A must have KPI handbook for marketing manager - HubSpot
31
A must have KPI handbook for marketing manager Publication of
-
Upload
khangminh22 -
Category
Documents
-
view
1 -
download
0
Transcript of A must have KPI handbook for marketing manager - HubSpot

1 A must have KPI handbook for marketing manager
A must have KPI handbook for marketing manager
Publication of

2
Share This Ebook!
A must have KPI handbook for marketing manager
A MUST HAVE KPI HANDBOOK FOR MARKETING MANAGER
By Gabriel Touchette
I am Bishop’s University graduate with a
BBA in Marketing and Entrepreneurship
(2012). Soon after, I also graduated from
Sherbrooke University with a Master degree in
e-commerce (2013). Being passionate about
entrepreneurship and web strategy,
I joined Ludis Media team as a Digital Marketing
Specialist. FOLLOW GAB ON TWITTER@GAB_TOUCHETTE
And Yan Desjardins
Yan Desjardins is VP Marketing at Ludis Media
and a seo and inbound marketing passionate.
He has over 15 years of experience in the digital
marketing industry.
FOLLOW YAN ON TWITTER@YDESJARDINS111

3
Share This Ebook!
A must have KPI handbook for marketing manager
CONTENTS
KPI EXPOSED: THE OFFICIAL HOW TO GUIDE FOR KPI
(PART 1) /4
(PART 2) /9
(PART 3) /18

4
Share This Ebook!
A must have KPI handbook for marketing manager
PART 1
KPI EXPOSED: THE OFFICIAL HOW TO GUIDE FOR KPI
5
Share This Ebook!
A must have KPI handbook for marketing manager
KPI have been around for quite a while, and their utilisation have grown exponentially in the last
few years. With the arrival of various analytic solutions that now provides a tremendous amount of
raw data, marketers are now more than ever challenged to produce insightful aggregated data for
their executives.
This article will be the first of a series that will seek to explain what are KPI’s, the different context
that web site segment themselves into and finally, a review of various KPI exposed and explained.
The best way to approach this question would be to start by
a quick definition. Let’s start with the official definition from
Investopedia: A set of quantifiable measures that a company
or industry uses to gauge or compare performance in terms of
meeting their strategic and operational goals.
The only thing I would have to add is that they are not only
required but also fundamental to complement any business
strategy activities.
KPI also allows the team to develop a feeling of responsibility and belonging toward the results
obtained. By having a dashboard (a collection of preselected and relevant KPI) that is shared
to a specific team, it will act has a motivational tool by providing concrete insight in the team
performance thus enhancing peer efforts.
What are KPI?

6
Share This Ebook!
A must have KPI handbook for marketing manager
Because of their strategic nature, dashboard and KPI aim at any executive or person in a position
of authority that has to track the company performance. So if you are reading this, are a marketing
executive and are managing a team of web marketers or a web marketer having to come up with
the right KPI, well you re at the good place!
Now, how to choose them? They’re so many of them, which one applies to your company?
The best indicator of which KPI to select will be your business strategy. It highlights your long-term
business objective using your organization’s mission and vision. Another reason why your business
strategy is a good indicator is that you invested so many efforts building it, but more important, you
fully understand it.
By using your business strategy, you will be able to select KPI that you will also fully understand.
A major source of failure among businesses that are implementing dashboard is that they don’t
fully understand the selected KPI… What actually happens when you don’t understand your KPI
is that you will also not see the importance of tracking them… And that will eventually lead to the
abandonment of your tracking activities.
But for who are those KPI principally made for?

7
Share This Ebook!
A must have KPI handbook for marketing manager
-The S stands for sustainable. It means that the
selected KPI has to have a lifetime of at least the
objective you want to reach. If it becomes useless
soon after implementing it, then you just wasted
both time and resources…
-The M stands for measurable. In the case of
KPI, ratio and percentages will be preferred to raw
numbers. Ratio allows the interaction of different variable and are, therefore, much more valuable
than raw, un-aggregated data.
-The A stands for actionable. This is a core value of a KPI. There is no point on selecting a KPI on
which you cannot work. If it is impossible for you to have an impact on this metric, don’t track it.
Focus only on what you will be able to interact with.
-The R stands for relevant. Does the selected KPI goes along the same direction as your business
strategy? If it does not, then it is not relevant, and you should not compromise resources on it.
-The T stands for time bound. It is crucial for KPI to have a starting point or that they can be
compared over time. This is particularly important to identify trends of other behaviour that could go
unnoticed without a proper time comparison.
S.M.A.R.T. KPI
8
Share This Ebook!
A must have KPI handbook for marketing manager
Now that you know how to select your KPI, how many of them should you select? That is a tricky
question that only depends on you. You have to keep in mind that a dashboard using KPI is meant
to be a tool that saves you time. The literature varies greatly on the quantity of KPI to have on your
dashboard but generally it revolves around 10-20. Based on personal experience, I find it more
convenient to work with 10-15 KPI. More than that, it becomes very time consuming.
In conclusion, now that you know what KPI are, what it does and how to choose them, you are fully
equipped for the part two of this series of article that will be posted shortly. In this second article, we
will explain the various type of websites, their core objectives and the KPI that are best suited for
each type of website. Stay tuned!
Sources:
Web Analytics: Nicolas Malo, Jacques Warren.
Performances Dashboards: Wayne W. Eckerson.
9
Share This Ebook!
A must have KPI handbook for marketing manager
PART 2
KPI EXPOSED: THE OFFICIAL HOW TO GUIDE FOR KPI
10
Share This Ebook!
A must have KPI handbook for marketing manager
Welcome back everyone for the second article of this series of three. If you haven’t read the
first part yet, I encourage you to do so. Today we will discuss how to categorize your business
questions using the REAN model. I will also provide KPI that best suits each step of your
conversion process. Not only will we cover that but we are also going to expose you the different
categories of website that exist based on their primary motive and will again propose KPI that are
specific to each of them.
After having made a comprehensive analysis of what KPIs are
in the previous article you may have studied your business
plan, and have come up with many questions regarding your
objectives. It’s now time to shift our attention on categorizing
those business questions.
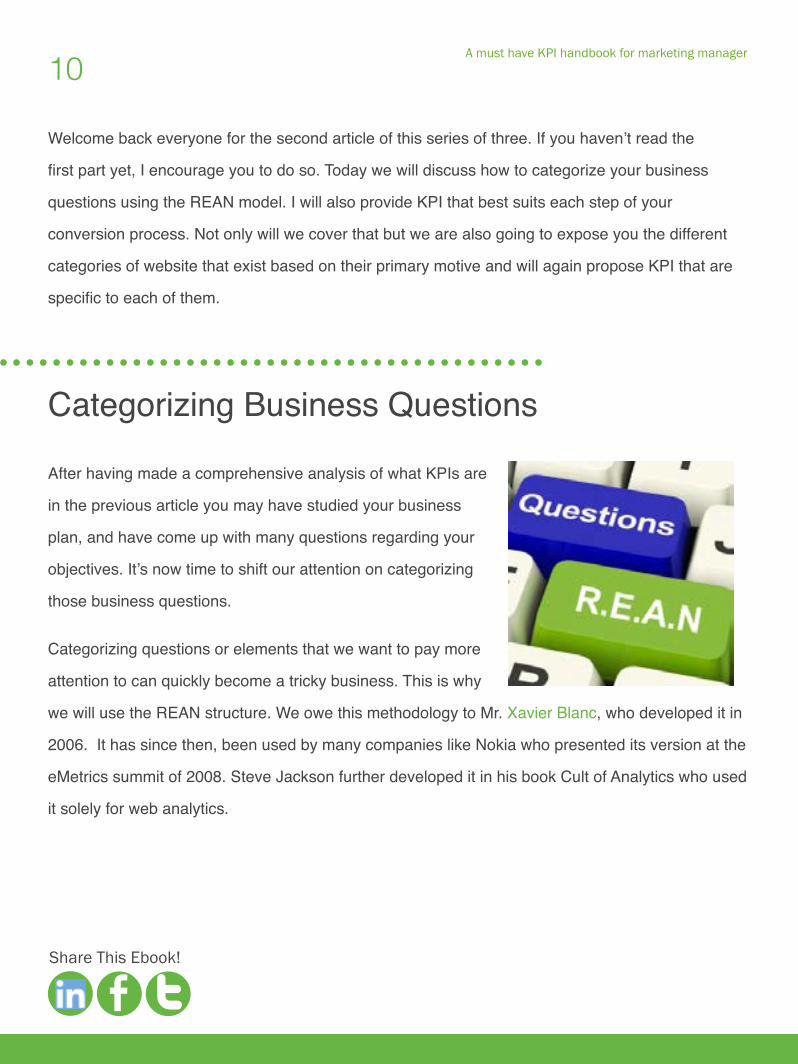
Categorizing questions or elements that we want to pay more
attention to can quickly become a tricky business. This is why
we will use the REAN structure. We owe this methodology to Mr. Xavier Blanc, who developed it in
2006. It has since then, been used by many companies like Nokia who presented its version at the
eMetrics summit of 2008. Steve Jackson further developed it in his book Cult of Analytics who used
it solely for web analytics.
Categorizing Business Questions

11
Share This Ebook!
A must have KPI handbook for marketing manager
Lets start by explaining the REAN approach before going any further. The REAN is an approach
that enables you to track your conversion efforts. I will explain each letter and what they mean and
give examples of business questions that would fall in each category. Finally, I will provide KPIs
that best suits each step of the REAN approach. Most of the following examples and definitions
were taken from Steven Jackson’s book Cult of Analytic. A must have.
RThe R stands for reach. Which method are you using in order to attract prospective clients? In a
web environment, web marketers often use various strategies such as PPC, backlinks, inbound
marketing, e-mailing and others.
Now, what kind of business questions would fall in this category? Well any questions such as how
do visitors find my website, what is the best source of traffic for my site cost wise and what kind of
segment visits my site.
Proposed KPIs for your reach:
-Visitor volume ratio per referrer (VVR)
It shows you the best traffic sources across every single channel you work with.
Formula: Number of visitors per traffic source / Total number of visitors
-Cost per referred visit (CPRV)
REAN
12
Share This Ebook!
A must have KPI handbook for marketing manager
It shows the best traffic sources in term of cost per visit.
Formula: Total marketing cost per referring source / Total number of visits per referring source
-Content/visit ratio per referrer (CVR)
Shows the best traffic sources in terms of content consumed across your top methods to attract.
Formula: Number of visits per traffic source / Number of visits per content groups
EThe E stands for engage. This is how your visitors interact with your site. What are they doing on
your site? Questions like what are the top paths through the site, engagement rate of visitors,
number of failed search are all indication of the engagement process.
Proposed KPIs for your engagement:
-Bounce rate
Gives you the percentage of visitors of your website who quit your page after viewing only one
page. They arrive on your page but navigate away without further action.
Formula: Page views / Number single page visits per page
-Shopping cart abandonment rate (SCAR)
This is a direct indicator of the performance of your shopping cart.
Formula: Number of successful purchases / Total number of visits to shopping cart
13
Share This Ebook!
A must have KPI handbook for marketing manager
A
The A stands for activate. This is basically the second level of action from the client. It involves
more efforts and shows more consideration for your brand from the user. How many sales did we
make, the number of e-books downloaded, the number of subscribers to our newsletter are all
concrete actions made by your users that generally occurs further in the conversion funnel, those
are micro or macro conversions.
Proposed KPIs for your activation:
-Conversion rate
Tells you how many visits performed the desired outcome per 100 visits. A conversion can be a
micro conversion (conversion of smaller value but still worth mentioning) or a macro conversion.
Formula: Number of confirmed conversions / Total number of visits
-Cost per acquisition (CPA)
Shows the cost of obtaining one conversion.
Formula: Total cost of referring source / Number of confirmed conversions
14
Share This Ebook!
A must have KPI handbook for marketing manager
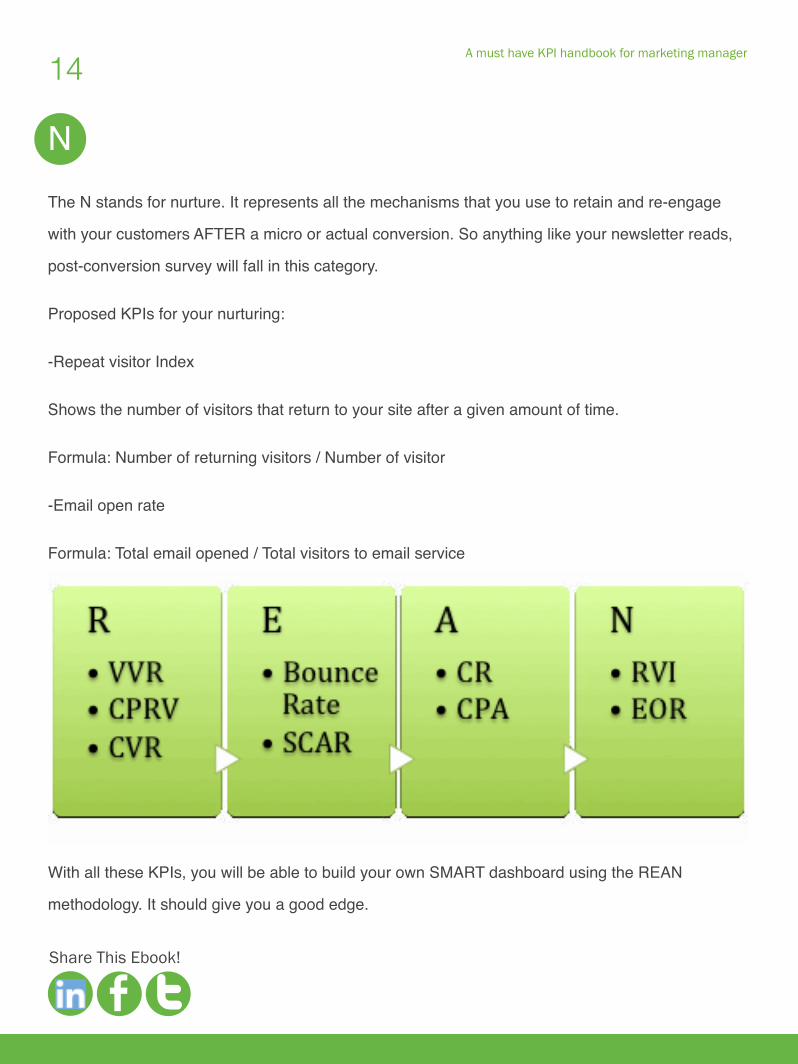
NThe N stands for nurture. It represents all the mechanisms that you use to retain and re-engage
with your customers AFTER a micro or actual conversion. So anything like your newsletter reads,
post-conversion survey will fall in this category.
Proposed KPIs for your nurturing:
-Repeat visitor Index
Shows the number of visitors that return to your site after a given amount of time.
Formula: Number of returning visitors / Number of visitor
-Email open rate
Formula: Total email opened / Total visitors to email service
With all these KPIs, you will be able to build your own SMART dashboard using the REAN
methodology. It should give you a good edge.

15
Share This Ebook!
A must have KPI handbook for marketing manager
Now as some of you might have already pointed out, it is not all of the websites that have the same
goals or objectives. In fact there are four broads categories of websites:
- Ecommerce sites;
- Content generation sites;
- Lead generation sites;
- Self-Serve sites.
Different types of websites
Ecommerce sites are any sites that offer pre-sale support, products for sale or after sale support.
Ecommerce sites have the core objective of generating online sales while reducing the marketing
expenses to a minimum. Which type of KPIs should you focus on if you are operating an
e-commerce site?
Any KPI concerning sales, returns and costs will be valuable for you. Here are a few KPIs that you
will want to look for:
-ROI;
-Cost per visits;
-Conversion rate.
Ecommerce sites

16
Share This Ebook!
A must have KPI handbook for marketing manager
The heart and soul of inbound marketing, content generation websites aim at attracting visitors
with the unique content they create. But what are their core objectives? They aim at increasing
the number of readers, the level of interest of their audience and time spent on their site. Here are
some KPIs you don’t want to miss if you are managing a content website:
-Average time spent on site
-Average number of pages view per visit
-Organic traffic
Content generation sites
Those are the sites that aim at increasing brand loyalty and ultimately, generating sales.
Their core function is to increase and segment their leads.
-Ebook downloads
-Average time spent on site
- Newsletter subscription
- Contact page bounce rate
Lead generation sites
17
Share This Ebook!
A must have KPI handbook for marketing manager
Those sites aim at assisting clients through Q&A, FAQ and other self-serve mechanisms. Their
core value is to increase customer’s satisfaction while decreasing the necessary time for the
customer to obtain answers.
-Average time spent on site (unlike the other sites, they want it to be the lowest possible)
-Customer’s satisfaction
-Any measure of contact caused by the website to other support service (phone, store)
In conclusion, there are many ways you can build your own dashboard using the KPIs that suits
your company. However, using the REAN approach, will enable you to have a dashboard that is
complete, but more importantly, meaningful for you and your team. As stated in the first article,
the first source of failure in dashboard implementation is the lack of understanding of the selected
metrics. As shown above, the importance of the metric varies greatly depending on the type of
website that you are using. Make sure to keep that in mind when researching your KPIs.
The next article will suggest a list of the most popular KPIs that will be explained and
contextualized. Stay tuned
Source:
Cult of Analytics by Steve Jackson.
Self-Serve sites

18
Share This Ebook!
A must have KPI handbook for marketing manager
PART 3
KPI EXPOSED: THE OFFICIAL HOW TO GUIDE FOR KPI

19
Share This Ebook!
A must have KPI handbook for marketing manager
Welcome back everyone for the third and final article of this series of three. If you haven’t
read the first part and second part yet, I encourage you to do so. In this final attempt to
draw a clear and complete picture about what KPIs are, how to choose them and generate
your own executive dashboard, I will now provide you a list of the most popular KPIs used
in a web context. Each KPI will be explained and provided with a specific formula.
I will also quickly explain how to set up thoughtful objectives. After all, the logical step after
tracking your performances is to set objectives for your future actions! Finally, I will rapidly
wrap everything we covered in the 3 articles of this series.
Before going any further, it is obligatory to re-state
the importance of your dashboard as a tracking
tool. Il will allow you as an executive to see how
your company performed in the last days, weeks or
quarter. With all due respect to the importance of
the historical data collected, the foremost important
DUMB objectives are for genius!contribution of your
dashboard will be to accurately enable you to set objectives for your web marketing
team.
DUMB Objectives

20
Share This Ebook!
A must have KPI handbook for marketing manager
By using all your analytic raw data, refining them with your KPIs you will obtain a refine
chronological evolutionary chart of your company performances. Using this chart combined with
your business strategic plan, you will be in a position to make future recommendations and set
business objectives. Those objectives are what are going to drive your team to achieve excellence.
I recommend you to use the DUMB methodology when it comes to select your objectives.
Here’s how DUMB objective breaks down:
- Doable
- Understandable
- Manageable
- Beneficial
It took three articles to get there, but we finally did it! I will now address some of the most popular
KPIs in a web-marketing context. Obviously there are many other interesting KPIs and once
more used to it, you will probably even come up with your own. I used a variety of sources for
this section ranging from books, personal experiences al the way to presentation material from
various references. I did my best explaining the vast majority of the term used below. If you stick
on a particular expression, I encourage you to leave a comment or to visit this lexicon by Avinash
Kaushik.
KPIs, KPIs and KPIs
21
Share This Ebook!
A must have KPI handbook for marketing manager
Take Rates
TR= # of visits performing the desired outcome / # visits
TR= # of visits performing the desired outcome / # unique visits
This metrics will help you gather more information than just the amount of newsletter registration,
eBook download or RSS feed subscription. The take rate really makes sense when used in a/b
testing context. It is of great help when testing eBook positioning on various pages for example.
Similarly, if you are generating revenue with ads, the take rate can enable you to compare the
different rates obtained when trying your ads at various locations on your page.
Repeat Visitor Share
RVS= # of repeat unique visitors / # unique visitors
This is the number of visitor that comes back to your site over time. You have to determine what
period is most relevant for your business/industry in order to have comparable data. This metric
is often ignored, but it is a great indicator of the quality of your content. We assume that normally
more and more people should come back to your site because you should always keep on posting
relevant and quality content.
WebSite Traffic Metrics
22
Share This Ebook!
A must have KPI handbook for marketing manager
Heavy User Share
HUS= # visits with over 11 pages viewed / # visits
The number of 11 pages is arbitrary and really depends on your sites and industry. In can be
increased or decreased according to your needs. This indicator enables you to see the share
of your user who makes a profound use of your sites. It is a great metric in order to assess the
engagement level of your site.
Committed Visitor Share
CVS= # visits that lasts more then 19 minutes / # visits
This metric is based on the assumption that the longer a visitor stays on your site, the more odds it
has to perform the desired actions. It highly correlates with Take Rates and sales metrics. However,
there are many elements to take in consideration when using this metric.
First off all, the length of the session does not always translate in longer visitors activity. Visitor can
open a tab, land on your site perform one action and then open another tab and simply forget your
site for 25 minutes. A visitor can also go on your site and leave for a cup of coffee and come back
15 minutes later. Also, the interpretation of this metric varies greatly depending on your industry.
If I offer self serves service on my site, I clearly want to stay away from long visit whereas if I am
operating a game website, then I want the longest visit possible. Make sure to read the second part
of my guide to know what type of website you are operating.

23
Share This Ebook!
A must have KPI handbook for marketing manager
Committed Visitor Index
CVI= # of pages view in the visits that lasts more than 19 minutes / # visits that lasts more then 19
minutes
This ratio is to be used in conjuncture with the Committed Visitor Share. It combines the time spent
with the quantity of pages viewed. It allows you to see if your client are just opening your site and
going for a coffee! The more your site is easy to use (a great user experience), the more your site
should have pages viewed for longer visits. You want to see this KPI increase over time.
Committed Visitor Volume
CVV= # of pages view in the visits that lasts more than 19 minutes / # pages viewed
This gives you the percentages of total page views on your site by your committed visitors. If it is
to low, it means that you are targeting the wrong audience for your site, and you should consider
reviewing your personas.
24
Share This Ebook!
A must have KPI handbook for marketing manager
Visitor EngagementVisitor Engagement Index
VEI= # visits / # unique visits
This KPI indicates you the tendency of your user to have multiple sessions on your site. The larger
the engagement in term of multiple visits, the further above 1 your index is going to be. Blog wants
to have this index as high as possible whereas commerce site want this number to be as close to 1
as possible.
Reject Rate: all pages
RR-all= # 1 page view / # visits
This gives you the general bounces rate of all your pages. It is an interesting metrics to track. You’ll
want to see this metric go down over time.
Reject Rate: Top entry
RR-top= # 1 page view-top entry / # visits starting by the top entry
This metric gives you the bounce rate for your top entry pages. The rule of thumb is that your top
5 entry pages account for approximately 80% of the traffic. I would recommend you to take the
Pareto law in consideration and focus on the top 5 entry pages. More than that really becomes time
consuming.

25
Share This Ebook!
A must have KPI handbook for marketing manager
Scanning Visitor Share
SVS= # visit lasting 1 minutes / # visits
Allow you to evaluate the “scanability” of your site. Having visit that lasts a minute can be
interesting in a usability context. It can mean that your visitors are able to quickly find what they are
looking for. This metric gives you the share of scanner that visits your site. Make sure to use this
KPI in conjuncture with the Scanning Visitor Index especially if the percentage is high.
Scanning Visitor Index
SVI= # of pages viewed in the visit lasting 1 minutes / # visit lasting 1 minutes
This index is to be used with the Scanning Visitor Share. If it is close to 1, it might be a sign of
navigation problem on your site.
Scanning Visitor Volume
SVV= # of pages viewed in the visit lasting 1 minutes / # pages viewed
This gives you the volume of scanner that visits your site. Depending on the orientation of your
site you might have a different perception of this metric. Service website will seek to have a lower
volume whereas content website such as Blog will want it to be higher.
26
Share This Ebook!
A must have KPI handbook for marketing manager
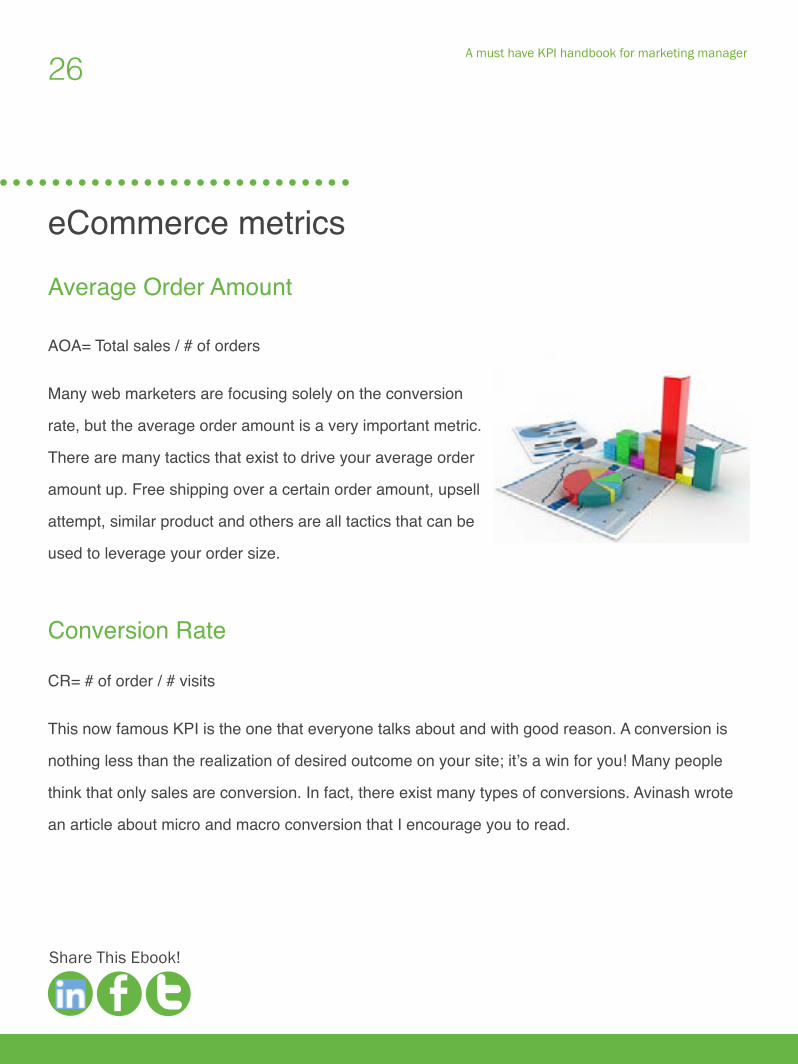
Average Order Amount
AOA= Total sales / # of orders
Many web marketers are focusing solely on the conversion
rate, but the average order amount is a very important metric.
There are many tactics that exist to drive your average order
amount up. Free shipping over a certain order amount, upsell
attempt, similar product and others are all tactics that can be
used to leverage your order size.
Conversion Rate
CR= # of order / # visits
This now famous KPI is the one that everyone talks about and with good reason. A conversion is
nothing less than the realization of desired outcome on your site; it’s a win for you! Many people
think that only sales are conversion. In fact, there exist many types of conversions. Avinash wrote
an article about micro and macro conversion that I encourage you to read.
eCommerce metrics
27
Share This Ebook!
A must have KPI handbook for marketing manager
Sales Per Visit
SPV= Total sales / # visits
This indicator tells you how many sales you are making per 100 visits. It gives a good perspective
on the overall efficacy of the website.
Cost Per Order
CPO= Marketing Cost / # of order
This will give you the marketing cost per order. It is a critical measure to have in order to assess the
profitability of your web marketing efforts.
Cost Per Acquisition (CPA)
CPA= Total cost of referring source / Number of confirmed conversions
Shows the cost of obtaining one conversion. It is a very interesting KPI to track in order to evaluate
the performance of your PPC campaign.
Repeat Order Rate
ROR= # of client orders / Total order
This measure enables you to see the % of your sales that is made by repeat business from your
existing clients. Again, it is important to establish a time period for this metric in order to have
relevant comparison. This measure can be used with the client retention rate.

28
Share This Ebook!
A must have KPI handbook for marketing manager
Client Retention Rate
CRR= # of client orders / # Client
This KPI gives you the rate at which your clients are coming back and making other purchases.
This KPI is not used as often by the web marketing community but is a metric that I really like.
Cost Per Visit
CPV= Marketing cost / # visits
This KPI allows you to calculate how much each visit cost you in term of marketing. It is interesting
to track it to keep control and monitor the marketing expenses. Depending on the data you have
access to you can also calculate the CPV client and CPV new clients
Order Acquisition Gap
OAG= CPV – CPO
This number is going to be negative and will represent the cost of not converting a potential client.
Your objective will be to reduce this number.
29
Share This Ebook!
A must have KPI handbook for marketing manager
Order Acquisition Ratio
OAR = CPO / CPV
This ratio is going to give you a positive number that represent how much more it is going to cost
you to acquire a new customer. An OAR of 25 means that it is going to cost you 25 time more to
acquire a new client than a new visitor.
Return On Investment
ROI = (Net profit / Investment) × 100
Another KPI that is well known in the business community is the ROI. This formula will give you a %
of return on investment. This measure is very broad and encompasses many source of investment
but does provide a financial incentive to justify your web marketing expenses!
30
Share This Ebook!
A must have KPI handbook for marketing manager
Conclusion
KPI enables the transformation of raw data into meaningful information and by having a dashboard,
it enables you as web marketing managers or executives to have quickly grasped the essentials
of the web performance of your business. We talked about how to develop KPIs, how ratio and
percentages where preferred to simple un-processed raw data, how to select SMART KPIs, how to
categorize your business questions using the REAN model, the different kind of website that exist
based on their core motive, how to generate DUMB objectives and finally, we covered a whole list
of web marketing KPIs.
As managers or executives, we often seek to obtain the purest data possible. You have to keep in
mind that the accuracy of your data in web marketing never really is of prime concern. What matter
the most is the consistency of those data so that you can accurately highlight the various trends
that take place over time. And it is with those trends that you will be able to plan your action further
down the road.
I hope that this series of articles helped you to understand what KPI are, how to select them, how to
set objectives and how to build your own dashboard. If you have any comment or recommendation,
I will gladly answer them.
Source:
Cult of Analytics by Steve Jackson.
Drilling Down
Web Analytics: Nicolas Malo, Jacques Warren.
31
Share This Ebook!
A must have KPI handbook for marketing manager
Ludis Media is a digital marketing agency, based in Sherbrooke, Canada. Our expertise covers the central aspects of internet marketing, from SEO to content strategy and inbound marketing.Proactive and personalized service to each of our customers is our promise!
Liked what you read? Why not sign up for a free Inbound Marketing Assessment?
ABOUT US
Get your assessment with an inbound marketing specialist
Publication of