KPI whitepaper - Affine
10
Deciphering the problem, challenges, and building solution framework to gather data; identify key metrics for predicting pre-launch video game sales. WHITEPAPER Structured & Data-driven Solution Framework to Identify Key Metrics to Predict Sales Before a Video Game Launch! www.affine.ai
-
Upload
khangminh22 -
Category
Documents
-
view
3 -
download
0
Transcript of KPI whitepaper - Affine

Deciphering the problem, challenges, and building solution framework to gather data;identify key metrics for predicting pre-launch video game sales.
WHITEP
APER
Structured & Data-driven Solution Framework to Identify Key Metrics to Predict Sales Before a Video Game Launch!
www.affine.ai

Now more than ever, marketing and brand managers need to monitor a video game presence on the volatile
and often unforgiving internet. Communicating a video game performance by weaving a narrative to
key-stakeholders, be it the Directors or CEO's has become crucial at every gaming company. Thus, the mar-
keting team and brand managers need to be alert that they are not merely tracking the signal in the noise but
amplifying it when necessary. To execute this process successfully; it is crucial to forming a holistic solution
framework as part of the long-term plans.
Introduction
Developing a game idea is complicated and muddled with unforeseeable challenges. The process of blend-
ing creativity with technical elements makes the process exciting and time-consuming. The sophistication
of this process barely matters if it doesn’t materialize to sales of the video game. To support this massive
development and design process, gaming companies are cautious in picking teams by employing highly
specialized professionals to tackle any challenges while ensuring their capability to provide instant solu-
tions for the problems. These teams, through numerous iterations, will arrive at key-metrics in reports to
analyze and improve gamers’ experience but may fall short of knowing how the key metrics contribute to
sales before a game released in the market. Thus, for gaming companies, identifying key metrics to predict
sales before video game launches could pose several challenges.
The Problem
There may be no alignment on the key-metrics due to different reporting methodologies and no
consensus on an important metric as every metric is “important.”
Different reporting structures within the organization sometimes lead to the performance of a week
analyzed with a different lens providing no insights or direction to steer vital decisions.
When teams improve their reporting methods, there is a significant amount of time to educate executives
on their process. The executives may not be willing to spend the amount of time required because they’re
unsure of the value of sales and might be worried about information overload.
1.
2.
3.
Common challenges that gaming teams face while reporting key-metrics to predict sales:

Formulating a structured data-driven solution framework based on imperative touchpoints mentioned below can help
overcome challenges that various teams face while reporting key-metrics to predict sales before video game launch.
In this whitepaper, we have discussed how to help executives identify the statistically significant predictor of sales and
move beyond, merely determining the important predictors to pointing to the weeks in which the variables stay signifi-
cant. This way, we can help marketing executives to track the key-metrics and the windows in which they need to
report.
It's crucial to proceed sequentially towards building the solution. Prior to that, we must develop an approach to identify
key metrics.
Firstly, streamline the data collection process by combining all important metrics and create a dataset with the target
variable being sales, which is a continuous independent variable. Secondly, initiate the statistical tests to understand
the interaction between metrics and the weeks from game launch for a title along with the domain expertise required to
create targets in the form of benchmarks. Machine learning should complement the expertise of domain knowledge
holders but not to replace it.
The Solution
Solution Framework to Identify Key Metrics:1. Building a complete solution
Collaborating data Timely report tracking Sales-driven
Aggregating the data from
different teams and identifying
how it ties to sales and the
contribution of each metric to
sales.
Irrespective of tracking metrics
periodically (daily or weekly),
identifying the periods when to
begin reporting and when to
stop.
Tying the contribution of
key-metrics to sales and
establishing a common
language for the organiza-
tion.

While creating the analytical dataset, many experts believe that unless there is a need for more granularity, a dataset
with weekly metrics should suffice the need. This approach applies even when the need arises to either aggregate the
dataset or to perform a deep-dive analysis.
Aggregating the metrics for each title by choosing a period uncovers the most consistent number of data points. Since
the dependent variable, which is the post-launch sales of a title is a continuous variable, this problem can be framed as
a classic regression problem. All the key performance indicators which can be predictors of this variable are classified
as independent variables in the dataset.
2. Identifying important KPIs for post-launch sales
Factors which may affect the sales of a product
Survey(Neilsen)
WebMentions(Netbase)
VideoEngagement(Tubular)
Ease &Volumeof Search
TitleCharacterstics
Online PressReleases& Reach
Seasonality
FirstChoice
NetSentiment
Total Views GoogleTrends
Metacritic Score Number of articlespublished
Competitorsin the 3-monthperiod
Game Rank TotalImpressions
TotalEngagements
Google Index User Review Score Article Reach SeasonalityEffect
UnaidedAwareness
Total Posts Total Uploads YouTubeIndex
No. of platformsthe game wasreleased on
Def. Interestto Purchase
Total Replies Whether it’s afranchise
AidedAwareness
Total Replies Genre
Avg. Rank in Top 5
Pre-Order/Buy Total Reposts
Wait NegativeSentiment
Own PositiveSentiment
Def. Not Interestedto Purchase
Top 5 Rank

In a nutshell, each algorithm brings its own advantages and disadvantages. Thus, you should assess your requirement
and team capability to choose the suitable one. However, below are few commonly used algorithms that many gaming
companies prefer to use
1. Multiple Linear Regression
2. Regression Trees
A single evaluation metric could be less effective to evaluate model performance. You can choose a model that satis-
fies the below criteria to ensure implacable results.
1. Training, test data error
2. Highest Adjusted R-squared
3. Root Mean Square Error
4. Weighted Mean Absolute Percentage Error
Using the rigor of a statistical framework to determine the validation periods in which Key Performance Indicators (KPI)
show a statistically significant change over time, which in this case is weekly.
3. Validation windows for important KPIs
PRE-LAUNCH SALES PREDICTION MODEL
TITLES : 67
TEST WMAPE : 49.4%
TRAIN WMAPE: 17.7%
R-SQUARED: 92.2%
ADJ. R-SQUARED: 91.7%
Pred
icte
d Sa
les
Actual Sales
Random Forest Regression vs Test Data
1e8
2.0
1.5
1.0
0.5
0.0
1e80.25 0.50 0.75 1.00 1.25 1.50 1.75 2.00
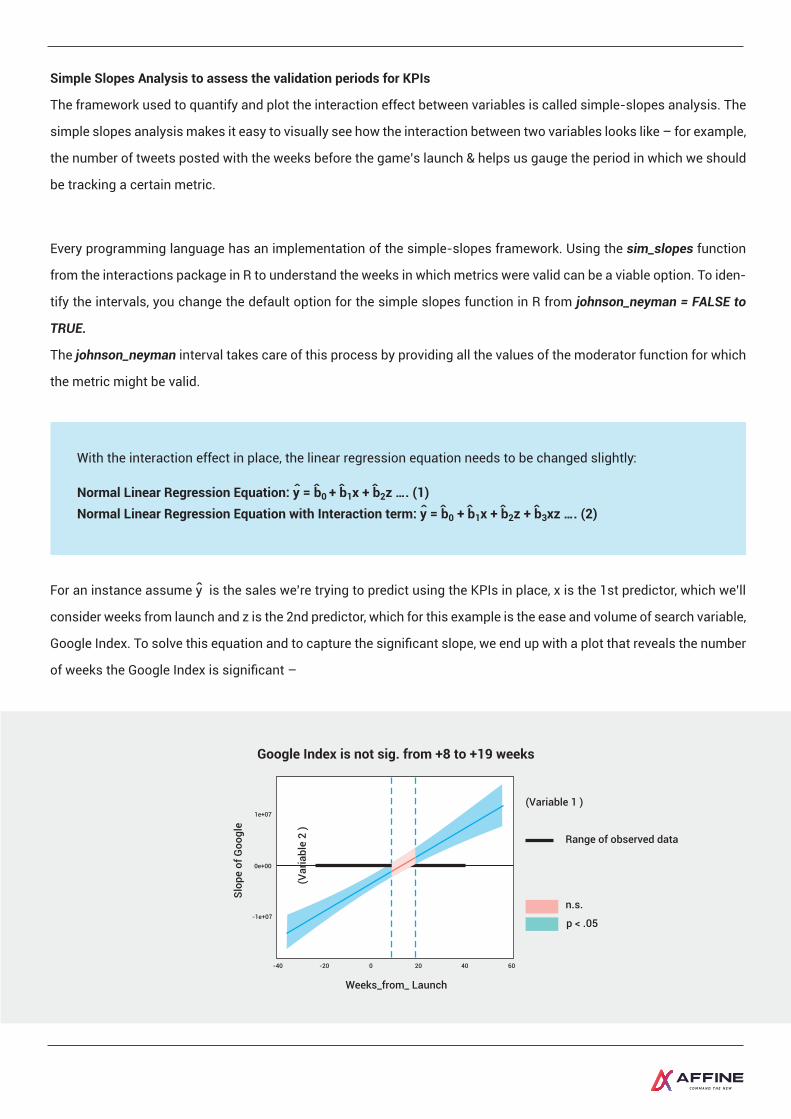
Simple Slopes Analysis to assess the validation periods for KPIs
The framework used to quantify and plot the interaction effect between variables is called simple-slopes analysis. The
simple slopes analysis makes it easy to visually see how the interaction between two variables looks like – for example,
the number of tweets posted with the weeks before the game’s launch & helps us gauge the period in which we should
be tracking a certain metric.
Every programming language has an implementation of the simple-slopes framework. Using the sim_slopes function
from the interactions package in R to understand the weeks in which metrics were valid can be a viable option. To iden-
tify the intervals, you change the default option for the simple slopes function in R from johnson_neyman = FALSE to
TRUE.
The johnson_neyman interval takes care of this process by providing all the values of the moderator function for which
the metric might be valid.
For an instance assume y is the sales we’re trying to predict using the KPIs in place, x is the 1st predictor, which we’ll
consider weeks from launch and z is the 2nd predictor, which for this example is the ease and volume of search variable,
Google Index. To solve this equation and to capture the significant slope, we end up with a plot that reveals the number
of weeks the Google Index is significant –
With the interaction effect in place, the linear regression equation needs to be changed slightly:
Normal Linear Regression Equation: y = b0 + b1x + b2z …. (1)Normal Linear Regression Equation with Interaction term: y = b0 + b1x + b2z + b3xz …. (2)
Weeks_from_ Launch
Google Index is not sig. from +8 to +19 weeks
-40 -20 0 20 40 60
Slop
e of
Goo
gle
(Var
iabl
e 2
)
-1e+07
0e+00
1e+07
(Variable 1 )
Range of observed data
n.s.
p < .05

Thus, we establish the fact that Google Index can be tracked from the 40th week before a game’s launch to the 8th week
beyond which it doesn’t change significantly for the next 11 weeks. This process can easily be replicated for the import-
ant KPIs to identify the periods of significant activity.
Before creating benchmarks, you would need to identify clusters of titles that have similar post-launch sales. While
there are several ways to cluster, since the focus is on sales of the game, you can create clusters of titles with similar
sales recorded. By creating groups of video game titles based on their sales, we could logically identify the titles which
have generated higher revenue. For example, assume premium titles that earn $100M in their 1st 3-months
post-launch have similar performance on the survey and social media to titles that earn $60M.
Using the dataset, which captures weekly performance, you can establish benchmarks by taking the average of the
metric for each cluster separately leading up to a game’s launch. The benchmark for a KPI in a cluster with higher sales
should be different for a lower sales cluster. Using averages to create benchmarks is the easiest approach, which can
be changed to a maximum of the metric for the week or minimum of the metric for the week depending on the context.
You can also extend this concept by creating confidence intervals for each metric.
Before overviewing the percentage value of week-over-week, let’s understand how does a game’s KPI shows a signifi-
cant deviation week-over-week?
4. Creating benchmarks for setting targets
The below illustration represents the probable output:
5. Reporting significant percentage change week-over-week
Use Comparative benchmarks to track a title 20 weeks from release
UNAIDED AWARENESS: SAMPLE VIEW
-19-18-17-16-15-14-13-12-11-10 -9 -8 -7 -6 -5 -4 -3 -2 -1 0 1 2 3
1 2 3 4 5
POINT OF ANALYSIS
20%18%16%14%12%10%
8%6%4%2%0%
-20 4 5 6 7 8 9 10 11 12 13 14 15 16 17 18 19 20
6

The inherent limitation of weekly/daily reporting is that we might accidentally highlight a metric’s performance to be
important when it isn’t necessarily so. This is similar to reporting daily headlines and overestimating a general trend/-
regular pattern. To overcome this problem, you need to dig deeper and highlight only those weeks in which there was a
significant percentage change.
Within a cluster, for every individual title, note down the percentage change week-over-week. And later, calculate the
standard error of percentage change for that particular week.
If either upper or lower bound is equal to zero, then the %change is not statistically significant
If both the upper and lower bound have the same sign, either positive or negative, then the percentage change is
statistically significant
If the lower and upper bound has different signs (positive or negative), then the percentage change is not statistically
significant
To determine whether the week-over-week percentage change was significant, use the followingalgorithm:
%Change = (MetricWeek2 - MetricWeek1)/(MetricWeek1)*100
Standard Error (%Change) = Mod(MetricWeek2 / MetricWeek1)*Sqrt (SE2Week 2/Metric2Week 2 + SE2Week 1/Metric2Week 1)*100
These calculations can now be used to create upper bounds and lower bounds
Lower bound (LB) = %Change – 1.65 * Standard Error (%Change)
Upper bound (UB) = %Change + 1.65 * Standard Error (%Change)
MA
U
MA
U
Action-Adventure in 2020: +59% over Median MAU Simulation in 2020: +124% over Median MAU120M
100M
80M
60M
40M
20M
M
60M
50M
40M
30M
20M
10M
M
Jan Feb Mar Apr May Jun Jul Aug Sep Oct Nov DecJan Feb Mar Apr May Jun Jul Aug Sep Oct Nov
Dec
Median of MAU from 2016 to 2019
Median of MAU from 2015 to 2019
Engagement was significantly up in 2Q20
1.
2.
3.

Want to know more about comprehensive gaming solutions ?
In the earlier stages, we already discussed how machine learning models can be used to extract important variables.
Additionally, the role of simple slopes analysis is to identify the periods in which a variable is statistically significant.
These methodologies help in creating weekly benchmarks for each cluster and set a target for every metric. Once the
top metrics and benchmarks are created, the gaming company can focus on targeting only the key metrics and save
time by not reporting metrics that don’t tie directly to sales or show any statistical deviation.
Next, this solution can be deployed as a dashboard running on a web server, which through automation can be struc-
tured to report only the key-metrics, benchmarks, and highlight only those weeks with significant change. Once this is
circulated within the organization, everyone will have access to the most important KPIs, and be in a better position to
generate insights. This process of generating insights by narrowing down the metrics being reported brings clarity in
deciding to set the targets for KPIs and be a top-performing title in the industry.
6. Analytical outcome
1. Reducing the number of key-metrics to be tracked from 30+ to 8
2. Weekly targets enabled teams to measure the difference in the set goal v/s actual result
3. Empowers other teams to implement the solution as the framework to emulate the industry-agnostic approach
Projected impact of analytical outcome
Identify key metrics to predict sales before a video game launch could be a daunting challenge for many organizations
given the preparations that must be made to plan, deploy, and ensure your approach is hassle-free and result oriented.
Marketing managers in the video game industry are now working in a dynamic environment on social media with
gaming communities exercising their power in inspiring massive successes or finding ways to overcome failure. The
proposed solution framework in this whitepaper can be used to determine the most important variables throughout the
process and be a forward-facing approach to solve and resolve business problems. Computing and reporting can never
be a goal, but insights are.
“The successful Analytical outcome is - running quarterly iterations of the developed solution and reducing the
error to ensure constant improvement with the help of accurate forecasts and support the mission of the compa-
ny to generating insights instead of just reporting numbers.”
Conclusion
Click Here

©2021 Affine. No part of this document may be modified, deleted or expanded by any process or means without prior written permission from Affine.
About Affine
-
-
Affine is a leading professional services & solutions firm, enabling global enterprises to affect their transformation &
innovation, leveraging the unique Trifecta of AI, Data-Engineering & Cloud. With a globally distributed team of 500 +
analytics professionals, Affine covers end-to-end capabilities spanning modern data engineering to core AI and scal-
able cloud deployment across North America, Europe, and Asia.
Affine combines the hyper-convergence of AI, Data-Engineering & Cloud, with its deep industry knowledge, particularly
in Manufacturing, Gaming, CPG, and Technology segments. Affine demonstrates thought leadership in all relevant
knowledge vectors by investing heavily in research through its highly acknowledged Centres-of-Excellence and strong
academia relationships with reputed institutions like UC Berkeley and premier IITs in India.
Talk to our experts!Discover how Affine can support your business transformation journey.
www.affine.ai [email protected]