A multilevel analysis of the role of the family and the state in self-rated health of elderly...
32
Author's Accepted Manuscript A multilevel analysis of the role of the family and the state in self-rated health of elderly Chinese Zhixin Feng, Wenfei Winnie Wang, Kelvyn Jones PII: S1353-8292(13)00088-9 DOI: http://dx.doi.org/10.1016/j.healthplace.2013.07.001 Reference: JHAP1334 To appear in: Health & Place Received date: 25 November 2012 Revised date: 28 February 2013 Accepted date: 3 July 2013 Cite this article as: Zhixin Feng, Wenfei Winnie Wang, Kelvyn Jones, A multilevel analysis of the role of the family and the state in self-rated health of elderly Chinese, Health & Place, http://dx.doi.org/10.1016/j.healthplace.2013.07.001 This is a PDF file of an unedited manuscript that has been accepted for publication. As a service to our customers we are providing this early version of the manuscript. The manuscript will undergo copyediting, typesetting, and review of the resulting galley proof before it is published in its final citable form. Please note that during the production process errors may be discovered which could affect the content, and all legal disclaimers that apply to the journal pertain. www.elsevier.com/locate/healthplace
-
Upload
independent -
Category
Documents
-
view
0 -
download
0
Transcript of A multilevel analysis of the role of the family and the state in self-rated health of elderly...

Author's Accepted Manuscript
A multilevel analysis of the role of the familyand the state in self-rated health of elderlyChinese
Zhixin Feng, Wenfei Winnie Wang, KelvynJones
PII: S1353-8292(13)00088-9DOI: http://dx.doi.org/10.1016/j.healthplace.2013.07.001Reference: JHAP1334
To appear in: Health & Place
Received date: 25 November 2012Revised date: 28 February 2013Accepted date: 3 July 2013
Cite this article as: Zhixin Feng, Wenfei Winnie Wang, Kelvyn Jones, Amultilevel analysis of the role of the family and the state in self-rated health ofelderly Chinese, Health & Place, http://dx.doi.org/10.1016/j.healthplace.2013.07.001
This is a PDF file of an unedited manuscript that has been accepted forpublication. As a service to our customers we are providing this early version ofthe manuscript. The manuscript will undergo copyediting, typesetting, andreview of the resulting galley proof before it is published in its final citable form.Please note that during the production process errors may be discovered whichcould affect the content, and all legal disclaimers that apply to the journalpertain.
www.elsevier.com/locate/healthplace
1��
A multilevel analysis of the role of the family and the state in self-rated health of elderly Chinese
First Author: Zhixin Feng
First Author’s Institution: University of Bristol, UK
Second Author: Wenfei Winnie Wang
Second Author’s Institution: University of Bristol, UK
Third Author: Kelvyn Jones
Third Author’s Institution: University of Bristol, UK
Corresponding Author: Zhixin Feng
Corresponding Author’s Institution: University of Bristol
Address: School of Geographical Sciences
University of Bristol
University Road
Bristol
UK
BS8 1SS
Email address: [email protected]
Abstract:
This study examines the geographical variations of self-rated health of the elderly based on the
2008 Chinese Longitudinal Healthy Longevity Survey. Multilevel logistic models are employed
to estimate how individual, family, and institutional factors affect the health of the elderly at both
individual and province levels. Results show that while individual characteristics help to explain

2��
self-rated health, the family remains an important determinant. Those with nobody to care for
them, those in poverty and those who have to rely on medical insurance report the worst health.
The role of the state is relatively limited in contributing to the health of the elderly. There are
substantial between province differences.
Key words: China, health, family, social security, multilevel modelling
Words (including abstract, references and tables): 6,283
Introduction
China has the largest and most rapidly growing elderly population in the world. In 2009, there
were approximately 110 million aged over 65, some 8.3% of the total (NBS, 2010). This is
forecast to grow to 16% in 2030 and to 23% in 2050 (United Nations, 2001). Traditionally, the
family has played a vital role in caring for the elderly, providing emotional, physical and
financial support (Zhang and Liu, 2007). However, the family’s capability for caring has been
eroded due to reduced family size caused by urbanization and lower fertility rates, and increased
mobility of young adults especially from the rural areas to cities. Consequently there are growing
geographical differences in such familial support. To address this demographic challenge, China
has been engaging in social security reforms, including pension, insurance, financial and medical
subsidies to provide institutional support for the elderly (Wang, 2006). While China has achieved
remarkable recent economic success, its social security provision for the elderly remains
extremely underfunded, underdeveloped and geographically unevenly distributed (Liu and
Zhang, 2004; Yip and Hsiao, 2009). This study focuses on the role of the family and the State in

3��
the health of the elderly to shed light on China’s demographic processes and to provide
implications for policy makers.
Support for the elderly in the Chinese context
Family Support
Filial piety is a notable Chinese cultural trait and has long been considered a major social force
holding together China’s family care system for the elderly (Zhan et al., 2008). Filial piety and
dutiful repayment is normally expressed in co-residence; the elderly living with their married
adult children and receiving emotional, physical and material help from family members
(Zimmer, 2005). Indeed, around 50.3% of elderly are living with their family members in 2010
(National Committee on Ageing, 2012).
Previous studies have illustrated the multifaceted relationships between living arrangements and
the health outcomes (e.g. Li et al., 2009; Sereny, 2011). There is some debate, however, about
the benefits of such arrangements. Although co-residence may provide the elderly with a sense
of pride as well as support to maintain health, it can also lead to dependence and acceleration of
loss of physical ability (Li et al., 2009). Some studies find that the elderly living alone are less
limited functionally because they have to undertake their own daily activities (e.g. Gu & Xu,
2007). A similar conclusion is drawn by Beydoun and Popkin (2005) who found that elderly
living independently were healthier than those living with non-spousal family members.

4��
However, other studies conclude that the family provides vital social support and interaction
resulting in the elderly living with their family exhibiting better health (Li et al., 2009).
Formal and professional personal social services for the elderly are extremely underdeveloped
in China and the primary financial responsibility for elderly care, irrespective of living
arrangements, traditionally falls on the family (Zhang and Liu, 2007). Recent studies have
reported that some 55% of the elderly in urban and 48% in rural areas want improved social
services (National Committee on Ageing, 2012). It is known that elderly living in households
with higher income have better health including lower risk of dysfunctional status, better
emotional health, and lower risk of mortality (Beydoun and Popkin, 2005).
Both traditional family living arrangements and financial support have been weakened in recent
decades due to reduced family size and increased mobility of young adults. These changes have
an important geographical dimension as there has been considerable urbanization with young
adults moving to urban areas without their elderly relatives (Kim, 2007). Moreover, the rural
elderly are usually not covered by state pension and health care plans. Consequently, the rural
elderly are more dependent on support from their families than the urban elderly when they lose
the physical ability to work (Cai et al., 2012). Indeed, some 87% of rural elderly above 80 rely
on family support compared to 29% of those aged between 60 and 64 (Cai et al., 2012).
.
State Support
5��
Institutional support for the elderly is provided in the form of social security which includes
pension, health insurance and social services. The provision varies greatly between places and
especially between rural and urban areas. In rural areas, the collective-based social security
collapsed in 1978 and was replaced by the Household Responsibility System whereby farming
families are responsible for their own welfare protection including old-age support (Zhang,
2011). The state only provides the “five guarantees” (food, clothing, medical care, fuel and
burial) for the elderly who are childless, disabled and without any support (Smart and Smart,
2001). A basic rural old-age insurance program was launched in 1992 with funding sources
primarily coming from individuals supplemented with collective-sponsored contributions and
governmental support. This scheme failed due to poor management, inconsistent policies, and
suspicions related to the financial sustainability of the promised returns. Only 1.5% of rural
elderly received social old age insurance in 2000 and only 11% participated in 2004 (Wang,
2006). A new rural old-age insurance program was introduced in 2009 targeted at covering all
rural areas by 2012. It has achieved a higher participation rate since its implementation, but its
impact on the elderly population is largely un-researched.
In urban areas prior to 1978, state-owned enterprises and the public sector provided social
welfare including retirement pension and medical care (Lin, 1992). After 1978, a multi-pillared
system, combining a basic social pillar with supplemental enterprise-sponsored pensions and
individual savings was introduced. In this system, pension financing is shared by the
government, enterprises and individuals. In 1997, a basic unified old-age insurance system using
a social-pool-plus-personal-accounts scheme was implemented and extended in 1999 to cover all
urban employees (Government White Papers, 2004). By the end of 2005, 175 million people,

6��
including 43.67 million retirees participated in the basic old-age insurance scheme (Government
White Papers, 2006). Even though the urban elderly enjoy better social security coverage, 40%
of non-working urban elderly still relied on family support in 2000 (Wang, 2006).
In terms of state health care provision, most of the urban residents continue to be covered by
medical insurance systems funded by the government and their work units after the economic
reform. In contrast, the old Cooperative Medical System which covered 90 percent of the rural
residents became insolvent after 1978 leaving the majority of the rural residents uninsured until
2003 (Yip and Hsiao, 2009). Since then the government established a new Rural Cooperative
Medical System and increased its financial support. The coverage for the rural elderly increased
from 14% in 2003 to 94% in 2008 according to China’s 2008 National Health Services Survey.
However, the increased coverage has not led to better access to formal medical care or improved
health statuses of rural residents due to high deductibles and limited budget at the county level
(Lei and Lin, 2009). The coverage for urban elderly also increased from 66% in 2003 to 86% in
2008. Moreover, the urban elderly have better access to higher quality medical services as health
spending per capita is increasingly skewed towards urban areas (Brixi et al., 2010). Since the
public resources disproportionately benefit higher-income households, people from poor
households, especially those in rural areas, face financial obstacles in accessing cheap effective
care (Liu et al., 2008).
Professional care is extremely limited and only 1.5% of the elderly stayed at nursing homes in
2000 (Leung, 1997). In recent years, this provision has been extended to people who could afford
7��
to pay. Community-based social services for single elderly in cities have also been promoted
actively by the government (Chu et al., 2008). However, the provision of the services is highly
localized and varies greatly between places.
Geographical Variations in Elderly Support and Health
A growing body of research contends that where people live makes a difference to health
outcomes (Jones and Moon, 1993; Mohan et al., 2005; Skapinakis et al., 2005). Health outcomes
are not only affected by individual characteristics but also by the surrounding environment where
individuals live and work (Duncan et al., 1998; Jones et al., 2000).
China is highly spatially differentiated in terms of its physical and cultural landscapes as well as
economic development. The quality and availability of the health resources vary greatly between
coastal and inland areas as a result of their different levels of economic development (Liu et al.,
2008; Brixi et al., 2010). Even though the main institutions of social security provision are
ostensibly implemented through central government, large variations exist in how they are
performed locally. Indeed, since the mid-2000s, each province implements its own social
security policy. Geographical variations also exist in family support with a U-shaped
relationship; the weakest family support in mid-developed urban regions and the highest in the
most and least developed provinces (Du and Wu, 1998; Lin, 2002).
8��
There have been few national scale studies of area variations on the health of the elderly in
China. Yin and Lu (2007) examined individual and community factors associated with activities
of daily living among the oldest-old and found unexplained geographical variations. The uneven
economic development, varied social security provision as well as different family support at
regional levels may all contribute to the geographical variations on the health outcomes of the
elderly. The objective of this study is to characterise the nature of province level differences in
the health of the elderly and to examine how family support and social security provision
contribute to these differences. We do not undertake an aggregate analysis at the province level
but a multilevel analysis where individual and province differences are considered
simultaneously.
Data and methodology
The empirical analysis of this study mainly uses the 2008 wave of the Chinese Longitudinal
Healthy Longevity Survey (CLHLS). The survey was conducted in a randomly selected half of
the total number of counties and cities in 23 provinces1. It includes the oldest-old (aged 80 and
older) as well as younger elders (aged 60-79). The survey areas covered 1.1 billion people, 85
percent of the total population in China. The 2008 wave has the largest dataset among all waves
and includes 12,591 interviewees with complete data. The dataset has a natural hierarchal
structure with individuals nested within provinces.
������������������������������������������������������������1 Eight provinces in northwest China are excluded from the study due to lack of reliable information on self-reported age; they are: Xinjiang, Inner Mongolia, Gansu, Qinghai, Ningxia, Tibet, Yunnan and Guizhou.

9��
The dependent variable is Self-Rated Health (SRH); previous research has indicated that this is
a sensitive and reliable indicator of an individual’s current health status (Wu and Schimmele,
2006). Although the focus of this research is on the effects of the state and family support, it is
important to control for other relevant individual factors but not to over control so that the main
effects are underestimated. Consequently, age, gender and educational status are included as
individual variables. The remaining variables are grouped into three categories: care support,
financial support and medical support; they are chosen to represent the characteristics of
contemporary China as discussed above. Details and summary statistics are given in Table 1
where the importance of the support of the family can clearly be seen. Some 49% live with their
family (not including living with their spouse) and the main source of finance is the family for
two thirds of the respondents. At the province level we include total health institutional beds per
1000 population to reflect health resources; this includes both hospital and health centre beds.
(Table 1 about here)
Methods
Given the ordinal nature of SRH and the hierarchical structure of individuals in provinces, the
appropriate model is the multilevel multinomial logistic (Duncan et al., 1998). This model has
three parts: the response, the fixed part and the random part. The observed response is whether
the individuals rate themselves into one of the three categories. This, for good statistical reasons
(Snijders and Bosker, 2011) is modelled as the log odds of being in fair or good health as

10��
compared to the base category of poor health. The fixed part consists of the predictor variables at
both the individual and province level. The associated estimated effects are on the logit scale but
can readily transformed to relative odds for easier comparison. The random part consists of two
elements: the un-accounted for individual differences which are assumed to come from
multinomial distribution and the residual province differentials on a logit scale. The variance of
the latter summarises the between-province differences conditional on what variables are
specified in the fixed part. This can be transformed to a Median Odds Ratio (Merlo et al., 2005)
to make comparisons with the size of the effects in the fixed part of the model. This is the
median value of the odds ratio between provinces of higher and lower propensity when randomly
picking two provinces. It can be conceptualised as the increased propensity of better health that
would result on average from moving to a province with a higher propensity.
All the models are estimated with the MLwiN software (Rasbash et al., 2009). Due to the
discrete nature of the outcome and the rather small number of higher level units, Bayesian
MCMC estimation is used because of its good properties in this situation (Browne and Draper,
2006).
Results
The models were estimated as a sequence, adding variables from one category at a time and
finally including all variables (Table 2). Model 1 is null model which only includes a constant in
the fixed part. Models 2 and 3 include variables for individual factors (Age, Gender and
Education). From Model 4a to Model 7, each category is added to model 3; Model 8 includes all
11��
the variables. The Deviance Information Criterion (DIC) is used to measure the badness-of-fit for
each model (Spiegelhalter et al., 2002). The DIC is penalized for complexity which is estimated
as the degrees of freedom (dof) consumed in the fit. Any reduction in the DIC is an improvement
in the fit of the model, and a larger reduction in the DIC shows a better fitting model. The change
in DIC between each model and Model 3 is also shown in Table 3. The category with greatest
reduction in the DIC is Financial Support with the bulk of the improvement in fit coming from
the sub-category of Family Income; the Care support category is important with most of the
improvement coming from the Source of Care. The Medical Support category plays a lesser but
still important role. Province health services have little explanatory power. In summary, the
major single determinant is of elderly health is family equivalised income.
(Table 2 about here)
(Table 3 about here)
(Figure 1 about here)
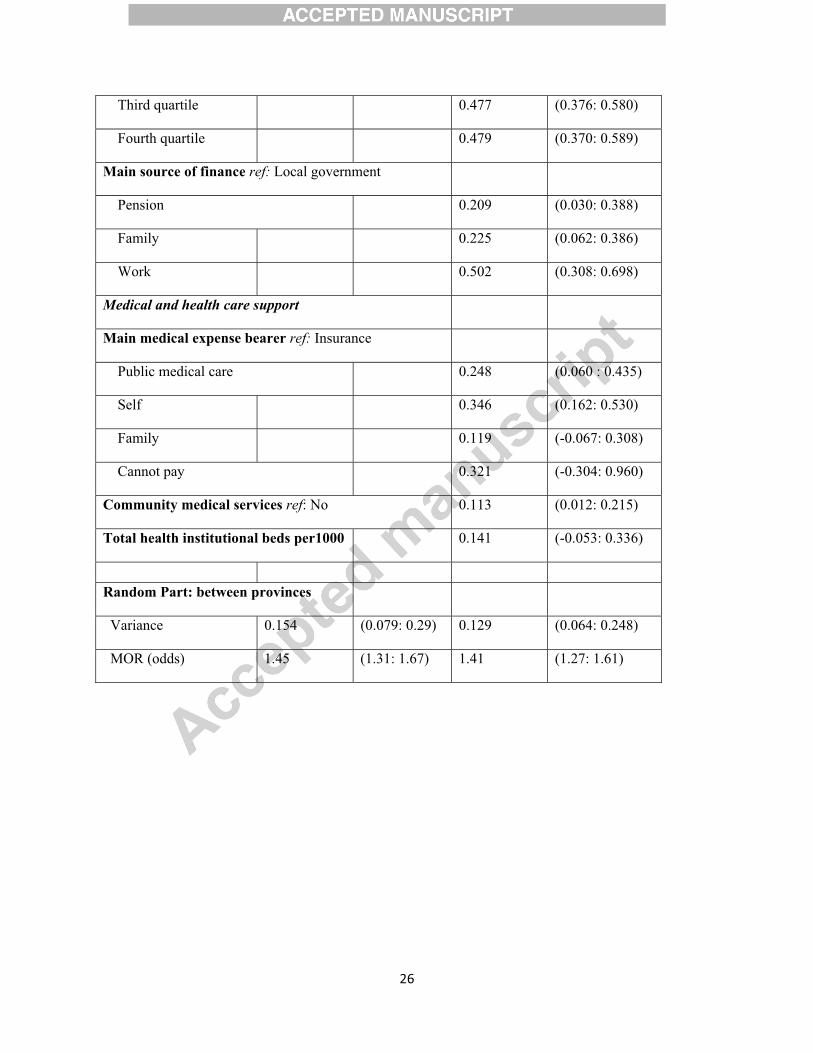
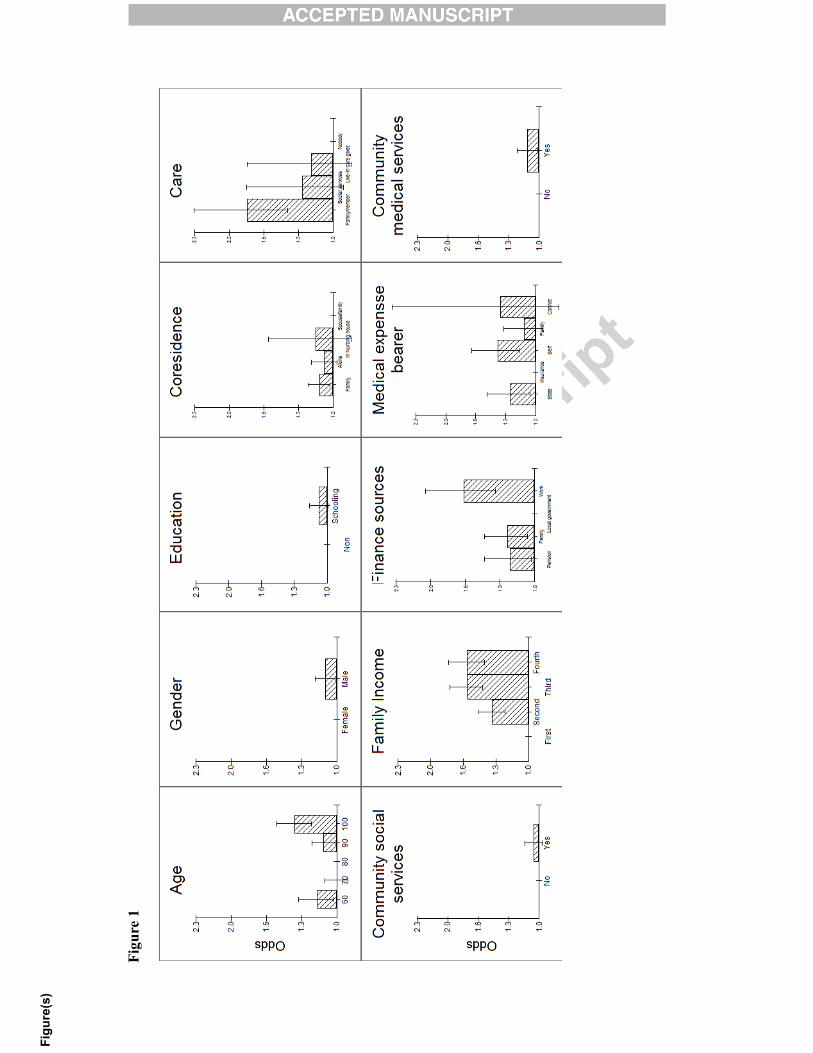
Table 3 presents the results of null model and the full model in the form of logits; it also gives
the residual variance between provinces, and the MOR statistic. All estimates also have their
95% Bayesian credible intervals. In order to appreciate the nature and the relative size of the
effects, the logits of the fixed effects in Model 8 are converted into relative odds ratios with the
base category; the lowest likelihood to report good health, being set to one. The results are
graphed in Figure 1 with a common vertical scale for comparison.

12��
Taking each variable and category in turn we can characterise the nature of the relationships.
For individual factors, the odds of having good health have a U-shaped relationship with the
lowest odds being reported by the 80 year olds with those younger and older reporting higher
odds. Elderly men are 10 percent more likely to have good health than elderly women. Elderly
with formal education are 7% more likely to be in good health than those without but even with a
large sample size the credible intervals include the estimate of no effect. The same can be said
for living arrangement and community social services; there are no substantial differences
according to whom they live with, nor if they receive social services, despite a fifth of the survey
being in receipt of such support. In contrast, the source of care is important. The key difference
in reporting good health is between those who have nobody and those receiving family care
when they are sick (odds of 1.8). The wide credible interval for social services and private live-in
carer as the main sources of care reflects how few have access to such care.
A sizeable effect is found for family income with the lowest odds of being good health being
found for those in the lower quartile with fewer than 360 US dollars. Those in the top quartile of
income (above 840 US dollars) have odds of 1.61 and those in middle quartiles all report higher
odds for good health than those in poverty. Family income matters a lot. The source of this
finance play a role too, with the main difference being the low odds of good health for those
relying on local government as compared to other sources (family, work, and pension). Who
bears the medical expense also has something of a role with the main contrast between those
relying on insurance (with the lowest odds) and the other categories (family, public care and
13��
self). The wide credible interval for not being able to pay reflects the very small numbers in this
category in the survey. There are no sizeable effects for community medical services or for the
province provision of hospital beds.
Table 3 also shows there for the level-2 between-province variance; the unexplained variance in
null model is 0.154, and it declines to 0.129 in the full model, which suggests that these variables
vary systematically in their mean proportion between provinces (Jones and Subramanian, 2012).
The MOR statistic for the full model 8 is 1.41, and the lower and upper CI’s are 1.27 and 1.61,
implying that are still unexplained differences between provinces. These odds are directly
comparable with the ORs of fixed effects variables. On average (in the median), conceptually
moving a person to a province with a higher probability of having good health, the propensity of
reporting good health will increase 1.41 times, which is greater than all the main individual
effects.
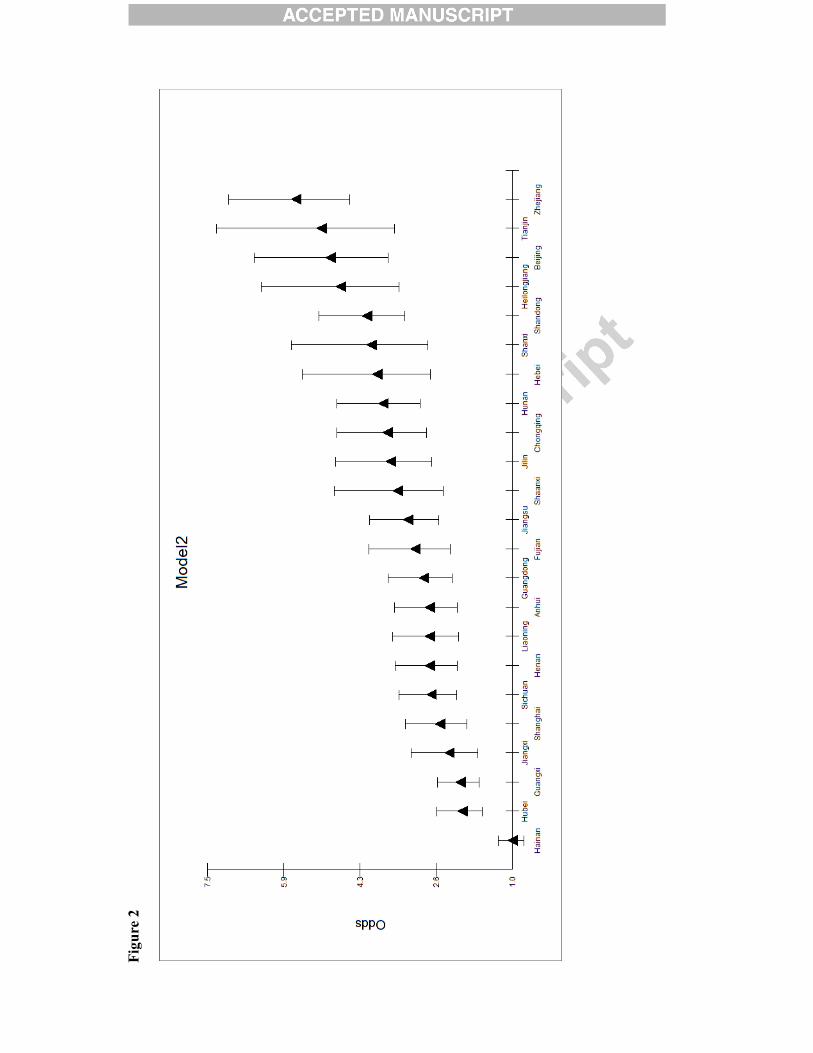
To illustrate the differences between provinces, Figure 2 plots the provincial differentials on an
odds scale for Model 2 (age and sex) and Model 8 (all variables) with the lowest odds set to 1.
The graph also provides the 95% comparative confidence intervals. The plot depicts substantial
differences with the best province (Zhejiang) 5.6 times higher than Hainan (the poorest
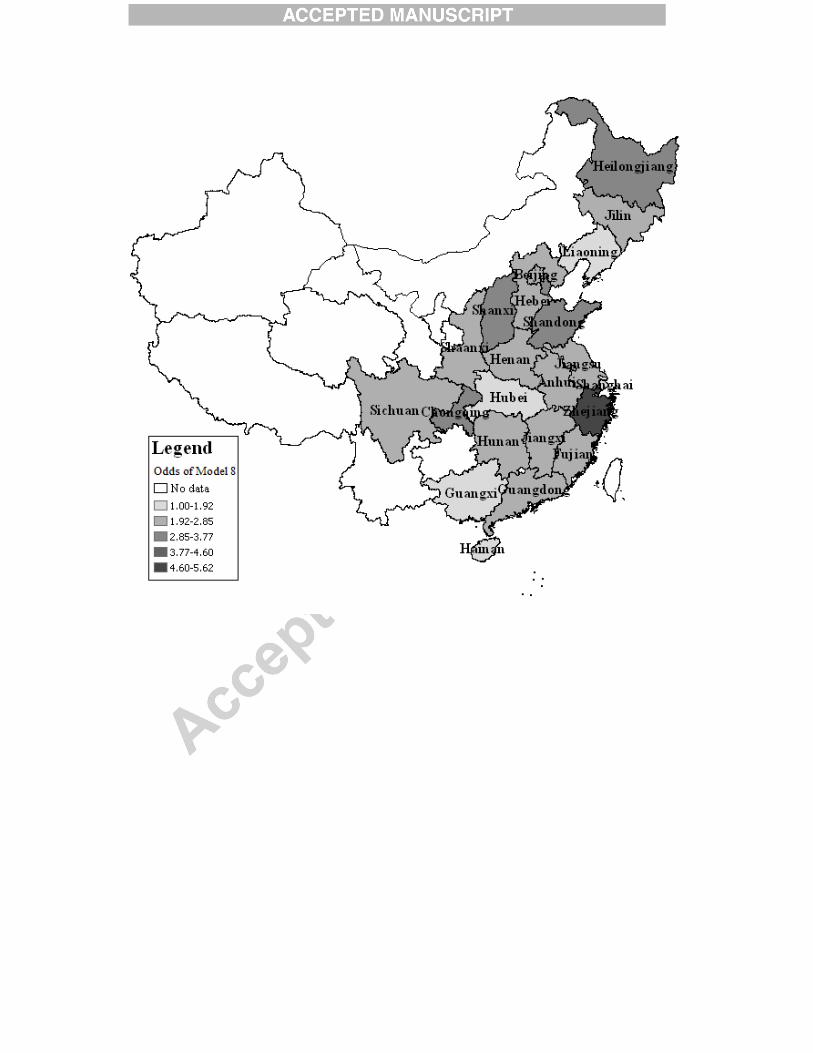
provinces) in model 2 and still 4.6 times higher in the full model. Figure 3 maps these
differential odds. Darker colour shows higher odds of reporting good health. It is clear that the
north part of China (excluding Liaoning) have better health than the middle and southern China.
Elderly in Hubei, Guangxi and Hainan are the lowest odds of reporting good health. Zhejiang is
14��
the province with best health for the elderly. These differential odds are large compared to all the
variables that we have included in the model; there are substantial (residual) differences between
provinces.
(Figure 2 about here)
(Figure 3 about here)
Discussion and conclusion
In terms of age, previous studies (Smith and Kington 1997; Zeng et al., 2002) found that the
physical and cognitive functions of the elderly declined rapidly as they became older. Our study
shows similar results for most of the elderly, but also exhibits a positive association between
health status and advanced age: elderly who are over 100 have a higher odds of reporting good
health than those who are octogenarians. Similar results were also identified by Liu and Zhang
(2004). This may be explained by Chinese cultural values as well as institutional effects. Chinese
families and societies show great respect for those of advanced age and the local government
also provides financial assistance to the oldest of the old. Such financial subsidy is substantially
higher for people who are over 100 than those who are in their 80s. Selective survivorship and
cohort differences may also play a role in this pattern. In terms of gender, the better health for
men is also found by Liu and Zhang (2004), and Sereny (2011). For education attainment,
Sereny (2011) found that educated elderly are more likely to self-rated health as poor; while, Liu
and Zhang (2004) found that the higher the educational attainment, the better health status the
15��
elderly reported. Li et al., (2009) did not find any sign of effects of education among SRH,
mortality and ADL disability using a two waves study. In conclusion the effect does indeed
appear to be small when other variables are taken into account.
The results suggest that elderly who are more independent, such as those who rely on
themselves for financial support or medical expenses are more likely to report good health.
Previous research showed that elderly who achieved financial and living independence report
better self-rated health based on a survey in Beijing (Meng and Zhang, 2010). A study on the
oldest of the old in China also suggested that elderly who are financially independent express
greater life satisfaction and exhibit better mental status (Li et al., 2007). These results may also
explain the high working rate among the elderly, notably the rural elderly (over 50 percent,
Xinhuanet.com, 2012) as they receive little or no income if they stop working even after
retirement age. With these results it is a possibility that there is reverse causality such that those
who are in poor health are less able to live and support themselves independently.
This independence of the elderly, however, does not indicate lack of need for care support;
those who receive no care are the most vulnerable. Moreover, those who rely on the state
economically are least likely to report good health. In China, only elderly with no children, no
work ability and no income (Three No’s) are eligible to receive state financial state assistance
(Zhang and Liu, 2007) and the coverage has only been recently extended to the oldest old. It is
not surprising, therefore, to find this group of people reporting the poorest health. It reflects the
inadequacy and underdevelopment of the state financial provision for the elderly; as well the
16��
assumption that the state’s responsibility for coverage of the elderly only extends to those who
are the most vulnerable (Ikels, 1992). However, adequate coverage from public medical care
does contribute more to the health of the elderly than those who have to rely on insurance for
medical expenses or out-of-pocket payment.
The results confirm the essential role the family plays in the care system for the elderly, and
those who receive family care are more likely to report good health than those who rely upon
other sources. Social services and professional personal care for the elderly in China is extremely
underdeveloped, the former is provided by the Street Office and primarily targets single elderly
people who are in the most urgent need (Leung, 1997); the latter is accessed by the few elderly
who can afford the services after privatization. For the majority, the family becomes the de facto
carer, particularly after the elderly become older and sick. A positive relationship exists between
family income and health, with those on the poorest income reporting much lower odds of being
in good health. As discussed earlier, high-income households benefit disproportionally from
public resources such as medical resources (Brixiet al., 2010). With access to higher quality
medical treatment, facilities and services, it is not surprising that elderly from these households
report better health. Breakdowns between age category and family support (finance and medical
expense) indicate that the reliance of the elderly on their family increases as they grow older.
Evidence suggests that sizeable geographical inequality exists in the health outcomes of the
elderly. Elderly from Zhejiang are nearly six times more likely to report good health than those
from Hainan. Elderly from Northern provinces on average report better health than those from

17��
southern provinces with some exceptions. Elderly from the old northeast industrial provinces
Liaoning and Jilin report poorer health. Industrial pollution may have a role in this (Zeng and
Vaupel, 2002). Zhejiang, one of the wealthiest provinces, reports the best health result for the
elderly. However, other more developed areas such as Shanghai, Guangdong and Beijing display
fairly poor average health which suggests that factors other than economic level may be
important. Results from a previous study suggest that the health of the elderly is affected by
provincial income inequality level (Feng et al., 2012). Elderly from Hainan are least likely to
report good health from our results and Hainan also experiences the highest income inequality
level (Feng et al., 2012). The provincial level variable--- Total health institutions beds per 1000
population --- is not significant which indicates that the availability of health facilities in a
province does not result in a higher health status of the elderly. The heavy medical expenses
might be the reason for the lack of relationship. Neither province GDP nor province mean
income was important variables in accounting for province differentials. The large residual
province differentials may relate to more intangible cultural differences. In models not presented
here, there were no important differences between urban and rural residents and between the Han
Chinese and minority Chinese ethnic groups; the province differentials did not reduce when
these variables were included.
As China’s society ages, individuals, families and the state are all facing daunting challenges.
Our findings are important for understanding that challenge. We have found that those in poverty
who are missing out on the economic transformation, those who have no one to care for them,
and those who have to rely on insurance are the fractions of the elderly with the poorest health.
All these groups can be expected to grow with increasing economic inequality, the urbanization
18��
of the young, and the further development of the empty nest problem as the elderly are
physically dislocated from their family. Moreover, province differentials which are already large
can be expected to grow alongside greater economic inequality. Although the family can be
expected to retain its vital welfare role, its capacity will be diminished due to reduced family size
and increased lifespan of the old population. Policies need to be implemented to transfer part of
the families’ responsibility, mainly financial support and personal care to other agents. Programs
that help enable the economic independence of the elderly especially rural elderly, such as the
new old-age insurance need to be strengthened. The government needs not only to pursue wider
coverage of these programs, but also extend the benefits that the elderly actually receive. This
future development needs to be targeted more towards less developed areas and underprivileged
groups in order to reduce health inequality amongst the elderly. Our findings reveal that it is not
just the scale of unprecedented demographic that is challenging but also the nature of this
change.

19��
References
Beydoun, M.A., & Popkin, B.M. (2005). The impact of socio-economic factors on functional status decline among community-dwelling older adults in China. Social Science & Medicine, 60, 2045-2057.
Brixi, H., Mu, Y., Targa, B., & Hipgrave, D. (2010). Equity and public governance in health system reform: Challenges and opportunities for China. World Bank Policy Research Working Paper.
Browne, W.J., & Draper, D. (2006). A comparison of Bayesian and likelihood-based methods for fitting multilevel models. Bayesian Analysis, 1, 473-513.
Cai, F., Giles, J., O'Keefe, P., & Wang, D. (2012). The Elderly and Old Age Support in Rural China : Challenges and prospects. In W. Bank (Ed.).
Chu, L.W., & Chi, I. (2008). Nursing homes in China. Journal of the American Medical Directors Association, 9, 239-245.
Du, P., & Wu, C. (1998). The analysis of primary source of economic support among the elderly in China. Population Research, 51-57.
Duncan, C., Jones, K., & Moon, G. (1998). Context, composition and heterogeneity: Using multilevel models in health research. Social Science & Medicine, 46, 97-117.
Feng, Z.X., Wang, W.F.W.N., Jones, K., & Li, Y.Q. (2012). An exploratory multilevel analysis of income, income inequality and self-rated health of the elderly in China. Social Science & Medicine, 75, 2481-2492.
Government White Papers, 2004. http://www.china.org.cn/e-white/20040907/1.htm retrieved on 15 July 2012.
Government White Papers, 2006. http://www.china.org.cn/english/aged/192046.htm retrieved on 15 July 2012.
Gu, D., & Xu, Q. (2007). Sociodemographic effects on dynamics of task-specific ADL functioning at the oldest-old ages. Journal of Cross-cultural Gerontology, 22, 61-81.
Ikels, C. (1992). Family caregiving and the elderly in China. In D. Biegel & A.Blum (Eds.), Aging and caregiving: Theory and practice (pp. 270-284). NewburyPark, CA: Sage Publications.
Jones, K., Gould, M.I., & Duncan, C. (2000). Death and deprivation: an exploratory analysis of deaths in the Health and Lifestyle survey. Social Science & Medicine, 50, 1059-1079.

20��
Jones, K., & Moon, G. (1993). Medical Geography - Taking Space Seriously. Progress in Human Geography, 17, 515-524.
Jones, K., & Subramanian, V.S. (2012). Developing multilevel models for analysing contextuality, heterogeneity and change. Bristol: Centre for Multilevel Modelling.
Kim, I.K. (2007). Social support for older persons: the role of family, community and state in selected Asian countires. Global review of Madrid Plan of action on Aging. Bangkok.
Lei, X., & Lin, W. (2009). The New Cooperative Medical Scheme in rural China: does more coverage mean more service and better health? Health Economics, 18, S25-S46.
Leung, J.C.B. (1997). Family Support for the Elderly in China. Journal of Aging & Social Policy, 9, 87-101.
Li, D.-m., Chen, Y.-Y., & Zhen-yun, W. (2007). Mental status of the oldest-old in China and its related factors. Chinese Mental Health Journal, 2, 614-617.
Li, L.W., Zhang, J., & Liang, J. (2009). Health among the oldest-old in China: Which living arrangements make a difference? Social Science & Medicine, 68, 220-227.
Li, M. 2012. The average monthly pension of rural elderly in China only 74 yuan, they still need to farm work. Xinhuanet.
Lin, G. (2002). Regional variation in family support for the elderly in China: a geodevelopmental perspective. Environment and Planning A, 34, 1617-1633.
Lin, J.Y.F. (1992). Rural Reforms and Agricultural Growth in China. American Economic Review, 82, 34-51.
Liu, G.P., & Zhang, Z. (2004). Sociodemographic differentials of the self-rated health of the oldest-old Chinese. Population Research and Policy Review, 23, 117-133.
Liu, Y., Rao, K., Wu, J., & Gakidou, E. (2008). China’s health system performance. Lancet, 372.
Meng, Q., & Zhang, T. (2010). Social support, self-care status and self-rated health in elderly. Journal of Medical Research, 39, 86-89.
Merlo, J., Chaix, B., Ohlsson, H., Beckman, A., Johnell, K., Hjerpe, P., et al. (2006). A brief conceptual tutorial of multilevel analysis in social epidemiology: using measures of clustering in multilevel logistic regression to investigate contextual phenomena. Journalof Epidemiology and Community Health, 60, 290-297.
Mohan, J., Twigg, L., Barnard, S., & Jones, K. (2005). Social capital, geography and health: a small-area analysis for England. Social Science & Medicine, 60, 1267-1283.
21��
National Bureau of Statistics (2010), Beijing, China: Chinese Statistics Press.
National Committee on Ageing (2012), China’s urban and rural elderly population status tracking survey report, Beijing, China.
Rasbash, J., Steele, F., Browne, W.J., & Goldstein, H. (2009). A user's guide to MLwiN, version 2.10. Bristol: University of Bristol.
Sereny, M. (2011). Living Arrangements of Older Adults in China: The Interplay Among Preferences, Realities, and Health. Research on Aging, 33, 172-204.
Skapinakis, P., Lewis, G., Araya, R., Jones, K., & Williams, G. (2005). Mental health inequalities in Wales, UK: multi-level investigation of the effect of area deprivation. British Journal of Psychiatry, 186, 417-422.
Smart, A., & Smart, J. (2001). Local citizenship: welfare reform urban/rural status, and exclusion in China. Environment and Planning A, 33, 1853-1869.
Smith, J.P., & Kington, R. (1997). Demographic and economic correlates of health in old age. Demography, 34, 159-170.
Snijders, T.A.B., & Bosker, R.J. (2011). Multilevel Analysis: An Introduction to basic and advanced multilevel modeling. London: Sage.
Spiegelhalter, D.J., Best, N.G., Carlin, B.R., & van der Linde, A. (2002). Bayesian measures of model complexity and fit. Journal of the Royal Statistical Society Series B-Statistical Methodology, 64, 583-616.
United Nations. 2001. World population prospects. New York.
Wang, D.W. (2006). China's urban and rural old age security system: Challenges and options. China & World Economy, 14, 102-116.
Wu, Z., & Schimmele, C.M. (2006). Psychological disposition and self-reported health among the 'oldest-old' in China. Ageing & Society, 26, 135-151.
Yin, D., & Lu, J. (2007). Individual and community factors associated with activities of daily living among the oldest-old: An application of the HLM method. Population Research and Policy Review, 60-70.
Yip, W., & Hsiao, W. (2009). China's health care reform: A tentative assessment. Chinaeconomic review, 20, 613-619.
Zeng, Y., & Vaupel, J.W. (2002). Functional capacity and self-evaluation of health and life of the oldest old in China. Journal of Social Issues, 58, 733-748.

22��
Zeng, Y., Vaupel, J.W., Xiao, Z., Zhang, C., & Liu, Y. (2002). Sociodemographic and health profiles of oldest old in China. Population and Development Review, 28.
Zhan, H.J., Feng, X.T., & Luo, B.Z. (2008). Placing elderly parents in institutions in urban China - A reinterpretation of filial piety. Research on Aging, 30, 543-571.
Zhang, C. (2011). Children, support in old age and social insurance in rural China. Munich University Library of Munich, Germany.
Zhang, W., & Liu, G. (2007). Childlessness, psychological well-being, and life satisfaction among the elderly in China. Journal of Cross-cultural Gerontology, 22, 185-203.
Zimmer, Z. (2005). Health and living arrangement transitions among China's oldest-old. Research on Aging, 27, 526-555.
Figure captions
Figure 1 The odds of good health: results from Model 8
Figure 2 Differential relative odds for provinces derived from models 2 and 8
Figure 3 Maps of odds of good health for provinces derived from model 2 and model 8�
Table 1 Descriptive univariate information on the 2008 CLHLS sample
Dependent variable
Self-rated health Poor (17.5%), Fair (35.2%), Good (47.3%),
Individual factors (n = 12,591)
Age60-69(11.1%), 70-79(19.2%), 80-89(27.3%), 90-99(25.9%), 100+ (16.4%)
Gender Male (44.4%), Female (55.6%)
Education No Schooling (59.5%); Schooling (40.5%)
Care Support
Co-residence Live with spouse (33.5%), Live with family member(s) 49.1%, Alone (15.8%), In a nursing house (1.6%)
23��
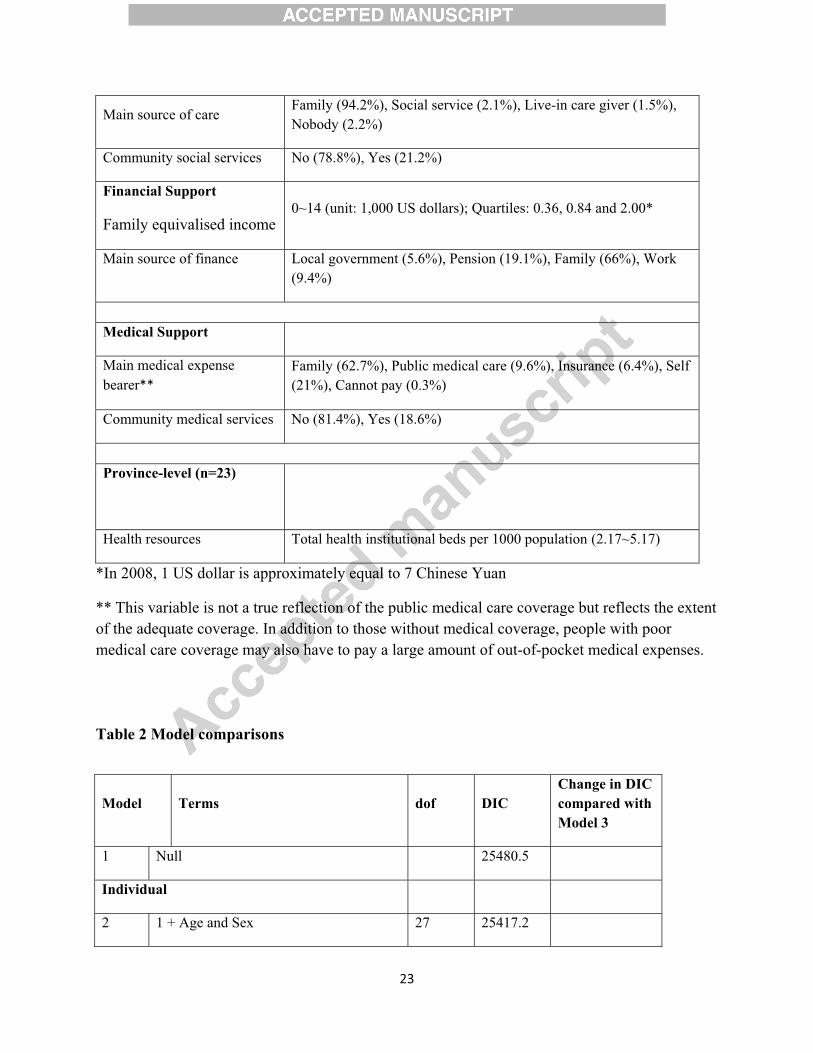
Main source of care Family (94.2%), Social service (2.1%), Live-in care giver (1.5%), Nobody (2.2%)
Community social services No (78.8%), Yes (21.2%)
Financial Support
Family equivalised income0~14 (unit: 1,000 US dollars); Quartiles: 0.36, 0.84 and 2.00*
Main source of finance Local government (5.6%), Pension (19.1%), Family (66%), Work (9.4%)
Medical Support
Main medical expense bearer**
Family (62.7%), Public medical care (9.6%), Insurance (6.4%), Self (21%), Cannot pay (0.3%)
Community medical services No (81.4%), Yes (18.6%)
Province-level (n=23)
Health resources Total health institutional beds per 1000 population (2.17~5.17)
*In 2008, 1 US dollar is approximately equal to 7 Chinese Yuan
** This variable is not a true reflection of the public medical care coverage but reflects the extent of the adequate coverage. In addition to those without medical coverage, people with poor medical care coverage may also have to pay a large amount of out-of-pocket medical expenses.
Table 2 Model comparisons
Model Terms dof DIC Change in DIC compared with Model 3
1 Null 25480.5
Individual
2 1 + Age and Sex 27 25417.2

24��
3 2 + Education 28 25408.1
Care support
4a 3+ Co-residence 32 25404.7 3.4
4b 3+ Source of Care 31 25378.6 29.5
4c 3+ Community Social Services 29 25404.2 3.9
4d 3 + Care Support ( All three) 35 25372.4 35.7
Financial Support
5a 3 + Family Income 31 25306.4 101.7
5b 3 + Source of Finance 32 25375.0 33.1
5c 3+ Financial Support (Both) 34 25276.2 131.9
Medical Support
6a 3 + Main medical support 33 25396.7 11.4
6b 3+ Community Medical services 30 25400.1 8.0
6c 3 + Medical Support (Both ) 34 25388.7 19.5
Province level
7 3 +Province health resources 29 25408.6 -0.5
Full Model
8 3+ Care Support + Financial + Medical + Province health resources 46 25228.6 179.6

25��
Table 3 Multilevel multinomial logit estimates
Null Model8
Fixed Part Estimate CI Estimate CI
Intercept.(<=Good) -0.068 (-0.192,0.099) -1.673 (-2.037: -1.305)
Intercept(<=Fair) 1.632 (1.506, 1.804) 0.06 (-0.302: 0.428)
Age ref:80-89
60-69 0.165 ( 0.031: 0.300)
70-79 -0.006 (-0.111: 0.099)
90-99 0.114 (0.020: 0.207)
100+ 0.331 (0.219: 0.445)
Male(ref: Female) 0.101 (0.020: 0.181)
Schooling(ref: Non-schooling) 0.077 (-0.008: 0.161)
Care Support
Co-residence ref: Live with spouse
Live with family member (s) 0.121 (0.027: 0.215)
Alone 0.080 (-0.031: 0.193)
In a nursing house 0.151 (-0.167: 0.472)
Main source of care ref: Nobody
Family 0.590 (0.355: 0.825)
Social service 0.249 (-0.091: 0.595)
Live-in care giver 0.181 (-0.187: 0.547)
Community social services ref: No 0.058 (-0.039: 0.154)
Financial Support
Family equivalised income ref: First quartile
Second quartile 0.309 (0.213: 0.405)
26��
Third quartile 0.477 (0.376: 0.580)
Fourth quartile 0.479 (0.370: 0.589)
Main source of finance ref: Local government
Pension 0.209 (0.030: 0.388)
Family 0.225 (0.062: 0.386)
Work 0.502 (0.308: 0.698)
Medical and health care support
Main medical expense bearer ref: Insurance
Public medical care 0.248 (0.060 : 0.435)
Self 0.346 (0.162: 0.530)
Family 0.119 (-0.067: 0.308)
Cannot pay 0.321 (-0.304: 0.960)
Community medical services ref: No 0.113 (0.012: 0.215)
Total health institutional beds per1000 0.141 (-0.053: 0.336)
Random Part: between provinces
Variance 0.154 (0.079: 0.29) 0.129 (0.064: 0.248)
MOR (odds) 1.45 (1.31: 1.67) 1.41 (1.27: 1.61)
�
Figu
re 1
Figu
re(s
)
Figu
re 2
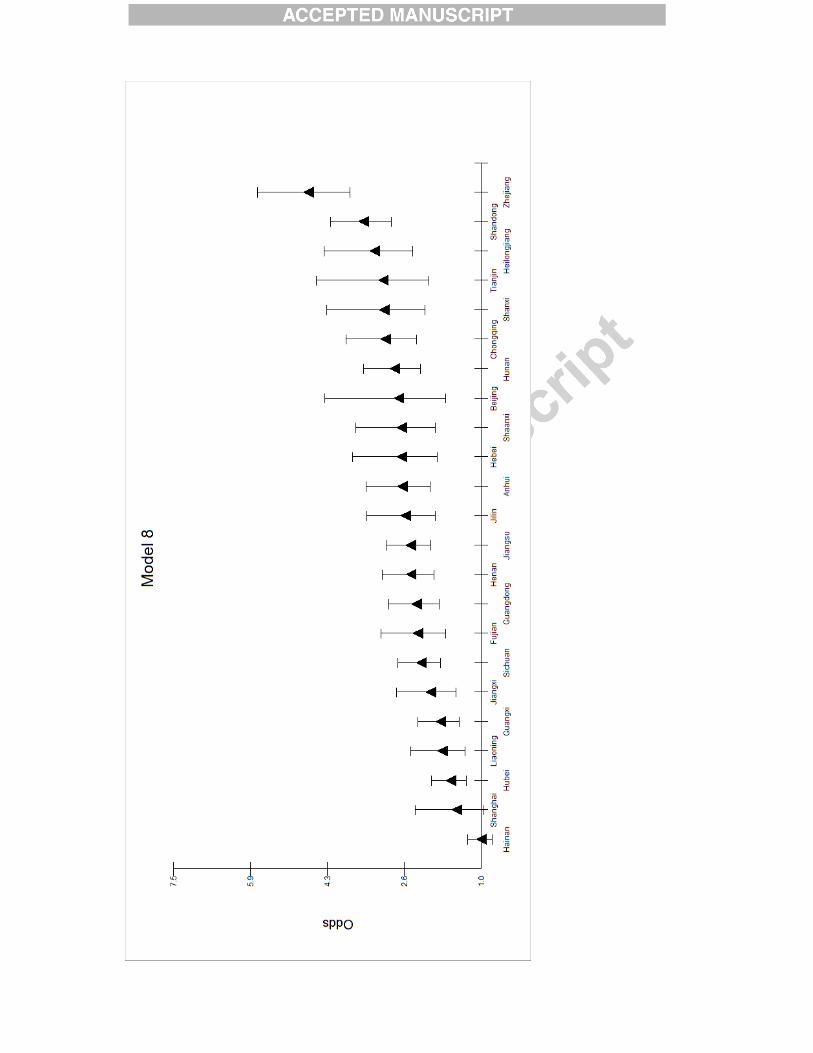

Figure 3