A multidisciplinary approach can efficiently trace the source of Asian dust storms
10
A multidisciplinary approach to trace Asian dust storms from source to sink Yan Yan a, b, * , Youbin Sun a, c, * , Long Ma a, b , Xin Long a, b a State Key Laboratory of Loess and Quaternary Geology, Institute of Earth Environment, Chinese Academy of Sciences, Xi'an 710075, China b University of Chinese Academy of Sciences, Beijing 100049, China c Institute of Global Environmental Change, Xi'an Jiaotong University, Xi'an 710049, China highlights A multidisciplinary approach can efficiently trace the source of Asian dust storms. Spring dust storms can be attributed to natural and anthropogenic origins. The northern Chinese deserts are the main sources for the natural dust storms. article info Article history: Received 29 September 2014 Received in revised form 14 January 2015 Accepted 18 January 2015 Available online 19 January 2015 Keywords: Dust storm Source tracing Satellite image Back trajectory analysis Proxy comparison abstract Tracing the source of dust storm (DS) in mega-cities of northern China currently suffers ambiguities from different approaches including source-sink proxy comparison, air mass back trajectory modeling, and satellite image monitoring. By integrating advantages of all three methods, we present a multidisci- plinary approach to trace the provenance of dust fall in Xi'an during the spring season (March to May) of 2012. We collected daily dust fall to calculate dust flux variation, and detected eight DS events with remarkable high flux values based on meteorological comparison and extreme detection algorithm. By combining MODIS images and accompanying real-time air mass back trajectories, we attribute four of them as natural DS events and the other four as anthropogenic DS events, suggesting the importance of natural and anthropogenic processes in supplying long-range transported dust. The primary sources of these DS events were constrained to three possible areas, including the northern Chinese deserts, Taklimakan desert, and Gurbantunggut desert. Proxy comparisons based upon the quartz crystallinity index and oxygen isotope further confirmed the source-to-sink linkage between the natural DS events in Xi'an and the dust emissions from the northern Chinese deserts. The integration of geochemical and meteorological tracing approaches favors the dominant contribution of short-distance transportation of modern dust fall on the Chinese Loess Plateau. Our study shows that the multidisciplinary approach could permit a better source identification of modern dust and should be applied properly for tracing the provenance fluctuations of geological dust deposits. © 2015 Elsevier Ltd. All rights reserved. 1. Introduction Dust storm (DS) is a disastrous natural phenomenon, which could bring serious damage to downwind human habitats, including causing soil degradation, breaking down industrial ma- chineries, disrupting traffics, harming vegetation and crops, dete- riorating air quality, and inducing acute respiratory diseases (Zhang et al., 2003a; Chen et al., 2004; Kan et al., 2007; Baddock et al., 2013). High dust loading in the air due to the DS events could also impact the solar radiation balance, cloud formation, secondary pollutant generation, and marine primary productivity, which have far more complex influence on the ecosystem (Zhuang et al., 1992; Zhang et al., 1994; Miller and Tegen, 1998; Jickells et al., 2005; Uno et al., 2009). Dust provenance studies in downwind mega-cities thus could provide critical information for government policy- making in DS damage control, and identify the parental material of the entrained dust for further assessment of its climatic, envi- ronmental and societal impacts. DS is also the primary dust * Corresponding authors. 97 Yanxiang Road, Yanta zone, Xi'an 710061, China. E-mail addresses: [email protected] (Y. Yan), [email protected] (Y. Sun). Contents lists available at ScienceDirect Atmospheric Environment journal homepage: www.elsevier.com/locate/atmosenv http://dx.doi.org/10.1016/j.atmosenv.2015.01.039 1352-2310/© 2015 Elsevier Ltd. All rights reserved. Atmospheric Environment 105 (2015) 43e52
Transcript of A multidisciplinary approach can efficiently trace the source of Asian dust storms
lable at ScienceDirect
Atmospheric Environment 105 (2015) 43e52
Contents lists avai
Atmospheric Environment
journal homepage: www.elsevier .com/locate/atmosenv
Amultidisciplinary approach to trace Asian dust storms from source tosink
Yan Yan a, b, *, Youbin Sun a, c, *, Long Ma a, b, Xin Long a, b
a State Key Laboratory of Loess and Quaternary Geology, Institute of Earth Environment, Chinese Academy of Sciences, Xi'an 710075, Chinab University of Chinese Academy of Sciences, Beijing 100049, Chinac Institute of Global Environmental Change, Xi'an Jiaotong University, Xi'an 710049, China
h i g h l i g h t s
� A multidisciplinary approach can efficiently trace the source of Asian dust storms.� Spring dust storms can be attributed to natural and anthropogenic origins.� The northern Chinese deserts are the main sources for the natural dust storms.
a r t i c l e i n f o
Article history:Received 29 September 2014Received in revised form14 January 2015Accepted 18 January 2015Available online 19 January 2015
Keywords:Dust stormSource tracingSatellite imageBack trajectory analysisProxy comparison
* Corresponding authors. 97 Yanxiang Road, YantaE-mail addresses: [email protected] (Y. Yan), suny
http://dx.doi.org/10.1016/j.atmosenv.2015.01.0391352-2310/© 2015 Elsevier Ltd. All rights reserved.
a b s t r a c t
Tracing the source of dust storm (DS) in mega-cities of northern China currently suffers ambiguities fromdifferent approaches including source-sink proxy comparison, air mass back trajectory modeling, andsatellite image monitoring. By integrating advantages of all three methods, we present a multidisci-plinary approach to trace the provenance of dust fall in Xi'an during the spring season (March to May) of2012. We collected daily dust fall to calculate dust flux variation, and detected eight DS events withremarkable high flux values based on meteorological comparison and extreme detection algorithm. Bycombining MODIS images and accompanying real-time air mass back trajectories, we attribute four ofthem as natural DS events and the other four as anthropogenic DS events, suggesting the importance ofnatural and anthropogenic processes in supplying long-range transported dust. The primary sources ofthese DS events were constrained to three possible areas, including the northern Chinese deserts,Taklimakan desert, and Gurbantunggut desert. Proxy comparisons based upon the quartz crystallinityindex and oxygen isotope further confirmed the source-to-sink linkage between the natural DS events inXi'an and the dust emissions from the northern Chinese deserts. The integration of geochemical andmeteorological tracing approaches favors the dominant contribution of short-distance transportation ofmodern dust fall on the Chinese Loess Plateau. Our study shows that the multidisciplinary approachcould permit a better source identification of modern dust and should be applied properly for tracing theprovenance fluctuations of geological dust deposits.
© 2015 Elsevier Ltd. All rights reserved.
1. Introduction
Dust storm (DS) is a disastrous natural phenomenon, whichcould bring serious damage to downwind human habitats,including causing soil degradation, breaking down industrial ma-chineries, disrupting traffics, harming vegetation and crops, dete-riorating air quality, and inducing acute respiratory diseases (Zhang
zone, Xi'an 710061, [email protected] (Y. Sun).
et al., 2003a; Chen et al., 2004; Kan et al., 2007; Baddock et al.,2013). High dust loading in the air due to the DS events couldalso impact the solar radiation balance, cloud formation, secondarypollutant generation, and marine primary productivity, which havefar more complex influence on the ecosystem (Zhuang et al., 1992;Zhang et al., 1994; Miller and Tegen, 1998; Jickells et al., 2005; Unoet al., 2009). Dust provenance studies in downwind mega-citiesthus could provide critical information for government policy-making in DS damage control, and identify the parental materialof the entrained dust for further assessment of its climatic, envi-ronmental and societal impacts. DS is also the primary dust
Y. Yan et al. / Atmospheric Environment 105 (2015) 43e5244
transport mechanism in loess formation, which formed the ChineseLoess Plateau (CLP), the most valuable continental archive of pastmonsoonal climate (Liu, 1985; Zhang et al., 1997; An, 2000; Prinset al., 2007). Provenance studies of deposited “modern loess” (i.e.,dust fall) are therefore critical to provide modern analogies oninterpreting loess provenance.
Modern observation and modeling results had identified theBadain Juran and Tengger deserts (referred to as the northernChinese deserts hereafter), Taklimakan desert, and Mongolian Gobidesert as the prime sources of modern dust in East Asia (Sun et al.,2001; Zhang et al., 2003b). Other areas including the Qaidam basin,Gurbantunggut desert, Mu Us desert, Hobq desert, and Horqin andOnqin Daga sandy lands were disputably considered as minor dustsources (Sun et al., 2001; Prospero et al., 2002; Zhang et al.,2003a,b; Shao et al., 2003; Qian et al., 2004; Laurent et al., 2006).To determine the sources of the dust deposits on the land and in theocean, previous studies mainly followed the methodology ofsource-sink proxy comparison, including elemental ratios (Zhanget al., 1996; Lee et al., 2010b), rare earth elements (Lee et al.,2010a), mineralogy (Li et al., 2007), NdeSr isotopes (Chen et al.,2007; Lee et al., 2010a), UePb age spectrum (Stevens et al., 2010;Pullen et al., 2011; Xiao et al., 2012), Electronic Spin Resonance(ESR) signal intensity of the E1' center and crystallinity index (CI) ofquartz (Sun et al., 2007, 2013), and quartz oxygen isotope (d18O)(Yan et al., 2014). These studies provided reasonable constraints onthe dominant sources of aeolian deposits on the Chinese LoessPlateau, consistentwith themeteorological andmodeling evidence.
Proxy comparison, however, is often insufficient to make un-ambiguous identification of dust sources, since the potential sour-ces may share similar geological and geochemical characteristics toa certain extent. For example, differentiating the dust of the QaidamBasin from that of the northern Chinese deserts remains difficult byapplying NdeSr isotopes (Chen et al., 2007) and quartz d18O (Yanet al., 2014). Similarly, mixing of dust from different sources mayaccount for similar UePb age spectrums of zircon in Chinese loessdeposits (Pullen et al., 2011; Che et al., 2013; Stevens et al., 2010).Alternatively, meteorological methods, including satellite imagesand air mass back trajectory modeling have been used to monitorthe DS activities and dust transport routes, which could precludeirrelevant source candidates (e.g. Fang et al., 2004; Li et al., 2007;Yuan et al., 2008; Feng et al., 2008; Li et al., 2009; Lee et al.,2010a; Lee et al., 2010b; Tsai et al., 2014). To ascertain DS activ-ities affecting certain sink areas, a robust source-to-sink linkageshould be supported by satellite images that prove dust entrain-ments in the sources, air mass trajectories that pass through dustplumes in the sources and arrive at the sink, and similar physi-ochemical characteristics of the dust particles. Previously, only Leeet al. (2010a,b) tried to integrate these three methodologies to tracethe provenance of local dust aerosols. The representativeness ofdaily air mass trajectories in the studies, however, fell short inconstraining possible source candidates for the studied DS events.
In this study, we conduct a multidisciplinary investigation onthe provenance of DS events occurring in Xi'an, southern ChineseLoess Plateau, in the spring of 2012. Our investigation is based onthe three methodologies described above with a better represen-tativeness of air movements by hourly back trajectory modeling.We collected daily dust fall, determined the flux variation timeseries, and identified eight DS events based on meteorologicalcomparison and extreme detection algorithm. We discussed thetransport routes of the spring DS events through air mass backtrajectory modeling. Combining satellite images and accompanyingreal-time hourly air mass back trajectories, we separated the DSevents into four natural and four anthropogenic DS events,analyzed the influences of natural dust sources and anthropogenicactivities on them, and further constrained the dust sources of the
four natural DS events to the Taklimakan desert, Gurbantunggutdesert, and the northern Chinese deserts. Additional proxy com-parisons, including quartz crystallinity index and oxygen isotope,confirmed the material linkage between the natural DS samplesand the northern Chinese deserts, suggesting the northern Chinesedeserts as the primary sources for natural DS events in Xi'an in thespring of 2012.
2. Sampling and methodology
2.1. Sampling daily dust fall in Xi'an
In this work, we adopted the wet collection method (Qian andDong, 2004) to collect daily dust fall in Xi'an, which lies on thesouthern CLP, downwind to the well-known natural dust sources inEast Asia (Fig. 1). The sampling site is situated at the southwesternpart of Xi'an, which is surrounded by commercial and residentialdistricts, and some manufacturing factories. To avoid fugitive dustfrom the ground, four glass dust collectors were placed adjacently1 m above the roof of a four-storied building with bottoms coveredby sufficient water during the sampling intervals. 86 dust sampleswere collected at 14 O'clock everyday fromMarch 8 till June 1, 2012.No obvious dust pollution had been observed from surroundingdistricts during the whole sampling campaign.
Dust samples were sifted using a 100 mesh sieve to remove thefallen leaves and insects, dried at 40 �C, and thenweighed. The dailydust flux was calculated using the following formula:
Flux ¼ weight=ðarea*timeÞ
where weight is in gram, area is in m2, and time is in day.To analyze the relationship of dust deposition and meteoro-
logical factors, daily maximum wind speed and rainfall were ac-quired from the global weather profile dataset provided by theChina Meteorological Data Sharing Service System (http://cdc.cma.gov.cn). The CLIM-X-DETECT algorithm (Mudelsee, 2006), a robusttime-dependent extreme detection method, was applied on thetime series of the dust flux to discern the DS events.
2.2. Dust storm detection using MODIS images
Satellite image is the best choice for large-scale and long-termdust storm detection (Akhlaq et al., 2012). There are four mostcommonly used satellite imaging devices, i.e. MODIS (MODerateresolution Imaging Spectroradiometer), AVHRR (Advanced VeryHigh Resolution Radiometer), GOES (Geostationary OperationalEnvironmental Satellites), and SEVIRI (Spinning Enhanced Visibleand Infrared Imager). Both GOES and SEVIRI provide 15-min tem-poral resolution with no less than 1000-m spatial resolution, whileAVHRR provides 1-day and 1000-m resolutions. MODIS, however,provides a spatial resolution of 250e1000 m with the same 1-daytemporal resolution. MODIS also provides global monitoring in 36spectral bands, whosewavelengths range from 0.415 mm (visible) to14.235 mm (infrared), while the others have no more than 12spectral bands. Since the one-day temporal resolution is enough,we adoptedMODIS because of its better spatial resolution andmoreinformation channels. All MODIS images were acquired from theGoddard Space Flight Center, NASA (http://ladsweb.nascom.nasa.gov), provided by the Earth Observing System Terra and Aquasatellites.
Robust extraction of DS coverage from infrared and/or visiblebands using a variety of algorithms remains challengeable. In ourtest runs, we found that BTD11e12 (bright temperature differencebetween 11 and 12 mm bands, Ackerman, 1997), and TIIDI (thermalinfrared integrated dust index, Liu and Liu, 2011) can not accurately
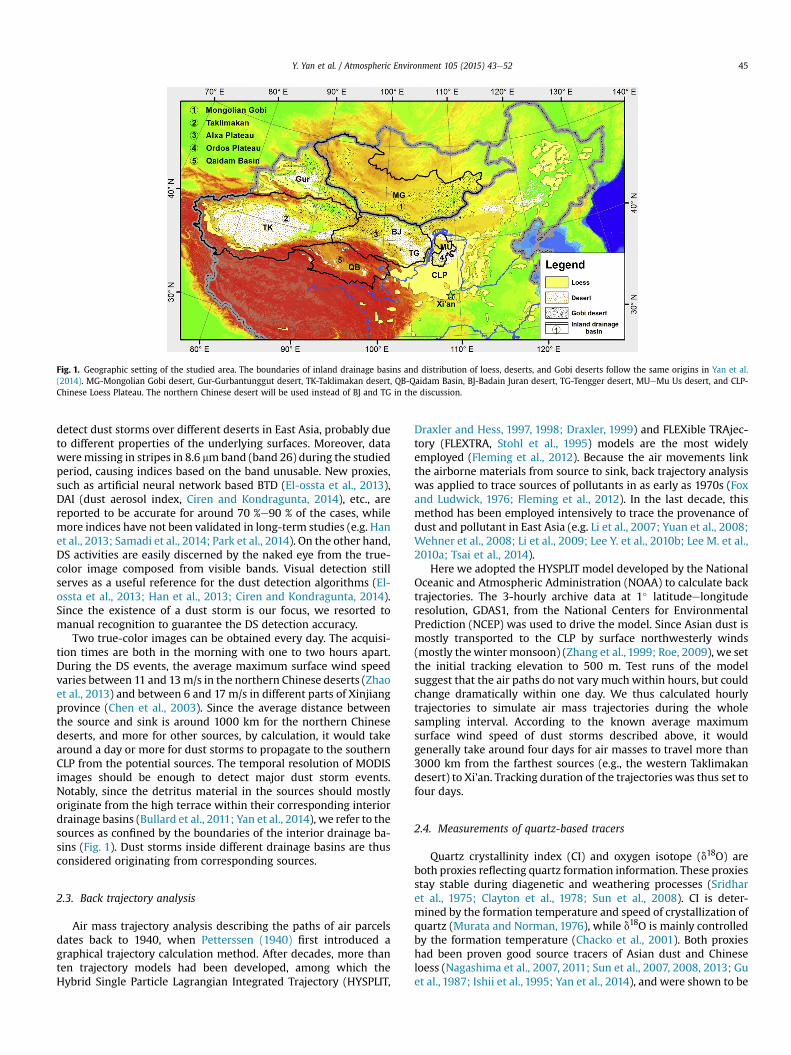
Fig. 1. Geographic setting of the studied area. The boundaries of inland drainage basins and distribution of loess, deserts, and Gobi deserts follow the same origins in Yan et al.(2014). MG-Mongolian Gobi desert, Gur-Gurbantunggut desert, TK-Taklimakan desert, QB-Qaidam Basin, BJ-Badain Juran desert, TG-Tengger desert, MUeMu Us desert, and CLP-Chinese Loess Plateau. The northern Chinese desert will be used instead of BJ and TG in the discussion.
Y. Yan et al. / Atmospheric Environment 105 (2015) 43e52 45
detect dust storms over different deserts in East Asia, probably dueto different properties of the underlying surfaces. Moreover, dataweremissing in stripes in 8.6 mmband (band 26) during the studiedperiod, causing indices based on the band unusable. New proxies,such as artificial neural network based BTD (El-ossta et al., 2013),DAI (dust aerosol index, Ciren and Kondragunta, 2014), etc., arereported to be accurate for around 70 %e90 % of the cases, whilemore indices have not been validated in long-term studies (e.g. Hanet al., 2013; Samadi et al., 2014; Park et al., 2014). On the other hand,DS activities are easily discerned by the naked eye from the true-color image composed from visible bands. Visual detection stillserves as a useful reference for the dust detection algorithms (El-ossta et al., 2013; Han et al., 2013; Ciren and Kondragunta, 2014).Since the existence of a dust storm is our focus, we resorted tomanual recognition to guarantee the DS detection accuracy.
Two true-color images can be obtained every day. The acquisi-tion times are both in the morning with one to two hours apart.During the DS events, the average maximum surface wind speedvaries between 11 and 13m/s in the northern Chinese deserts (Zhaoet al., 2013) and between 6 and 17 m/s in different parts of Xinjiangprovince (Chen et al., 2003). Since the average distance betweenthe source and sink is around 1000 km for the northern Chinesedeserts, and more for other sources, by calculation, it would takearound a day or more for dust storms to propagate to the southernCLP from the potential sources. The temporal resolution of MODISimages should be enough to detect major dust storm events.Notably, since the detritus material in the sources should mostlyoriginate from the high terrace within their corresponding interiordrainage basins (Bullard et al., 2011; Yan et al., 2014), we refer to thesources as confined by the boundaries of the interior drainage ba-sins (Fig. 1). Dust storms inside different drainage basins are thusconsidered originating from corresponding sources.
2.3. Back trajectory analysis
Air mass trajectory analysis describing the paths of air parcelsdates back to 1940, when Petterssen (1940) first introduced agraphical trajectory calculation method. After decades, more thanten trajectory models had been developed, among which theHybrid Single Particle Lagrangian Integrated Trajectory (HYSPLIT,
Draxler and Hess, 1997, 1998; Draxler, 1999) and FLEXible TRAjec-tory (FLEXTRA, Stohl et al., 1995) models are the most widelyemployed (Fleming et al., 2012). Because the air movements linkthe airborne materials from source to sink, back trajectory analysiswas applied to trace sources of pollutants in as early as 1970s (Foxand Ludwick, 1976; Fleming et al., 2012). In the last decade, thismethod has been employed intensively to trace the provenance ofdust and pollutant in East Asia (e.g. Li et al., 2007; Yuan et al., 2008;Wehner et al., 2008; Li et al., 2009; Lee Y. et al., 2010b; Lee M. et al.,2010a; Tsai et al., 2014).
Here we adopted the HYSPLIT model developed by the NationalOceanic and Atmospheric Administration (NOAA) to calculate backtrajectories. The 3-hourly archive data at 1� latitudeelongituderesolution, GDAS1, from the National Centers for EnvironmentalPrediction (NCEP) was used to drive the model. Since Asian dust ismostly transported to the CLP by surface northwesterly winds(mostly the winter monsoon) (Zhang et al., 1999; Roe, 2009), we setthe initial tracking elevation to 500 m. Test runs of the modelsuggest that the air paths do not vary much within hours, but couldchange dramatically within one day. We thus calculated hourlytrajectories to simulate air mass trajectories during the wholesampling interval. According to the known average maximumsurface wind speed of dust storms described above, it wouldgenerally take around four days for air masses to travel more than3000 km from the farthest sources (e.g., the western Taklimakandesert) to Xi'an. Tracking duration of the trajectories was thus set tofour days.
2.4. Measurements of quartz-based tracers
Quartz crystallinity index (CI) and oxygen isotope (d18O) areboth proxies reflecting quartz formation information. These proxiesstay stable during diagenetic and weathering processes (Sridharet al., 1975; Clayton et al., 1978; Sun et al., 2008). CI is deter-mined by the formation temperature and speed of crystallization ofquartz (Murata and Norman, 1976), while d18O is mainly controlledby the formation temperature (Chacko et al., 2001). Both proxieshad been proven good source tracers of Asian dust and Chineseloess (Nagashima et al., 2007, 2011; Sun et al., 2007, 2008, 2013; Guet al., 1987; Ishii et al., 1995; Yan et al., 2014), and were shown to be

Fig. 2. Time series of dust flux, wind speed and rainfall. Solid gray line denotes thetime-dependent threshold calculated by the CLIM-X-DETECT algorithm (Mudelsee,2006). Gray bars highlight the detected dust storm (DS) events.
Y. Yan et al. / Atmospheric Environment 105 (2015) 43e5246
more efficient, if they are used in combination (Yan et al., 2014).These two tracers are used for source-sink proxy comparison in thisstudy. Since fine and coarse dust particles are transported throughdifferent processes (Pye, 1987; Zhang et al., 1999), CI and d18O offine and coarse quartz are measured and discussed separately.
Consistent with previous studies (Sun et al., 2013; Yan et al.,2014), selected DS samples were first separated into two sizefractions (i.e. <16 and 16e63 mm) using wet sieving and the pipettemethod based on Stokes’ law (Lerman et al., 1974). To measurequartz CI, samples were treated subsequently with hydrogenperoxide (H2O2), acetic acid (CH3COOH), and sodium dithionite(Na2S2O3)-sodium citrate (Na3C6H5O7$2H2O) buffered with sodiumbicarbonate (NaHCO3) to remove organic matter, carbonate, andiron and manganese oxides, respectively (Rea and Janecek, 1981;Sun et al., 2007). Sample powder mixed quantitatively with stan-dard Si powder (Wako, Co. Ltd, Japan) was grounded in an agatemill, then placed in a glass holder and irradiated with a Cu Kasource under 40 KV and 40 mA conditions to obtain its X-ray dif-fractogram. CI was calculated as following (Murata and Norman,1976):
CI ¼ 10� F1� a=b
where the scaling factor F1 is estimated to be 1.21 (Sun et al., 2013),a is the height of the (212) peak at 2q of 67.74�, b is its total heightagainst the background. Quartz CI was measured using an X'pertPro MPD X-ray diffractometer (XRD) at the Institute of EarthEnvironment, University of Chinese Academy of Sciences. Therelative standard deviation of CI measurements was estimatedbelow 1.5% by repeated measurements of a standard sample of theLab (Wako quartz, CI ¼ 10).
For d18O measurements, samples were first treated with H2O2and hydrogen chloride (HCl) to remove organic matter, carbonate,and iron and manganese oxides. Sample powder was then fusedwith potassium pyrosulfate (K2S2O7) at 640 �C for 45min to removeclay minerals (Kiely and Jackson, 1965; Sun et al., 2000), soaked influosilicic acid (H2SiF6) for three days to dissolve feldspars andamorphous materials (Sridhar et al., 1975), and finally soaked insaturated boric acid for one night to remove fluorides (Jacksonet al., 1974). Oxygen of the extracted quartz was liberated byreacting with bromine pentafluoride (BrF5) at 550 �C, and thenturned into CO2 by reacting with a graphite rod at 700 �C. Oxygenisotope composition is then determined and calculated using theusual d notation as per mil deviations from Standard Mean OceanWater (SMOW):
d18OSA�SMOW ¼�d18OSA�R þ 103
���d18OST�SMOW
þ 103�=�d18OST�R þ 103
�� 103
where d18OSA e SMOW is the d18O of the sample relative to SMOW,d18OSA e R is the d18O of the sample relative to the referential CO2,d18OST e SMOW is the d18O of the standard sample relative to SMOW,and d18OST e R is the d18O of the standard sample relative to thereferential CO2. Quartz d18O was analyzed using a Finnigan Mat 251Mass Spectrometer at the Institute of Mineral Resources, ChineseAcademy of Geological Sciences. The analytical precision of theinstrument is 0.2‰.
3. Results and discussion
3.1. Daily spring dust flux and its relationship with meteorologicalfactors
The variation of the spring dust flux shows a prominent
baseline-spike pattern (Fig. 2). Among the 86 days, dust fluxremained under 0.5 g m�2$day�1 on 56 days, and above1.0 g m�2$day�1 on 13 days only. The average flux is0.7 g m�2$day�1, with the lowest flux being 0.1 g m�2$day�1 onMay 3 and the highest flux being 8.2 g m�2$day�1 on April 2. Urbandust fall consists of dust input from local sources as well as regionalsources out of local vicinity. It is possible that dust induced byhuman activities from local sources might have a strong influenceon local dust flux fluctuation. Urban human activities such as traffic,manufacturing, and construction normally follow a consistent dailypattern. If certain activities could emit a large quantity of dust thatimpacted our sampling site, they would have resulted in aconsecutive high dust flux baseline rather than sporadic narrowspikes. Abnormal activities such as short-term building demolitionor explosion, which might result in the flux spikes, were notobserved during the sampling campaign. It is thus reasonable toassume that the dust flux fluctuation mostly relies on the meteo-rological factors.
Wind speed and rainfall are two key meteorological factorscontrolling dust deposition. High dust fluxes always happened onrainy and/or windy days (Fig. 2). High wind speed would entrainmore dust into the air, and consequently increase the dust depo-sition, while rainfall works as a super detergent for the atmosphere,effectively rinsing off the dust and raising the dust flux. High windspeed or rainfall alone, however, does not guarantee flux extremes.During the wet deposition days, no significant correlation wasidentified between the rainfall and dust flux (correlation coefficientless than 0.1). Among the rainy days, there were 7 days with dustflux over 1.0 g m�2$day�1, including the highest flux(8.2 g m�2$day�1) on April 2 with limited rainfall (<1 mm). Incontrast, the dust flux on the day with the heaviest rainfall(27.3 mm on May 29) was merely 0.2 g m�2$day�1. The amount ofprecipitation apparently shows a minor influence on the dust flux.The consistency between the rainfall initiations and the spikingdust fluxes, however, explicitly indicates that rainfall would alwaysincrease the dust fall at the beginning, but not necessarily result inhigh dust flux afterwards.
For dry deposition, the correlation coefficient between the fluxand wind speed on non-raining days is less than 0.3, suggesting nosignificant linear correlation. Among these days, dust flux exceeded1.0 g m�2$day�1 on 6 days, with the highest flux (6.3 g m�2$day�1)on March 19 corresponding to strong wind speed (12.3 m/s).However, wind speeds were also very high on March 11 and 18(10.1e11.1 m/s), corresponding to relatively low dust flux

Y. Yan et al. / Atmospheric Environment 105 (2015) 43e52 47
(<1.0 g m�2$day�1). Furthermore, under similar meteorologicalconditions, including rainfall and comparable wind speed, dust fluxreached 2.8 g m�2$day�1 on May 21, while it stayed around0.3 g m�2$day�1 on March 15 and 0.5 g m�2$day�1 on March 28.The drastic flux contrasts in the cases above with comparable highwind speed, rainfall, or both, suggest that local dust input is verylimited even under favorable synoptic conditions. The high dustfluxes thus suggest more dust input from regional sources ratherthan local ones, which can be presumably considered as DS events.
3.2. DS events and their transport routes
There is not a predetermined dust flux threshold to distinguishthe DS events from the daily flux variation. Applying the CLIM-X-DETECT algorithm, 11 flux extremes had been detected during thespring of 2012 in Xi'an. Flux extremes on single days or twoconsecutive days can be viewed as one event. 8 DS events were thusidentified as on March 19 (DS 1), March 23 (DS 2), April 2 and 3 (DS3), April 9 (DS 4), April 12 (DS 5), April 24 and 25 (DS 6), May 11 (DS7), and May 20 and 21 (DS 8), respectively. It is noteworthy that thedust flux is 1.2 g m�2$day�1 for DS 4, and 1.1 g m�2$day�1 for DS 7,
Fig. 3. Different transport routes of the air masses for the DS events. A shows the trajectormainly from the south for DS 1, 4, 7, 8.
lower than that on April 30 (1.4 g m�2$day�1). This might beattributed to the arbitrariness of the statistical detection method,which exists in all statistical extreme event detection methods. Thenet dust deposition flux for a DS event on the CLP was estimatedbetween 1.6 and 4.3 g m�2$day�1 (Shao et al., 2003), suggestingthat our detection is nonetheless sufficient to include all DS events.
We established the connection between the DS events and thedust input from regional sources. Whether these DS events wereattributed to the well known natural dust sources or regionalanthropogenic sources, as suggested by previous studies (Fu et al.,2008; Lee et al., 2007; Wehner et al., 2008; Moreno et al., 2011),needs further proof. Hourly air mass back trajectories were calcu-lated for every DS event. The results show that air masses of four DSevents (DS 2, 3, 5, and 6) mainly follow the northern and north-western routes, tracing back through the northern Chinese desertsto the Mongolia Gobi desert and Taklimakan desert, respectively(Fig. 3A). Cluster analysis demonstrates that only 8% of the trajec-tories of the four DS events come from nearby areas to the south,suggesting that the natural dust sources are their potential dustsuppliers. Air masses of the other four DS events, including DS 1, 4,7, and 8, either never went through those natural sources (e.g. DS 1
ies mainly coming from the north and northwest for DS 2, 3, 5, and 6. B shows those

Y. Yan et al. / Atmospheric Environment 105 (2015) 43e5248
and 4), or partially went through the Taklimakan desert, including 6trajectories of DS 7 and 3 of DS 8 (Fig. 3B). Only 9% of the trajectoriesof these four DS events went through known natural dust sources,while most of them came from nearby places to the south andsoutheast of Xi'an. This suggests that the human habitats ratherthan natural dust sources likely played a key role in supplying dustfor these four DS events.
Among the 264 trajectories of all DS events, less than 10 tra-jectories went through the Qaidam Basin. There are more trajec-tories, still significantly fewer in comparison with other routes,going through other parts of the Tibetan Plateau. The high topo-graphic setting is clearly a powerful constraint preventing airmasses from the Tibetan Plateau interfering with the surface windsystem on the CLP. Evidence further shows no dust stormshappened in the Qaidam Basin and on the Tibetan Plateau duringthese DS events (see section 3.3). Therefore, the Qaidam Basin is aless important source of spring dust storms on the CLP in moderndays, consistent with meteorological observation and modelingresult (Sun et al., 2001; Zhang et al., 2003b).
3.3. Impacts of natural and anthropogenic sources on the DS events
We composed the true-color satellite images, incorporated withair mass trajectories calculated to the acquisition time of the im-ages, which could provide real-time glimpses into the history ofdust entrainment and air mass movements from source to sink. Ifthe air masses of a DS event are found in the dust plumes of certainsource area on the satellite images, we identify the source as a dustsupplier for the DS event. Note that a composed MODIS image ofthree or more original images was needed to cover all potential
Fig. 4. MODIS images with accompanying real-time air mass back trajectories for anthropogred ones indicate the positions of the air masses at the acquisition time of the images. (For inweb version of this article.)
sources. The acquisition time of the composed image was thenassigned the same time of the original image covering more area ofthese potential sources. Air mass trajectories were calculated to theassigned times, which led to around one to two hour time dis-crepancies between the termination points of the trajectories andthe composed MODIS images. Such discrepancies, however, do notaffect our discussion.
From the composed images, we found that there were no tra-jectories of DS 1 and 4 deriving from the natural dust sources,implying that the corresponding DS events are most likely ofanthropogenic origin (Fig. 4A and B, for simplicity, only represen-tative images are shown). During the four days prior to DS 7 and 8,there were no dust plumes transporting from the natural sources tothe CLP, and the corresponding air masses were not in dust plumes(Fig. 4C and D), indicating the anthropogenic origin of these two DSevents. The majority of the trajectories of these anthropogenic DSevents, however, did pass some gray dusty clouds to the south andsoutheast of Xi'an (Fig. 4). Examination of multiple satellite imagesassured the anthropogenic origin for those dusty clouds, suggestingpossible haze events and therefore the linkage between theanthropogenic DS events and haze events.
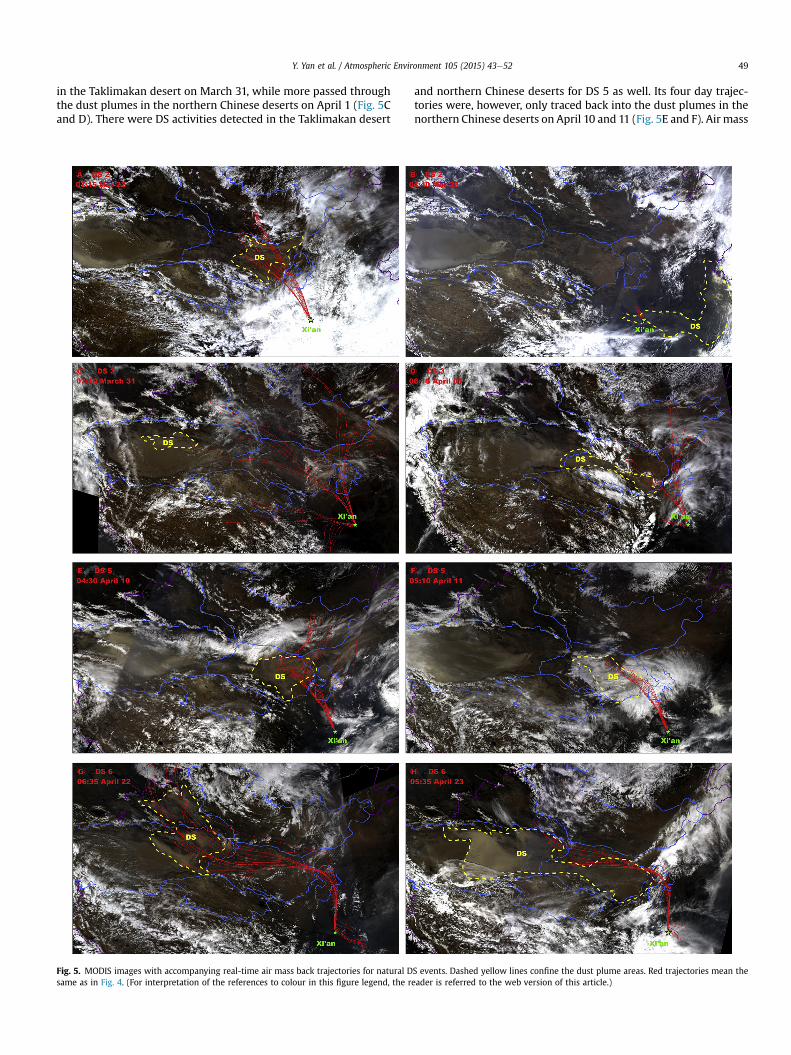
For the other four DS events (DS 2, 3, 5, and 6), satellite imagesrecorded that dust plumes in the sources progressively propagatedto the east and southeast. More importantly, the corresponding airmass trajectories were obviously passing through the dust plumesin various sources. Air mass trajectories of DS 2 exclusively passedthrough the dust plumes in the northern Chinese deserts on March22, which arrived at Xi'an onMarch 23 (Fig. 5A and B), even thoughthere were also DS activities in the Taklimakan desert. For DS 3,only one trajectorywas recorded passing through a thin dust plume
enic DS events. Gray trajectories are four-day trajectories. The termination points of theterpretation of the references to colour in this figure legend, the reader is referred to the
Y. Yan et al. / Atmospheric Environment 105 (2015) 43e52 49
in the Taklimakan desert on March 31, while more passed throughthe dust plumes in the northern Chinese deserts on April 1 (Fig. 5Cand D). There were DS activities detected in the Taklimakan desert
Fig. 5. MODIS images with accompanying real-time air mass back trajectories for natural Dsame as in Fig. 4. (For interpretation of the references to colour in this figure legend, the r
and northern Chinese deserts for DS 5 as well. Its four day trajec-tories were, however, only traced back into the dust plumes in thenorthern Chinese deserts on April 10 and 11 (Fig. 5E and F). Air mass
S events. Dashed yellow lines confine the dust plume areas. Red trajectories mean theeader is referred to the web version of this article.)

Y. Yan et al. / Atmospheric Environment 105 (2015) 43e5250
trajectories of DS 6 on April 24, on the other hand, passed throughdust plumes in the Taklimakan desert and Gurbantunggut desert onApril 22, and the northern Chinese deserts on April 23 (Fig. 5G andH). We thus assured that these DS events were originated from thenatural dust sources.
It is worth noting that the four natural DS events yielded19.90 g/m2 of dust fall in the spring of 2012, contributing 31% of thetotal spring dust deposition. By contrast, the four anthropogenic DSevents amounted to 12.4 g/m2, with a 20% contribution to the totalspring dust deposition. The dust flux of the severest anthropogenicDS on March 19 (6.3 g m�2$day�1) is comparable to that of theseverest natural DS on April 2 (8.2 g m�2$day�1). This suggests thathuman habitats have played an important role in providing long-range transported mineral dust to the atmosphere. In addition,lots of trajectories went through the Mongolian Gobi desert. Therewere dust entrainments in the Mongolian Gobi desert, while notrajectories in the dust plumes were detected. This suggests thattheMongolian Gobi desert is an unlikely source for dust fall in Xi'anin the spring of 2012.
3.4. Constraint on the primary sources of spring DS events
During different natural DS events, air masses passed throughdust plumes in one or more sources, including the Taklimakandesert, Gurbantunggut desert, and northern Chinese deserts. Theprimary sources of these natural DS events can be further con-strained by applying provenance tracer comparison. Quartz CI and
Fig. 6. Bivariate plots of quartz d18O versus quartz CI of the fine fraction (a), and quartzd18O of both fine and coarse fractions (b).
d18O of three DS samples (DS 3, 5, and 6) were compared with thosefrom the desert surface samples. DS 2 was excluded because of thesample insufficiency. For fine dust, quartz CI is 9.2, 9.5, and 8.9 forDS 3, 5, and 6, respectively, and the corresponding quartz d18O is16.7, 16.1, and 16.6‰. We plotted quartz d18O against CI of three DSsamples and the source inventory (Fig. 6a). The lowest quartz CI forDS 6 is still higher than the maximum quartz CI (8.8) for both theTaklimakan desert andMongolian Gobi desert. All three DS samplesthus fall roughly into the range of the northern Chinese deserts. Forcoarse dust, quartz d18O is 15.3‰ for DS 3, 15.4‰ for DS 5, and15.6‰ for DS 6. Paired quartz d18O values of fine and coarse dust inthree DS samples share the same characteristics with those of thenorthern Chinese deserts (Fig. 6b). Since they fall between theTaklimakan desert andMongolian Gobi desert, this could alsomeanthat the studied dust is the mixture of dust from both the Takli-makan desert and Mongolian Gobi desert. The Mongolian Gobidesert is, however, not a potential source for these DS events. Themixing interpretation thus does not apply here.
For the DS 3, dust plumes were identified in the Taklimakandesert and northern Chinese deserts. Based on the quartz CI andd18O characteristics, the primary source of the coarse and fine dustcan be confined to the northern Chinese deserts. Satellite imagesand back trajectory analysis indicated that DS 5 was only originatedfrom the northern Chinese deserts, which is further confirmed bythe tracer comparison. However, the situation is more complicatedwith DS 6. Beside the Taklimakan desert and northern Chinesedeserts, the Gurbantunggut desert is also the possible primarysource. Being deemed as a subordinate dust source, the Gurban-tunggut desert was not considered in previous quartz d18O study,while the CI of fine quartz of the Gurbantunggut desert falls into thesame value range of the northern Chinese deserts (Sun et al., 2007).The Gurbantunggut desert is therefore indistinguishable by quartzCI-d18O comparison. There is nonetheless no reason to think its rolein DS 6 should be any different from that of the Taklimakan desertin DS 6 and DS 3. In addition, after the trajectories passed theGurbantunggut desert, most of them passed the dust plumes in theTaklimakan desert and/or northern Chinese deserts again (Fig. 5Gand H). It is reasonable to assume that they acquired more dustlater. The slightly lower quartz CI of DS 6might be resulted from thedust contribution from the Taklimakan desert and/or Gurban-tunggut desert (Fig. 6a). Its prime source, however, should still bethe northern Chinese deserts. We therefore conclude that thenorthern Chinese deserts are the prime sources for both fine andcoarse DS dust on the southern CLP in the spring of 2012. Thisconclusion is consistent with previous provenance understandingof dust depositions on the CLP (Sun et al., 2001, 2008; Li et al.,2009), also in favor of the short-distance deposition theory ofChinese loess (Chen and Li, 2011).
4. Conclusions
We collected daily dust fall in Xi'an in the spring of 2012, andidentified eight DS events using the CLIM-X-DETECT algorithm. Bycombining MODIS images and real-time air mass back trajectories,these DS events were divided into two types, originating fromvarious natural or anthropogenic sources. Similar dust flux in-tensities between the natural and anthropogenic DS events suggestthat more attention should be paid to the influence of anthropo-genic activities on urban mineral aerosols and to environmentalimpacts of anthropogenic dust. By tracing air masses back into thedust plumes in diverse sources, the primary sources of the naturalDS events were confined to three possible sources, including thenorthern Chinese deserts, Taklimakan desert, and Gurbantuggutdesert. Source-sink comparisons of quartz CI and d18O furtherconfirmed the northern Chinese deserts as their prime sources.
Y. Yan et al. / Atmospheric Environment 105 (2015) 43e52 51
Since the sampling campaign was limited to a single spring season,the conclusions based on the eight DS events need to be validatedby long-term investigation of the urban mineral dust variations onseasonal to annual timescales in future. Nevertheless, our studyindicates that a multidisciplinary approach by integrating satelliteimage monitoring, air mass trajectory modeling, and proxy com-parison can successfully constrain the primary sources of moderndust storms. This integrated approach should be also properlyemployed to trace the provenance of Cenozoic aeolian depositionson the land and in the ocean, since the source range, source-to-sinkdistance, past atmospheric circulations, and topography likelychanged significantly in the geological past.
Acknowledgments
We thank Dr. Singh and two anonymous reviewers for theirconstructive comments. We are also grateful for the help of DefangWan with oxygen isotope measurements, and Susan Clemens withlanguage polishing. This work was supported by the Natural Sci-ence Foundation of China (No. 41072272) and Key InnovationProject (KZCX-EW-114) from the Chinese Academy of Sciences.
References
Ackerman, S.A., 1997. Remote sensing aerosols using satellite infrared observations.J. Geophys. Res. 102, 17069e17080.
Akhlaq, M., Sheltami, T.R., Mouftah, H.T., 2012. A review of techniques and tech-nologies for sand and dust storm detection. Rev. Environ. Sci. Bio/Technology 11(3), 305e322.
An, Z., 2000. The history and variability of the East Asian paleomonsoon climate.Quat. Sci. Rev. 19 (1), 171e187.
Baddock, M.C., Strong, C.L., Murray, P.S., McTainsh, G.H., 2013. Aeolian dust as atransport hazard. Atmos. Environ. 71, 7e14.
Bullard, J.E., Harrison, S.P., Baddock, M.C., Drake, N., Gill, T.E., McTainsh, G., Sun, Y.,2011. Preferential dust sources: a geomorphological classification designed foruse in global dust - cycle models. J. Geophys. Res. 116 (F4).
Che, X.D., Li, G.J., 2013. Binary sources of loess on the Chinese Loess Plateau revealedby U-Pb ages of zircon. Quat. Res. 80, 545e551.
Chen, H.W., Wang, X., Ma, Y., 2003. Effects of strong winds on sandstorms in Xin-jiang. Acta Sci. Nat. Univ. Pekin. 39 (2), 187e193 (in Chinese).
Chen, J., Li, G.J., Yang, J.D., Rao, W.B., Lu, H.Y., Balsam, W., Sun, Y.B., Ji, J.F., 2007. Ndand Sr isotopic characteristics of Chinese deserts: implications for the prove-nances of Asian dust. Geochim. Cosmochim. Acta 71, 3904e3914.
Chen, J., Li, G.J., 2011. Geochemical studies on the source region of Asian dust. Sci.China Earth Sci. 54, 1279e1301. http://dx.doi.org/10.1007/s11430-011-4269-z.
Chen, Y.S., Sheen, P.C., Chen, E.R., Liu, Y.K., Wu, T.N., Yang, C.Y., 2004. Effects of Asiandust storm events on daily mortality in Taipei, Taiwan. Environ. Res. 95 (2),151e155.
Chacko, T., Cole, D.R., Horita, J., 2001. Equilibrium oxygen, hydrogen and carbonisotope fractionation factors applicable to geologic systems. Rev. Mineral.Geochem. 43, 1e81.
Ciren, P., Kondragunta, S., 2014. Dust aerosol index (DAI) algorithm for MODIS.J. Geophys. Res-Atmos. 119 (8), 4770e4792.
Clayton, R.N., Jackson, M.L., Sridhar, K., 1978. Resistance of quartz silt to isotopicexchange under burial and intense weathering conditions. Geochim. Cosmo-chim. Acta 42, 1517e1522.
Draxler, R.R., 1999. HYSPLIT4 User's Guide. NOAA Tech. Memo. ERL ARL-230. NOAAAir Resources Laboratory, Silver Spring, MD.
Draxler, R.R., Hess, G.D., 1997. Description of the HYSPLIT_4 Modeling System. NOAATech. Memo. ERL ARL-224. NOAA Air Resources Laboratory, Silver Spring, MD,p. 24.
Draxler, R.R., Hess, G.D., 1998. An overview of the HYSPLIT_4 modeling system oftrajectories, dispersion, and deposition. Aust. Meteor. Mag. 47, 295e308.
El-ossta, E., Qahwaji, R., Ipson, S.S., 2013. Detection of dust storms using MODISreflective and emissive bands. IEEE J. Sel. Top. Appl. Earth Observations RemoteSens. 6 (6), 2480e2485.
Fang, X.M., Han, Y.X., Ma, J.H., Song, L.C., Yang, S.L., Zhang, X.Y., 2004. Dust stormsand loess accumulation on the Tibetan Plateau: a case study of dust event on 4March 2003 in Lhasa. Chin. Sci. Bull. 49 (9), 953e960.
Feng, J.L., Zhu, L.P., Ju, J.T., Zhou, L.P., Zhen, X.L., Zhang, W., Gao, S.P., 2008. Heavydust fall in Beijing, on April 16e17, 2006: geochemical properties and in-dications of the dust provenance. Geochem. J. 42 (2), 221e236.
Fleming, Z.L., Monks, P.S., Manning, A.J., 2012. Review: untangling the influence ofair-mass history in interpreting observed atmospheric composition. Atmos. Res.104, 1e39.
Fox, T.D., Ludwick, J.D., 1976. Lead (Pb) concentrations associated with 1000-MBgeostrophic back trajectories at Quillayute, Washington. Atmos. Environ. 10,
799e803.Fu, Q., Zhuang, G., Wang, J., Xu, C., Huang, K., Li, J., Hou, B., Lu, T., Streets, D.G., 2008.
Mechanism of formation of the heaviest pollution episode ever recorded in theYangtze River Delta, China. Atmos. Environ. 42, 2023e2026.
Gu, Z.Y., Liu, T.S., Zheng, S.H., 1987. A preliminary study on quartz oxygen isotope inChinese loess and soils. In: Liu, T.S. (Ed.), Aspects of Loess Research. China OceanPress, pp. 291e301.
Han, L., Tsunekawa, A., Tsubo, M., Zhou, W., 2013. An enhanced dust index for Asiandust detection with MODIS images. Int. J. Remote Sens. 34 (19), 6484e6495.
Ishii, T., Isobe, I., Mizuno, K., Kanai, Y., Matsuhisa, Y., Mizota, C., Qian, Y.B.,Terashima, S., Okumura, K., 1995. Study of the formation processes and sedi-mentary environment of surface geological features in desertic areas of China,with special reference to the characteristics and origin of eolian sediments. Bull.Geol. Surv. Jpn. 46, 651e685.
Jackson, M.L., Sayin, M., Clayton, R.N., 1974. Quartz Isolation for Oxygen IsotopicAbundance by the Pyrosulfate-hexafluorosilic Acid Method Applied to SeveralLoesses. Agronomy Abstracts. Am. Soc. Agromony, Madison, WI 53711,pp. 184e185.
Jickells, T.D., An, Z.S., Andersen, K.K., Baker, A.R., Bergametti, G., Brooks, N., Cao, J.J.,Boyd, P.W., Duce, R.A., Hunter, K.A., Kawahata, H., Kubilay, N., LaRoche, J.,Liss, P.S., Mahowald, N., Prospero, J.M., Ridgwell, A.J., Tegen, I., Torres, R., 2005.Global iron connections between desert dust, ocean biogeochemistry, andclimate. Science 308, 67e71.
Kan, H., London, S.J., Chen, G., Zhang, Y., Song, G., Zhao, N., Jiang, L., Chen, B., 2007.Differentiating the effects of fine and coarse particles on daily mortality inShanghai, China. Environ. Int. 33 (3), 376e384.
Kiely, P.V., Jackson, M.L., 1965. Quartz, feldspar and mica determination for soils bysodium pyrosulfate fusion. Soil Sci. Soc. Am. Proc. 29, 159e163.
Laurent, B., Marticorena, B., Bergametti, G., Mei, F., 2006. Modeling mineral dustemissions from Chinese and Mongolian deserts. Glob. Planet. Change 52,121e141.
Lee, C.S.L., Li, X.D., Zhang, G., Li, J., Ding, A.J., Wang, T., 2007. Heavy metals and Pbisotopic composition of aerosols in urban and suburban areas of Hong Kong andGuangzhou, South China-evidence of the long-range transport of air contami-nants. Atmos. Environ. 41 (2), 432e447.
Lee, M.K., Lee, Y.I., Yi, H.I., 2010a. Provenances of atmospheric dust over Korea fromSr-Nd isotopes and rare earth elements in early 2006. Atmos. Environ. 44,2401e2414. http://dx.doi.org/10.1016/j.atmosenv.2010.04.010.
Lee, Y.C., Yang, X., Wenig, M., 2010b. Transport of dusts from East Asian and non-East Asian sources to Hong Kong during dust storm related events1996e2007. Atmos. Environ. 44, 3728e3738. http://dx.doi.org/10.1016/j.atmosenv.2010.03.034.
Lerman, A., Lal, D., Dacey, M.F., 1974. Stokes' settling and chemical reactivity ofsuspended particles in natural waters. In: Gibbs, R.J. (Ed.), Suspended Solids inWater. Plenum Press, New York, pp. 17e47.
Li, G.J., Chen, J., Chen, Y., Yang, J.D., Ji, J.F., Liu, L., 2007. Dolomite as a tracer for thesource regions of Asian dust. J. Geophys. Res. 112, D17201. http://dx.doi.org/10.1029/2007jd008676.
Li, G.J., Chen, J., Ji, J.F., Yang, J.D., Conway, T.M., 2009. Natural and anthropogenicsources of East Asian dust. Geology 37, 727e730. http://dx.doi.org/10.1130/G30031A.1.
Liu, T.S., 1985. Loess and the Environment. China Ocean Press, p. 189 (in Chinese).Liu, Y., Liu, R., 2011. A thermal index from modis data for dust detection. In: Geo-
science and Remote Sensing Symposium (IGARSS), 2011. IEEE International,pp. 3783e3786.
Miller, R.L., Tegen, I., 1998. Climate response to soil dust aerosols. J. Clim. 11 (12),3247e3267.
Moreno, T., Querol, X., Alastuey, A., Reche, C., Cusack, M., Amato, F., Pandolf, M.,Pey, J., Richard, A., Prevot, A.S.H., Furger, M., Gibbons, W., 2011. Variations intime and space of trace metal aerosol concentrations in urban areas and theirsurroundings. Atmos. Chem. Phys. 11, 9415e9430.
Mudelsee, M., 2006. CLIM-X-DETECT: a Fortran 90 program for robust detection ofextremes against a time-dependent background in climate records. Comput.Geosci. 32, 141e144. http://dx.doi.org/10.1016/j.cageo.2005.05.010.
Murata, K.J., Norman, M.B., 1976. An index of crystallinity for quartz. Am. J. Sci. 276(9), 1120e1130.
Nagashima, K., Tada, R., Tani, A., Toyoda, S., Sun, Y.B., Isozaki, Y., 2007. Contributionof Aeolian dust in Japan sea sediments estimated from ESR signal intensity andcrystallinity of quartz. Geochem. Geophys. Geosyst. 8 http://dx.doi.org/10.1029/2006GC001364.
Nagashima, K., Tada, R., Tani, A., Sun, Y., Isozaki, Y., Toyoda, S., Hasegawa, H., 2011.Millennial-scale oscillations of the westerly jet path during the last glacialperiod. J. Asian Earth Sci. 453, 1214e1220.
Park, S.S., Kim, J., Lee, J., Lee, S., Kim, J.S., Chang, L.S., Ou, S., 2014. Combined dustdetection algorithm by using MODIS infrared channels over East Asia. RemoteSens. Environ. 141, 24e39.
Petterssen, S., 1940. Weather Analysis and Forecasting, pp. 221e223.Prins, M.A., Vriend, M., Nugteren, G., Vandenberghe, J., Lu, H., Zheng, H., Jan
Weltje, G., 2007. Late Quaternary aeolian dust input variability on the ChineseLoess Plateau: inferences from unmixing of loess grain-size records. Quat. Sci.Rev. 26 (1), 230e242.
Prospero, J.M., Ginoux, P., Torres, O., Nicholson, S.E., Gill, T.E., 2002. Environmentalcharacterization of global sources of atmospheric soil dust identified with theNimbus 7 Total Ozone Mapping Spectrometer (TOMS) absorbing aerosolproduct. Rev. Geophys. 40, 1002. http://dx.doi.org/10.1029/2000RG000095.
Y. Yan et al. / Atmospheric Environment 105 (2015) 43e5252
Pullen, A., Kapp, P., McCallister, A.T., Chang, H., Gehrels, G.E., Garzione, C.N.,Heermance, R.V., Ding, L., 2011. Qaidam Basin and northern Tibetan Plateau asdust sources for the Chinese Loess Plateau and paleoclimatic implications.Geology 39, 1031e1034.
Pye, K., 1987. Aeolian Dust and Dust Deposits. Academic Press, London, p. 68.Qian, G.Q., Dong, J.B., 2004. Discussions on different dust trapping methods and on
some related Topics. J. Desert Res. 24, 779e782 (in Chinese).Qian, W.H., Tang, X., Quan, L.S., 2004. Regional characteristics of dust storms in
China. Atmos. Environ. 38, 4895e4907.Rea, D.K., Janecek, T.R., 1981. Mass accumulation rates of the non-authigenic inor-
ganic crystalline (eolian) components from the western Mid-Pacific mountains,deep sea drilling project site 463. In: Thiede, et al. (Eds.), Proceedings of theInitial Report of Deep Sea Drill Project, 62, pp. 653e659.
Roe, G., 2009. On the interpretation of Chinese loess as a paleoclimate indicator.Quat. Res. 71 (2), 150e161.
Samadi, M., Boloorani, A.D., Alavipanah, S.K., Mohamadi, H., Najafi, M.S., 2014.Global dust Detection Index (GDDI); a new remotely sensed methodology fordust storms detection. J. Environ. Health Sci. Eng. 12 (1), 20.
Shao, Y., Yang, Y., Wang, J., Song, Z., Leslie, L.M., Dong, C., Zhang, Z., Lin, Z., Kanai, Y.,Yabuki, S., Chun, Y., 2003. Northeast Asian dust storms: real-time numericalprediction and validation. J. Geophys. Res-Atmos. (1984e2012) 108 (D22).http://dx.doi.org/10.1029/2003JD003667.
Sridhar, K., Jackson, M.L., Clayton, R.N., 1975. Quartz oxygen isotopic stability inrelation to isolation from sediments and diversity of source. Soil Sci. Soc. Am.Proc. 39, 1209e1213.
Stevens, T., Palk, C., Carter, A., Lu, H., Clift, P., 2010. Assessing the provenance of loessand desert sediments in northern China using U-Pb dating and morphology ofdetrital zircons. GSA Bull. 122, 1331e1344.
Stohl, A., Wotawa, G., Seibert, P., Krompkolb, H., 1995. Interpolation errors in windfields as a function of spatial and temporal resoloution and their impact ondifferent types of kinematic trajectories. J. Appl. Meteorol. 34, 2149e2165.
Sun, J.M., Zhang, M.Y., Liu, T.S., 2001. Spatial and temporal characteristics of duststorms in China and its surrounding regions, 1960e1999: Relations to sourcearea and climate. J. Geophys. Res. 106, 18,325e18,333.
Sun, Y., Chen, H., Tada, R., Weiss, D., Lin, M., Toyoda, S., Yan, Y., Isozaki, Y., 2013. ESRsignal intensity and crystallinity of quartz from Gobi and sandy deserts in EastAsia and implication for tracing Asian dust provenance. Geochem. Geophys.Geosyst. 14 (8), 2615e2627. http://dx.doi.org/10.1002/ggge.20162.
Sun, Y., Tada, R., Chen, J., Liu, Q., Toyoda, S., Tani, A., Ji, J., Isozaki, Y., 2008. Tracing theprovenance of fine-grained dust deposited on the central Chinese Loess Plateau.Geophys. Res. Lett. 35. http://dx.doi.org/10.1029/2007GL031672L01804.
Sun, Y.B., Lu, H.Y., An, Z.S., 2000. Grain size distribution of quartz isolated fromChinese loess/paleosol. Chin. Sci. Bull. 45, 2296e2298.
Sun, Y.B., Tada, R., Chen, J., Chen, H.Z., Toyoda, S., Tani, A., Isozaki, Y., Nagashima, K.,Hasegawa, H., Ji, J.F., 2007. Distinguishing the sources of Asian dust based onelectron spin resonance signal intensity and crystallinity of quartz. Atmos.
Environ. 41, 8537e8548.Tsai, F.J., Tu, J., Hsu, S., Chen, W., 2014. Case study of the Asian dust and pollutant
event in spring 2006: source, transport, and contribution to Taiwan. Sci. TotalEnviron. 478, 163e174. http://dx.doi.org/10.1016/j.scitotenv.2014.01.072.
Uno, I., Eguchi, K., Yumimoto, K., Takemura, T., Shimizu, A., Uematsu, M., Liu, Z.,Wang, Z., Hara, Y., Sugimoto, N., 2009. Asian dust transported one full circuitaround the globe. Nat. Geosci. 2, 557e560. http://dx.doi.org/10.1038/ngeo583.
Wehner, B., Birmili, W., Ditas, F., Wu, Z., Hu, M., Liu, X., Mao, J., Sugimoto, N.,Wiedensohler, A., 2008. Relationships between submicrometer particulate airpollution and air mass history in Beijing, China, 2004e2006. Atmos. Chem.Phys. 8, 6155e6168. http://dx.doi.org/10.5194/acp-8-6155-2008.
Xiao, G.Q., Zong, K.Q., Li, G.J., Hu, Z.H., Dupont-Nivet, G., Peng, S.Z., Zhang, K.X., 2012.Spatial and glacial-interglacial variations in provenance of the Chinese loessplateau. Geophys. Res. Lett. 39, L20715. http://dx.doi.org/10.1029/2012GL053304.
Yan, Y., Sun, Y., Chen, H., Ma, L., 2014. Oxygen isotope signatures of quartz frommajor Asian dust sources: implications for changes in the provenance of Chi-nese loess. Geochim. Cosmochim. Acta 139, 399e410.
Yuan, H., Zhuang, G.S., Li, J., Wang, Z.F., 2008. Mixing of mineral with pollutionaerosols in dust season in Beijing: revealed by source apportionment study.Atmos. Environ. 42, 2141e2157. http://dx.doi.org/10.1016/j.atmosenv.2007.11.048.
Zhang, R., Wang, M., Zhang, X., Zhu, G., 2003a. Analysis on the chemical andphysical properties of particles in a dust storm in spring in Beijing. PowderTechnol. 137 (1), 77e82.
Zhang, X.Y., Arimoto, R., An, Z.S., 1997. Dust emission from Chinese desert sourceslinked to variations in atmospheric circulation. J. Geophys. Res. 102 (D23),28041e28047.
Zhang, X.Y., Arimoto, R., An, Z.S., 1999. Glacial and interglacial patterns for Asiandust transport. Quat. Sci. Rev. 18, 811e819.
Zhang, X.Y., Gong, S.L., Zhao, T.L., Arimoto, R., Wang, Y.Q., Zhou, Z.J., 2003b. Sourcesof Asian dust and role of climate change versus desertification in Asian dustemission. Geophys. Res. Lett. 30, 2272. http://dx.doi.org/10.1029/2003GL018206.
Zhang, X.Y., Zhang, G.Y., Zhu, G.H., Zhang, D.E., An, Z.S., Chen, T., Huang, X.P., 1996.Elemental tracers for Chinese source dust. Sci. China, Ser. D. 39 (5), 512e521.
Zhang, Y., Sunwoo, Y., Kotamarthi, V., Carmichael, G.R., 1994. Photochemical oxidantprocesses in the presence of dust: an evaluation of the impact of dust on par-ticulate nitrate and ozone formation. J. Appl. Meteorol. 33 (7), 813e824.
Zhao, M.R., Yan, D.T., Li, Y.Y., Zhang, C.S., Hu, L.L., 2013. Change characteristics ofsandstorm Frequency and its causes in 2001-2010 over Minqin, Gansu, China.J. Desert Res. 33 (4), 1144e1149 (in Chinese).
Zhuang, G., Yi, Z., Duce, R.A., Brown, P.R., 1992. Link between iron and sulphur cyclessuggested by detection of Fe(II) in remote marine aerosols. Nature 355,537e539.