A multi-component model of the dynamics of salt-induced hypertension in Dahl-S rats
11
BMC Physiology Research article A multi-component model of the dynamics of salt-induced hypertension in Dahl-S rats Violeta I McLoone 1 , John V Ringwood 1 and Bruce N Van Vliet* 2 Addresses: 1 Department of Electronic Engineering, National University of Ireland Maynooth, Maynooth, Co. Kildare, Ireland and 2 Division of BioMedical Sciences, Faculty of Medicine, Memorial University of Newfoundland, St. John’s, Newfoundland A1B 3V6, Canada E-mail: Violeta I McLoone - [email protected]; John V Ringwood - [email protected]; Bruce N Van Vliet* - [email protected] *Corresponding author Published: 29 October 2009 Received: 18 June 2009 BMC Physiology 2009, 9:20 doi: 10.1186/1472-6793-9-20 Accepted: 29 October 2009 This article is available from: http://www.biomedcentral.com/1472-6793/9/20 © 2009 McLoone et al; licensee BioMed Central Ltd. This is an Open Access article distributed under the terms of the Creative Commons Attribution License ( http://creativecommons.org/licenses/by/2.0), which permits unrestricted use, distribution, and reproduction in any medium, provided the original work is properly cited. Abstract Background: In humans, salt intake has been suggested to influence blood pressure (BP) on a wide range of time scales ranging from several hours or days to many months or years. Detailed time course data collected in the Dahl salt-sensitive rat strain suggest that the development of salt- induced hypertension may consist of several distinct phases or components that differ in their timing and reversibility. To better understand these components, the present study sought to model the dynamics of salt-induced hypertension in the Dahl salt sensitive (Dahl-S) rat using 3 sets of time course data. Results: The first component of the model (“Acute-Reversible”) consisted of a linear transfer function to account for the rapid and reversible effects of salt on BP (ie. acute salt sensitivity, corresponding with a depressed slope of the chronic pressure natriuresis relationship). For the second component (“Progressive-Irreversible”), an integrator function was used to represent the relatively slow, progressive, and irreversible effect of high salt intake on BP (corresponding with a progressive salt-induced shift of the chronic pressure natriuresis relationship to higher BP levels). A third component (“Progressive-Reversible”) consisted of an effect of high salt intake to progressively increase the acute salt-sensitivity of BP (ie. reduce the slope of the chronic pressure natriuresis relationship), amounting to a slow and progressive, yet reversible, component of salt- induced hypertension. While the 3 component model was limited in its ability to follow the BP response to rapid and/or brief transitions in salt intake, it was able to accurately follow the slower steady state components of salt-induced BP changes. This model exhibited low values of mean absolute error (1.92 ± 0.23, 2.13 ± 0.37, 2.03 ± 0.3 mmHg for data sets 1 - 3), and its overall performance was significantly improved over that of an initial model having only 2 components. The 3 component model performed well when applied to data from hybrids of Dahl salt sensitive and Dahl salt resistant rats in which salt sensitivity varied greatly in its extent and character (mean absolute error = 1.11 ± 0.08 mmHg). Conclusion: Our results suggest that the slow process of development of salt-induced hypertension in Dahl-S rats over a period of many weeks can be well represented by a combination of three components that differ in their timing, reversibility, and their associated effect on the chronic pressure natriuresis relationship. These components are important to distinguish since each may represent a unique set of underlying mechanisms of salt-induced hypertension. Page 1 of 11 (page number not for citation purposes) BioMed Central Open Access
Transcript of A multi-component model of the dynamics of salt-induced hypertension in Dahl-S rats

BMC Physiology
Research articleA multi-component model of the dynamics of salt-inducedhypertension in Dahl-S ratsVioleta I McLoone1, John V Ringwood1 and Bruce N Van Vliet*2
Addresses: 1Department of Electronic Engineering, National University of Ireland Maynooth, Maynooth, Co. Kildare, Ireland and 2Division ofBioMedical Sciences, Faculty of Medicine, Memorial University of Newfoundland, St. John’s, Newfoundland A1B 3V6, Canada
E-mail: Violeta I McLoone - [email protected]; John V Ringwood - [email protected]; Bruce N Van Vliet* - [email protected]*Corresponding author
Published: 29 October 2009 Received: 18 June 2009
BMC Physiology 2009, 9:20 doi: 10.1186/1472-6793-9-20 Accepted: 29 October 2009
This article is available from: http://www.biomedcentral.com/1472-6793/9/20
© 2009 McLoone et al; licensee BioMed Central Ltd.This is an Open Access article distributed under the terms of the Creative Commons Attribution License (http://creativecommons.org/licenses/by/2.0),which permits unrestricted use, distribution, and reproduction in any medium, provided the original work is properly cited.
Abstract
Background: In humans, salt intake has been suggested to influence blood pressure (BP) on awide range of time scales ranging from several hours or days to many months or years. Detailedtime course data collected in the Dahl salt-sensitive rat strain suggest that the development of salt-induced hypertension may consist of several distinct phases or components that differ in theirtiming and reversibility. To better understand these components, the present study sought tomodel the dynamics of salt-induced hypertension in the Dahl salt sensitive (Dahl-S) rat using 3 setsof time course data.
Results: The first component of the model (“Acute-Reversible”) consisted of a linear transferfunction to account for the rapid and reversible effects of salt on BP (ie. acute salt sensitivity,corresponding with a depressed slope of the chronic pressure natriuresis relationship). For thesecond component (“Progressive-Irreversible”), an integrator function was used to represent therelatively slow, progressive, and irreversible effect of high salt intake on BP (corresponding with aprogressive salt-induced shift of the chronic pressure natriuresis relationship to higher BP levels).A third component (“Progressive-Reversible”) consisted of an effect of high salt intake toprogressively increase the acute salt-sensitivity of BP (ie. reduce the slope of the chronic pressurenatriuresis relationship), amounting to a slow and progressive, yet reversible, component of salt-induced hypertension. While the 3 component model was limited in its ability to follow the BPresponse to rapid and/or brief transitions in salt intake, it was able to accurately follow the slowersteady state components of salt-induced BP changes. This model exhibited low values of meanabsolute error (1.92 ± 0.23, 2.13 ± 0.37, 2.03 ± 0.3 mmHg for data sets 1 - 3), and its overallperformance was significantly improved over that of an initial model having only 2 components. The3 component model performed well when applied to data from hybrids of Dahl salt sensitive andDahl salt resistant rats in which salt sensitivity varied greatly in its extent and character (meanabsolute error = 1.11 ± 0.08 mmHg).
Conclusion: Our results suggest that the slow process of development of salt-inducedhypertension in Dahl-S rats over a period of many weeks can be well represented by acombination of three components that differ in their timing, reversibility, and their associated effecton the chronic pressure natriuresis relationship. These components are important to distinguishsince each may represent a unique set of underlying mechanisms of salt-induced hypertension.
Page 1 of 11(page number not for citation purposes)
BioMed Central
Open Access

BackgroundA high level of dietary salt or sodium intake is thought tocontribute importantly to the etiology [1] and prevalence[2] of hypertension. The physiological basis of the linkbetween salt and blood pressure (BP) has been wellinvestigated, resulting in the identification of a numberof factors and mechanisms that contribute to the salt-sensitivity of BP [3-5]. The focus of the present studyconcerns the detailed time course of the effects of saltloading on BP, and what this may tell us about thecomponent structure or processes underlying the devel-opment of salt-induced hypertension.
At one extreme, salt loading and restriction have beenwidely described to affect BP within several days orweeks, and changes on this time scale have often beenused to categorize individuals as salt-sensitive or salt-resistant [6,7]. This acute form of BP salt-sensitivitycorresponds with an altered slope of the steady staterelationship between salt intake and BP (the chronicpressure-natriuresis relationship) [3,8], and has been afocus of much research concerning the mechanisms andfeatures of salt-induced hypertension. At the otherextreme, high dietary salt intakes have also beendemonstrated to affect BP on a much slower time scaleof many months or years [9-12]. In some studies, theseslow and progressive effects of salt have been found to bepartly irreversible [13-15], the irreversible characteristiccorresponding with a shift of the chronic pressurenatriuresis relationship to higher BP levels [13,14].Finally, an effect of sustained salt loading to alter theslope of the chronic pressure natriuresis relationship,amounting to a salt induced worsening of acute salt-sensitivity, has also been suggested [13,14]. Thus, theimpact of high dietary salt intake on BP may represent acombination of processes that differ with respect to theirtiming, reversibility, and specific effect on the chronicpressure natriuresis relationship.
The Dahl rat (Dahl-S) strain is a widely investigatedexperimental model of genetic salt-sensitivity in whichthe time course of salt-induced hypertension has beenstudied in detail. In a previous study of this strain, wefound that the characteristics of both acute and slow-progressive forms of salt-induced hypertension appearedto coexist [13]. In the present study, we used data fromDahl-S rats to investigate whether the time course of salt-induced hypertension in this strain could be wellrepresented as a multi-component process. To extendprevious theoretical analyses of the acute salt sensitivity ofBP which have focused on the chronic pressure natriuresisrelationship [3,8], each component was designed tocorrespond with a defining feature (e.g. slope or position)of the chronic pressure natriuresis relationship.
Constructed in this manner, the model was able todescribe not only the progression of salt-induced hyper-tension, but also the corresponding progressive altera-tions of the chronic pressure natriuresis relationship.
MethodsData setsThe Dahl salt sensitive rat represents an experimentalmodel in which the time course of salt-inducedhypertension has been documented in greatest detail[13]. We developed our model using all detailed timecourse data available to us for this strain. This consistedof two previously published sets and one previouslyunpublished set of data that illustrate the time course ofBP responses to salt loading in Dahl salt sensitive rats.A fourth set of previously published time course dataobtained from hybrids of Dahl-S and Dahl-R rats wassubsequently used to investigate whether the model wasgenerally robust. All experiments were approved byMemorial University’s Institutional Animal CareCommittee.
Data set 1 (Figure 1A) consisted of previously published[13] time course data of BP changes for 9 male Dahl-Srats exposed to a step increase in salt intake (1 controlweek of regular (0.7%) salt diet, followed by 6 weeks ofhigh (4%) salt diet, followed by a 4 week recovery periodon regular salt diet).
Data set 2 (Figure 1B) provides the previously published[13] time course of BP changes for 5 male Dahl-S ratsduring a sequence of step increases in salt intake whichhad been used to explore changes in an irreversiblecomponent of salt induced BP changes.
Data set 3 is a previously unpublished data setdocumenting the BP response of Dahl-S rats (males,Brookhaven Strain, ~3 months of age) to a sequentialswitching of dietary salt between regular (0.7%) andhigh (4%) levels according to a pseudo-random binarysequence. Figure 1C illustrates the mean BP response ofthe 8 individual Dahl-S rats used in this protocol, whilethe response of individual animals is provided inFigure 2. This previously unpublished data set wasoriginally produced by us in the course of a pilot studywhich sought to use linear transfer function analysis tocontrast differences in the rapid and slow components ofsalt-induced hypertension in this model. This analysiswas not pursued because standard linear analysismethods were realized to be inappropriate when someof the components of the salt-induced BP response werefound to be nonlinear (ie. partly irreversible: by the endof the protocol for this data set, BP levels on low salt diet
BMC Physiology 2009, 9:20 http://www.biomedcentral.com/1472-6793/9/20
Page 2 of 11(page number not for citation purposes)

were significantly elevated above that of the baselineperiod, P < 0.05. An irreversible nature of salt inducedhypertension in this model is even more evident in otherdata sets, Figure 1). Being available, this detailed data setwas therefore included in model development andevaluation.
To record BP for data set 3, a BP telemeter (Ta11Pa-C40,Data Sciences International) was surgically implantedin each rat at 10 - 11 weeks of age under pentobarbital(55 mg/kg i.p.) or ketamine-xylazine (90 and 5-10 mg/kg i.m., respectively) anesthesia, as previously described
[16]. Penicillin G (30,000 U/kg, i.m.) was administeredat the time of surgery. Following a recovery period of atleast 11 days, BP was recorded continuously for 72 days,each daily mean BP level being calculated as the averagelevel of mean arterial pressure sampled once eachminute, 1440 times per day. During this recordingperiod, the dietary salt level was manipulated on adaily basis in the following pseudo-random binarysequence, with each “0” indicating a 24 h exposure toa regular salt (0.7% NaCl) diet and “1” indicating a 24 hexposure to a high salt (4% NaCl) diet): 00000000011111101010 1100110111 0110100100 1110001011
Figure 1Comparison of model responses with the original data. Model output is compared with the group-average meanarterial pressure (MAP) data for each of the four data sets (A - D). The time course of the change in dietary salt between low(0.7% NaCl) and high (4% NaCl) levels is shown in blue at the base of each graph.
BMC Physiology 2009, 9:20 http://www.biomedcentral.com/1472-6793/9/20
Page 3 of 11(page number not for citation purposes)

1100101000 110000100000 (see Figure 1C and Figure 2).To maintain the effects of occasional disturbanceconstant throughout the protocol, cages were changedon a daily basis between 11 am and 12 noon, and anychanges to the diet were also made at that time.Telemetry records were inspected on a daily basis inorder that occasional artifacts could be detected andexcluded from analysis. The BP level was calculated asthe mean of all BP samples recorded between 12 noonon one day and the next. At the end of the protocol, ratswere killed by anesthetic overdose and the telemeterswere removed and cleaned. Telemeters were calibratedon several occasions before and following the protocol,and the change in offset with time was calculated bylinear regression. In 11 cases in which the regression wasstatistically significant (P < 0.05), we used the regressiondata to correct offset drift on a daily basis, with dailyincrements in offset correction ranging from 0.004 to0.09 mmHg over the course of the protocol. In 2 cases inwhich the regression was not significant, a single meanoffset correction value was uniformly applied to all data.
Data set 4 (Figure 1D) consisted of the previouslypublished [13] time course of the BP response to a stepincrease in dietary salt among 13 male hybrid rats (F2progeny of a cross between Dahl-S and Dahl-R rats)whose salt-sensitivity ranges between those of the Dahl-Sand Dahl-R strains. The experimental protocol consisted
of a control week of regular (0.7%) salt diet, followed byhigh (4%) salt diet for 10 weeks, followed by a return toregular salt diet for 1 week.
Numerical methodsDuring development of the model structure, we usedmean values for each data set as inputs to the model.Subsequently, models were parameterised for eachindividual animal and errors were estimated. MatLab’sSimulink (The Mathworks Inc, Natick, MA, USA)modelling environment was used for model implemen-tation. The numerical optimization was done usingNeleder-Mead simplex algorithm [17] implemented inthe “fminsearch” function in the MatLab OptimisationToolbox. The objective function to be minimised (Jk)was defined as the Mean Squared Error (MSE) betweenmodel results and experimental data:
JN
y yk i i
i
N
= −=∑1 2
1
( )
• yi is the actual experimental BP data, and• ŷi is the BP response obtained from the modelsimulations.
Error results are presented in the form of the meanabsolute error (MAE), which indicates the averagedifference between each point in the data and thecorresponding point in the model results in mmHg.During model development, model performance wasevaluated by visual inspection of the dynamic perfor-mance of the model output relative to the original datasets and by comparison of each model’s MAE values. AnF-test was subsequently used to evaluate improvementsin the performance of the model (residual sum ofsquares) relative to changes in model complexity(degrees of freedom) [18].
ResultsModel performance for data from Dahl-S rats(data sets 1-3)The first component (“Acute-Reversible”, AR) of themodel consisted of a first order transfer function withtime constant τAR and steady state gain GAR (Figure 3).This component was selected to represent the dynamicsof the well described reversible change in BP that occursover the days to weeks following a step change in saltintake in salt sensitive subjects (e.g. humans [19], dogs[20], mice [21], rats [22], monkeys [23]), with the valueGAR serving to scale the degree of acute salt sensitivity ofBP (ie. GAR = change in steady state BP level/change indietary salt content above the baseline level of 0.7%NaCl) and being inversely proportional to the slope ofthe chronic pressure natriuresis relationship. The second
Figure 2Illustration of the original blood pressure data of dataset 3. The plot shows the salt-induced change in meanarterial pressure (MAP) of the 8 individual Dahl-S rats in dataset 3. The average response of the 8 animals is shown inFigure 1C. The time course of the change in dietary saltbetween low (0.7%) and high (4%) levels is shown in blue atthe base of the graph. The upward trend in MAP over thecourse of the intermittent salt exposure was significant,amounting to 9.6 ± 1.9 mmHg (P < 0.01).
BMC Physiology 2009, 9:20 http://www.biomedcentral.com/1472-6793/9/20
Page 4 of 11(page number not for citation purposes)

component (“Progressive-Irreversible”, PI) consisted of asimple integrator with gain GPI (Figure 3). Thiscomponent was selected to represent the slow, progres-sive, and irreversible progression of salt-induced hyper-tension apparent in Dahl-S rats [13] (but also evident ona slower time scale in regular outbred rats [9,15,24]),and corresponds with an effect of chronic high salt intaketo shift the chronic pressure natriuresis relationship tohigher BP levels. The value GPI scales the sensitivity ofthis shift to salt intake, the shift in BP amounting to theproduct GPI·(increase in dietary salt content abovebaseline of 0.7% NaCl)·(time spent above baselinesalt level, in days). A third component (“Progressive-Reversible”, PR) consisted of a simple integrator termwith gain GPR that imposed a progressive and irreversibleincrease in the effect of the gain GAR of the 1st
component (Acute-Reversible) of the model in propor-tion to the extent and duration of exposure to high salt(Figure 3). GPR serves to scale this salt dependentincrease in acute salt sensitivity, effectively increasingthe effect of GAR by the product GPR·(increase in dietarysalt content above baseline level of 0.7% NaCl)·(timespent above baseline salt level, in days). Like theProgressive-Irreversible component, this 3rd component
provided the 3 component model with a slow andprogressive BP response to a sustained increase in saltintake. However, in contrast with the Progressive-Irreversible component, this 3rd component representsa progressive effect of high salt intake to increase acutesalt-sensitivity (ie. to progressively reduce the slope ofthe CPNR). This component was intended to correspondto the salt-induced worsening of acute salt sensitivitythat is apparent in the progressively increasing BPresponse to salt restriction in data set 2 [13]. Such aprocess is also consistent with the slow and progressivebut reversible form of salt-induced rise in BP evident intime course data from chimpanzees [10].
The 3 component model was able to accurately followBP responses to relatively sustained changes in saltintake, but was limited in its ability to reproduce themost rapid BP transients associated with sudden and/orbrief transitions in salt intake (particularly in the case ofdata set 3, obtained from an experimental protocolfeaturing frequent and brief changes in salt intake).Mean error values for the 3 component model weregenerally low (<3 mmHg, Table 1). An F-test indicatedthat, for data sets 1 and 2, model performance was
Figure 3Illustration of the structure of the 3 component model. Each of the individual three component parts of themodel are outlined and labelled. GAR, gain of the Acute-Reversible component; τAR, time constant of the Acute-Reversiblecomponent; GPR, gain of the Progressive-Reversible component; GPI, gain of the Progressive-Irreversible component.
BMC Physiology 2009, 9:20 http://www.biomedcentral.com/1472-6793/9/20
Page 5 of 11(page number not for citation purposes)
statistically superior to that of an initial model con-structed of only 2 components (AR and PI) (F statistic =24.1 and 64.0, respectively; P < 0.01 in both cases).In the case of data set 3, performance of the 3 and2 component models were not significantly different(F statistic = 1.0, P = 0.314).
Higher order modelsIn subsequent studies, we found that further improve-ment of the model’s dynamic performance required theaddition of one or more high order functions ofrelatively arbitrary structure. Such additions greatlyincreased model complexity and arbitrariness whileproviding little additional insight or reduction in overallerror, the MAE values already being quite modest(Table 1). Therefore, we considered the 3 componentmodel to have achieved the study’s objective with anappropriate balance between performance and complex-ity, and further elaborations of model structure were notpursued.
Model performance for data from hybrid rats (data set 4)The 3 component model performed well when appliedto data from hybrid rats (data set 4), the performancebeing significantly better than that of an initial modelhaving only 2 components (F statistic = 10.8; P < 0.01),and with the mean error value being well less than2 mmHg (Table 1). GAR, GPI, and GPR values werereduced below the levels obtained for Dahl-S rats in dataset 1-3 (Table 1), consistent with the observed attenua-tion of salt sensitivity of BP in Dahl strains in which thegenetic determinants of their salt sensitivity have beendiluted by cross breeding [13,25].
DiscussionIn the 1960s, development of the Dahl-S rat strain wasinstrumental in establishing the importance of genetic-environmental interactions in setting the long-term BPlevel. Today, descendents of this strain continue to bewidely used to study the detailed mechanisms under-lying salt-induced hypertension [26-29]. While manyindividual mechanisms have been studied, the progres-sion of salt-induced hypertension has generally beendiscussed as if it were the result of a single (albeit
complex) process or cascade. This may in part be due tothe absence of suitably detailed time course data, whichhas become available only recently following thedevelopment of BP telemetry. In the present study wehave demonstrated that the main dynamics of salt-induced hypertension in Dahl-S rats can be wellrepresented as a multi-component process consisting ofthree major elements that differ in several fundamentalcharacteristics, such as their time course and reversibility.Because each phase or component may involve a uniqueset of underlying mechanisms or genetic determinants,taking this multi-component nature in to account mayhave important ramifications for understanding andinvestigating the causes of salt-induced hypertension inthis experimental model, and possibly others.
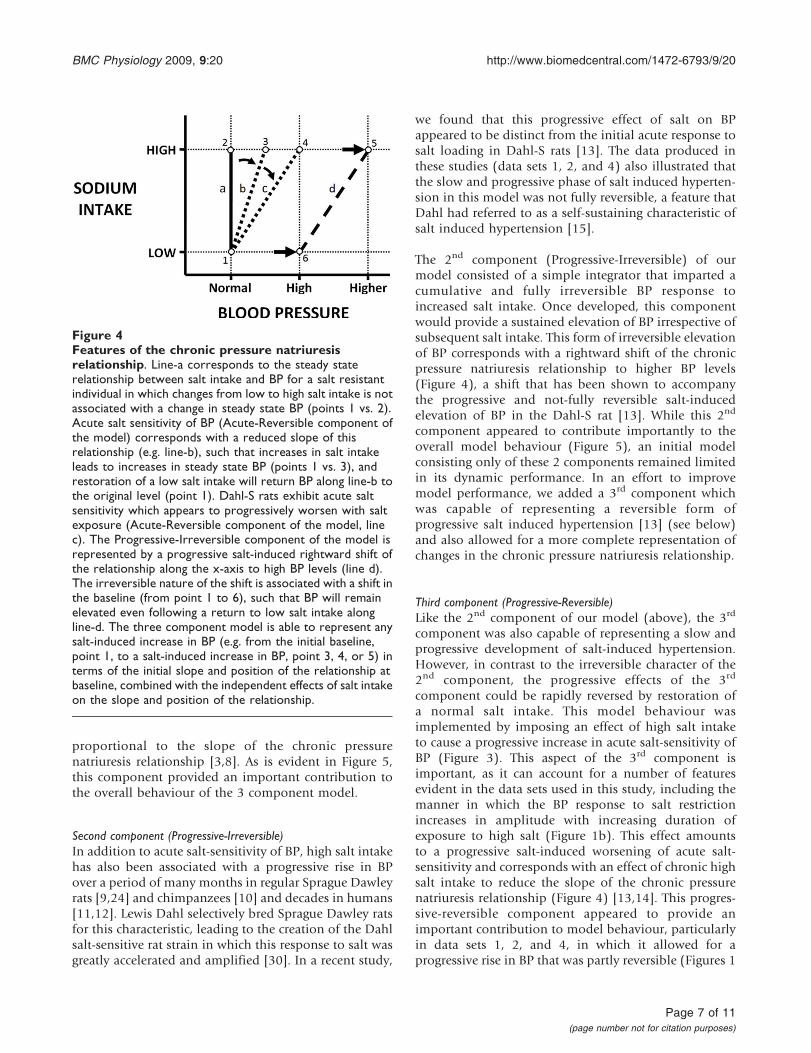
Model componentsTheoretical analyses of BP regulation have pointed to thefundamental role of the steady state relationshipbetween salt intake and BP (the “chronic pressurenatriuresis relationship” or “renal function curve”,Figure 4) in setting the long-term BP level [3,8]. Theslope of this relationship has been used to define theacute salt sensitivity of BP in previous analyses [3,8]. Inour current model, we used three components to betterrepresent the evolving steady state relationship betweensalt intake and BP during the development of salt-induced hypertension. As is evident in Figure 4 andexplained below, the combination of these threecomponents is capable of representing essentially anysalt-induced change in the steady state level of BP.
First component (Acute-Reversible)In salt-sensitive subjects, salt loading leads to corre-sponding changes in BP within days to weeks, coincidingapproximately with the time course of the reestablish-ment of salt balance. In our model, this phenomenonwas accounted for by a linear transfer function, a simplereversible process that exhibited a time constant of oneto two days (Table 1). Such time constant valuescorrespond reasonably well with the time course of theinitial phase of salt induced BP change in rats [22](Figure 1). The gain of this component (GAR) representsthe degree of acute salt sensitivity of BP and is inversely
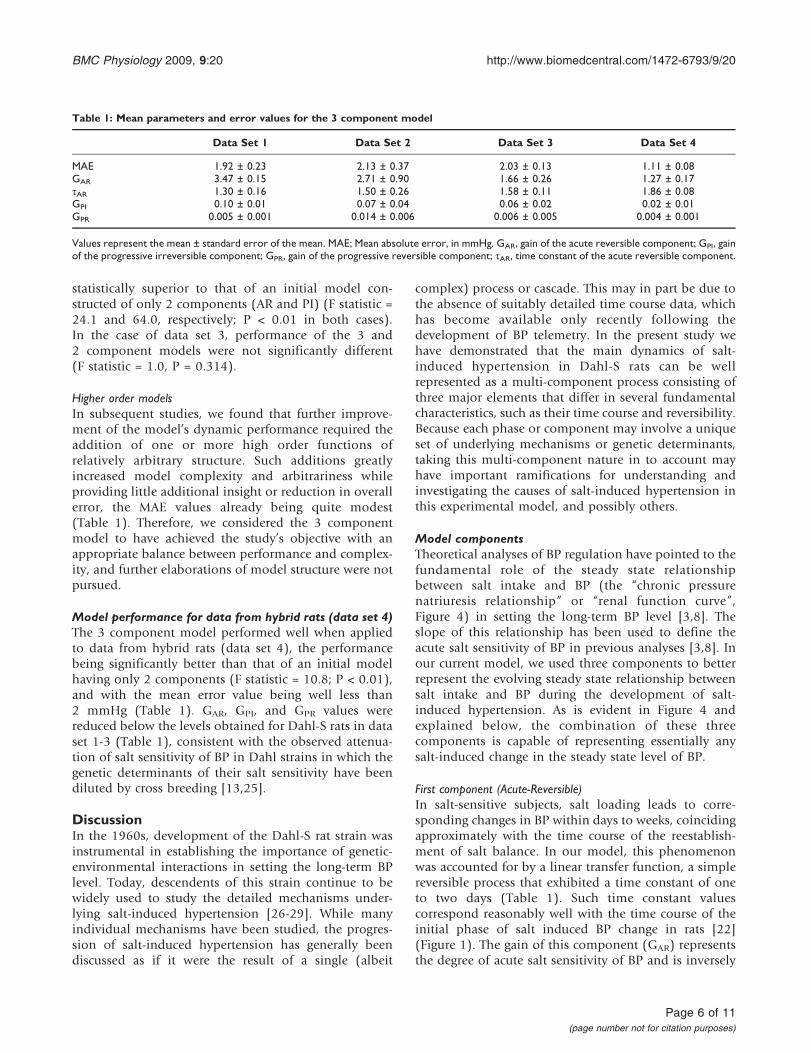
Table 1: Mean parameters and error values for the 3 component model
Data Set 1 Data Set 2 Data Set 3 Data Set 4
MAE 1.92 ± 0.23 2.13 ± 0.37 2.03 ± 0.13 1.11 ± 0.08GAR 3.47 ± 0.15 2.71 ± 0.90 1.66 ± 0.26 1.27 ± 0.17τAR 1.30 ± 0.16 1.50 ± 0.26 1.58 ± 0.11 1.86 ± 0.08GPI 0.10 ± 0.01 0.07 ± 0.04 0.06 ± 0.02 0.02 ± 0.01GPR 0.005 ± 0.001 0.014 ± 0.006 0.006 ± 0.005 0.004 ± 0.001
Values represent the mean ± standard error of the mean. MAE; Mean absolute error, in mmHg. GAR, gain of the acute reversible component; GPI, gainof the progressive irreversible component; GPR, gain of the progressive reversible component; τAR, time constant of the acute reversible component.
BMC Physiology 2009, 9:20 http://www.biomedcentral.com/1472-6793/9/20
Page 6 of 11(page number not for citation purposes)
proportional to the slope of the chronic pressurenatriuresis relationship [3,8]. As is evident in Figure 5,this component provided an important contribution tothe overall behaviour of the 3 component model.
Second component (Progressive-Irreversible)In addition to acute salt-sensitivity of BP, high salt intakehas also been associated with a progressive rise in BPover a period of many months in regular Sprague Dawleyrats [9,24] and chimpanzees [10] and decades in humans[11,12]. Lewis Dahl selectively bred Sprague Dawley ratsfor this characteristic, leading to the creation of the Dahlsalt-sensitive rat strain in which this response to salt wasgreatly accelerated and amplified [30]. In a recent study,
we found that this progressive effect of salt on BPappeared to be distinct from the initial acute response tosalt loading in Dahl-S rats [13]. The data produced inthese studies (data sets 1, 2, and 4) also illustrated thatthe slow and progressive phase of salt induced hyperten-sion in this model was not fully reversible, a feature thatDahl had referred to as a self-sustaining characteristic ofsalt induced hypertension [15].
The 2nd component (Progressive-Irreversible) of ourmodel consisted of a simple integrator that imparted acumulative and fully irreversible BP response toincreased salt intake. Once developed, this componentwould provide a sustained elevation of BP irrespective ofsubsequent salt intake. This form of irreversible elevationof BP corresponds with a rightward shift of the chronicpressure natriuresis relationship to higher BP levels(Figure 4), a shift that has been shown to accompanythe progressive and not-fully reversible salt-inducedelevation of BP in the Dahl-S rat [13]. While this 2nd
component appeared to contribute importantly to theoverall model behaviour (Figure 5), an initial modelconsisting only of these 2 components remained limitedin its dynamic performance. In an effort to improvemodel performance, we added a 3rd component whichwas capable of representing a reversible form ofprogressive salt induced hypertension [13] (see below)and also allowed for a more complete representation ofchanges in the chronic pressure natriuresis relationship.
Third component (Progressive-Reversible)Like the 2nd component of our model (above), the 3rd
component was also capable of representing a slow andprogressive development of salt-induced hypertension.However, in contrast to the irreversible character of the2nd component, the progressive effects of the 3rd
component could be rapidly reversed by restoration ofa normal salt intake. This model behaviour wasimplemented by imposing an effect of high salt intaketo cause a progressive increase in acute salt-sensitivity ofBP (Figure 3). This aspect of the 3rd component isimportant, as it can account for a number of featuresevident in the data sets used in this study, including themanner in which the BP response to salt restrictionincreases in amplitude with increasing duration ofexposure to high salt (Figure 1b). This effect amountsto a progressive salt-induced worsening of acute salt-sensitivity and corresponds with an effect of chronic highsalt intake to reduce the slope of the chronic pressurenatriuresis relationship (Figure 4) [13,14]. This progres-sive-reversible component appeared to provide animportant contribution to model behaviour, particularlyin data sets 1, 2, and 4, in which it allowed for aprogressive rise in BP that was partly reversible (Figures 1
Figure 4Features of the chronic pressure natriuresisrelationship. Line-a corresponds to the steady staterelationship between salt intake and BP for a salt resistantindividual in which changes from low to high salt intake is notassociated with a change in steady state BP (points 1 vs. 2).Acute salt sensitivity of BP (Acute-Reversible component ofthe model) corresponds with a reduced slope of thisrelationship (e.g. line-b), such that increases in salt intakeleads to increases in steady state BP (points 1 vs. 3), andrestoration of a low salt intake will return BP along line-b tothe original level (point 1). Dahl-S rats exhibit acute saltsensitivity which appears to progressively worsen with saltexposure (Acute-Reversible component of the model, linec). The Progressive-Irreversible component of the model isrepresented by a progressive salt-induced rightward shift ofthe relationship along the x-axis to high BP levels (line d).The irreversible nature of the shift is associated with a shift inthe baseline (from point 1 to 6), such that BP will remainelevated even following a return to low salt intake alongline-d. The three component model is able to represent anysalt-induced increase in BP (e.g. from the initial baseline,point 1, to a salt-induced increase in BP, point 3, 4, or 5) interms of the initial slope and position of the relationship atbaseline, combined with the independent effects of salt intakeon the slope and position of the relationship.
BMC Physiology 2009, 9:20 http://www.biomedcentral.com/1472-6793/9/20
Page 7 of 11(page number not for citation purposes)

and 5). Its role in individual rats from data set 4 isillustrated in Figure 6. While this form of salt-inducedsalt sensitivity has not been widely considered in thepast, it is evident in data from chimpanzees in which 22months of salt loading was associated with a progressiverise in BP that was nevertheless reversible upon restora-tion of normal salt intake [10]. Such a process is alsoconsistent with the age-associated increases in acute salt-sensitivity in humans [31,32]. While slow increases inacute salt-sensitivity in humans with age have beenattributed to ageing itself, it is equally plausible that theyare the result of an increasing period of exposure to a
high salt intake, since a salt intake is typically highthroughout life in Western societies [4].
We are not aware of a specific mechanism which couldaccount for a salt-induced worsening of acute salt-sensitiv-ity. However, in the Dahl-S rat, the development of salt-induced hypertension is accompanied by progressivechanges in renal structure and an accumulation of renallesions [33-35]. Such changes could potentially underlie aworsening of salt-sensitivity, similar to the suggested linkagebetween subtle changes in renal structure and the develop-ment of salt sensitivity in other experimental models [36].
Figure 5Contribution of individual model components to the overall behavior of the 3 component model. In addition tothe three components of the model (Acute-Reversible, Progressive-Reversible, Progressive-Irreversible), the net effect ofthe interaction between the Acute-Reversible and Progressive-Reversible components (the total amount of salt-inducedhypertension that can be reversed by salt restriction) is also plotted ("Total acute (AR+PR)"). The contributions areshown separately for data set 1 (A), data set 2 (B), data set 3 (C), and data set 4 (D).
BMC Physiology 2009, 9:20 http://www.biomedcentral.com/1472-6793/9/20
Page 8 of 11(page number not for citation purposes)

Strengths and limitationsThe main purpose of our study was to investigate thetime course of the development of salt-induced hyper-tension in Dahl-S rats and to determine if it could bewell represented as a system with multiple components.In this regard our model has performed well, as it wasable to provide a reasonable representation of the steadystate components of previously published time coursedata for the development of salt-induced hypertensionin the Dahl rat strain. This result is consistent with thehypothesis that multiple distinct phases or componentsare involved in the development of this form ofhypertension.
An important strength of the model is its comprehensiveability to represent changes in the chronic pressure
natriuresis relationship associated with the developmentand progression of salt-induced hypertension. By com-prehensive, we refer to the ability of the model torepresent virtually any salt-induced increase in thebaseline BP level in terms of the initial slope of thechronic pressure natriuresis relationship and any sub-sequent salt-induced change in the position and/or slopeof the relationship (Figure 4). In addition, the modelmay be useful to compare the contribution of individualcomponents to the dynamics of salt-induced hyperten-sion between individuals, and potentially betweendifferent strains or species. Figure 6, for example,illustrates the role of each of the three model compo-nents in individual hybrid rats of data set 4. Beingsecond generation hybrids (F2 progeny of a cross of Dahlsalt sensitive and Dahl salt resistant rats), these rats
Figure 6Calculated changes in the chronic pressure natriuresis relationship associated with model simulationsof the development of salt induced hypertension. The graphs illustrate calculated changes in the chronic pressurenatriuresis relationship for three individual hybrid rats of data set 4 (Rats FF5, FF6, and FF8). The relationship is plottedfor days 1, 22, 42, and 67 of the protocol. The original BP time course data and corresponding model output for eachof the three rats are shown in the fourth panel.
BMC Physiology 2009, 9:20 http://www.biomedcentral.com/1472-6793/9/20
Page 9 of 11(page number not for citation purposes)

exhibit wide inter-individual variations in the character-istics of their salt-induced BP changes [13] (Figure 6).Nevertheless, the 3 component model was well able torepresent the changes in BP and the correspondingchanges in the chronic pressure natriuresis relationship.
A limitation of our model is that, while it was able torepresent the salt-induced changes in steady state BP, itwas not able to follow the most rapid dynamicsexhibited by the BP data. This was particularly evidentin the case of data set 3, a data set dominated byfrequent changes in salt intake. In the case of data sets 1,2, and 4, this limitation was also apparent as an inabilityto fully reproduce the BP transient associated with asudden return of salt intake to control levels. Thus, whilethe performance of our model suggest that the timecourse of salt-induced hypertension can be approxi-mated by a 3 component process, we must acknowledgethat additional complexities exist, particularly withrespect to the most rapid dynamics contained withinthe data.
A second limitation of our model is that it links dietarysalt levels to BP responses without accounting forspecific intermediary processes or mechanisms. Whileour model structures were based on time course datarather than specific mechanisms, they nevertheless doinform us about the arrangement and complexity ofmechanisms underlying the development of salt-inducedhypertension. Most importantly, our results suggest thatsalt-induced hypertension is not simply the result of onesingle process. On the contrary, it would appear to be theresult of a multi-component process, with each phase orcomponent differing with respect to features of timing,reversibility, and representation in the chronic pressurenatriuresis relationship. From a mechanistic point ofview, this is an important insight, since this implies thateach individual component of our model may have aunique set of underlying mechanisms and geneticdeterminants.
ConclusionThe effect of salt on BP is often presumed to be the resultof a single process or cascade. Our model resultsdemonstrate that the progression of salt-induced hyper-tension in the Dahl-S salt-sensitive rat can be wellrepresented as a multi-component process, with eachcomponent having distinct characteristics of timing andreversibility. In addition, each component also has acorresponding distinct action on the slope or position ofthe chronic pressure natriuresis relationship. As we haveshown here, this relationship not only dictates the steadystate level of BP occurring for a given level of salt intake,but can also be used to describe the development of
salt-induced hypertension in the Dahl-S rat model. Animportant implication of these findings is that each ofthe 3 components of our model may correspond with aunique set of underlying mechanisms and/or geneticdeterminants. Such components may therefore beimportant to consider in any comprehensive explanationof the etiology of salt-induced hypertension. In futurestudies of the Dahl rat or other salt-sensitive models, themechanisms or characteristics associated with eachindividual component could be addressed throughmodest additions to standard experimental protocolsthat would permit the acute and progressive phases ofsalt induced BP changes, and their degree of reversibility,to be distinguished or quantified.
Authors’ contributionsVIM was responsible for implementing model structuresin software and assessing and documenting modelbehaviour. JVR was responsible for overseeing modelimplementation and evaluation. BVV initially conceivedof the study, coordinated manuscript preparation, andprovided original data used in model development andevaluation. All three authors contributed to the design ofthe study and development of model structures. Allauthors read and approved the final manuscript.
AcknowledgementsThe authors wish to thank Linda Chafe for her contribution to theexperiments outlined in this manuscript. This study was supported by agrant from the Canadian Institutes of Health Research (#91547), theIreland-Newfoundland Partnership fund, the Irish Research Council forScience Engineering and Technology, and the John and Pat HumeScholarship fund in NUI Maynooth.
References1. He FJ and MacGregor GA: Effect of longer-term modest salt
reduction on blood pressure. Cochrane Database of SystematicReviews 2005, 2: CD004937.
2. Joffres MR, Campbell NR, Manns B and Tu K: Estimate of thebenefits of a population-based reduction in dietary sodiumadditives on hypertension and its related health care costs inCanada. Can J Cardiol 2007, 23:437–43.
3. Guyton AC: Circulatory Physiology III. Arterial pressure and hypertension.WB Saunders and Co: Toronto; 1980.
4. Meneton P, Jeunemaitre X, de Wardener HE and MacGregor GA:Links between dietary salt intake, renal salt handling, bloodpressure, and cardiovascular diseases. Physiol Rev 2005,85:679–715.
5. Burnier M: Sodium in health and disease. Informa Healthcare: NewYork; 2008.
6. Fujita T, Henry WL, Bartter FC, Lake CR and Delea CS: Factorsinfluencing blood pressure in salt-sensitive patients withhypertension. Am J Med 1980, 69:334–344.
7. Kawasaki T, Delea CS, Bartter FC and Smith H: The effect of high-sodium and low-sodium intakes on blood pressure and otherrelated variables in human subjects with idiopathic hyper-tension. Am J Med 1978, 64:193–8.
8. Kimura G and Brenner BM: Implications of the linear pressure-natriuresis relationship and importance of sodium sensitiv-ity in hypertension. J Hypertens 1997, 15:1055–61.
9. Meneely GR, Tucker RG, Darby WJ and Auerbach SH: Chronicsodium chloride toxicity in the albino rat. II. Occurrence ofhypertension and of a syndrome of edema and renal failure.J Exp Med 1953, 98:71–80.
BMC Physiology 2009, 9:20 http://www.biomedcentral.com/1472-6793/9/20
Page 10 of 11(page number not for citation purposes)

10. Denton D, Weisinger R, Mundy NI, Wickings EJ, Dixson A,Moisson P, Pingard AM, Shade R, Carey D, Ardaillou R, Paillard F,Chapman J, Thillet J and Michel JB: The effect of increased saltintake on blood pressure of chimpanzees. Nat Med 1995,1:1009–1016.
11. Elliott P, Stamler J, Nichols R, Dyer AR, Stamler R, Kesteloot H andMarmot M: Intersalt revisited: further analyses of 24 hoursodium excretion and blood pressure within and acrosspopulations. BMJ 1996, 312:1249–1253.
12. Law MR, Frost CD and Wald NJ: By how much does dietary saltreduction lower blood pressure? I. Analysis of observationaldata among populations. BMJ 1991, 302:811–815.
13. Van Vliet BN, Chafe LL, Halfyard S and Leonard AM: Distinct rapidand slow phases of salt-induced hypertension in Dahl salt-sensitive rats. J Hypertens 2006, 24:1599–1606.
14. Van Vliet BN and Montani JP: The time course of salt-inducedhypertension, and why it matters. Int J Obes (Lond) 2008,32(Suppl 6):S35–47.
15. Dahl LK: Effects of chronic excess salt feeding. Inductionof self-sustaining hypertension in rats. J Exp Med 1961,114:231–236.
16. Van Vliet BN, Hu L, Scott T, Chafe L and Montani JP: Cardiachypertrophy and telemetered blood pressure six weeksfollowing baroreceptor denervation in normotensive rats.Am J Physiol 1996, 271:R1759–1769.
17. Lagarias JC, Reeds JA, Wright MH and Wright PE: Convergenceproperties of the Nelder-Mead Simplex method in lowdimensions. SIAM Journal of Optimization 1998, 9:112–147.
18. Boxenbaum HG, Riegelman S and Elashoff RM: Statistical Estima-tions in Pharmacokinetics. J Pharmacokinetics Biopharmaceutics1974, 2:123–148.
19. McDonough J and Wilhelmj CM: The effect of excess salt intakeon human blood pressure. Am J Dig Dis Nutr 1954, 21:180–181.
20. Coleman TG and Guyton AC: Hypertension caused by saltloading in the dog. III. Onset transients of cardiac outputand other circulatory variables. Circ Res 1969, 25:153–160.
21. Leonard AM, Chafe LL, Montani J-P and Van Vliet BN: Increasedsalt sensitivity in eNOS knockout mice. Am J Hypertens 2006,12:1264–1269.
22. Osborn JW and Hornfeldt BJ: Arterial baroreceptor denerva-tion impairs long-term regulation of arterial pressure duringdietary salt loading. Am J Physiol 1998, 275:H1558–H1566.
23. Srinivasan SR, Dalferes ER Jr, Wolf RH, Radhakrishnamurthy B,Foster TA and Berenson GS: Variability in blood pressureresponse to dietary sodium intake among African greenmonkeys (Cercopithecus aethiops). Am J Clin Nutr 1984,39:792–796.
24. Ball COT and Meneely GR: Observations on dietary sodiumchloride. J Am Dietetic Assoc 1957, 33:366–370.
25. Knudsen KD, Dahl LK, Thompson K, Iwai J, Heine M and Leitl G:Effects of chronic excess salt ingestion. Inheritance ofhypertension in the rat. J Exp Med 1970, 132:976–1000.
26. Manning RD Jr, Tian N and Meng S: Oxidative stress andantioxidant treatment in hypertension and the associatedrenal damage. Am J Nephrol 2005, 25:311–7.
27. Manning RD Jr, Hu L, Tan DY and Meng S: Role of abnormal nitricoxide systems in salt-sensitive hypertension. Am J Hypertens2001, 14:68S–73S.
28. Leenen FH, Ruzicka M and Huang BS: The brain and salt-sensitivehypertension. Curr Hypertens Rep 2002, 4:129–35.
29. Garrett MR, Saad Y, Dene H and Rapp JP: Blood pressure QTLthat differentiate Dahl salt-sensitive and spontaneouslyhypertensive rats. Physiol Genomics 2000, 3:33–8.
30. Dahl LK, Knudsen KD, Heine MA and Leitl GJ: Effects of chronicexcess salt ingestion. Modification of experimental hyper-tension in the rat by variations in the diet. Circ Res 1968,22:11–8.
31. Myers J and Morgan T: The effect of sodium intake on the bloodpressure related to age and sex. Clin Exp Hypertens A 1983,5:99–118.
32. Weinberger MH and Fineberg NS: Sodium and volume sensitiv-ity of blood pressure. Age and pressure change over time.Hypertension 1991, 18:67–71.
33. Rapp JP and Dene H: Development and characteristics ofinbred strains of Dahl salt-sensitive and salt-resistant rats.Hypertension 1985, 7:340–349.
34. Jaffé D, Sutherland LE, Barker DM and Dahl LK: Effects of chronicexcess salt ingestion. Morphologic findings in kidneys of ratswith differing genetic susceptibilities to hypertension. ArchPathol 1970, 90:1–16.
35. Chen PY, St John PL, Kirk KA, Abrahamson DR and Sanders PW:Hypertensive nephrosclerosis in the Dahl/Rapp rat. Initialsites of injury and effect of dietary L-arginine supplementa-tion. Lab Invest 1993, 68:174–184.
36. Johnson RJ, Herrera-Acosta J, Schreiner GF and Rodriguez-Iturbe B:Subtle acquired renal injury as a mechanism of salt-sensitivehypertension. N Engl J Med 2002, 346:913–23.
Publish with BioMed Central and every scientist can read your work free of charge
"BioMed Central will be the most significant development for disseminating the results of biomedical research in our lifetime."
Sir Paul Nurse, Cancer Research UK
Your research papers will be:
available free of charge to the entire biomedical community
peer reviewed and published immediately upon acceptance
cited in PubMed and archived on PubMed Central
yours — you keep the copyright
Submit your manuscript here:http://www.biomedcentral.com/info/publishing_adv.asp
BioMedcentral
BMC Physiology 2009, 9:20 http://www.biomedcentral.com/1472-6793/9/20
Page 11 of 11(page number not for citation purposes)