A modeling study on the hydrodynamics of a coastal embayment occupied by mussel farms (Ria de...
14
A modeling study on the hydrodynamics of a coastal embayment occupied by mussel farms (Ria de Ares-Betanzos, NW Iberian Peninsula) Pedro Duarte a, * , Xos e Ant on Alvarez-Salgado b , Maria Jos e Fern andez-Reiriz b , Silvia Piedracoba c , Uxío Labarta b a Norwegian Polar Institute, Fram Centre, N-9296 Tromsø, Norway b CSIC Instituto de Investigaciones Marinas, Eduardo Cabello 6, 36208 Vigo, Spain c Universidad de Vigo, Departamento de Física Aplicada, Campus Lagoas-Marcosende, 36200 Vigo, Spain article info Article history: Received 23 October 2013 Accepted 25 May 2014 Available online 9 June 2014 Keywords: hydrodynamic modeling Galician rias Ria de Ares-Betanzos aquaculture rafts mussel cultivation residual circulation abstract The present study suggests that both under upwelling and downwelling winds, the residual circulation of Ria de Ares-Betanzos remains positive with a strong influence from river discharge and a positive feedback from wind, unlike what is generally accepted for Galician rias. Furthermore, mussel cultivation areas may reduce residual velocities by almost 40%, suggesting their potential feedbacks on food replenishment for cultivated mussels. The Ria de Ares-Betanzos is a partially stratified estuary in the NW Iberian upwelling system where blue mussels are extensively cultured on hanging ropes. This type of culture depends to a large extent on water circulation and residence times, since mussels feed on sus- pended particles. Therefore, understanding the role of tides, continental runoff, and winds on the cir- culation of this embayment has important practical applications. Furthermore, previous works have emphasized the potential importance of aquaculture leases on water circulation within coastal ecosys- tems, with potential negative feedbacks on production carrying capacity. Here we implemented and validated a 3D hydrodynamic numerical model for the Ria de Ares-Betanzos to (i) evaluate the relative importance of the forcing agents on the circulation within the ria and (ii) estimate the importance of culture leases on circulation patterns at the scale of the mussel farms from model simulations. The model was successfully validated with empirical current velocity data collected during July and October 2007 using an assortment of efficiency criteria. Model simulations were carried out to isolate the effects of wind and river flows on circulation patterns. © 2014 Elsevier Ltd. All rights reserved. 1. Introduction The Galician rias are flooded tectonic valleys on the northwest coast of the Iberian Peninsula (Fig. 1). They support 40% of the European and 15% of the global production of blue mussels, about 250 10 6 kg year 1 (Labarta et al., 2004). The cultivation system consists of hanging ropes (maximum length, 12 m) mounted on floating rafts (maximum size, 500 m 2 )(P erez-Camacho et al., 1991) of which there are over three and a half thousand in the five rias where these structures are installed (Figueiras et al., 2002). The large economic importance of these embayments, not only for mussel production but also for harbor, fishing, touristic and conservation activities, stimulated a large number of field studies on their physical, geochemical and biological features. Conversely, numerical modeling studies are scarce and focused mostly on cir- culation issues (e.g. Torres-L opez et al., 2001; Souto et al., 2003; Carballo et al., 2009). Figueiras et al. (2002) reviewed some of the most important characteristics of these ecosystems justifying their high productivity. The subtidal circulation of the four rias Baixas, to the south of Cape Fisterra (Fig. 1), is conditioned by the seasonal and short-term succession of upwelling and downwelling events on the adjacent shelf. The upwelling-favorable season starts be- tween March and May and ends around early October ( Alvarez- Salgado et al., 2000). However, Alvarez et al. (2009) suggested that upwelling events occur also during the winter along the Galician coast. The upwelling-favorable season is characterized by the prevalence of northerly winds, with the Ekman pumping pro- ducing an inflow of upwelled water at the bottom of these * Corresponding author. E-mail addresses: [email protected], [email protected] (P. Duarte). Contents lists available at ScienceDirect Estuarine, Coastal and Shelf Science journal homepage: www.elsevier.com/locate/ecss http://dx.doi.org/10.1016/j.ecss.2014.05.021 0272-7714/© 2014 Elsevier Ltd. All rights reserved. Estuarine, Coastal and Shelf Science 147 (2014) 42e55
Transcript of A modeling study on the hydrodynamics of a coastal embayment occupied by mussel farms (Ria de...
lable at ScienceDirect
Estuarine, Coastal and Shelf Science 147 (2014) 42e55
Contents lists avai
Estuarine, Coastal and Shelf Science
journal homepage: www.elsevier .com/locate/ecss
A modeling study on the hydrodynamics of a coastal embaymentoccupied by mussel farms (Ria de Ares-Betanzos, NW IberianPeninsula)
Pedro Duarte a, *, Xos�e Ant�on Alvarez-Salgado b, Maria Jos�e Fern�andez-Reiriz b,Silvia Piedracoba c, Uxío Labarta b
a Norwegian Polar Institute, Fram Centre, N-9296 Tromsø, Norwayb CSIC Instituto de Investigaciones Marinas, Eduardo Cabello 6, 36208 Vigo, Spainc Universidad de Vigo, Departamento de Física Aplicada, Campus Lagoas-Marcosende, 36200 Vigo, Spain
a r t i c l e i n f o
Article history:Received 23 October 2013Accepted 25 May 2014Available online 9 June 2014
Keywords:hydrodynamic modelingGalician riasRia de Ares-Betanzosaquaculture raftsmussel cultivationresidual circulation
* Corresponding author.E-mail addresses: [email protected], pmsdu
http://dx.doi.org/10.1016/j.ecss.2014.05.0210272-7714/© 2014 Elsevier Ltd. All rights reserved.
a b s t r a c t
The present study suggests that both under upwelling and downwelling winds, the residual circulation ofRia de Ares-Betanzos remains positive with a strong influence from river discharge and a positivefeedback from wind, unlike what is generally accepted for Galician rias. Furthermore, mussel cultivationareas may reduce residual velocities by almost 40%, suggesting their potential feedbacks on foodreplenishment for cultivated mussels. The Ria de Ares-Betanzos is a partially stratified estuary in the NWIberian upwelling system where blue mussels are extensively cultured on hanging ropes. This type ofculture depends to a large extent on water circulation and residence times, since mussels feed on sus-pended particles. Therefore, understanding the role of tides, continental runoff, and winds on the cir-culation of this embayment has important practical applications. Furthermore, previous works haveemphasized the potential importance of aquaculture leases on water circulation within coastal ecosys-tems, with potential negative feedbacks on production carrying capacity. Here we implemented andvalidated a 3D hydrodynamic numerical model for the Ria de Ares-Betanzos to (i) evaluate the relativeimportance of the forcing agents on the circulation within the ria and (ii) estimate the importance ofculture leases on circulation patterns at the scale of the mussel farms frommodel simulations. The modelwas successfully validated with empirical current velocity data collected during July and October 2007using an assortment of efficiency criteria. Model simulations were carried out to isolate the effects ofwind and river flows on circulation patterns.
© 2014 Elsevier Ltd. All rights reserved.
1. Introduction
The Galician rias are flooded tectonic valleys on the northwestcoast of the Iberian Peninsula (Fig. 1). They support 40% of theEuropean and 15% of the global production of blue mussels, about250 � 106 kg year�1 (Labarta et al., 2004). The cultivation systemconsists of hanging ropes (maximum length, 12 m) mounted onfloating rafts (maximum size, 500 m2) (P�erez-Camacho et al., 1991)of which there are over three and a half thousand in the five riaswhere these structures are installed (Figueiras et al., 2002).
The large economic importance of these embayments, not onlyfor mussel production but also for harbor, fishing, touristic and
[email protected] (P. Duarte).
conservation activities, stimulated a large number of field studieson their physical, geochemical and biological features. Conversely,numerical modeling studies are scarce and focused mostly on cir-culation issues (e.g. Torres-L�opez et al., 2001; Souto et al., 2003;Carballo et al., 2009). Figueiras et al. (2002) reviewed some of themost important characteristics of these ecosystems justifying theirhigh productivity. The subtidal circulation of the four rias Baixas, tothe south of Cape Fisterra (Fig. 1), is conditioned by the seasonaland short-term succession of upwelling and downwelling eventson the adjacent shelf. The upwelling-favorable season starts be-tween March and May and ends around early October (�Alvarez-Salgado et al., 2000). However, Alvarez et al. (2009) suggestedthat upwelling events occur also during the winter along theGalician coast. The upwelling-favorable season is characterized bythe prevalence of northerly winds, with the Ekman pumping pro-ducing an inflow of upwelled water at the bottom of these

Fig. 1. Galician rias with a detail of the Ria de Ares-Betanzos, showing monitoring stations (triangles), the location of mussel rafts (small white dots), model domain (continuousline) and rivers Eume and Mandeo. A raster image with the bathymetry and model grid is also shown (see text).
P. Duarte et al. / Estuarine, Coastal and Shelf Science 147 (2014) 42e55 43
embayments and a compensating outflow of surface waters (posi-tive residual circulation). During the downwelling-favorable sea-son, southerly winds prevail, provoking a reversal of this circulationpattern: Ekman pumping forces the entry of shelf surface waterinto the embayment and a compensating outflow through thebottom layer (Piedracoba et al., 2005). A negative circulation wasobserved in Ria de Pontevedra, as a result of the accumulation ofdenser water in the inner estuary originated from a previous up-welling event (deCastro et al., 2004). It is therefore presumed thatthese inversions may occur sporadically in Galician rias with adominating positive residual circulation that may persist againsttidal forces (deCastro et al., 2004).
The Ria de Ares-Betanzos, to the north of Cape Fisterra (Fig. 1), is4e7 times smaller than the rias Baixas and oriented differently. As aconsequence, Ekman pumping on the adjacent shelf has a lowerimpact on the subtidal circulation of this embayment and conti-nental runoff gains more importance compared with the rias Baixas(�Alvarez-Salgado et al., 2011). The Ria de Ares-Betanzos supportsthe production of 147 mussel rafts, mostly concentrated along itssouthern margin (Fig. 1). This type of culture depends to a large
extend onwater circulation and residence times, sincemussels feedon suspended living and non-living particles transported by thewater (Navarro et al., 1991; P�erez-Camacho et al., 1995). Previousworks have emphasized the potential importance of aquacultureleases on water circulation within coastal ecosystems with poten-tial negative feedbacks on production carrying capacity (Grantet al., 1998; Grant and Bacher, 2001). Following Shi et al. (2011),suspended aquaculture leases in Sungo Bay (China) may cause areduction on the average speed of surface current by 40%,decreasing the exchange of water with the adjacent sea. Currentspeed reductions may have important feedbacks on bivalve pro-duction and exploitation since they have implications on thedispersal of mussel larvae before settlement (Peteiro et al., 2011),the availability of suspended food and the occurrence of harmfulmicroalgae, which limits the extraction of this resource (�Alvarez-Salgado et al., 2011). Therefore, understanding the hydrody-namics of the Ria de Ares-Betanzos and the feedbacks from culti-vation leases on water circulation has important practicalapplications for the sustainable management of this importantculture.

P. Duarte et al. / Estuarine, Coastal and Shelf Science 147 (2014) 42e5544
Previous studies in the Ria de Ares-Betanzos have focused onphytoplankton diversity and productivity (Blanco, 1985; Mari~noet al., 1985; Bode and Varela, 1998), nutrient distributions (Pregoet al., 1999), the physico-chemical structure of the benthic envi-ronment (S�anchez-Mata et al., 1999) or the relationship betweensubtidal circulation and net ecosystem metabolism (Villegas-Ríoset al., 2011). The latter authors implemented a 2-D transient boxmodel to integrate physical, chemical and biological data and toestimate fluxes between the inner and outer parts of the ria. Theyconcluded that, compared with the rias Baixas, the subtidal circu-lation of the Ria de Ares-Betanzos is positive both under upwellingand downwelling conditions as a result of the larger relativeimportance of river flows (Villegas-Ríos et al., 2011).
The main hypotheses of the present study are that:
� residual circulation in Ria de Ares-Betanzos is positive irre-spective of wind directions;
� mussel leases have an important effect in reducing residualcurrent velocities with a potentially negative feedback onmussel culture.
Accordingly, a 3D hydrodynamic model of the Ria de Ares-Betanzos was implemented and validated and, thereafter, used tofulfill the following objectives:
� evaluate the relative importance of local winds, tidal and riverforcing processes on the circulation, providing a further test tothe explanations advanced by Villegas-Ríos et al. (2011) for thepersistent positive residual circulation;
� access the importance of culture leases on residual circulation.
2. Methods
2.1. Study site
The Ria de Ares-Betanzos is the largest of six bays located be-tween Cape Fisterra and Cape Prior, in the NW coast of the IberianPeninsula (Fig. 1), with a surface area of 72 km2, a volume of0.75 km3 and a length of 19 km. It consists of two branches: Ares,the estuary of river Eume and Betanzos, the estuary of riverMandeowith long-term average flows of 16.5 and 14.1 m3s�1, respectively(Prego et al., 1999; S�anchez-Mata et al., 1999). The two branchesconverge into a zone that is freely connected to the adjacent shelfthrough a mouth that is 40 m deep and 4 km wide.
2.2. Available data
Field data used in this work are described in Villegas-Ríos et al.(2011) and were obtained in July and OctobereNovember of 2007.An acoustic Doppler (ACDP) current profiler was moored at stn 3(Fig. 1) and covered the periods from 3 to 26 July and from 15October to 20 November. Current velocity was measured from thesurface to 16 m depth with a time step of 10 min. Furthermore,continuous vertical profiles of salinity and temperature wererecorded at stns A1, A2, B1, B2, 4 and 5 in the periods 9e23 July and10e29 October (stn 5 was sampled only in October). These datawere used for model initialization and validation.
Data on air temperature, relative humidity and light intensityfrom the meteorological station of Ferrol (Fig. 1) were downloadedfrom the web side of the Galician Weather Forecast AgencyMeteogalicia (http://www.meteogalicia.es). Flows from riversEume andMandeowere obtained as described in Villegas-Ríos et al.(2011). Wind velocity and direction as well as river flows for thetwo periods under study are depicted in Fig. 2. Tide harmonics for A
Coru~na were obtained in SHOM (1984). These data were used formodel forcing (see below).
2.3. Hydrodynamic model
The hydrodynamic model described here is similar to theMOHID (http://www.mohid.com/) model implementationdescribed in Taboada et al. (1998), for Ria de Vigo, and Ruiz-Villarreal et al. (2002), for Ria de Pontevedra. The main differ-ences are the usages of a sigma vertical coordinate in the formerand of a finite-volume approach in the latter, whereas the presentmodel uses Cartesian coordinates and finite differences. The modelis based on the horizontal equations of motion (1 and 2), theequation of continuity (3 and 4), the equation of transport (5) andthe hydrostatic and the Bousinesq assumptions (Pond and Pickard,1983):
vuxdt
þ vðuuÞvx
þ vðuvÞvy
þ vðuwÞvz
� vxv2uvx2
� vyv2uvy2
� vzv2uvz2
¼ � vPrvx
� Cf jujuH
� Cdjujudl2V
þ vtxrvz
þ f vy (1)
vvydt
þ vðvvÞvy
þ vðvuÞvx
þ vðvwÞvz
� vxv2v
vx2� vy
v2v
vy2� vz
v2v
vz2
¼ � vPrvy
� Cf jvjvH
� Cdjvjvdl2V
þ vtyrvz
� fux (2)
dxdt
¼ vuxvx
þ vvyvy
þ vwz
vz(3)
vuxvx
þ vvyvy
þ vwz
vz¼ 0 (4)
vSdt
þ vðuSÞvx
þ vðvSÞvy
þ vðwSÞvz
¼v
�Ax
vSvx
�
vxþv
�Ay
vSvy
�
vyþv
�Az
vSvz
�
vz(5)
where u, v andw are the components of the current velocity (West-East (x), South-North (y) and Bottom-Up (z), respectively) (inm s�1); P is the hydrostatic pressure (in N m�2); r is the seawaterdensity (in kg m�3); n is the eddy diffusivity (EasteWest (x),NortheSouth (y) and BottomeUp (z), respectively) (in m2 s�1); Cf isthe rugosity coefficient (dimensionless); Cd is the body drag coef-ficient (dimensionless); d and l are thewidth and height of the bodyagainst which drag is calculated (in m);t is the wind stress (inN m�2); f is the Coriolis parameter (in s�1); x is the surface eleva-tion/water level (in m); H is the water depth (in m); S is the con-centration of any dissolved or particulate property (in kg m�3); andA is the diffusivity of the mentioned property along each of thethree dimensions (in m2 s�1).
Eq. (3) is applied at the surface, where flow divergence/convergence may change surface elevation. Eq. (4) is applied belowthe surface, where the balance of inflows and outflows at anycontrol volume must be zero.
The generic algorithm is:
vtþ1ijk /xtþ
1 =
2ij /utþ1
ijk /wtþ1ijk /Vtþ1
ijk and xtþ1ij /Stþ1
ij
As mentioned above, the spatial discretization of the equationsis based on finite differences. The resolution is semi-implicitfollowing an Alternate Direction Implicit (ADI) scheme. Eqs. (1)and (2) are used to replace the velocity terms in the equation of

Fig. 2. Wind velocity and direction and river flow data used to force the model for the periods covered by the simulations (see text).
P. Duarte et al. / Estuarine, Coastal and Shelf Science 147 (2014) 42e55 45
continuity (3). One of the velocity terms is explicit and the other isimplicit. Eq. (3) is integrated vertically to estimate surface elevationimplicitly (xtþ1=2
ijk ), without the need to know vertical velocities atthis time and with vertical diffusivities canceling each other out.Obtained elevations at t þ 1/2 (half time step) are used in thepressure term of Eqs. (1) and (2), to calculate horizontal velocities(again, one of the velocity components is calculated explicitly andthe other is calculated implicitly). The pressure term has a baro-tropic parcel that results from differences in water elevation and abaroclinic parcel that results from water density differences. Af-terwards, vertical velocities are calculated with the continuityequation from the bottom till the surface. At the surface layer, thenumerical solution of Eq. (3) is used to obtain a final estimate forthe water level (xtþ1
ijk ). Calculated velocities are then used in thetransport equation to calculate the concentration of dissolved orparticulate substances (5).
In this model there are two drag terms: the first drag term inboth Eqs. (6) and (7) is bottom drag (computed implicitly for sta-bility) whereas the second drag term results from drag exerted by abody within the water (for example: aquaculture leases). Theformer term is computed only for bottom cells, whereas the latter iscomputed for cells where mussel rafts are located. This drag iscalculated as described in Morrison et al. (1950):
D ¼ 12r$u2$Cd$d$l (6)
where Cd, d and l were defined above.To get a force per unit of mass (acceleration), similar to the other
parcels of both equations, it is necessary to divide this equation bythe mass of the water contained in a certain volume, obtaining:
D ¼ 12
Cd$u2$r$d$lrV
⇔Cd$u2$d$l
2V(7)
The implementation of this drag termwas necessary to take intoaccount the drag effects of the hanging ropes from mussel rafts.Each raft has approximately 500 ropes descending to a depth of upto 12 m. Each rope has a diameter of up to 12 cm, when loaded withmussels. Cd may have values between 1 and 2 for flowsapproaching a cylinder (Fernandes et al., 2008). Additionally, theeffect of the ropes has to be adjusted to the grid resolution of themodel, i.e. defining the ropes density per horizontal grid cell.
In this model, flows are solved at the sides of the grid cells,whereas surface elevations and concentrations are calculated at thecells centre. Horizontal advection terms are calculated using a firstorder upwind scheme, whereas diffusion terms are based on acentral differences scheme. Vertical advection is computed with

Table 1Model simulations and corresponding abbreviations.
Period Simulation Abbreviation
July Standard July-StWithout rivers July-1Without wind July-2With northerly wind July-3With southerly wind July-4Without body drag due to the mussel rafts July-5
October Standard October-StWithout rivers October-1Without wind October-2With northerly wind October-3With southerly wind October-4
P. Duarte et al. / Estuarine, Coastal and Shelf Science 147 (2014) 42e5546
the Lax-Wendorf Total Variation Diminishing (TDV) advectionscheme described in James (1996), to reduce numerical diffusionand allow a better simulation of vertical stratification. Horizontaldiffusivities are used as a calibration parameter, whereas verticaldiffusivities are computed with a mixing length model followingNihoul (1982) and Santos (1995).
The model is forced by tidal height at the sea boundaries, localwinds and fresh water flows. It includes a wet-drying scheme forintertidal areas, which ceases using the advection termwhen depthis less than a threshold value to avoid numerical instabilities. Belowthis threshold the model computes all remaining terms e pressure,bottom drag and Coriolis e while water depth is greater than0.05 m. When this limit is reached, computations do not take placein a given cell until a neighbor cell has a higher water level,allowing then the pressure term to start ‘filling’ the ‘dry’ cell.Furthermore, the model may add and remove surface layers duringthe simulation: if water depth of the surface layer becomes smallerthan a predefined threshold, this layer is added to the second one.When the depth of this second layer becomes large enough is itdivided in two and the former surface layer is restored. This way itis possible to maintain a high resolution near the surface withoutnumerical problems arising when depth becomes too small.
This model uses a staggered grid with Cartesian vertical co-ordinates. The horizontal spatial resolution of the model grid usedin this work is 150 m, the vertical resolution is between less than1 m at the surface and up to approx. 15 m at the bottom layercorresponding to 107 lines� 121 columns� 15 vertical layers. Fig. 1depicts a GIS image showing a chart of the Ria de Ares-Betanzos,the location of sampling stations used for model initialization andvalidation and a white line with the limits of the model domain. Adetail of the bathymetry used in the model is also shown.
The model was implemented with EcoDynamo (Pereira et al.,2006), an object-oriented modeling software written in Cþþ.There are different objects to simulate hydrodynamic, thermody-namic and biogeochemical processes and variables. The shellinterface allows the user to choose among different models and todefine the respective setups e time steps, output formats (file,graphic and tables), objects to be used and variables to be visual-ized. The list of objects, variables and parameters of model equa-tions are stored in specific files. Objects may communicate amongthem for data exchange. In the present work the following objectswere used: (i) Tide object, to simulate water level at the seaboundaries, using harmonics for A Coru~na (cf. e Methodology e
Available data); (ii) Air temperature object, storing air temperaturedata; (iii) Wind object, storing wind velocities and directions; (iv)Light object, storing solar radiation data; (v) Water temperatureobject, for water temperature calculation following the equationsdescribed in Portela and Neves (1994); (vi) Three-dimensionalhydrodynamic object, to solve the hydrodynamic equationsmentioned above. The first four objects act as forcing functions forboth water temperature and hydrodynamic calculations.
EcoDynamo includes objects for several biogeochemical pro-cesses and variables and it has been used to simulate coastal lagoonand estuarine ecosystems, and also specific species (e.g. Duarteet al., 2007, 2012; Serpa et al., 2013; Azevedo et al., 2014). There-fore, it was developed seeking a compromise regarding the detailused to simulate the various physical, chemical and biologicalprocesses. The implementation of the model described here,focusing on the hydrodynamic processes, is a first step toward anecosystem model of the Ria de Ares-Betanzos.
2.3.1. SimulationsSimulations were run for 9e31 July and for 15 Octobere20
November 2007 for comparison with field data and also with re-sidual flow estimates obtained by Villegas-Ríos et al. (2011) with a
transient 2-D kinematic box model. Two simulations, hereafternamed as “standard” were used for model validation. These simu-lations were forcedwith available meteorological data for the studyperiod to be as realistic as possible. Afterwards, simulations wererun without river flows or without wind or with a wind blowingalways from the north or always from the south. Furthermore,simulations were run without taking into account the body dragexerted by the hanging ropes of mussel rafts. In all cases, only oneconditionwas tested at each time. Comparing standard simulationswith those without river flows allows estimating the relativeimportance of continental runoff in establishing the positive re-sidual circulation pattern. Comparing standard simulations withthose without wind and with those with a wind oriented in theNorth-South direction allows understanding the relative impor-tance of local wind forcing on the observed residual circulation.Finally, comparing standard simulations with thosewithout musselrafts body drag allows estimating the effect of the mussel farms onthe circulation of the ria. Table 1 synthesizes the set of simulationscarried out in this study and corresponding abbreviations.
2.3.2. ValidationFor the purposes of model validation, field data collected in July
and October 2007 were used to compare with July and Octoberstandard simulations (see above and Table 1). Current velocity timeseries obtained at stn 3 (Fig. 1) were compared with model results.A correspondence had to be established between water layersmonitored by the ACDP current meter and model layers. Accord-ingly, model predicted velocities were averaged for layers: (i) 1 to 5for comparisonwith current meter surface layer data; (ii) 6 to 8, forcomparison with current meter intermediate layer data; (iii) 9 to12, for comparison with current meter deeper layer data. Further-more, vertical temperature and salinity profiles available for thesame periods were also compared with those obtained with themodel. However, since there was no available salinity and watertemperature data along the sea boundary for the simulation period,it was not possible to do a realistic simulation for these variables.Therefore, available data for the outermost station (stn 4, referFig. 1) at the starting simulation dates were assumed for the wholesimulation period.
The overall correspondence between data records and simu-lated values was analyzed using Model II linear regression analysis,as suggested by Laws and Archie (1981), with the major axisregression method as recommended by Mespl�e et al. (1996) anddescribed in Sokal and Rohlf (1995). ANOVA was used to test thevariance explained by the model. Furthermore, several efficiencycriteria were used: the root mean square error (RMSE), the Nash-Sutcliffe efficiency (E) (Nash and Sutcliffe, 1970), the index ofagreement (d) (Wilmott, 1981), their modified versions E1(Wilmott, 1981) and d1 (Krause et al., 2005), respectively, and the

Table 2Measures of reliability synthesized in Allen et al. (2007).
Excellent Very good Good Poor
Nash Sutcliffe model efficiency (E) (Nash and Sutcliffe, 1970)and Mar�echal (2004) for quality level criteria
>0.65 0.65e0.5 0.5e0.2 <0.2
Very good Good Reasonable Poor
Cost function (CF) (OSPAR Commission, 1998) �1 1e2 2e5 �5Cost function with quality criteria according to Radach and Moll (2006) 2e3 �3
Fig. 3. Predicted and observed u (eastewest) and v (northesouth) velocity components over a period of 550 h, from October 16th till November 7th 2007 at station 3 (cf. Fig. 1)between c.a. 6 and 12 m depth.
P. Duarte et al. / Estuarine, Coastal and Shelf Science 147 (2014) 42e55 47
cost function (CF) (OSPAR Commission, 1998). Whenever availablein the literature, qualitative criteria were adopted (Table 2).
3. Results
3.1. Model performance
Fig. 3 shows predicted and observed u and v velocity compo-nents at stn 3 for the standard October simulation and for the in-termediate layers (Fig. 3). Model simulations fit well with the
measured data for the intermediate and deeper layers but not forthe surface ones. Similar results were obtained for the July standardsimulation (not shown). Table 3 presents a synthesis of model IIlinear regression analysis between empirical and simulated data forboth velocity components, together with the results obtained forthe assortment of efficiency criteria defined in the methods section(Table 3). With the exception of results obtained for the surfacelayers, the slopes of the regression lines tend to be close to one andthe y-intercepts tend to be close to zero. Deviations of the formerfrom one would suggest that differences between model
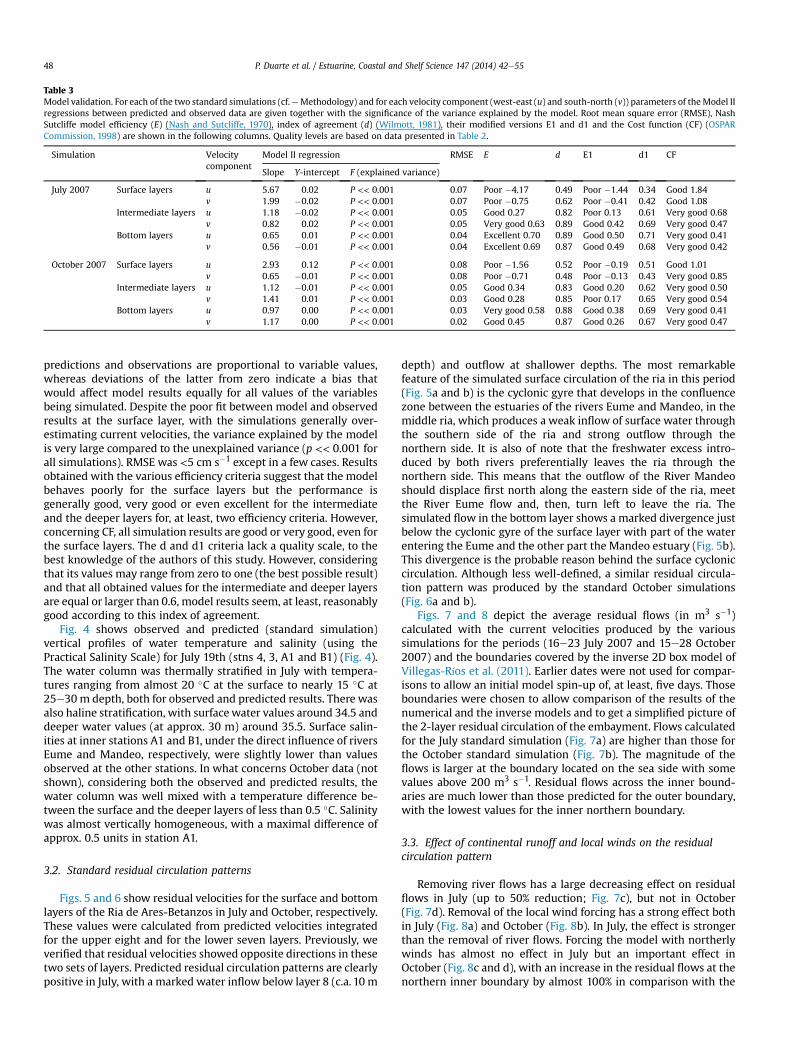
Table 3Model validation. For each of the two standard simulations (cf.eMethodology) and for each velocity component (west-east (u) and south-north (v)) parameters of theModel IIregressions between predicted and observed data are given together with the significance of the variance explained by the model. Root mean square error (RMSE), NashSutcliffe model efficiency (E) (Nash and Sutcliffe, 1970), index of agreement (d) (Wilmott, 1981), their modified versions E1 and d1 and the Cost function (CF) (OSPARCommission, 1998) are shown in the following columns. Quality levels are based on data presented in Table 2.
Simulation Velocitycomponent
Model II regression RMSE E d E1 d1 CF
Slope Y-intercept F (explained variance)
July 2007 Surface layers u 5.67 0.02 P << 0.001 0.07 Poor �4.17 0.49 Poor �1.44 0.34 Good 1.84v 1.99 �0.02 P << 0.001 0.07 Poor �0.75 0.62 Poor �0.41 0.42 Good 1.08
Intermediate layers u 1.18 �0.02 P << 0.001 0.05 Good 0.27 0.82 Poor 0.13 0.61 Very good 0.68v 0.82 0.02 P << 0.001 0.05 Very good 0.63 0.89 Good 0.42 0.69 Very good 0.47
Bottom layers u 0.65 0.01 P << 0.001 0.04 Excellent 0.70 0.89 Good 0.50 0.71 Very good 0.41v 0.56 �0.01 P << 0.001 0.04 Excellent 0.69 0.87 Good 0.49 0.68 Very good 0.42
October 2007 Surface layers u 2.93 0.12 P << 0.001 0.08 Poor �1.56 0.52 Poor �0.19 0.51 Good 1.01v 0.65 �0.01 P << 0.001 0.08 Poor �0.71 0.48 Poor �0.13 0.43 Very good 0.85
Intermediate layers u 1.12 �0.01 P << 0.001 0.05 Good 0.34 0.83 Good 0.20 0.62 Very good 0.50v 1.41 0.01 P << 0.001 0.03 Good 0.28 0.85 Poor 0.17 0.65 Very good 0.54
Bottom layers u 0.97 0.00 P << 0.001 0.03 Very good 0.58 0.88 Good 0.38 0.69 Very good 0.41v 1.17 0.00 P << 0.001 0.02 Good 0.45 0.87 Good 0.26 0.67 Very good 0.47
P. Duarte et al. / Estuarine, Coastal and Shelf Science 147 (2014) 42e5548
predictions and observations are proportional to variable values,whereas deviations of the latter from zero indicate a bias thatwould affect model results equally for all values of the variablesbeing simulated. Despite the poor fit between model and observedresults at the surface layer, with the simulations generally over-estimating current velocities, the variance explained by the modelis very large compared to the unexplained variance (p << 0.001 forall simulations). RMSE was <5 cm s�1 except in a few cases. Resultsobtained with the various efficiency criteria suggest that the modelbehaves poorly for the surface layers but the performance isgenerally good, very good or even excellent for the intermediateand the deeper layers for, at least, two efficiency criteria. However,concerning CF, all simulation results are good or very good, even forthe surface layers. The d and d1 criteria lack a quality scale, to thebest knowledge of the authors of this study. However, consideringthat its values may range from zero to one (the best possible result)and that all obtained values for the intermediate and deeper layersare equal or larger than 0.6, model results seem, at least, reasonablygood according to this index of agreement.
Fig. 4 shows observed and predicted (standard simulation)vertical profiles of water temperature and salinity (using thePractical Salinity Scale) for July 19th (stns 4, 3, A1 and B1) (Fig. 4).The water column was thermally stratified in July with tempera-tures ranging from almost 20 �C at the surface to nearly 15 �C at25e30 m depth, both for observed and predicted results. There wasalso haline stratification, with surfacewater values around 34.5 anddeeper water values (at approx. 30 m) around 35.5. Surface salin-ities at inner stations A1 and B1, under the direct influence of riversEume and Mandeo, respectively, were slightly lower than valuesobserved at the other stations. In what concerns October data (notshown), considering both the observed and predicted results, thewater column was well mixed with a temperature difference be-tween the surface and the deeper layers of less than 0.5 �C. Salinitywas almost vertically homogeneous, with a maximal difference ofapprox. 0.5 units in station A1.
3.2. Standard residual circulation patterns
Figs. 5 and 6 show residual velocities for the surface and bottomlayers of the Ria de Ares-Betanzos in July and October, respectively.These values were calculated from predicted velocities integratedfor the upper eight and for the lower seven layers. Previously, weverified that residual velocities showed opposite directions in thesetwo sets of layers. Predicted residual circulation patterns are clearlypositive in July, with a marked water inflow below layer 8 (c.a. 10 m
depth) and outflow at shallower depths. The most remarkablefeature of the simulated surface circulation of the ria in this period(Fig. 5a and b) is the cyclonic gyre that develops in the confluencezone between the estuaries of the rivers Eume and Mandeo, in themiddle ria, which produces a weak inflow of surface water throughthe southern side of the ria and strong outflow through thenorthern side. It is also of note that the freshwater excess intro-duced by both rivers preferentially leaves the ria through thenorthern side. This means that the outflow of the River Mandeoshould displace first north along the eastern side of the ria, meetthe River Eume flow and, then, turn left to leave the ria. Thesimulated flow in the bottom layer shows a marked divergence justbelow the cyclonic gyre of the surface layer with part of the waterentering the Eume and the other part the Mandeo estuary (Fig. 5b).This divergence is the probable reason behind the surface cycloniccirculation. Although less well-defined, a similar residual circula-tion pattern was produced by the standard October simulations(Fig. 6a and b).
Figs. 7 and 8 depict the average residual flows (in m3 s�1)calculated with the current velocities produced by the varioussimulations for the periods (16e23 July 2007 and 15e28 October2007) and the boundaries covered by the inverse 2D box model ofVillegas-Ríos et al. (2011). Earlier dates were not used for compar-isons to allow an initial model spin-up of, at least, five days. Thoseboundaries were chosen to allow comparison of the results of thenumerical and the inverse models and to get a simplified picture ofthe 2-layer residual circulation of the embayment. Flows calculatedfor the July standard simulation (Fig. 7a) are higher than those forthe October standard simulation (Fig. 7b). The magnitude of theflows is larger at the boundary located on the sea side with somevalues above 200 m3 s�1. Residual flows across the inner bound-aries are much lower than those predicted for the outer boundary,with the lowest values for the inner northern boundary.
3.3. Effect of continental runoff and local winds on the residualcirculation pattern
Removing river flows has a large decreasing effect on residualflows in July (up to 50% reduction; Fig. 7c), but not in October(Fig. 7d). Removal of the local wind forcing has a strong effect bothin July (Fig. 8a) and October (Fig. 8b). In July, the effect is strongerthan the removal of river flows. Forcing the model with northerlywinds has almost no effect in July but an important effect inOctober (Fig. 8c and d), with an increase in the residual flows at thenorthern inner boundary by almost 100% in comparison with the

Fig. 4. Predicted and observed (standard simulation) vertical profiles of water temperature and salinity in 19th July 2007, at several stations depicted in Fig. 1 (3, 4, A1 and B1), ninedays after simulation started.
P. Duarte et al. / Estuarine, Coastal and Shelf Science 147 (2014) 42e55 49
standard simulation. Regarding the results obtained with southerlywind forcing, there is an important increase in residual circulationacross the outer boundary both in July (Fig. 8e) and October(Fig. 8f). In the case of the latter, there is also a remarkable decreasein the residual circulation across the inner northern boundaryassociated with a change in the direction of the surface flow.
3.4. Effect of mussel farms on the residual circulation pattern
The percentage of reduction in residual velocities (Fig. 9),calculated from the differences between the simulation withoutmussel farms and the standard simulation, for the study period inJuly, suggests that body drag exerted by the mussel rafts may slow
the residual currents by almost 40%. Even though the flow reduc-tion is most remarkable in the areas with the larger concentrationof mussel rafts (refer also Fig. 1 regarding the location of musselrafts), changes are predicted for an area covering almost the wholeinner ria. In the regions surrounding mussel rafts, where currentvelocity reduction is higher (darker areas), there is an increase incurrent velocity of up to 5% (white areas) suggesting that drag ef-fects may enhance lateral shear.
4. Discussion
There were previous hydrodynamic modeling studies in theGalician rias (e.g. Taboada et al. (1998) in Ria de Vigo; Ruiz-

Fig. 5. Residual velocities predicted by the model for the simulations July e St, July-3 and July-4 (cf. e Table 1) integrated for the upper eight layers (left maps) and for the bottomseven layers (right maps) (see text).
P. Duarte et al. / Estuarine, Coastal and Shelf Science 147 (2014) 42e5550
Villarreal et al. (2002) in Ria de Pontevedra; Iglesias et al. (2008),Carballo et al. (2009), and Iglesias and Carballo (2009, 2010) inRia de Muros) but, to the best knowledge of the authors, this isthe first 3D hydrodynamic model applied to the Ria de Ares-Betanzos.
The model reproduces reasonably well the velocity field at theintermediate and bottom layers. However, despite the good resultsobtained with some validation criteria, such as the cost function,the agreement between measured and modeled currents is not sosatisfactory for the surface layer. Such a disagreement cannot beimputed exclusively to the performance of the model. It is well
known that the ability of the DCM12 to measure the current in thesurface layer is negatively affected in such a way that the mostenergetic tidal harmonics are not found in the surface layer(1e5 m), as could be expected, but in the second one (Míguez,2003; Piedracoba et al. 2005a). Whether this is a natural physicalprocess (wind/wave induced turbulence at the surface layer) or aninstrumental artifact is not clear yet. Because the DCM12 wasdesigned to reduce the side-lobe effect (Aanderaa et al. 1995;Aanderaa Instruments, 1999), this can cause artificial effects onsurface measurements that lead to underestimate of surface ve-locities (van Haren, 2001). It is also of note that the vertical

Fig. 6. Residual velocities predicted by the model for the simulations October e St, October �3 and October-4 (cf. e Table 1) integrated for the upper eight layers (left maps) and forthe bottom seven layers (right maps) (see text).
P. Duarte et al. / Estuarine, Coastal and Shelf Science 147 (2014) 42e55 51
stratification is reasonably well reproduced by the model both fortemperature and salinity.
Exchange flows calculated by Villegas-Ríos et al. (2011) acrossthe three boundaries defined in Fig. 7 with a 2-D kinematic boxmodel are significantly higher than the outputs of the standardsimulations. Although a 2-D positive residual circulation pattern isshown by both the inverse and the numerical model, the values ofthe former are from twofold (in July) to tenfold (in October) largerthan the latter. It should be noted that the 2-D box model ofVillegas-Ríos et al. (2011) was based on the integration ofsimplified versions of the equations of continuity (4) and salinityconservation (5):
QS ¼ QB þ QR þ P � E (8)
VDSDt
¼ QBSB � QSSs (9)
where QB, QS, QR, P and E (m3s�1) are, respectively, the horizontalbottom and surface subtidal flows at the open boundary of each ofthe 3 boxes defined in Figs. 7 and 8, continental runoff, precipita-tion and evaporation, between two consecutive surveys. Ss and SB(kg m�3) are the salinities at the bottom and surface layers of eachboundary, averaged over two consecutive surveys. To obtain Ss andSB, they used the salinity profiles collected on each survey and

Fig. 7. Predicted daily averaged residual flows (m3 s�1) for both the July and the October simulations (July-St, July-1, October-St and October-1) (cf. e Table 1), for part of the periodcovered by the work of Villegas-Ríos et al. (2011) (dates shown at the top of the panels) and for the boundaries of their box-model. Surface and bottom values were integrated for theupper eight and for the lower seven layers, respectively.
P. Duarte et al. / Estuarine, Coastal and Shelf Science 147 (2014) 42e5552
assumed that this salinity was representative for the whole crosssection that defines the boundary of each box. This is equivalent toassume that the water flow is homogeneous throughout each crosssection. However, the standard model simulations (Figs. 5 and 6)predicts a marked lateral gradient in the residual circulation,mainly in the middle ria, where the predicted flows through thenorthern side of the embayment are an order of magnitudestronger than through the southern side. Furthermore, there arecases where there is an inflow of surface water through thesouthern side resulting in the cyclonic gyre previously described.
Considering that P and E were negligible during both studyperiods (Villegas-Ríos et al., 2011) 8 may be simplified to:
QS ¼ QB þ QR (10)
Inserting (10) into (9) and solving for QB:
QB ¼ V DSDt þ QRSSSB � SS
(11)
Eq. (11) implies that very small differences in bottom and sur-face salinities will lead to very high bottom flow estimates and,consequently, to very high surface flow estimates. Therefore, whenwater is weakly stratified, as in October 2007, higher flow estimatesare more likely to be obtained. Therefore, probably, the disagree-ment between the results of the kinematic and the numericalmodel should be more due to the assumptions made to run thekinematic model than to a failure of the numerical model toreproduce the circulation pattern of the ria.
In support of the model results there are some indirect evi-dences: i) despite that almost 100% of the adult mussels are locatedin the mussel farms of the southern side of the ria, the site wheremussel seeds are collected more efficiently is the northern outerside of the ria (Peteiro et al., 2011). The surface circulation patternpredicted by the model would explain this dislocation between thesite of massive gamete production and the site of massive larvae
settlement; ii) despite the closeness of the mussel farm area ofArnela to the mouth of the River Mandeo, surface salinities at thatsite are not coupled to the Mandeo river flow (Isabel et al., inpreparation). This is consistent with the preferential displacementof the freshwater discharged by the River Mandeo to the North, tomeet the outflow of the river Eume suggested by the model sim-ulations; iii) If the current velocity profile in the central segment ofthe riawas representative of thewhole cross section, the renewal ofthis embayment would be from two to tenfold faster than predictedby themodel, which would be hardly compatible with the observedwarming of the surface layer and the recurrent closure of musselcultivation areas because of the occurrence of harmful microalgaecharacteristic of highly stratified sites with very low flushing rates(�Alvarez-Salgado et al., 2011).
Concerning the modeled residual flows, differences betweeninput and output values are expected to be matched by river flows.However, when inputs and outputs are compared in Figs. 7 and 8there are situations when the former are larger than the latter.This is not the result of some violation of the conservation law, butjust the result of the net changes in water height along the periodsused to calculate residual flows. In fact, tests conducted for longerperiods when initial and final heights were similar confirmed thatthe model is conservative.
As expected in partially mixed estuaries, a double-layered pos-itive residual pattern has been observed or predicted with modelsfor several Galician rias, with water flowing seaward in a surfacelayer and upstream in a bottom layer (e.g. Taboada et al. (1998) forRia de Vigo; Ruiz-Villarreal et al. (2002) for Ria de Pontevedra;Iglesias and Carballo (2010) for Ria de Muros). In some cases, anegative circulation has been observed, as in Ria de Muros, whendenserwater accumulated in the inner part of the estuary (deCastroet al., 2004) or a three layer circulation was predicted under SSWwinds, with inflow in the surface and bottom layers and outflow inthe intermediate layer (Iglesias and Carballo, 2010). The importanceof tide induced circulationwas emphasized by (Iglesias et al., 2008)for Ria de Muros.

Fig. 8. Predicted daily averaged residual flows (m3 s�1) for both the July and the October simulations (July-2, July-3, July-4, October-2, October-3 and October-4) (cf. e Table 1), forthe part of the period covered by the work of Villegas-Ríos et al. (2011) (dates shown at the top of the panels) and for the boundaries of their box-model. Surface and bottom valueswere integrated for the upper eight and for the lower seven layers, respectively.
P. Duarte et al. / Estuarine, Coastal and Shelf Science 147 (2014) 42e55 53
The comparison of July 2007 simulations with and without riverflows (cf. Table 1) suggests the importance of the latter in the in-tensity of residual circulation during that period. However, a similarcomparison with the October 2007 simulations suggests theopposite. This is an obvious consequence of the larger river flows inJuly 2007 (average ¼ 5.7 m3 s�1) compared with those of October2007 (average ¼ 2.8 m3 s�1) (c.f. e Fig. 2). The comparison of Julyand October simulations with and without the wind effect suggeststhe strong effect of the wind forcing, especially in the July simu-lation. Therefore, it may be concluded that it is hard to generalizeon the relative weight of these two potentially important forcingmechanisms that will change as a function of their respectivemagnitude. However, within the ranges covered by the presentstudy periods and model simulations it seems that local wind havethe potential for a larger effect on the intensity of input/outputresidual flows than the river outputs.
When the standard simulations are compared with those witha persistently meridional wind (Figs. 5e8), model results suggestthat southerly winds have a stronger effect on residual circulation,increasing the intensity of the input/output flows across the outerboundary. Again, the differences in the patterns obtained for Julyand October are a result of the large differences in wind velocityfor both periods. In the case of October, northerly winds seem tohave an effect of blockage of the residual circulation along the
outer boundary (Fig. 6): both surface and bottom residual veloc-ities under persistent northerly wind produce a strong south-westward current along the outer boundary of the model, pre-venting the exchange between the ria and the adjacent shelf.However, it is important to keep in mind that this effect could bemerely an artifact resulting from the close location of the seaboundary that prevents the integration of mesoscale effects onmodel dynamics rather than a real phenomenon. Possibly, theorientation of this ria implies an influence of meridional windsslightly different from that observed for the rias Baixas that areperpendicular to the shore (Fig. 1). In Ares-Betanzos, a perfectlymeridional northerly wind would force the water towards thesouth-western margin, possibly explaining the above mentionedblockage of the circulation. Such an effect would not be observedwith a perfectly meridional southerly wind because most of thenorth-western boundary is open and, therefore, the model doesnot receive the feedback of the interaction of water circulationwith land boundaries.
The impact of mussel cultivation on hydrodynamics maycorrespond to large reductions in residual current velocities (up to40%) suggesting the potential for mussel rafts to influence waterflows and, therefore, water and food renewal for the cultivatedspecies. This is a potentially negative feedback to the cultivationprocess, in line with findings by other authors. Grant et al. (1998)

Fig. 9. Percent differences in residual velocities integrated over time and depth be-tween simulations with and without mussel raft body drag (see text). Upper panel andlower panels: average results integrated for the upper eight layers and the lower sevenlayers, respectively.
P. Duarte et al. / Estuarine, Coastal and Shelf Science 147 (2014) 42e5554
applied the methodology of drag calculation within a kelp forest,described by Jackson and Winant (1983), to estimate drag exertedby mussel rafts in Saldanha Bay (South Africa). Grant and Bacher(2001), working with a two-dimensional vertically integratedfinite element model to simulate current velocities in Sungo Bay(China), used Manning coefficients of 0.03 and 0.15 for non-aquaculture and aquaculture areas, respectively, to account forthe slowdown effects of aquaculture structures on the flow. Thesame approach was followed by Duarte et al. (2003) for the sameecosystem. Shi et al. (2011) estimated that body drag exerted bykelp cultivation in Sungo Baymay cause a 40% reduction on averagespeed of surface current, using a similar approach to the onedescribed in the present study. Delaux et al. (2011) used a 2D highresolution computational fluid dynamics model to investigate theinfluence of block spacing and angle in suspended shellfish long-line cultures and obtained flow reductions of up to 25%. In arecent paper, Piedracoba et al. (2014) reported lower current ve-locities in the areas with the larger concentration of rafts in Ria deAres-Betanzos which is consistent with the results obtained in thepresent study. However, these authors could not separate the effectof the rafts from other effects such as bathymetric differences be-tween sites.
5. Conclusions
In this work a 3D hydrodynamic model was implemented forthe Ria de Ares-Betanzos and validated with empirical data oncurrent velocities, using a suite of different criteria, and also bycomparing observed and predicted vertical salinity and tempera-ture profiles. Results from model simulations suggest the existenceof a cyclonic gyre that develops in the confluence zone between theestuaries of the rivers Eume and Mandeo, in the middle ria,consistent with empirical evidence on mussel larval dispersion.Furthermore, residual circulation seems to be always positive witha bottom inflow and a surface outflow, irrespective of local windregime and as a probable result of river flows and the geographicorientation of this system, unlike what has been observed in riasBaixas to the south of Cape Fisterra. Substantial reduction of thesubtidal circulation of the Ria de Ares-Betanzos has been predictedbecause of the presence of mussel farms, not only locally, but at thescale of thewhole embayment. A reduction of the flowwould affectnegatively the carrying capacity of the mussel farms and wouldfavor the occurrence of harmful microalgae that proliferates instratified slowmoving environments. In this light, and claiming theprinciple of precaution, a cornerstone of the sustainable exploita-tion of marine living resources, we suggest incorporating this kindof numerical models to the scientific advice of policymakersinvolved in the regulation of extensive aquaculture.
Acknowledgments
The authors thank the PROINSA Mussel Farm and their staff fortechnical assistance. This study was sponsored by MICINN ESSMAproject (ACI2008-0780), and PROINSA-CSIC contract-project(CSIC0704101100001).
References
Aanderaa, I., Iversen, S., Forbord, S., 1995. Acoustic Doppler current meter: shallowwater harbor application. Sea Technol. 43.
Aanderaa Instruments, 1999. Doppler current meter, DCM 12, reliability and com-parison tests. In: Sensor & Systems. A Newsletter from Aanderaa Instruments.Aanderaa Instruments, p. 4.
Allen, J.I., Holt, J.T., Blackford, J., Proctor, R., 2007. Error quantification of a high-resolution coupled hydrodynamic-ecosystem coastal-ocean model: Part 2.Chlorophyll-a, nutrients and SPM. J. Mar. Syst. 68, 381e404.
�Alvarez-Salgado, X.A., Gago, J., Míguez, B.M., Gilcoto, M., P�erez, F.F., 2000. Surfacewaters of the NW Iberian Margin: upwelling on the shelf versus outwelling ofupwelled waters from the rias Baixas. Estuar. Coast. Shelf Sci. 51, 821e837.
Alvarez, I., Ospina-Alvarez, N., Pazos, Y., deCastro, M., Bernardez, P., Campos, M.J.,Gomez-Gesteira, J.L., Alvarez-Ossorio, M.T., Varela, M., Gomez-Gesteira, M.,Prego, R., 2009. A winter upwelling event in the Northern Galician Rias: Fre-quency and oceanographic implications. Estuar. Coast. Shelf Sci. 82, 573e582.
�Alvarez-Salgado, X.A., Figueiras, F.G., Fern�andez-Reiriz, M.J., Labarta, U., Peteiro, L.,Piedracoba, S., 2011. Control of lipophilic shellfish poisoning outbreaks byseasonal upwelling and continental runoff. Harmful Algae 10, 121e129.
Azevedo, I.C., Bordalo, A.A., Duarte, P., 2014. Influence of freshwater inflow vari-ability on the Douro estuary primary productivity: a modelling study. Ecol.Model. 272, 1e15.
Blanco, J., 1985. Algunas características del fitoplancton de Lorb�e (Ria de Ares yBetanzos) en primavera. Bol. Inst. Espa~nol Oceanogr. 2, 17e26.
Bode, A., Varela, M., 1998. Primary production and phytoplankton in three GalicianRias Altas (NW Spain): seasonal and spatial variability. Sci. Mar. 62, 319e330.
Carballo, R., Iglesias, G., Castro, A., 2009. Residual circulation in the Ria de Muros(NW Spain): a 3D numerical model study. J. Mar. Syst. 75, 116e130.
deCastro, M., G�omez-Gesteira, M., Alvarez, I., Prego, R., 2004. Negative estuarinecirculation in the Ria of Pontevedra (NW Spain). Estuar. Coast. Shelf Sci. 60,301e312.
Delaux, S., Stevens, C.L., Popinet, S., 2011. High-resolution computational fluid dy-namics modeling of suspended shellfish structures. Environ. Fluid Mech. 11,405e425.
Duarte, P., Meneses, R., Hawkins, A.J.S., Zhu, M., Fang, J., Grant, J., 2003. Mathe-matical modelling to assess the carrying capacity for multi-species culturewithin coastal waters. Ecol. Model. 168, 109e143.
Duarte, P., Azevedo, B., Ribeiro, C., Pereira, A., Falc~ao, M., Serpa, D., Bandeira, R.,Reia, J., 2007. Management oriented mathematical modelling of ria Formosa(South Portugal). Transit. Water Monogr. 1, 13e51.

P. Duarte et al. / Estuarine, Coastal and Shelf Science 147 (2014) 42e55 55
Duarte, P., Fern�andez-Reiriz, M.J., Labarta, U., 2012. Modelling mussel growth inecosystems with low suspended matter loads using a Dynamic Energy Budgetapproach. J. Sea Res. 67, 44e57.
Fernandes, L., Saraiva, S., Leit~ao, P.C., Pina, P., Santos, A., Braunschweig, F., Neves, R.,2008. Code, tests and presentation of results of small scale applications relevantfor field campaign data; parameterizations of modules e 3D model of a musselraft. Managing benthic ecosystems in relation to physical forcing and envi-ronmental constraints (MaBenE), EVK3-2001-00144.
Figueiras, F.G., Labarta, U., Fern�andez-Reiriz, M.J., 2002. Coastal upwelling, primaryproduction and mussel growth in the Ria Baixas of Galicia. Hydrobiologia 484,121e131.
Grant, J., Stenton-Dozey, J., Monteiro, P., Pitcher, G., Heasman, K., 1998. Shellfishculture in the Benguela system: a carbon budget of Saldanha Bay for raft cultureof Mytilus galloprovincialis. J. Shellfish Res. 17, 41e49.
Grant, J., Bacher, C., 2001. A numerical model of flow modification induced bysuspended aquaculture in a Chinese Bay. Can. J. Fish. Aquat. Sci. 58, 1e9.
Iglesias, G., Carballo, R., Castro, A., 2008. Baroclinic modelling and analysis of tide-and wind-induced circulation in the Ria de Muros (NW Spain). J. Mar. Syst. 74,475e484.
Iglesias, G., Carballo, R., 2009. Seasonality of the circulation in the Ria de Muros(NW Spain). J. Mar. Syst. 78, 94e108.
Iglesias, G., Carballo, R., 2010. Effects of high winds on the circulation of the using amixed open boundary condition: the Ria de Muros, Spain. Environ. Model.Softw. 25, 455e466.
James, I.D., 1996. Advection schemes for shelf sea models. J. Mar. Syst. 8, 237e254.Jackson, G.A., Winant, C.D., 1983. Effect of a kelp forest on coastal currents. Con-
tinen. Shelf Res. 2, 75e80.Krause, P., Boyle, D.P., B€ase, F., 2005. Comparison of different efficiency criteria for
hydrological model assessment. Adv. Geosci. 5, 89e97.Labarta, U., Fern�andez-Reiriz, M.J., P�erez-Camacho, A., P�erez-Corbacho, E., 2004.
Bateeiros, Mar, Mejill�on. Una Perspectiva Bioecon�omica (Serie Estudios Sec-toriales). Fundaci�on CaixaGalicia, A Coru~na, Espa~na.
Laws, E.A., Archie, J.W., 1981. Appropriate use of regression analysis in marinebiology. Mar. Biol. 65, 99e118.
Mar�echal, D., 2004. A Soil-based Approach to Rainfall-runoff Modelling in Unga-uged Catchments for England and Wales. PhD Thesis. Cranfield University.
Mari~no, J., Campos, M., Nunes, M., Iglesias, M., 1985. Variaci�on estacional de losfactores ambientales y del fitoplancton en la zona de Lorb�e (Ria de Ares yBetanzos) en 1978. Bol. Inst. Espa~n. Oceanogr. 2, 88e99.
Mespl�e, F., Trousselier, M., Casellas, C., Legendre, P., 1996. Evaluation of simplestatistical criteria to qualify a simulation. Ecol. Model. 88, 9e18.
Míguez, B.M., 2003. Descripci�on din�amica de la circulaci�on en dos rias Baixas: Vigoy Pontevedra. Ph.D. Thesis. Universidade de Vigo, Vigo, Spain.
Morrison, J.R., O’Brien, M.P., Johnson, J.W., Schaaf, S.A., 1950. The forces exerted bysurface waves on piles. Petrol. Trans. AIME 189, 149e154.
Nash, J.E., Sutcliffe, J.V., 1970. River flow forecasting through conceptual models.Part I e a discussion of principles. J. Hydrol. 10, 282e290.
Navarro, E., Iglesias, J.I.P., Perez-Camacho, A., Labarta, U., Beiras, R., 1991. Thephysiological energetics of mussels (Mytilus galloprovincialis Lmk) fromdifferent cultivation rafts in the Ria de Arosa (Galicia, N.W. Spain). Aquaculture94, 197e212.
Nihoul, J.C.J., 1982. Hydrodynamics of Semi-enclosed Seas. Proceedings of the 13thInternational Liege Colloquium on Ocean Hydrodynamics. Elsevier Oceanog-raphy Series, vol. 34. Elsevier Scientific, Amsterdam, p. 555.
OSPAR Commission, 1998. Report of the modeling workshop on eutrophi-cation issues. 5e8 November, Den Haag, The Netherlands, OSPAR Report,86 pp.
Pereira, A., Duarte, A., Norro, A., 2006. Different modelling tools of aquatic eco-systems: a proposal for a unified approach. Ecol. Inform. 1, 407e421.
Peteiro, L.G., Labarta, U., Fern�andez-Reiriz, M.J., �Alvarez-Salgado, X.A., Filgueira, R.,Piedracoba, S., 2011. Influence of intermittent-upwelling on Mytilus
galloprovincialissettlement patterns in the Ría de Ares-Betanzos. Mar. Ecol. Prog.Ser. 443, 111e127.
P�erez-Camacho, A., Gonz�alez, R., Fuentes, J., 1991. Mussel culture in Galicia (N.W.Spain). Aquaculture 94, 263e278.
P�erez-Camacho, A., Labarta, U., Beiras, R., 1995. Growth of mussels (Mytilus edulisgalloprovincialis) on cultivation rafts: influence of seed source, cultivation siteand phytoplankton availability. Aquaculture 138, 349e362.
Piedracoba, S., �Alvarez-Salgado, X.A., Ros�on, G., Herrera, J.L., 2005. Short-timescalethermohaline variability and residual circulation in the central segment of thecoastal upwelling system of the ría de Vigo (northwest Spain) during fourcontrasting periods. J. Geophys. Res. 110 (C03018), 1e15.
Piedracoba, S., �Alvarez Salgado, X.A., Labarta, U., Fern�andez-Reiriz, M.J., G�omez, B.,Balseiro, C., 2014. Water flows through mussel rafts and their relationship withwind speed in a coastal embayment (Ria de Ares-Betanzos, NW Spain). Con-tinen. Shelf Res. 75, 1e14.
Pond, S., Pickard, G., 1983. Introductory Dynamical Oceanography. Elsevier Butter-worth-Heinemann, Oxford, p. 329.
Portela, L.I., Neves, R., 1994. Modelling temperature distribution in the shallow Tejoestuary. In: Tsakiris, G., Santos, M.A. (Eds.), Advances in Water ResourcesTechnology and Management. Balkema, Rotterdam, pp. 457e463.
Prego, R., Barciela, M.C., Varela, M., 1999. Nutrient dynamics in the Galician coastalarea (Northwestern Iberian Peninsula): do the Rias Bajas receive more nutrientsalts than the Rias Altas? Continen. Shelf Res. 19, 317e334.
Radach, G., Moll, A., 2006. Review of three-dimensional ecological modeling relatedto the North Sea shelf system. Part II: model validation and data needs. Oce-anogr. Oceanogr. Mar. Biol. Annu. Rev. 44, 1e60.
Ruiz-Villarreal, M., Montero, P., Taboada, J.J., Prego, R., Leit~ao, P.C., P�erez-Villar, V.,2002. Hydrodynamic Model Study of the Ria de Pontevedra Under EstuarineConditions. Estuar. Coast. Shelf Sci. 54, 101e113.
S�anchez-Mata, A., Gl�emarec, M., Mora, J., 1999. Physico-chemical structure of thebenthic environment of a Galician Ria (Ria de Ares-Betanzos, north-west Spain).J. Mar. Biol. Assoc. U.K. 79, 1e21.
Santos, A., 1995. Modelo hidrodinamico tridimensional de circulaç~ao oceanicaestuarina. PhD Thesis. Universidade T�ecnica de Lisboa, Lisbon, Portugal.
Serpa, D., Ferreira, P.P., Caetano, M., Cancela da Fonseca, L., Dinis, M.T., Duarte, P.,2013. A coupled biogeochemical-Dynamic Energy Budget model as a tool formanaging fish production ponds. Sci. Total Environ. 463e464, 861e874.
Shi, J., Wei, H., Zhao, L., Yuan, Y., Fang, J., Zhang, J., 2011. A physicalebiologicalcoupled aquaculture model for a suspended aquaculture area of China. Aqua-culture 318, 412e424.
SHOM e Service Hydrographique et Oc�eanographique de la Marine, 1984. Table desmar�ees des grands ports du Monde. Service Hydrographique etOc�eanographique de la Marine.
Sokal, R.R., Rohlf, F.J., 1995. Biometry: the Principles and Practice of Statistics inBiological Research, third ed. Freeman, New York, p. 887.
Souto, C., Gilcoto, M., Fari~na-Busto, L., P�erez, F.F., 2003. Modelling the residual cir-culation of a coastal embayment affected by wind driven upwelling: circulationof the Ria de Vigo (NW Spain). J. Geophys. Res. 108 (C11), 3340e3358.
Taboada, J.J., Prego, R., Ruiz-Villarreal, M., G�omez-Gesteira, M., Montero, P.,Santos, A.P., P�erez-Villar, V., 1998. Evaluation of the seasonal variations in theresidual circulation in the Ria of Vigo (NW Spain) by means of a 3D Baroclinicmodel. Estuar. Coast. Shelf Sci. 47, 661e670.
Torres-L�opez, S., Varela, R.A., Delhez, E., 2001. Residual circulation and thermoclinedistribution of the Ria de Vigo: a 3-D hydrodynamical model. Sci. Mar. 65(Suppl. 1), 277e289.
van Haren, H., 2001. Estimates of sea level, waves and winds from a bottom-mounted ADCP in a shelf sea. J. Sea Res. 45, 1e14.
Villegas-Ríos, D., �Alvarez-Salgado, X.A., Piedracoba, S., Ros�on, G., Labarta, U.,Fern�andez-Reiriz, M.J., 2011. Net ecosystemmetabolism of a coastal embaymentfertilised by upwelling and continental runoff. Continen. Shelf Res. 31, 400e413.
Wilmott, C.J., 1981. On the validation of models. Phys. Geogr. 2, 184e194.