A Model for Transit Design with Choice of Electric Charging System
16
Procedia - Social and Behavioral Sciences 87 (2013) 234 – 249 1877-0428 © 2013 The Authors. Published by Elsevier Ltd. Selection and peer-review under responsibility of SIDT2012 Scientific Committee. doi:10.1016/j.sbspro.2013.10.607 SIDT Scientific Seminar 2012 A model for transit design with choice of electric charging system Gaetano Fusco a,b *, Adriano Alessandrini a , Chiara Colombaroni a , Maria Pia Valentini c a CTL - Research Centre for Transport and Logistics, Sapienza Univ. of Rome, Via Eudossiana 18, Rome 00184, Italy b DICEA - Department of Civil, Constructional and Environmental Engineeering, Sapienza Univ. of Rome, Via Eudossiana 18, Rome 00184, Italy c ENEA, Unità Tecnica Efficienza Energetica-Mobilità Sostenibile, Casaccia, via Anguillarese 301, Roma Abstract The paper deals with the problem of transit system design for a mixed fleet of electric and internal combustion buses and introduces a model for the vehicle type choice that involves computation of lifetime internal and external cost. Unlike previous works focused on transit network design problem, this model assumes the set of routes as fixed. It introduces instead different fast charging alternatives and constraints related to battery autonomy, energy consumption and power transfer from the electricity grid. Results of a real-size numerical application carried out on a transport corridor in Rome are illustrated. Keywords: Transit network design; Battery electric buses; Fast charging; Lifetime external costs 1. Introduction Collective transport systems make a more efficient use of space and energy resources than the individual transport; therefore, they are commonly acknowledged as an effective means to face environmental and congestion problems that affect urban areas. However, the current reduction of economic resources does not allow to increase the quantitative level of transit supply and, on the contrary, requires a deep reorganization of the transit system. Thus, efficient transit design methodologies are necessary to avoid effectiveness drops in terms of level of service and ridership. On the other hand, the huge consumption of fossil energy sources requires a system design that looks out for energy and economic sustainability. Moreover, heavy air pollution of urban areas needs, other than demand-oriented policies, a reorganization of transit supply and a greater use of environmental low impact vehicles, like electric, hybrid and compressed natural gas (CNG) vehicles. Battery and plug-in electric vehicles are achieving a wide interest from industries, decision-makers and customers, and they are seen as a potential environmental friendly alternative to internal combustion engines. However, energy needs arising with * Corresponding author. Tel.: +39-06-44585128; fax: +39-06-44585774. E-mail address: [email protected] Available online at www.sciencedirect.com © 2013 The Authors. Published by Elsevier Ltd. Selection and peer-review under responsibility of SIDT2012 Scientific Committee. ScienceDirect
Transcript of A Model for Transit Design with Choice of Electric Charging System

Procedia - Social and Behavioral Sciences 87 ( 2013 ) 234 – 249
1877-0428 © 2013 The Authors. Published by Elsevier Ltd.Selection and peer-review under responsibility of SIDT2012 Scientific Committee.doi: 10.1016/j.sbspro.2013.10.607
SIDT Scientific Seminar 2012
A model for transit design with choice of electric charging system
Gaetano Fuscoa,b*, Adriano Alessandrinia, Chiara Colombaronia, Maria Pia Valentinic aCTL - Research Centre for Transport and Logistics, Sapienza Univ. of Rome, Via Eudossiana 18, Rome 00184, Italy
bDICEA - Department of Civil, Constructional and Environmental Engineeering, Sapienza Univ. of Rome, Via Eudossiana 18, Rome 00184, Italy c ENEA, Unità Tecnica Efficienza Energetica-Mobilità Sostenibile, Casaccia, via Anguillarese 301, Roma
Abstract
The paper deals with the problem of transit system design for a mixed fleet of electric and internal combustion buses and introduces a model for the vehicle type choice that involves computation of lifetime internal and external cost. Unlike previous works focused on transit network design problem, this model assumes the set of routes as fixed. It introduces instead different fast charging alternatives and constraints related to battery autonomy, energy consumption and power transfer from the electricity grid. Results of a real-size numerical application carried out on a transport corridor in Rome are illustrated. © 2013 The Authors. Published by Elsevier Ltd. Selection and peer-review under responsibility of SIDT2012 Scientific Committee.
Keywords: Transit network design; Battery electric buses; Fast charging; Lifetime external costs
1. Introduction
Collective transport systems make a more efficient use of space and energy resources than the individual transport; therefore, they are commonly acknowledged as an effective means to face environmental and congestion problems that affect urban areas. However, the current reduction of economic resources does not allow to increase the quantitative level of transit supply and, on the contrary, requires a deep reorganization of the transit system. Thus, efficient transit design methodologies are necessary to avoid effectiveness drops in terms of level of service and ridership. On the other hand, the huge consumption of fossil energy sources requires a system design that looks out for energy and economic sustainability. Moreover, heavy air pollution of urban areas needs, other than demand-oriented policies, a reorganization of transit supply and a greater use of environmental low impact vehicles, like electric, hybrid and compressed natural gas (CNG) vehicles. Battery and plug-in electric vehicles are achieving a wide interest from industries, decision-makers and customers, and they are seen as a potential environmental friendly alternative to internal combustion engines. However, energy needs arising with
* Corresponding author. Tel.: +39-06-44585128; fax: +39-06-44585774. E-mail address: [email protected]
Available online at www.sciencedirect.com
© 2013 The Authors. Published by Elsevier Ltd.Selection and peer-review under responsibility of SIDT2012 Scientific Committee.
ScienceDirect
235 Gaetano Fusco et al. / Procedia - Social and Behavioral Sciences 87 ( 2013 ) 234 – 249
the introduction of new electric vehicles on the transport network require a careful design of the energy distribution network and power stations (Farmer et al., 2010; Sundstrom et al., 2010; Shahidinejad et al., 2012). On the other hand, battery electric vehicles and plug-in hybrid vehicles constitute a distributed system for energy storage, which can be utilized to provide ancillary services and peak shaving to the electricity grid (Lund and Kempton, 2008). Thus, the two networks of transit and energy supply should be seen as an integrated system and more enhanced methods for transit network design should be developed accordingly. Such methods for transit network design should take into account total lifetime energy and environmental impacts of vehicles within an economic assessment of the transit system, as requested also by the recent European laws on public procurement of road vehicles (EC, 2009).
Transit network design has a vast literature body, which recently has been object of several comprehensive reviews. According to Kepaptsoglou and Karlaftis (2009), it includes the design of route layouts and the determination of associated operational characteristics such as frequencies, rolling stock types, and so on. It is common practice to divide the planning process into strategic, tactical and operational decisions. Scientific literature on transit network design typically deals with strategic decisions and focuses on the problems of design of routes. Although the choice of the size and types of the rolling stock is a very relevant issue for the strategic planning, as it affects both costs and performances of the transit system, it has not been included in the optimization problem formally, with exception of very few papers (among others: Baaj & Mahmassani, 1995; Bielli et al., 2002; Gholami & Mohaymany, 2011; Asadi Bagloe & Ceder, 2011; Beltran et al., 2012). Most authors determine the fleet size indirectly through the frequency optimization, under some kind of constraints on the total fleet size. In the most recent review on transit network design, Farahani et al. (2013) underline some gaps in the existing literature. As far as the approach to the problem formulation, they make two major remarks, concerning environmental issues, which are largely ignored, and the need for a time-dependent approach, which represents the long-term effects of strategic decisions involved in network design.
In fact, a time-dependent model has been introduced by Szeto et al. (2010), which provides an optimization framework for road network design considering the land-use transport interaction over time and allows the evaluation of the impacts of the network design on the related parties including landowners, toll road operators, transit operators, and road users. The model has been applied to a very simple network and does not optimize investments on rolling stock of the transit system. In the same way, very few papers introduced environmental issues in the objective functions of transit network design. Cipriani et al. (2006) linked variations of external costs to modal split; Beltran et al. (2012) extended that model and considered a mixed fleet of internal combustion and electric vehicles; Gallo et al. (2011) modeled external costs of car traffic and introduced an additional scheme for external costs internalization.
In this paper, we aim for dealing with the issues of strategic planning related to the assessment of long-term internal of external costs due to the introduction of different power-train technologies. Specifically, we extend the transit system design problem of a mixed electric and internal combustion fleet to deal with energy constraints related to different solutions for battery charging and power transfer from the electricity grid. We also introduce a rather general time-dependent cost model to evaluate lifetime impacts. Unlike previous works focused on transit network design (Beltran et al.; Cipriani et al.), we assume the set of routes as fixed and we aim at introducing constraints related to battery autonomy, energy consumption and charging times. Nevertheless, the problem formulation allows a straightforward implementation of usual metaheuristic algorithms to search for optimal route layout jointly with frequency optimization and fleet assignment to bus lines.
The paper is organized as follows. After this introduction, the next section provides a wider discussion of the problem, from different points of view concerning methodological, environmental and technological issues. The third section presents the mathematical formulation of the transit network design problem with energy supply constraints. Section 4 describes the results of the application to a real size case study related to a portion of the transit network of Rome. Finally, the conclusion summarizes main findings and recommendations for future applications.

236 Gaetano Fusco et al. / Procedia - Social and Behavioral Sciences 87 ( 2013 ) 234 – 249
2. Problem discussion
Transit system design for a mixed fleet of electric and internal combustion buses consists in determining the optimal composition of vehicle types and charging technologies as well as determining the optimal location of charging stations, that is: at deposits, at terminuses or at bus stops equipped for fast charging, if any. The types of batteries, vehicles and charging systems affect the design variables. Terminuses and bus stops equipped for battery charging both work during the day; that is, during the peak of the global energy urban consumption. Large fleets of electric vehicles might require new energy production stations; on the other hand, deposits work during the off-peak period, and would provide a more desirable time distribution of the energy consumption. However, such large consumption nodes might require investments for enlarging electric substations as well as for the final distribution network. Moreover, distributed charging facilities that provide frequent charging to vehicles would use smaller batteries and then would reduce the costs for vehicles procurement and maintenance. Thus, the transit network design problem for electric bus fleet has to be defined by considering the entire process of energy consumption, production, distribution and charging during the whole day.
2.1. Energy and environmental issues
In Italy, transport is responsible for more than 31% of the whole energy consumption (ENEA estimates, 2011). Most of the transport share of such consumption (2/3) is due to passenger mobility, which is concentrated in urban areas. According to the ‘National road transport emissions and consumption inventory 2010’ (ISPRA, 2010), urban buses consume only 2% of the total energy for urban mobility, but they emit almost 6% of total nitrogen oxides, due to a high incidence of diesel engines and a low rate of fleet rejuvenation. In 2010 the Italian urban bus fleet was more than 10 years old (ASSTRA & Hermes, 2011) and almost 15% of the urban buses were older than 14 years. As a consequence, more than 80% of the whole fleet was composed by older standards, from Euro 0 to Euro III. Investments in public fleets slacked off sensibly in the latest period, so that not only the average age of vehicles increased but also fleet amount reduced (-6% 2006 to 2010). Despite the present deficiencies in the supply system, an improvement in energy and environmental performances of public transport is required, in order to face accessibility, environmental and economic issues. Generally speaking, conversion to non-conventional energy sources can be more easily and quickly planned for public transport than for private cars, thanks to a direct control on fleet procurement and energy supplying. In fact, recent trends in public fleet composition by energy source show that the share of non-conventional vehicles increased, mainly for methane buses but also for electric ones that, in 2010, represented almost 2% of the whole fleet, while they were less than 1% just five years before (Table 1).
Table 1. Urban buses fleet composition in Italy by engine technology, 2006 – 2010 (Source: ASSTRA & Hermes, 2011)
2006 2007 2008 2009 2010
Diesel 89.68 88.62 88.4 87.93 87.63
Methane 6.82 8.37 8.77 9.22 9.53
LPG 0.21 0.39 0.36 0.37 0.23
Hybrid 1.24 0.74 0.66 0.66 0.57
Electric 0.98 1.11 1.18 1.18 1.79
Others 1.07 0.77 0.63 0.65 0.24

237 Gaetano Fusco et al. / Procedia - Social and Behavioral Sciences 87 ( 2013 ) 234 – 249
These figures show that fleet renewal, despite a scarcity of funds, is oriented towards alternative technologies and energy sources, even before UE Directive 33/2009 adoption in Italy. According to this normative, public procurement of new vehicles must take into account lifetime energy and environmental costs. As for the energy consumption, electric vehicles are much more efficient than ones equipped with internal combustion engines; engine efficiency passes from about 25% for conventional vehicles to 80-90% for electric vehicles (ISPRA, 2011). On the other hand, energy production is less efficient for electricity than for fossil fuels: in fact, energy expenditure for extraction, refinery and transportation of fossil fuels goes around 15%, while electricity production nowadays implies more than 55% of energy losses (for thermoelectric plants in Italy). As a matter of fact, even considering the whole Well-To-Wheel energy cycle (that is, considering the sum of Well-To-Tank and Tank-To-Wheel consumption), electric buses are more efficient than diesel and methane ones, as shown on the left of Fig. 1, with reference to medium size vehicles. Also in economic terms, energy costs of electric buses are the lowest within the considered technology set (see Fig. 1, on the right), with and without taxation (regarding this last feature, reductions of excise have been considered, as provided by Italian law for public transport).
0
0,5
1
1,5
2
2,5
3
3,5
4
Diesel Euro III midi Methane Electric
Uni
t ene
rgy
cons
umpt
ion
[kW
h/km
]
TTW WTT
0
5
10
15
20
25
30
35
40
Diesel Euro III midi Methane Electric
TTW
ene
rgy
cost
[eu
roce
nt/k
m] NET GROSS
Fig. 1. Tank-to-Wheel (TTW) and Well-to-Tank (WTT) specific energy consumption of urban buses by powertrain technology (on the left) and TTW specific energy costs, excluding (net) and including (gross) taxation (on the right) (Source: ENEA elaboration from ISPRA, 2011)
With regard to environmental aspects, battery electric vehicles, which do not emit any substances at tail pipe, have a lower overall amount of emissions than internal combustion vehicles, even when considering the whole energy cycles, as shown in Fig. 2, which reports upstream and downstream particulate matter (PM), nitrogen oxides (NOx) and CO2 emissions of medium size bus categories. More specifically, total NOx emissions of electric buses are less than 5% of diesel ones and less than 15% of methane ones. The overall particulate matter (PM) emitted by diesel buses is much higher than that of electric and methane powered ones. Moreover, most of diesel emissions are at tail pipe. This is a relevant issue, since external costs for PM are highly dependent on the land use. According to the European Handbook on transport environmental costs (Mailbach et al., 2008), one ton of PM10 emitted in Italy produces, on average: 48,000 euro of external costs in urban areas; 148,700 euro in metropolitan areas; 27,100 euro in extra-urban built areas and 6,700 euro in industrial areas (2000 values). Applying these factors to specific vehicle emissions, it can be estimated that PM external costs of diesel buses exceed electric and methane buses by many times.
Regarding CO2 emissions, differences among considered bus categories are not as evident as for PM and NOx, even if decarbonizing of electric power in Italy is gradually enlarging the gap between electric vehicles and internal combustion ones. By summing both emission and external cost factors, specific environmental costs for different urban bus technologies are reported on the right at bottom of Fig. 2, which highlights an impressive gap between conventional and electric vehicles.

238 Gaetano Fusco et al. / Procedia - Social and Behavioral Sciences 87 ( 2013 ) 234 – 249
In conclusion, as for energy, air pollution and climate change, electric buses result very appealing, mainly with respect to diesel ones. Moreover, electric vehicles are much quieter than internal combustion ones. On the other hand, disposal of exhaust batteries is an environmental drawback of electric mobility to be faced. Last but not least, possible electric vehicles diffusion –particularly Plug-in Electric Vehicles (PEVs)– causes some concerns about the load of the power distribution network. This is relevant for private transport, which total consumption levels are high enough to put electric system into crisis, especially if battery recharging superimposes to the present absorption by other demand sectors (industry, buildings, etc.). On the other hand, PEV batteries may constitute a significant reserve and may be used to provide storage capability for cheap energy produced by renewable sources and to supply auxiliary services to the grid (de Nigris et al., 2010). With regard to the public transport, whose energy consumption represents a small fraction of national total, nor relevant concerns neither opportunities for electric distribution system can be reasonably envisaged per se, even if analyses on energy demand (and its spatial and temporal distribution) within electric mobility scenarios must consider also this subset of transport sector in order to correctly evaluate possible demand peaks overlapping.
0
1
2
3
4
5
6
7
8
9
Diesel EURO III midi Methane Electric
NO
x U
nit e
mis
sion
[g
/km
]
TTW WTT
0
0,05
0,1
0,15
0,2
0,25
0,3
Diesel EURO III midi Methane Electric
PM
Uni
t em
issi
on
[g/k
m]
TTW WTT
0
0,2
0,4
0,6
0,8
1
Diesel EURO III midi Methane Electric
CO
2 U
nit e
mis
sion
[g
/km
]
TTW WTT
0
1
2
3
4
5
6
Diesel EURO III midi Methane Electric
Uni
t cos
t [
Eur
o ce
nt/k
m]
TTW WTT
Fig. 2. Tank-to-Wheel (TTW) and Well-to-Tank (WTT) specific emissions of urban buses by powertrain technology (on the top and bottom on the left) and NOx, PM and CO2 external costs of urban buses, by powertrain technology (bottom, on the right) (ENEA estimates)

239 Gaetano Fusco et al. / Procedia - Social and Behavioral Sciences 87 ( 2013 ) 234 – 249
As far as the past trend, a significant improvement in the efficiency of electricity production has been observed in the last years, as shown on the left in Fig. 3, and it is expected to continue in the next period, so that, even without any further vehicle innovation, WTW specific energy consumption of electric vehicles is being reduced. Moreover, renewable and clean sources should be introduced in electric production more widely, so that oil dependency and environmental impacts of the transport sector could slump in case of a wider electrification. As a matter of fact, since 2007 a higher and higher incidence of renewable sources for electricity production has been monitored in Italy, due to the requirements of reducing oil dependency and CO2 emissions of Member States; nowadays, about 25% of electricity power in Italy derives from renewable sources (mostly from hydroelectric plants, but with an increasing share of photovoltaic, wind and geothermal). Because of more efficient thermoelectric plants and a higher share of renewable energy sources, a perceptible reduction of specific was observed in the last two decades, as illustrated in the picture on the right of Fig. 3 with reference to the CO2.
Fig. 3. Net productivity of thermoelectric plants in Italy in the years from 2001 to 2010 (on the left) and specific CO2 emission of electric consumption in Italy, in the years from 1990 to 2010 (Source: ENEA and ISPRA, 2011)
2.2. Technology issues
Electric motors for vehicle traction have been in use for more than a century (train, tram and trolley-bus) and have reached levels of efficiency unreachable by internal combustion engines. However electric energy production and storage still remain, despite recent battery progresses, the Achilles’ heel which limits electric road-vehicles diffusion. The “pure electric” vehicles or BEVs (Battery Electric Vehicles) have batteries as on board energy storage and need recharging. Their use in public transport fleets has been limited so far by the weight problem. To increase power and autonomy of a BEV it is necessary to increase battery size and weight which limits the autonomy. Heavy weight BEVs are, for this reason, so far non-feasible. To increase the power and extend the range of electric vehicles several on-board technologies have been developed. Ranging from hybridization, in which all (full hybrids - HEV) or part (plug-in - PHEV) of the electricity used for traction is generated on board by an internal combustion engine to fuel-cell electric vehicles (FEV), in which energy is stored in compressed or liquefied hydrogen which is fed to a fuel cell to produce electricity when needed.
The development of fast charging technologies (40-50 kW power and 60-100 A current) opened new scenarios for BEVs. While in the past charging took several hours and needed to be done in depots either immobilizing the vehicles or removing the battery packs, fast charging allow quick refilling made at stops or terminuses allowing to increase the size of the vehicles (which no longer rely on batteries capable to guarantee a full day of work) and allowing to re-design the transport lines for BEVs, which can be made capable of supplying services virtually

240 Gaetano Fusco et al. / Procedia - Social and Behavioral Sciences 87 ( 2013 ) 234 – 249
impossible before. Flexible/distributed charging technologies are convenient for better spatial and temporal distribution which then needs for optimization.
The aim of the paper, which is to allow designing transport networks in an optimized way, requires to quantify accurately BEVs energy consumption. Energy consumptions are highly dependent on speed and slope profiles, so accurate energy consumption models are needed. Energy consumption for a single run depends on the line length, the road slope, passenger loads, the speed diagram and the auxiliaries (e.g. air conditioning) other than the vehicle type and the individual driver behavior; anyway averaging the consumption on the round trip for moderate slopes it is possible to approximately model the energy consumption as a function of the average speed. The conventional consumption factors –those present in Copert software (EC, 1999) and MEET or CorinAir literature (EEA, 2007)– do not apply to small battery electric vehicles at low speed, but experimental measurements made by CTL have been used to calibrate similar relations for this kind of vehicles (Fig. 4). Though very imprecise if used to measure instantaneous consumption, it proved to be reliable to measure the average consumption, which can then be used to model design scenarios.
Fig. 4. Dependence of the energy consumption factor from the average speed (experimental data collected on a fleet of Gulliver-Technobus in the framework of CTL-ENEA Smartcities project).
3. Problem formulation and solution
3.1. Mathematical formulation
Electric bus transit network design is formulated as an optimization problem, which consists in minimizing the overall lifetime cost of the transit system, including internal and external costs for energy provision, other than fleet investment and operating costs of transit service. Well-to-Wheel energy costs account for the external costs of the entire production and distribution process for each source of energy. Constraints include classical equations of energy and vehicular flow conservation as well as capacity constraints for charging and passenger loads.
The objective function is the sum of net present costs, which are composed by investment, maintenance, operating, external and users’ costs. These are indicated respectively as CI, CM, CO, CU and CE in equations from (1) to (5). The first two terms are the cost contributions of the different elements of the transit system and the network supply; namely: vehicles and electric facilities at depots, terminuses and bus stops. The last three cost components are related to the system performances. These are segmented by time period h in order to differentiate between peak and non-peak hours, for both the transport and the energy needs.

241 Gaetano Fusco et al. / Procedia - Social and Behavioral Sciences 87 ( 2013 ) 234 – 249
Operating costs are usually composed by the costs of drivers, energy consumptions, tires, lubricants, taxes, insurance and general costs. However, in this economic analysis, instead of splitting energy costs into operating (which are related to WTT segment) and external (which are related to WTT segment) costs, we compute the WTW energy consumption costs as a whole and we aggregate energy and environmental costs, by assuming the latter are proportional to the former. This general energy and environmental cost function, indicated as CE in equation (4), includes also noise costs, which are as usually assumed to be proportional to the distance covered, with factors depending on day or night hours as well as on urban or extra-urban environment (Maibach et al., 2008). Taxes and excises are ignored because they are just transfers between different members of society. Thus, operating costs CO account for the other costs except the energy. The cost of drivers is proportional to the total operating driving time, while other costs, for lubricants and tires consumption, are proportional to the total distance covered. General costs and other operating costs related to the vehicle use, like insurance costs, can be assumed to be proportional to the number of vehicles and so can be computed together with maintenance costs. Finally, users’ costs CU are proportional to the sum of the time spent by users onboard and the waiting time at bus stops and terminuses.
CI = cid Wd( )d =1
D
∑ + cit Wt( )z=1
Z
∑ + cis Ws( )s=1
S
∑ + cikmk
k=1
K
∑ (1)
CM = cmd Wd( )d =1
D
∑ + cmz Wz( )z=1
Z
∑ + cms Ws( )s=1
S
∑ + cmkmk
k=1
K
∑ (2)
CO = f jh δa, j la + tz, j
z=1
Z
∑a=1
A
∑⎛
⎝ ⎜ ⎜
⎞
⎠ ⎟ ⎟
j=1
J
∑h=1
T
∑ ⋅cd + f jh δa, j la δ j,kcok
k=1
K
∑a=1
A
∑j=1
J
∑h=1
T
∑ (3)
CE = f jh δa, j la δk, jcea
k va,hk , pa, j
h( )k=1
K
∑a=1
A
∑j=1
J
∑h=1
T
∑
(4)
CU = λ j pa, jh ta, j
h
a=1
A
∑ + β qs, jh ws, j
h
s=1
S
∑ + β qz, jh wz, j
h
z=1
Z
∑⎛
⎝ ⎜ ⎜
⎞
⎠ ⎟ ⎟
j=1
J
∑h=1
T
∑ (5)
Symbols in equations have the following meaning: CI: yearly investment costs for electric facilities and vehicles cid: unitary investment cost for electric facilities of power Wd at bus depot d ciz: unitary investment cost for electric facilities of power Wz at bus terminus z cis: unitary investment cost for electric facilities of power Ws at bus stop s cik: unitary investment cost for vehicles of type k CM: yearly maintenance costs for electric facilities and vehicles cmd: unitary maintenance cost for electric facilities of power Wd at bus depot d cmz: unitary maintenance cost for electric facilities of power Wz at bus terminus z cms: unitary maintenance cost for electric facilities of power Ws at bus stop s cmk: unitary maintenance cost for vehicles of type k CO: yearly operational costs for vehicles cd: hourly wage rate of bus drivers cok: unitary operating cost per km for vehicles of type k f h
j: frequency on line j at hourly time period h th
a,j: travel time on link a for bus line j at hourly time period h

242 Gaetano Fusco et al. / Procedia - Social and Behavioral Sciences 87 ( 2013 ) 234 – 249
thz,j: drivers’ waiting time at terminus z for bus line j at hourly time period h
la: length of link a δa,j = 1 if link a belongs to line j and 0 otherwise δk,j = 1 if vehicle of type k is assigned to line j and 0 otherwise CU: yearly users’ costs λj : value of time for users of line j β : weighting factor of waiting time with respect to onboard travel time ph
a,j: number of passenger load on link a for bus line j at hourly time period h qh
z,j: number of passengers waiting at terminus z for bus line j at hourly time period h qh
s,j: number of passengers waiting at bus stop s for bus line j at hourly time period h wh
s,j: passengers’ waiting time at bus stop s for bus line j at hourly time period h wh
z,j: passengers’ waiting time at terminus z for bus line j at hourly time period h CE: yearly environmental costs for electric vehicles cea
k: unitary environmental and energy costs on link a for vehicle of type k vh
a,k: commercial speed on link a for a vehicle of type k at hourly time period h h: hourly time period T: time period of study, covering the whole lifetime period for plants and vehicles D: number of depots Z: number of terminuses S: number of bus stops K: number of vehicle types J: number of bus lines A: number of links Constraints include equations of energy consumption (6) for all runs performed on each line j; equations of
vehicular flow conservation (7), which relates number of vehicles, operating speed and frequency for each bus line; constraints (8) on energy power rate, which require that the total energy consumed on each line be smaller than the maximum charge and time stops at each recharging station, located at terminuses, bus stops, depots. Waiting times at bus stops and terminuses (9) are determined by conditions on line frequency and scheduled charging time, which are dependent on the type of charger and battery.
L j = f jh δa, j la δk, j ga
k va,kh , pa, j
h( )k=1
K
∑a=1
A
∑h=1
H( j )
∑ (6)
m jh = f j
h δa, jlava, jh
a=1
A
∑ (7)
L j ≤ maxh m jh{ } δ j,dηdWdΔt j,d
d =1
D
∑ + f j δ j,sηsWsΔtss=1
S
∑h=1
H( j )
∑ + f j δ j,zηzWzΔtzz=1
Z
∑h=1
H( j )
∑ (8)
ts, jh = max
1
f jh,Δt j,s
⎧ ⎨ ⎪
⎩ ⎪
⎫ ⎬ ⎪
⎭ ⎪ tz, j
h = max1
f jh,Δt j,z
⎧ ⎨ ⎪
⎩ ⎪
⎫ ⎬ ⎪
⎭ ⎪ (9)
The following symbols have been introduced: Lj: Energy consumed for line j on an average day gk
a: unitary energy consumption for a vehicle of type k on link a mh
j: number of vehicles on service on line j at hourly time period h

243 Gaetano Fusco et al. / Procedia - Social and Behavioral Sciences 87 ( 2013 ) 234 – 249
vha,j: commercial speed on link a for a vehicle operating on line j at hourly time period h
δj,d = 1 if line j utilizes depot d and 0 otherwise δj,s = 1 if stop s belongs to line j and 0 otherwise δj,z = 1 if line j utilizes terminus z and 0 otherwise H(j): daily operating time of line j Wd: nominal power rate at depot d Ws: nominal power rate at stop s Wz: nominal power rate at terminus z ηd: efficiency of charger at depot d ηs: efficiency of charger at stop s ηz: efficiency of charger at terminus z Δtj,d: stopping time at depot d for buses of line j Δtd: average stopping time at stop s Δtj,z: average stopping time at terminus z for buses of line j
Fleet size for each type of vehicle k is determined by applying the equation (7) in the rush hour and obtaining so maxj{mh
j}. Optimal route frequency is computed by applying the so-called ‘square root rule’ (Mohring, 1976), which minimizes the total cost for both users and operators under the assumption of uniform arrival of passengers at bus stop:
f jh =
λ j δa, j pa, jh
a=1
A
∑
2 δ j,kcokk=1
K
∑ (10)
with the above defined meanings of the symbols.
3.2. Remarks on solution procedures
The long-term transit network design problem so defined is a classical mixed integer optimization problem of a non linear objective function with non linear constraints and mixed discrete–integer design variables. These are: composition of the bus fleet for vehicle type, energy storage and traction characteristics; bus route layout; line frequencies; locations and power of charging stations at deposits, terminuses and/or bus stops; assignment of vehicle types to different lines; assignment of lines operated by electric vehicles to charging stations.
Solution procedures for transit network design are usually based on problem specific heuristics or metaheuristic algorithms that allow simulating the bus network and computing their performances by applying even complex realistic models. A very recent review is reported in Farahani et al. (2013), which points out that the most used metaheuristics apply genetic algorithms; other solution methods in literature are ant colony algorithm and simulated annealing. We experienced genetic algorithms in previous works concerning transit network design with route layout problem (Cipriani et al., 2006), continuous transportation network design for signal settings (Colombaroni et al., 2009) as well as simulated annealing in continuous transportation network design for signal settings and traffic assignment problem (Cipriani & Fusco, 2002). Genetic algorithms were applied in the past for the selection of the best bus lines and revealed to be an effective solution procedure for discrete nonlinear optimization problems. They can be suitably extended to the present problem of choosing the
244 Gaetano Fusco et al. / Procedia - Social and Behavioral Sciences 87 ( 2013 ) 234 – 249
types of vehicle and the types and the locations of charging stations at bus stops, by minimizing the fitness function defined as the sum of terms from (1) to (4). Continuous variables, such as the power of charging facilities, the battery capacity and the line frequencies, can be solved through analytical optimization of each single sub-problem for each line independently, as done for the frequency in equation (10).
However, the main aim of the paper is not to find out the best possible solution, but to introduce a general methodology for strategic transit design and to compare different technology alternatives, which are –at the present– at a very early stage of development. With this aim in view, analyzing preset alternatives is more effective than the application of an optimization procedure, since it allows appreciating the role of the different design variables and identifying the most promising future lines of research.
4. Application to a real size case study
4.1. Network description
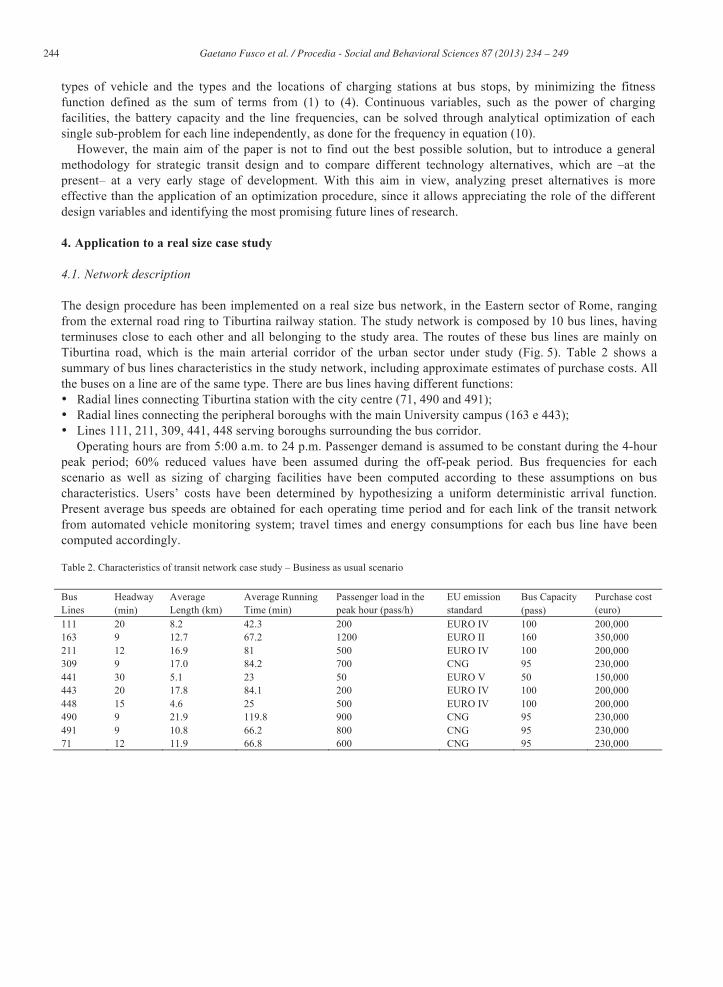
The design procedure has been implemented on a real size bus network, in the Eastern sector of Rome, ranging from the external road ring to Tiburtina railway station. The study network is composed by 10 bus lines, having terminuses close to each other and all belonging to the study area. The routes of these bus lines are mainly on Tiburtina road, which is the main arterial corridor of the urban sector under study (Fig. 5). Table 2 shows a summary of bus lines characteristics in the study network, including approximate estimates of purchase costs. All the buses on a line are of the same type. There are bus lines having different functions: • Radial lines connecting Tiburtina station with the city centre (71, 490 and 491); • Radial lines connecting the peripheral boroughs with the main University campus (163 e 443); • Lines 111, 211, 309, 441, 448 serving boroughs surrounding the bus corridor.
Operating hours are from 5:00 a.m. to 24 p.m. Passenger demand is assumed to be constant during the 4-hour peak period; 60% reduced values have been assumed during the off-peak period. Bus frequencies for each scenario as well as sizing of charging facilities have been computed according to these assumptions on bus characteristics. Users’ costs have been determined by hypothesizing a uniform deterministic arrival function. Present average bus speeds are obtained for each operating time period and for each link of the transit network from automated vehicle monitoring system; travel times and energy consumptions for each bus line have been computed accordingly.
Table 2. Characteristics of transit network case study – Business as usual scenario
Bus Lines
Headway (min)
Average Length (km)
Average Running Time (min)
Passenger load in the peak hour (pass/h)
EU emission standard
Bus Capacity (pass)
Purchase cost (euro)
111 20 8.2 42.3 200 EURO IV 100 200,000 163 9 12.7 67.2 1200 EURO II 160 350,000 211 12 16.9 81 500 EURO IV 100 200,000 309 9 17.0 84.2 700 CNG 95 230,000 441 30 5.1 23 50 EURO V 50 150,000 443 20 17.8 84.1 200 EURO IV 100 200,000 448 15 4.6 25 500 EURO IV 100 200,000 490 9 21.9 119.8 900 CNG 95 230,000 491 9 10.8 66.2 800 CNG 95 230,000 71 12 11.9 66.8 600 CNG 95 230,000

245 Gaetano Fusco et al. / Procedia - Social and Behavioral Sciences 87 ( 2013 ) 234 – 249
Fig. 5. Bus lines in the study area
4.2. Technology alternatives
While a much richer literature is available for internal combustion engines, experimental data on energy consumption of electric vehicles at different operating speeds are available for small buses only, as discussed in Section 2.2. Performances of large buses have been estimated by assuming that a correlation exists between consumption curves of electric and diesel buses of similar size. A conversion function has been calibrated by comparing experimental data of the small electric bus with the corresponding curve of a similar diesel bus. This conversion function has been then applied to the speed-consumption curve for medium and large diesel buses in order to obtain the corresponding relationship for medium and large electric buses. In addition, a linear dependence has been assumed between the energy consumption of the electric buses and the weight of the batteries, which is related in its turn to the battery capacity.
Several alternative scenarios have been considered, as summarized in Table 3, by introducing different assumptions on the number of lines operated by electric buses (9 lines in the scenarios from 1 to 4; 4 lines in scenarios 5 and 6) as well as on the charging technologies. In scenario 4, buses are equipped with 80kWh Li-ion batteries; fast charging occurs at depots during the night (with 30 kW power) and at terminuses (with 100 kW power) after each run for the time needed to store the energy required to either complete the next run or to reach the depot at the end of the operating hours. The commercial speed is re-determined according to the charging requirements. In other scenarios electric buses are equipped with ultracapacitors and very fast charging facilities are installed at both terminuses (60 kW in scenarios 2, 3 and 6; 100 kW in scenario 4; 120 kW in scenarios 1 and 5) and bus stops (100 kW in scenarios 2, 3 and 6; 200 kW in scenarios 1 and 5). Because of the larger size and weight of their battery, the buses equipped with 80kWh batteries are assumed to have 35% higher energy consumption with respect to buses equipped with 10kWh ultracapacitors. Dwell time at bus stops is assumed anyway to be sufficient to provide the bus with the energy charge needed to arrive at the next stop. Scenario 3 has been designed by assuming that one half of the bus stops were equipped with fast charging, so that the minimum dwell time is determined according to the distance to the next bus stop. In the other scenarios, with the exception
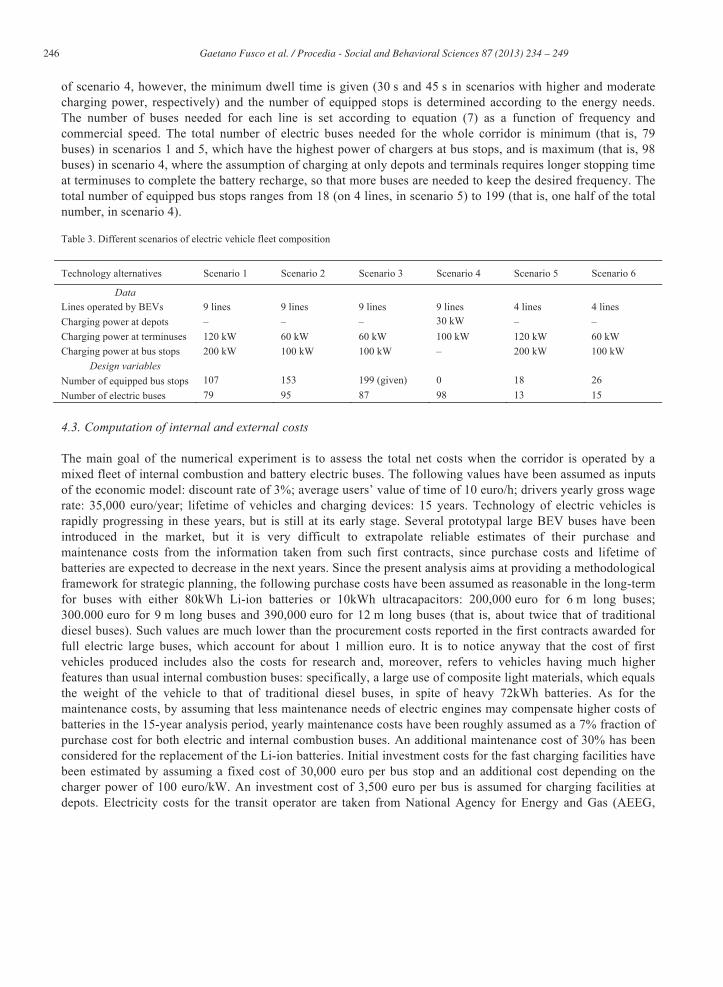
246 Gaetano Fusco et al. / Procedia - Social and Behavioral Sciences 87 ( 2013 ) 234 – 249
of scenario 4, however, the minimum dwell time is given (30 s and 45 s in scenarios with higher and moderate charging power, respectively) and the number of equipped stops is determined according to the energy needs. The number of buses needed for each line is set according to equation (7) as a function of frequency and commercial speed. The total number of electric buses needed for the whole corridor is minimum (that is, 79 buses) in scenarios 1 and 5, which have the highest power of chargers at bus stops, and is maximum (that is, 98 buses) in scenario 4, where the assumption of charging at only depots and terminals requires longer stopping time at terminuses to complete the battery recharge, so that more buses are needed to keep the desired frequency. The total number of equipped bus stops ranges from 18 (on 4 lines, in scenario 5) to 199 (that is, one half of the total number, in scenario 4).
Table 3. Different scenarios of electric vehicle fleet composition
Technology alternatives Scenario 1 Scenario 2 Scenario 3 Scenario 4 Scenario 5 Scenario 6
Data Lines operated by BEVs 9 lines 9 lines 9 lines 9 lines 4 lines 4 lines Charging power at depots – – – 30 kW – – Charging power at terminuses 120 kW 60 kW 60 kW 100 kW 120 kW 60 kW Charging power at bus stops 200 kW 100 kW 100 kW – 200 kW 100 kW
Design variables Number of equipped bus stops 107 153 199 (given) 0 18 26 Number of electric buses 79 95 87 98 13 15
4.3. Computation of internal and external costs
The main goal of the numerical experiment is to assess the total net costs when the corridor is operated by a mixed fleet of internal combustion and battery electric buses. The following values have been assumed as inputs of the economic model: discount rate of 3%; average users’ value of time of 10 euro/h; drivers yearly gross wage rate: 35,000 euro/year; lifetime of vehicles and charging devices: 15 years. Technology of electric vehicles is rapidly progressing in these years, but is still at its early stage. Several prototypal large BEV buses have been introduced in the market, but it is very difficult to extrapolate reliable estimates of their purchase and maintenance costs from the information taken from such first contracts, since purchase costs and lifetime of batteries are expected to decrease in the next years. Since the present analysis aims at providing a methodological framework for strategic planning, the following purchase costs have been assumed as reasonable in the long-term for buses with either 80kWh Li-ion batteries or 10kWh ultracapacitors: 200,000 euro for 6 m long buses; 300.000 euro for 9 m long buses and 390,000 euro for 12 m long buses (that is, about twice that of traditional diesel buses). Such values are much lower than the procurement costs reported in the first contracts awarded for full electric large buses, which account for about 1 million euro. It is to notice anyway that the cost of first vehicles produced includes also the costs for research and, moreover, refers to vehicles having much higher features than usual internal combustion buses: specifically, a large use of composite light materials, which equals the weight of the vehicle to that of traditional diesel buses, in spite of heavy 72kWh batteries. As for the maintenance costs, by assuming that less maintenance needs of electric engines may compensate higher costs of batteries in the 15-year analysis period, yearly maintenance costs have been roughly assumed as a 7% fraction of purchase cost for both electric and internal combustion buses. An additional maintenance cost of 30% has been considered for the replacement of the Li-ion batteries. Initial investment costs for the fast charging facilities have been estimated by assuming a fixed cost of 30,000 euro per bus stop and an additional cost depending on the charger power of 100 euro/kW. An investment cost of 3,500 euro per bus is assumed for charging facilities at depots. Electricity costs for the transit operator are taken from National Agency for Energy and Gas (AEEG,
247 Gaetano Fusco et al. / Procedia - Social and Behavioral Sciences 87 ( 2013 ) 234 – 249
2012); gasoil and CNG costs are taken from ISTAT official statistics. It is worth mentioning that in the economical analyses these values have to be computed without taxes and excises. Energy consumption and emission factors of pollutant emissions for internal combustion engines are taken from Copert model (EEA, 2011) as functions of speed, slope and load; unitary external costs of pollutants are set out by Directive 2009/33/EC. Unitary external costs of CO2 and noise for travelling 1 km in urban areas are taken directly from the European Handbook on Transport environmental costs (Maibach et al., 2008).
4.4. Numerical results
Results of the numerical computations are shown in Table 4. All scenarios exhibit comparable economic performances. Scenarios 1, 2 and 3, which introduce fast charging at bus stops on 9 lines, have lower total net present costs than the ‘business as usual’ scenario, with improvements up to 5%, in the case of scenario 1. However, introducing electric buses on only 4 lines (as in scenarios 5 and 6) increases the total costs, as it does not allow to share charging facilities among many vehicles and so does not exploit scale economies on the transit corridor. As expected, all ‘with project’ scenarios reduce environmental, energy and noise external costs, but require higher investment and maintenance costs. Larger benefits, in the order of 65% for environment and energy and of 80% for the noise, occur in the scenarios with 9 lines operated by electric buses. The corresponding values of the benefits reduce to 10% if only 4 lines are operated by electric buses. Slightly minor benefits are achieved in scenario 4 (55% less than in business as usual) because of heavier batteries, which determine also larger energy consumption and higher maintenance cost for battery substitution.
In all ‘with project’ scenarios users’ costs are slightly larger (from 4% to 6%) than in the ‘business as usual’ scenario, because of the longer stopping time at bus stops needed for battery recharging. Users’ costs are higher in scenarios 2 and 6, which assume weaker charging facilities and then need 45 s stopping times instead of 30 s, as it has been assumed in the other scenarios. Personnel costs depend on both the number of electric vehicles needed to supply the service scheduled, which is related on their turn to the commercial speed; that is, to the stopping time at bus stops for battery recharging, which is shorter in scenarios 1 (79 buses) and higher in scenario 4, which requires 98 buses to keep the scheduled headways. Intermediate results are obtained in the other scenarios, as reported in Table 3.
Although users’ costs are a very relevant fraction of total costs, the ranking of different ‘with project’ scenarios does not change if the analysis is limited to the environmental and the operator’s costs. Scenario 1 is still the most convenient, with a reduction of the net present costs of 17% with respect to the business as usual scenario. Scenario 3 reduces them as 11% and scenario 2 of 8%. In this case, which excludes users’ costs from the analysis, also scenario 4 and 5 would produce limited benefits, of 2% and 3%, respectively. It is worth noticing that users’ costs in scenario 5 are the same as in scenario 1. The drawback of scenario 5 is that introduction of electric vehicles on only few lines does not allow to exploit investments on charging facilities. Such a drawback becomes a clear disbenefit in scenario 6, when longer stops for recharging require reduce commercial speed and require even more investments for vehicles and bus stop charging facilities.

248 Gaetano Fusco et al. / Procedia - Social and Behavioral Sciences 87 ( 2013 ) 234 – 249
Table 4. Components of net present costs (millions of euro) for different design scenarios of electric fleet compositions defined in Table 3 and business as usual scenario, described in Table 2
Costs [millions of euro 2013]
Business as usual
Scenario 1 Scenario 2 Scenario 3 Scenario 4 Scenario 5 Scenario 6
Environment Net Present Cost €26 €9 €9 €9 €9 €25 €25
Energy Net Present Cost €60 €20 €20 €20 €27 €56 €56
Investment Net Present Cost €20 €46 €51 €50 €47 €27 €29
Maintenance Net Present Cost €1 €3 €3 €3 €3 €1 €2
Noise Net Present Cost €9 €2 €2 €2 €2 €8 €8
Personnel Net Present Cost €147 €140 €165 €153 €170 €140 €165
Users' Net Present Cost €342 €357 €357 €357 €357 €357 €357
Total Net Present Cost €606 €576 €606 €593 €616 €614 €642
5. Conclusions and further developments
The paper has dealt with the problem of introducing an electric bus fleet to operate some lines of a transit corridor in an urban area. Numerous assumptions have been introduced to estimate energy consumptions for medium and large electric buses, which are not yet available on the market. A mathematical model of lifetime net present costs for environment, energy, investment, maintenance, operations and users has been introduced. The model has been applied to simulate bus operations on the transit corridor along Tiburtina road in Rome, Italy, for different compositions of the electric bus fleet and recharging alternatives: at bus stops or at terminuses and depots. Results show that scenarios with electric vehicles have higher investment and personnel costs; however, they are compensated by lower environmental and energy costs, if chargers at bus stops have enough high power to limit both the number of equipped bus stops and the recharging time.
Due to the continuous technological progress on fast charging systems for large vehicles, results are affected by a large number of assumptions, so that further sensitivity analyses are worth being carried out to investigate how some technical and operational factors affect the performances of different kinds of vehicles and charging systems. As more accurate estimates on the technical factors will be available, the focus of research should be addressed to search for the best trade-off between the investment costs for vehicles and those for charging infrastructures at bus stops. Research topics will be also extended to compare bus operations by battery electric vehicles with those by different traction technologies like hybrid, plug-in hybrid and fuel cell. Furthermore, the model that computes the present cost of the transit network as a function of traction technology and charging infrastructure will be implemented into a general transit network optimization with continuous (frequency) and discrete (line routes, choice of type of vehicles and type of charging system) variables. Preliminary tests have highlighted the suitability of stochastic optimization algorithms like genetic and swarm, which revealed effective tools for extending the problem to determine line routes and the set of routes of the bus network.
Acknowledgements
Results presented in the paper belong to the joint research project Assessment of electricity needs ensuing from introduction of electric fleets for urban public transport and freight distribution carried out by ENEA and CTL at Sapienza University of Rome.

249 Gaetano Fusco et al. / Procedia - Social and Behavioral Sciences 87 ( 2013 ) 234 – 249
References
AEEG (2012). Tariffe di distribuzione - Periodo regolatorio 2012 - 2015. Italian Authority of Energy and Gas. Available at: http://www.autorita.energia.it/it/elettricita/distr.htm. Asadi Bagloee, S., & Ceder, A. A. (2011). Transit-network design methodology for actual-size road networks. Transportation Research Part B: Methodological, 45(10), 1787-1804. ASSTRA & Hermes (2011). Autobus e Investimenti 2011, Italy. Baaj, M. H., & Mahmassani, H. S. (1995). Hybrid route generation heuristic algorithm for the design of transit networks. Transportation Research Part C: Emerging Technologies, 3(1), 31-50. Beltran B., Carrese S., Cipriani E. & Petrelli M. (2009). Transit network design with allocation of green vehicles: a genetic algorithm approach, Transportation Research Part C, 17, 475–483. Bielli, M., Caramia, M., & Carotenuto, P. (2002). Genetic algorithms in bus network optimization. Transportation Research Part C: Emerging Technologies, 10(1), 19-34. Cipriani, E., & Fusco, G. (2002). Solution procedures for the global optimization of signal settings and traffic assignment combined problem, Proc.of the 3rd ICTTS Conference, Beijing, China, ASCE, ISBN: 0784406308. Cipriani E., Fusco G. & Petrelli M. (2006). A multimodal transit network design procedure for urban areas. Advances in Transportation Studies, Section A, 10, 5–20. Colombaroni, C., Fusco, G., & Gemma, A. (2009). Optimization of Traffic Signals on Urban Arteries through a Platoon-Based Simulation Model, in Proc. of the 11th WSEAS Int. Conf. Automatic Control, Modelling and Simulation, Istanbul, Turkey, WSEAS Press. de Nigris, M., Gianinoni, I., Grillo, S., Massucco, S. & Silvestro, F. (2010). Impact evaluation of plug-in electric vehicles (PEV) on electric distribution networks. 14th International Conference on Harmonics and Quality of Power (ICHQP), 1-6, 26-29. EC (1999). European Commission, MEET – Methodology for calculating transport emissions and energy consumption, Luxembourg: Office for Official Publications of the European Communities. EEA (2007). European Environment Agency, EMEP/CORINAIR Emission Inventory Guidebook – 2007, Technical Report no. 16/2007, Published December 06, 2007 (latest version). EEA (2011). European Environment Agency, COPERT – Computer Programme to Calculate Emissions from Road Transport, Published: Nov 08, 2011. http://www.emisia.com/copert/General.html. EC (2009). Directive 2009/33/EC of the European Parliament and of the Council of 23 April 2009 on the promotion of clean and energy-efficient road transport vehicles. Official Journal L 120 of 15.5.2009. Farahani, R. Z., Miandoabchi, E., Szeto, W. Y., & Rashidi, H. (2013). A review of urban transportation network design problems. European Journal of Operational Research, 229(2), 281–302 Farmer, C., Hines, P., Dowds, J., & Blumsack, S. (2010). Modeling the impact of increasing PHEV loads on the distribution infrastructure. In Proc. of 43rd IEEE Hawaii International Conference on System Sciences (HICSS), pp. 1-10. Gallo, M., Montella, B., & D’Acierno, L. (2011). The transit network design problem with elastic demand and internalisation of external costs: An application to rail frequency optimisation. Transportation Research Part C: Emerging Technologies, 19(6), 1276-1305. Gholami, A., & Mohaymany, A. S. (2011). Economic conditions for minibus usage in a multimodal feeder network. Transportation Planning and Technology, 34(8), 839-856. ISPRA (2010). Road Transport emissions National Inventory, Technical Report no. 124/2010, Italy. ISPRA (2011). Produzione termoelettrica ed emissioni di CO2, Technical Report no. 135/2011, Italy. Kepaptsoglou, K., & Karlaftis, M. (2009). Transit route network design problem: review. Journal of transportation engineering, 135(8), 491-505. Lund, H., & Kempton, W. (2008). Integration of renewable energy into the transport and electricity sectors through V2G. Energy Policy, 36(9), 3578-3587. Mailbach, M. et al. (2008). Handbook on estimation of external costs in the transport sector, Delft, 2008. Mohring, H. (1976). Transportation economics. Ballinger, Cambridge, MA, USA. Shahidinejad, S., Filizadeh, S., & Bibeau, E. (2012). Profile of charging load on the grid due to plug-in vehicles. IEEE Transactions on Smart Grid, 3(1), 135-141. Sundstrom, O., & Binding, C. (2010). Planning electric-drive vehicle charging under constrained grid conditions. In Proc. of IEEE International Conference on Power System Technology (POWERCON), pp. 1-6. Szeto, W. Y., Jaber, X., & O Mahony, M. (2010). Time Dependent Discrete Network Design Frameworks Considering Land Use. Computer Aided Civil and Infrastructure Engineering, 25(6), 411-426.