A MIXED ME - Open Collections
184
’TIS BETTER TO GIVE THAN RECEIVE?’ EXPLORING THE HEALTH-RELATED BENEFITS ASSOCIATED WITH DELIVERING PEER SUPPORT: A MIXED METHODS STUDY by Rowshanak Afshar MD, Mashhad University of Medical Sciences, 2012 A THESIS SUBMITTED IN PARTIAL FULFILLMENT OF THE REQUIREMENTS FOR THE DEGREE OF DOCTOR OF PHILOSOPHY in THE FACULTY OF GRADUATE AND POSTDOCTORAL STUDIES (Experimental Medicine) THE UNIVERSITY OF BRITISH COLUMBIA (Vancouver) August 2020 © Rowshanak Afshar, 2020
-
Upload
khangminh22 -
Category
Documents
-
view
0 -
download
0
Transcript of A MIXED ME - Open Collections

’TIS BETTER TO GIVE THAN RECEIVE?’ EXPLORING THE HEALTH-RELATED BENEFITS ASSOCIATED WITH DELIVERING PEER
SUPPORT: A MIXED METHODS STUDY
by
Rowshanak Afshar
MD, Mashhad University of Medical Sciences, 2012
A THESIS SUBMITTED IN PARTIAL FULFILLMENT OF
THE REQUIREMENTS FOR THE DEGREE OF
DOCTOR OF PHILOSOPHY
in
THE FACULTY OF GRADUATE AND POSTDOCTORAL STUDIES (Experimental Medicine)
THE UNIVERSITY OF BRITISH COLUMBIA
(Vancouver)
August 2020
© Rowshanak Afshar, 2020

ii
The following individuals certify that they have read, and recommend to the Faculty of Graduate and Postdoctoral Studies for acceptance, the dissertation entitled: ’Tis better to give than receive? Exploring the health-related benefits associated with
delivering peer support
Submitted by Rowshanak Afshar in partial fulfillment of the requirements for the
degree of Doctor of Philosophy in Experimental Medicine.
Examining Committee:
Dr. Tricia S. Tang, Department of Medicine, UBC
Supervisor
Dr. Diana Sherifali, School of Nursing, McMaster University
Supervisor Committee Member Dr. Pat Camp, School of Population and Public Health, UBC
Supervisor Committee Member Dr. Gary Poole, School of Population and Public Health, UBC
University Examiner Dr. Rosemin Kassam, School of Population and Public Health, UBC
University Examiner Additional Supervisory Committee Members:
Dr. Susan Cox, School of Population and Public Health, UBC
Supervisor Committee Member Dr. Martin Guhn, School of Population and Public Health, UBC
Supervisor Committee Member

iii
Abstract
BACKGROUND: The effects of peer support (PS) on clinical and psychosocial
outcomes has been extensively studied in patients with type 2 diabetes, but only
minimally examined in the peer leaders (PLs) who deliver support. This thesis’s
objectives are to: examine PLs’ sociodemographic and personality characteristics,
assess the clinical and psychological benefits of providing support; and identify
strategies to improve PS interventions.
METHODS: A sequential explanatory mixed-methods research design
approach was utilized. The studies conducted for this thesis were extensions of a
larger randomized controlled trial assessing the impact of PS on diabetes-related
health outcomes. Fifty-two recruits completed PL training and were matched with
participants on schedule availability, gender preference, and geographic
proximity. PLs and participants had an initial face-to-face meeting, then weekly
phone contacts in the first 3 months and bi-weekly phone contacts in the last 9
months. PLs underwent health-related assessments at baseline, 3, and 12
months. The primary outcomes were A1C and diabetes distress (DD). At study
completion, PLs were deemed effective if their participants sustained and/or
improved A1C and DD from baseline. The PLs’ sociodemographic and personality

iv
characteristics were also measured. To explore PLs’ perspectives, 17 PLs were
subsequently invited for semi-structured interviews.
RESULTS: PLs’ A1C and DD remained stable over the course of the
intervention. Effective PLs had significantly lower baseline DD and significantly
higher extraversion than ineffective PLs. During the interviews, PLs characterized
their experiences with participants as positive, mutually beneficial, and helpful
with diabetes management. Suggestions were that PLs be vigorously screened
and that the PL-participant matching process take shared characteristics (e.g.,
demographic characteristics, diabetes-related commonalities, and life
experiences) into account. Traits of successful PLs were also identified.
CONCLUSION: Delivering PS interventions may offer clinical and
psychosocial benefits to the providers themselves. Further research is warranted
with regard to the PL recruitment and matching process to maximize benefits for
PLs and participants.

v
Lay Summary
Diabetes is a lifelong condition defined by a high level of blood sugar caused by
insulin deficiency/insufficiency and/or resistance. High blood sugar can harm
organs, blood vessels, and nerves. Adequate control of blood sugar through
lifestyle changes such as exercising and eating healthily can delay these
consequences and allow people with diabetes to live healthy lives. To gain the
knowledge and skills required for diabetes self-management, patients newly
diagnosed with diabetes usually receive education from their physicians or
through classes at diabetes education centers. However, patients need lifelong
support to sustain their initial gains. Considering the limitations on financial and
professional resources, peer-to-peer (between two patients with diabetes)
education and support may be an appropriate response to this issue. This
research explores the benefits that individuals receive from delivering support to
peers with the same health condition and proposes ways to optimize these
programs.

vi
Preface
The systematic review presented in Chapter 2 was conducted at Gordon
and Leslie Diamond Health Care Center in Vancouver, British Columbia, Canada.
Under the supervision of Drs. Tricia S. Tang and Diana Sherifali, I designed,
implemented, and completed the systematic review. With the help of the
librarian, Ms. Helen Brown, I designed and conducted the search strategy. I also
undertook the data extraction and manuscript preparation. Amir Seyyed Askari
helped with the data extraction and manuscript preparation. Rawel Sidhu’s
contributions included data extraction quality check and manuscript preparation.
A version of Chapter 2 has been published: Afshar, R., Tang, T. S., Askari, A.
S., Sidhu, R., Brown, H., Sherifali, D. (2019). "Peer Support Interventions in Type 2
Diabetes: Review of Components and Process Outcomes." J Diabetes.
The research studies in Chapters 3-5 were conducted in Diabetes Education
Centers associated with Vancouver General Hospital (VGH), St. Paul’s Hospital
(SPH), Richmond Hospital (RGH), and Vancouver Coastal Health/North Shore
Chronic Disease Services. These research projects were extensions of a larger
randomized controlled trial – “From clinic to community: Using peer support as a
transition model for improving long-term diabetes-related health outcomes” –

vii
that assessed the effects of a 12-month, telephone-based, peer-led diabetes self-
management support (DSMS) intervention on glycemic control and diabetes
distress in patients with type 2 diabetes in a specialty-care setting. The study is
registered on clinicaltrials.gov (NT02804620). The principal investigator for the
main trial is Dr. Tricia S. Tang. My contributions included preparation of the ethics
application for submission to the UBC Clinical Research Ethics Board at the
University of British Columbia and different study sites; participant and peer
leader recruitment; data collection; day-to-day problem solving with the clinical
trial; data analyses; and manuscript preparation.
For the purpose of my thesis, I designed and implemented the following
collateral studies under the supervision of my committee members Drs. Tricia
Tang, Diana Sherifali, Pat Camp, Susan Cox, and Martin Guhn. With the help of
Rawel Sidhu and Amir S. Askari, I analyzed the data and reported the outcomes in
chapters 3, 4, and 5. A version of chapters 3, 4, and 5 is projected to be published
by 2021.

viii
Table of Contents Abstract ............................................................................................................................... iii
Lay Summary ........................................................................................................................ v
Preface ................................................................................................................................. vi
Table of Contents ............................................................................................................... viii
List of Tables ......................................................................................................................... x
List of Figures ....................................................................................................................... xi
List of Abbreviations ............................................................................................................ xii
Acknowledgements ............................................................................................................ xiv
Dedication ........................................................................................................................... xv
Chapter 1: Introduction ......................................................................................................... 1
DIABETES EPIDEMIOLOGY ...............................................................................................................1
DIABETES BURDEN .........................................................................................................................2
DIABETES PATHOLOGY, COMPLICATIONS, AND PREVENTION ..........................................................2
DIABETES MANAGEMENT ...............................................................................................................5
DIABETES SELF-MANAGEMENT EDUCATION AND SUPPORT .............................................................7
PEER SUPPORT IN DIABETES SELF-MANAGEMENT ...........................................................................8
THEORETICAL FRAMEWORK ...........................................................................................................9
SUMMARY ................................................................................................................................... 13
Chapter 2: A Systematic Review of Recruitment, Training, and Health-related Outcomes for Individuals Who Deliver Peer Support in Type 2 Diabetes ..................................................... 15
SUMMARY ................................................................................................................................... 16
INTRODUCTION ............................................................................................................................ 19
RESEARCH DESIGN AND METHODS ............................................................................................... 20
RESULTS ....................................................................................................................................... 23
DISCUSSION ................................................................................................................................. 35
Practice Implications .................................................................................................................... 38
Conclusion ................................................................................................................................... 39
Chapter 3: ’Tis Better to Give Than Receive? Examining the Impact of Providing Support on Glycemic Control and Diabetes Distress at 3 and 12 Months in Peer Leaders......................... 41
SUMMARY ................................................................................................................................... 42

ix
INTRODUCTION ............................................................................................................................ 44
RESEARCH DESIGN AND METHODS ............................................................................................... 46
RESULTS ....................................................................................................................................... 50
DISCUSSION ................................................................................................................................. 58
IMPLICATIONS FOR FUTURE RESEARCH ......................................................................................... 63
Chapter 4: A Winning Combination: Exploring the Demographic and Personality Characteristics of Effective Peer Leaders for the Enhancement of Peer Leader Selection and Pairing Models .................................................................................................................... 65
SUMMARY ................................................................................................................................... 66
INTRODUCTION ............................................................................................................................ 68
RESEARCH DESIGN AND METHODS ............................................................................................... 69
RESULTS ....................................................................................................................................... 74
DISCUSSION ................................................................................................................................. 78
IMPLICATIONS FOR FUTURE RESEARCH ......................................................................................... 82
Chapter 5: Qualitative Study: Exploring Peer Support in Type 2 Diabetes from the Peer Leaders’ Perspectives .......................................................................................................... 84
SUMMARY ................................................................................................................................... 85
INTRODUCTION ............................................................................................................................ 87
RESEARCH DESIGN AND METHODS ............................................................................................... 89
FINDINGS ..................................................................................................................................... 93
DISCUSSION ............................................................................................................................... 116
CONCLUSION.............................................................................................................................. 125
Chapter 6: Integrated Discussion ........................................................................................ 127
REFERENCES ...................................................................................................................... 138
Appendices ........................................................................................................................ 145
Appendix A: Chapter 2 – Peer Leaders’ Questionnaire ................................................................. 145
Appendix B: Chapter 2 – Peer Leaders’ Clinical Values Form ........................................................ 151
Appendix C: Chapter 3 – Mini International Personality Item Pool (Mini-IPIP) Scale...................... 152
Appendix D: Chapter 5 – Semi-Structured Interviews .................................................................. 154
Appendix E: Chapter 5 – Study Diagram Depicting Explanatory Sequential Mixed Methods Design (QUAN qual) .......................................................................................................................... 155
Appendix F: Chapter 5 – Semi-Structured Interview Guide and Survey ......................................... 156
Appendix G: Chapter 6 – Peer Leader Selection and Pairing Models ............................................. 160

x
List of Tables
Table 1: Quality Assessments of the Included Studies, Using the EPHPP Tool .......................... 25
Table 2: Peer Leader Training Programs...................................................................................... 28
Table 3: Peer Leaders' Sociodemographic Characteristics ......................................................... 28
Table 4: Modalities of Interventions ........................................................................................... 30
Table 5: Baseline Characteristics of Peer Leaders ....................................................................... 55
Table 6: Comparing the Baseline Characteristics of Active Peer leaders versus Dropouts ....... 56
Table 7: Comparing the Demographic Characteristics of Unpaired and Paired Peer leaders ... 57
Table 8: Changes in Clinical and Psychosocial Outcomes at Baseline and 3-month and 12-
month Follow-ups ........................................................................................................................ 58
Table 9: Baseline Demographic Characteristics of Effective versus Ineffective Peer Leaders .. 76
Table 10: Correlation Coefficient between Peer Leaders’ Personality Characteristics and
Effectiveness Based on A1C Difference from Baseline to 12 Months. ....................................... 77
Table 11: Correlation Coefficient between Peer Leaders’ Personality Characteristics and
Effectiveness Based on DD Difference from Baseline to 12 Months. ........................................ 77
Table 12: Comparing Big 5 Personality Traits Between Effective and Ineffective Peer Leaders
....................................................................................................................................................... 78
Table 13: Interviewed Peer Leaders' Characteristics at Baseline (N=17) ................................... 94
Table 14: Peer Leaders' and Participants' A1C changes from baseline to 12 months ............... 95
Table 15: Four Group Comparisons ........................................................................................... 116

xi
List of Figures
Figure 1: Social Cognitive Theory ................................................................................................. 14
Figure 2: PRISMA Flow Diagram .................................................................................................. 24
Figure 3: Components of Peer Support Interventions in Type 2 Diabetes, Adapted from the
Studies Included in This Review .................................................................................................. 40
Figure 4: Recruitment and Follow-up of Peer Leaders in a Repeated Measures Study ............ 54

xii
List of Abbreviations
A1C: Glycated Hemoglobin
BMI: Body Mass Index
BP: Blood Pressure
CENTRAL: Cochrane Central Register of Controlled Trials
CINAHL: Cumulative Index to Nursing and Allied Health Literature
DCCT: Diabetes Control and Complication Trial
DD: Diabetes Distress
DDS: Diabetes Distress Scale
DEC: Diabetes Education Center
DSME: Diabetes Self-Management Education
DSMES: Diabetes Self-Management Education and Support
DSMS: Diabetes Self-Management Support
EMR: Electronic Medical Records
EPHPP: The Effective Public Health Practice Project quality assessment tool
MeSH: Medical Subject Headings
Mini-IPIP: Mini International Personality Item Pool Scale
PEP: Patient Empowerment Programme

xiii
PHQ-9: Patient Health Questionnaire scale
PICO: Population, Intervention, Comparison, Outcome
PL: Peer Leader
PLEASED: Peer-led, Empowerment-based Approach to Self-management Efforts in
Diabetes
PLT: Peer Leader Training Programs
RCT: Randomized Controlled Trial
T1DM: Type 1 Diabetes Mellitus
T2DM: Type 2 Diabetes Mellitus
TIDieR: Template for Intervention Description and Replication checklist
UKPDS: UK Prospective Diabetes Study
WC: Waist Circumference

xiv
Acknowledgements “Alone we can do so little, together we can do so much."
Helen Keller
After five years of intensive work, today is the day to thank those who
supported me throughout my academic journey. These years were an intensive
learning opportunity for me not only in the science field but also on a personal
level.
I would like to thank every member of “Team Tang” who worked alongside
me even on Christmas and New Year’s Day to help me arrange and implement my
thesis studies.
I would also like to express my sincerest gratitude to my mentors – Dr.
Tang, Dr. Camp, Dr. Sherifali, Dr. Cox, and Dr. Guhn – who supported me along
this stressful yet joyful journey. I would not have successfully completed this
chapter of my life without your help and support.

xv
Dedication
“Family and friends are hidden treasures, seek them and enjoy their riches.”
Wanda Hope Carter
I would like to take this opportunity to thank my family and friends who
provided love and support, which allowed me to continue my journey and not
give up despite many difficulties. I will always be thankful for you all!

1
Chapter 1: Introduction
“Diabetes is a chronic, debilitating and costly disease associated with severe
complications, which poses severe risks for families, Member States and the entire
world.”
United Nations General Assembly
DIABETES EPIDEMIOLOGY
One of the most common chronic diseases, diabetes affects more than 415
million people around the world and is projected to affect 612 million by 2040.1
Canada is no exception to the global epidemic. Its diabetes prevalence was
estimated at 3.4 million (9.3%) in 2015 and is projected to increase to 5 million
(12.1%) by 2025 – a 44% increase.2 Type 2 diabetes accounts for the vast majority
of these cases (85%).3
As insulin production deteriorates with age,4 old age is considered a major
risk factor for type 2 diabetes. However, a trend toward increasing type 2
diabetes prevalence – in parallel with the rising rate of obesity and sedentary
lifestyles – is also being seen in adolescents and young adults.5 In fact, between

2
2008 to 2009 in Canada, more than 50% of the population affected with type 2
diabetes was of working age (25–64 years old).4
DIABETES BURDEN
Diabetes is a serious public health concern, for many reasons.3 Diabetes
and its long-term complications shorten the lifespan by 5 to 15 years, limit work
ability, and increase morbidity and mortality.2 Compared to the general
population, patients with diabetes are more prone to macrovascular and
microvascular complications and non-traumatic lower limb amputations.3 In
Canada, diabetes is the leading cause of acquired blindness before age 50. And 30
percent of patients with diabetes develop clinical depression.6
The financial costs are also extreme. According to Diabetes Canada, the
cost of diabetes to the Canadian health care system was $3.4 billion in 2016 and is
projected to increase by $5 billion by 2026.2 The majority of patients with type 2
diabetes spend more than 3% of their income for their diabetes treatment.2,6
DIABETES PATHOLOGY, COMPLICATIONS, AND PREVENTION
Type 2 diabetes is a chronic disease caused by abnormal metabolic
regulation, with potential long-term complications.5,7 Development of type 2
diabetes appears to result from a complex interaction between genes and

3
environment.5,7 Abnormalities in insulin secretion and/or resistance to insulin are
deemed to be the causes. These abnormalities are believed to vary among
individuals: some may have a lower level of insulin secretion; others may have
more resistance to insulin action.7
Genetics has been shown to play an important role in the development of
type 2 diabetes.5 Individuals with one parent affected by type 2 diabetes have a
40% lifetime risk of developing the disorder; those with two affected parents have
a 70% lifetime risk.5
Two environmental factors—the recent increase in obesity and physical
inactivity—are strongly and independently linked to the higher prevalence of type
2 diabetes in westernized countries.8 Weight gain increases the rate of type 2
diabetes by 9% for every added kilogram. Physical inactivity independently –
regardless of the patient’s body weight – causes insulin resistance, leading to
poorer glycemic control. 9-12 Weight loss and physical activity have been shown to
decrease the incidence of type 2 diabetes in the high-risk population by 40–60%
over 3–4 years.13-16 Not surprisingly, they are also the foundation of diabetes
management.10,11

4
The major clinical burden of longstanding diabetes is its long-term micro-
and macrovascular complications.5 The key role of hyperglycemia in microvascular
complications – nephropathy, neuropathy, and retinopathy – was confirmed by
the landmark Diabetes Control and Complication Trial (DCCT) in 1993.17 In this
trial, 1441 adolescents and younger adults with type 1 diabetes were randomly
assigned to conventional treatment – standard treatment at the time – or
experimental treatment – intensive management with multiple daily insulin
injections or use of an insulin pump with frequent blood glucose monitoring and a
detailed insulin-dosage algorithm, designed to bring patients to a near-
normoglycemic state. Over the course of study, mean A1C was 7.2% and 9% for
the experimental group and the conventional group, respectively, and the rate of
microvascular complications was significantly lower in the experimental arm.17 A
similar study, the UK Prospective Diabetes Study (UKPDS), showed the importance
of intensive glucose control in preventing microvascular complications in patients
who had recently been diagnosed with type 2 diabetes.18
Diabetes is also a major risk factor for macrovascular complications,
including cardiovascular, cerebrovascular, and peripheral artery disease.5
Cardiovascular disease appears to have similar clinical and pathological

5
manifestations in patients with and without diabetes, but in patients with
diabetes the manifestations present more aggressively, at earlier ages, and are
associated with a mortality risk that is two to four times higher.5 The level of
glycemic control, as measured by A1C, has been shown to be an independent
predictor of all-cause and cardiovascular mortality in patients with diabetes.
Notably, each 1% increase in A1C results in 30% and 40% increase in all-cause and
cardiovascular mortality. 5 Although the DCCT showed a 58% decrease in
cardiovascular events in patients with type 1 diabetes who exercised intensive
glucose control, 19 the role of tight glycemic control on cardiovascular events in
type 2 diabetes is less clear, as these patients are more likely to have other
cardiovascular risk factors, such as hypertension and dyslipidemia. 5 The UKPDS
generated the strongest evidence to date in favor of cardiovascular benefits to
intensive glycemic control in type 2 patients: 15% and 13% reductions in
myocardial infarction and all-cause mortality, respectively, in the intervention arm
compared to the conventional group.20
DIABETES MANAGEMENT
The goal of diabetes management is to reach optimal glycemic control (A1C
7%), which, along with tight control of blood pressure and lipid profile (where

6
applicable), plays a critical role in delaying and preventing long-term diabetes
complications.21 Individuals with diabetes should be under the care of a physician-
coordinated health care team and provided with an individualized diabetes
management plan—preferably one that also involves the family. In order to attain
optimal glycemic control, patients with type 2 diabetes must effectively manage
their condition through lifestyle modification and/or the use of oral and injectable
medications.7 These patients should be actively involved in planning their
treatment and may benefit from attending diabetes self-management education
programs.5
As part of diabetes management, dietary recommendations continue to
evolve. Current approaches focus on calorie restriction to achieve a loss of 5–10%
of body weight. A low-fat, low-carbohydrate diet has been shown to lead to
weight loss, thereby improving glycemic control.5
Regular exercise also has a strong effect on diabetes control – aerobic and
resistance exercises have been shown to improve glycemic control regardless of
weight loss – but is too often overlooked.5,7,21 Current guidelines recommend at
least 150 minutes of moderate to intense physical activity per week.21

7
Self-monitoring of blood glucose is another essential component of
diabetes care. The frequency and timing of tests should be individualized based
on the patient’s diabetes type, medications, and length of time since diagnosis. It
is recommended that recently diagnosed patients (<6 months) self-monitor more
frequently as they learn how diet, exercise, and medications affect their glycemic
control.5,21,22
DIABETES SELF-MANAGEMENT EDUCATION AND SUPPORT
Diabetes self-management education and support (DSMES) is fundamental
to the care of patients with diabetes.23 DSMES is a continuous process that equips
patients with diabetes with the knowledge and skills required for self-care
behaviors and assists them with executing and sustaining these behaviors on an
ongoing basis.23,24 The current research offers robust evidence that DSMES
improves patients’ self-efficacy, self-care behaviors, and glycemic control.24,25
The education component, DSME, is a systematic approach designed to
actively involve patients with diabetes in health-related activities and decisions,
using knowledge and skills taught through patient-provider collaboration. DSME
alone has been shown to improve both clinical outcomes (e.g., A1C reduction and
improvement in cardiovascular risk factors) and psychological outcomes.24 Patient

8
Empowerment Programme (PEP), a study involving 27,278 patients with type 2
diabetes and no prior cardiovascular risk factors, observed decreases of 44%,
20%, and 30% in all-cause mortality, first cardiovascular episode, and stroke,
respectively, in patients who received DSME.26 DSME has also been shown to
reduce the rate of diabetes-related hospitalizations and financial burden.23
However, its positive impacts appear to be of short to medium duration – they
usually start to diminish after 6 months.23
To sustain the behavioral changes needed for effective diabetes
management, patients need ongoing support, which traditionally has been
offered by diabetes educators.24 Today, constraints in financial and professional
resources make it unlikely that diabetes educators or other health care
professionals can meet the high demand for DSMS. Peer support – a promising
and cost-effective approach in which volunteers share their knowledge and
experience with peers who have the same chronic condition27 – could help fill the
gap.28
PEER SUPPORT IN DIABETES SELF-MANAGEMENT
Peer support is described as support received from a person that shares
similar characteristics with the target population and has experiential knowledge

9
of a particular behavior or condition.27 The “similar characteristics” are often age,
gender, disease, or language. The reciprocity of the relationships between peer
leaders and patients may benefit peer leaders in addition to patients. For
example, peer leaders could benefit by enhancing their interpersonal skills and
knowledge and by receiving social approval and appreciation from their patients.
29,30
The effect of peer support on diabetes self-management has been tested in
a variety of settings (primary care, secondary care, tertiary care, and community)
using different modalities of contact (face-to-face meetings, telephone-based,
and technology-based).27 Several randomized control trials have shown benefits
to different peer support models in diabetes, including improvements in patients’
clinical and psychological outcomes and self-care behaviors.31-43 Although the
impact of peer support interventions on patients has been extensively studied,
less attention has been directed to peer leaders as the providers of support, or to
the components of these interventions.
THEORETICAL FRAMEWORK
Behavioral theories describe the mechanism of change and why a particular
behavior is expected to happen. Historically, theories of social support, social

10
cognition, and social comparison have been used to explain the mechanisms of
peer support.29 In this dissertation, which mainly focuses on peer leaders,
theories of social cognition and social comparison were applied to describe how a
combination of internal and external factors led to sustainability or improvement
of health outcomes in peer leaders in diabetes type 2 peer support studies.
Social Cognitive Theory
Social cognitive theory (Figure 1) has been utilized in diverse contexts,
including community-based health-promotion programs and self-management
studies for chronic diseases and emotional disorders.44 In this theory, human
behavior results from interactions among the causative triad of personal
cognitive, socioenvironmental, and behavioral factors.
Personal cognitive factors are defined as one’s ability to apply knowledge to
self-regulate preferences and to reflect on the experience. The major constructs
are: (1) self-efficacy (defined as one’s confidence in her/his own ability to conduct
a behavior that will result in an outcome), (2) collective efficacy (defined as one’s
belief in the ability of a group of people to perform a behavior that will result in
an outcome), (3) outcome expectations (defined as one’s judgment about the
possible consequences of behaviors), and (4) knowledge (defined as one’s

11
understanding of the risks and benefits of health-related behaviors and having
enough information to perform an action).44
Socioenvironmental factors are the physical and social determinants that
encourage or discourage a behavior. The major constructs are: (1) observational
learning (defined as learning by observing others’ behaviors and their
consequences), (2) normative beliefs (defined as cultural norms and beliefs about
the social acceptability and perceived prevalence of a behavior), (3) social support
(defined as perceived support that an individual receives from others), and (4)
barriers and opportunities (defined as factors that ease or hinder the
performance of an action).44
Behavioral factors are the health-enhancing or health-compromising
behaviors performed by an individual. The major constructs are: (1) behavioral
skills (defined as the abilities necessary to perform an action), (2) intentions
(defined as the aim behind new behaviors or changing current behaviors), and (3)
reinforcement and punishment (defined as increasing or decreasing behaviors
through the addition or removal of rewards or punishments).44

12
Social Comparison Theory
Social comparison theory proposes that humans possess an innate drive
to compare themselves with nonexperts who have one or more of the same
background characteristics (e.g., a health condition).45 The comparison mostly
happens in cases where individuals are uncertain how to assess their performance
or respond to it.46 Depending on whether the target comparison is perceived as
superior or inferior to the self, the social comparison is upward or downward.
Both can have positive effects. Upward social comparison tends to produce
negative feelings, which could motivate individuals to achieve more; downward
social comparison often results in increased self-esteem, which may lead to self-
enhancement.45,46
We hypothesized that PLs, as providers of support in PS interventions, will
sustain or enhance their clinical and psychosocial diabetes outcomes over the
course of the study via: (1) attending the peer leader training program to boost
their knowledge, skills, and confidence related to diabetes self-management
behaviors (personal factors – social cognitive theory); (2) increasing the frequency
of such behaviors due to mutual learning and the support, appreciation, and
approval they receive from their participants (socioenvironmental and behavioral

13
factors – social cognitive theory); (3) applying the acquired knowledge and skills
to enhance their diabetes self-management and become role models for their
participants (behavioral factors – social cognitive theory); and (4) comparing
themselves with their participants in terms of glycemic control and overall health
(social comparison theory).
SUMMARY
Type 2 diabetes is a progressive chronic disease with potential long-term
complications. The management of diabetes depends on optimal glycemic
control, as well as tight control of cholesterol levels and blood pressure. Together,
these interventions have been shown to prevent or delay the long-term
complications of diabetes.5,7 Diabetes self-management education (DSME) is
critical to these measures. Patients appear to benefit clinically and psychologically
from DSME on topics such as healthy eating, exercise, monitoring of blood sugar,
and diabetes care during illness. However, the improvements associated with self-
management education mostly begin to diminish after 6 months. In order to
sustain the behavioral changes required for effective diabetes control, patients
required ongoing support.23 Unfortunately, limited health care system resources
may prevent health care professionals from providing this support. To address

14
these limitations, peer support—a promising and cost-effective approach to
diabetes self-management—could help. The next chapter includes a
comprehensive literature review of peer support interventions in type 2 diabetes,
and describes the underlying elements of such interventions.
Figure 1: Social Cognitive Theory
Personal Cognitive
Factors
Socio-environmental
Factors
Outcome (Human
Behavior)
Behavioral Factors

15
Chapter 2: A Systematic Review of Recruitment, Training, and Health-related Outcomes for Individuals Who Deliver Peer Support in Type 2 Diabetes

16
SUMMARY
OBJECTIVE: This review focuses on peer leaders in peer support
interventions for adults with type 2 diabetes mellitus (T2DM). The objectives are
to describe the strategies used to recruit peer leaders; characterize the socio-
demographic background of peer leaders; compare and contrast the various
models used to train peer leaders; describe the modalities of intervention
delivery; and examine the impact of peer support on peer leaders’ diabetes-
related health outcomes.
RESEARCH DESIGN AND METHODS: A systematic review of English-
language articles was conducted using the following databases from inception to
February 2018: 1) Medline, 2) PubMed, 3) EMBASE, 4) CENTRAL (Cochrane
Central Register of Controlled Trials), 5) CINAHL (Cumulative Index to Nursing and
Allied Health Literature), and 6) PsycINFO. Two reviewers independently screened
titles or abstracts of retrieved articles, evaluated full texts of studies that met the
criteria, and extracted data using the Template for Intervention Description and
Replication (TIDieR) checklist.
RESULTS: In total, 19 out of 1682 retrieved articles were included in the
final selection. Of these, 15 were randomized controlled trials (RCTs) and four

17
were cluster RCTs. Most interventions were conducted in primary care settings.
Although face-to-face was the most common modality of contact among the
selected studies, the rate of contacts was higher via telephone. Potential peer
leaders were identified primarily through recommendations from health care
professionals. The health care professionals based their recommendations on the
potential peer leaders’ personal interests in coaching, glycemic control, and
verbal communication skills. Across the selected studies, peer leaders were
mostly female with at least university education and a long history of diabetes (
10 years). Peer leader training varied significantly in length and content; the two
most frequent topics were communication skills and diabetes knowledge. Finally,
the effect of interventions on peer leaders has been largely overlooked. Our
review found only one study that evaluated the impact of peer support
interventions on peer leaders’ clinical and psychosocial outcomes.
CONCLUSIONS: While there is a growing body of literature on the impact of
peer support on patients’ clinical and/or psychosocial outcomes in diabetes, less
attention has been paid to different components of these interventions, or to
how these interventions affect peer leaders. In the end, we proposed suggestions

18
for enhancing existing peer support models, using components identified in this
review.
Key words: Peer Group, Diabetes Mellitus, Systematic Review

19
INTRODUCTION
Optimal diabetes control requires active participation by patients in their
treatment.5 Diabetes self-management education and support (DSMES) is a
continuous process that teaches patients the knowledge and skills needed for
self-care behaviours (DSME), then helps support patients as they perform and
maintain these behaviours on an ongoing basis (DSMS).23 While DSME has been
shown to produce improvements in patients’ clinical and psychosocial outcomes,
these benefits are typically short-term and begin to diminish after 6 months.47,48
To sustain the benefits from DSME, patients must receive ongoing support.23,24
Given the increasing prevalence of diabetes, the constraints on financial,
human, and health-care resources for diabetes management, and the need for
ongoing support for patients with type 2 diabetes (T2DM), efficient and low-cost
interventions for these patients warrant exploration.23,49,50 Peer support, an
inexpensive intervention model in which individuals with a medical condition
receive support from non-professional others (“peers”) with the same condition,
has shown promise in chronic illnesses such as type 2 diabetes.27 The success of
peer support hinges on the knowledge and experience that peer leaders (PLs) can
share with patients.27 The reciprocity of relationships between PLs and patients

20
may also benefit the PLs by enhancing their interpersonal skills and knowledge,
and through the social approval, and gratitude they receive from their
patients.29,30,51
Although a growing body of literature has focused on the effects of peer
support models on patients, less attention has been directed towards the
potential health-related benefits that PLs themselves may experience as a result
of this relationship. The aim of this study is to review peer support interventions
in T2DM using a validated tool, the Template for Intervention Description and
Replication (TIDieR) checklist,52 in order to identify different components of peer
support interventions, including PL recruitment strategies and training programs
(PLTs), PLs’ socio-demographic background, modalities of peer support
intervention delivery, and impact of delivering peer support on PLs’ health
outcomes.
RESEARCH DESIGN AND METHODS
Search Strategy
The key question of this research was formulated based on the “PICO”
method. The search strategy was developed with the help of a librarian (HB)
based on Medical Subject Headings (MeSH) terms and key word analyses of

21
studies in the field. MeSH and different combinations of free text terms were
searched from inception to February 2018 in the following 6 databases: 1)
MEDLINE, 2) PubMed, 3) EMBASE, 4) CENTRAL (Cochrane Central Register of
Controlled Trials), 5) CINAHL (Cumulative Index to Nursing and Allied Health
Literature), and 6) PsycINFO. Search results from all databases were transferred
to Covidence for removing duplicates and reviewing the rest. Reference lists of
selected studies were also reviewed, in order to detect other potentially pertinent
studies. To learn more about the studies, we referred to their protocols when
available. If papers were generated by the same study (i.e. secondary analyses),
only the original paper was included in the review. In the final selection, we
included only randomized controlled trials (RCTs) that were written in English and
excluded papers that included any pharmacological component in the
management of diabetes or that did not have information about the recruitment,
training, or outcomes of PLs.
Study Screening, Data Extraction, and Quality Assessment
Prior to starting the systematic review of the literature, two reviewers (RA
and AA) independently tested data screening and extraction forms for
comprehension. Titles and abstracts, and full text citations were screened for

22
inclusion in the review. For the citations that met the criteria, study
characteristics, including the TIDieR (Template for Intervention Description and
Replication) checklist, were extracted by two reviewers independently. The TIDieR
checklist includes a brief name of the intervention; the rationale for the
intervention (why); any material and any procedures, activities, and/or processes
used in the intervention (what); the providers of the intervention (who); the
modes of delivery of the intervention (how); the location of the intervention
(where); the number of times and the duration of the intervention (when and
how much); intervention tailoring; intervention modification; and planned and
actual intervention fidelity (how well).52 In addition, the two reviewers each used
the Effective Public Health Practice Project (EPHPP) quality assessment tool for
quantitative studies to assess the methodology quality of the included studies
that pertain to education or counselling.53 Any inconsistencies between reviewers
at any point were resolved through discussion and/or by the third review author
(TT).

23
RESULTS
Search Results
The initial search resulted in 1682 articles. Removal of duplicates reduced
the number to 834 for title and abstract screening. One additional article was
identified when the references of pertinent articles in the field of study were
inspected. Of the 835 articles identified, 742 were deemed irrelevant, and 93
qualified for full-text review. Nineteen studies were included in the final
selection, as shown in Figure 2. Common reasons for exclusion were lack of
information about PLs and/or use of a study design that is not an RCT (e.g., pre-
post design).
Fifteen studies were RCTs and four were cluster RCTs.39,41,54,55 The total
study population at baseline was 5636 (varied from 106 to 1299), with 3265
patients in the intervention arms (which included both peer- and health care
professional–led groups), 3108 patients in the peer support groups, 2371 patients
in the control groups receiving usual care, and 356 PLs.
One, eight, and ten studies were globally rated strong, moderate, and
weak, respectively, by the two reviewers using EPHPP (Table 1).

24
Figure 2: PRISMA Flow Diagram
Records identified through database searching
(n = 1682)
Scre
enin
g In
clu
de
d
Elig
ibili
ty
Iden
tifi
cati
on
Additional records identified through other sources
(n = 1)
Records after duplicates removed (n = 835)
Records screened (n = 835)
Records excluded (n = 742)
Full-text articles assessed for eligibility
(n = 93)
Full-text articles excluded, with reasons
(n = 74) 23 Abstracts 17 Not Enough Information 14 Wrong study design 5 Duplicate 3 Conference Presentation 3 Review Paper 3 Wrong patient population 3 Wrong setting 1 Book 1 Commentary 1 Wrong outcomes
Studies included in qualitative synthesis
(n = 19)

25
Table 1: Quality Assessments of the Included Studies, Using the EPHPP Tool
Selection Bias
Study Design
Confounders Blinding Data Collection Method
Withdrawals and Dropouts
Global Rating
Ahmadi et al. Moderate Strong Strong Weak Strong Strong Moderate Chan et al. Weak Strong Strong Moderate Strong Strong Moderate Dale et al. Weak Strong Strong Moderate Strong Strong Moderate Debussche et al.
Moderate Strong Strong Weak Strong Strong Moderate
Gagliardino et al.
Moderate Strong Strong Weak Strong Weak Weak
Johansson et al.
Weak Strong Strong Weak Strong Strong Weak
Lorig et al. Weak Strong Strong Weak Strong Strong Weak Paz-Pacheco et al.
Moderate Strong Strong Weak Strong Moderate Moderate
Peimani et al. Weak Strong Strong Weak Strong Weak Weak Phillis-Tsimikas et al.
Weak Strong Strong Weak Strong Moderate Weak
Siminierio et al.
Weak Strong Strong Weak Strong Strong Weak
Simmons et al.
Weak Strong Weak Moderate Strong Moderate Weak
Smith et al. Moderate Strong Strong Weak Strong Strong Moderate Tang et al. (2014)
Moderate Strong Strong Moderate Strong Weak Moderate
Thom et al. Moderate Strong Weak Weak Strong Strong Weak Van der Wulp et al.
Weak Strong Strong Weak Strong Strong Weak
Anzaldo-Campos et al.
Moderate Strong Weak Weak Strong Strong Weak
Tang et al. (2015)
Moderate Strong Strong Moderate Strong Moderate Strong
Riddle et al. Moderate Strong Strong Weak Strong Strong Moderate
Why, What, and Who?
Some studies used peer support to deliver ongoing DSME; 31-34,36,38 others
used peer support as ongoing DSMS following short-term DSME
programs.28,35,37,39-43,54-58 The rationales given for the peer support interventions
were to improve clinical and/or psychosocial outcomes (either directly or through
increasing self-efficacy 58 or enhanced diabetes self-management 39), self-efficacy,

26
self-care behaviours, and diabetes self-management. Potential PLs were mostly
identified through recommendations from health professionals 31,37,43,54-56,59 or
through centers or databases that contained information on patients with
diabetes.28,33,34,39,41,59 Fifteen studies defined eligibility criteria for peer leader
recruitment.28,31-34,36,37,39,41-43,54-57
Most studies require a personal history of diabetes as an eligibility criterion.
In one study, however, a peer leader could be an individual without diabetes who
had cared for or lived with a patient with diabetes.32 Peer leaders were selected
primarily based on their interest in joining the study, acceptable glycemic control
(A1C 8.5%), with some studies requiring peer leaders to demonstrate strong
communication skills - as assessed via interview.31,34,37,41,43,56 Only 3 studies
interviewed the prospective peer leaders in person prior to selection.28,31,59 In
addition, one study included personality traits in the PL inclusion criteria,
however, it offered no further discussion of how personality traits were measured
or which traits were considered.60
PLs in all included studies received training, but the training varied
significantly in content and structure. The duration of training programs ranged
from 2–3 hours to 46 hours, and all training was conducted in group-based

27
formats. The programs were primarily led by research teams and health
professionals, including certified diabetes educators, clinical psychologists, nurses,
nutritionists, and, in one study, endocrinologists. The core elements of each
training program, in order of frequency, were: (1) communication
skills,28,31,34,35,37,39-43,55,56,61 (2) diabetes knowledge,31-35,38,42,43,54,55,57 (3) facilitation
skills,31,34,35,37-39,42,54,55,57 (4) behavioural modification skills,33,35-38,40,42,57 (5)
motivational interviewing,28,34,40-42,57,58 and (6) ethics.41 Role plays were a teaching
approach often used. In most studies, the training programs were based on a
curriculum, and peer leader candidates were provided with manuals, booklets,
scripts, and/or notes (Table 2).
The studies used different names for PLs (e.g., “peers,” “peer supporters,”
“peer educators,” “peer leaders,” “peer support facilitators,” “peer coaches,” and
“expert patients”). For the purpose of this study, we use “PLs.” In 14 studies, the
PL population size was listed; sizes ranged from 1 to 127 (total = 356). Only five
articles provided PLs’ sociodemographic characteristics. Across these five studies,
the mean age of PLs was 59.8 (9.5) years; the PLs were mostly female (66.4%);
49.6% were married; and the mean duration of diabetes was 10.8 years (8). PLs

28
either had type 1 or type 2 diabetes (T1DM or T2DM) 28,35 or were caregivers to
patients with diabetes (Table 3).32
Table 2: Peer Leader Training Programs
Communication Skills
Diabetes Knowledge
Facilitation Skills
Behavioral Modification Skills
Motivational Inquiry
Ethics
Ahmadi et al. X X X - - - Chan et al. X - - - - - Dale et al. X - - - X - Debussche et al. - X - X - - Gagliardino et al.
X X X - X -
Johansson et al. - X X - - - Lorig et al. X X X X Paz-Pacheco et al.
- - - X - -
Peimani et al. X - X X - - Philis-Tsimikas et al.
- X X X - -
Siminerio et al. X - - X X - Simmons et al. X - - - X X Smith et al. X X X - - - Tang et al. (2014)
X X X X X -
Thom et al. X X - - - - van der Wulp et al.
- - - - X -
Anzaldo-Campos et al.
- X - - - -
Tang et al. (2015)
X X X X X -
Riddle et al. X - X - - -
Table 3: Peer Leaders' Sociodemographic Characteristics
N Age (meanSD) Female/Male (%)
Duration of Diabetes
(meanSD)
Married/Living with a Cohabitant (%)
A1C (meanSD)
Chan et al. 33 55.611.5 65/35 11.36.7 - 72 Smith et al. 29 62.711.3 59/41 6.88.1 70 -
Thom et al. 24 588.1 66.7/65.7 10.612.3 29.2 6.880.76 Tang et al. 8 637.2 75/25 14.35 - -

29
How, Where, When, and Tailoring?
Modalities of intervention were 1) face-to-face, 2) phone, 3) internet, or 4)
some combination of these. The interventions were offered in groups or
individually. Seven studies delivered only group-based, face-to-face interventions;
two used one-on-one phone calls only; seven used a combination of group-based,
face-to-face interventions and one-to-one phone calls; only one study delivered
one-to-one, face-to-face interventions; and three studies had an extra component
of technology (Table 4). The technology component included email
correspondence and the use of smartphone applications.32,41,58
Studies were conducted in a variety of settings: 10, 1, 3, and 5 studies were
held in primary care,28,32,34,38,40,43,54,55,57,58 secondary care,33 tertiary care,31,37,56 and
community-based settings,35,36,39,41,42 respectively.
Some studies tapered the intervention, starting with more frequent
sessions and reducing the frequency over the course of the study.28,31,32,34,55,56 The
in-person meeting durations ranged from 1 hour to 2 ½ hours. The phone calls
lasted 15–30 minutes. Nine studies had tailoring, which means the frequency,
length, and content of sessions and phone calls were tailored to patient

30
needs.28,32,34,37,39,40,42,57,58 In one study, group members served as consultants,
scheduling and conducting the next meetings.39
Table 4: Modalities of Interventions
Face to Face Phone Calls Technology
Ahmadi et al. X - -
Chan et al. X X -
Dale et al. - X -
Debussche et al. X - -
Gagliardino et al. X X -
Johansson et al. X - -
Lorig et al. X - -
Paz-Pacheco et al. X - -
Peimani et al. X X -
Philis-Tsimikas et al. X - -
Siminerio et al. - X -
Simmons et al. X X X
Smith et al. X - -
Tang et al. (2014) X X -
Thom et al. X X -
van der Wulp et al. X X X Anzaldo-Campos et al. X - X
Tang et al. (2015) X X -
Riddle et al. X X -
Implementation and Evaluation Outcomes
In 15 articles, strategies were used to ensure intervention fidelity over the
period of study. In most of these studies, PLs were provided with logs, record lists,
or checklists to keep records of their contacts with their patients, including the
frequency, topic of conversation, and duration of contact.28,34,37,39-42,54,56-58 A few
studies used audiotape, videotape, and direct observation of sessions (by the

31
research team) to assess treatment fidelity.35,37,38 One study evaluated the
intervention fidelity using the Bellg et al. framework, which assesses aspects such
as treatment design, training procedure, delivery of treatment, receipt of
treatment, and enactment of treatment.55
The peer leader retention rate, which was reported in five studies, ranged
from 56% to 88%.30,43,55,58,59 Across all studies, 83.4% of patients completed the
study (54.8%-96.7%). Simmons et al. reported that 92.6% of patients maintained
contact with their PLs via telephone, but only 61.4% actually attended a peer
support session.41 Smith et al. reported that 90% of patients in the intervention
group were in contact with their PLs,56 but 18% never attended a group
meeting.55
One study reported minor changes in the protocol in response to problems
in conducting the research study.33 In a cluster RCT done by Riddle et al., one
cluster had to combine with another due to an insufficient number of group
members.39 This led to a delay in initiating the intervention for this joint cluster;
as a result, the intervention lasted for only 8 months of the 12-month study.
Of the 19 studies, only one measured the health outcomes of the PLs. In
this study, 79 PL candidates were recruited across three tertiary hospitals in China

32
– the same sites where participants were recruited. Of those, 59 completed the
training program, and 33 agreed to be paired. A separate group of patients (n=60)
with type 2 diabetes of similar glycemic control (A1C<8%) receiving usual care
were selected as the comparison group.30 At 6 months, only the group that
received peer leader training reported improvements in self-care behaviors –
including diet adherence and foot care – and sustained their level of glycemic
control. After four years of delivering peer support, sustained A1C was noted only
in the matched peer leaders group. Individuals in both the comparison group and
unmatched peer leaders group experienced A1C deterioration over the duration
of the study.30
Future Directions in Peer Support Interventions in Type 2 Diabetes
Suggestions for the enhancement of future peer support interventions,
based on the findings of this review, are italicized in Figure 3.
To improve intervention delivery, more rigorous screening of suitability is
required. Some suggestions to consider are: 1) in addition to having T2DM and
satisfactory glycemic control (A1C 8%), PLs should possess strong and effective
verbal communication skills, a proficiency that can be evaluated when
interviewing prospective PLs, and 2) personality aptness may be also considered

33
that can be assessed by interviewing the candidates or administration of short
screening personality tests. A meta-analysis found that individuals with higher
scores of conscientious (on the “Big 5” personality traits – Openness,
Conscientiousness, Extraversion, Agreeableness, and Neuroticism (OCEAN)) tend
to invest more in volunteerism.62
Singh et al. defined the qualities of effective teachers as a combination of
knowledge of the subject, strong communication skills, and enthusiasm for
teaching.63 To develop these qualities in PLs, PLT programs need to cover not only
the fundamentals of diabetes self-management, but also communication,
facilitation, motivational interviewing, and behaviour-modification skills, which
supports Tang et al.’s 46-hour PLT program.59 Additionally, patient confidentiality,
ethical considerations and a knowledge of existing resources available for patients
with T2DM should also be deemed important components. Above all, future
programs should tailor the length and content of the training to the objectives of
the intervention. For example, interventions intending to utilize peer support as a
means of ongoing DSMS would benefit from paying particular attention to
motivational interviewing and behaviour modification skills as part of their PLs’

34
training. Alternatively, peer support programs focusing on DSME (vs. DSMS) may
emphasize diabetes knowledge in its PL training instead.
Furthermore, it may not be ideal to pair patients with T2DM with peer
leaders who have T1DM as these conditions are experienced very differently.
Although certain aspects of diabetes self-management are common to both
types, many challenges are different. For example, Daousi et al. found that, in
speciality care, 52% of patients with T2DM had obesity, compared to just 16.6% of
patients with T1DM.64 Medication adherence among patients with T2DM is
usually poor due to poly-pharmacy and older mean age. At the time of diagnosis,
patients with T2DM may have long-term complications such as retinopathy and
nephropathy, complications patients with T1DM are less likely to have. As a
result, support needs and approaches to addressing those needs – may differ for
patients with T1DM and T2DM. Therefore, PLs who have T2DM would likely
provide more relevant support to patients with the same condition.
Current studies on peer support primarily focus on the clinical and
psychosocial outcomes of patients but often overlook the effects on PLs. One
reason for this lack of attention could be that, in general, PLs are expected to be
under good glycemic control as a qualification for delivering support. Whether PLs

35
experience any benefits or harm from PLT programs and/or the reciprocity of
interactions with patients may be an important area to explore.
DISCUSSION
Peer support approaches have received considerable attention in T2DM
and have been shown to deliver promising clinical and psychosocial outcomes for
patients. Despite the growing body of literature on patients’ outcomes, little
attention has been paid to peer leaders and other components of peer support
interventions. We found only one study that assessed the impact of peer support
interventions on PLs; it showed improvements in self-care behaviors and
maintenance of glycemic control over four years.30
Although patients with poor glycemic control have been shown to benefit
the most from peer support,32,33,38,43 a majority of peer support interventions have
been designed for, and implemented in, primary care offices – settings where
most patients already have satisfactory glycemic control.34,54,55 In contrast,
patients presenting to tertiary care settings tend to be poorly controlled and/or
recently diagnosed, which positions them as prime candidates for peer support.
Patients appear to prefer telephone-based interventions due to their
accessibility and flexibility. Two of the studies that used a combination of face-to-

36
face and telephone modalities compared how much each modality was used.
Both studies found that patients and PLs were in contact more often via
telephone than face-to-face (92.6% vs 61.4%; 76.6% vs 23.4%).41,43 Despite
patients’ inclination to use the telephone, more patients showed significant
improvement in clinical and/or psychosocial outcomes when the interventions
were entirely face-to-face (71.4%), as opposed to telephone-only (0%) or a
combination of these modalities (42.8%).
Although a variety of strategies were used to enhance intervention fidelity
during the studies (e.g., written reports, checklists and logs, follow-up phone calls,
audio- and videotaping of sessions), no rigorous approaches were implemented
to recruit suitable peer leader candidates to deliver the interventions. While three
studies did interview the peer leader candidates in person as a screening
strategy,28,31,59 two studies did not mention a screening process or eligibility
criteria.35,58
Only a few studies included demographic characteristics of PLs.30,43,55,59 On
average, PLs were mostly female and had at least a university education,43,55,59
which is consistent with the characteristics associated with health care volunteers
in general.65

37
Although diabetes distress, self-management variables, and glycemic
control are strongly associated with each other,66 few peer support studies
examined DD as a primary psycho-social outcome.
Based on the components of the peer support models identified in this
review, some suggestions to consider in the design of future peer support
interventions are as follows: 1) Include more rigorous screening protocols such as
interviews to evaluate prospective peer leaders’ communication skills and
personality suitability. 2) Consider using a standardized PLT program that
encompasses diabetes knowledge; communication, facilitation, behavioral
modification, and motivational inquiry skills; codes of ethics; and community
resources for patients with diabetes (e.g. educational events, support groups,
etc.).67 3) Consider alternative modalities of contact that may yield the
advantages of both telephone (accessibility and flexibility) and face-to-face
(effectiveness), such as Skype, FaceTime, and social media platforms. 4)
Emphasize that the effect of peer support on psychosocial outcomes (e.g., DD) is
as important as its effect on clinical outcomes. And 5) include an evaluation of the
impact of peer support interventions on PLs’ (as well as patients’) clinical and
psychosocial outcomes.

38
This study has a few limitations. First, despite utilizing a comprehensive,
rigorous search strategy across several databases, we were only able to include
RCTs that were written in English. It is possible there are quality RCTs conducted
in non-English speaking countries. Second, our search strategy only made use of
backward – and not forward – reference searching. This may have caused us to
miss some articles that were published later than the studies we identified.
However, we did carefully assess the studies we found for quality and content
(TIDieR). A hallmark of this study is its use of the TIDieR checklist to robustly
define and report the various components of peer support interventions.
Practice Implications
As limited resources and escalating costs have put new strains on the
health care system, peer support models of diabetes care have emerged as an
effective, long-term, cost-efficient means of sharing experiential knowledge of
diabetes self-management. There is a growing body of literature on the beneficial
effects of peer support on the clinical and psychosocial outcomes of its recipients.
However, considerably less attention has been paid to those providing the
support – the peer leaders. Areas such as the peer leaders’ demographic
characteristics, how they are recruited, the training they receive, and changes in

39
their own health outcomes as a result of providing peer support have rarely been
explored. This lack of evidence presents challenges to health care practitioners
who are uncertain about how to best recruit peer leaders, which models to
implement in training them, and how to effectively deliver a diabetes peer
support intervention. Health care practitioners should benefit from a review of
the existing literature on peer support models of diabetes care, PL recruitment
strategies, and PL training programs, as well as the best components of an
idealized peer support model, all of which are included in this paper. Given that
peer support is often deployed within high-risk, economically vulnerable, and
marginalized communities, our systematic review can assist health care providers
as they design successful, evidence-based interventions for vulnerable patient
populations.
Conclusion
This review examined the various components and process outcomes of
type 2 diabetes peer support interventions. We found that the studies differed
greatly in terms of population, aims, organization, and modality. More research is
needed on the processes underlying peer support interventions and how these

40
processes can be optimized to improve intervention fidelity and – by extension –
outcomes.
Figure 3: Components of Peer Support Interventions in Type 2 Diabetes, Adapted from the Studies Included in This Review
Peer Support Interventions in
T2DM
Peer Leader
Recruitment
Strategies
Recommendations from Health Care
Professionals
Email/Mail Invitations
Diabetes Related Databases
Diabetes Related Associations
Advertisements
Eligibility Criteria
Personal Interest
Have T2DM or Be a Caregiver to a
Patient with T2DM
Good Glycemic Control
Have Basic Knowledge of
Diabetes
Good Communication
Skills
Appropriate Personality
Traits
Training
Communication Skills
Diabetes Knowledge
Facilitation Skills
Behavioral Modification Skills
Motivational Inquiry
Knowledge of Existing Resources for Patients with
T2DM
Ethical Considerations
Intervention Delivery
Outcomes
Clinical
Psychosocial
Patient
Recruitment
Intervention Recipient
Clinical/Psycho-social Outcomes

41
Chapter 3: ’Tis Better to Give Than Receive? Examining the Impact of Providing Support on Glycemic Control and Diabetes Distress at 3 and 12 Months in Peer Leaders.

42
SUMMARY
OBJECTIVE: The objective of this study is to examine the impact of peer
support on peer leaders’ glycemic control and diabetes distress at 3 and 12
months post-baseline as part of the 12-month randomized controlled trial “From
clinic to community: using peer support as a transition model for improving long-
term diabetes-related health outcomes.”
RESEARCH DESIGN AND METHODS: This study was part of a larger
randomized controlled trial (RCT) assessing the effects of a 12-month, peer-led
diabetes self-management support (DSMS) intervention on long-term diabetes-
related health outcomes. Fifty-two peer leaders were recruited between May
2015, and June 2017, and were invited to attend a 30-hour training program. Peer
leaders were matched with participants based on schedule availability, gender
preference, and geographic proximity, and were invited to health-related
assessments at baseline, 3 months, and 12 months. The primary clinical and
psychosocial outcomes were A1C and diabetes distress (DD), respectively.
Secondary outcomes were cardiovascular risk factors – blood pressure (BP), body
mass index (BMI), and waist circumference (WC) – and depression.

43
RESULTS: A majority of peer leaders were male (53.8%) and married or
partnered (55.8%). The peer leaders had a mean age of 57.511, a long history of
diabetes (13.911 years), satisfactory glycemic control (7.0%0.9%), and a low
level of diabetes distress (1.670.52) at baseline. Out of 52 Peer leaders, 43
(82.7%) completed the 12-month study. A1C and DD remained stable over 12
months. There was no statistically significant change in any of the secondary
outcomes.
CONCLUSIONS: Findings of this study suggest that delivering support may
have a stabilizing effect on glycemic control and diabetes distress over the long-
term.
Key words: peer leaders, diabetes distress, A1C

44
INTRODUCTION
One widely used approach to promoting effective diabetes self-
management is diabetes self-management education (DSME) followed by
diabetes self-management support (DSMS).23 Although DSME has been shown to
reduce A1C by 0.76% at immediate follow-up (with an additional 1% reduction
with each additional 23.6 hours of education),68,69 the benefits begin to diminish
after 6 months without ongoing support.23 This concern, coupled with Canada’s
limited human and financial health-care resources and the projected increase in
diabetes prevalence, suggests that new, less resource-intensive interventions are
needed.21 Peer support, in which individuals with diabetes receive support from
others with the same condition, has shown promise as a cost-effective model for
providing ongoing support.29
The relationship between peer leaders and participants hinges on their
shared experiences and challenges living with their disease.27 In addition to
benefiting participants, this relationship may also have a positive impact on peer
leaders, who could gain new skills and abilities, social approval from the
recipient(s) for their help, and improvements to their self-image.51,70

45
Although a growing body of literature examines the effect of peer support
on participants’ clinical and/or psychosocial outcomes, the impact of such
interventions on the peer leaders who have diabetes has not been extensively
investigated. Most studies examining the effect of peer support on peer leader
outcomes have involved chronic conditions other than diabetes.51,71-74 For
example, a survey study of 253 peer leaders in mental health in the United States
reported a positive impact on peer leaders’ interpersonal, social, spiritual, and
professional outcomes, as well as their own recovery and mental health.75 The
only study (to our knowledge) that evaluated the effects of providing peer
support on peer leaders’ clinical, psychosocial, and behavioral outcomes in type 2
diabetes was conducted in Hong Kong. That study reported improvements in self-
care behaviors and maintenance of glycemic control in peer leaders over four
years.30 To contribute to the burgeoning area of research on peer leaders in type
2 diabetes, we carried out this study investigating the impact of delivering peer
support on glycemic control and diabetes distress at 3 and 12 months post-
baseline in peer leaders as part of a 12-month, Peer-led, Empowerment-based
Approach to Self-management Efforts in Diabetes (PLEASED) study.

46
RESEARCH DESIGN AND METHODS
This study is part of an RCT examining the effects of a 12-month peer-led
diabetes self-management support (DSMS) intervention on long-term diabetes-
related health outcomes in a tertiary setting and was approved by the University
of British Columbia Clinical Research Ethics Board.76 For the purpose of this
article, data from peer leaders are used.
PL Recruitment
Fifty-two peer leaders were recruited between May 2015, and June 2017.
Recruitment strategies included: (1) recommendations from Diabetes Education
Center (DEC) staff, (2) flyers posted in DECs and endocrinologists’ offices affiliated
with three different hospitals, (3) invitations sent to eligible patients identified
from the endocrinologists’ electronic medical records (EMR), (4) Vancouver
Coastal Health Research Institute e-blast, (5) the Patient Voices Network
newsletter, and (6) advertisements in local newspapers. To be eligible for the
study, candidates had to: (1) have diabetes, (2) be 21 years of age, (3) speak
English, (4) have transportation to attend training, (5) be willing to commit to a
30-hour training program, (6) have a land-line telephone or mobile phone, and (7)
have a self-reported A1C of 8% or less. Participants with any serious health

47
conditions or addictions to alcohol or drugs that would impede meaningful
participation were excluded.
Peer Leader Training
All interested peer leader candidates were consented and were invited to
attend a 30-hour training (6 training sessions of 5 hours each) adapted from Tang
et al.’s original 46-hour PLEASED (Peer-led, Empowerment-based, Approach to
Self-management efforts in Diabetes) peer leader training program.42 The peer
leader training covered five core competencies: diabetes-related knowledge,
empowerment-based facilitation skills, five-step goal setting, active listening skills,
and perceived self-efficacy. It also addressed the three key components of peer
support: assistance in daily self-management; social and emotional support; and
linkage to clinical care.
Upon successful completion of the training, each peer leader received $400
to offset the costs associated with participation (e.g., time, travel, parking ($120),
etc.).
Exposure/Contact
Peer leaders were matched with participants based on schedule availability,
gender preference, and geographic proximity. Peer leaders were required to

48
make at least 12 weekly contacts with their participants for the first 3 months of
the intervention, and at least 18 biweekly contacts for the remaining 9 months.
The first contact was face-to-face in the sites of the research study, or the
participant’s home or at an agreed-upon community-based location, and the
remaining contacts were via telephone. Each support contact followed a general
structure that included discussing recent self-management challenges; sharing
feelings about these challenges; solving problems; addressing self-management
questions; and setting self-management goals. Peer leaders received a stipend of
$20 per participant, per month, over the 12-month period of the study. To ensure
regular contacts between peer leaders and participants, the research team
periodically followed up with peer leaders.
Sample Size Estimation
The present study is part of a larger RCT examining the effects of a 12-
month peer-led diabetes self-management support (DSMS) intervention on long-
term diabetes-related health outcomes. Based on the main trial sample size
calculation, we estimate that we will need a minimum of 50 peer leaders if each
peer leader takes at least 1 or 2 participant(s).

49
Outcomes and Measurements
Peer leaders who agreed to be paired were invited to undergo health-
related assessments at baseline, 3 months, and 12 months. Measures included
A1C (%), blood pressure (BP-mmHg), body mass index (BMI-kg/m2), and waist
circumference (cm). Peer leaders were also asked to complete self-report surveys
to assess diabetes distress and depression.
The primary clinical outcome was A1C, as measured by a Siemens DCA
Vantage Analyzer A1C point-of-care machine – with a 0.967 correlation coefficient
with lab measurements.77 The secondary clinical outcomes included BP, BMI, and
WC. BP was measured using an Omron BP785 digital monitor. Height and weight
were measured using a portable Seca Stadiometer Model 217 and a digital scale
Model 874, respectively. A Seca 203 ergonomic tape was used to measure WC.
The primary psychosocial outcome was diabetes distress, which was
assessed using the 17-item Diabetes Distress Scale (DDS) developed by Polonsky
et al.78 DD scores of < 2, 2.0–2.9, and >=3 are suggestive of little or no distress,
moderate distress, and high distress, respectively.78 The DDS is specific to
diabetes and assesses four distress-related domains: (1) emotional burden
subscale, (2) physician distress subscale, (3) regimen-related distress subscale,

50
and (4) interpersonal distress. Depression was measured using the Patient Health
Questionnaire (PHQ-9) scale, with scores of 5, 10, 15, and 20 corresponding to
mild, moderate, moderately severe, and severe depression, respectively.79
Statistics Analyses
Descriptive analysis was performed to show frequencies and distribution of
characteristics across the study sample. Continuous data are presented as means
and standard deviations, and categorical data are presented as frequencies. All
analyses are intention-to-treat. A linear mixed effects model with adjustment for
multiple comparisons was used to evaluate the changes from baseline to 3
months and 12 months for all longitudinal outcomes. The “intervention effect” of
outcomes, defined as the changes from baseline to 3-month and 12-month
follow-up, is estimated. Sensitivity analysis is used to ensure that the intervention
effect is not affected by age, gender, or duration of diabetes.
RESULTS
Description of Peer Leaders’ Baseline Characteristics
Of the 75 recruited prospective peer leaders, 58 successfully completed the
peer leader training, and 52 of the 58 agreed to be paired with a participant. Of
the 52 paired peer leaders, 46 completed the 3-month assessment, and 43

51
completed the 12-month assessment (Figure 4). For the purposes of this paper,
we categorized two groups of peer leaders: (1) paired peer leaders, who
completed peer leader training, were paired with a participant(s), and had at least
one contact session, and (2) unpaired peer leaders, who completed the peer
leader training but declined to be paired with a participant. Paired peer leaders
were further divided into active peer leaders, who completed the 12-month
study, and dropouts, who left the study before their final 12-month assessment.
Peer leaders’ baseline characteristics are provided in Table 5. Tables 6 and 7
compare the demographic characteristics of paired peer leaders, unpaired peer
leaders, active peer leaders, and dropouts. There were no significant differences
in baseline characteristics between groups.
Unpaired peer leaders were older and more likely to be retired than paired
peer leaders; dropouts were younger and more likely to be employed than active
peer leaders. While both active peer leaders and dropouts had PHQ-9 scores of
less than 5, the dropouts’ mean score was more than 1.5 times higher than the
active peer leaders’ mean score. The one peer leader who was found to have high
distress belonged to the dropout group. The number of participants assigned to
each peer leader ranged from 1 to 13, with a median of 1. Most peer leaders had

52
1 or 2 participants (57.7% and 26.9%, respectively). Only one peer leader had 13
participants.
There were no significant changes from baseline to 12 months in any of the
primary or secondary outcomes before and after omission of outliers or when
controlling for age, gender, and duration of diabetes.
Glycemic Control
Peer leaders maintained their A1C level through the study without any
statistically significant change from baseline to 3 (P=0.47) or 12 months (P=0.81).
Cardiovascular Risk Factors
Blood Pressure
Systolic Blood Pressure
SBP decreased from baseline to 3 months and 12 months by 1.61 and 0.31,
respectively; however, the changes were not statistically significant.
Diastolic Blood Pressure
DBP showed the same decreasing pattern as SBP over the course of study.
Similarly, there was no statistically significant change at any time.
Waist Circumference
WC increased from baseline to 3 months and 12 months, but the changes
were not statistically significant.
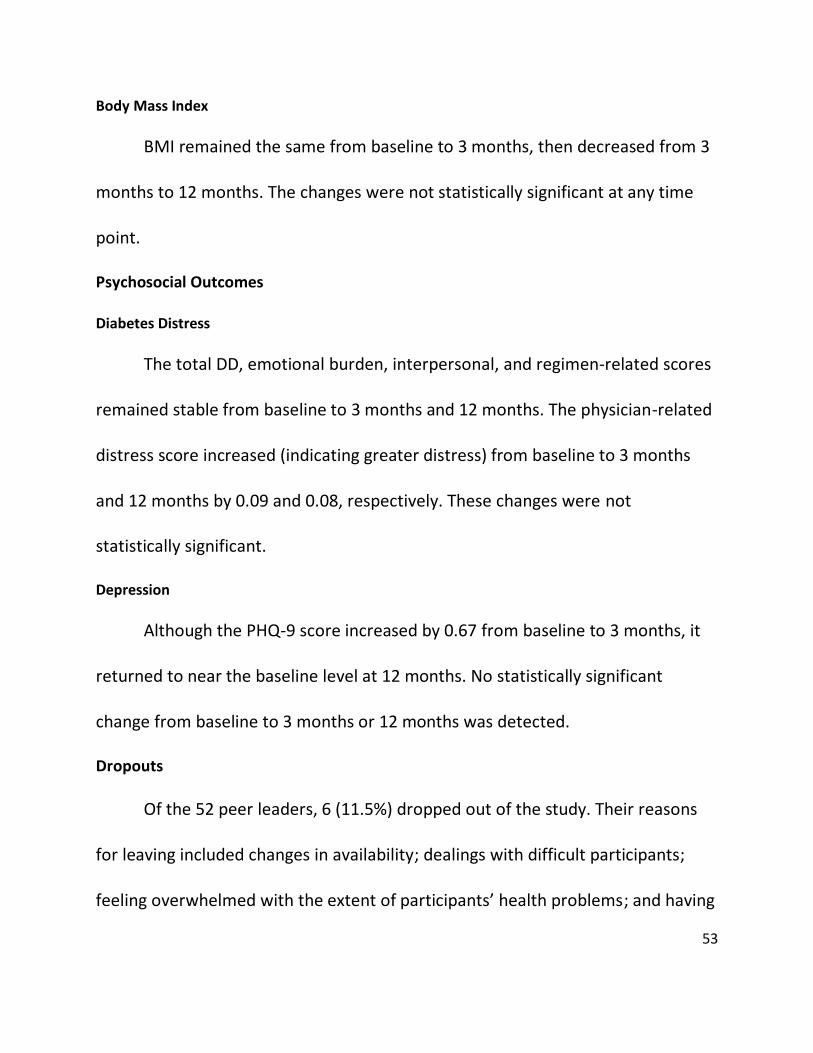
53
Body Mass Index
BMI remained the same from baseline to 3 months, then decreased from 3
months to 12 months. The changes were not statistically significant at any time
point.
Psychosocial Outcomes
Diabetes Distress
The total DD, emotional burden, interpersonal, and regimen-related scores
remained stable from baseline to 3 months and 12 months. The physician-related
distress score increased (indicating greater distress) from baseline to 3 months
and 12 months by 0.09 and 0.08, respectively. These changes were not
statistically significant.
Depression
Although the PHQ-9 score increased by 0.67 from baseline to 3 months, it
returned to near the baseline level at 12 months. No statistically significant
change from baseline to 3 months or 12 months was detected.
Dropouts
Of the 52 peer leaders, 6 (11.5%) dropped out of the study. Their reasons
for leaving included changes in availability; dealings with difficult participants;
feeling overwhelmed with the extent of participants’ health problems; and having

54
greater responsibility than they expected as peer leaders. Please refer to Table 8
for a summary of statistical analyses.
Figure 4: Recruitment and Follow-up of Peer Leaders in a Repeated Measures Study
Eligible patients (A1C < 8%; Age > 21 years old) Ca
52 agreed to be paired
6 refused to be paired
46 completed 3-month follow-up
43 completed 12-month follow-up
n = 75
58 completed training

55
Table 5: Baseline Characteristics of Peer Leaders
N 52
Age (years), mean ± SD 57.511
Male/Female, n (%) 28/24 (53.8/46.2%)
DM 1/DM 2, n (%) 6/46 (11.5/88.5%)
Diabetes duration (years), mean ± SD 13.911
Marital status, n (%) Never married Married or partnered Separated/divorced/widowed
8(15.4%) 29(55.8%) 15(28.9%)
Ethnicity, n (%) Caucasian East Asian South Asian Southeast Asian Others
24(46.2%) 9(17.3%) 12(23.1%) 2(3.8%) 5(9.6%)
Education, n (%) Less than high school High school degree University/college graduate
0(0%) 2(3.8%) 50(96.1%)
Household income < $20,000 $20,000 to $49,999 $50,000 to $69,999 > $70,000
3(5.8%) 13(25%) 7(13.5%) 24(46.2%)
Employment Status, n (%) Employed Retired
26(50%) 16 (30.8%)
PHQ-9 score, mean ± SD 2.72.9
DD score, n (%) Little or no distress Moderate distress High distress
39(75%) 12(23.1%) 1(1.9%)
Anti-hyperglycemic medication, n (%) No medication Oral diabetes medication Insulin GLP-1 non-insulin injectable
6 (11.5%) 36(69.2%) 20(38.5%) 6 (11.5%)
A1C, mean ± SD 7.00.9
BMI, mean ± SD (metric) 30.16.9
WC, mean ± SD 101.217.2cm
SBP, mean ± SD (metric) 126.817.7
DBP, mean ± SD 78.912.1
* WC: waist circumference (cm), SBP: systolic blood pressure (mmHg), DBP: diastolic blood pressure (mmHg)

56
Table 6: Comparing the Baseline Characteristics of Active Peer leaders versus Dropouts
Active Dropouts N 46 6 Age (years), mean ± SD 58.1±10.5 52.2±14.4 Male/Female, n (%) 25/21 (54.3/45.7%) 3/3 (50/50%) DM 1/DM 2, n (%) 5/41 (10.9/89.1%) 1/5 (16.7/83.3%) Diabetes duration (years), mean ± SD 13.8±11.9 14.2±6.1 Marital status, n (%)
Never married Married or partnered Separated/divorced/widowed
8 (17.4%) 25 (54.3%) 13 (28.2%)
0 (0%) 4 (66.7%) 2 (33.3%)
Ethnicity, n (%) Caucasian East Asian South Asian Southeast Asian Others
22 (47.8%) 9 (19.6%) 10 (21.7%) 1 (2.2%) 4 (8.7%)
2 (33.3%) 0 (0%) 2 (33.3%) 1 (16.7%) 1 (16.7%)
Education, n (%) Less than high school High school degree University/college graduate
0 (0%) 2 (4.3%) 44 (95.7%)
0 (0%) 0 (0%) 6 (100%)
Household income < $20,000 $20,000 to $49,999 $50,000 to $69,999 > $70,000
3 (6.5%) 13 (28.2%) 7 (15.2%) 19 (41.3%)
0 (0%) 0 (0%) 0 (0%) 5 (83.3%)
Employment Status, n (%) Employed Retired
23 (50%) 14 (30.4%)
3 (50%) 2 (33.3%)
PHQ-9 score, mean ± SD 2.5±2.6 4±4.9 DD score, n (%)
Little or no distress Moderate distress High distress
35 (76.1%) 11 (23.9%) 0 (0%)
4 (66.7%) 1 (16.7%) 1 (16.7%)
Anti-hyperglycemic medication, n (%) No medication Oral diabetes medication Insulin GLP-1 non-insulin injectable
6 (13%) 32 (69.6%) 18 (39.1%) 5 (10.9%)
0 (0%) 4 (66.7%) 2 (33.3%) 1 (16.7%)
A1C, mean ± SD 6.9±0.8 7.1±1.6 BMI, mean ± SD (metric) 30.1±6.7 30.3±8.1 WC, mean ± SD 101.2±17.2 101.2±17.6 SBP, mean ± SD (metric) 126.8±18.6 127.2±8.9 DBP, mean ± SD 78.6±11.9 81.2±14.7

57
Table 7: Comparing the Demographic Characteristics of Unpaired and Paired Peer leaders
Unpaired Peer Leaders Paired Peer Leaders N 6 52
Age, mean SD 64.713.5 57.511 Male/Female, n (%) 4/2 (66.7/33.3%) 28/24 (53.8/46.2%) DM1/DM2, n (%) 0/6 (0/100%) 6/46 (11.5/88.5%) Diabetes Duration (years), mean ± SD 13.312.5 13.911 Marital status, n (%)
Never married Married or partnered Separated/divorced/widowed
0 (0%) 5 (83.3%) 1 (16.7%)
8(15.4%) 29(55.8%) 15(28.9%)
Ethnicity, n (%) Caucasian East Asian South Asian Southeast Asian Others
3 (50%) 0 (0%) 2 (33.3%) 1 (16.6%) 0 (0%)
24(46.2%) 9(17.3%) 12(23.1%) 2(3.8%) 5(9.6%)
Education, n (%) Less than high school High school degree University/college graduate
0 (0%) 1 (16.6%) 5 (83.3%)
0(0%) 2(3.8%) 50(96.1%)
Employment Status, n (%) Employed Retired
2 (33.3%) 4 (66.6%)
26(50%) 16 (30.8%)

58
Table 8: Changes in Clinical and Psychosocial Outcomes at Baseline and 3-month and 12-month Follow-ups
Outcome Baseline 3-month-baseline 12-month-baseline A1C (%) 7.0 (5.2-10) 0.14 (-0.15 to 0.44)
P = 0.47 0.07 (-0.22 to 0.37) P = 0.81
SBP (mmHg) 126.8 (95-177.5) -1.61 (-6.33 to 3.10) P = 0.69
-0.31 (-5.03 to 4.41) P = 0.99
DBP (mmHg) 78.9(57.5-109) -1.56 (-4.940 to 1.80) P = 0.51
-1.17 (-4.54 to 2.20) P = 0.69
BMI (kg/m2) 30.1 (20.5-53.1) 0.06 (-0.34 to 0.47) P = 0.92
-0.23 (-0.64 to 0.17) P = 0.36
WC (inch) 101.2 (67.5-147.3) 0.35 (-0.29 to 0.99) P = 0.41
0.31 (-0.33 to 0.96) P = 0.47
DDS Emotional burden Interpersonal Physician
Regimen
1.67 (1-3.6) 1.8 (1-5.4) 1.7 (1-4) 1.3 (1-3) 1.8 (1-3.2)
0.01 (-0.11 to 0.13) P = 0.98 -0.02 (-0.17 to 0.14) P = 0.95 -0.02 (-0.98 to 0.21) P = 0.98 0.09 (-0.28 to 1.52) P=0.28 0.02 (-0.17 to 0.22) P = 0.96
0.01 (-0.11 to 0.13) P = 0.98 -0.06 (-0.22 to 0.09) P = 0.62 0.02 (-0.20 to 0.24) P = 0.98 0.08 (0.41 to 1.28) P=0.43 -0.01 (-0.19 to 0.21) P = 0.99
PHQ-9 2.7(0-13) 0.67 (-0.22 to 1.56) P = 0.17
0.04 (-0.85 to 0.93) P = 0.99
DISCUSSION
The effect of peer support interventions on the clinical and psychosocial
outcomes of participants has received considerable attention; what is less well
understood is the impact of these interventions on the individuals who deliver the
support. This study sought to investigate this impact. Our cohort of peer leaders
started the study with a mean A1C and mean diabetes distress level that were
both at target. Following 12 months of providing emotional and behavioral

59
support to participants struggling with self-management, the mean A1C and
diabetes distress levels of peer leaders remained at target. In other words, the
lack of change was a favorable outcome. Moreover, most cardiovascular risk
factors were within recommended guidelines at the beginning of the study and
remained within normal range until the end. (The exception was BMI that was not
within recommended guidelines at the study’s beginning, and remained
essentially unchanged.) Indeed, in the context of medicine, “no news is good
news.”
To date, only one other study has considered the effects of peer support on
peer leaders in diabetes. In Hong Kong, Yin et al. examined the effects of
providing peer support across 79 individuals with diabetes who were recruited to
be peer leaders. Of these 79 individuals, 59 completed peer leader training and
were divided into two groups: 26 who attended peer leader training but refused
to become peer leaders (refused trainees), and 33 who attended the training and
agreed to become peer leaders (agreed trainees). These groups were then
compared with 60 individuals with diabetes who did not attend peer leader
training (usual care). The authors found that, compared to the other two groups,
the agreed trainees more successfully sustained their A1C over 4 years of the

60
study.30 Unlike our repeated measures observational study, the quasi-experiment
design used by Yin et al. allowed for the comparison of within-group A1C changes
across the 3 groups. In addition, the larger sample size enabled them to discern
statistically significant differences among the groups. However, if we isolate the
changes in the Yin et al. study to the “agreed trainee” group, their results are
consistent with our own.
Considering that the peer leader’s A1C and diabetes distress were at target
at baseline, this allowed for minimal room for improvement through the course of
the study. In fact, our peer leaders’ sustained A1C throughout the study could be
interpreted as a desirable outcome given that diabetes is a progressive disease in
which A1C increases, on average, by approximately 0.2% per year. Thus, anything
less than a 0.2% increase may constitute an improvement.80 In addition, The
Action to Control Cardiovascular Risk in Diabetes Study found that intensive
therapy in type 2 diabetes (designed to achieve A1C < 6.0%) increases the
mortality rate and does not decrease major cardiovascular events – especially in
geriatric populations.81 This suggests that, for our leaders (many of whom are
geriatric), further tightening of A1C control might not add benefits and could even
be detrimental.

61
The benefits that peer leaders received by attending the training and
interacting with participants may have also influenced outcomes other than A1C
and diabetes distress. In Yin et al.’s study, the peer leaders who completed the
training program significantly improved on diet adherence and foot care. In a
systematic review and meta-analysis of the effects of volunteering on volunteers’
physical and mental health, no impact on volunteers’ physical health was
observed, but volunteers did have a lower mortality rate, higher life satisfaction,
and higher well-being. Furthermore, qualitative research on other chronic
illnesses (e.g., human immunodeficiency virus [HIV] and multiple sclerosis [MS])
found that assisting others helped peer leaders enhance their personal growth,
empowerment, confidence, self-awareness, and self-esteem.51,82
Peer leaders had a mean age of 57.5 years with a mean duration of
diabetes of 13.9 years. Paired peer leaders were primarily male, married, and
university/college graduates. Four additional studies – two in primary care, one in
community settings, and one in tertiary care – have also reported baseline
demographic characteristics for peer leaders in peer support interventions in type
2 diabetes.30,43,55,59 In these studies, peer leaders were largely older,43,55,59
female,43,55,56,59 and – on average – had a shorter history of diabetes than did our

62
leaders.43,55,56 The differences in the study setting, modality of contact, and time
commitment might play a role in the observed discrepancies across the four
studies. For example, the peer leader population in our study, like that of Chan et
al.’s telephone-based study, was primarily younger than those in face-to-face or
combined (telephone and face-to-face) studies – modalities that might be
perceived as more time-consuming. Interestingly, peer leaders who successfully
completed the study tended to be older than those who dropped out. This could
again be attributed to the greater time availability of older PLs. The younger
prospective peer leaders might have thought that a telephone-based intervention
would require a minimal time commitment, only to later encounter time-
consuming challenges in contacting participants and scheduling calls.
This study has several limitations. First, it was a repeated measures
observational study, and the sample size may have been too small to detect
significant changes over the course of study. Larger sample sizes and controlled
trials are required for further investigations. Second, we did not test the A1C
levels of prospective PLs at the time of recruitment, and instead relied on self-
reported numbers as one of the recruitment eligibility criteria. Consequently,
11.5% of peer leaders had A1C > 8% at baseline. Third, the number of assigned

63
participants significantly differed from one peer leader to another based on the
peer leaders’ availability and interest. As a result, some peer leaders had a higher
amount of participant contacts than the rest. Fourth, while some peer leaders
might have strictly adhered to the frequency and interval of contacts that were
outlined in the study protocol and might have followed the instructions and
strategies taught in the peer leader training program, others may have been more
lax .83 This discrepancy might have varied the impact of the study from one pair to
another. Lastly, although our study dropout rate is within the range of other
studies,30,43,55,58,59 the loss of peer leaders might have attenuated the power of our
statistical analyses.
To our knowledge, this is the first study in North America to examine the
impact of providing peer support on peer leaders in a telephone-based peer
support intervention for adults with type 2 diabetes.
IMPLICATIONS FOR FUTURE RESEARCH
The findings of this study warrant further research on the impact of
providing support on peer leaders in peer support interventions. Similar to Yin et
al., our study was conducted in a tertiary setting. Further investigations are
needed to: (1) examine the impact of such interventions on peer leaders

64
delivering support to participants in other settings (e.g., primary care and
community-based); (2) compare the peer leaders’ sociodemographic
characteristics in different settings using various modalities of contact and
investigate why interested candidates differ, if any divergence exists; and (3)
explore reasons for variation in sociodemographic characteristics in peer leader
training completers who are not paired with participants, peer leader training
completers who are paired with participants, and dropouts.
Although the present study demonstrates that peer leaders sustained their
glycemic control and diabetes distress levels during the year they took part in a
peer support intervention in type 2 diabetes, the benefits they receive may
extend beyond the clinical or psychosocial outcomes we assessed. A mixed
method research design is needed to define the relevant outcome measures and
to systematically examine the impact of such interventions on peer leaders.

65
Chapter 4: A Winning Combination: Exploring the Demographic and Personality Characteristics of Effective Peer Leaders for the Enhancement of Peer Leader Selection and Pairing Models

66
SUMMARY
OBJECTIVE: The purpose of this study is to investigate the demographic and
personality characteristics of peer leaders participating in a 12-month randomized
controlled trial examining the effects of peer-led diabetes self-management
support (DSMS) on long-term diabetes-related health outcomes.
RESEARCH DESIGN AND METHODS: This cross-sectional study is part of a
larger randomized controlled trial assessing the effects of a 12-month peer
support intervention on long-term diabetes health outcomes. In total, 52 peer
leaders were recruited between May 2015 and June 2017. Eligible candidates
were English-speaking adults (age ≥ 21) with diabetes, with a self-reported A1C ≤
8%, who had access to a phone and transportation, and who were willing to
attend a 30-hour training program. Successful graduates of the training program
were paired with participants. Only peer leaders who had at least one participant
complete the baseline and 12-month assessments were eligible to be included in
the study. Thirty-seven of 51 paired PLs met this criterion. These 37 PLs were
asked to fill out a self-reported survey on their sociodemographic characteristics
(age, gender, income, education, etc.) and a Mini-IPIP scale that measured their
“Big Five” personality traits. We categorized peer leaders as effective if their

67
participants sustained or improved their A1C and Diabetes Distress (DD) scores
from baseline to 12 months, and as ineffective if their participants worsened in
any of these parameters.
RESULTS: Of the 37 peer leaders, 20 were deemed to be effective. The
majority of effective peer leaders were male, married, employed, and highly
educated. The mean age for effective PLs was 59.8 (SD=12.5). All PLs scored
highest on agreeableness and lowest on neuroticism. The effective PLs had a
significantly lower baseline DD score (P=0.02) and a significantly higher
extraversion score (P=0.03), compared to the ineffective group.
CONCLUSION: Peer leaders typically scored high in agreeableness and low
in neuroticism. Extraversion, indicating sociability and positive affect, emerged as
the personality trait that best corresponded with peer leader effectiveness.
Key words: peer leader, personality, effectiveness

68
INTRODUCTION
In peer support interventions, volunteer peer leaders provide ongoing
support to participants to help them with their emotional health, as well as
initiate and maintain self-management improvements .27,59 These interventions
have shown promise in promoting better chronic disease self-management.27
Research has shown that volunteers in health care settings (e.g., hospice care) are
generally well-educated, female, and of high economic status.84 The volunteers
also share certain personality traits, such as lower levels of neuroticism and
higher levels of extraversion.84,85 One meta-analytic review found that the “Big 5”
personality traits – Openness, Conscientiousness, Extraversion, Agreeableness,
and Neuroticism (OCEAN) – were strongly correlated with performance
motivation. Individuals who score high in certain traits may be better suited to
setting aspirational goals and achieving program objectives.86 Another study
found that the presence of certain personality traits in volunteers can be used to
predict the volunteers’ performance and the success of the programs they are
involved in.87 Specifically, volunteers who are narcissistic and self-centered tend
to volunteer for shorter durations, while those who are perfectionist, obsessive,

69
and conscientious maintain high standards for themselves and others – enhancing
the quality of their work.87
There is a growing body of literature on how peer-led interventions affect
their participants,29,31-34,37-39,41-43,57,88 but the research on how to best recruit peer
leaders and pair them with participants – especially peer leaders in diabetes – is
very limited.30,43,55,59 This is a critical gap in the literature, as the quality of the
intervention is directly correlated with the quality of the peer leader.
To our knowledge, no other study has explored the personality
characteristics of peer leaders in peer support interventions in type 2 diabetes.
This study fills this gap in the literature by evaluating the personality
characteristics of peer leaders in the 12-month, tertiary-care, telephone-based
Peer-led Empowerment-based Approach to Self-management Efforts in Diabetes
(PLEASED) study,42 and proposes a model for selecting and pairing peer leaders
based on their demographic and personality characteristics.
RESEARCH DESIGN AND METHODS
A detailed description of the study is published elsewhere. A summary is
provided below.76

70
This study, which has been approved by the University of British Columbia
Clinical Research Ethics Board, is part of a randomized controlled trial (RCT) on
the effects of a 12-month peer-led diabetes self-management support (DSMS)
intervention on long-term diabetes-related health outcomes in a tertiary setting.76
For the purpose of this article, we only included peer leaders that had at least one
participant complete both the baseline and 12-month assessments.
Peer Leader Recruitment and Training
We recruited 52 peer leaders from May 2015 to June 2017. Recruitment
strategies included flyers posted in the Diabetes Education Centers (DECs) and
endocrinologists’ offices of three nearby hospitals, recommendations from DEC
staff, invitations sent to eligible patients identified from the endocrinologists’
electronic medical records, Vancouver Coastal Health Research Institute e-blast,
announcements in the Patient Voices Network newsletter, and advertisements in
local newspapers. To be eligible for selection as a peer leader, a candidate had to
(1) be diagnosed with diabetes, (2) be at least 21 years of age, (3) speak English,
(4) have transportation to attend training, (5) be willing to commit to a 30-hour
training program, (6) have a landline telephone or mobile phone, and (7) have a
self-reported A1C of 8% or less. The exclusion criteria included any serious health

71
conditions or addictions to alcohol or other drugs that could hinder meaningful
participation in the study. Prospective peer leaders were consented and asked to
participate in a 30-hour training program adapted from Tang et al.’s original 46-
hour PLEASED (Peer-led, Empowerment-based, Approach to Self-management
efforts in Diabetes) program.59
Intervention
Peer leaders who successfully completed the training were paired with
intervention participants based on mutual availability, gender, and geographical
proximity. Participants were required to have type 2 diabetes and be 20 years or
older, and were recruited from tertiary care. The first contact between the peer
leader and participant was face-to-face at a site of the research study,
participant’s home, or an agreed-upon location in the community. After this initial
contact, the peer leaders were then required to telephone their participants
weekly in the first 3 months of the study, and biweekly in the last 9 months.
Outcomes and Measures
Peer leaders were asked to fill out a self-reported survey that asked for
their sociodemographic characteristics (e.g., age, gender, income, education,
immigrant status, time since immigration), and to complete the Diabetes Distress

72
Scale (DDS), Patient Health Questionnaire (PHQ-9), and Mini International
Personality Item Pool (Mini-IPIP) Scale, which is used to measure the “Big Five”
personality traits.
The Mini-IPIP is a shorter, 20-item version of the 50-item International
Personality Item Pool Five-Factor Model measure. Scores range from 20 to 100.
The internal consistency across different studies is acceptable ( 0.6), and the
test-retest correlations are similar to the parent measure.89 The PHQ-9, a nine-
item instrument for measuring and evaluating depression, was used to measure
depressive symptomology among peer leaders, with scores of 5, 10, 15, and 20
corresponding to mild, moderate, moderately severe, and severe depression,
respectively.79 The DDS is a 17-item self-reported instrument scored on a six-point
Likert scale. It consists of four subscales (emotional burden distress, physician-
related distress, regimen-related distress, and interpersonal distress) that
together yield a total diabetes distress score. For our study, scores of less than 2,
2 to 2.9, and 3 and higher indicated no distress, moderate distress, and high
distress, respectively.78

73
The participants were invited to undergo assessments at baseline, 3
months, and 12 months. The assessment battery included an A1C test and the 17-
item Diabetes Distress Scale (DDS) survey.
Data Analysis
We categorized peer leaders as effective if their participants sustained or
improved their mean A1C and DD scores from baseline to 12 months, and as
ineffective if their participants worsened in these metrics. We compared the
baseline characteristics between the two groups of peer leaders using chi-square
for categorical variables and ANCOVA for continuous variables. Use of ANCOVA
allowed us to control for the number of peer leaders’ participants.
Peer Leader Effectiveness Score
We scored peer leader effectiveness based on two continuous variables: (1)
the difference between participants’ mean 12-month and baseline A1C; and (2)
the difference between participants’ mean 12-month and baseline DD scores. As
diabetes is a progressive disease and higher DD is associated with poorer glycemic
control, sustaining A1C and DD is perceived as a clinically desirable outcome.66,80
The greater the difference for either of these two variables, the higher (or lower)
the peer leader’s effectiveness score was deemed to be. Later, we estimated the

74
correlation coefficient to assess the relationship between personality traits and
the peer leaders’ effectiveness score.
RESULTS
Peer Leaders’ Baseline Sociodemographic Characteristics
Of the 37 peer leaders included in this study, most were male (54%);
married or partnered (54%); university or college graduates (97.3%); and
employed part- or full-time (84%). The mean A1C was 7% (SD=0.8). Ages ranged
from 34 to 79 years, with the mean being 59.5 years (SD=10). The mean years of
living with diabetes was 14.2 (SD=12.7). The mean DD score (1.6±0.4) suggested
low levels of diabetes distress. Although most peer leaders had just one (49%) or
two (32%) participants, some had more, and one had 13.
Of the 37 peer leaders, 20 were categorized as effective. Effective peer
leaders were predominantly Caucasian and had lower household income, a lower
employment rate, and fewer years diagnosed with diabetes than did ineffective
peer leaders. Ineffective peer leaders had tighter glycemic control (6.8 (0.7),
versus 7.1(1) for effective leaders) but a higher PHQ-9 score (2.7(3), versus
2.1(2.2) for effective leaders).

75
In general, the only significant difference in baseline characteristics
between the groups was the total DDS score and two of its subscales – emotional
burden and regimen distress. All three scores were significantly higher for
ineffective peer leaders. Table 9 displays baseline characteristics of effective
versus ineffective peer leaders.
Personality Characteristics
Peer leaders generally scored high on agreeableness and lowest on
neuroticism (agreeableness > openness > conscientiousness > extraversion >
neuroticism). The same pattern was seen in both effective and ineffective peer
leaders. When the two groups of peer leaders were compared, effective peer
leaders scored significantly higher on the “extraversion” trait. Initially, no
significant relationship was found between any of the personality traits and peer
leaders’ effectiveness scores. However, a closer examination of the A1C data
revealed an outlier: a peer leader whose two participants’ A1C decreased by
nearly 50%. After eliminating this outlier from the analyses, we found a strong
positive relationship between extraversion and A1C improvement from baseline
to 12 months (P-value = 0.05).

76
Table 10 and Table 11 show the correlation coefficient between peer
leaders’ personality characteristics and effectiveness. Table 12 compares the Big 5
Personality Traits of effective and ineffective peer leaders.
Table 9: Baseline Demographic Characteristics of Effective versus Ineffective Peer Leaders
Measures Peer Leaders
Effective Peer
Leaders
Ineffective Peer Leaders
P-value
N 37 20 17 -
Age (years), mean (SD) 59.5 (10) 59.8 (12.5) 59.1 (6.2) 0.65
Male/Female, n (%) 20/17 (54%/46%)
11/9 (55%/45%)
9/8 (53%/47%)
1.0
DM 1/DM 2, n (%) 4/33 (11%/89%)
3/17 (15%/85%)
1/16 (6%/94%)
0.61
Diabetes duration (years), mean (SD) 14.2 (12.7) 13.9 (11.5) 14.6 (14.3) 0.81
Marital status, n (%) Never married Married or partnered
Separated/divorced/widowed
6 (16%)
20 (54%) 11 (30%)
3 (15%) 10 (50%) 7 (35%)
3 (18%) 10 (59%) 4 (23%)
0.82
Ethnicity, n (%) Aboriginal Caucasian East Asian South Asian Southeast Asian
Others
0 (0%)
17 (46%) 8 (22%) 9 (24%) 1 (3%) 2 (5%)
0 (0%)
11 (55%) 2 (10%) 4 (20%) 1 (5%)
2 (10%)
0 (0%)
6 (35%) 6 (35%) 5 (29%) 0 (0%) 0 (0%)
0.43
Education, n (%) Less than high school High school degree
University/college graduate
0
1 (2.7%) 36 (97.3%)
0
1(5%) 19 (95%)
0 0
17 (100%)
1.0
Household income, n (%) <20,000 20,000 to 49,999
50,000 to 69,000
70,000
2 (5%)
9 (24%) 6 (16%)
17 (47%)
2 (10%) 7 (35%) 3 (15%) 6 (30%)
0 (0%)
2 (12%) 3 (18%)
11 (65%)
0.08
Employment, n (%) Full-time Part-time Retired
20 (54%) 11 (30%) 6 (16%)
9 (45%) 7 (35%) 4 (20%)
11 (65%) 4 (23%) 2 (12%)
0.54

77
A1C, mean (SD) 7.0 (0.8) 7.1 (1) 6.8 (0.7) 0.41
DD, mean (SD) Emotional Burden Physician Distress Regimen Distress Interpersonal Distress
1.6 (0.4) 1.7 (0.6) 1.3 (0.5) 1.7 (0.5) 1.6 (0.7)
1.4 (0.3) 1.4 (0.4) 1.2 (0.5) 1.5 (0.4) 1.5 (0.5)
1.8 (0.5) 1.9 (0.7) 1.4 (0.5) 1.9 (0.6) 1.7 (0.9)
0.02 0.02 0.31 0.03 0.47
PHQ-9, mean (SD) 2.4 (2.5) 2.1 (2.2) 2.7 (3) 0.44
Neuroticism, mean (SD) 2.2 (0.6) 2.2 (0.6) 2.1 (0.5) 0.60
Extraversion, mean (SD) 3.1 (0.8) 3.3 (0.7) 2.8 (0.8) 0.02
Openness, mean (SD) 4.0 (0.7) 4.0 (0.8) 4.0 (0.6) 0.73
Agreeableness, mean (SD) 4.3 (0.6) 4.2 (0.7) 4.3 (0.5) 0.59
Conscientiousness, mean (SD) 3.8 (0.5) 3.8 (0.6) 3.8 (0.5) 0.59
Table 10: Correlation Coefficient between Peer Leaders’ Personality Characteristics and Effectiveness Based on A1C Difference from Baseline to 12 Months.
Measures Effectiveness Correlation Coefficient1
P-value1 Effectiveness Correlation Coefficient 2
P-value2
Neuroticism - 0.10 (- 0.34 – 0.31)
0.92 - 0.13 (- 0.44 – 0.20)
0.43
Extraversion - 0.11 (- 0.42 – 0.22)
0.51 - 0.32 (- 0.59 – 0.01)
0.05
Openness - 0.01 (- 0.33 – 0.31)
0.94 + 0.10 (- 0.23 – 0.42)
0.54
Agreeableness - 0.05 (- 0.37 – 0.27)
0.75 - 0.01 (- 0.34 – 0.32)
0.94
Conscientiousness - 0.11 (- 0.42 – 0.22)
0.51 - 0.03 (- 0.35 – 0.30)
0.87
1 Effectiveness including outliers
2 Effectiveness excluding outliers Table 11: Correlation Coefficient between Peer Leaders’ Personality Characteristics and Effectiveness Based on DD Difference from Baseline to 12 Months.
Measures Effectiveness Correlation Coefficient P-value
Neuroticism - 0.02 (- 0.35 – 0.30)
0.88
Extraversion - 0.01 (- 0.32 – 0.33)
0.96
Openness - 0.01 (- 0.34 – 0.31)
0.94
Agreeableness 0.30 (- 0.03 – 0.57)
0.07
Conscientiousness - 0.03 (- 0.35 – 0.3)
0.85

78
Table 12: Comparing Big 5 Personality Traits Between Effective and Ineffective Peer Leaders
Measures P for Between Group Difference Mean Difference (Confidence Interval)
Neuroticism 0.50 - 0.13 (- 0.50 – 0.25)
Extraversion 0.03 - 0.55 (-1.06 – - 0.27)
Openness 0.87 0.04 (- 0.42 – 0.49)
Agreeableness 0.65 0.08 (- 0.30 – 0.47)
Conscientiousness 0.78 0.05 (- 0.32 – 0.42)
DISCUSSION
There is a growing body of literature on the effects of peer support
interventions on participants’ health-related outcomes in chronic disease self-
management. Less attention has been directed to peer leaders; their
sociodemographic characteristics or personality traits; or the selection models
used to recruit them. Inquiries in these areas may enhance the effectiveness of
peer support interventions. New data may be especially useful in the context of
one-on-one, face-to-face, telephone-based interventions, where finding the best
possible matches is critical to success.
Consistent with Caidwell et al., our peer leaders (both effective and
ineffective) were largely Caucasian and had high levels of education.84 In contrast
to Caidwell et al., our peer leaders were predominantly men, employed full-time,
and of higher income.84 These differences in peer leader composition may be

79
attributed to our comparatively small sample size, or to differences in clinical
setting: hospice care in Caidwell et al. versus diabetes self-management in our
case.
When we compared the groups in our study, we found that the number of
peer leaders who were retired or employed part-time was higher – although not
significantly so – in the effective group than in the ineffective group. Thus, peer
leaders in the effective group may have had additional time to help their
participants. Effective peer leaders also scored significantly lower in total DD and
two of its subscales – emotional burden and regimen distress – than did
ineffective peer leaders, even though ineffective peer leaders had lower A1C
(albeit by a statistically insignificant amount). This suggests two possibilities: (1)
individuals whose DD is lower in the subscales associated with managing the
personal and regimen-related demands of diabetes (the emotional burden and
regimen distress subscales, respectively) might have better diabetes-related
coping skills, which may equip them to better help others with diabetes self-
management; and (2) peer leaders need not have optimal glycemic control to be
effective. A1C is used mostly as an eligibility criterion for peer leaders’ selection
and may have limited usefulness in predicting peer leaders’

80
effectiveness.31,34,37,43,56 Diabetes distress seems to be a better predictor. Future
peer support studies may consider these findings when establishing their criteria
for peer leader recruitment.
Our findings also suggest that individuals with high levels of agreeableness
and low level of neuroticism were more likely to sign up as peer leaders.
Agreeableness is indicative of altruistic behaviors, sympathy, generosity, and
warmth90 – while neuroticism is suggestive of negative affect (e.g., sadness,
anxiety, anger) and poor reactions to undesirable situations (e.g., threat, loss,
frustration).90 What makes these individuals “effective” (as defined in this article)
may be their level of extraversion.90 This finding is similar to Bruck et al.’s account
of a strong significant correlation between volunteers’ extraversion and their
quality of work.91
We observed no statistically significant relationship between extraversion
and the percentage of A1C improvement from baseline to 12 months, but when
we omitted the one outlier—the peer leader whose participants’ glycemic control
improved by more than 50% throughout the study—we noticed a strong trend
between these two variables. The lack of statistical significance between
extraversion and A1C improvement in the initial analyses before the omission of

81
the outlier might be partly attributable to our study’s telephone-based modality
of contact, which may allow peer leaders who are lower in extraversion to
succeed.
Peer leaders are the foundation of peer support interventions. To enhance
the efficacy of such interventions, robust models for selecting peer leaders and
for matching peer leaders with participants must be defined. Our findings suggest
that low diabetes distress could be an important, underutilized selection criterion
for prospective peer leader candidates. Satisfactory glycemic control (A1C<8%)
could remain a criterion in peer leader selection models, to ensure that peer
leaders possess a minimum level of diabetes self-management knowledge;
however, our results suggest that optimal glycemic control (A1C7%) is not
necessarily suggestive of peer leaders’ effectiveness. For studies that are focused
on clinical outcomes (e.g., improvements in A1C), peer leader candidates with
higher extraversion scores should be recruited. Therefore, we recommend that
peer leader candidates undergo a personality test, and that peer recruitment and
peer pairing models incorporate the results. Recruiting effective peer leaders may
increase not only intervention success rates but also participants’ and peer
leaders’ retention rates.

82
This study is not without limitations. First, its small sample size could have
attenuated the power of our statistical analyses. Second, participants were not
assigned in equal numbers to peer leaders. As a result, some peer leaders might
have allocated more time overall or had less time to spend with individual
participants. To address this gap, we used ANCOVA to control for the number of
participants. Lastly, we defined effectiveness based on the improvement in
participants’ DD and A1C from baseline to 12 months; however, there might be
other factors that participants see as important to peer leaders’ effectiveness
(such as level of satisfaction from peer leader-participant interaction). Further
qualitative research is needed on the participants’ point of view.
What distinguishes this study is that – to our knowledge – it is the first to
examine the personality traits of peer leaders, and the first to propose
adjustments in selection models for recruiting peer leaders and pairing them with
participants in diabetes interventions.
IMPLICATIONS FOR FUTURE RESEARCH
The findings of our study support the inclusion of novel, less utilized
evaluation metrics for the selection and recruitment of peer leaders in diabetes
peer-support interventions. Contrary to convention, optimal glycemic control may

83
not be an accurate metric for predicting the success of a peer leader candidate.
Other selection metrics, such as personality assessments, may be more predictive
of success and should be considered in the selection of peer leaders. For example,
future interventions should consider preferentially recruiting peer leaders that
demonstrate high extraversion. Another potential – and underutilized – selection
metric may be low diabetes distress.
While the findings of this paper provide some guidance on an effective peer
leader selection strategy, further research on this topic is warranted. Specifically,
future investigations should aim to illustrate what attributes – in addition to
personality and diabetes distress – indicate potential success for peer leaders, and
what additional measures – outside of participants’ clinical and psychosocial
outcomes – can be used to quantify a peer leader’s success. These findings,
ideally supported by mixed-methods research with a larger sample size, would
allow us better optimize peer leader recruitment and participant pairings to
improve outcomes.

84
Chapter 5: Qualitative Study: Exploring Peer Support in Type 2 Diabetes from the Peer Leaders’ Perspectives

85
SUMMARY
OBJECTIVE: To explore the peer leaders’ (PLs’) perspectives on core
components of a 12-month telephone-based peer support intervention in type 2
diabetes (T2DM) in a tertiary-care setting.
METHODS: A sequential explanatory mixed-methods approach was utilized.
A purposive sample of seventeen PLs was recruited based on PLs’ and their
participants’ A1C changes from baseline to 12 months. They were then divided
into four groups: (1) mean PLs’ and participants’ A1C improved, (2) mean PLs’ and
participants’ A1C worsened, (3) mean PLs’ A1C improved while participants’ A1C
worsened, and (4) mean PLs’ A1C worsened while participants’ A1C improved.
Three to five PLs were interviewed in each category. Audio files were transcribed
verbatim. The transcripts were analyzed using the qualitative descriptive
approach.
FINDINGS: Overall, PLs reported mutually beneficial and reciprocal
relationships with participants. They encountered challenges in maintaining the
regular contacts with participants and in motivating them to make lifestyle
changes. The program facilitated PLs’ personal diabetes control by raising
awareness and encouraging them to make positive lifestyle modifications. They

86
mostly perceived their diabetes control as inferior to that of their family members
and friends with T2DM (upward social comparison), and as superior to that of
their participants (downward social comparison). These perceptions, together
with the desire to motivate their participants, led some PLs to make behavioral
changes. To improve the program, PLs suggested having more frequent but
shorter training sessions and reducing the amount of reading and composition.
They asked for additional support from the research team, and for more frequent
face-to-face contacts with participants.
CONCLUSION: Overall, the program seems to have benefited the PLs, and
the PLs were satisfied with the intervention design. However, our intervention,
like most programs of this kind, had some limitations, which similar studies in the
future will need to address.
Key words: peer leader, peer support, mixed methods research

87
INTRODUCTION
To achieve optimal diabetes control, patients with type 2 diabetes require
diabetes self-management education and support (DSMES) – a continuous
process that provides them with the knowledge, skills, and support they need in
order to initiate and maintain self-care behaviors on an ongoing basis.23 The need
for long-term support for these patients, together with the limited resources in
the health-care system, necessitates research on efficient, low-cost
interventions.23,49,50 One such intervention, peer support, allows individuals with
chronic health conditions to interact with others who have experience with the
same condition.92 Through these interventions, participants receive social and
behavioral support while learning to cope with the demands of disease
management.93 In addition to being cost-effective, such interventions have shown
promise in improving diabetes self-management not only in patients with type 2
diabetes24,29,32,36,55 but also in peer leaders with the disorder (who may improve
their diabetes management through interactions with their participants).30,94
When two individuals are paired via a peer support intervention, they are likely to
engage in social comparison – defined as “the process of thinking about
information about one or more other people in relation to the self.”92 The target

88
of comparison – in this case, the participant or peer leader – is either perceived as
superior to self (upward comparison) or inferior to self (downward comparison).93
For peer leaders, social comparison is more likely to be downward.93 This type of
comparison may occasionally cause individuals to experience negative
emotions, as it reveals that their situation could be worse. However, it more often
prompts self-evaluation and self-enhancement,45 which can lead to health
benefits for the individual.
The scientific literature to date has mostly investigated the health care
professionals’ and participants’ experiences during the peer support intervention
and has devoted much less attention to the peer leaders’ experiences. To our
knowledge, there is only one diabetes study that qualitatively investigates the
peer leaders’ experiences/opinions during the intervention period. Accordingly,
the first objective of this study is to use face-to-face interviews to collect and
examine the peer leaders’ thoughts about the different components of the
intervention, the characteristics of an effective peer leader, and their experiences
during the support-delivery period. A second objective is to investigate how social
comparison in a telephone-based peer support intervention affects the peer
leaders’ diabetes self-management in a tertiary care setting.

89
RESEARCH DESIGN AND METHODS
This qualitative study follows a larger randomized controlled trial study
evaluating the effects of a 12-month peer-led diabetes self-management support
intervention on diabetes-related health outcomes. The detailed description of the
study is published elsewhere.76 A brief summary is written below. To inform the
present research question, we utilized an explanatory sequential model using a
qualitative descriptive approach.95-99
Peer Leader Recruitment and Training
In total, 52 peer leaders were recruited from May 2015 to June 2017.
Eligible candidates were required to have diabetes, be 21 years of age, speak
English, have access to transportation to attend training sessions, be amenable to
committing to a 30-hour training program, possess a land-line or mobile phone,
and have a self-reported A1C 8% (A1C is an indicator of glycemic control over
the past 3 months. The normal A1C range for healthy individuals is below 6%; A1C
7% is considered optimal glycemic control for patients with diabetes.).
Interested individuals were consented and subsequently attended a 30-
hour training (consisting of 6 sessions of 5 hours each) adapted from Tang et al.’s
original 46-hour PLEASED (Peer-led, Empowerment-based, Approach to Self-

90
management efforts in Diabetes) peer leader training program.67,100 The training
was designed to cover the knowledge and skills that peer leaders would need to
help their participants make diabetes-related lifestyle changes. The three key
components of peer support addressed during the trainings were as follows: (1)
assistance in daily self-management, (2) social and emotional support, and (3)
linkage to clinical care. Some of the strategies that PLs were trained to use in
order to motivate their patients for lifestyle modifications were: (1) active
listening, (2) empowerment-based facilitation strategies, (3) reflective listening,
(4) goal setting, (5) action plans, and (6) problem solving.
Intervention
Upon completing the training program, the peer leaders who were willing
to be paired were matched with participants based on schedule availability,
gender, and geographic proximity. They were then invited to a face-to-face
session to get acquainted with their participant. Peer leaders contacted their
participants weekly by phone in the first 3 months, then biweekly by phone for
the last 9 months.
Semi-Structured Interviews
After the 12-month study, peer leaders were divided into four categories

91
based on the changes in their own and their participants’ A1C over the course of
the study: group 1 (), in which mean peer leaders’ and participants’ A1C both
improved; group 2 (), in which mean peer leaders’ and participants’ A1C both
worsened; group 3 (), in which mean peer leaders’ A1C improved while
participants’ A1C worsened; and group 4 (), in which mean peer leaders’ A1C
worsened while participants’ A1C improved. (Note that arrows reflect A1C levels,
so a down arrow represents an improvement.) Out of 52 peer leaders, a
purposive sample of 17 – three to five from each category – were recruited and
invited to attend a semi-structured interview conducted by two interviewers.101-
103 At the beginning of the interviews, peer leaders were asked to fill out a short
survey. The interviewers (BM, AA) then asked the peer leaders questions from the
interview question guide. They began with open-ended questions designed to
explore the peer leaders’ perceptions of the purpose of the study and the
different phases and components of the intervention. As needed, the
interviewers followed up with probing questions in order to further clarify the
peer leaders’ responses or to ensure that the peer leaders understood the original
questions. Interviews lasted approximately 20 to 45 minutes. We continued to
interview until saturation was achieved in every group except group 3, where the

92
number of peer leaders was limited.104
Analysis Process
The recordings were transcribed verbatim. Transcripts were quality-
checked for accuracy and analyzed using NVivo 12 Software. Qualitative
descriptive analysis was used to assess the semi-structured interview data.95 All
the quality-checked transcripts were uploaded to the NVivo 12 software. The
categories were predefined and identified based on the findings of the
quantitative phase. These predefined categories were created in the software.
Two authors (RA and ASA) reviewed the transcripts line by line to code the data
and identify statements for each predetermined category; dragged and dropped
the appropriate texts to the relevant folder; looked for emerging themes; and
created the nodes (themes) in the NVivo software. The similar responses in each
node were counted and then grouped together to find a description of the
pattern. Upon completion, the results were merged, and the differences were
sorted by consensus. Ultimately, a detailed description of the peer leaders’
experiences was generated and compared across the four groups.
Data Trustworthiness
In order to endorse the credibility, transferability, and dependability of the

93
data, we used triangulation of data methods and triangulation of investigators.105
We reviewed the field notes and treatment fidelity forms that were completed by
peer leaders during the quantitative phase. We also asked different team
members to interview and analyze the data, and took their various perspectives
into consideration.
Ethical Considerations
This study is approved by the University of British Columbia Clinical
Research Ethics Board. Informed consent was obtained from peer leaders, who
were provided a small honorarium for their participation. To respect peer leaders’
confidentiality, numbers or pseudonyms were used to refer to peer leaders
throughout the article.
FINDINGS
Description of the Sample
The mean age of interviewed peer leaders was 61.3 years (range=48 to 79;
SD=8.9). The mean number of years lived with diabetes was 15.3 (range=2 to 59;
SD=13.7), and the mean A1C level was 7.0 (range=5.8 to 8.8; SD=0.9). Of the 17
interviewed peer leaders, 58.8% (n=10) were male and 41.2% (n=7) were female.
Peer leaders were largely Caucasian (58.8%; n=10); employed (41.2%; n=7), and

94
married or partnered (47.1%; n=8). All were highly educated. Although most peer
leaders had 1 (35%) or 2 (35%) participant(s), the number of assigned participants
differed significantly from one peer leader to another (from 1 to 13). Please refer
to Table 13 and Table 14 for details.
Table 13: Interviewed Peer Leaders' Characteristics at Baseline (N=17)
Age (years), mean ± SD 61.38.9
Male/Female, n (%) 10/7 (58.8%/41.2%)
DM 1/DM 2, n (%) 1/16 (5.9%/94.1%)
Diabetes duration (years), mean ± SD 15.313.7
Marital status, n (%) Never married Married or partnered Separated/divorced/widowed
3(17.6%) 8(47.1%) 6(35.3%)
Ethnicity, n (%) Caucasian East Asian South Asian
10(58.8%) 3(17.6%) 4(23.5%)
Education, n (%) University/college graduate
17(100%)
Household income (n=15) < $20,000 $20,000 to $49,999 $50,000 to $69,999 > $70,000
1(5.9%) 4(23.6%) 3(17.7%) 7(41.2%)
Employment status, n (%) Employed Retired Other
7(41.2%) 6 (35.3%) 4 (23.5%)
A1C, mean ± SD 7.00.9

95
Table 14: Peer Leaders' and Participants' A1C changes from baseline to 12 months
Group 1 () PL ID PL’s A1C
(Baseline) PL’s A1C
(12 months) Participant’s A1C
(Baseline) Participant’s A1C
(12 months) PL No. 1 8.4 6.8 12.6 6.4 PL No. 2 8.5 7 10.3 9 PL No. 3 6.9 6.4 7.4 7.2 PL No. 4 6.5 5.3 7.8 5.4 PL No. 5 6.2 5.6 8.4 7.7
Group 2 ()
PL ID PL’s A1C (Baseline)
PL’s A1C (12 months)
Participant’s A1C (Baseline)
Participant’s A1C (12 months)
PL No. 6 6.9 7.3 7 6.9 PL No. 7 7.8 11.8 8.1 7.5 PL No. 8 6.9 7.4 8.2 7.7 PL No. 9 5.9 6.1 10.3 8.4
PL No. 10 7.2 7.8 7.7 7.3
Group 3 ()
PL ID PL’s A1C (Baseline)
PL’s A1C (12 months)
Participant’s A1C (Baseline)
Participant’s A1C (12 months)
PL No. 11 7.2 6.4 9.6 11.6 PL No. 12 8.8 8.7 9.5 9.7 PL No. 13 7.3 5.9 6 6.8
Group 4 ()
PL ID PL’s A1C (Baseline)
PL’s A1C (12 months)
Participant’s A1C (Baseline)
Participant’s A1C (12 months)
PL No. 14 5.8 6.1 6.3 9.1 PL No. 15 6.8 7.8 6.4 6.9 PL No. 16 6.4 6.9 5.8 6.4 PL No. 17 6.1 6.2 3.9 6.7
Peer Leader Training Program
In this section, we asked for the peer leaders’ opinions on different
elements of the training program, including the diabetes knowledge sessions
presented by health care professionals, the communication and motivational

96
inquiry skills training, and the group exercises.
I would not have known what to do and what to not to do if I had not
done the training: All peer leaders agreed that the training program was relevant
to their responsibilities during the study, the components of the training were
beneficial and practical, and that the research team achieved the primary training
goal, which was to equip peer leaders with specific sets of skills (e.g.,
communication, facilitation, motivational inquiry) that were vital to the
intervention. The educational sessions conducted by invited speakers – a certified
diabetes educator, a dietitian, an endocrinologist, a fitness educator, and a
psychologist – helped give the peer leaders the skills and confidence they needed
to encourage participants to make lifestyle modifications and improve their
diabetes control. Their overall impression was that the training program was
comprehensive, well-organized, and instructive.
Peer Leader Training Sessions – Quotes Peer Leader No. 4 “I would have not known what to do and what not to do If I had not done
the training.” Peer Leader No. 11 “It was [a] really well-organized … very comprehensive program. It was
very educational and very practical also. We did a lot of activities … [including a] very rich book they gave us about diabetes.”
Peer Leaders-Participant Contact
In this section, we asked the peer leaders for their thoughts about using the
telephone as the main modality of contact and about the frequency of contact

97
with their participants (one initial introductory face-to-face session, 12 weekly
phone calls for the first three months, and 18 biweekly phone calls for the rest of
the year).
Modality of Contact
Face-to-face contact is better, but the chances of failure are higher: The
peer leaders concurred that face-to-face was the ideal modality of contact, but
noted that barriers such as weather, physical presence, and geographical distance
sometimes made such meetings impractical. They generally agreed that a
combination of face-to-face and telephone contacts would be best.
Modality of Contact – Quotes Peer Leader No. 7 “Face-to-face [contact] is better, but the chances of failure [are] higher. A
combination is acceptable, with more frequent face-to-face sessions.” Peer Leader No. 17 “Combination of telephone and face-to-face is fine. It’s essential to meet
the person at the start, and then it depends on both parties’ lives.”
Only one peer leader preferred telephone over other modalities of contact;
another PL preferred meeting face-to-face.
Frequency of Contact
Should the frequency of contact be defined based on individuals’ unique
needs? The majority of peer leaders were satisfied with the frequency of contact.
A few peer leaders suggested less frequent contacts due to the 12-month
duration of study, but others thought weekly contacts might be more effective

98
because biweekly contacts are infrequent enough for participants to go “off
track.”
Frequency of Contact – Quotes Peer Leader No. 5
“I think it’s important that we met initially. In a way, it … might have been good to meet throughout [the study] once or twice. I think initially [for the first few months] once a week, and then … the two-week intervals are good.”
Peer Leader No. 10 “I thought that it was actually fine the way it was, with a minimum of biweekly contacts.”
A few peer leaders underscored the importance of being flexible in the
frequency of contacts and tailoring the frequency to participants’ needs.
Frequency of Contact – Quotes Peer Leader No. 2 “I was in contact with her as many [times] as it took.”
Peer Leaders
Peer Leaders Motivation to Participate
The goal of this section was to look into peer leaders’ motivations for
participating in the program, and to determine whether different motives among
the four groups might have affected the clinical outcomes for peer leaders and
their participants.
Does personal motivation triumph over altruism? When peer leaders
discussed their reasons for attending the program, three themes emerged: (1)
personal gains; (2) altruism; and (3) referrals.

99
Some peer leaders joined the program for personal reasons: to compare
their diabetes control to that of other peer leaders and participants, and to push
themselves to invest more effort in their diabetes self-management in order to
keep up with family members and friends with type 2 diabetes. They took part in
the program because they hoped to learn more about self-care and diabetes
management while helping their participants.
Some entered the program with altruistic intentions of giving back to the
community and using their communication skills and positive personality
characteristics to help others.
And some participated mostly because they were referred by physicians or
diabetes educators who thought they had exceptional skills and knowledge to
share with others with type 2 diabetes.
Motivation for Participation – Quotes Peer Leader No. 2 “I wanted to give something back to the country that was good to me. I got
something out of it. … I can be quite selfish.” Peer Leader No. 4 “My mother, she was a blood sugar patient for … 30 years and she’s not on
the insulin. Maybe that was my motivation, that ‘Hey, she has done that and why shouldn’t I?’ ... [I] can live healthy as long as I control sugar.”
Peer Leader No. 5 “I attended the program because I knew I had to learn more about myself. I thought I had a lot of good skills to offer. … It is not all altruistic.”
Peer Leader No. 8 “I found [out] about it from my doctor and he said I might be a good candidate for this.”

100
Peer Leader Experiences
In this section, we explored the peer leaders’ experiences during the
intervention, including challenges they overcame and benefits they gained.
Peer leaders were pleased overall with the study and their participants. In
describing their experience, peer leaders often highlighted three factors: (1) their
participants’ motivation to change; (2) the quality of relationship(s) with their
participant(s); and (3) the impact of the study on their own diabetes control.
Two-way street and an interactive relationship: They described their
relationships with participants as reciprocal, interactive, and collaborative, with
ample sharing of ideas and diabetes knowledge, and mainly believed that their
gains exceeded their expectations. They learned from the interactions, including
the participants’ personal accounts and struggles. “I really really learned a lot, not
just academically, but … from my peers,” said one peer leader.
Did we get along like a house on fire? Peer leaders’ experiences depended
partly on how motivated their participants were to change. Some were satisfied
with their participants and their progress over the course of study; others felt
challenged by their participants’ lack of motivation to change or even set up
meetings. A number of peer leaders realized that the experience benefited their

101
diabetes control awareness; a few felt that their accomplishments were limited to
psychosocial and not clinical outcomes.
How may I stop getting into a rut being a diabetic? Peer leaders described
three main benefits of the study: (1) as an eye-opener to the consequences of
poorly controlled diabetes and the benefits of diabetes self-management
improvement; (2) as a means to enhance their diabetes knowledge; and (3) as an
avenue to psychosocial benefits.
The majority of peer leaders noticed that their participation served as a
warning about shortcomings in their diabetes self-management and as a reminder
of the repercussions of uncontrolled diabetes. One remarked that he had been
able to “clean up [his] own life in the process of [helping] somebody else.” Peer
leaders noted that their diabetes self-management improvement transpired at
different stages of the study: (1) in the course of peer leader training program; (2)
after the training and prior to the start of the intervention, as they prepared to
coach their participants; and (3) during the intervention period, through the
exchange of information and ideas with participants.
Peer leaders’ knowledge of diabetes increased significantly over the course
of the study. “I learned a lot more about diabetes than [from] having been a

102
diabetic for more than 17 years,” one recalled. Some perceived their learning as
mainly an accumulative process that occurred during the training sessions and in
their interactions with their participants.
They described the psychosocial benefits as “reinforcement,” “psychosocial
satisfaction through helping others,” and “reducing the feeling of isolation by
resonating with someone who suffers from the same health condition and
struggles with the same challenges.”
Peer Leader Experiences – Quotes Peer Leader No. 5 “I really enjoyed it. I found it was a really collaborative kind of thing. I
looked at it as a two-way street and an interactive relationship.” Peer Leader No. 9 “it was more an eye opener, as they opened up and talked about their
personal challenges.” Peer Leader No. 13 “It varied. Four of them were really easy to get a hold of … Three guys,
they were all highly motivated … and I found I got as much from them as I gave them – I thought that was reciprocal.”
Peer Leader No. 17 “In one way, it was very positive, because we got along like a house on fire. … In another way, I’m not sure how much I actually helped her. I know I made somewhat of a difference, but I don’t know if I made a difference in the A1C. But in life – yes.”
Peer Leader Experiences – Quotes Peer Leader No. 5 “I learned a lot more about diabetes [from this program] than [from]
having been diabetic for more than 17 years. … Being a peer counselor made me want to be a really good example, in other words, walk the walk. … I felt it was a responsibility that I owed both of us.”
Peer Leader No. 6 “For me, we exchanged information and ideas on how to manage. ... So, I feel that it helps both ways – as a peer leader and participant. It’s uplifting when you can help people and they thank you and they say, ‘Wow, it’s working for me.’”
Peer Leader No. 9 “I really learned a lot … through studying all the resources, especially the personal accounts from the participants, their struggles and everything.”
Peer Leader No. 10 “Honestly, I know nobody with diabetes except me, right, so … it’s kind of nice to know there’s other people out there and you can help [them] and

103
kind of understand what’s going on with you.”
Peer Leader Experiences – Quotes Peer Leader No. 9 “It’s like warning bells for me, like [if] you don’t do this, you’re going to be
having this problem.”
“Well, I became more aware … that I was in a rut and that perhaps it would be a good idea to get out of that rut – and I did fairly well. And I am more aware of what we eat.”
Peer Leader Experiences – Quotes Peer Leader No. 1 “I am conscious of what I’m putting in my body. … I exercise at home and
[am] aware of my body more.” Peer leader No. 2 “I cleaned up my own life in the process of helping somebody else. ‘Wow, I
actually received more than I gave.’ I made the changes that I was trying to place on the other person, and I realized, before I’m able to teach someone or motivate somebody, I gotta be sure and certain of myself, and perfect my behavior, and participate in the program.”
Peer Leader Experiences – Quotes Peer Leader No. 6 “It gave me more empathy. … Overall, [it] improved [my] health and gave
[me] satisfaction that [I] can do something for others.” Peer Leader No. 12 “I’m not sure it has affected me a great deal. But I do see the study as
positive, because I also thought a lot more about my own diet and I have upped my own exercise.”
Peer Leader Experiences – Quotes Peer Leader No. 17 “Just giving me an interest outside myself and outside my house. …
Especially with retirees, that’s really important, having avenues outside your own house.”
I don’t know if I made a difference in the A1C; but in life – yes!
Because the peer leaders had different motivations for attending the
program, they also had distinct perceptions about what constituted a successful
change for them and their participants. A number of peer leaders considered
improvement in their own and their participants’ A1C as a success; a few said

104
helping others was rewarding and made them feel uplifted; some felt they had
made a difference in a participant’s life by being present, whether or not a
diabetes-related outcome was achieved. Only a few peer leaders seemed to have
intuited the purpose behind the study – to evaluate the impact of providing
support on their and their participants’ primary diabetes-related clinical and
psychosocial outcomes – but all felt that they somehow benefited by
participating.
Every participant brought her or his own unique culture, background,
school of thought, and understanding of the study objectives to the study, and
this contributed to the strength of the group.
Challenges
Discipline is the hardest part: Peer leaders discussed challenges that arose
for them at (1) the personal level; (2) their participants’ level; and (3) the study
level. On the personal level, some peer leaders struggled with the discipline
required to contact their participants regularly over the 12-month course of the
study. At the participants’ level, peer leaders struggled to involve and motivate
their participants to make changes. At the study level, peer leaders were unable
to master all of the aspects of diabetes self-management that were taught during
the peer leader training program.

105
Challenges – Quotes Peer Leader No. 5 “The challenges were the length of time. I felt a year was too long.
Toward the end [because we had developed a friendship] there were times when I could have done better than I did. I could have done one or two follow-ups that I didn’t do.”
Peer Leader No. 9 “Trying to connect with her was difficult.”
Peer Leader No. 14 “I had a couple of challenges with a couple. … [I] couldn’t really get them motivated to change. … [They] weren’t interested really in changing the routine.”
Peer Leader No. 15 “It was almost as if his mind was already made up, and I would say he dropped out of the program because … it really was not going to do anything for him, as far as he was concerned.”
Effective Peer Leaders
In this section, we explored the peer leaders’ perspectives on the outcome
measures that are used to gauge peer leaders’ effectiveness and on factors that
make for effective peer leaders (including personality characteristics).
Outcome Measures
The peer leaders defined effectiveness based on two benchmarks: 1)
participants’ A1C improvement, and 2) participants’ diabetes knowledge
enhancement.
A1C improvement as the main benchmark: The peer leaders believed that
improvement in participants’ A1C level is one of the most – if not the most –
important outcome measure for peer leader effectiveness because A1C is the
main index of glycemic control. Some peer leaders also considered “diabetes

106
knowledge” to be an important outcome measure, since knowledge building is
part of the reciprocal relationship between peer leader and participant.
Outcome Measures for Evaluation of Effective Peer leaders – Quotes Peer Leader No. 10 “In terms of any other improvement or sort of benchmarking … we have
to have a goal ... and the A1C, unfortunately, we all live with it, so that’s the primary number you have some relationship with, and then everything else after that.”
Characteristics
It definitely takes more than some certain personality characteristics to
become an effective peer leader: The peer leaders perceived effective peer
leaders as individuals who possess certain personality characteristics and
interpersonal skills. The personality characteristics included empathy, patience,
assertiveness, open-mindedness, and compassion. Translated to the Big Five – a
theory that identifies five distinct traits (openness, conscientiousness,
extraversion, agreeableness, neuroticism) – the characteristics and skills valued by
peer leaders mostly fall under extraversion, conscientiousness, and openness. The
peer leaders stressed that effective peer leaders should also be nonjudgmental,
motivational, and positive; display a sense of humor; make themselves available
for their participants; possess strong interpersonal, communication, listening,
organizational, and time management skills; and have a strong command of
English (preferably native English speakers).

107
Characteristics of Effective Peer Leaders – Quotes
Peer Leader No. 8 “I don’t think on a one-on-one interaction, extraversion matters very much.”
Social Comparison as a Mechanism of Change
In this section, we looked into peer leaders’ motivation to make behavioral
changes and explored the role of social comparison in those changes. In the
theory of social comparison, patients with chronic conditions actively compare
their chronic disease management and control with others with the same
condition. When comparing themselves with participants whose control is
superior (upward social comparison), the peer leaders may feel motivated to do
more to reach a similarly high level of control; when comparing themselves to
participants whose control is inferior (downward social comparison), the peer
leaders may feel encouraged to make positive changes to prevent their disease
from advancing to the level of their participants, or the peer leaders could
become discouraged and allow their control to worsen.
Downward and upward social comparisons are forms of external
motivation.100 Participants could also change as a result of internal motivation.
Internal motivation is based on behaving well for its own sake.106

108
A number of peer leaders utilized both subtypes of external motivation
(upward and downward social comparisons). They sought to improve their
diabetes control in order to match that of family members or friends (upward
social comparison), then worked to ensure that their diabetes control stayed
superior to that of participants who had suffered diabetes complications
(downward social comparison). Some peer leaders maintained or improved their
glycemic control as they prepared to coach their participants, so that they could
demonstrate superior diabetes control (downward social comparison). There was
only one peer leader who perceived his glycemic control as inferior to his
participant’s (upward social comparison).
A few peer leaders credited internal motivations (e.g., two-way exchanges
of information; the desire to be healthy in general) for their changes in their
diabetes self-management.
Social Comparison as a Mechanism of Change
Peer Leader No. 1 “[I] helped [my] participant to manage her diabetes.” [downward social comparison]
Peer Leader No. 5 “I tried not to compare them to each other as they’re individuals, nor did I compare myself to them. I had a stake in their positive growth … [and] they had a stake in mine. I learned as much from them as they did from me.” [internal motivation]
Peer Leader No. 12
“Positive changes were related to [my] personal desire to be healthy and well and [my] recent success in paramedic exams.” [internal motivation]
Peer Leader No. 14
“The only difference I feel is I may have more knowledge, but we encourage each other and motivate each other to do better.” [downward social comparison]

109
Peer Leader No. 16
“[I] kept myself as controlled by diet and exercise. [My] participant is still a regular [follower], but [has] better-controlled sugar levels.” [upward social comparison]
Peer Leaders Opinion on Future Direction of Intervention
Peer Leader-Participant Pairing Guidelines
We asked our peer leaders what factors (besides availability, gender
preference, and geographic proximity) researchers should consider when pairing
peer leaders with participants in order to make peer support interventions
successful.
Some sort of approximation in life is essential for pairing: The peer leaders
suggested three factors: (1) similarities in personal characteristics such as age,
gender, background (e.g., social, job, family status, etc.), expectations, and
personality; (2) diabetes-related commonalities such as stage of disease and the
extent of diabetes knowledge; and (3) similar life circumstances.
Peer Leader-Participant Pairing Guidelines – Quotes Peer Leader No. 2 “The research team have to know the peer leaders fairly well to pair them
with participants. Similar personalities ... having some sort of approximation of levels in their life.”
Peer Leader No. 5 “Matching [peer leaders] and peers who are both on insulin would be good.”
Peer Leader No. 9
“I guess if people are more similar, in outlook in life, it might work better.”
Peer Leader No. 10 “I would say that a little bit more emphasis on managing the expectations of both sides [is needed], so they’re a little bit more clear on what the expectations are.”
Peer Leader No. 14 “You guys need to learn or get to know the peer leaders as well. Get to

110
know our traits, so that when you’re interviewing your participants, you know us, so then you get to know who to pair.”
Research Team Support Contact
In this section, we explored the peer leaders’ point of view on the support
they received from the research team and their expectations of the research
team.
I needed more support… A number of peer leaders needed more support
from the research team over the year of study. The peer leaders believed that
regular face-to-face meetings should have been scheduled with the research
team, so that peer leaders could more directly discuss their challenges and seek
advice.
Research Team Support Contact – Quotes
Peer Leader No. 13
“I thought everyone did their job well, but the structure [of research team contact] could have been better … [with] peer leaders and one of you folks here just to discuss things, or to get once a month for that. I prefer face-to-face, obviously.”
Peer Leader No. 17 “Probably a bit more contact from the group to see where you are at.”
They also asked for a single point of contact who would be available
throughout the study to answer questions or address difficulties.
Research Team Support Contact – Quotes Peer Leader No. 1
“I felt there was enough support. … But I wouldn’t know who to talk to. Every time I come in, [it’s] ‘But who are you?’ It’s always someone else that’s calling me.”

111
Dropouts
In this section, we asked our peer leaders for their opinions on what the
research team could have done to lessen the peer leader and participant drop-out
rate.
To decrease peer leader dropout rate, the peer leaders suggested 1)
recruiting suitable candidates through robust screenings; 2) establishing a better
matching system to find appropriate pairs; 3) withholding payments until the end
of the study; 4) inviting effective peer leaders to mentor newly graduated
individuals; 5) providing peer leaders with more support; and 6) conducting
sessions where peer leaders can meet and share their challenges and suggestions.
Peer Leader Dropouts – Quotes Peer Leader No. 9 “I guess maybe … if you’ve had people that were successful and you keep
them on … then when you bring on new ones, you have them interact with them, maybe that will help.” “I guess peer leaders could be brought together. … Then people could tell about problems they’ve encountered and how they were able to solve it or … if we could learn from … some successful peer leader … who [is] doing so well and … could talk about it and give us tips or whatever.”
Peer Leader No. 17
“Get peer leaders together at three months to share their experience. … Hand out some advice and suggestions to peer leaders.”
To decrease the participant dropout rate, peer leaders suggested 1)
implementing robust screenings before participants’ recruitment and pairing; 2)
recruiting participants with flexible schedules and availability; 3) limiting the

112
number of participants to no more than five per peer leader; 4) adding more face-
to-face meetings between telephone contacts; 5) having the study organizers
follow up regularly with both participants and peer leaders; 6) showing
appreciation for participants’ time and effort through non-monetary rewards; and
7) introducing newly enrolled participants to previous participants who benefited
from the program.
Participant Dropouts – Quotes Peer Leader No. 6 “I would say that they would only get $30. But I think it would be good to
reward participants not by money.” Peer Leader No. 9 “The same thing with patients, when you have new patients come in, and
you have patients that are in the program already, and they’re successful or doing better, and you have them interact with those patients.”
Peer Leader No. 16 “I think definitely, maybe look towards someone that has more comparable personality traits or someone that can get along. … Some people do have issues with being matched with a male or a female or … maybe there’s some racial issues too … maybe this person’s a bit of a bighead or … maybe [it’s] the age thing.”
Program Improvement
We ended the interviews by asking peer leaders for their recommendations
on how to improve similar studies in the future.
The peer leaders recommended increasing the frequency of training
sessions but decreasing their duration; shortening the diabetes knowledge
component and making it suitable to everyone’s learning ability; and integrating
technology into the program (e.g., having an online library). They suggested that

113
the training be held in larger groups consisting of candidates with similar
backgrounds, so that the candidates can benefit more from class discussions. Peer
leaders would have also appreciated feedback from health-care professionals
during the training; refresher training; and sessions where frequently asked
questions could be addressed.
Program Improvement – Quotes Peer Leader No. 1 “If you can get peer leaders … [who are] all pretty [much the] same … they
can form a team of their own … in a sense that they are [able] to relate to one another.”
Peer Leader No. 7 “Information [provided in PL training] is so much. … Some people might not be able to grasp it.”
Moreover, they recommended including more frequent face-to-face
sessions between the telephone calls and using additional modalities of contact,
such as Skype and FaceTime.
Program Improvement – Quotes Peer Leader No. 2 “Let’s stick to Skype. … It worked perfectly.”
While one peer leader suggested reducing the length of the study to seven
or eight months, another believed that one year might not be long enough to help
the more challenging participants improve their diabetes management. Another
peer leader wanted the research team to balance the number of participants
among peer leaders.

114
Program Improvement – Quotes Peer Leader No. 5
“I would make [the study] shorter. The seven months would be ideal. I think [the PL training] would’ve been better … in a larger group, to get more interaction and more feedback and more suggestions.”
Peer Leader No. 10
“I think a year in some ways is too short … because [the participants] are coming from different backgrounds … [and] have their own challenges. … So, it may just take longer for them to realize and see more positive control.”
Four Group Comparisons
What distinguishes the four groups from one another is the peer leaders’
motivations for joining the study. Individuals who intended to enhance their
diabetes knowledge and gauge their control against others generally improved
their control by the end of the intervention period (internal motivation). Those
whose glycemic control deteriorated over the course of the study were mainly
motivated by referrals by physicians or diabetes educators (external motivation).
Improvements in A1C were also seen in the peer leaders whose glycemic control
was satisfactory ( 8%) but not optimal (7%) at the beginning of the
intervention. In contrast, peer leaders who started the program with on-target
A1C were unable to improve their glycemic control.
The peer leaders in group 1 () seemed more cognizant of the
repercussions of poor glycemic control. They reinforced their words with
behaviors and were deemed the most adept at translating their knowledge to
tangible improvement in self-care behaviors. This, in turn, allowed them to act as

115
role models for their participants. In other groups, peer leaders mostly talked
about improving diabetes-related knowledge, implementing self-care behaviors,
and achieving psychosocial benefits through their interactions with participants.
Peer leaders in groups 1 () and 4 () indicated that their participants
were better able to fulfill their goals. This aligns with the results of quantitative
analyses showing that the participants of peer leaders in these groups indeed
improved their A1C, while the participants of peer leaders in groups 2 () and 3
() did not.
More of the peer leaders in group 4 () said their participants were
resistant to change. Surprisingly, the group 4 participants improved their glycemic
control the most during the study period. Also, the group 4 PLs () requested
significantly more support from the research team than the other groups did. A
possible explanation for this is that the peer leaders in this group, having become
aware of their increasing A1C levels during the course of the study, realized that
they themselves needed more support in order to improve or sustain their
glycemic control.
In group 3, one of the peer leaders had type 1 diabetes. As a result, this
group was expected to have a longer mean diabetes duration than other groups.

116
Table 15: Four Group Comparisons
PL Groups
Motivation
Experience (Positive vs. Challenges)
Impact on PLs’ Diabetes Control
Mechanism of Change
Sociodemographic Characteristics
Group 1
()
Gauging their diabetes control
Positive: Improving their diabetes care Challenges: Participants’ level (contact and reluctance to change) and study levels
Eye-opener to the consequences of poorly controlled diabetes; backing up their words with actions to translate their knowledge to tangible improvements
Downward social comparison*; Internal motivation
Mean age: 66 years old Male: 60% Married: 60% Mean Diabetes duration: 14 years Mean A1C: 7.3%
Group 2
()
Referrals Positive: Educational benefits Challenges: Participants’ level (contacts)
Enhancing their diabetes knowledge; gaining psychosocial benefits
Downward social comparison*
Mean age: 57.2 years old Male: 25% Married: 50% Mean Diabetes duration: 14 years Mean A1C: 6.3%
Group 3
()
Learning and sharing knowledge
Positive: Educational benefits Challenges: Participants’ level (contact and reluctance to change)
Eye-opener to the consequences of poorly controlled diabetes; psychosocial benefits
Downward social comparison*; Internal motivation
Mean age: 56.3 years old Male: 66.7% Married: 33.3% Mean Diabetes duration: 26.7 years Mean A1C: 7.7%
Group 4
()
Varied Positive: Educational and psychological benefits Challenges: Participants’ level (reluctance to change)
Psychosocial benefits Downward social comparison*; upward social comparison
Mean age: 62.8 years old Male: 80% Married: 40% Mean Diabetes duration: 11 years Mean A1C: 6.9%
*Dominant mechanism of change in the group.
DISCUSSION
The impacts of peer support interventions on participants with type 2
diabetes have been well investigated, but the effects of these interventions on
peer leaders’ have not. Little is known about the peer leaders’ clinical and

117
psychosocial outcomes, or about how these interventions encourage peer leaders
to change their behaviors. The objective of this study is to explore a peer support
intervention from the perspective of the peer leaders, to share the peer leaders’
feedback on how to improve such interventions, and to evaluate the role of social
comparison in diabetes self-management among peer leaders.
Peer leaders were generally satisfied with the intervention and reported
positive experiences. They found their interactions with participants to be
mutually beneficial and reciprocal, despite facing challenges in contacting and
motivating their participants.
Peer leaders found that the program increased their awareness of their
diabetes control and motivated them to make positive lifestyle modifications. The
majority of peer leaders perceived their diabetes control as inferior to family
members or friends with type 2 diabetes, and this initially motivated them to
participate in the study. Most peer leaders perceived their control as superior to
that of the participants they were assigned in the study. This perception, and their
desire to motivate their participants, led them to make behavioral changes
throughout the intervention.

118
To enhance the intervention, the peer leaders proposed a training program
with more frequent but shorter sessions and less reading and composition. They
suggested more frequent face-to-face sessions with participants and additional
support from the research team during the intervention period.
Logistics of Study
Consistent with other studies, the peer leaders in our study were generally
pleased with the training and training materials; they felt that both were well-
suited to their responsibilities during the intervention.94,107 They suggested
abridging the diabetes knowledge component; this would bring the training more
in line with the Paul et al. study, where the training was brief, no final assessment
was given, and the main emphasis was on providing support and not diabetes
education.107 The peer leaders in our study also recommended that more
technology be integrated into the training program (e.g., PowerPoints, video clips,
interactive online activities, online library), to accommodate personal preferences
and differences in learning styles.
The peer leaders agreed that, given the barriers to face-to-face contacts,
the telephone was satisfactory as the main modality of study; this is consistent
with other studies where telephone-based communication is described as a

119
“personalized process” or “putting [on] more of a human face.” 107,108 However, to
enhance relationships with participants, peer leaders suggested that more
frequent face-to-face sessions be scheduled (e.g., every 3 months).
Peer leaders also suggested that the research team provide future peer
leaders with more structured support (e.g., meetings with the project coordinator
every few months, or convening peer leaders occasionally to share their
struggles). This suggestion is in line with the findings of another study, which
offered peer leaders the opportunity to meet regularly with project coordinators.
In that study, peer leaders gave positive feedback about their interactions with
the research team.107
In our study, peer leaders also highlighted the importance of using
similarities in 1) personal characteristics, 2) stage of diabetes, and 3) life
circumstances to effectively pair peer leaders and participants. This is in line with
the Heisler et al. study, where peers were paired based on level of diabetes, self-
care goals, and problems recognized in their survey responses.94 The qualitative
analyses of that study showed that poor matches might have resulted from lack of
similarity in the peer leaders’ and patients’ challenges and availability.94

120
Suggestions for increasing the peer leader/participant retention rate in our
study included introducing newly enrolled peer leaders/participants to
accomplished peer leaders/participants from the past, implementing robust
screenings during recruiting, creating suitable pairs, replacing monetary with non-
monetary rewards, and providing structured support to peer leaders.107,109
Peer Leaders
Baseline characteristics
Comparing the baseline characteristics across the four groups, we noticed
that peer leaders in the first and third group – where peer leaders improved their
glycemic control – had a higher mean A1C (>7% and <8%) at baseline that might
have enhanced their motivations to join the study. Given their level of glycemic
control at baseline, there might have been more room for improvement
compared to the other two groups where their mean A1C at baseline was right on
target (7%).
Motivation
The main motivations to become peer leaders were (1) personal gains; (2)
altruism; and (3) referrals. Most of the peer leaders whose glycemic control
improved joined the study for selfish reasons; the peer leaders whose glycemic
control did not improve were motivated by referrals or sought to gain personal

121
benefits while helping others. This suggests that peer leaders who intend to make
a difference in their own lives are more likely to improve their own glycemic
control.
Experiences
The peer leaders’ overall experience was overwhelmingly positive. They
received psychosocial satisfaction and enhanced their diabetes self-management.
Their greatest challenges were in contacting participants and motivating them to
modify their lifestyles. This is consistent with another study in which some of the
peer leaders were more motivated than their matches.94
Most of the peer leaders in group 1 () exchanged information with their
participants and made lifestyle changes in order to better model diabetes self-
management behaviors. In other groups, most peer leaders exchanged
information about strategies for behavioral changes but did not make such
changes themselves. A similar peer-led telephone-based intervention in type 2
diabetes, which was designed to increase physical activity, resulted in participants
becoming more receptive to the idea of physical activity but had a limited impact
in terms of behavior change.110 The result of that study might be applicable to
peer leaders as well as participants in similar peer support interventions.

122
Impact
The peer leaders generally identified three effects that the study had on
them: 1) enhancing diabetes knowledge; 2) appraising the benefits of optimal
glycemic control; and 3) receiving psychosocial benefits from helping peers. They
mainly agreed that their awareness of diabetes and its long-term complications
significantly increased through their study participation,111 and that this has
encouraged them to focus more on their own health shortcomings. Some peer
leaders modified their behaviors before asking their participants to do so. Others
said that helping others during the study increased their feelings of satisfaction
and decreased their feelings of isolation.
Like the peer leaders in the Goldman et al. (2013) and Paul et al. (2013)
studies, the group 1 peer leaders found that the study empowered them to shift
to a healthier lifestyle.107,112 Like the peer leaders in the Plotnikoff et al. study,
peer leaders in groups 2–4 mostly benefited from the educational component.110
Effective Peer Leaders
Peer leaders believed that improvements in the participants’ A1C, or
diabetes-related knowledge should be used to measure peer leader effectiveness.
Personality characteristics of effective peer leaders included extraversion,
conscientiousness, and openness, based on the Big Five personality model. Some

123
peer leaders preferred to set boundaries with their participants; this was similar
to the Goldman et al. study, where some peer coaches desired to set boundaries
in their role as an advisor and supporter.112
Role of Social Comparison
Of the many factors that influence self-management and control,
comparison with peers seems to be one of the strongest.113 Individuals may
perceive their control as superior (downward social comparison) or inferior
(upward social comparison). Those who are motivated via social comparison have
been shown to have better diabetes self-management than individuals who are
internally motivated.100
In this study, peer leaders said that, to enhance their control, they were
more likely to compare themselves with someone whose control is superior
(upward social comparison). However, peer leadership did not afford them many
such opportunities: consistent with other studies in chronic health conditions, the
peer leaders mostly perceived their diabetes control as superior to that of their
participants (downward social comparison).100,114 Our peer leaders said the study
made them more aware of the repercussions of poor glycemic control; this
resulted in behavioral changes by at least some of them.

124
Suggestions to Enhance Peer Leader Selection and Peer Leader-Participant Match
Based on the findings of the study, we designed a two-step peer leader
selection and one-step peer leader-participant matching model to enhance future
peer support interventions in type 2 diabetes.
The two-stage peer leader selection model includes a brief online screening
survey (as indicated in Appendix G) that consists of the following: (1) the last A1C
value in the previous 6 months; (2) MINI diabetes distress scale (Appendix E); and
(3) select Mini-IPIP measures (Appendix G). Subsequent to the screening, eligible
candidates will be invited to an in-person interview, during which their
communication skills will be assessed using the Active Listening Observation Scale
(ALOS-global – Appendix G). This should help ensure their suitability for the
role.115
In order to establish appropriate peer leader-participant matches, peer
leaders and participants will be asked to: (1) complete a survey, at the outset,
that asks about sociodemographic characteristics, their diabetes stage and its
complications, and any life experiences they would like to share with the other
party; and (2) provide feedback on their match after the first few contacts, to
evaluate whether the pairing is a good fit.

125
CONCLUSION
The current study enhances our knowledge of peer leaders’ experiences in
a peer-led intervention and the role of social comparison in peer leaders’ diabetes
self-management.
In the initial quantitative phase of this sequential explanatory study, we
found that peer leaders maintained their main diabetes health-related outcomes
over the study period. This was partly explained by our qualitative findings about
the contributing factors that led to sustained positive outcomes. Peer leaders felt
that their attendance enhanced their knowledge of diabetes and in some cases
motivated them to implement lifestyle modifications.
Additionally, in the quantitative phase, effective peer leaders (i.e., leaders
whose participants’ A1C and DDS improved from baseline to 12 months) had a
significantly lower baseline DD score (P=0.02) and a significantly higher
extraversion score (P=0.03), compared to the ineffective group. The qualitative
findings suggest that possessing certain personality characteristics is only one of
many factors that contribute to peer leaders’ effectiveness. Other determinants,
such as interpersonal skills, are equally significant.
The findings of these studies underline the need for further mixed methods

126
studies with larger sample sizes.
Limitations and Strengths
This study is not without limitations. First, peer leaders were interviewed at
different timepoints after completing the study. However, the interviews were
able to reflect the perceived experiences of the peer leaders. Second, although
peer leaders reported overwhelmingly positive experiences, it would have also
been beneficial to interview the participants, to obtain a more comprehensive
understanding of the study’s impact. Third, one of our categories had only three
peer leaders. Due to the small sample, we could not reach saturation in that
group. Finally, we utilized purposeful sampling (based on peer leaders’ A1C) to be
able to compare the findings across the four groups of peer leaders. Although
focus groups might have yielded richer data considering the objectives of study,
we proceeded with semi-structured interviews to fully respect the study
participants’ confidentiality.
The strength of this study stems from the fact that, to our knowledge, it is
one of the few studies to explore the peer leaders’ experiences in delivering
support and to examine the role of social comparison in peer leaders’ diabetes
self-management in a peer support diabetes intervention.

127
Chapter 6: Integrated Discussion
Effective diabetes self-management consists of diabetes self-management
education (DSME) followed by ongoing diabetes self-management support
(DSMS). Although DSME improves A1C at the immediate follow-up, the benefits
start to diminish after six months. In the face of limited financial and human
resources and escalating costs on an already strained health care system, peer
support models of diabetes care have emerged as an effective, long-term, cost-
efficient means of sharing experiential knowledge of diabetes self-management.
The peer support models have been conducted in a variety of settings
(community, primary, secondary, and tertiary care), using various frequencies and
modalities of contact. A growing body of literature examines the impact of peer
support on health-related outcomes for patients with diabetes. However,
considerably less attention has been given to those providing the support—the
“peer leaders.” Little is known about their demographic characteristics, how they
are recruited, the training they receive, or how their health outcomes change as a
result of providing peer support. This lack of data poses challenges for researchers
who are considering how to best recruit peer leaders, which models to implement

128
in training them, and how to effectively deliver a diabetes peer support
intervention.
In Chapter 2, I conducted a comprehensive literature search to define the
components of peer support interventions in type 2 diabetes and to confirm the
need for further examination of 1) peer leaders’ characteristics; 2) the impact of
peer support interventions on peer leaders; and 3) ways to enhance treatment
fidelity in these interventions. To date, only five articles mentioned peer leaders’
sociodemographic characteristics at baseline. The effect of interventions on peer
leaders was largely overlooked: only one study evaluated the impact of peer
support interventions on peer leaders’ clinical and psychosocial outcomes. To
address this gap in the literature, I applied a mixed methods research design and
reported the results of this research in Chapters 3–5.
In Chapter 3, the impact of delivering support on peer leaders’ clinical and
psychosocial outcomes was assessed in a 12-month telephone-based peer
support intervention recruiting adults with type 2 diabetes affiliated with a
specialty-care setting. Seventy-five peer leaders, all English-speaking adults with
type 1 or type 2 diabetes, were recruited and invited to participate in a 30-hour
peer leader training program. Fifty-eight graduated from the training program,

129
and fifty-two were interested in continuing and being paired with participants.
The peer leaders’ first contact with each participant was face-to-face, followed by
12 weekly telephone contacts in the first 3 months and 18 biweekly telephone
contacts in the remaining 9 months.
The impact of providing support on peer leaders’ main diabetes-related
clinical and psychosocial outcomes was evaluated by measuring A1C and DD at
three timepoints (baseline, 3 months, and 12 months) over the 12-month course
of the study. The results suggest that providing support might be as beneficial as
receiving it. The peer leaders sustained their level of glycemic control throughout
the study in spite of diabetes being a progressive disease in which A1C increases,
on average, by approximately 0.2% per year.80,116 Their overall DD and other
cardiovascular risk factors remained stable over the 12 months. Out of the four
subcategories of DDS, the peer leaders did exhibit an increase – albeit an
insignificant one – in physician-related distress. One possible explanation for this
is that, in attending the training program and interacting with their participants,
the peer leaders became more aware of shortcomings in the diabetes care they
were receiving from health care professionals.
In Chapter 4, the sociodemographic and personality characteristics of

130
effective peer leaders – defined as those whose participants’ A1C and DD
sustained or improved from baseline to 12 months – were investigated, and
suggestions for peer leader selection and pairing were proposed. The results
demonstrated that the effective peer leaders had satisfactory glycemic control
(mean A1C: 7.1%), while ineffective peer leaders had optimal glycemic control
(mean A1C: 6.8%). The effective leaders also scored significantly lower on DD than
the ineffective peer leaders did. A higher level of extraversion was detected in
effective peer leaders and was positively associated with participants’ A1C
improvement. The findings of this study suggest that additional layers of
screening are needed to determine prospective peer leaders’ suitability for the
role. These screenings may include evaluating candidates’ personality traits via
interviews, assessing of their level of diabetes distress, and considering their
glycemic control prior to recruitment. To help ensure that peer leaders possess
essential diabetes knowledge, a satisfactory level of glycemic control (A1C <8%)
should be considered as an inclusion criterion. However, our findings suggest that
optimal glycemic control (A1C <7%) is not necessarily an indicator of peer leaders’
effectiveness.
In Chapter 5, a descriptive qualitative study was conducted to learn about

131
peer leaders’ experiences during the support-delivery period, to uncover their
perspectives on different components of the intervention, and to elicit their
suggestions for improvement. Seventeen peer leaders were interviewed.
The interviewed peer leaders found the peer leader training program and
its components beneficial, practical, and pertinent to their responsibilities, and
endorsed a combination of face-to-face and telephone as the preferred modality
of contact. Although the peer leaders felt that the frequency of contact was
sufficient to address their participants’ needs, they would have preferred more
flexibility in the number and timing of the contacts. Overall, peer leaders
described their experiences during the support delivery as positive, and their
relationships with their participants as mutually beneficial and reciprocal. The
majority of peer leaders believed that their attendance enhanced their diabetes
control. They attributed their enhanced control to greater awareness of their
diabetes management, feeling motivated to improve their control before
coaching their participants, and striving for the level of control of their role
models (family members/friends). Peer leaders acknowledged the importance of
possessing a certain set of personality characteristics – extraversion,
conscientiousness, and openness – in their role as “coaches.” They defined their

132
effectiveness based on the improvements they helped make in their participants’
A1C and diabetes knowledge.
The findings of the qualitative phase shed light on the results of the
quantitative phase. In Chapter 3, the impact of providing support on peer leaders’
main diabetes-related clinical and psychosocial outcomes was evaluated over 12
months. The qualitative findings in Chapter 5 uncovered multiple factors that may
have contributed to the sustained outcomes. For example, the peer leaders’ said
their diabetes self-management was enhanced as a result of their attending the
training program and coaching and exchanging information with their
participants. Overall, the peer leaders perceived their relationship with
participants as reinforcing better diabetes control in themselves.
In Chapter 4, we defined peer leaders’ effectiveness based on their
participants’ A1C and DD scores from baseline to 12 months. The qualitative
findings in Chapter 5 established change in participants’ glycemic control as one
of the most important measures of peer leaders’ effectiveness, but not the only
one.
In the same chapter, we compared the personality characteristics of
effective and ineffective peer leaders, and noted that effective peer leaders

133
scored significantly higher on extraversion. The qualitative data further suggested
that although certain personality traits could be used in peer leader selection to
reinforce the quality of peer leader–participant relations, decrease the study
drop-out rate, and enhance the participants’ and peer leaders’ clinical and
psychosocial outcomes, these traits are not the only determinants to consider.
The peer leaders concurred that other factors such as similar life circumstances
also contribute to the peer leader–participant relationship.
Ultimately, the peer leaders’ main suggestions for enhancing the program
included the following: 1) given that the main role of peer leaders is to provide
support to their participants, the diabetes knowledge component of the training
session should be shortened; 2) the program should include more face-to-face
contacts along with the telephone calls; 3) peer leaders should receive regular
support calls from or meetings with the research team; 4) in order to pair peer
leaders and participants successfully, personal, diabetes-related, and life
circumstances similarities should be considered.
How to implement and translate this new knowledge into clinical practice?
In a health care system that has limited resources and faces increasing
costs, PS interventions have emerged as an effective, long-term, cost-efficient

134
model of care for patients with diabetes.23,50,117 A growing body of literature
documents the effects of PS on the clinical and psychosocial outcomes of
recipients, but considerably less attention has been paid to those providing the
support – the peer leaders. Little is known about their demographic
characteristics, how they are recruited, or how their own health outcomes change
as a result of providing peer support.30,43,55,59 This lack of information can present
challenges to health care practitioners who are uncertain about how to best
recruit and train PLs and how to effectively deliver a diabetes PS intervention. The
results of this thesis will help health care practitioners design and enhance the
delivery of PS models of diabetes care.
Most PS studies to this point have focused on potential PL candidates’
personal history of diabetes and acceptable glycemic control as the eligibility
criteria.31,34,37,41,43,56,118 Only a few studies have considered the use of
communication skills and personality traits in peer leader selection.28,59,60,118 In the
quantitative phase of this mixed methods study, we found a significant
relationship between peer leaders’ effectiveness and a certain personality trait
(extraversion), and in the qualitative phase, we observed an emphasis, by peer

135
leaders, on the importance of interpersonal skills as another determinant that
would enhance peer leader recruitment.
Although several studies have reported peer leaders’ baseline
characteristics (i.e., age, gender, duration of diabetes, marital status, and A1C),
none has mentioned peer leaders’ DD score.43,55,56,59 The findings of this thesis
also suggest that there is a significant association between the diabetes distress
score and peer leaders’ effectiveness, and no significant association between A1C
and peer leader’s effectiveness.
Many studies have evaluated the effect of PS interventions on participants’
diabetes-related main clinical and psychosocial outcomes, but only one study
(before this one) has assessed the impact of delivering PS on peer leaders’
outcomes.30 In that study, PLs showed improvement in their self-care behaviors
and sustainment in their glycemic control over 4 years.30 The findings of the
present study are consistent with this. They suggest that providing support had a
stabilizing impact on peer leaders’ glycemic control and diabetes distress over one
year.
PS is an effective, cost-efficient model that can be implemented and
integrated into our healthcare system in populations and areas where the need

136
for such interventions is greatest. Peer support is often deployed within high-risk,
economically vulnerable, and marginalized communities. Our findings can assist
health care providers as they design successful, evidence-backed interventions for
vulnerable patient populations in underserved districts.
In conclusion, researchers and policy makers who are designing future peer
support interventions may wish to consider the findings of this dissertation, which
serve as the foundation for these suggestions: 1) peer leader selection criteria
should be outlined clearly, and additional layers of screening should be
considered, including interviews that assess candidates’ suitability,
communication skills, and personality traits; 2) the length and components of
peer leader training programs should be tailored to the primary objective of the
peer support intervention – DSME or DSMS; 3) frequency of contacts may be
tailored to each participant’s individual needs; 4) extra attention should be paid
to the strategies for pairing peer leaders and participants, especially in one-on-
one peer support interventions; and 5) the impact of peer support interventions
on peer leaders’ clinical and psychosocial outcomes should be assessed further.
Integration of these suggestions into future peer support programs may add to
their effectiveness in chronic disease self-management.

137
To improve peer support intervention fidelity and participants’ and peer
leaders’ retention rates, further research is needed on peer leader selection and
pairing models. Further investigation is also warranted on the impact of various
peer support interventions on peer leaders’ clinical and psychosocial diabetes-
related health outcomes in diverse settings. Ideally, these studies would use a
controlled trial design and have a larger sample size.

138
REFERENCES 1. Federation ID. IDF Diabetes Atlas, 8th edn. Brussels, Belgium. International Diabetes Federation.
2017. 2. Model CDC. Estimated diabetes statistics in Canada. 2015. 3. Forouhi NG, Wareham NJ. Epidemiology of diabetes. Medicine (Abingdon, England : UK ed).
2014;42(12):698-702. 4. https://www.canada.ca/en/public-health/services/chronic-diseases/reports-
publications/diabetes/diabetes-canada-facts-figures-a-public-health-perspective/chapter-1.html. Accessed.
5. Goldman L, Schafer AI. 6. Pelletier C, Dai S, Roberts KC, Bienek A, Onysko J, Pelletier L. Report summary. Diabetes in
Canada: facts and figures from a public health perspective. Chronic Dis Inj Can. 2012;33(1):53-54.
7. Jameson JL, Fauci AS, Kasper DL, et al. Harrison's principles of internal medicine. 2018. 8. Davies MJ, Tringham JR, Troughton J, Khunti KK. Prevention of Type 2 diabetes mellitus. A
review of the evidence and its application in a UK setting. Diabetic medicine : a journal of the British Diabetic Association. 2004;21(5):403-414.
9. Franz MJ. Evidence-based nutrition principles and recommendations for the treatment and prevention of diabetes and related complications. Diabetes care.25(1):148-198.
10. Klein S. Weight management through lifestyle modification for the prevention and management of type 2 diabetes: rationale and strategies: a statement of the American Diabetes Association, the North American Association for the Study of Obesity, and the American Society for Clinical Nutrition. Diabetes care.27(8):2067-2073.
11. Sigal RJ. Physical activity/exercise and type 2 diabetes. Diabetes care.27(10):2518-2539. 12. Sullivan PW, Morrato EH, Ghushchyan V, Wyatt HR, Hill JO. Obesity, Inactivity, and the
Prevalence of Diabetes and Diabetes-Related Cardiovascular Comorbidities in the U.S., 2000–2002. Diabetes care. 2005;28:1599-1603.
13. Knowler WC. Reduction in the incidence of type 2 diabetes with lifestyle intervention or metformin. The New England journal of medicine.346(6):393-403.
14. Pan XR. Effects of diet and exercise in preventing NIDDM in people with impaired glucose tolerance. The Da Qing IGT and Diabetes Study. Diabetes care.20(4):537-544.
15. Tuomilehto J. Prevention of type 2 diabetes mellitus by changes in lifestyle among subjects with impaired glucose tolerance. The New England journal of medicine.344(18):1343-1350.
16. Williamson DF. Primary prevention of type 2 diabetes mellitus by lifestyle intervention: implications for health policy. Annals of internal medicine.140(11):951-957.
17. Nathan DM, Bayless M, Cleary P, et al. Diabetes control and complications trial/epidemiology of diabetes interventions and complications study at 30 years: advances and contributions. In. Diabetes. Vol 622013:3976+.
18. Stratton IM, Adler AI, Neil HA, et al. Association of glycaemia with macrovascular and microvascular complications of type 2 diabetes (UKPDS 35): prospective observational study. BMJ (Clinical research ed). 2000;321(7258):405-412.
19. Nathan DM, Group DER. The diabetes control and complications trial/epidemiology of diabetes interventions and complications study at 30 years: overview. Diabetes care. 2014;37(1):9-16.

139
20. Holman RR, Paul SK, Bethel MA, Matthews DR, Neil HAW. 10-Year Follow-up of Intensive Glucose Control in Type 2 Diabetes. New England Journal of Medicine. 2008;359(15):1577-1589.
21. Committee DCCPGE. Diabetes Canada 2018 Clinical Practice Guidelines for the Prevention and Management of Diabetes in Canada. Canadian journal of diabetes. 2018(42(Suppl 1)):S1-S325.
22. Malanda UL, Bot SD, Nijpels G. Self-monitoring of blood glucose in noninsulin-using type 2 diabetic patients: it is time to face the evidence. Diabetes Care. 2013;36(1):176-178.
23. Beck J, Greenwood DA, Blanton L, et al. 2017 National Standards for Diabetes Self-Management Education and Support. Diabetes Care. 2017;40:1409-1419.
24. Diabetes Canada Clinical Practice Guidelines Expert C, Sherifali D, Berard LD, Gucciardi E, MacDonald B, MacNeill G. Self-Management Education and Support. Canadian journal of diabetes. 2018;42 Suppl 1:S36-S41.
25. Arambepola C, Ricci-Cabello I, Manikavasagam P, Roberts N, French DP, Farmer A. The Impact of Automated Brief Messages Promoting Lifestyle Changes Delivered Via Mobile Devices to People with Type 2 Diabetes: A Systematic Literature Review and Meta-Analysis of Controlled Trials. Journal Of Medical Internet Research. 2016;18(4):e86-e86.
26. Wong CK, Wong Wc Fau - Wan YF, Wan Yf Fau - Chan AKC, et al. Patient Empowerment Programme in primary care reduced all-cause mortality and cardiovascular diseases in patients with type 2 diabetes mellitus: a population-based propensity-matched cohort study. (1463-1326 (Electronic)).
27. Heisler M. Overview of Peer Support Models to Improve Diabetes Self-Management and Clinical Outcomes. Diabetes Spectrum. 2007;20:214-221.
28. Dale J, Caramlau I, Sturt J, Friede T, Walker R. Telephone peer-delivered intervention for diabetes motivation and support: the telecare exploratory RCT. Patient education and counseling. 2009;75(1):91-98.
29. Dale JR, Williams SM, Bowyer V. What is the effect of peer support on diabetes outcomes in adults? A systematic review. Diabetic medicine : a journal of the British Diabetic Association. 2012;29(11):1361-1377.
30. Yin J, Wong R, Au S, et al. Effects of Providing Peer Support on Diabetes Management in People With Type 2 Diabetes. Ann Fam Med. 2015;13 Suppl 1:S42-49.
31. Ahmadi Z, Sadeghi T, Loripoor M. The outcomes of peer-led diabetes education in comparison to education delivered by health professionals in Iranian patients. Health education research. 2018;33(1):64-72.
32. Anzaldo-Campos MC, Contreras S, Vargas-Ojeda A, Menchaca-Diaz R, Fortmann A, Philis-Tsimikas A. Dulce Wireless Tijuana: A Randomized Control Trial Evaluating the Impact of Project Dulce and Short-Term Mobile Technology on Glycemic Control in a Family Medicine Clinic in Northern Mexico. Diabetes Technol Ther. 2016;18(4):240-251.
33. Debussche X, Besancon S, Balcou-Debussche M, et al. Structured peer-led diabetes self-management and support in a low-income country: The ST2EP randomised controlled trial in Mali. PloS one. 2018;13(1):e0191262.
34. Gagliardino JJ, Arrechea V, Assad D, et al. Type 2 diabetes patients educated by other patients perform at least as well as patients trained by professionals. Diabetes Metab Res Rev. 2013;29(2):152-160.
35. Lorig K, Ritter PL, Villa FJ, Armas J. Community-based peer-led diabetes self-management: a randomized trial. The Diabetes educator. 2009;35(4):641-651.

140
36. Paz-Pacheco E, Sandoval MA, Ardena GJ, et al. Effectiveness of a community-based diabetes self-management education (DSME) program in a rural agricultural setting. Prim Health Care Res Dev. 2017;18(1):35-49.
37. Peimani M, Monjazebi F, Ghodssi-Ghassemabadi R, Nasli-Esfahani E. A peer support intervention in improving glycemic control in patients with type 2 diabetes. Patient Educ Couns. 2018;101(3):460-466.
38. Philis-Tsimikas A, Fortmann A, Lleva-Ocana L, Walker C, Gallo LC. Peer-led diabetes education programs in high-risk Mexican Americans improve glycemic control compared with standard approaches: a Project Dulce promotora randomized trial. Diabetes care. 2011;34(9):1926-1931.
39. Riddell MA, Dunbar JA, Absetz P, et al. Cardiovascular risk outcome and program evaluation of a cluster randomised controlled trial of a community-based, lay peer led program for people with diabetes. BMC public health. 2016;16(1):864.
40. Siminerio L, Ruppert KM, Gabbay RA. Who can provide diabetes self-management support in primary care? Findings from a randomized controlled trial. The Diabetes educator. 2013;39(5):705-713.
41. Simmons D, Prevost AT, Bunn C, et al. Impact of community based peer support in type 2 diabetes: a cluster randomised controlled trial of individual and/or group approaches. PLoS One. 2015;10(3):e0120277.
42. Tang TS, Funnell MM, Sinco B, Spencer MS, Heisler M. Peer-Led, Empowerment-Based Approach to Self-Management Efforts in Diabetes (PLEASED): A Randomized Controlled Trial in an African American Community. Ann Fam Med. 2015;13 Suppl 1:S27-35.
43. Thom DH, Ghorob A, Hessler D, De Vore D, Chen E, Bodenheimer TA. Impact of peer health coaching on glycemic control in low-income patients with diabetes: a randomized controlled trial. Ann Fam Med. 2013;11(2):137-144.
44. Glanz K, Rimer BK, Viswanath K. Health behavior : theory, research, and practice. 2015. 45. Dibb B, Yardley L. How does social comparison within a self-help group influence adjustment to
chronic illness? A longitudinal study. Social science & medicine (1982). 2006;63(6):1602-1613. 46. Buunk AP, Gibbons FX. Social comparison orientation: a new perspective on those who do and
those who don't compare with others. In: Guimond S, ed. Social Comparison and Social Psychology: Understanding Cognition, Intergroup Relations, and Culture. Cambridge: Cambridge University Press; 2005:15-32.
47. Norris SL, Lau J, Smith SJ, Schmid CH, Engelgau MM. Self-Management Education for Adults With Type 2 Diabetes. Diabetes care. 2002;25(7):1159.
48. Pillay J, Armstrong MJ, Butalia S, et al. Behavioral Programs for Type 2 Diabetes Mellitus: A Systematic Review and Network Meta-analysis. Annals of internal medicine. 2015;163(11):848-860.
49. Canada D. An Economic Tsunami: Cost of Diabetes in Canada. 2009. 50. Stetson B, Minges KE, Richardson CR. New directions for diabetes prevention and management
in behavioral medicine. Journal of behavioral medicine. 2017;40(1):127-144. 51. Schwartz CE, Sendor M. Helping others helps oneself: response shift effects in peer support.
Social science & medicine (1982). 1999;48(11):1563-1575. 52. Hoffmann TC, Glasziou PP, Boutron I, et al. Better reporting of interventions: template for
intervention description and replication (TIDieR) checklist and guide. BMJ : British Medical Journal. 2014;348.
53. Armijo-Olivo S, Stiles CR, Hagen NA, Biondo PD, Cummings GG. Assessment of study quality for systematic reviews: a comparison of the Cochrane Collaboration Risk of Bias Tool and the

141
Effective Public Health Practice Project Quality Assessment Tool: methodological research. Journal of evaluation in clinical practice. 2012;18(1):12-18.
54. Johansson T, Keller S, Winkler H, Ostermann T, Weitgasser R, Sonnichsen AC. Effectiveness of a Peer Support Programme versus Usual Care in Disease Management of Diabetes Mellitus Type 2 regarding Improvement of Metabolic Control: A Cluster-Randomised Controlled Trial. J Diabetes Res. 2016;2016:3248547.
55. Smith SM, Paul G, Kelly A, Whitford DL, O'Shea E, O'Dowd T. Peer support for patients with type 2 diabetes: cluster randomised controlled trial. BMJ. 2011;342:d715.
56. Chan JC, Sui Y, Oldenburg B, et al. Effects of telephone-based peer support in patients with type 2 diabetes mellitus receiving integrated care: a randomized clinical trial. JAMA Intern Med. 2014;174(6):972-981.
57. Tang TS, Funnell M, Sinco B, et al. Comparative effectiveness of peer leaders and community health workers in diabetes self-management support: results of a randomized controlled trial. Diabetes care. 2014;37(6):1525-1534.
58. van der Wulp I, de Leeuw JR, Gorter KJ, Rutten GE. Effectiveness of peer-led self-management coaching for patients recently diagnosed with Type 2 diabetes mellitus in primary care: a randomized controlled trial. Diabetic medicine : a journal of the British Diabetic Association. 2012;29(10):e390-397.
59. Tang TS, Funnell MM, Gillard M, Nwankwo R, Heisler M. Training peers to provide ongoing diabetes self-management support (DSMS): results from a pilot study. Patient education and counseling. 2011;85(2):160-168.
60. Ghorob A, Vivas MM, De Vore D, et al. The effectiveness of peer health coaching in improving glycemic control among low-income patients with diabetes: protocol for a randomized controlled trial. BMC public health. 2011;11:208.
61. Assah FK, Atanga EN, Enoru S, Sobngwi E, Mbanya JC. Community-based peer support significantly improves metabolic control in people with Type 2 diabetes in Yaounde, Cameroon. Diabetic medicine : a journal of the British Diabetic Association. 2015;32(7):886-889.
62. Lodi-Smith J, Roberts BW. Social Investment and Personality: A Meta-Analysis of the Relationship of Personality Traits to Investment in Work, Family, Religion, and Volunteerism. Personality and Social Psychology Review. 2007;11(1):68-86.
63. Singh S, Pai DR, Sinha NK, Kaur A, Soe HHK, Barua A. Qualities of an effective teacher: what do medical teachers think? BMC Medical Education. 2013;13(1):128.
64. Daousi C, Casson IF, Gill GV, MacFarlane IA, Wilding JP, Pinkney JH. Prevalence of obesity in type 2 diabetes in secondary care: association with cardiovascular risk factors. Postgraduate medical journal. 2006;82(966):280-284.
65. King HR, Jackson JJ, Morrow-Howell N, Oltmanns TF. Personality Accounts for the Connection Between Volunteering and Health. J Gerontol B Psychol Sci Soc Sci. 2015;70(5):691-697.
66. Fisher L, Glasgow RE, Strycker LA. The Relationship Between Diabetes Distress and Clinical Depression With Glycemic Control Among Patients With Type 2 Diabetes. Diabetes care. 2010;33:1034-1036.
67. Tang TS, Funnell MM, Gillard M, Nwankwo R, Heisler M. The development of a pilot training program for peer leaders in diabetes: process and content. The Diabetes educator. 2011;37(1):67-77.
68. Clark M. Diabetes self-management education: a review of published studies. Primary care diabetes. 2008;2(3):113-120.

142
69. Norris SL, Lau J, Smith SJ, Schmid CH, Engelgau MM. Self-management education for adults with type 2 diabetes: a meta-analysis of the effect on glycemic control. Diabetes care. 2002;25(7):1159-1171.
70. Riessman F. The "Helper" Therapy Principle. Social Work. 1965;10(2):27-32. 71. Arnstein P, Vidal M, Wells-Federman C, Morgan B, Caudill M. From chronic pain patient to peer:
Benefits and risks of volunteering. Pain Management Nursing. 2002;3(3):94-103. 72. Musick MA, Herzog Ar Fau - House JS, House JS. Volunteering and mortality among older adults:
findings from a national sample. (1079-5014 (Print)). 73. E. PMG, Roberta H, Enid E, D LM, Theodore A. Effect of counselor training on skills development
and psychosocial status of volunteers with systemic lupus erythematosus. Arthritis & Rheumatism. 1993;6(1):38-44.
74. Krause N. Providing emotional support to others, self-esteem, and self-rated health. Archives of Gerontology and Geriatrics. 2016;65:183-191.
75. Gene Johnson, M.S.W. ,, Chris Magee, B.S. ,, Mihoko Maru, M.A. ,, Kathleen Furlong-Norman, M.Ed., M.S.W. ,, E. Sally Rogers, Sc.D. , and, Kenneth Thompson, M.D. Personal and Societal Benefits of Providing Peer Support: A Survey of Peer Support Specialists. Psychiatric Services. 2014;65(5):678-680.
76. Tang TS, Afshar R, Elliott T, Kong J, Gill S. Study protocol and baseline sample characteristics: From clinic to community: Using peer support as a transition model for improving long-term diabetes-related health outcomes. Contemporary clinical trials. 2019;79:104-110.
77. Health Quality O. Point-of-Care Hemoglobin A(1c) Testing: An Evidence-Based Analysis. Ontario Health Technology Assessment Series. 2014;14(8):1-30.
78. Polonsky WH, Fisher L, Earles J, et al. Assessing psychosocial distress in diabetes: development of the diabetes distress scale. Diabetes Care. 2005;28(3):626-631.
79. Kroenke K, Spitzer RL, Williams JB. The PHQ-9: validity of a brief depression severity measure. J Gen Intern Med. 2001;16(9):606-613.
80. Matthews DR, Cull CA, Stratton IM, Holman RR, Turner RC. UKPDS 26: Sulphonylurea failure in non-insulin-dependent diabetic patients over six years. UK Prospective Diabetes Study (UKPDS) Group. Diabetic medicine : a journal of the British Diabetic Association. 1998;15(4):297-303.
81. Action to Control Cardiovascular Risk in Diabetes Study G, Gerstein HC, Miller ME, et al. Effects of intensive glucose lowering in type 2 diabetes. N Engl J Med. 2008;358(24):2545-2559.
82. Marino P, Simoni Jm Fau - Silverstein LB, Silverstein LB. Peer support to promote medication adherence among people living with HIV/AIDS: the benefits to peers. (0098-1389 (Print)).
83. McManus IC, Thompson M, Mollon J. Assessment of examiner leniency and stringency ('hawk-dove effect') in the MRCP(UK) clinical examination (PACES) using multi-facet Rasch modelling. BMC medical education. 2006;6:42-42.
84. J C, JP S. - Effective hospice volunteers: demographic and personality characteristics. American Journal of Hospice & Palliative Medicine. 1994;11(2):40-45.
85. S C-O, Y B. - Personality characteristics of hospice palliative care volunteers: the ''big five'' and empathy. American Journal of Hospice & Palliative Medicine. 2010;27(6):407-412.
86. Judge TA, Ilies R. Relationship of personality to performance motivation: A meta-analytic review. Journal of Applied Psychology. 2002;87(4):797-807.
87. Burke DM, Hall M. Personality characteristics of volunteers in a companion for children program. Psychological reports.59.
88. Lorig K, Ritter PL, Laurent DD, et al. Online diabetes self-management program: a randomized study. Diabetes care. 2010;33(6):1275-1281.

143
89. Donnellan MB, Oswald FL, Baird BM, Lucas RE. The mini-IPIP scales: tiny-yet-effective measures of the Big Five factors of personality. Psychol Assess. 2006;18(2):192-203.
90. Widiger TA. The Oxford Handbook of the Five Factor Model. Oxford University Press; 2015. 91. Burke DM, Hall M. Personality Characteristics of Volunteers in a Companion for Children
Program. Psychological Reports. 1986;59(2):819-825. 92. Locock L, Brown JB. 'All in the same boat'? Patient and carer attitudes to peer support and social
comparison in Motor Neurone Disease (MND). Social science & medicine (1982). 2010;71(8):1498-1505.
93. Arigo D, Smyth JM, Suls JM. Perceptions of similarity and response to selected comparison targets in type 2 diabetes. Psychol Health. 2015;30(10):1206-1220.
94. Heisler M, Piette JD. "I help you, and you help me": facilitated telephone peer support among patients with diabetes. The Diabetes educator. 2005;31(6):869-879.
95. Sandelowski M. Whatever happened to qualitative description? Research in nursing & health. 2000;23(4):334-340.
96. Creswell JW. Research design: qualitative, quantitative, and mixed methods approaches. 4th ed. Thousand Oaks, California: SAGE Publications; 2014.
97. Creswell JW, & Plano, C. V. L. . Designing and conducting mixed methods research. 2nd ed. Thousand Oaks, Calif: SAGE Publications; 2011.
98. Ivankova NV, Creswell JW, Stick SL. Using Mixed-Methods Sequential Explanatory Design: From Theory to Practice. Field Methods. 2016;18(1):3-20.
99. Kim H, Sefcik JS, Bradway C. Characteristics of Qualitative Descriptive Studies: A Systematic Review. Res Nurs Health. 2017;40(1):23-42.
100. Gorawara-Bhat R, Huang ES, Chin MH. Communicating with older diabetes patients: self-management and social comparison. Patient education and counseling. 2008;72(3):411-417.
101. Palinkas LA, Horwitz SM, Green CA, Wisdom JP, Duan N, Hoagwood K. Purposeful Sampling for Qualitative Data Collection and Analysis in Mixed Method Implementation Research. Adm Policy Ment Health. 2015;42(5):533-544.
102. Kvale S, & Brinkmann, S. . InterViews: Learning the craft of qualitative research interviewing (3rd ed.). Los Angeles: Sage Publications.; 2015.
103. Teddlie C, Yu F. Mixed Methods Sampling. Journal of Mixed Methods Research. 2016;1(1):77-100.
104. Saunders B, Sim J, Kingstone T, et al. Saturation in qualitative research: exploring its conceptualization and operationalization. Quality & Quantity. 2017;52(4):1893-1907.
105. Krefting L. Rigor in qualitative research: the assessment of trustworthiness. Am J Occup Ther. 1991;45(3):214-222.
106. Deci EL. Springer US; 1985. 107. Paul G, Keogh K, D'Eath M, Smith SM. Implementing a peer-support intervention for people with
type 2 diabetes: a qualitative study. Family practice. 2013;30(5):593-603. 108. Joseph DH, Griffin M, Hall RF, Sullivan ED. Peer Coaching: An Intervention for Individuals
Struggling With Diabetes. The Diabetes Educator. 2001;27(5):703-710. 109. Paul G, Smith SM, Whitford D, O'Kelly F, O'Dowd T. Development of a complex intervention to
test the effectiveness of peer support in type 2 diabetes. BMC health services research. 2007;7:136.
110. Plotnikoff RC, Johnson ST, Luchak M, et al. Peer telephone counseling for adults with type 2 diabetes mellitus: a case-study approach to inform the design, development, and evaluation of programs targeting physical activity. The Diabetes educator. 2010;36(5):717-729.

144
111. Struthers R, Hodge FS, De Cora L, Geishirt-Cantrell B. The experience of native peer facilitators in the campaign against type 2 diabetes. The Journal of rural health : official journal of the American Rural Health Association and the National Rural Health Care Association. 2003;19(2):174-180.
112. Goldman ML, Ghorob A, Eyre SL, Bodenheimer T. How do peer coaches improve diabetes care for low-income patients?: a qualitative analysis. The Diabetes educator. 2013;39(6):800-810.
113. Huang ES. Self-Reported Goals of Older Patients with Type 2 Diabetes Mellitus GOALS OF OLDER PATIENTS WITH DIABETES. Journal of the American Geriatrics Society (JAGS).53(2):306-311.
114. Helgeson VS, Taylor SE. Social Comparisons and Adjustment Among Cardiac Patients. Journal of applied social psychology.23(15).
115. Fassaert T, van Dulmen S, Schellevis F, Bensing J. Active listening in medical consultations: Development of the Active Listening Observation Scale (ALOS-global). Patient education and counseling. 2007;68(3):258-264.
116. Wallace TM, Matthews DR. Poor glycaemic control in type 2 diabetes: a conspiracy of disease, suboptimal therapy and attitude. QJM : monthly journal of the Association of Physicians. 2000;93(6):369-374.
117. Doucet G, Beatty M. The Cost of Diabetes in Canada: The Economic Tsunami. Canadian Journal of Diabetes. 2010;34(1):27-29.
118. Ju C, Shi R, Yao L, et al. Effect of peer support on diabetes distress: a cluster randomized controlled trial. Diabetic Medicine. 2018;35(6):770-775.

145
Appendices
Appendix A: Chapter 2 – Peer Leaders’ Questionnaire
SECTION A: DEMOGRAPHICS Please answer every question by filling in the blank(s), circling the correct answer, or checking the correct box(s). 1. What is your age? __ __ years old 2. What is your gender? 1 Male 2 Female 3. Which country, were you born in? ____________________________ 4. If you were not born in Canada, how long have you lived in Canada?
________ 5. What year were you first told you had diabetes? (Please enter the year)
__ __ __ __ 6. How old were you when you were first told you had diabetes? __ __ 7. What is your marital status?
1 Never married
2 Married
3 Unmarried but living with partner
4 Separated/Divorced
5 Widowed
8. What is your ethnic origin? (check all that apply)
1 Aboriginal

146
2 Arabic
3 East Asian (Chinese, Korean, Japanese)
4 South Asian (Bangladesh, Pakistan, Indian)
5 Southeast Asian (Vietnamese, Cambodian)
6 White
7 Native Hawaiian or other Pacific Islanders
8 Other _______________
9. What is your highest level of education?
1 Less than high school
2 High school graduate (or equivalent)
3 Some college or technical school
4 College graduate
5 Graduate degree(s)
10. What is your total pre-tax household income?
1 $20,000
2 $20,000 to $29,999
3 $30,000 to $39,999
4 $40,000 to $49,999
5 $50,000 to $59,999
6 $60,000 to $69,999
7 $70,000

147
11. Which of the following best describes your current employment status?
(check one box)
1 Full-time job
2 Part-time job
3 Unemployed or laid off
4 Homemaker
5 In school
6 Retired
7 Other __________________

148
SECTION B: COPING WITH DIABETES During the last month, how much of a problem has each of the following been for you?
Not a Problem
Minor Problem
Moderate Problem
Somewhat Serious Problem
Serious Problem
Very Serious Problem
a. Feeling that diabetes is taking up too much of my mental and physical energy every day.
1 2 3 4 5 6
b. Feeling that my doctor doesn’t know enough about diabetes and diabetes care.
1 2 3 4 5 6
c. Feeling angry, scared, and/or depressed when I think about living with diabetes.
1 2 3 4 5 6
d. Feeling that my doctor doesn’t give me clear enough directions on how to manage my diabetes.
1 2 3 4 5 6
e. Feeling that I am not testing my blood sugars frequently enough.
1 2 3 4 5 6
f. Feeling that I am often failing with my diabetes regimen.
1 2 3 4 5 6
g. Feeling that friends or family are not supportive enough of my self-care efforts.
1 2 3 4 5 6
h. Feeling that diabetes controls my life. 1 2 3 4 5 6
i. Feeling that my doctor doesn’t take my concerns seriously enough.
1 2 3 4 5 6
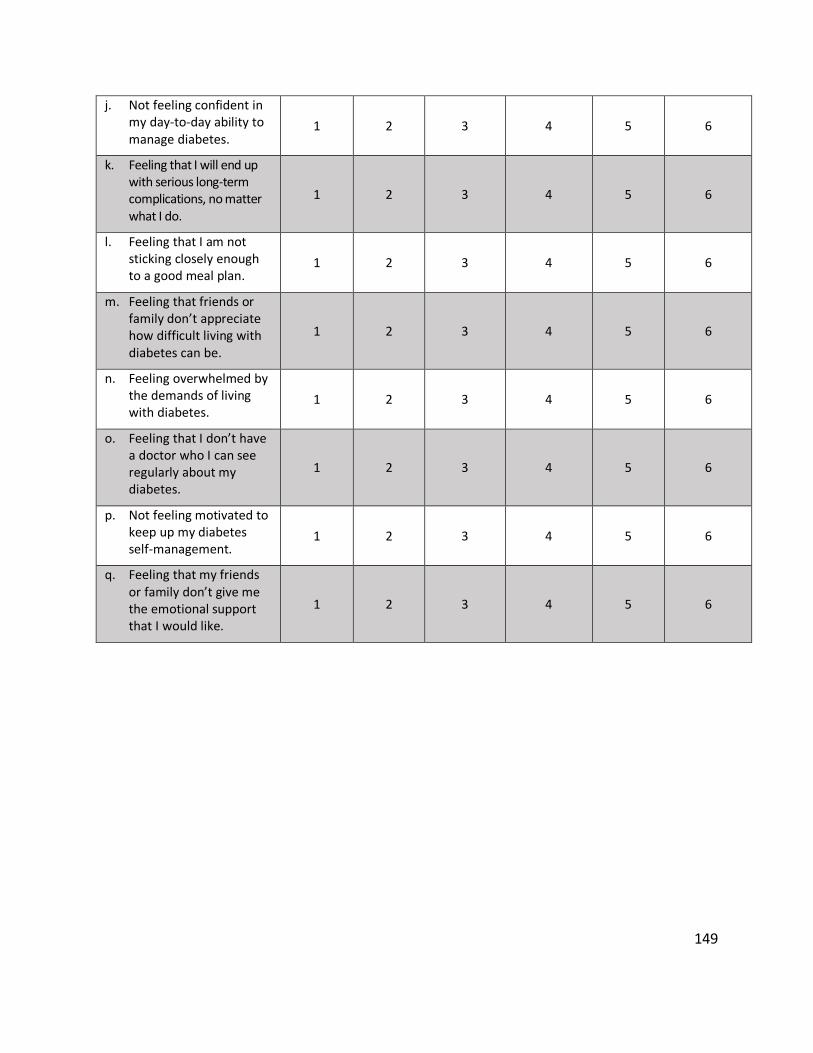
149
j. Not feeling confident in my day-to-day ability to manage diabetes.
1 2 3 4 5 6
k. Feeling that I will end up with serious long-term complications, no matter what I do.
1 2 3 4 5 6
l. Feeling that I am not sticking closely enough to a good meal plan.
1 2 3 4 5 6
m. Feeling that friends or family don’t appreciate how difficult living with diabetes can be.
1 2 3 4 5 6
n. Feeling overwhelmed by the demands of living with diabetes.
1 2 3 4 5 6
o. Feeling that I don’t have a doctor who I can see regularly about my diabetes.
1 2 3 4 5 6
p. Not feeling motivated to keep up my diabetes self-management.
1 2 3 4 5 6
q. Feeling that my friends or family don’t give me the emotional support that I would like.
1 2 3 4 5 6

150
Over the past 2 weeks, how often have you been bothered by each of the following problems? (Circle your answer)
NOTE: If you checked “Several days” please discuss this as soon as possible with your health care provider, go to the nearest emergency room, or dial 911.
Not at all Several Days
More than half the days
Nearly every day
a. Little interest or pleasure in doing things. 0 1 2 3
b. Feeling down, depressed, or hopeless. 0 1 2 3
c. Trouble falling or staying asleep, or sleeping too much.
0 1 2 3
d. Feeling tired or having little energy. 0 1 2 3
e. Poor appetite or overeating. 0 1 2 3
f. Feeling bad about yourself-or that you are a failure or have let yourself or your family down.
0 1 2 3
g. Trouble concentrating on things such as reading the newspaper or watching television.
0 1 2 3
h. Moving or speaking so slowly that other people could have noticed. Or the opposite-being so fidgety or restless that you have been moving around a lot more than usual.
0 1 2 3
i. Thoughts that you would be better off dead, or of hurting yourself in some way.
0 1 2 3

151
Appendix B: Chapter 2 – Peer Leaders’ Clinical Values Form
Subject ID:
Measurements
Height
Weight BMI
Waist Circumference
Blood Pressure
First Reading Systolic Diastolic
Second Reading Systolic Diastolic
Average Systolic Diastolic

152
Appendix C: Chapter 3 – Mini International Personality Item Pool (Mini-IPIP) Scale
Very Inaccurate
Moderately Inaccurate
Neither Inaccurate nor
Accurate
Moderately Accurate
Very Accurate
a. I keep in the background. 1 2 3 4 5
b. I get chores done right away. 1 2 3 4 5
c. I have difficulty understanding abstract ideas.
1 2 3 4 5
d. I feel others’ emotions. 1 2 3 4 5
e. I seldom feel blue. 1 2 3 4 5
f. I talk to a lot of different people at parties. 1 2 3 4 5
g. I make a mess of things. 1 2 3 4 5
h. I have vivid imagination. 1 2 3 4 5
i. I sympathize with others’ feelings. 1 2 3 4 5
j. I am relaxed most of the time. 1 2 3 4 5
k. I don’t talk a lot. 1 2 3 4 5
l. I like order. 1 2 3 4 5
m. I am not interested in abstract ideas. 1 2 3 4 5
n. I am not really interested in others. 1 2 3 4 5
o. I have frequent mood swings. 1 2 3 4 5
p. I am the life of the party. 1 2 3 4 5
q. I often forget to put things back in their proper place.
1 2 3 4 5

153
r. I do not have a good imagination. 1 2 3 4 5
s. I am not interested in other peoples’ problems.
1 2 3 4 5
t. I get upset easily. 1 2 3 4 5

154
Appendix D: Chapter 5 – Semi-Structured Interviews
Peer Leader Pseudonyms Interview Time and Date Interviewer
Peer Leader No. 1 12 PM on July 30, 2018 Bushra Mahmood
Peer Leader No. 2 4 PM on July 9, 2018 Bushra Mahmood
Peer Leader No. 3 9 AM on July 7, 2018 Bushra Mahmood
Peer Leader No. 4 6 PM on July 16, 2018 Bushra Mahmood
Peer Leader No. 5 12 PM on July 7, 2018 Ayman Azhar
Peer Leader No. 6 4:30 PM on July 17, 2018 Ayman Azhar
Peer Leader No. 7 10 AM on July 7, 2018 Ayman Azhar
Peer Leader No. 8 3:30 PM on July 11, 2018 Ayman Azhar
Peer Leader No. 9 12 PM on July 7, 2018 Bushra Mahmood
Peer Leader No. 10 9 AM on July 7, 2018 Ayman Azhar
Peer Leader No. 11 11:30 AM on July 10, 2018 Bushra Mahmood
Peer Leader No. 12 6 PM on July 16, 2018 Ayman Azhar
Peer Leader No. 13 11 AM on July 16, 2018 Bushra Mahmood
Peer Leader No. 14 12 PM on July 12, 2018 Bushra Mahmood
Peer Leader No. 15 11 AM on July 9, 2018 Bushra Mahmood
Peer Leader No. 16 2 PM on July 9, 2018 Bushra Mahmood
Peer Leader No. 17 12 PM on July 16, 2018 Ayman Azhar

155
Appendix E: Chapter 5 – Study Diagram Depicting Explanatory Sequential Mixed Methods Design (QUAN qual)
Integration of the Quantitative and Qualitative
Findings
Qualitative Data Analysis
Qualitative Data Collection
Sample Selection; Interview Guide Development
Quantitative Data Analysis
Quantitative Data Collection Repeated Measure
Observational Study
Interview Protocol and Interviews
One-on-One Semi-Structured Interviews with 17 PLs who participated in the QUAN Phase
Qualitative Descriptive Design
Purposefully Selecting PLs from the QUAN Phase for Qualitative Phase
Developing Interview Guide for the Qualitative Phase
Descriptive Analysis of PLs’ Socio-Demographic Characteristics
Changes in A1C and Diabetes Distress from Baseline to 12 Months
SPSS Software Descriptive Analysis Linear mixed effects
model
Survey Results on PLs’ Glycemic Control and Diabetes Distress at Baseline, 3 Months, and 12 Months
Codes and Themes Qualitative Descriptive
Analysis NVivo Qualitative
Software Coding and Identifying
Themes
Text Data (Interview Transcripts)
Discussion Implication Future Research
Interpretation and Explanation of the QUAN and qual Findings

156
Appendix F: Chapter 5 – Semi-Structured Interview Guide and Survey
SECTION A: SEMI-STRUCTURED INTERVIEW GUIDE Introduction: Hello! I hope you all are doing well! It is an honor to have you here today. Thanks for coming and accepting our invitation to participate in the research project “From clinic to community.” [Outline what will happen and how long it will take.] We are conducting a semi-structured interview today. The purpose of today’s interview is to share your experiences with us. This will help us improve our program. Introduce yourself to the peer leader and mention your role in the study. Add brief description of informed consent. (The interviewer will pass the two copies of consent forms to the participant, explaining that the white copy is for the study’s record and the yellow paper is the peer leaders’ copy. Then, she/he will start reading the consent form loudly.) Ask if there are any questions. Please let me know if you don’t feel comfortable answering any of the questions. In this case, we will move to the next question. Experiences as a peer leader: • How many participants do you have? • How long have you been a peer leader? • What has been your experience in working with your participants up until
now? (The facilitator writes participants’ experiences on the board.) • Would you mind telling us about positive aspects of your experience? • Would you mind telling us about challenges you have encountered? • What, if anything, would you change to make this experience better, if you had
the opportunity to step back in time? • What are your thoughts about telephone versus face-to-face contacts? • What is the optimal frequency for peer leader and participant contacts? • What are the behavioral goals that your participant(s) were most interested in
achieving? • What changes, if any, did your participants make? (Now, the facilitator passes
small pieces of papers to the peer leader.)

157
• Would you please jot down 3 ways that this study has affected you as both a peer leader and as a person with diabetes?
• What are some of the things that you noted? • Some of you previously mentioned that being a peer leader has helped you
with your diabetes management. Please tell us about this, if any of you have had the same experience with our study.
Questions about peer leader training: • How relevant was the peer leader training that you received to working with
your participants?
• How can we improve our training sessions? • What advice would you give to a peer leader who wants to start the program
tomorrow?
Questions about the characteristics of an effective peer leader: [Before asking any questions, please define what you mean by effective peer leader (improvement in their participants’ A1C or diabetes distress score).] • What characteristics do you think an effective peer leader should have? • In your opinion, what other criteria should be considered in defining effective
peer leaders? • In our preliminary analyses, effective peer leaders scored higher in
conscientiousness and extraversion. [Define conscientiousness and extraversion for them if needed.] What are your thoughts about this?
• What does a peer leader need to do to be conscientious/extraverted? Why does it matter if a leader is conscientious/extraverted?
• Are there any other personality characteristics that you think are necessary for effective peer leaders?
Miscellaneous questions: • Why did you attend the program? • What criteria/characteristics do you think we should use for pairing peer
leaders and participants? • What do you think we can do to decrease the drop-out rate?
Closing: • Are there any other points that you want to make?

158
Thanks for coming and being a part of our study! Please contact us if you have any concerns.

159
SECTION B: SEMI-STRUCTURED INTERVIEW SURVEY Subject ID: Date: Time: Please answer the following questions: 1. How did your glycemic control change over the course of the study? 2. Do you know how your participant(s) did over the course of the study? 3. If your participant improved, did it affect your glycemic control and what was
that? 4. If your participant’s glycemic control worsened over the last year, did it affect
you and what was that? 5. If you have made any positive changes, what do you relate them to? 6. If you haven’t made any positive changes, or things declined, what do you
relate them to? 7. Where do you see yourself in comparison to your participant?

160
Appendix G: Chapter 6 – Peer Leader Selection and Pairing Models
PEER LEADER SELECTION MODEL Peer leaders will be screened and recruited via a two-stage process.
I. In the initial phase, screening would be online and may include the following items at the minimum: a. Screening Diabetes Distress Scale (< 3) b. Select Mini-IPIP (high level of agreeableness (>4); low level of neuroticism (<2.5); and high level of
extraversion (>3))
c. A1C (7% and <8%)
II. The prospective peer leaders who met the initial screening criteria should then be invited to an in-person interview to assess their communication skills using the Active Listening Observation Scale (ALOS-global),115 to ensure their suitability for the role.
III. Please refer to the following two modified scales below.

161
SECTION A: SCREENING DIABETES DISTRESS SCALE Living with diabetes can sometimes be tough. There may be many problems and hassles concerning diabetes and they can vary greatly in severity. Problems may range from minor hassles to major life difficulties. Listed below are 2 potential problem areas that people with diabetes may experience. Consider the degree to which each of the 10 items may have distressed or bothered you DURING THE PAST MONTH and circle the appropriate number. Please note that we are asking you to indicate the degree to which each item may be bothering you in your life, NOT whether the item is merely true for you. If you feel that a particular item is not a bother or a problem for you, you would circle "1." If it is very bothersome to you, you might circle "6."
Not a problem
A slight problem
A moderate problem
Somewhat serious problem
A serious problem
A very serious problem
Feeling overwhelmed by the demands of living with diabetes.
1 2 3 4 5 6
Feeling that I am often failing with my diabetes routine.
1 2 3 4 5 6

162
SECTION B: SELECT MINI-IPIP SCALE This test measures your BIG5 personality, one of the most popular scientific measures of personality. You will be asked to evaluate the extent to which you agree with following statements. Please answer honestly with regard to how you see yourself in the present moment, not how you would like to be in the future. There are no incorrect answers nor any personality profile that is inherently more desirable than another.
Very inaccurate Moderately inaccurate
Neither inaccurate nor accurate
Moderately accurate
Very accurate
I keep in the background. 1 2 3 4 5 I feel others’ emotions. 1 2 3 4 5 I seldom feel blue. 1 2 3 4 5 I talk to a lot of different people at parties.
1 2 3 4 5
I sympathize with others’ feelings.
1 2 3 4 5
I am relaxed most of the time. 1 2 3 4 5
I don’t talk a lot. 1 2 3 4 5 I am not really interested in others.
1 2 3 4 5
I have frequent mood swings. 1 2 3 4 5
I am the life of the party. 1 2 3 4 5 I am not interested in other peoples’ problems. 1 2 3 4 5
I get upset easily. 1 2 3 4 5

163
SECTION C: ACTIVE LISTENING SKILLS
Items Strongly Disagree Disagree Neutral Agree Strongly Agree
Given participant time and space to present the problem.
1 2 3 4 5
Thoroughly explores and identifies all aspects of the problem.
1 2 3 4 5
Listens attentively. 1 2 3 4 5 Is not distracted during the conversation.
1 2 3 4 5
Is not offhand, hurried, or dismissive.
1 2 3 4 5
Expresses understanding verbally and non-verbally.
1 2 3 4 5
Makes an effort to state back understanding of what the other is communicating.
1 2 3 4 5
Uses open-ended questions. 1 2 3 4 5 Avoid giving advice or expressing judgements.
1 2 3 4 5

164
PEER LEADER-PARTICIPANT PAIRING MODEL
Peer leaders and participants will be paired based on their personal preferences (i.e., gender, age, location, etc.) Below is a questionnaire created based on the results of the study:
SECTION A: SOCIO-DEMOGRAPHICS
1. What is your age? __ __ years old 2. What is your gender? 1 Male 2 Female 3. What is your marital status?
1 Never married
2 Married/Partnered
3 Separated/Divorced
4 Widowed
4. What is your ethnic origin? (check all that apply)
1 Aboriginal
2 East Asian

165
3 South Asian
4 Southeast Asian
5 Caucasian
6 Other _______________
5. What is your highest level of education?
1 Less than high school
2 High school graduate (or equivalent)
3 University graduate or higher
6. Which of the following best describes your current employment status?
1 Employed/self-employed
2 Unemployed/laid off
3 In school
5 Retired
6 Other __________________

166
SECTION B: DIABETES-RELATED QUESTIONS
1. How long have you been diagnosed with diabetes? __ __
2. What type of diabetes do you have?
1 Type 1
2 Type 2
3. Do you take any medication for your diabetes?
1 Yes
2 No
4. Do you inject any type of insulin for your diabetes?
1 Yes
2 No
a. If yes, how long have you been on insulin? __ __

167
5. Do you use any other types of injection for your diabetes?
1 Yes
2 No
6. Do you have amputations as a result of your diabetes?
1 Yes
2 No
7. Are you on dialysis?
1 Yes
2 No
8. Do you have any neuropathy (numbness, tingling, or burning pain in your toes, fingers, feet, or legs)?
1 Yes
2 No

168
9. Do you have trouble seeing as a result of diabetes?
1 Yes
2 No

169
SECTION C: LIFE EXPERIENCE
1. Are you currently experiencing a particular life circumstance or challenge that you would prefer your peer
leader has related experiences in (e.g., pregnancy, disability, demanding job, etc.)? Please be specific.