A Microsatellite Guided Insight into the Genetic Status of Adi, an Isolated Hunting-Gathering Tribe...
11
A Microsatellite Guided Insight into the Genetic Status of Adi, an Isolated Hunting-Gathering Tribe of Northeast India S. Krithika, Suvendu Maji, T. S. Vasulu* Biological Anthropology Unit, Indian Statistical Institute, Kolkata, India Abstract Tibeto-Burman populations of India provide an insight into the peopling of India and aid in understanding their genetic relationship with populations of East, South and Southeast Asia. The study investigates the genetic status of one such Tibeto-Burman group, Adi of Arunachal Pradesh based on 15 autosomal microsatellite markers. Further the study examines, based on 9 common microsatellite loci, the genetic relationship of Adi with 16 other Tibeto-Burman speakers of India and 28 neighboring populations of East and Southeast Asia. Overall, the results support the recent formation of the Adi sub- tribes from a putative ancestral group and reveal that geographic contiguity is a major influencing factor of the genetic affinity among the Tibeto-Burman populations of India. Citation: Krithika S, Maji S, Vasulu TS (2008) A Microsatellite Guided Insight into the Genetic Status of Adi, an Isolated Hunting-Gathering Tribe of Northeast India. PLoS ONE 3(7): e2549. doi:10.1371/journal.pone.0002549 Editor: Niyaz Ahmed, Centre for DNA Fingerprinting and Diagnostics, India Received December 28, 2007; Accepted May 29, 2008; Published July 2, 2008 Copyright: ß 2008 Krithika et al. This is an open-access article distributed under the terms of the Creative Commons Attribution License, which permits unrestricted use, distribution, and reproduction in any medium, provided the original author and source are credited. Funding: The funding for the work was provided by the Indian Statistical Institute, Kolkata and Central Forensic Science Laboratory, Kolkata. CFSL provided the lab infracture and other materials required for the laboratory analysis of the samples. The funders had no role in study design, data analysis, decision to publish, or preparation of the manuscript. Competing Interests: The authors have declared that no competing interests exist. * E-mail: [email protected] Introduction Northeast India has always been a hotspot for population geneticists due to its unique and strategic geographic location and the presence of linguistically, culturally and demographically diverse populations practicing varied occupations (from hunting- gathering to settled agriculture) [1–3]. Due to their relative geophysical isolation (flanked by the Eastern Himalayas in the northern and the Bay of Bengal in the southern region), leading to limited external gene flow, these diverse populations retain a unique population structure which in turn is expected to reflect in their gene pools. This region exhibits linguistic diversity (represented by Tibeto- Burman, Austro-Asiatic and Indo-European language families) which can be attributed to diverse socio-cultural influences, extensive population interactions and putative long history of migrations experienced by the region in the past [4–5]. The Tibeto-Burman speaking populations predominate the region, about 2% of the total Indian population [6], representing a significant component of the biological diversity of the peopling of India. They exhibit vast diversity with respect to culture, language, subsistence economy and population structure variables like size, growth, distribution, marriage patterns and degree of endogamy [2,7–8]. These populations are of significance in understanding the peopling of India and in comprehending the relationship prevailing among the regional populations, as well as the relationship of these populations with the neighboring East/ Southeast Asian groups to whom they are morphologically, ethno- historically and linguistically affiliated [2,4–5,7–8]. In view of their importance, many researchers have earlier attempted, using classical and molecular genetic markers, to address various population genetic issues pertaining to these regional groups. The studies were however sporadic and restricted to only few regional populations [9–20]. In this regard, the Tibeto-Burman speaking populations inhabiting the easternmost tip of northeast India, Arunachal Pradesh, (sharing the international border between India and Bhutan, Tibet, Myanmar) were hardly dealt with and hence there exist a dearth of population genetic studies in this region [21–24]. However, Arunachal Pradesh is of importance from a population genetic perspective, as this region has experienced cultural contacts and population interactions due to multitude waves of migration, during different periods, from the adjoining regions [25]. Arunachal Pradesh (situated between latitude 26u309N and 29u309N and longitude 91u309E and 97u309E) is the abode of 26 major Tibeto-Burman speaking tribes and 110 sub-tribes and minor tribes [25], majority claiming their descent from the Tibetan region during different time periods (evident from the available ethno-historical accounts and folklore tradition). One of the largest tribe of the region is Adi, a collective tribe distributed in the temperate and sub-tropical regions within the districts of West Siang, East Siang, Upper Siang, Upper Subansiri and Dibang Valley in central Arunachal Pradesh [25–26]. They share similar physical features of that of East Asian populations and speak Adi dialects which belong to North-Assam branch of Tibeto-Burman sub-linguistic family [27]. The ethno-history suggests their origin from southern regions of Tibet (China) and traces their migration and settlement history of their ancestors (the ‘Tani’ group) at different time periods during about 5 th –7 th century AD [26,28– 30]. There are about 12 sub-tribes of Adi, categorized under two PLoS ONE | www.plosone.org 1 July 2008 | Volume 3 | Issue 7 | e2549
-
Upload
independent -
Category
Documents
-
view
3 -
download
0
Transcript of A Microsatellite Guided Insight into the Genetic Status of Adi, an Isolated Hunting-Gathering Tribe...
A Microsatellite Guided Insight into the Genetic Status ofAdi, an Isolated Hunting-Gathering Tribe of NortheastIndiaS. Krithika, Suvendu Maji, T. S. Vasulu*
Biological Anthropology Unit, Indian Statistical Institute, Kolkata, India
Abstract
Tibeto-Burman populations of India provide an insight into the peopling of India and aid in understanding their geneticrelationship with populations of East, South and Southeast Asia. The study investigates the genetic status of one suchTibeto-Burman group, Adi of Arunachal Pradesh based on 15 autosomal microsatellite markers. Further the study examines,based on 9 common microsatellite loci, the genetic relationship of Adi with 16 other Tibeto-Burman speakers of India and28 neighboring populations of East and Southeast Asia. Overall, the results support the recent formation of the Adi sub-tribes from a putative ancestral group and reveal that geographic contiguity is a major influencing factor of the geneticaffinity among the Tibeto-Burman populations of India.
Citation: Krithika S, Maji S, Vasulu TS (2008) A Microsatellite Guided Insight into the Genetic Status of Adi, an Isolated Hunting-Gathering Tribe of NortheastIndia. PLoS ONE 3(7): e2549. doi:10.1371/journal.pone.0002549
Editor: Niyaz Ahmed, Centre for DNA Fingerprinting and Diagnostics, India
Received December 28, 2007; Accepted May 29, 2008; Published July 2, 2008
Copyright: � 2008 Krithika et al. This is an open-access article distributed under the terms of the Creative Commons Attribution License, which permitsunrestricted use, distribution, and reproduction in any medium, provided the original author and source are credited.
Funding: The funding for the work was provided by the Indian Statistical Institute, Kolkata and Central Forensic Science Laboratory, Kolkata. CFSL provided thelab infracture and other materials required for the laboratory analysis of the samples. The funders had no role in study design, data analysis, decision to publish, orpreparation of the manuscript.
Competing Interests: The authors have declared that no competing interests exist.
* E-mail: [email protected]
Introduction
Northeast India has always been a hotspot for population
geneticists due to its unique and strategic geographic location and
the presence of linguistically, culturally and demographically
diverse populations practicing varied occupations (from hunting-
gathering to settled agriculture) [1–3]. Due to their relative
geophysical isolation (flanked by the Eastern Himalayas in the
northern and the Bay of Bengal in the southern region), leading to
limited external gene flow, these diverse populations retain a
unique population structure which in turn is expected to reflect in
their gene pools.
This region exhibits linguistic diversity (represented by Tibeto-
Burman, Austro-Asiatic and Indo-European language families)
which can be attributed to diverse socio-cultural influences,
extensive population interactions and putative long history of
migrations experienced by the region in the past [4–5]. The
Tibeto-Burman speaking populations predominate the region,
about 2% of the total Indian population [6], representing a
significant component of the biological diversity of the peopling of
India. They exhibit vast diversity with respect to culture, language,
subsistence economy and population structure variables like size,
growth, distribution, marriage patterns and degree of endogamy
[2,7–8]. These populations are of significance in understanding the
peopling of India and in comprehending the relationship
prevailing among the regional populations, as well as the
relationship of these populations with the neighboring East/
Southeast Asian groups to whom they are morphologically, ethno-
historically and linguistically affiliated [2,4–5,7–8]. In view of their
importance, many researchers have earlier attempted, using
classical and molecular genetic markers, to address various
population genetic issues pertaining to these regional groups.
The studies were however sporadic and restricted to only few
regional populations [9–20]. In this regard, the Tibeto-Burman
speaking populations inhabiting the easternmost tip of northeast
India, Arunachal Pradesh, (sharing the international border
between India and Bhutan, Tibet, Myanmar) were hardly dealt
with and hence there exist a dearth of population genetic studies in
this region [21–24]. However, Arunachal Pradesh is of importance
from a population genetic perspective, as this region has
experienced cultural contacts and population interactions due to
multitude waves of migration, during different periods, from the
adjoining regions [25].
Arunachal Pradesh (situated between latitude 26u309N and
29u309N and longitude 91u309E and 97u309E) is the abode of 26
major Tibeto-Burman speaking tribes and 110 sub-tribes and
minor tribes [25], majority claiming their descent from the
Tibetan region during different time periods (evident from the
available ethno-historical accounts and folklore tradition). One of
the largest tribe of the region is Adi, a collective tribe distributed in
the temperate and sub-tropical regions within the districts of West
Siang, East Siang, Upper Siang, Upper Subansiri and Dibang
Valley in central Arunachal Pradesh [25–26]. They share similar
physical features of that of East Asian populations and speak Adi
dialects which belong to North-Assam branch of Tibeto-Burman
sub-linguistic family [27]. The ethno-history suggests their origin
from southern regions of Tibet (China) and traces their migration
and settlement history of their ancestors (the ‘Tani’ group) at
different time periods during about 5th–7th century AD [26,28–
30]. There are about 12 sub-tribes of Adi, categorized under two
PLoS ONE | www.plosone.org 1 July 2008 | Volume 3 | Issue 7 | e2549
major clusters based on their dialect, culture, ethno-historical
migration and distribution along the Siang river valley. While one
cluster consists of the Minyong, Padam, Shimong, Milan, Pasi,
Panggi and Komkar sub-tribes, the other includes Gallong, Ramo,
Bokar, Pailobo and Bori sub-tribes. Among these 12 sub-tribes,
Minyong and Padam are numerically large (about several
thousands), the rest being small (in hundreds) [29–30] and live
in isolation in upper mountain regions. Their ethno-historical
records suggest that these sub-tribes are as a resultant of fission-
fusion processes due to inter tribal war fares [26,28]. Some of the
remotely located (in mountainous terrains) Adi sub-populations
practice hunting-gathering, while some others located over plain
lands, in close proximity to urban area, practice settled agriculture.
These wide variations in population structure, coupled with the
vast diversity in their culture including religious beliefs, customs,
dialect, house types, food habits, dress and ornaments’ pattern and
demography, render importance to these groups from a
population genetic perspective [29–31].
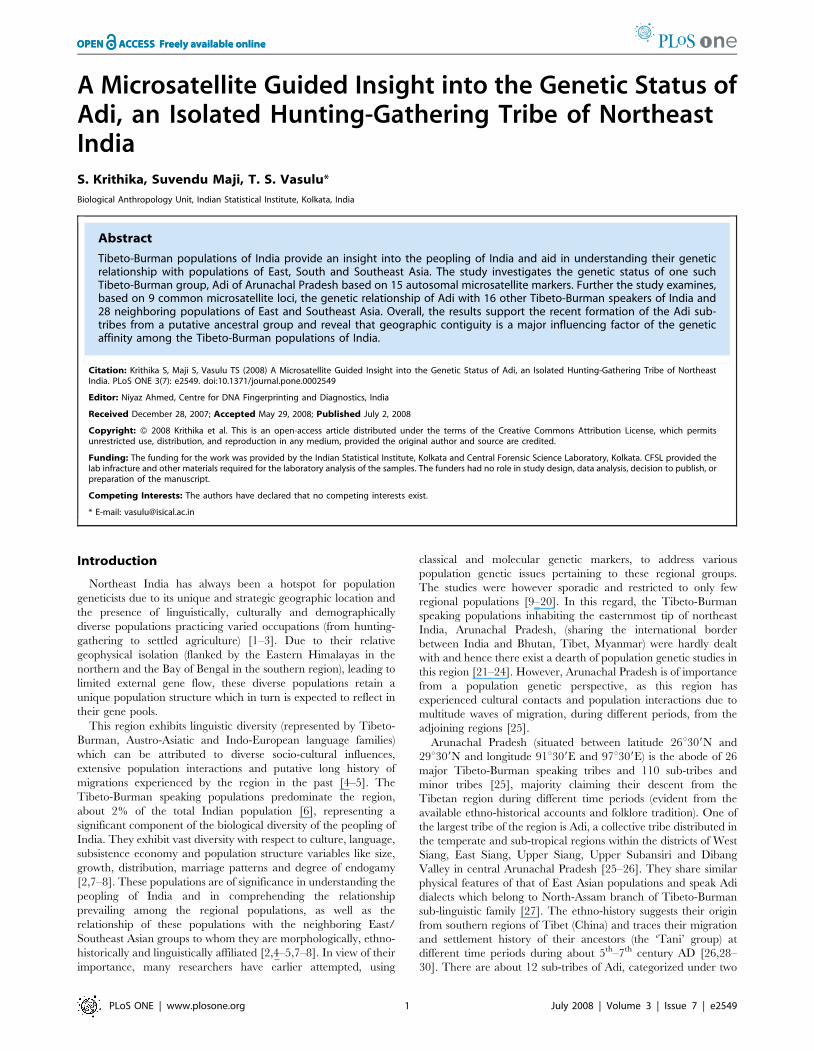
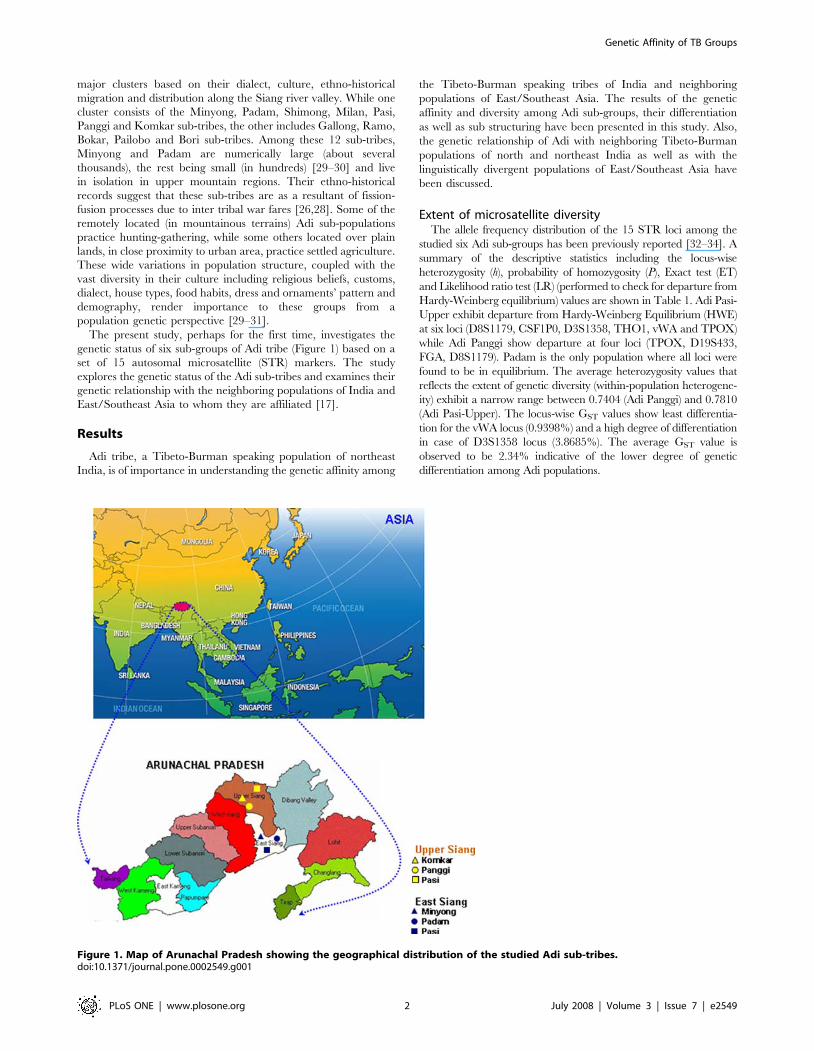
The present study, perhaps for the first time, investigates the
genetic status of six sub-groups of Adi tribe (Figure 1) based on a
set of 15 autosomal microsatellite (STR) markers. The study
explores the genetic status of the Adi sub-tribes and examines their
genetic relationship with the neighboring populations of India and
East/Southeast Asia to whom they are affiliated [17].
Results
Adi tribe, a Tibeto-Burman speaking population of northeast
India, is of importance in understanding the genetic affinity among
the Tibeto-Burman speaking tribes of India and neighboring
populations of East/Southeast Asia. The results of the genetic
affinity and diversity among Adi sub-groups, their differentiation
as well as sub structuring have been presented in this study. Also,
the genetic relationship of Adi with neighboring Tibeto-Burman
populations of north and northeast India as well as with the
linguistically divergent populations of East/Southeast Asia have
been discussed.
Extent of microsatellite diversityThe allele frequency distribution of the 15 STR loci among the
studied six Adi sub-groups has been previously reported [32–34]. A
summary of the descriptive statistics including the locus-wise
heterozygosity (h), probability of homozygosity (P), Exact test (ET)
and Likelihood ratio test (LR) (performed to check for departure from
Hardy-Weinberg equilibrium) values are shown in Table 1. Adi Pasi-
Upper exhibit departure from Hardy-Weinberg Equilibrium (HWE)
at six loci (D8S1179, CSF1P0, D3S1358, THO1, vWA and TPOX)
while Adi Panggi show departure at four loci (TPOX, D19S433,
FGA, D8S1179). Padam is the only population where all loci were
found to be in equilibrium. The average heterozygosity values that
reflects the extent of genetic diversity (within-population heterogene-
ity) exhibit a narrow range between 0.7404 (Adi Panggi) and 0.7810
(Adi Pasi-Upper). The locus-wise GST values show least differentia-
tion for the vWA locus (0.9398%) and a high degree of differentiation
in case of D3S1358 locus (3.8685%). The average GST value is
observed to be 2.34% indicative of the lower degree of genetic
differentiation among Adi populations.
Figure 1. Map of Arunachal Pradesh showing the geographical distribution of the studied Adi sub-tribes.doi:10.1371/journal.pone.0002549.g001
Genetic Affinity of TB Groups
PLoS ONE | www.plosone.org 2 July 2008 | Volume 3 | Issue 7 | e2549

Table 1. Locus-wise and population-wise descriptivestatistics among the studied populations, based on 15 STRloci
Locus Populations Statistical Parameters
ET LR h p
D5S818 Lower Pasi 0.4850 0.5300 0.7650 0.1560
Upper Pasi 0.2335 0.0010 0.7910 0.2882
Minyong 0.4480 0.4265 0.5200 0.0012
Panggi 0.2655 0.1405 0.8595 0.0242
Komkar 0.2935 0.1595 0.8226 0.2424
Padam 0.8625 0.9055 0.8043 0.8955
FGA Lower Pasi 0.4330 0.7170 0.7950 0.0001
Upper Pasi 0.1640 0.0740 0.8060 0.0142
Minyong 0.0185 0.0130 0.8125 0.4497
Panggi 0.0065 0.0045 0.8451 0.9704
Komkar 0.6670 0.8715 0.7674 0.0864
Padam 0.2540 0.3510 0.6591 0.0000
D8S1179 Lower Pasi 0.0020 0.0000 0.8270 0.4880
Upper Pasi 0.0000 0.0000 0.9170 0.0022
Minyong 0.0225 0.0190 0.8667 0.2039
Panggi 0.0000 0.0000 0.8636 0.0545
Komkar 0.0090 0.0075 0.8730 0.2908
Padam 0.0345 0.0225 0.9200 0.0108
D21S11 Lower Pasi 0.6430 0.8550 0.8030 0.3550
Upper Pasi 0.2710 0.0390 0.6670 0.0016
Minyong 0.6005 0.5150 0.7083 0.6842
Panggi 0.0000 0.0000 0.8818 0.0024
Komkar 0.3425 0.2000 0.9032 0.1106
Padam 0.3420 0.5205 0.8200 0.8597
D7S820 Lower Pasi 0.5300 0.7540 0.6200 0.0002
Upper Pasi 0.2530 0.2660 0.7500 0.4362
Minyong 0.0825 0.1590 0.6364 0.1424
Panggi 0.1490 0.3175 0.6628 0.1409
Komkar 0.9930 0.6981 0.6981 0.5583
Padam 0.1225 0.0955 0.7727 0.7349
Locus Populations Statistical Parameters
ET LR h p
CSF1PO Lower Pasi 0.1970 0.1800 0.6700 0.3820
Upper Pasi 0.0010 0.0020 0.5320 0.0054
Minyong 0.0715 0.2275 0.4545 0.1477
Panggi 0.0795 0.0235 0.6667 0.7589
Komkar 0.9115 0.8145 0.7143 0.4788
Padam 0.0640 0.2165 0.5217 0.2348
D3S1358 Lower Pasi 0.2550 0.4090 0.6960 0.6980
Upper Pasi 0.0020 0.0020 0.8160 0.0250
Minyong 0.7245 0.5775 0.6207 0.1423
Panggi 0.0445 0.0250 0.8073 0.0130
Komkar 0.9950 0.9775 0.7619 0.7348
Padam 0.7700 0.7805 0.6800 0.7600
THO1 Lower Pasi 0.4280 0.0050 0.6000 0.6970
Upper Pasi 0.0005 0.0000 0.7520 0.0022
Minyong 0.0030 0.0025 0.7241 0.2641
Panggi 0.4535 0.3315 0.6273 0.0294
Locus Populations Statistical Parameters
ET LR h p
Komkar 0.0540 0.0280 0.6190 0.4228
Padam 0.6985 0.4965 0.7000 0.0972
D13S317 Lower Pasi 0.7430 0.8390 0.7990 0.7540
Upper Pasi 0.4810 0.0800 0.6880 0.0018
Minyong 0.8650 0.9365 0.6842 0.4553
Panggi 0.1195 0.0760 0.7624 0.3300
Komkar 0.4430 0.4165 0.8131 0.5465
Padam 0.9860 0.9685 0.7708 0.8012
D16S5139 Lower Pasi 0.0320 0.0710 0.7270 0.3900
Upper Pasi 0.2910 0.0670 0.7600 0.2645
Minyong 0.3145 0.2775 0.7778 0.8607
Panggi 0.0190 0.0325 0.6875 0.6560
Komkar 0.0515 0.0945 0.6393 0.4217
Padam 0.6600 0.6690 0.7500 0.6301
Locus Population Statistical Parameters
ET LR h p
D2S1338 Lower Pasi 0.1770 0.3100 0.7550 0.0002
Upper Pasi 0.2630 0.2040 0.7050 0.0000
Minyong 0.4355 0.2925 0.9545 0.2730
Panggi 0.1935 0.2295 0.7561 0.0608
Komkar 0.0925 0.0830 0.8750 0.3816
Padam 0.7350 0.8775 0.7872 0.2614
D19S433 Lower Pasi 0.0010 0.3060 0.7950 0.0187
Upper Pasi 0.1220 0.0040 0.8950 0.0067
Minyong 0.0160 0.0145 0.7037 0.3349
Panggi 0.0000 0.0000 0.9450 0.0329
Komkar 0.0000 0.0000 0.8730 0.2753
Padam 0.7165 0.6530 0.8600 0.7637
Vwa Lower Pasi 0.2820 0.0660 0.8150 0.9100
Upper Pasi 0.0000 0.0000 0.8450 0.0265
Minyong 0.0150 0.0225 0.6154 0.3347
Panggi 0.0035 0.0005 0.8455 0.1544
Komkar 0.0000 0.0000 0.8730 0.0388
Padam 0.1595 0.0485 0.8600 0.1999
TPOX Lower Pasi 0.2830 0.0650 0.5550 0.0014
Upper Pasi 0.0000 0.0000 0.8120 0.0105
Minyong 0.0535 0.0320 0.6667 0.7009
Panggi 0.0000 0.0000 0.8073 0.0233
Komkar 0.7945 0.3990 0.6667 0.4691
Padam 0.1035 0.4035 0.7941 0.9360
D18S51 Lower Pasi 0.0010 0.0010 0.6800 0.0015
Upper Pasi 0.0980 0.2080 0.6810 0.0391
Minyong 0.1215 0.0575 1.0000 0.1945
Panggi 0.2400 0.3650 0.6029 0.7448
Komkar 0.6645 0.6210 0.7143 0.6395
Padam 0.4120 0.4035 0.7941 0.9360
ET: Exact Test; LR: Likelihood Ratio Test (ET and LR tests were done to test fordeparture from Hardy-Weinberg equilibrium); h: average heterozygosity; p:Probability of homozygositydoi:10.1371/journal.pone.0002549.t001
Table 1. Cont.
Genetic Affinity of TB Groups
PLoS ONE | www.plosone.org 3 July 2008 | Volume 3 | Issue 7 | e2549

Genetic differentiation and sub-structuring among Aditribe
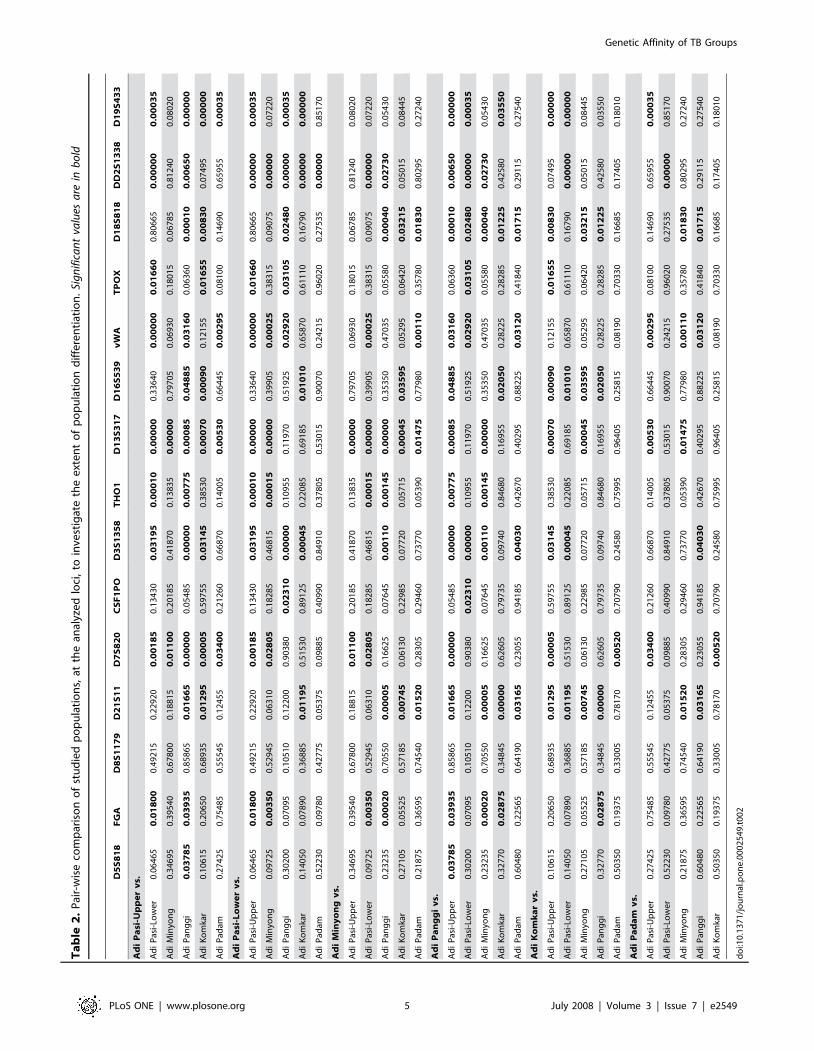
The locus-wise results of the exact test of population differenti-
ation are shown in Table 2. Pair wise comparison of the sub-tribes of
Adi reveal most significant difference (at 12 loci: D5S818, FGA,
D21S11, D7S820, D3S1358, THO1, D13S317, D16S539, vWA,
D18S818, D2S1338, D19S433) between Adi Pasi-Upper and Adi
Panggi. Adi Pasi-Upper also shows significant differences at 9 loci
with Adi Pasi-Lower (FGA, D7S820, D3S1358, THO1, D13S317,
vWA, TPOX, D2S1338, D19S433) and at 8 loci with Adi Komkar
(D21S11, D7S820, D3S1358, D13S317, D16S539, TPOX,
D18S818, D19S433). Least significant difference is shown by Adi
Padam with Adi Pasi-Lower (at locus D2S1338) and Adi Komkar
(at locus D7S820). Overall, Adi Pasi-Upper shows significant
difference, at loci D7S820 and D13S317, with all the other study
populations. Among the analyzed 15 STR loci, D8S1179 shows no
significant difference among the Adi sub-tribes and also CSF1PO
and D5S818 show significant difference only in one pair of
populations (between Adi Pasi-Lower–Adi Panggi and Adi Pasi-
Upper –Adi Panggi respectively).
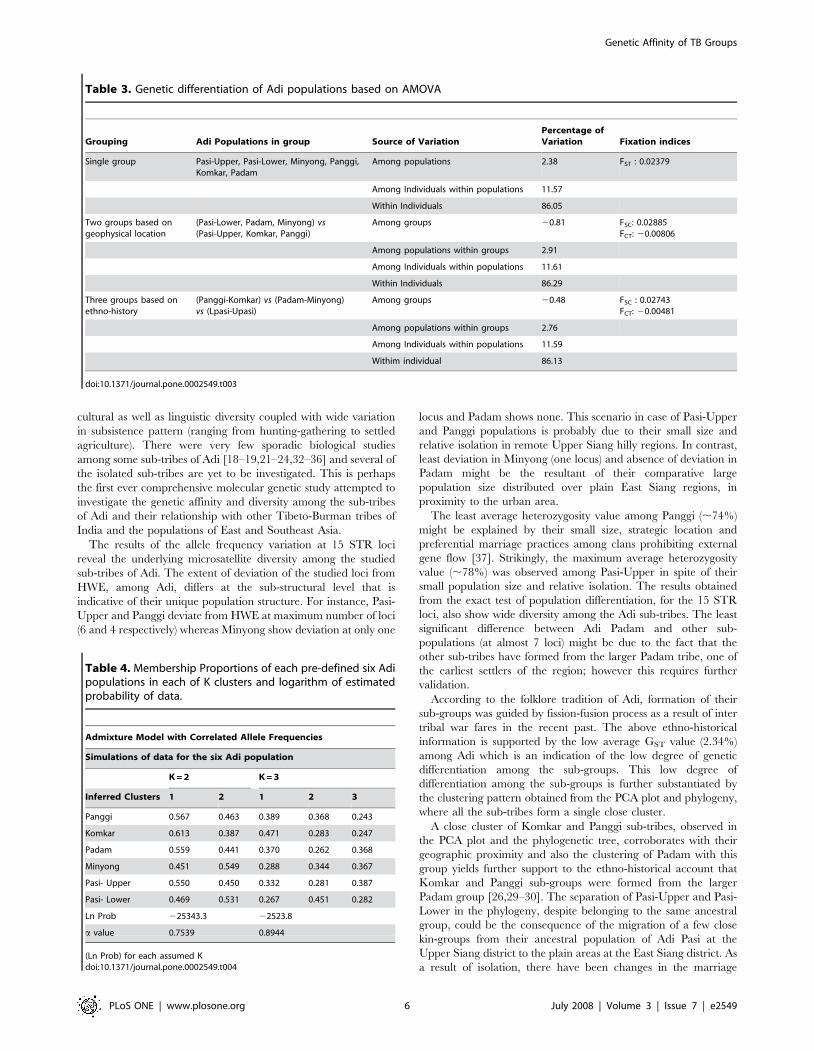
AMOVA results, presented in Table 3, reveal that irrespective of
any grouping, 2.38% of variation is attributable to differences among
populations, while 11.6% of variation result from differences among
the individuals within populations. The corresponding FST value of
0.02379 indicates a low degree of genetic differentiation, among the
studied groups, which might probably be attributed to the recent
formation of the different factions from a common ancestral group.
Two important factors that might possibly have played a key role in
the genetic differentiation of Adi are: fission due to inter-tribal
conflicts and relative geographic isolation of the formed contempo-
rary Adi sub-tribes [28–30]. So AMOVA analyses were performed to
understand the relative influence of both these factors towards the
genetic differentiation of Adi (Table 3). The grouping of populations
based on their geophysical location (FSC: 0.02885) as well as their
ethno-history (FSC: 0.02743) did not reveal any significant differences
among the groups. In both cases, the variation among the populations
and within the groups was around 2.8% and among the individual
within the populations was around 11.6% as in case of the single
group analysis. The variation within individuals was found to be
around 86% at different levels of analyses.
To understand the extent of sub structuring among the Adi sub-
tribes we have performed structure analysis with different values of
K. Simulation summary for K = 2 and K = 3, including the logarithm
of estimated probability of data (Ln Prob) values, values of
proportion of membership of each pre-defined populations in each
of the two or three clusters and the corresponding a values are given
in Table 4. The pattern of sub structuring among the studied sub-
populations is depicted in Figure 2. The log probability values and
the membership proportions of each group, during different
simulations, show no clear sub-structure among the Adi sub-tribes.
In case of K = 2 and K = 3, Adi Komkar show higher proportion of
membership (0.613 and 0.471) to cluster 1. Adi Pasi-Lower shows
higher values of membership proportion (0.451) in case of clusters 2,
when K = 3. The extent of genetic differentiation do not differ in
case of K = 3 (mean value of a= 0.894) and K = 2 (mean value of
a= 0.754) categories. The pattern depicted in Figure 2 (both for
K = 2 and K = 3) shows no clear indication of sub-structuring among
the six Adi sub-populations.
Genetic affinity among the studied populationsThe pattern of clustering and the genetic affinity between the six
Adi sub-tribes are shown in the DA-NJ phylogenetic trees
(supplementary Figure S1) and the PCA plot (Figure 3). The
studied populations depict a single close cluster of four populations
(Panggi, Komkar, Padam and Pasi-Lower), the remaining two
populations, viz., Adi Pasi-Upper and Adi Minyong separating
away from the others. The PCA plot also show a similar pattern of
clustering, substantiating the pattern obtained from the dendro-
gram, with the exception of Adi Pasi-Lower which was distantly
located from the Panggi-Komkar-Padam cluster.
Genetic relationship of Adi with other populationsa) Tibeto-Burman speaking populations of India. The DA-
NJ phylogenetic tree, depicting the genetic relationship of Adi sub-
populations with the sixteen neighboring Tibeto-Burman speaking
populations of north and north-east India, is shown in supplementary
Figure S2 and the corresponding PCA plot is depicted in Figure 4.
Overall, the geographically proximate Tibeto-Burman populations
tend to cluster together. The phylogeny exhibits 3 distinct major
clusters. Cluster I consists of two sub-clusters, where the first sub-
cluster, Ladakh-Sikkim sub-cluster, includes 4 populations from Ladakh
[Ladakh Buddhist, Argon, Drokpa and Balti] and 2 populations from
Sikkim [Bhutia and Lepcha]. Lotha Naga of Nagaland is found to be
an outlier to the Ladakh populations. The second sub-cluster,
Mizoram sub-cluster, comprise completely of the four tribal populations
of Mizoram [Hmar, Mara, Lai and Lusei].
Cluster II (Arunachal cluster) consist exclusively of the six Adi sub-
groups which retained their previous clustering pattern (Figures 2
and 3) and thereby revealing their distinct identity. The third
major cluster (Manipur-Garo cluster) includes three populations from
Manipur [Hmar, Naga and Kuki] along with the distantly located
Garo of West Bengal. Garo of Meghalaya stands out as an outlier
to this cluster. The corresponding PCA plot (Figure 4) reveal
similar clustering pattern as observed in supplementary Figure S2,
but the clusters 1 and 2 is not as clearly distinct as it was in the
phylogeny. The third cluster, Manipur-Garo cluster, however retains
their distinctness.
b) Populations of East and Southeast Asia. The DA-NJ
phylogeny (supplementary Figure S3) comprising of the Tibeto-
Burman speakers of India (including Adi) along with the linguistically
diverse but morphologically similar populations of East and Southeast
Asia, show geography based clustering of the analyzed populations,
but the branching of the clusters are not distinct at the root. However,
the sub-branching shows clear clustering of regional populations and
at least 4 major clusters can be seen in the dendrogram. One cluster
consist of populations from East Asia [4: Han Chinese- North-East,
Chinese-East, Japanese and Korean] and Manipur of India [3:
Hmar, Kuki and Naga] along with Garo of West Bengal. Another
major cluster comprise of populations from Southeast Asia [7: Thai,
Vietnamese, Filipinos, Malaysian Malays, Malaysian Singaporean,
Malaysian Javanese and Indonesian] and Ladakh and Sikkim of
India [3: Drokpa, Balti and Bhutia]. Yet another cluster includes
chiefly the Tibetan populations [4: Naqu, Changdu, Lassa and
Chinese Tibetan] along with 2 populations of Ladakh [Argon and
Ladakh Buddhist], 3 populations of Nepal [Sherpa, Non-Sherpa and
Nepalese], Lotha Naga of Nagaland, Lepcha of Sikkim and
Bhutanese. One more cluster consist of populations from
Arunachal Pradesh [six Adi sub-groups], Mizoram [4: Hmar,
Mara, Lai and Lusei], Luoba of Tibet, Nepali of Sikkim and Garo
of Meghalaya. The remaining populations [7: mainly from different
geographical regions of China] are sparsely located in the phylogeny.
The corresponding PCA plot (figure not shown) of this dataset did
reveal similar clustering pattern.
Discussion
Adi tribe comprises of several sub-tribes settled in relative
geophysical isolation since several generations. They exhibit socio-
Genetic Affinity of TB Groups
PLoS ONE | www.plosone.org 4 July 2008 | Volume 3 | Issue 7 | e2549
Ta
ble
2.
Pai
r-w
ise
com
par
iso
no
fst
ud
ied
po
pu
lati
on
s,at
the
anal
yze
dlo
ci,
toin
vest
igat
eth
ee
xte
nt
of
po
pu
lati
on
dif
fere
nti
atio
n.
Sig
nif
ica
nt
valu
esa
rein
bo
ld
D5
S8
18
FG
AD
8S
11
79
D2
1S
11
D7
S8
20
CS
F1
PO
D3
S1
35
8T
HO
1D
13
S3
17
D1
6S
53
9v
WA
TP
OX
D1
8S
81
8D
D2
S1
33
8D
19
S4
33
Ad
iP
asi
-Up
pe
rv
s.
Ad
iP
asi-
Low
er
0.0
64
65
0.0
18
00
0.4
92
15
0.2
29
20
0.0
01
85
0.1
34
30
0.0
31
95
0.0
00
10
0.0
00
00
0.3
36
40
0.0
00
00
0.0
16
60
0.8
06
65
0.0
00
00
0.0
00
35
Ad
iM
inyo
ng
0.3
46
95
0.3
95
40
0.6
78
00
0.1
88
15
0.0
11
00
0.2
01
85
0.4
18
70
0.1
38
35
0.0
00
00
0.7
97
05
0.0
69
30
0.1
80
15
0.0
67
85
0.8
12
40
0.0
80
20
Ad
iP
ang
gi
0.0
37
85
0.0
39
35
0.8
58
65
0.0
16
65
0.0
00
00
0.0
54
85
0.0
00
00
0.0
07
75
0.0
00
85
0.0
48
85
0.0
31
60
0.0
63
60
0.0
00
10
0.0
06
50
0.0
00
00
Ad
iK
om
kar
0.1
06
15
0.2
06
50
0.6
89
35
0.0
12
95
0.0
00
05
0.5
97
55
0.0
31
45
0.3
85
30
0.0
00
70
0.0
00
90
0.1
21
55
0.0
16
55
0.0
08
30
0.0
74
95
0.0
00
00
Ad
iP
adam
0.2
74
25
0.7
54
85
0.5
55
45
0.1
24
55
0.0
34
00
0.2
12
60
0.6
68
70
0.1
40
05
0.0
05
30
0.6
64
45
0.0
02
95
0.0
81
00
0.1
46
90
0.6
59
55
0.0
00
35
Ad
iP
asi
-Lo
we
rv
s.
Ad
iP
asi-
Up
pe
r0
.06
46
50
.01
80
00
.49
21
50
.22
92
00
.00
18
50
.13
43
00
.03
19
50
.00
01
00
.00
00
00
.33
64
00
.00
00
00
.01
66
00
.80
66
50
.00
00
00
.00
03
5
Ad
iM
inyo
ng
0.0
97
25
0.0
03
50
0.5
29
45
0.0
63
10
0.0
28
05
0.1
82
85
0.4
68
15
0.0
00
15
0.0
00
00
0.3
99
05
0.0
00
25
0.3
83
15
0.0
90
75
0.0
00
00
0.0
72
20
Ad
iP
ang
gi
0.3
02
00
0.0
70
95
0.1
05
10
0.1
22
00
0.9
03
80
0.0
23
10
0.0
00
00
0.1
09
55
0.1
19
70
0.5
19
25
0.0
29
20
0.0
31
05
0.0
24
80
0.0
00
00
0.0
00
35
Ad
iK
om
kar
0.1
40
50
0.0
78
90
0.3
68
85
0.0
11
95
0.5
15
30
0.8
91
25
0.0
00
45
0.2
20
85
0.6
91
85
0.0
10
10
0.6
58
70
0.6
11
10
0.1
67
90
0.0
00
00
0.0
00
00
Ad
iP
adam
0.5
22
30
0.0
97
80
0.4
27
75
0.0
53
75
0.0
98
85
0.4
09
90
0.8
49
10
0.3
78
05
0.5
30
15
0.9
00
70
0.2
42
15
0.9
60
20
0.2
75
35
0.0
00
00
0.8
51
70
Ad
iM
iny
on
gv
s.
Ad
iP
asi-
Up
pe
r0
.34
69
50
.39
54
00
.67
80
00
.18
81
50
.01
10
00
.20
18
50
.41
87
00
.13
83
50
.00
00
00
.79
70
50
.06
93
00
.18
01
50
.06
78
50
.81
24
00
.08
02
0
Ad
iP
asi-
Low
er
0.0
97
25
0.0
03
50
0.5
29
45
0.0
63
10
0.0
28
05
0.1
82
85
0.4
68
15
0.0
00
15
0.0
00
00
0.3
99
05
0.0
00
25
0.3
83
15
0.0
90
75
0.0
00
00
0.0
72
20
Ad
iP
ang
gi
0.2
32
35
0.0
00
20
0.7
05
50
0.0
00
05
0.1
66
25
0.0
76
45
0.0
01
10
0.0
01
45
0.0
00
00
0.3
53
50
0.4
70
35
0.0
55
80
0.0
00
40
0.0
27
30
0.0
54
30
Ad
iK
om
kar
0.2
71
05
0.0
55
25
0.5
71
85
0.0
07
45
0.0
61
30
0.2
29
85
0.0
77
20
0.0
57
15
0.0
00
45
0.0
35
95
0.0
52
95
0.0
64
20
0.0
32
15
0.0
50
15
0.0
84
45
Ad
iP
adam
0.2
18
75
0.3
65
95
0.7
45
40
0.0
15
20
0.2
83
05
0.2
94
60
0.7
37
70
0.0
53
90
0.0
14
75
0.7
79
80
0.0
01
10
0.3
57
80
0.0
18
30
0.8
02
95
0.2
72
40
Ad
iP
an
gg
iv
s.
Ad
iP
asi-
Up
pe
r0
.03
78
50
.03
93
50
.85
86
50
.01
66
50
.00
00
00
.05
48
50
.00
00
00
.00
77
50
.00
08
50
.04
88
50
.03
16
00
.06
36
00
.00
01
00
.00
65
00
.00
00
0
Ad
iP
asi-
Low
er
0.3
02
00
0.0
70
95
0.1
05
10
0.1
22
00
0.9
03
80
0.0
23
10
0.0
00
00
0.1
09
55
0.1
19
70
0.5
19
25
0.0
29
20
0.0
31
05
0.0
24
80
0.0
00
00
0.0
00
35
Ad
iM
inyo
ng
0.2
32
35
0.0
00
20
0.7
05
50
0.0
00
05
0.1
66
25
0.0
76
45
0.0
01
10
0.0
01
45
0.0
00
00
0.3
53
50
0.4
70
35
0.0
55
80
0.0
00
40
0.0
27
30
0.0
54
30
Ad
iK
om
kar
0.3
27
70
0.0
28
75
0.3
48
45
0.0
00
00
0.6
26
05
0.7
97
35
0.0
97
40
0.8
46
80
0.1
69
55
0.0
20
50
0.2
82
25
0.2
82
85
0.0
12
25
0.4
25
80
0.0
35
50
Ad
iP
adam
0.6
04
80
0.2
25
65
0.6
41
90
0.0
31
65
0.2
30
55
0.9
41
85
0.0
40
30
0.4
26
70
0.4
02
95
0.8
82
25
0.0
31
20
0.4
18
40
0.0
17
15
0.2
91
15
0.2
75
40
Ad
iK
om
ka
rv
s.
Ad
iP
asi-
Up
pe
r0
.10
61
50
.20
65
00
.68
93
50
.01
29
50
.00
00
50
.59
75
50
.03
14
50
.38
53
00
.00
07
00
.00
09
00
.12
15
50
.01
65
50
.00
83
00
.07
49
50
.00
00
0
Ad
iP
asi-
Low
er
0.1
40
50
0.0
78
90
0.3
68
85
0.0
11
95
0.5
15
30
0.8
91
25
0.0
00
45
0.2
20
85
0.6
91
85
0.0
10
10
0.6
58
70
0.6
11
10
0.1
67
90
0.0
00
00
0.0
00
00
Ad
iM
inyo
ng
0.2
71
05
0.0
55
25
0.5
71
85
0.0
07
45
0.0
61
30
0.2
29
85
0.0
77
20
0.0
57
15
0.0
00
45
0.0
35
95
0.0
52
95
0.0
64
20
0.0
32
15
0.0
50
15
0.0
84
45
Ad
iP
ang
gi
0.3
27
70
0.0
28
75
0.3
48
45
0.0
00
00
0.6
26
05
0.7
97
35
0.0
97
40
0.8
46
80
0.1
69
55
0.0
20
50
0.2
82
25
0.2
82
85
0.0
12
25
0.4
25
80
0.0
35
50
Ad
iP
adam
0.5
03
50
0.1
93
75
0.3
30
05
0.7
81
70
0.0
05
20
0.7
07
90
0.2
45
80
0.7
59
95
0.9
64
05
0.2
58
15
0.0
81
90
0.7
03
30
0.1
66
85
0.1
74
05
0.1
80
10
Ad
iP
ad
am
vs.
Ad
iP
asi-
Up
pe
r0
.27
42
50
.75
48
50
.55
54
50
.12
45
50
.03
40
00
.21
26
00
.66
87
00
.14
00
50
.00
53
00
.66
44
50
.00
29
50
.08
10
00
.14
69
00
.65
95
50
.00
03
5
Ad
iP
asi-
Low
er
0.5
22
30
0.0
97
80
0.4
27
75
0.0
53
75
0.0
98
85
0.4
09
90
0.8
49
10
0.3
78
05
0.5
30
15
0.9
00
70
0.2
42
15
0.9
60
20
0.2
75
35
0.0
00
00
0.8
51
70
Ad
iM
inyo
ng
0.2
18
75
0.3
65
95
0.7
45
40
0.0
15
20
0.2
83
05
0.2
94
60
0.7
37
70
0.0
53
90
0.0
14
75
0.7
79
80
0.0
01
10
0.3
57
80
0.0
18
30
0.8
02
95
0.2
72
40
Ad
iP
ang
gi
0.6
04
80
0.2
25
65
0.6
41
90
0.0
31
65
0.2
30
55
0.9
41
85
0.0
40
30
0.4
26
70
0.4
02
95
0.8
82
25
0.0
31
20
0.4
18
40
0.0
17
15
0.2
91
15
0.2
75
40
Ad
iK
om
kar
0.5
03
50
0.1
93
75
0.3
30
05
0.7
81
70
0.0
05
20
0.7
07
90
0.2
45
80
0.7
59
95
0.9
64
05
0.2
58
15
0.0
81
90
0.7
03
30
0.1
66
85
0.1
74
05
0.1
80
10
do
i:10
.13
71
/jo
urn
al.p
on
e.0
00
25
49
.t0
02
Genetic Affinity of TB Groups
PLoS ONE | www.plosone.org 5 July 2008 | Volume 3 | Issue 7 | e2549
cultural as well as linguistic diversity coupled with wide variation
in subsistence pattern (ranging from hunting-gathering to settled
agriculture). There were very few sporadic biological studies
among some sub-tribes of Adi [18–19,21–24,32–36] and several of
the isolated sub-tribes are yet to be investigated. This is perhaps
the first ever comprehensive molecular genetic study attempted to
investigate the genetic affinity and diversity among the sub-tribes
of Adi and their relationship with other Tibeto-Burman tribes of
India and the populations of East and Southeast Asia.
The results of the allele frequency variation at 15 STR loci
reveal the underlying microsatellite diversity among the studied
sub-tribes of Adi. The extent of deviation of the studied loci from
HWE, among Adi, differs at the sub-structural level that is
indicative of their unique population structure. For instance, Pasi-
Upper and Panggi deviate from HWE at maximum number of loci
(6 and 4 respectively) whereas Minyong show deviation at only one
locus and Padam shows none. This scenario in case of Pasi-Upper
and Panggi populations is probably due to their small size and
relative isolation in remote Upper Siang hilly regions. In contrast,
least deviation in Minyong (one locus) and absence of deviation in
Padam might be the resultant of their comparative large
population size distributed over plain East Siang regions, in
proximity to the urban area.
The least average heterozygosity value among Panggi (,74%)
might be explained by their small size, strategic location and
preferential marriage practices among clans prohibiting external
gene flow [37]. Strikingly, the maximum average heterozygosity
value (,78%) was observed among Pasi-Upper in spite of their
small population size and relative isolation. The results obtained
from the exact test of population differentiation, for the 15 STR
loci, also show wide diversity among the Adi sub-tribes. The least
significant difference between Adi Padam and other sub-
populations (at almost 7 loci) might be due to the fact that the
other sub-tribes have formed from the larger Padam tribe, one of
the earliest settlers of the region; however this requires further
validation.
According to the folklore tradition of Adi, formation of their
sub-groups was guided by fission-fusion process as a result of inter
tribal war fares in the recent past. The above ethno-historical
information is supported by the low average GST value (2.34%)
among Adi which is an indication of the low degree of genetic
differentiation among the sub-groups. This low degree of
differentiation among the sub-groups is further substantiated by
the clustering pattern obtained from the PCA plot and phylogeny,
where all the sub-tribes form a single close cluster.
A close cluster of Komkar and Panggi sub-tribes, observed in
the PCA plot and the phylogenetic tree, corroborates with their
geographic proximity and also the clustering of Padam with this
group yields further support to the ethno-historical account that
Komkar and Panggi sub-groups were formed from the larger
Padam group [26,29–30]. The separation of Pasi-Upper and Pasi-
Lower in the phylogeny, despite belonging to the same ancestral
group, could be the consequence of the migration of a few close
kin-groups from their ancestral population of Adi Pasi at the
Upper Siang district to the plain areas at the East Siang district. As
a result of isolation, there have been changes in the marriage
Table 3. Genetic differentiation of Adi populations based on AMOVA
Grouping Adi Populations in group Source of VariationPercentage ofVariation Fixation indices
Single group Pasi-Upper, Pasi-Lower, Minyong, Panggi,Komkar, Padam
Among populations 2.38 FST : 0.02379
Among Individuals within populations 11.57
Within Individuals 86.05
Two groups based ongeophysical location
(Pasi-Lower, Padam, Minyong) vs(Pasi-Upper, Komkar, Panggi)
Among groups 20.81 FSC: 0.02885FCT: 20.00806
Among populations within groups 2.91
Among Individuals within populations 11.61
Within Individuals 86.29
Three groups based onethno-history
(Panggi-Komkar) vs (Padam-Minyong)vs (Lpasi-Upasi)
Among groups 20.48 FSC : 0.02743FCT: 20.00481
Among populations within groups 2.76
Among Individuals within populations 11.59
Withim individual 86.13
doi:10.1371/journal.pone.0002549.t003
Table 4. Membership Proportions of each pre-defined six Adipopulations in each of K clusters and logarithm of estimatedprobability of data.
Admixture Model with Correlated Allele Frequencies
Simulations of data for the six Adi population
K = 2 K = 3
Inferred Clusters 1 2 1 2 3
Panggi 0.567 0.463 0.389 0.368 0.243
Komkar 0.613 0.387 0.471 0.283 0.247
Padam 0.559 0.441 0.370 0.262 0.368
Minyong 0.451 0.549 0.288 0.344 0.367
Pasi- Upper 0.550 0.450 0.332 0.281 0.387
Pasi- Lower 0.469 0.531 0.267 0.451 0.282
Ln Prob 225343.3 22523.8
a value 0.7539 0.8944
(Ln Prob) for each assumed Kdoi:10.1371/journal.pone.0002549.t004
Genetic Affinity of TB Groups
PLoS ONE | www.plosone.org 6 July 2008 | Volume 3 | Issue 7 | e2549

patterns leading to higher endogamy among the Adi Pasi-Upper as
against the inter-tribal marriages and low endogamy among the
Adi Pasi-Lower.
AMOVA results also show least genetic differentiation among the
sub-tribes of Adi. The low FSC values (around 2.7%) irrespective of
ethno-historical or geographical grouping of the populations suggest
that the formation of the sub-populations was a recent phenomenon
and that the ethno-history and geography had less influence on the
overall genetic make up of the populations. So in spite of the socio-
cultural, geographic and linguistic diversity, Adi sub-groups remain
genetically less differentiated. However, this observation needs to be
speculated as the increase in the number of samples and the
microsatellite loci might contradict the above observation. The
STRUCTURE analysis also support the findings of AMOVA,
wherein no clear sub-structuring was observed among the Adi sub-
populations (for both K = 2 and K = 3 runs). Overall, the low
average GST values, close clustering in PCA plot and phylogeny, low
FST and FSC values of AMOVA and absence of discrete sub-
structuring among Adi sub-tribes support their recent formation
from a common ancestral group.
The phylogenetic analyses of Adi and other Tibeto-Burman
groups show geography based clustering. Tibeto-Burman tribes of
India are supposed to have arrived in several waves of migrations
during different time periods from eastern, southeastern and
central Asian regions and have localized in various geographical
regions of the subcontinent [1,5,38]. The geophysical nature of the
terrain especially of mountain valleys and rivers in different parts
of sub-Himalayan mountain ranges might have acted as
geographical barriers and posed hurdles for migration preventing
gene flow from other regions and from other populations as well.
This should have resulted in regional genetic differentiation of
populations in their respective geographical regions. This
expectation is validated by the results obtained from the
phylogenetic tree of 22 Tibeto-Burman populations which shows
the formation of clusters based on the geographic proximity of the
populations. For example, the six subpopulations of Adi tribe
inhabiting the Siang river valleys in central Arunachal Pradesh all
cluster together. Similarly the tribes from Mizoram, Manipur,
Sikkim and Ladakh from wide geographical regions form separate
clusters. A deviation observed, from other studies as well, is the
clustering of Garo of West Bengal and Garo of Meghalaya along
with the Manipur tribes, though the Garo tribes are geographically
separate from the tribes of Manipur. This probably suggests their
common genetic affinity with the Manipur tribes and possible
Figure 3. PCA plot, based on DA distance, of the 6 studied Adi sub-groups.doi:10.1371/journal.pone.0002549.g003
Figure 2. Bar plot estimation figures of six Adi sub-tribes, inferred from the STRUCTURE analysis.doi:10.1371/journal.pone.0002549.g002
Genetic Affinity of TB Groups
PLoS ONE | www.plosone.org 7 July 2008 | Volume 3 | Issue 7 | e2549

common migration history of these populations and the Manipur
tribes. This further confirms the preliminary results of our earlier
microsatellite study on Adi Pasi-Lower and other Tibeto-Burman
populations of India [24].
The inclusion of populations from East and South-east Asia in
the phylogenetic analyses reveals the clustering of the Luoba
ethnic group of Tibet with the Adi groups of Arunachal Pradesh.
According to the ethnologue information, Luoba Tibetan (Boga’er
Luoba), categorized under the North-Assam branch of the Tibeto-
Burman sub linguistic family, is also alternatively referred to as
Adi/Abor and is supposed to have been derived from the ‘Tani’
group, the putative ancestral population of Adi. They are located
in southern fringes of central Tibetan region, which is adjacent to
the Upper Siang district of Arunachal Pradesh. The clustering of
Luoba with Adi further supports the ethno-historical accounts of
their putative common origin.
The fifty populations from East and Southeast Asian countries
along with the Adi and other Indian Tibeto-Burman populations
show an interesting pattern of clustering. Some Tibeto-Burman
populations of India (e.g. Adi tribes of Arunachal Pradesh,
populations from Ladakh, Mizoram, Sikkim, and Garo of
Meghalaya) get clustered with the Tibetan populations from Tibet
and China whereas some others (e.g. Drokpa, Balti of Ladakh and
Bhutia of Sikkim) cluster along with Southeast Asian populations.
All the morphologically similar populations, irrespective of their
linguistic affiliation, cluster together possibly with respect to their
geography and ethno-historical account of migration.
Overall, Adi and other Tibeto-Burman speaking populations of
India are regionally well differentiated and exhibit genetic affinity
with the neighboring populations of East/Southeast Asia, based on
their shared ethno-history. However, a clearer picture will possibly
emerge from the analysis of increased number of informative
genetic markers and from the uniparental markers like mitochon-
drial DNA and Y chromosome.
Materials and Methods
PopulationsBlood samples were collected with the permission of the District
Circle Officer, (DCO), East and Upper Siang districts, and
approval of the ‘Gaon Burah’ (village head) of each village of the
studied populations. Prior informed consent were obtained
verbally from 836 healthy voluntary participants belonging to five
sub-tribes [Pasi, Minyong, Padam, Panggi and Komkar] of the Adi
tribe, distributed at different villages in East Siang (low altitude)
and the Upper Siang (high altitude) districts of Arunachal Pradesh,
north east India (see Introduction for further details on Adi tribe).
Among the five populations of Adi, Pasi was sampled from both
East and Upper Siang districts and the two sampled groups were
treated separately as Adi Pasi-Lower and Adi Pasi-Upper. Prior
approval for the study was obtained from the ‘Indian Statistical
Institute Review Committee for Protection of Research Risk to
Humans’. The five sub-tribes of Adi selected for this study, were
analyzed for a set of 15 autosomal STR (microsatellites) markers to
unravel the genetic structure and affinity.
Further, to understand the genetic relationships between Adi
sub-tribes and other neighboring Tibeto-Burman speaking popu-
lations, the generated autosomal STR data of Adi was compared
with the published allele frequency data (for the nine common loci)
of other sixteen Tibeto-Burman speaking populations from north
(Ladakh) and northeast (Mizoram, Manipur, Sikkim, Nagaland
and Meghalaya) India [39–44]. Also the observation that Tibeto-
Burman speakers of the Indian subcontinent share similar physical
features with that of the East and Southeast Asian populations
instigated us to comprehend the genetic status of Tibeto-Burman
speakers of India (including Adi) amidst the linguistically diverse
but physically akin populations of East/Southeast Asia. So we
compared the populations of north and northeast India, based on
the available allele frequency data of nine common STR loci,
along with that of East/Southeast Asia [45–68]. Due to the
unavailability of the genotype data for the studied reference
populations, we had no other option but to restrict our analyses
based on the available allele frequency data. Details of all the
studied populations, their sample size, ethnic and linguistic
affiliations, geographical locations, subsistence patterns and their
literature sources are given in the supplementary Table S1.
DNA isolation and microsatellite typingHigh molecular weight DNA was isolated, from the collected
blood samples of Adi sub-tribes, using the standard phenol/
chloroform method [69]. One to 10 ng of individual DNA
template were amplified for fifteen tetranucleotide repeat loci
(D5S818, FGA, D8S1179, D21S11, D7S820, CSF1PO, D3S1358,
THO1, D13S317, D16S539, D2S1338, D19S433, vWa, TPOX,
Figure 4. PCA plot, based on DA distance, of the 22 Tibeto- Burman populations of India.doi:10.1371/journal.pone.0002549.g004
Genetic Affinity of TB Groups
PLoS ONE | www.plosone.org 8 July 2008 | Volume 3 | Issue 7 | e2549
and D18S51) on Gene-Amp PCR 9700 thermal cycler (Applied
Biosystems, Foster City) by using the AmpFI STRH Identifiler kit
(Applied Biosystems, Foster City) according to manufacturer’s
instructions. While the amplified products of Pasi and Minyong
sub-tribes were separated on a 4% polyacrylamide gel using the
ABI Prism 377 automated DNA sequencer (Applied Biosystems),
the amplified fragments of Panggi, Komkar and Padam sub-tribes
were separated and detected using the ABI PrismH 3100-Avant
Genetic Analyzer (Applied Biosystems, Foster City). The resultant
data was then analyzed using GeneScanTM Analysis Software
(Version 3.7) and the allele designations were done with
GenotyperTM DNA Fragment Analysis Software (Version 3.7)
(Applied Biosystems, Foster City). The laboratory experiments
were carried out following all the quality control measures.
Statistical AnalysesThe allele frequencies of the 15 STR loci were calculated, from the
obtained genotype data of the Adi sub-tribes, using the DNATYPE
software [70]. The observed heterozygosity (h) at each locus and the
probability of homozygosity (P) were estimated to evaluate the extent
and magnitude of genetic diversity among the sub-groups of Adi.
Also, likelihood ratio test (LR) and the exact test (ET) were performed
to test the possible divergence of each locus from the Hardy-
Weinberg Expectations (HWE) [71–72]. Based on the allele
frequencies of the 15 autosomal STR loci of six Adi populations,
the locus-wise genetic diversity (GST) [73-74] and the population-wise
average heterozygosity were estimated to understand the degree of
genetic differentiation and the within-population heterogeneity
respectively. Locus-wise exact test of population differentiation, using
Arlequin 3.01, was performed to analyze the extent of genetic
diversity at the studied loci among the six Adi sub-tribes [75].
To understand the genetic relatedness between the six studied
Adi populations; pair-wise genetic distances using the modified
Cavalli-Sfroza distance (DA) and the standard genetic distance
(DST) measures of Nei et al., [76] were computed using the
software DISPAN [77]. Subsequently, the conventional rectangu-
lar form of two phylogenetic trees: the unweighted pair group
method with arithmetic mean (UPGMA) tree and neighbor-
joining (NJ) tree were constructed based on the DA and DST
distance measures by employing the software DISPAN. To check
for the reliability and consistency of the clustering pattern of the
obtained dendrograms, a total of 1000 and also 10,000 bootstrap
replications were separately performed. In order to further explore
the topology of the obtained phylogenetic trees including the
positions and lengths of the branches, branching patterns as well as
the cluster formation, the radiation form of the trees were also
constructed using the phylogenetic software Mega v3.1 [78]. Since
DA distance measure is the most efficient for obtaining correct
phylogenetic trees under various evolutionary conditions and also
is least affected by small size [79], and because UPGMA and the
NJ phylogenies depict a similar pattern of relationship between the
populations, our discussions are based only on the DA–NJ trees.
To characterize the clustering trends exhibited by these studied
populations, the data dimensionality was reduced by performing a
covariance analysis between factors [Principle Component Anal-
ysis (PCA)]. This analysis was performed based on the DA distance
matrix, of the six Adi sub-groups, using SPSS software (Version
11.0), Chicago, IL, USA. The PCA plot further substantiates the
dendrogram clustering method, and especially when bootstrap
values of the dendrogram are considerably low, the similar
clustering in both the PCA plot and the dendrogram indicates the
consistency of the results obtained.
In order to investigate the genetic variation within and between
the sub-populations of Adi, Analysis of Molecular Variance
(AMOVA) was performed using Arlequin 3.01 [75]. Also, the
significance of the AMOVA values was estimated by use of 10,000
permutations. Three levels of analyses were performed, wherein at
the first level the six Adi sub-groups [Pasi-Upper, Pasi-Lower,
Minyong, Panggi, Komkar and Padam] were considered as a
‘single group’. At the second level, the six Adi populations were
categorized into ‘two groups’ based on their geophysical locations
[Group 1: Padam, Minyong, Pasi-Lower; Group 2: Panggi,
Komkar, Pasi-Upper]. The populations of group 1 (Padam,
Minyong and Pasi-Lower) are located at the lower plains of the
Siang river valley and geographically separate from the popula-
tions of group 2 (Panggi, Komkar, Pasi-Upper) which, on the
contrary, are isolated and settled at the higher mountain ranges.
At the third level of analyses, three groups were constructed based
on the ethno-historical information of the sub-groups [Group 1:
Panggi and Komkar; Group 2: Padam and Minyong; Group 3:
Pasi-Upper and Pasi-Lower].
To obtain a vivid insight into the sub structuring among Adi
sub-tribes, a model-based clustering method was employed, using
genotype data consisting of unlinked markers, as implemented in
Structure 2.1 program [80]. The program was performed by using
100,000 MCMC replications after a 20,000 burn-in length.
Simulations were done with different values of K (from 1 to 5)
under the assumption of admixture model and correlated allele
frequencies among populations. Each run was carried out several
times to ensure consistency of the results.
In addition to the above analyses performed on Adi populations,
we also conducted the comparative analyses of Adi sub-groups
with sixteen Tibeto-Burman speaking populations of north and
northeast India and also with other neighboring East and
Southeast Asian populations that share similar physical features
with that of Adi. Phylogenetic analysis (as described above) as well
as Principle Component Analysis, were performed on these
populations, based on the available allele frequency data, to
understand their underlying genetic affinity and also to obtain a
better clarity of the genetic status of Adi populations with the
Tibeto-Burman speaking regional populations and linguistically
diverse other global populations of East/Southeast Asia.
Supporting Information
Table S1 Sample size, geographical distribution, linguistic
affiliation and the subsistence pattern of the studied populations.
Found at: doi:10.1371/journal.pone.0002549.s001 (0.10 MB
DOC)
Figure S1 DA-NJ phylogenetic trees, based on 15 loci, depicting
the genetic relationship between the Adi sub-groups.
Found at: doi:10.1371/journal.pone.0002549.s002 (0.05 MB TIF)
Figure S2 DA- NJ phylogenies, based on 9 loci, depicting the
genetic relationship between 22 Tibeto-Burman populations of
India.
Found at: doi:10.1371/journal.pone.0002549.s003 (0.09 MB TIF)
Figure S3 DA- NJ phylogenies, based on 9 loci, depicting the
genetic relationship between 50 populations of India and East/
Southeast Asia.
Found at: doi:10.1371/journal.pone.0002549.s004 (0.18 MB TIF)
Acknowledgments
This study is essentially a part of the Indian Statistical Institute project
undertaken by TSV in collaboration with Central Forensic Science
Laboratory (CFSL), Kolkata. TSV thanks Directors of both the Institutes
for logistic support. We acknowledge the Adi tribes for their participation
and cooperation in the study. Our sincere gratitude to the officials of the
Genetic Affinity of TB Groups
PLoS ONE | www.plosone.org 9 July 2008 | Volume 3 | Issue 7 | e2549

Government of Arunachal Pradesh especially of the Siang districts. We
thank Dr. Kashyap, CFSL for providing the laboratory facilities and the
required materials to carry out the experiments and Dr. R Trivedi, CFSL
for technical support. We also thank the research scholars of CFSL for their
help in laboratory experiments. We acknowledge all the reviewers for their
valuable comments which have helped us to improve our manuscript
substantially.
Author Contributions
Conceived and designed the experiments: TV SK. Performed the
experiments: SK. Analyzed the data: SK SM. Wrote the paper: TV SK
SM. Other: Collected blood samples: SM SK TV. Fieldwork: SM SK.
References
1. Dani AH (1960) Prehistory and protohistory of eastern India. Calcutta: Firma
KL Mukhopadhyay.
2. Elwin V (1959) A Philosophy for NEFA. Shillong: North-East Frontier Agency.
3. Bhasin MK, Walter H (2001) Genetics of castes and tribes of India. Delhi:
Kamla-Raj Enterprises.
4. Ruhlen M (1991) A guide to the world’s languages: Volume 1, Classification.
Stanford, California: Stanford University Press.
5. Rapson EJ (1955) People and Languages. In: Rapson EJ, ed. Cambridge historyof India, Vol 1. Delhi: S. Chand. pp 33–57.
6. Malhotra KC, Vasulu TS (1993) Structure of human populations in India. In:Majumder PP, ed. Human population genetics. New York: Plenum. pp
207–233.
7. Majumdar DN (1980) Northeast India: A profile. In: Sharma TC,Majumdar DN, eds. Eastern Himalayas: A study on anthropology and tribalism.
New Delhi: Cosmo.
8. Singh KS (1998) People of India: India’s communities, Vol 1. New Delhi:
Oxford University Press.
9. Das BM, Deka R, Das R (1980) Haemoglobin E in six populations of Assam.
J Indian Anthrop Soc 15: 153–156.
10. Roychoudhury AK (1981) The genetic composition of the people in EasternIndia. J Indian Anthrop Soc 16: 153–170.
11. Walter H, Mukherjee BN, Gilbert K, Lindenberg P, Dannewitz A, et al. (1986)Investigations on the variability of haptoglobin, transferrin and Gc polymor-
phisms in Assam, India. Hum Hered 36: 388–396.
12. Deka R, Reddy AP, Mukherjee BN, Das BM, Banerjee S, et al. (1988)
Haemoglobin E distribution in ten endogamous population groups of Assam,India. Hum Hered 38: 261–266.
13. Roychoudhury AK (1992) Genetic relationships of the populations in eastern
India. Ann Hum Biol 19: 489–501.
14. Kumar V, Basu D, Reddy BM (2004) Genetic heterogeneity in northeastern
India: Reflection of tribe-caste continuum in the genetic structure. Am J HumBiol 16: 334–345.
15. Dutta R, Reddy BM, Chattopadhyay P, Kashyap VK, Sun G, et al. (2002)
Patterns of genetic diversity at the nine forensically approved STR loci in the
Indian populations. Hum Biol 74: 33–49.
16. Chakrabarti CS, Roy M, Sengupta NK, Lalthantluanga R, Majumder PP (2002)Genetic relationships among some tribal groups inhabiting the north eastern,
eastern and sub Himalayan regions of India. Ann Hum Genet 66: 361–368.
17. Roychoudhury AK, Nei M (1997) The emergence and dispersal of Mongoloids.
J Indian Anthropol Soc 32: 1–49.
18. Cordaux R, Saha N, Bentley GR, Aunger R, Sirajuddin SM, et al. (2003)
Mitochondrial DNA analysis reveals diverse histories of tribal populations fromIndia. Eur J Hum Genet 11: 253–264.
19. Cordaux R, Weiss G, Saha N, Stoneking M (2004) The northeast Indian
passageway: a barrier or corridor for human migration? Mol Biol Evol 21:
1525–1533.
20. Kashyap VK, Chattopadhyay P, Dutta R, Vasulu TS (2004) Genetic structureand affinity among eight ethnic populations of eastern India: based on 22
polymorphic DNA loci. Am J Hum Biol 16: 311–327.
21. Maji S, Krithika S, Vasulu TS (2007) Genetic kinship among an isolated Adi
tribe of Arunachal Pradesh: isonymy in the Adi Panggi. Hum Biol 79(3):321–337.
22. Krithika S, Maji S, Vasulu TS (2006) Genetic heterogeneity among three Adi
tribes of Arunachal Pradesh, India. Hum Biol 78(2): 221–227.
23. Krithika S, Maji S, Vasulu TS (2007) Intertribal and temporal allele-frequency
variation at the ABO locus among Tibeto-Burman-speaking Adi subtribes ofArunachal Pradesh, India. Hum Biol 79(3): 355–362.
24. Krithika S, Trivedi R, Kashyap VK, Bharati P, Vasulu TS (2006) Antiquity,geographic contiguity and genetic affinity among Tibeto-Burman populations of
India: a microsatellite study. Ann Hum Biol 33(1): 26–42.
25. Arunachal Pradesh Human Development Report 2005 (2006) Itanagar,
Arunachal Pradesh: Department of Planning, Government of ArunachalPradesh.
26. Tabi T (2006) The Adis. Pasighat, Arunachal Pradesh: Siang Literary Forum.
27. Gordon RG, ed (2005) Ethnologue: Languages of the World, Fifteenth edition.Dallas, Tex.: SIL International.
28. Lego N (2005) History of the Adis of Arunachal Pradesh. Itanagar, Arunachal
Pradesh: Peregrine Graphics.
29. Nath J (2000) Cultural Heritage of Tribal Societies, Vol 1 (The Adis). New
Delhi: Omsons Publications.
30. Roy S (1997) Aspects of Padam Minyong culture. Itanagar, Arunachal Pradesh:The Director of Research.
31. Blackburn S (2003/2004) Memories of Migration: Notes on legends and beads
in Arunachal Pradesh, India. European Bulletin of Himalayan Research 25/26:
15–60.
32. Krithika S, Trivedi R, Kashyap VK, Vasulu TS (2005) Genetic diversity at 15
microsatellite loci among the Adi Pasi population of Adi tribal cluster in
Arunachal Pradesh, India. Leg Med (Tokyo) 7: 306–310.
33. Krithika S, Trivedi R, Kashyap VK, Vasulu TS (2007) Genotype profile for
fifteen tetranucleotide repeat loci in two Tibeto-Burman speaking tribal
populations of Arunachal Pradesh, India. J Forensic Sci 52: 239–241.
34. Krithika S, Trivedi R, Kashyap VK, Vasulu TS (2007) Allele frequency
distribution at 15 autosomal STR loci in Panggi, Komkar and Padam sub tribes
of Adi, a Tibeto-Burman speaking population of Arunachal Pradesh, India. Leg
Med (Tokyo) 9: 210–217.
35. Bhattacharjee PN (1954) Blood group investigations in the Abor Tribe. Bull
Dept Anthropol 3: 51–54.
36. Kumar N (1954) Blood group and secretor frequency among the Galong. Bull
Dept Anthropol 3: 55–64.
37. Koley RN (2007) The Panggis. Itanagar, India: Directorate of Research,
Government of Arunachal Pradesh (In press).
38. Gadgil M, Joshi NV, Shambu Prasad UV, Manoharan S, Suresh Patil (1997)
Peopling of India. In: Balasubramanian D, Appaji Rao N, eds. The Indian
Human Heritage. Hyderabad, India: Universities Press.
39. Chattopadhyay P, Ranjan D, Kashyap VK (2001) Population data for nine
fluorescent based STR loci among four important tribal populations of India.
J Forensic Sci 46: 184–188.
40. Kashyap VK, Guha S, Trived R (2002) Concordance study on 15 STR loci in
three major populations of Himalayan State Sikkim. J Forensic Sci 47(5):
1163–1167.
41. Langstieh BT, Reddy BM, Thangaraj K, Kumar V, Singh L (2004) Genetic
diversity and relationships among the tribes of Meghalaya compared to other
Indian and Continental populations. Hum Biol 76 (4): 569–590.
42. Maity B, Nunga SC, Kashyap VK (2003) Genetic polymorphism revealed by 13
tetrameric and 2 pentameric STR loci in four Mongoloid tribal population.
Forensic Sci Int 132 (3): 216–222.
43. Mastana SS, Murry B, Sachdeva MP, Das K, Young D, et al. (2007) Genetic
variation of 13 STR loci in the four endogamous tribal populations of Eastern
India. Forensic Sci Int 169: 266–273.
44. Trivedi R, Chattopadhyay P, Maity B, Kashyap VK (2002) Genetic
polymorphism at nine microsatellite loci in four high altitude Himalayan desert
human populations. Forensic Sci Int 127 (1–2): 150–155.
45. De Ungria MCA, Roby RK, Tabbada KA, Rao-Coticone S, Tan MMM, et al.
(2005) Allele frequencies of 19 STR loci in a Philippine population generated
using AmpFlSTR multiplex and ALF singleplex systems. Forensic Sci Int 152:
281–284.
46. Dobashi Y, Kido A, Fujitani N, Hara M, Susukida R, et al. (2005) STR data for
the AmpFLSTR Identifiler loci in Bangladeshi and Indonesian populations. Leg
Med 7: 222–226.
47. Gao Y, Zhang Z, Wang Z, Bian S (2005) Genetic data of 15 STR forensic loci in
eastern Chinese population. Forensic Sci Int 154: 78–80.
48. Hu SP, Wu DQ, Xu XH, Liu JW, Li B (2005) Genetic profile of 15 STR loci in
the Min Nan population in Southeast China. Forensic Sci Int 152: 263–
265.
49. Jian T, Xiuling W, Shigemi O (2006) Genetic polymorphisms of 15 STR Loci in
a Japanese population. J Forensic Sci 51: 188–189.
50. Kang L, Li S (2005) Allele frequencies of 15 STR loci of Luoba ethnic group in
Tibet (Southwestern China). Forensic Sci Int 155: 219–221.
51. Kim YL, Hwang JY, Kim YJ, Lee S, Chung NG, et al. (2003) Allele frequencies
of 15 STR loci using AmpF/STR Identifiler kit in a Korean population.
Forensic Sci Int 136: 92–95.
52. Kraaijenbrink T, van Driem GL, Opgenort JRML, Tuladhar NM, de Knijff P
(2007) Allele frequency distribution for 21 autosomal STR loci in Nepal.
Forensic Sci Int 168: 227–231.
53. Kraaijenbrink T, van Driem GL, Gaselo KT, de Knijff P (2007) Allele frequency
distribution for 21 autosomal STR loci in Bhutan. Forensic Sci Int 170: 68–72.
54. Long Li K, Li S (2005) Allele frequencies of 15 STR loci of Luoba ethnic group
in Tibet (Southwestern China). Forensic Sci Int 155: 219–221.
55. Long Li K, Dongya Y, Fengying Y, Kai L, Xi Z (2007) Genetic polymorphisms
of 15 STR loci in two Tibetan populations from Tibet Changdu and Naqu,
China. Forensic Sci Int 169: 239–243.
56. Long Li K, Zhao J, Liu K, Li X (2007) Allele frequencies of 15 STR loci of
Tibetan lived in Tibet Lassa. Forensic Sci Int 168: 236–240.
Genetic Affinity of TB Groups
PLoS ONE | www.plosone.org 10 July 2008 | Volume 3 | Issue 7 | e2549

57. Izuan M, Seah LH, Panneerchelvam S, Nor NM (2005) STR Data for the
PowerPlexH 16 system loci for the Malays, Chinese and Indian groups of theMalaysian population. J Forensic Sci 50: 1225–1228.
58. Ota M, Droma Y, Basnyat B, Katsuyama Y, Asamura H, et al. (2007) Allele
frequencies for 15 STR loci in Tibetan populations from Nepal. Forensic Sci Int169: 234–238.
59. Rerkamnuaychoke B, Rinthachai T, Shotivaranon J, Jomsawat U,Siriboonpiputtana T, et al. (2006) Thai population data on 15 tetrameric
STR loci—D8S1179, D21S11, D7S820, CSF1PO, D3S1358, TH01, D13S317,
D16S539, D2S1338, D19S433, vWA, TPOX, D18S51, D5S818 and FGA.Forensic Sci Int 158: 234–237.
60. Shimada I, Brinkmann B, Tuyen N, Hohoff C (2002) Allele frequency data for16 STR loci in the Vietnamese population. Int J Leg Med 116: 246–48.
61. Tie J, Wang X, Oxida S (2006) Genetic Polymorphisms of 15 STR Loci in aJapanese Population. J Forensic Sci 51: 188–189.
62. Wang CW, Chen DP, Chen CY, Lu SC, Sun CF (2003) STR data for the
AmpFlSTR SGM Plus and Profiler loci from Taiwan. Forensic Sci Int 138:119–122.
63. Wang ZY, Yu RJ, Wang F, Li XS, Jin TB (2005) Genetic polymorphisms of 15STR loci in Han population from Shaanxi (NW China). Forensic Sci Int 147:
89–91.
64. Yan J, Shen C, Li Y, Yu X, Xiong X, et al. (2007) Genetic analysis of 15 STRloci on Chinese Tibetan in Qinghai Province. Forensic Sci Int 169: e3–6.
65. Yang B, Wang G, Liu Y, Yang W (2005) Population data for the AmpF, STRHIdentifilerTM PCR Amplification Kit in China Han in Jilin Province, China.
Forensic Sci Int 151: 293–97.66. Yong RYY, Aw LT, Yap EPH (2004) Allele frequencies of 15 STR loci of three
main ethnic populations in Singapore using an in-house marker panel. Forensic
Sci Int 141: 175–83.67. Zeng ZS, Zheng XD, Zhu YL, Wang ZQ, Xiang ZD, et al. (2007) Population
genetic data of 15 STR loci in Han population of Henan province (centralChina). Leg Med 9: 30–32.
68. Zhang H, Li Y, Jiang J, Zhang J, Wu J, et al. (2007) Analysis of 15 STR loci in
Chinese population from Sichuan in West China. Forensic Sci Int 171: 222–225.
69. Sambrook J, Fritsch EF, Maniatis T (1989) Molecular cloning: A laboratory
manual. In: Ford N, Nolan C, Ferguson MC, eds. Cold Spring Harbor: Cold
Spring Harbor Laboratory Press.
70. Chakraborty R, King A, Stivers D, Zhong Y (1998) DNATYPE [Windows 95/
NT version], CHG. University of Texas, Houston, TX, USA.
71. Chakraborty R, Zhong Y (1994) Statistical power of an exact test of Hardy–
Weinberg proportions of genotype data at a multi-allelic locus. Hum Hered 44:
1–9.
72. Guo SW, Thompson EA (1992) Performing the exact test of Hardy–Weinberg
proportion for multiple alleles. Biometrics 48: 361–72.
73. Nei M (1973) Analysis of gene diversity in subdivided populations. Proc Nat
Acad Sci 70: 3321–3323.
74. Nei M (1987) Molecular evolutionary genetics. New York: Columbia University
Press.
75. Excoffier L, Laval G, Schneider S (2005) Arlequin ver. 3.01: An integrated
software package for population genetics data analysis. Evolutionary Bioinfor-
matics Online 1: 47–50.
76. Nei M, Tajima F, Tateno Y (1983) Accuracy of estimated phylogenetic trees
from molecular data. II. Gene frequency data. J Mol Evol 19: 153–170.
77. Ota T (1993) Dispan: Genetic distance and phylogenetic analysis. Institute of
Molecular Evolutionary Genetics, Pennsylvania State University, Pennsylvania:
University Park.
78. Kumar S, Tamura K, Nei M (2004) MEGA3: Integrated software for Molecular
Evolutionary Genetics Analysis and sequence alignment. Briefings in Bioinfor-
matics 5: 150–163.
79. Takezaki N, Nei M (1996) Genetic distances and reconstruction of phylogenetic
trees from microsatellite data. Genetics 144: 389–399.
80. Pritchard JK, Stephens M, Donnelly P (2000) Inference of population structure
using multilocus genotype data. Genetics 155: 945–959.
Genetic Affinity of TB Groups
PLoS ONE | www.plosone.org 11 July 2008 | Volume 3 | Issue 7 | e2549