
LADDERING: UNVEILING DATA GATHERING AN INTERPRETATION
18
______________________________________________________________________________________ 49 REMark – Revista Brasileira de Marketing e-ISSN: 2177-5184 DOI: 10.5585/remark.v13i4.2726 Data de recebimento: 11/03/2014 Data de Aceite: 02/05/2014 Editor Científico: Otávio Bandeira De Lamônica Freire Avaliação: Double Blind Review pelo SEER/OJS Revisão: Gramatical, normativa e de formatação Brazilian Journal of Marketing - BJM Revista Brasileira de Marketing – ReMark Edição Especial – Vol. 13, n. 4. Setembro/ 2014 IKEDA/ CAMPONAR/ CHAMIE LADDERING: UNVEILING DATA GATHERING AN INTERPRETATION ABSTRACT Laddering is a research technique very appropriate when there is a focus on customer value and personal value understanding. It is an in deep one to one interview with content analysis used to develop knowledge on how the attributes of products can be translated to meaningful associations related to it. It is followed by the means-end chains theory, which is a construction of attributes, that take to consequences there are moved by ones personal value. Although it is opportune in marketing studies when investigating human behavior, there is a limited number of publications using it because the practical application may discourage researches. Thus, this study aims to light the marketing activity to discuss the technique and describe the main stages of the research (interviews, data collection and analysis). The description of this process was taken from a real research using the technique. It was found that even exploratory, the technique provides valuable information to support decisions in Marketing. Keywords: Laddering; Means-end Chains; Customer Value. LADDERING: REVELANDO A COLETA E INTERPRETAÇÃO DOS DADOS RESUMO Laddering é uma técnica de pesquisa bastante apropriada quando o foco está relacionado ao entendimento do valor para o cliente e valores pessoais. Trata-se de uma técnica de entrevista individual e profunda que se ampara na análise de conteúdo para desenvolver conhecimento sobre como os indivíduos traduzem os atributos de produtos em associações significativas em relação a si mesmo seguindo a teoria meios-fim, ou seja, atributos que levam a consequências e que culminam com os valores dos entrevistados. Apesar de oportuna em estudos de marketing, por investigar o comportamento humano, o restrito número de publicações sobre sua aplicação prática podem desestimular os pesquisadores de utilizá-la. Assim, o presente estudo tem por objetivo à luz da atividade de marketing discutir a técnica e descrever as principais etapas da pesquisa (entrevista, coleta de dados e análise). A descrição desse processo foi feita a partir de uma pesquisa real que utilizou a técnica. Constata-se que mesmo exploratória, a pesquisa que se utiliza desta técnica disponibiliza informações valiosas para suporte nas decisões em marketing. Palavras-chaves: Laddering; Cadeia Meios-Fim; Valor para o Cliente. Ana Akemi Ikeda 1 Marcos Cortez Campomar 2 Beatriz Cavalcante Chamie 3 1 Doutora em Administração pela Universidade de São Paulo – USP. Professora da área de Marketing da Faculdade de Economia, Administração e Contabilidade da Universidade de São Paulo – FEA/USP. Brasil. E-mail: [email protected] 2 Doutor em Administração pela Universidade de São Paulo – USP. Professor da área de Marketing da Faculdade de Economia, Administração e Contabilidade da Universidade de São Paulo – FEA/USP. Brasil. E-mail: [email protected] 3 Mestre em Marketing pela Faculdade de Economia, Administração e Contabilidade da Universidade de São Paulo – FEA/USP. Professora da Fundação Instituto de Administração –FIA e da Escola Superior de Propaganda e Marketing – ESPM. Brasil. E-mail: [email protected]
Transcript of LADDERING: UNVEILING DATA GATHERING AN INTERPRETATION

______________________________________________________________________________________
49
REMark – Revista Brasileira de Marketing e-ISSN: 2177-5184
DOI: 10.5585/remark.v13i4.2726 Data de recebimento: 11/03/2014 Data de Aceite: 02/05/2014 Editor Científico: Otávio Bandeira De Lamônica Freire
Avaliação: Double Blind Review pelo SEER/OJS Revisão: Gramatical, normativa e de formatação
Brazilian Journal of Marketing - BJM
Revista Brasileira de Marketing – ReMark Edição Especial – Vol. 13, n. 4. Setembro/ 2014
IKEDA/ CAMPONAR/
CHAMIE
LADDERING: UNVEILING DATA GATHERING AN INTERPRETATION
ABSTRACT
Laddering is a research technique very appropriate when there is a focus on customer value and personal value
understanding. It is an in deep one to one interview with content analysis used to develop knowledge on how the
attributes of products can be translated to meaningful associations related to it. It is followed by the means-end chains
theory, which is a construction of attributes, that take to consequences there are moved by ones personal value.
Although it is opportune in marketing studies when investigating human behavior, there is a limited number of
publications using it because the practical application may discourage researches. Thus, this study aims to light the
marketing activity to discuss the technique and describe the main stages of the research (interviews, data collection
and analysis). The description of this process was taken from a real research using the technique. It was found that
even exploratory, the technique provides valuable information to support decisions in Marketing.
Keywords: Laddering; Means-end Chains; Customer Value.
LADDERING: REVELANDO A COLETA E INTERPRETAÇÃO DOS DADOS
RESUMO
Laddering é uma técnica de pesquisa bastante apropriada quando o foco está relacionado ao entendimento do valor
para o cliente e valores pessoais. Trata-se de uma técnica de entrevista individual e profunda que se ampara na análise
de conteúdo para desenvolver conhecimento sobre como os indivíduos traduzem os atributos de produtos em
associações significativas em relação a si mesmo seguindo a teoria meios-fim, ou seja, atributos que levam a
consequências e que culminam com os valores dos entrevistados. Apesar de oportuna em estudos de marketing, por
investigar o comportamento humano, o restrito número de publicações sobre sua aplicação prática podem desestimular
os pesquisadores de utilizá-la. Assim, o presente estudo tem por objetivo à luz da atividade de marketing discutir a
técnica e descrever as principais etapas da pesquisa (entrevista, coleta de dados e análise). A descrição desse processo
foi feita a partir de uma pesquisa real que utilizou a técnica. Constata-se que mesmo exploratória, a pesquisa que se
utiliza desta técnica disponibiliza informações valiosas para suporte nas decisões em marketing.
Palavras-chaves: Laddering; Cadeia Meios-Fim; Valor para o Cliente.
Ana Akemi Ikeda1
Marcos Cortez Campomar2
Beatriz Cavalcante Chamie3
1 Doutora em Administração pela Universidade de São Paulo – USP. Professora da área de Marketing da Faculdade
de Economia, Administração e Contabilidade da Universidade de São Paulo – FEA/USP. Brasil. E-mail:
[email protected] 2 Doutor em Administração pela Universidade de São Paulo – USP. Professor da área de Marketing da Faculdade de
Economia, Administração e Contabilidade da Universidade de São Paulo – FEA/USP. Brasil. E-mail:
[email protected] 3 Mestre em Marketing pela Faculdade de Economia, Administração e Contabilidade da Universidade de São Paulo
– FEA/USP. Professora da Fundação Instituto de Administração –FIA e da Escola Superior de Propaganda e
Marketing – ESPM. Brasil. E-mail: [email protected]

Laddering: Unveiling Data Gathering an Interpretation
_____________________________________________________________________________________
_______________________________________________________________________________
50 IKEDA/ CAMPONAR/
CHAMIE
Brazilian Journal of Marketing - BJM Revista Brasileira de Marketing – ReMark
Edição Especial – Vol. 13, n. 4. Setembro/ 2014
1 INTRODUCTION
Laddering is a gerund derived from the verb
‘to ladder’, which means climbing, since ladder is a
type of non-fixed stairs. This term is also used in
finance with a specific meaning, but in marketing it is
a fairly appropriate technique to be used in academic
or market research studies, since it addresses aspects
of consumer behavior. The laddering technique allows
an evaluation through simple concrete means
(attributes) evolving to concepts that can be extremely
abstract and difficult to be evaluated. It can be used for
the assessment of personal values that consumers
associate with an object that is being analyzed, which
would not be easily achieved through other techniques
of data collection and analysis of exploratory nature,
even in those of qualitative approach.
2 MAIN TOPICS AND STUDIES RELATED TO
THE LADDERING TECHNIQUE
This technique heavily relies on the concepts
of the means-end chain, and therefore this study begins
with the presentation of its theoretical framework
followed by an explanation of the laddering technique.
This theoretical framework is concluded with a list of
the main publications found and used in this study.
a) Means-end chain theory. The pioneering
publication addressing the means-end chains (and
laddering) was written by Gutman, in 1982. Later, in
1988, Reynolds and Gutman introduced a more
structured and detailed approach especially addressing
the laddering theory, its method, analysis and
interpretation, thus significantly contributing to a
further analysis of the technique. Gutman (1982)
describes that the means-end chain is a model that
seeks to explain how the means facilitate the
achievement of the final states desired. The means are
objects (products) or activities in which people engage
and ends are the states of happiness, security and
accomplishment. He argues that the means-end chain
model is based on two fundamental principles: (i) the
personal values defined as final desired states and that
play a dominant role in directing individual’s choice;
and (ii) people deal with the huge diversity of products
that are potential to meet their personal values
(motivators), grouping them into sets or classes in
order to reduce the complexity of choice. The central
aspect of the means-end chain model is that the
consumer chooses the actions that produce the desired
effects seeking to minimize undesired consequences.
According to Gengler and Reynolds (1995),
consumers translate the product attributes into the
production of benefits (or consequences), and the
benefits are ultimately translated to the consumer in a
direction oriented to personal values. For them, the
means-end chain theory postulates the way by which
these physical attributes of the products are related to
the personal values of the individuals and define how
products gain personal relevance and meaning.
Following the same logic, Botschen et al. (1999)
complement that the chain begins with the components
product, service or behavior (attributes) and
establishes a sequence of links with the concept of self
(personal values) through the consequences perceived
or benefits produced by certain attributes of the
product, service or behavior. The means-end chain
forms the so-called A-C-V (attributes, consequences
and personal values), whose basic premises are: (i)
personal values are key elements that influence
consumers; (ii) consumers are able to create categories
based on the roles of the products in their satisfaction
and personal values; (iii) all actions have
consequences, which can be desired and undesired
consequences; and (iv) consumers associate
consequences to actions (GUTMAN, 1982).
The means-end chain theory allows going beyond the
understanding of the rational properties by reaching an
understanding of its meanings in the lives of clients.
As people have different values, they will have
different means-end chains, and therefore, through this
structure, it is possible to understand the decision
making process of the consumption/purchase structure
analyzed (VALETTE-FLORENCE; RAPACCHI,
1991). In the composition of the chains, there are
different levels of abstraction, as shown in Illustration
1, which form a kind of continuum, from the most
concrete to the most abstract. These different levels are
explained in the following topics. It is worth noting
that all levels of abstraction are not always present
within the constructed chains.

Laddering: Unveiling Data Gathering an Interpretation
_______________________________________________________________________________
_____________________________________________________________________________
51
Brazilian Journal of Marketing - BJM
Revista Brasileira de Marketing – ReMark Edição Especial – Vol. 13, n.4. Setembro/ 2014
IKEDA/ CAMPONAR/ CHAMIE
Illustration 1 – Levels of abstraction of the means-end chain
Source: Adapted from VALETTE-FLORENCE; RAPACHI, 1991, p. 31.
The attributes (A) are the characteristics of
the products, services or behavior that may be
preferred or sought after by consumers, these attributes
can have two levels: concrete and abstract attributes,
for example, price and good quality, respectively
(BOTSCHEN et al. 1999). Botschen et al. (1999)
assert that people expect consequences and benefits
from a particular product, service or behavior.
According to the authors, from the customer’s
perspective, it is not the attributes of the product that
counts, but the solution of the problem (the recurring
benefit) derived from a certain combination of
attributes. According to Gutman (1982), consumers
make choices and thus learn what attributes will
produce the desired consequences. For the author,
consumers seek consequences and the situations of
consumption provide the opportunity to achieve them.
Thus, the consequences (C) are defined as: “[...] any
physiological or psychological result directly or
indirectly from the consumer (first the behavior and
then the consequences) that may be desirable or
undesirable for the consumer (GUTMAN, 1982 p.
61).” The consequences can be direct or indirect, and
Gutman (1982) exemplifies this difference describing
that, by buying a dress, there is a direct consequence
that makes the consumer feel better, and for feeling
better, people react more favorably to that individual
(an indirect consequence). The consequences/benefits
can be classified into functional and psychological.
Functional consequences directly influence the act of
consuming/buying, while the psychological
consequences are produced through the functional
consequences, such as when using a product can
produce a sophisticated image or status (VALETTE-
FLORENCE; RAPACHI, 1991). Personal values (V),
on the other hand, are defined by Rokeach (1973) as
multifaceted and work as a guide in a variety of ways.
The author describes them as “[...] an enduring belief
that a specific mode of conduct or end-state of
existence is personally or socially preferable to an
opposite or converse mode of conduct or end-state of
existence” (p. 5). And that “values are standards that
tell us how to rationalize in the psychoanalytic sense,
beliefs, attitudes and actions that would otherwise be
personally and socially unacceptable so that it will end
with personal feelings of morality and competence,
both indispensable ingredients for the maintenance
and enhancement of self-esteem “(p. 13). He identified
36 personal values, classifying them into two groups:
Instrumental personal value is related to
behavior (that is, being honest or open-
minded) and is indispensable to achieve the
final states. It is the motivation, because they
are the idealized behaviors, tools, to achieve
the desired end states.
Terminal personal value is related to the end
states of existence (that is, happiness,
security, and accomplishment). Terminal
personal values are enduring beliefs, specific
modes of conduct or end states of existence,
the final goals, which, if approved over time,
lead to desirable end states, such as a
comfortable life, a sense of accomplishment,
a world of peace, or racial equality. He
concludes that the instrumental and terminal
values are related, but organized in a separate
manner. Gutman (1982) adds that in the
marketing perspective, it is not the end state,
but its relationship with the ability to
influence the consumer towards the end state
that leads to a significant role to the means-
end chain model.
b) Laddering Technique. The laddering technique
involves an in-depth discussion focused on the
connections between personal values and the process
of choice (GUTMAN, 1991). The primary meaning of
ladder is to move from the lowest level
(surface/concrete/tangible/objective) to the highest
level (depth/abstract/conceptual/subjective). The
technique is mainly associated with studies on
consumer values, because it enables the discovery of
forming constructs and motivators. The laddering
technique was inspired by the study of Kelly (1955)
who, in the field of psychotherapy, developed the so-
called “Repertory Grid” to identify the ways by which
people construct meaning for the objects and interpret
their experience. Gutman (1982), Reynolds and
Gutman (1988), who are the main authors of the
technique, quote Kelly regarding the use of different
levels of distinction for interpreting the meaning of
something.

Laddering: Unveiling Data Gathering an Interpretation
_____________________________________________________________________________________
_______________________________________________________________________________
52 IKEDA/ CAMPONAR/
CHAMIE
Brazilian Journal of Marketing - BJM Revista Brasileira de Marketing – ReMark
Edição Especial – Vol. 13, n. 4. Setembro/ 2014
Laddering involves a tailored interviewing
format using primarily a series of directed
questions, characterized by the question
“Why is it important for you?”, with the
express purpose of determining the set of
links between the main elements of
perception across the range of attributes (A),
consequences (C) and personal values (V)
(REYNOLDS & GUTMAN, 1988, p. 12).
According to Wansink (2000), in the survey,
the respondents initially answer why they prefer a
certain product or service usually being something
related to the attribute. Thus, these attributes are
related to the personal consequences for them and then
the consequences are related to the personal values.
Each attribute, consequence and personal value is
found through a question based on the previous
answer. According to the means-end theory, it is
possible to establish a sequential connection in the
hierarchy of value, forming the chain called ladder A
(attribute) – C (consequence) –V (value). The same
author concludes that it is possible to climb the steps
to reach the actual reasons, or personal values, and that
many consequences can be revealed by the
respondents until the value is unveiled. Each A-C-V
sequence forms a means-end chain or a ladder. At the
end, there is a several sequences, resulting from the
interviews with respondents.
According to Reynolds and Gutman (1988), the
elements that make up the means-end chain form
elements presented sequentially obtained from the
respondents as a function of the technical capacity
derived from the laddering, causing the respondent to
critically think about the connections between the
product attributes and, in this case, their personal
motivations; thus allowing the construction of a
summary table representing the number of
connections between the elements. In this summary
table, the dominant connections can be graphically
represented in a tree diagram, called Hierarchical
Value Map (HVM). The authors state that this type of
cognitive map is structural in nature and represents the
relationships or associations between different levels
of abstraction. The HVM thus summarizes all
interviews held or “ways of thinking” with the
dominant representations about the subject studied.
Table 1- Articles that address laddering and means-end chain
Year Title Authors
1975 Using the benefit chain for improved strategy formulation Young, S.; Feigin, B.
1981 A means-end model for facilitating analyses of product markets based on consumer
judgment
Gutman, J.
1982 Means-end chain model based on consumer categorization processes Gutman, J.
1988 Laddering theory, method, analysis, and interpretation Reynolds, T.J.; Gutman, J.
1991 Exploring the nature of linkages between consequences and values Gutman, J.
1991 Means-end chain: connecting products with self
1991 Improvements in means-end chain analysis-using graph theory and correspondence
analysis
Valette-Florence. P;
Rapacchi, B..
1995 Determination of the dominant means-end chains A constrained
clustering approach
Aififeiüe, J.M.; Florence,
P.V.
1995 Measuring subjective meaning structures by the laddering method: Theoretical
considerations and methodological problems
Grunert, K.G.; Grunert, S.C.
1995 Applying laddering data to communications: Strategy and adverti3ng practice Reynolds, T.J.; Whitlaik,
D.B.
1995 Consumer understanding and advertising strategy: analysis and strategic
translation of laddering data.
Gengler, C. E.; Reynolds, T.
1995 Measuring subjective meaning structures by the laddering method: Theoretical
considerations and methodological problems
Grunert,K. G.; Grunert S.C.
1998 A causal Analysis of means-end hierarchies in a cross-cultural context:
methodological refinements
Valette-Florence, P.
1999 Using means-end Structures for benefit segmentation: an application to services Botschen. G.: Thelen, E. M:
Pieters, R..
2000 New techniques to generate key marketing insights Wansink,B.
2001 Laddering in the practice of marketing research: barriers and solutions Veludo-de-Oliveira, T.M;
Campomar, M.C.; Ikeda, A.
A.
2003 Conhecendo o "valor do cliente" de um jomal on-line Leão, A. L. M. S.; Mello,
S.C.B..
2004 Usos e limitações do método laddering Veludo-de-Oliveira, T.M;
Ikeda, A.A.

Laddering: Unveiling Data Gathering an Interpretation
_______________________________________________________________________________
_____________________________________________________________________________
53
Brazilian Journal of Marketing - BJM
Revista Brasileira de Marketing – ReMark Edição Especial – Vol. 13, n.4. Setembro/ 2014
IKEDA/ CAMPONAR/ CHAMIE
2005 Explaining choice option attractiveness by belief elicited by the laddering method Giunert, K.G.; Bech-Larsen.
T.
2006 Discussing laddering application by the means-end chain theory Veludo-de-Oliveira, T.M;
Campomar, M.C.; Ikeda, A.
A.
2007 On the hierarchical nature of means-end relationships in laddering data Rekon, J. V.; Wierenga, B.
2007 The mean-end approach to understanding customer values of a on-line newspaper Leão, A. L. M. S.; Mello,
S.C.B..
2008 Laddering em pesquisas de marketing. Veludo-de-Oliveira, T.M;
Ikeda, A.A.
Source: developed by the authors
Table 1 shows a list of relevant studies on
laddering and means-end chain for those who wish to
know the previous studies and detailed aspects of this
technique. There are two ways to use laddering, the
traditional way, also called soft laddering, and the so-
called hard laddering. Soft laddering is the
conventional technique, with a semi-structured
individual interview, where the flow of the speech of
the respondent is more free and with little intervention
from the interviewer providing greater freedom of
expression, it is usually recorded and requires a more
specialized knowledge of the researcher, who will
implement it ( KACIAK, CULLEN, 2009). On the
other hand, hard laddering forces the respondent to
produce the ladders in a predetermined sequence using
a software, such as LADDERMAP. There is a
structuring of information to collect data that requires
a lower expertise of the researcher, as it uses more
structured interviews and pre-established procedures
in data collection. The studies of Kaciak, Cullen and
Sagan (2010) and Phillips and Reynolds (2009)
explore this aspect. In this study, the approach is the
traditional method, soft technique, as it is believed that
the manual technique brings greater benefit in learning
and absorption of information by the researchers.
3 A FIELD RESEARCH USING LADDERING
Below it was described the use and
application of the laddering technique detailing the
main stages of a field research conducted aiming to
facilitate the understanding of the process as a whole.
In this research the main question was: “which
personal values underlie the experience of buying
toys?”. The research depicted in this study was carried
out with 15 mothers according to the qualification of
the selected profile. The duration of the interviews
ranged from 55 to 110 minutes (74 minutes on
average). The steps to be presented are: (i) interviews
and data collection, (ii) analysis and interpretation of
data.
(i) Interviews and data collection. According to
Reynolds and Gutman (1988), it is necessary to
explain to the respondent that there are no right or
wrong answers and that the purpose of the interview is
simply to understand the ways how the respondents
consider a particular set of products or services. The
interviewer is a facilitator/conductor who continually
makes the question “why is this important to you?”
(REYNOLDS; GUTMAN;1988). The constant
questions “why?” are one of the outstanding features
of laddering, as they motivate deeper reflections about
the real motivations, and help entering more subjective
questions. Initially, the respondent is asked about what
kinds of features would be useful to describe or
distinguish different brands or products to then obtain
the key attributes. In the case of toy stores, the stimuli
were made aiming to evoke the situational context in
question. Reynolds and Gutman (1988) recommend
three formulas to stimulate this step, working mainly
in the distinct characteristics between different offers,
which are: (i) triadic sorting: three different options (of
brands, for example) are presented and the respondent
is asked to indicate differences and similarities of two
in relation to the third; (ii) differences of preference:
an order of preference to then mention the reasons and
(iii) differences of occasion: the customer is inserted
in a context (of consumption, for example) where they
describe the characteristics relating to this context.
The researcher's knowledge and preparation
for the application of the technique is paramount to
obtain effective results. To assist in this process,
Wansink (2000) describes good practices to be used by
the researcher during an interview using the technique
and one of the main characteristics of the technique is
to avoid the answer yes and no and, through the
“whys?” reveal the reasons which are often latent. It
was noted that the use of the technique, for exploring
deeper and also subjective factors, might motivate an
awareness on the part of respondents, who expose their
beliefs and deep motivations.
The research protocol assisted in conducting
the interviews, which were recorded so that there was
no loss of content. In addition to the recordings, there
was the use of annotations, for the partial construction
of some ladders evidenced during the interviews.
There was a greater ease in the creation of the ladders
when they were built soon after the interview. The step
of analysis proposed in the technique is sensitive
because the researcher must interpret in a neutral and

Laddering: Unveiling Data Gathering an Interpretation
_____________________________________________________________________________________
_______________________________________________________________________________
54 IKEDA/ CAMPONAR/
CHAMIE
Brazilian Journal of Marketing - BJM Revista Brasileira de Marketing – ReMark
Edição Especial – Vol. 13, n. 4. Setembro/ 2014
faithful manner the recording, than can then be added
to the recordings of the facial expressions and body
movements, once it is necessary to adapt the words of
the respondents to the constructs identified within the
coding of the content without losing the essence of the
meaning. In this application, there was a choise to use
the mapping of concrete and abstract attributes,
functional and psychological consequences and
instrumental and terminal personal values.
Out of the total interviews, 155 ladders were
built. Each interview generated on average 10 ladders
(minimum of 8 and maximum of 14). In general, the
ladders emerged naturally during the interviews. The
difficulty emerged with the profiles of people who
were more objective, rational and with more reserved
personalities, as they would “hide” the personal values
that motivated them. Through the constant questions
“why?”, many shoppers expressed doubts, and for this
reason, previous explanations were given to avoid
simple answers and explain that the constant questions
“why?” were part of the methodology that was being
applied. In addition, at this moment there was no
concern to create linear chains, as some ladders would
stop evolving at a certain point, with the possibility of
recovering them later, with a different situational
stimulus that could or could not emerge naturally. That
is, the construction of a single ladder emerged in
different moments of the interview. The identification
of the personal values was guided by the definitions
made by Rokeach (1973).
(ii) Procedure for the analysis and interpretation of
data. To assist this step, a partial transcript of the
interviews was made, to then proceed with the content
analysis for the preparation of the coding of the factors
that relate to the research subject, and finally, classify
the attributes (A), consequences (C) and personal
values (V) identified in the interviews and their
dominant perceptions. This stage included the
following steps: (a) content analysis, (b) construction
of the implications matrix, (c) construction of the
hierarchical value map and (d) determining the
orientations of dominant perceptions and (e)
interpretation of results.
(ii.a) Content Analysis. The material obtained in the
interviews from the transcripts of the tapes with the
interviews was submitted to content analysis.
Reynolds and Gutman (1988) state that it is necessary
to register everything in order to develop a general
sense of the types of elements followed by a set of
keywords selected and coded as a synthesis that
reflects everything that was mentioned. According to
them, this is firstly done by classifying all the answers
according to the characteristics of A-C-V to then turn
them into individual summary codes. The point out
that the purpose of this analysis is to find the
fundamental meanings of the object of study, noting
that the focus is the relationship between the elements.
The result of this step is a set of elements (keywords)
listed in an A-C-V sequence, which expresses the
reasoning of the respondents. It is necessary to select
the sections that have a greater relationship with the
object of research and stand out due to their meaning.
The content analysis was performed through the
coding of the elements identified in the value
dimensions.
The steps were:
1. Transcript of the interview.
2. Detailed reading of the transcript
highlighting the important aspects to help in
the construction of the elements forming the
chains.
3. Preliminary construction of the chains during
the readings, followed by the structured
construction of the chains with references to
the attributes, consequences and personal
values coded and named (performed
individually, by interview).
4. At each new interview analyzed, there is a
mapping of the need for opening new
elements within the coding and
nomenclatures already identified in ladders
built through the previous analyses.
5. Detailed classification of each element based
on the context identified, that is, built to
represent the element in all ladders on which
it was present.
6. Constant review of the names of the
elements, evaluation of overlapping of
meanings and renaming when necessary.
Retroactive revision, where necessary,
considering the ladders already built.
7. Closing of elements, meanings, and
individual ladders.
The construction of ladders is a very long
process, due to the need for a constant revision
including ladders already built, for the analysis of
coherence and consistency between them. With certain
frequency, elements are created with different names,
but with similar meanings and that needed to be
integrated subsequently. During the construction of the
ladders, a certain degree of generalization of the
nomenclature was required, generating, in some cases,
a loss of essence, and for this reason it was noted the
importance of building an in-depth descriptive content
of analysis of interviews. That is, including a
descriptive part (in addition to the chains) adding to
the interpretation of the means-end chains obtained
through the study. The reading and rereading of the
contents of the interview helped the identification of
relevant parts for the construction of ladders, and from
these it was extracted the essence for building the
elements. It was sought to keep the focus on the central

Laddering: Unveiling Data Gathering an Interpretation
_______________________________________________________________________________
_____________________________________________________________________________
55
Brazilian Journal of Marketing - BJM
Revista Brasileira de Marketing – ReMark Edição Especial – Vol. 13, n.4. Setembro/ 2014
IKEDA/ CAMPONAR/ CHAMIE
meanings of the elements, which appeared to be
representative, so some elements were grouped, as
they appeared to be less relevant for the analysis of
results. Leão and Mello (2003) mention that it is
possible to identify how the respondents expressed,
even with different terms, the same opinion about
something, to allow grouping the quotes in the most
representative elements of meaning. This grouping is
also described as a good practice by Reynolds and
Gutman (1988). There are twists and turns during the
construction of the ladders, as there may be, for
example, the need to breakdown an element that
appeared to be relevant throughout the interviews. The
analyses are made and only in the last interview, it is
possible to find the final elements of each respondent,
because even finalized the elements mapped at the
beginning may change. It is a flexible and time-
consuming process, where one seeks to avoid giving
different names for the same things and grouping in a
coherent manner the major topics identified in the
survey. There is also a constant questioning about the
entry of new elements. If the same researcher
interviews and conducts the data analysis and
interpretation in full, it has the advantage of having a
holistic view of all the information gathered. The next
step is to code these elements, based on the allocation
of numbers arranged in ascending order and that refer
to attributes, consequences and personal values. The
final result is consolidated in a summary table
containing the main elements derived from the
interviews, classified and coded within the value
hierarchy. The coding is used to facilitate the
placement of each element in a ladder, thus producing
a matrix with the ladders of each respondent (thus
represented by codes). The standard technique uses a
consecutive numerical coding, starting in attributes
and ending with personal values. The coding can only
be finalized (and final) after the completion of all
analyses through the confirmation that there is no
additional element in the formation of ladders. This
coding is laborious because when an attribute is
inserted, the numbering of the elements that form the
consequences or personal values also have to be
changed, hindering the use of codes from the
beginning of the formation of ladders. Therefore, in
the research described it was decided to adapt the
proposal of Reynolds and Gutman (1988), putting
ahead of the number a letter corresponding to the
group to which the element belongs. The letter
corresponds to the attributes, consequences and
personal values; and the number corresponds to the
code present in each one of them; for example:
Concrete attributes: A (A1, A2, A3, A4,
A5...).
Abstract attributes: B (B1, B2, B3, B4, B5...).
Functional consequences: C (C1, C2, C3, C4,
C5...).
Psychological consequences: D (D1, D2, D3,
D4, D5...).
Instrumental personal values: E (E1, E2, E3,
E4, E5...).
Terminal personal values: F (F1, F2, F3, F4,
F5...).
The result of the content analysis, expressed
in a summarized manner in Table 2, allowed the
identification of 52 elements (code A1 to F6), as well
as the classification, according to the means-end chain
model.

Laddering: Unveiling Data Gathering an Interpretation
_____________________________________________________________________________________
_______________________________________________________________________________
56 IKEDA/ CAMPONAR/
CHAMIE
Brazilian Journal of Marketing - BJM Revista Brasileira de Marketing – ReMark
Edição Especial – Vol. 13, n. 4. Setembro/ 2014
Table 2 – Representation of the summary of codes
Code
Element name
Times
it appears
Concrete Attributes
A1 Assortment 71
A2 Low price toys 9
A3 Brand/theme/type of toy 7
A4 Area for children 9
A5 Permission to touch/grab
toys
11
A6 Building toys/games 10
A7 Large store 9
A8 Store environment 9
A9 Store location 5
A10 Display 5
A11 Colorfulness 5
A12 Information 11
A13 Price 9
A14 Educational toys and books 14
A15 Toys for outdoor area 6
A16 Store staff 14
Abstract Attributes
B1 Store Atmosphere 15
B2 Options 27
B3 Known references 15
B4 Entertainment 24
B5 Children’s world 13
B6 Quality/benefits 30
B7 Usefulness 30
B8 Novelty 13
Functional consequences
C1 Requires little time and
money
24
C2 Tranquility 18
C3 Raises interest in the child 20
C4 Development of cognitive
and behavioral skills
26
C5 Finding different items 18
C6 Magical, playful stimuli 32
C7 Safety in choice 16
C8 Leisure program 13
Psychological consequences
D1 Freedom of choice 23
D2 Stimuli for education 34
D3 Effective expenditure /
valuation of money
23
D4 Leads to the fantasy world 30
D5 Feel good 29
D6 Small treat 11
D7 Brings childhood/nostalgic
memories
17
Instrumental Personal Values
E1 Loving 11
E2 Imaginative 34
E3 Self-control 19
E4 Welfare 14
E5 Helpful 50
E6 Independent 13
E7 Joyful, glad 14
Terminal Personal Values
F1 Prosperous life 20

Laddering: Unveiling Data Gathering an Interpretation
_______________________________________________________________________________
_____________________________________________________________________________
57
Brazilian Journal of Marketing - BJM
Revista Brasileira de Marketing – ReMark Edição Especial – Vol. 13, n.4. Setembro/ 2014
IKEDA/ CAMPONAR/ CHAMIE
F2 Beautiful world 15
F3 Sense of accomplishment 49
F4 Pleasure / Happiness 34
F5 Freedom 9
F6 Exciting/active life 28
Source: Representation proposed by the authors.
As important as the identification of the
elements that make up the dimensions of customer
value in the shopping experience is the description of
the meanings attributed to them. The most tangible
level of the elements was classified as concrete
attribute, that is, an objective characteristic; as for the
abstract attribute, the most intangible elements. The
consequences, or benefits, were also classified into
two levels, the first being the functional consequences,
that is, the most objective benefits; and the second, the
psychological consequences, which are more indirect
and address the influence of this consequence in the
emotional state or feeling of the respondents. The
personal values were separated into instrumental and
terminal, as proposed by Rokeach (1973), where the
instrumental values are taken as the means to achieve
the final states, defined as terminal personal values.
The method used for the significance attributed to the
elements is illustrated in Table 3.
Table 3 - Example of description of the elements of the value dimensions
CODE
ELEMENT DESCRIPTION
A4
Area for children: Physical area available at the premises of the store where the child can have contact with
stimuli of interaction purposefully positioned in the place, such as: differentiated decoration, tables with games,
slide, toys open for handling, etc.
B1 Store Atmosphere: Area of the store and its multiple sensory stimuli: sound, sight, smell and touch.
B2 Options: Relates to the quantity, volume. Possibility to purchase, select products and services
provided/offered/sold in the store.
C2
Tranquility: Allowing a period of peace, serenity and introspection without the interruption from others,
especially children. There are also cases where the benefit is to have the child under emotional control, without
crying. There are mothers who seek this tranquility for longer periods and for this they use toys as a means of
reward for good behavior. It also relates to the quality of the route in the store (accumulation of people, amplitude
of the aisles, no boxes on the way, etc.) and for the store (distance, traffic, access and parking).
C3
Raises interest in the child: Degree of attraction exerted on the child by means of objects and scenarios that
delight children, draw attention and create desire. Developing a reflection of the adult or the child about what the
child likes.
D1
Freedom of choice: Able to choose individually whatever is deemed interesting to meet their needs or desires.
The feeling of freedom of choice of shoppers may arise when they exercise their freedom of choice or when the
child does so.
D2 Stimuli for education: Provides additional support to the overall learning process of the child who will receive
the toy, thereby assisting in the construction and development of their future.
E2
Imaginative: Bold, creative. Possibility of traveling in the internal creative world, present in the mind. It
awakens the imagination, fantasy, creation of mental images, through the creation of stories, contexts, memories
and even the construction of physical objects.
F1 Prosperous life: Belief that success in life, of a comfortable life, especially with regard to the financial aspect.
Feeling that “now I can.”
Source: Representation proposed by the authors.
Based on that, the individual ladders were
built, so that they could be consolidated for a joint
analysis. The ladders were first created firstly based on
the nomenclature adopted to then be transcribed to the
coding language, thus facilitating the construction of
analysis and counting. Table 4 shows the model of
ladders built based on the analysis of a respondent, that
is, it is an individual response coded. The respondent
taken as example generated 10 ladders, and many of
them included code A1 as their main concrete attribute
with respect to the assortment offered in the store. The
A1 was either alone as a concrete attribute, or
associated with another attribute, as well as the A14
(educational toys and books), A6 (building

Laddering: Unveiling Data Gathering an Interpretation
_____________________________________________________________________________________
_______________________________________________________________________________
58 IKEDA/ CAMPONAR/
CHAMIE
Brazilian Journal of Marketing - BJM Revista Brasileira de Marketing – ReMark
Edição Especial – Vol. 13, n. 4. Setembro/ 2014
toys/games) and A3 (brand/theme/type of toy), and
these were related to different components B, C, D, E
or F, depending on the context in which the
consequences (benefits) were being addressed, these
consequences were either functional or psychological.
As a result of the content analysis and identification of
the elements, the analyses were developed for each
respondent. The creation of coded ladders enabled the
analysis that integrates the different results obtained.
Table 4- Model of the ladder creation arising from one interview
Source: Representation proposed by the authors.
(ii.b) Construction of the implication matrix. After
the construction of the individual ladders, codes and
construction of the content of elements it is possible to
build the analysis integrating the different results,
where there is the development of the implication
matrix.
According to Reynolds and Gutman (1988),
this step involves the construction of a matrix which
shows the number of times that each element takes to
another element. It is qualified as a square matrix with
a size that reflects the number between 30 and 50
elements establishing among themselves direct and
indirect relations (when there are other elements
between them). The number of relationships between
the elements is presented in the matrix in a fractional
manner, where the direct relationships (XX) appear to
the left of the point and indirect relationships (YY) to
the right of the point.
The implication matrix was sought to
understand how strong or present are each of the
elements, and what are the most present direct or
indirect connections between them. That is, there is a
construction of integrated and representative ladders,
called chains. From that point, the word ladder was
used referring to the nomenclature of the individual
sequences of the respondents, and the nomenclature
chains to the sequences resulting from the joint
analysis of the ladders through the implication matrix.
The implications matrix shows the number of times
that each element takes to another element, and is
qualified as a square matrix establishing direct
relationships between them (when directly related,
represented by XX) and indirect relationships (when
there are elements between them, for example, the
connection of concrete attributes with functional
consequences, where there is the abstract attribute
between them, represented by YY). If it is taken the
example Table 4, in ladder 1, there is an element A7
directly relating with the element B2 (XX) and the
same element A7 indirectly relating with the element
C5 (YY). During the construction, the elements were
placed in the matrix in rows and columns to allow the
identification of the relationships. In the rows, there is
the element being analyzed and in the column is the
number of times it related with each one of the other
elements. Since, in this example, the concrete
attributes do not relate with others, they do not appear
in the columns, except for A1 (assortment), which in
this case related with other attributes. To facilitate the
construction of the joint implication matrix, it relied
on the construction of individual matrices, separated
into direct and indirect, to then sum add and join the
direct and indirect connections through the semicolon.
The matrix forms a relationship XX;YY, where XX
(always positioned on the left) represents the direct
relationships and YY (on the right) represents the
indirect relationships. The direct relationships are
those that are between adjacent elements, that is, that
are side by side, and the indirect relationships refer to
elements that have at least one element between them.
Unlike the implication matrix proposed by
Reynolds and Gutman (1988), where there are no
breakdowns between elements, and thus a connection
of attributes with attributes and consequences with
consequences, in the example it was chosen to
continue with the breakdowns, but having one way
only, as there was no need to connect concrete
attributes with specific attributes (except for element
A1), abstract attributes with abstract attributes and so
on. Thus, there was only one way where each ladder
had at least six elements and at most seven (when A1
was connected to another concrete attribute). It
Ladder 1 Ladder 2 Ladder 3 Ladder 4 Ladder 5 Ladder 6 Ladder 7 Ladder 8 Ladder 9 Ladder 10
1 2 3 4 5 6 7 8 9 10
A7 A10 A9 A1 A1 A1 A1 A16 A12 A1
A14 A6 A3
B2 B1 B6 B7 B7 B8 B8 B7 B6 B3
C5 C1 C2 C4 C4 C5 C6 C5 C7 C3
D5 D5 D5 D2 D2 D6 D7 D6 D2 D4
E4 E4 E4 E5 E5 E2 E4 E5 E5 E2
F4 F4 F4 F6 F6 F4 F4 F3 F3 F3

Laddering: Unveiling Data Gathering an Interpretation
_______________________________________________________________________________
_____________________________________________________________________________
59
Brazilian Journal of Marketing - BJM
Revista Brasileira de Marketing – ReMark Edição Especial – Vol. 13, n.4. Setembro/ 2014
IKEDA/ CAMPONAR/ CHAMIE
generated an implication matrix where the
relationships are either direct or indirect, thus not
leading to a direct and indirect connection between the
same elements (except for the element A1). Therefore,
the only case where XX; YY has nonzero value in both
fields is in the element A1; in the others, the
connection is either direct or indirect. According to
Reynolds and Gutman (1998), the meaning of the
element is part of the function of the number of
connections that it has with other elements, hence the
need for counting.
Another option adopted in the construction of
the implication matrix taken as example was the single
count of each connection for each respondent, that is,
instead of counting each time the element appears
relating with another, within the ladders constructed
from the same respondent, every relationship between
elements of each respondent corresponds to only one
count, no matter how many times the respondent
mentioned it, thus avoiding distortion in the
representativeness of the results. For example, in
Table 4 that shows the ladders created in an interview,
even with four connections between element E4 and
element F4, this connection was counted only once.
The single independent count of the number of times
the respondent mentioned is an option cited by
Reynolds and Gutman (1988, p. 20). For this, there
was a manual assembly of the implications matrix at
first by respondent and then adding all respondents.
The characteristic of the individual matrix was having
the number 1 (when there was a connection between
the elements) or zero (when there were no
connections). With this,
the number shown in XX or YY refers to the
number of respondents that interconnected the two
elements.
Table 5 - Implication matrix (XX;YY) with direct (XX) and indirect (YY) representations
Source: Representation proposed by the authors.
A1 B1 B2 B3 B4 B5 B6 B7 B8 C1 C2 C3 C4 C5 C6 C7 C8 D1 D2 D3 D4 D5 D6 D7 E1 E2 E3 E4 E5 E6 E7 F1 F2 F3 F4 F5 F6
A1 10;01 04;08 ;05 ;01 04;02 01;10 12 ;01 ;02 ;06 ;13 ;09 ;11 ;04 ;06 ;05 ;15 ;05 ;09 ;01 ;04 ;13 ;05 ;13 ;02 ;04 ;12 ;03 ;05 ;08 ;04 ;10 ;08 ;02 ;10
A2 03 04 02 ;05 ;02 ;01 ;01 ;01 ;03 ;05 ;01 ;02 ;05 ;01 ;02 ;04 ;03
A3 05 01 04 01 ;01 ;02 ;02 ;02 ;01 ;02 ;02 ;01 ;01 ;03 ;01 ;01 ;01 ;02 ;02 ;01 ;01
A4 01 07;01 01 ;03 ;01 ;03 ;02 ;03 ;03 ;03 ;02 ;01 ;01 ;04 ;01 ;01 ;01 ;04 ;02 ;01
A5 01 03 02 05 ;01 ;04 ;01 ;02 ;01 ;01 ;04 ;01 ;02 ;03 ;01 ;01 ;02 ;01 ;04 ;02 ;01 ;02 ;06 ;01 ;02
A6 10 01 03 01 05 ;07 ;02 ;07 ;02 ;02 ;02 ;04 ;01 ;02 ;07
A7 04 05 ;01 ;03 ;04 ;01 ;03 ;01 ;01 ;04 ;03 ;01 ;03 ;02 ;01 ;01 ;02 ;04 ;01
A8 05 01 03 ;01 ;01 ;01 ;05 ;01 ;05 ;03 ;01 ;01 ;03 ;02 ;03 ;01 ;03 ;01 ;03 ;01
A9 05 ;03 ;02 ;05 ;02 ;03 ;01 ;03 ;01
A10 03 01 01 ;02 ;02 ;01 ;01 ;04 ;02 ;02 ;01 ;01 ;01 ;01 ;02
A11 02 03 ;05 ;05 ;03 ;02 ;04 ;01
A12 10 ;01 ;04 ;01 ;04 ;01 ;06 ;02 ;02 ;03 ;07 ;01 ;07 ;02 ;01
A13 05 02 01 ;06 ;02 ;08 ;01 ;01 ;08 ;07 ;01
A14 13 01 03 01 08 ;12 ;01 ;01 ;11 ;02 ;01 ;01 ;04 ;09 ;06 ;07
A15 06 02 02 01 01 ;04 ;02 ;05 ;01 ;02 ;02 ;01 ;01 ;06
A16 03 11 ;03 ;02 ;01 ;01 ;01 ;04 ;02 ;05 ;01 ;01 ;06 ;01 ;01 ;02 ;08 ;03 ;02 ;01 ;06 ;02 ;03
B1 02 02 05 ;03 ;07 ;01 ;03 ;04 ;04 ;02 ;01 ;06 ;01 ;05 ;01
B2 07 03 04 07 02 02 01 ;06 ;02 ;08 ;03 ;01 ;03 ;01 ;01 ;05 ;08 ;01 ;06 ;01 ;04 ;02 ;10 ;03 ;02
B3 01 02 03 01 03 02 02 ;01 ;01 ;02 ;02 ;01 ;07 ;02 ;08 ;01 ;01 ;02 ;02 ;02 ;03 ;02 ;03
B4 02 04 02 02 03 06 ;06 ;03 ;01 ;03 ;04 ;03 ;01 ;05 ;02 ;03 ;01 ;02 ;06 ;01 ;01 ;03 ;06 ;03 ;05
B5 01 02 02 01 01 05 ;01 ;01 ;06 ;01 ;03 ;01 ;01 ;04 ;02 ;02 ;05 ;01 ;01
B6 04 02 06 04 02 02 06 ;02 ;08 ;06 ;02 ;08 ;01 ;04 ;05 ;03 ;11 ;01 ;01 ;11 ;05 ;05
B7 05 03 02 10 01 01 04 ;04 ;10 ;02 ;02 ;06 ;01 ;03 ;01 ;02 ;11 ;02 ;02 ;01 ;08 ;02 ;01 ;06
B8 06 06 01 ;02 ;04 ;01 ;07 ;02 ;06 ;02 ;01 ;02 ;05 ;06 ;02
C1 02 08 07 03 ;02 ;01 ;07 ;02 ;05 ;11 ;03
C2 03 01 06 02 ;02 ;04 ;04 ;05 ;02 ;03 ;03 ;02 ;05 ;03 ;01
C3 04;01 05 02 04 01 ;05 ;01 ;04 ;01 ;03 ;03 ;01 ;03 ;05 ;03
C4 13 01 03 ;02 ;04 ;01 ;10 ;01 ;06 ;10
C5 06 01 01 02 02 02 02 ;03 ;04 ;02 ;07 ;02 ;04 ;05 ;06 ;01 ;01
C6 01 01 09 01 01 08 ;02 ;12 ;01 ;02 ;01 ;04 ;05 ;09 ;01 ;07 ;01 ;03
C7 02 07 04 ;04 ;02 ;07 ;01 ;04 ;07 ;01 ;01
C8 02 02 02 02 04 ;03 ;04 ;01 ;03 ;01 ;01 ;01 ;05 ;01 ;02
D1 03 02 01;01 05 05 01 ;04 ;01 ;04 ;04 ;03 ;01
D2 01 03 02 12 01 01 ;10 ;01 ;10
D3 01 10 03 01 ;03 ;10 ;03 ;01
D4 02 10 01 01 04 ;03 ;05 ;02 ;08 ;01 ;03
D5 01 03 06 08 02 02 ;03 ;04 ;08 ;04 ;02
D6 03 02 02 02 01 01 ;04 ;04 ;02 ;01
D7 02 11 02 01 01 ;03 ;03 ;01 ;06 ;03
E1 04 02 03 02
E2 04 06 03 08 06
E3 01 08 02 01
E4 03 01 04 02
E5 01 03 12 05 02 07
E6 02 01 03 02
E7 03 03 05 01

Laddering: Unveiling Data Gathering an Interpretation
_____________________________________________________________________________________
_______________________________________________________________________________
60 IKEDA/ CAMPONAR/
CHAMIE
Brazilian Journal of Marketing - BJM Revista Brasileira de Marketing – ReMark
Edição Especial – Vol. 13, n. 4. Setembro/ 2014
Table 5 shows the implication matrix that
shows value XX on the left and value YY on the right.
Since zero was deleted to facilitate the visualization of the
table, the semicolon was placed before YY to characterize
it. For interpreting the table with the implication matrix, it
is recommended to start by the line, to understand the
relationship of each element with another element shown
in the columns; for example, the element A1 has zero
connection with B1, 10 connections with B2 and an
indirect connection with it and so on. The reading
continues this way, thus enabling a way to analyze the
summary table of all the connections present in the ladders
constructed. The construction of the implication matrix is
a slow and detailed process, but quite revealing after
completion. It is the result of the analysis so builds an
accurate and consolidated image of the results achieved in
the research. Table 6 allows a better visualization of the
relationships between the elements, with regard to the
number of direct or indirect connections. The element
with the highest number of indirect connections from it is
A1. As it can be seen, there is no relationships starting
from the personal values, because they are at the highest
level of the hierarchy of the chains.
Table 6 - Summary of direct (XX) and indirect (YY) relationships forming (XX;YY)
SOURCE: Representation proposed by the authors. (ii.c.) Construction of the hierarchical map of value
(HMV). The third step of the analysis of the laddering
technique is the construction of the hierarchical map
of value (HMV), which visually shows the chains with
stronger connections. It is a complex and laborious
step to be performed manually. The construction of the
map is performed through the implication matrix that
supports the construction of integrated chains. The
purpose of the HMV is described by Reynolds and
Gutman (1998, p. 23) as follows: “mapping the
hierarchical relations and interconnect all meaningful
chains in a map in which all relations are exposed [...]
resulting in a map that includes all relevant relations,
and yet is easy to read and interpret.” Thus, not all
direct and indirect relations are considered, only the
most representative for the visualization to be
facilitated.
This step maps the existing direct or indirect
relations between the various elements and shows
them in a simple way. The hierarchical map of value is
a visual and representative chart, that is why Gengler
and Reynolds (1995) argue that the HVM contrasts

Laddering: Unveiling Data Gathering an Interpretation
_______________________________________________________________________________
_____________________________________________________________________________
61
Brazilian Journal of Marketing - BJM
Revista Brasileira de Marketing – ReMark Edição Especial – Vol. 13, n.4. Setembro/ 2014
IKEDA/ CAMPONAR/ CHAMIE
current positions and develops scenarios that
ultimately may become strategic options. Reynolds
and Gutman (1988) argue that to construct an HVM
from the implication matrix, it should start from the
adjacent relations to a gradual construction, which
connect all the chains that are formed by means of
elements to a large matrix. They argue that to make the
HVM, a series of pairs are connected, and the criteria
for evaluating the relations is the number of relations
between the elements. Not all relations between
attributes, consequences and personal values are
considered, but the most important ones, so during the
construction of the hierarchical map of value (HMV),
it was tracked the direct and indirect relationships with
a sample greater than or equal to 4 respondents
(minimum of times each element appears in the
matrix), causing various cells of the matrix to be
discarded for presenting responses of relations below
the cutoff point (weaker relationships). Reynolds and
Gutman (1988, p. 20) recommend that the cutoff line
is between 3 and 5 respondents for each connection. It
was conducted a test with the cutoff in three or more
respondents, but the number of relations between the
variables generated a hierarchical map impossible to
be viewed due to the large number of connections and
intersections. With the option of researchers to
establish the cutoff line in 4 or more respondents, only
35% of the connections were maintained, which was
not seen as a problem since there were many
connections with one or two respondents – eliminating
those that represented weak connections and that
would not significantly contribute to the analysis. The
relations that did not reach the cutoff point were
excluded from this step.

Laddering: Revelando a Coleta e Interpretação dos Dados
_____________________________________________________________________________________
_______________________________________________________________________________
62 Brazilian Journal of Marketing - BJM
Revista Brasileira de Marketing – ReMark Edição Especial – Vol. 13, n.4. Setembro/ 2014
IKEDA/ CAMPONAR/
CHAMIE
Illustration 2 - Hierarchical map of value (HMV) in the toy shopping experience
Source: Representation proposed by the authors.
Notes: 1. dotted lines = crossed lines 2. The elements A15, A10, A11, D6 and F5 are not present in the chains as they do not have representative connections for their formation. In addition, the
elements A3, B3 and E6 do not result in terminal values and are therefore invalid.
Laddering: Unveiling Data Gathering an Interpretation
_______________________________________________________________________________
_____________________________________________________________________________
63
Brazilian Journal of Marketing - BJM Revista Brasileira de Marketing – ReMark
Edição Especial – Vol. 13, n.4. Setembro/ 2014
IKEDA/ CAMPONAR/ CHAMIE
After filtering the most significant
relationships, the most representative chains were
formed based on the implication matrix. These chains
were the basis for forming the HMV. The result of the
map can be seen in Illustration 2.
The chains resulting from the map are
constructed with A1 (line) meeting the first relation
above the cut line, which in the case of the research
was B2, with the number 10 in the relations, thus
initiating the first chain with A1-B2. Shortly after, it
was evaluated element B2 to find the first significant
reaction in the same line, in which case it is the
element C1, thus forming A1-B2-C1. In the line of C1,
the first significant relation is D3, and the first
significant relations of D3 is E3 (with 10 relations) and
with the latter, F3. At the end, the first significant
chain is formed, which is A1-B2-C1-D3-E3-F3. It
continues up to the end for building the map. The
means-end chains obtained through the analysis
described are not all existing chains, but
representations of the connections for building the
hierarchical map of value. For Reynolds and Gutman
(1988) the purpose of mapping these relations is the
interconnection of the representative chains in the map
of relationships. The hierarchical map of value (HMV)
in question shows the following characteristics in its
quadrants: the numbers shown above the description
of the element refers to the element code; and the
number below refers to the number of times the
element appeared in the individual ladders constructed
based on the answers of the respondents (without
cutoff line). Reynolds and Gutman (1988) describe
that dotted lines should be avoided as they difficult the
visualization of the map. Despite attempting to avoid,
the number of data did not allow the construction of
the map without crossing the lines, in these cases it is
recommended to represent them with dotted lines,
thereby facilitating the visualization. In any case, the
construction of the map requires intelligence in the
allocation of the quadrant to avoid the dotted lines and
facilitate the visualization of the existing connections.
The reading should always occur from bottom to top,
thus starting on concrete attributes and ending in
terminal personal values.
Based on the hierarchical map of value, any
path between the base (concrete attributes) and the top
(terminal personal values) is possible. The HMV is a
large summary table that allows many analyses on the
subject proposed. For an increased focus on the
qualitative analyses of the chains, the next step is to
determine the most representative paths (or chains),
that is, using another cutoff line. The process of
obtaining representative chains is laborious, but
provides a special contribution to the methodology
used. For this, 259 paths, or possible chains, were
outlined within the map. This is a manual process that
requires considerable attention and review by the
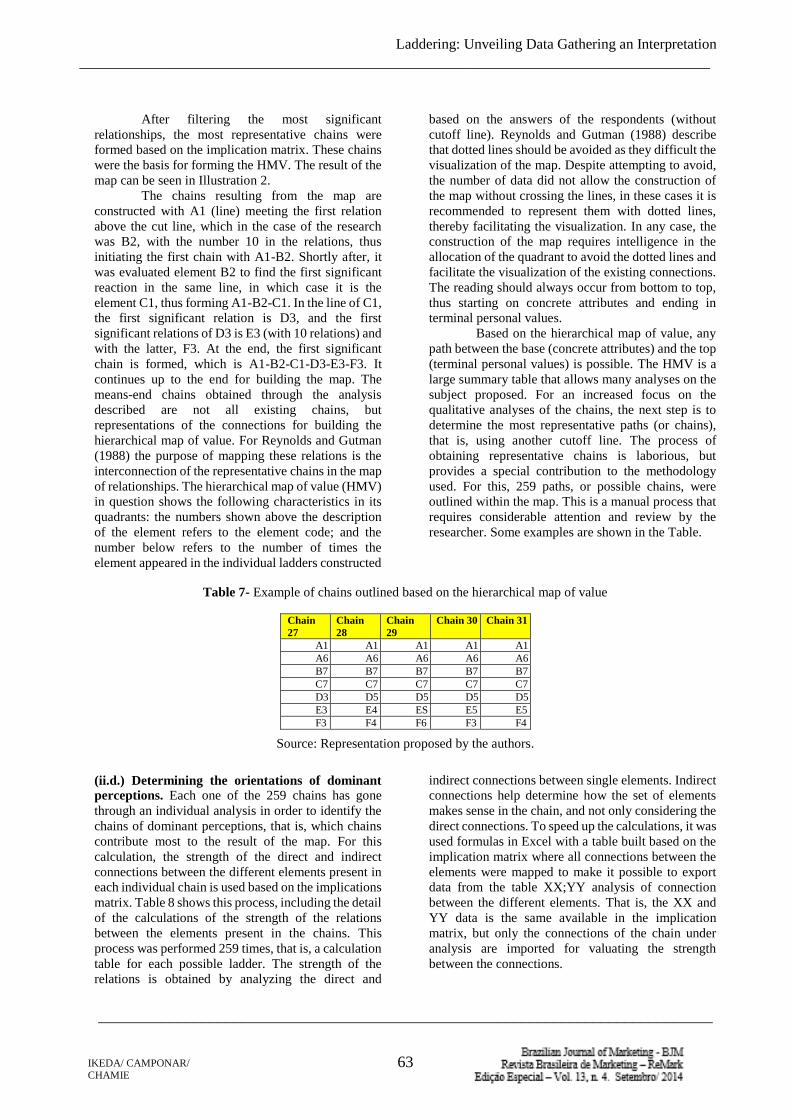
researcher. Some examples are shown in the Table.
Table 7- Example of chains outlined based on the hierarchical map of value
Chain
27
Chain
28
Chain
29
Chain 30 Chain 31
A1 A1 A1 A1 A1
A6 A6 A6 A6 A6
B7 B7 B7 B7 B7
C7 C7 C7 C7 C7
D3 D5 D5 D5 D5
E3 E4 ES E5 E5
F3 F4 F6 F3 F4
Source: Representation proposed by the authors.
(ii.d.) Determining the orientations of dominant
perceptions. Each one of the 259 chains has gone
through an individual analysis in order to identify the
chains of dominant perceptions, that is, which chains
contribute most to the result of the map. For this
calculation, the strength of the direct and indirect
connections between the different elements present in
each individual chain is used based on the implications
matrix. Table 8 shows this process, including the detail
of the calculations of the strength of the relations
between the elements present in the chains. This
process was performed 259 times, that is, a calculation
table for each possible ladder. The strength of the
relations is obtained by analyzing the direct and
indirect connections between single elements. Indirect
connections help determine how the set of elements
makes sense in the chain, and not only considering the
direct connections. To speed up the calculations, it was
used formulas in Excel with a table built based on the
implication matrix where all connections between the
elements were mapped to make it possible to export
data from the table XX;YY analysis of connection
between the different elements. That is, the XX and
YY data is the same available in the implication
matrix, but only the connections of the chain under
analysis are imported for valuating the strength
between the connections.

Laddering: Revelando a Coleta e Interpretação dos Dados
_____________________________________________________________________________________
_______________________________________________________________________________
64 Brazilian Journal of Marketing - BJM
Revista Brasileira de Marketing – ReMark Edição Especial – Vol. 13, n.4. Setembro/ 2014
IKEDA/ CAMPONAR/
CHAMIE
Table 8 - Calculations for determining the chains of dominant perceptions
Source: Representation proposed by the authors.
Table 8 describes that Chain N. 2 has both
direct and indirect relations significantly weaker than
the relationships established through the Chain N. 25.
Through the direct (XX) and indirect (YY)
connections calculated in the chains, it was possible to
compare the strength of the connections between them,
thus obtaining the chains of dominant perceptions. The
chains with stronger connections are those which have
higher values as a result of the sum of the XX;YY
connections between the elements. A special attention
given was to compare the total numbers summed with
the same criteria, that is, there were chains with seven
elements instead of eight, due to the connection of A1
with the concrete attributes A3, A6 and A14. Since
these attributes, whenever they were present were
connected to A1, it was excluded A1 from the
calculation (only in these cases), thus leaving an
equitable comparison in all chains, always with six
elements within the calculations. The chains that have
not reached the terminal values were excluded from
the calculation (11 chains with this characteristics), as
well as some chains that did not start on attribute (9
cases with the element B5).
The criterion chosen for the identification of
the chains of dominant perception was to filter the
chains that had a sum of direct and indirect relations
above 25% of the average obtained between the
relations of all chains. Gengler and Reynolds (1995)
state that the sum of the relations between the
elements, directly and indirectly, is an indicator of
strength of given association of the means-end chain.
Through this process, 56 dominant chains were
obtained. Table 9 shows a summary of all the elements
belonging to the means-end chains that are part of the
dominant perceptions. The elements with greater
prominence in presence were highlighted, aiming to
allow a better visualization. The content analysis of
Table 9 already indicates a series of clues regarding
the elements that provide value to the customer.
Table 9 - Elements present in the chains of dominant perceptions
Code Element name Times it appears
Attributes
Assortment 36
A5 Permission to touch / grab toys 4
A6 Building toys/games 2
A9 Store location 2
A12 Information 8
A13 Price 1
A14 Education toys and books 5
A16 Store staff 4
B2 Options 10
B6 Quality/benefits 26
B7 Usefulness 11
B8 Novelty 9
Consequences
C1 Requires little time and money 11
C3 Raises interest in the child 13
C4 Development of cognitive and behavioral skills 15
C5 Finding different items 2
C6 Magical, playful stimuli 9
C7 Safety in choice 6
D1 Freedom of choice 4
D2 Stimuli for education 24
D3 Effective expenditure/valuation of money 6

Laddering: Unveiling Data Gathering an Interpretation
_______________________________________________________________________________
_____________________________________________________________________________
65
Brazilian Journal of Marketing - BJM Revista Brasileira de Marketing – ReMark
Edição Especial – Vol. 13, n.4. Setembro/ 2014
IKEDA/ CAMPONAR/ CHAMIE
D4 Leads to the fantasy world 7
D5 Feel good 11
D7 Brings childhood/nostalgic memories 4
Personal Values
E2 Imaginative 10
E3 Self-control 6
E5 Helpful 39
E7 Joyful, glad 1
F1 Prosperous life 2
F2 Beautiful world 2
F3 Sense of accomplishment 31
F4 Pleasure/Happiness 10
F6 Exciting/active life 11
Source: Representation proposed by the authors.
(ii.e.) Interpretation of results. Understanding the
value in the toy shopping experience was made
possible through the interpretation of the hierarchical
map of value (HMV) and the mapping of the chains of
dominant perceptions. The analysis of the meaning of
the value focused on the functional consequences or
benefits (elements represented by the letter C) which
include the key representations that constitute the
expression of value, as there is an understanding that
this is the central point where the toy store can add
value to its potential customer. Thus, the attributes (A
and B) are the means to achieve the key-consequences
(C and D) and the personal values are their deep
motivations (E and F). In this step, the priority chains
were mapped and associated with earth other through
the element C, which is the functional consequence. In
the 56 chains of dominant perceptions, it was
identified six elements belonging to the functional
consequence (C). The elements of functional
consequences present in the dominant perceptions of
value then formed six major sets of chains (all related
through element C), where there are several other
elements that relate and create meaning to them, and
these elements are formed by concrete and abstract
attributes, psychological consequences, instrumental
and terminal personal values. The psychological
consequences (elements D) have great importance in
the translation of the meaning of the functional
consequence (element C), because they add the
emotional aspect in the representations of value
obtained. Based on six major sets of dominant chains
formed by element C, which obtained the
representations of value. These representations were
characterized by means of sentences that contain the
meaning of the elements that configured them, which
are: i) the toy store is a means to obtain stimuli that
assist in the education of children; (ii) the magical and
playful stimuli evoke memories and fantasies; (iii) the
time and money are important resources upon
purchase; (iv) the toy sought is the one that arouses the
desire of the child; (v) the assortment offered is
important to support the choice; and (vi) the feeling of
making a good purchase is a desired factor. The six
chains with the main representations of value were
split when necessary in order to obtain subtopics that
detail and enrich the six representations obtained. Each
theme included the presentation of the priority chain
(through the hierarchical value map) which configured
the main elements involved in their characterization.
The representations can, therefore, present themes,
which are breakdowns of the main representation to
attribute a more specific meaning to the set of elements
that comprise it. During the representations of value,
excerpts of the interview could be added, thus
providing a greater reality and tangibilization to the
result presented.
4 FINAL CONSIDERATIONS
Laddering is an interesting tool for finding
out constructs that provide value to customers and
unconscious personal values that the respondents
reveal from the successive questionings. It is a process
based on more superficial elements to reach the
motivating elements, or personal values.
Although its precepts have been discussed in
the mid-1950s with the thesis of Kelly (1955), in the
psychology field, it was only in the 1980s that the
technique started being used in marketing with the
studies of Gutman (1982 ) and then with Reynolds
(1988) without necessarily gaining popularity, because
the publications addressing the subject is not extensive
until today. This study described the different steps
using as illustration a real research highlighting its
difficulties and recommendations. It can thus be used
as a guide for studies that choose to use the method.
The conclusion is that despite being an exploratory
research and having multiple barriers arising from its
own characteristics (tedious, repetitive and laborious),
it is a very useful type of research to support marketing
decisions for bringing to light important meanings
provided by products, brands, objects and people.
REFERENCES
Aufifeille, J.M.; Florence, P.V.. Determination of the
dominant means-end chains: A constrained clustering
approach. International Journal of Research in
Marketing, v. 12, n. 3, p. 267-278, 1995

Laddering: Revelando a Coleta e Interpretação dos Dados
_____________________________________________________________________________________
_______________________________________________________________________________
66 Brazilian Journal of Marketing - BJM
Revista Brasileira de Marketing – ReMark Edição Especial – Vol. 13, n.4. Setembro/ 2014
IKEDA/ CAMPONAR/
CHAMIE
Botschen, G.; Thelen, E.M.; Pieters, R.. Using means-end
structures for benefit segmentation an application to
services. European Journal of Marketing, v.33, n.1/2, p.
38-58, 1999.
Gengler, C.E.; Reynolds, T.J.. Consumer understanding and
advertising strategy: analysis and strategic translation of
laddering data. Journal of Advertising Research, v. 35,
n. 4, p. 19-33, jul.-aug., 1995.
Grunert, K.G.; Bech-Larsen, T.. Explaining choice option
attractiveness by beliefs elicited by the laddering
method. Journal of Economic Psychology, v. 26, n. 2, p.
223-241, 2005.
Grunert, K.G.; Grunert, S.C.. Measuring subjective meaning
structures by the laddering method: Theoretical
considerations and methodological problems.
International Journal of Research in Marketing, v.12,
n.3, p. 209-225, 1995.
Gutman, J.. A Means-End Chain Model Based on Consumer
Categorization Processes. The Journal of Marketing, v.
46, n. 2, p. 60-72, spring, 1982.
Gutman, J.. Exploring the Nature of Linkages Between
Consequences and Values. Journal of Business
Research, v. 22, n. 2, p. 143-148, 1991.
Gutman,J. A means-end model for facilitating analyses of
product markets based on consumer judgement.
Advances in Consumer Research, v. 8, n. 1, p. 116-121,
1981.
Ikeda, A.A.; Veludo-De-Oliveira, T.M..O conceito de valor
para o cliente: definições e implicações gerenciais em
marketing. REAd, edição 44, v. 11, n. 2, p. 1-22, mar.-
abr., 2005.
Kaciak, E.; Cullen, C. W. Cullen. A method of abbreviating
a laddering survey . Journal of Targeting, Measurement
& Analysis for Marketing. v. 17, n. 2, p. 105–113, 2009.
Kaciak, E.; Cullen, C. W.; Sagan, A. The quality of ladders
generated by abbreviated hard laddering. Journal of
Targeting, Measurement & Analysis for Marketing, v.
18. n. 3/4, p. 159-16, Sep. 2010.
Kelly, G.A.. The psychology of personal constructs. New
York: Norton & Company INC, 1955.
Leão, A.L.M.S; Mello, S.C.B. Conhecendo o “valor do
cliente” de um jornal on-line. REA, v. 43, n. 3, p. 22-35,
2003.
Leão, A.L.M.S; Mello, S.C.B.. The means-end approach to
understanding customer values of a on-line newspaper.
BAR- Brazilian Administration Review, edição Jan/Apr
, v. 4, n. 1, p. 1-20, 2007.
Martins, G.A., Theóphilo, C.R.. Metodologia da
Investigação Científica para Ciências Sociais Aplicadas:
2. ed. São Paulo: Atlas, 2009.
Phillips, J.; Reynolds, T. J. A hard look at hard laddering: A
comparison of studies. Qualitative Market Research: An
International Journal, v. 12, n. 1, p83-99, Jan. 2009.
Rekom , J.V.; Wierenga, B.. On the hierarchical nature of
means–end relationships in laddering data. Journal of
Business Research, v. 60, n. 4, p. 401-410, 2007.
Reynolds, T.J.; Gutman, J.. Laddering theory, method,
analysis, and interpretation. Journal of Advertising
Research, v. 28, n. 1, p. 11-31, feb.-mar., 1988.
Reynolds, T.J.; Whitlark, D.B. Applying laddering data to
communications: strategy and advertising practice.
Journal of Advertising Research, v. 35, n. 4, p. 9-17, jul.-
aug., 1995.
Rokeach, M. J.. The Nature of Human Values, New York:
The Free Press, 1973.
Sánchez-Fernández, R.; Iniesta-Bonillo, M.A..The concept
of perceived value: a systematic review of the research.
Marketing Theory, v. 7, n. 4, p. 427–451, 2007.
Valette-Florence, P.; Rapacchi, B.. Improvements in means-
end chain analysis- using graph theory and
correspondence analysis. Journal of Advertising
Research, v. 31, n. 1, p. 30-45, feb-mar., 1991.
Valette-Florence, P.. A Causal Analysis of Means-End
Hierarchies in a Cross-Cultural Context: Methodological
Refinements. Journal of Business Research, v. 42, n. 2,
p. 161–166, 1998.
Veludo-De-Oliveira, T. M.; Ikeda, A. A.. Laddering em
pesquisas de marketing. Caderno EBAPE.BR(FGV), v.
VI, n. 5, p. 1-13, 2008.
Veludo-De-Oliveira, T. M.; Ikeda, A.. Usos e limitações do
método laddering. RAM. Revista de Administração
Mackenzie. São Paulo, v. 5, n. 1, p. 197-222, 2004.
Veludo-De-Oliveira, T.; Ikeda, A; Campomar, M.C..
Laddering in the practice of marketing research: barriers
and solutions. Qualitative Market Research: An
International Journal. v. 9, n. 3, p. 297-306, 2006.
Walker, B.A.; Olson, J.C.. Means-End Chains: Connecting
Products With Self. Journal of Business Research, v. 22,
n. 2, p. 111-118, 1991.
Wansink, B.. New techniques to generate key marketing
insights. Journal of Marketing, v. 12, n. 2, p. 28-36,
summer, 2000.
Young, S.; Feigin, B.. Using the benefit chain for improved
strategy formulation. Journal of Marketing, Chicago, v.
39, n. 3, p. 72-74, 197.