A Microprocessor-Based Novel Instrument for Temperature and Thermal Conductivity Measurements
9
TECHNICAL ARTICLE A Microprocessor-Based Novel Instrument for Temperature and Thermal Conductivity Measurements M. Rehman 1 , M. Abdul Mujeebu 2 , T.B. Kheng 1 , and B.A.J.A. Abu Izneid 1 1 School of Electrical and Electronics Engineering, Engineering Campus, Universiti Sains Malaysia, Nibong Tebal, Penang, Malaysia 2 School of Mechanical Engineering, Engineering Campus, Universiti Sains Malaysia, Nibong Tebal, Penang, Malaysia Keywords Thermal Conductivity, PT 100 Sensor, PIC Microcontroller, OrCAD Layout Plus Correspondence M.A. Mujeebu, School of Mechanical Engineering, Engineering Campus, Universiti Sains Malaysia, 14300 Nibong Tebal, Penang, Malaysia Email: [email protected] Received: July 3, 2010; accepted: September 6, 2010 doi:10.1111/j.1747-1567.2010.00698.x Abstract This article presents the details of design and development of a mobile and low-cost measuring device that can directly measure the thermal conductiv- ity of a material. The device does not need an AC power source and needs only a battery to operate. In its operation, the output of a platinum resis- tance thermometer (PT100 sensor) is amplified by LM324 Quad differential input operational amplifier and fed to Microchip PIC16F877A microcontroller through an analog-to-digital converter. The microcontroller calculates the ther- mal conductivity of the material by a given set of temperature difference and finally the result is displayed on a liquid crystal display. PIC Basic programming language is used to program the PIC microcontroller. The analog circuit and printed circuit board layout are designed using OrCAD software. It has been observed that the proposed device can measure the temperature with an accu- racy of 0.5 ◦ C and thermal conductivity with an accuracy of 0.01 W/mm ◦ C. The power consumption of the device is found to be 277.25 mW. Introduction Thermal conductivity is a key thermal transport property of materials. Knowledge of thermal con- ductivity and its accurate measurement is crucial for a wide range of applications, including polymer injec- tion molding, home insulation using various building materials, insulation for space shuttle, design of heat exchangers and fins, thermal management of elec- tronic packages in semiconductor industry, and so on. Thermal conductivity measurement techniques are broadly classified under steady state methods and transient methods. The radial heat flow method and the guarded hotplate method are examples of steady state method. 1–3 Hot wire 4 and laser flash 5 methods are examples of the transient method. The comparison of various transient techniques is available in literature. 6 Other techniques include the 3ω (three omega) method, 7–9 the differential photoacoustic method, 10 the photothermal deflection method or the probe-beam deflection method, 11,12 the thermal-wave technique, 13 the transient plane source method, 14 the thermorflectance or the Nano-TheMS method, 15 and differential scanning calorimetry. 16 Apart from these, many techniques have been developed by previous researchers for spe- cific applications. For instance, Banaszkiewicz et al. 17 developed a sensor to perform in situ thermal con- ductivity determination of cometary and asteroid materials. The sensor was made of platinum wire (resistance thermometer) and isotan wire (heating element) that could operate independently. A steady state, bi-substrate technique for measurement of the through-thickness thermal conductivity of ceramic coatings was developed by Tan et al. 18 A thin-film thermal conductivity meter was designed and built by Subramanian et al. 19 to measure the thermal con- ductivity of the thermal sensitive paints. A stationary absolute method for the thermal conductivity mea- surement of semiconductor materials was developed by Vahanyan. 20 While reviewing the previous works, it can be observed that most of the methods have been developed for specific applications and operating Experimental Techniques (2011) © 2011, Society for Experimental Mechanics 1
Transcript of A Microprocessor-Based Novel Instrument for Temperature and Thermal Conductivity Measurements

T E C H N I C A L A R T I C L E
A Microprocessor-Based Novel Instrument for Temperatureand Thermal Conductivity MeasurementsM. Rehman1, M. Abdul Mujeebu2, T.B. Kheng1, and B.A.J.A. Abu Izneid1
1 School of Electrical and Electronics Engineering, Engineering Campus, Universiti Sains Malaysia, Nibong Tebal, Penang, Malaysia
2 School of Mechanical Engineering, Engineering Campus, Universiti Sains Malaysia, Nibong Tebal, Penang, Malaysia
KeywordsThermal Conductivity, PT 100 Sensor, PIC
Microcontroller, OrCAD Layout Plus
CorrespondenceM.A. Mujeebu,
School of Mechanical Engineering,
Engineering Campus,
Universiti Sains Malaysia, 14300 Nibong
Tebal, Penang, Malaysia
Email: [email protected]
Received: July 3, 2010; accepted:
September 6, 2010
doi:10.1111/j.1747-1567.2010.00698.x
Abstract
This article presents the details of design and development of a mobile andlow-cost measuring device that can directly measure the thermal conductiv-ity of a material. The device does not need an AC power source and needsonly a battery to operate. In its operation, the output of a platinum resis-tance thermometer (PT100 sensor) is amplified by LM324 Quad differentialinput operational amplifier and fed to Microchip PIC16F877A microcontrollerthrough an analog-to-digital converter. The microcontroller calculates the ther-mal conductivity of the material by a given set of temperature difference andfinally the result is displayed on a liquid crystal display. PIC Basic programminglanguage is used to program the PIC microcontroller. The analog circuit andprinted circuit board layout are designed using OrCAD software. It has beenobserved that the proposed device can measure the temperature with an accu-racy of 0.5◦C and thermal conductivity with an accuracy of 0.01 W/mm ◦C.The power consumption of the device is found to be 277.25 mW.
Introduction
Thermal conductivity is a key thermal transportproperty of materials. Knowledge of thermal con-ductivity and its accurate measurement is crucial fora wide range of applications, including polymer injec-tion molding, home insulation using various buildingmaterials, insulation for space shuttle, design of heatexchangers and fins, thermal management of elec-tronic packages in semiconductor industry, and so on.
Thermal conductivity measurement techniques arebroadly classified under steady state methods andtransient methods. The radial heat flow methodand the guarded hotplate method are examples ofsteady state method.1–3 Hot wire4 and laser flash5
methods are examples of the transient method.The comparison of various transient techniques isavailable in literature.6 Other techniques includethe 3ω (three omega) method,7–9 the differentialphotoacoustic method,10 the photothermal deflectionmethod or the probe-beam deflection method,11,12
the thermal-wave technique,13 the transient plane
source method,14 the thermorflectance or theNano-TheMS method,15 and differential scanningcalorimetry.16 Apart from these, many techniqueshave been developed by previous researchers for spe-cific applications. For instance, Banaszkiewicz et al.17
developed a sensor to perform in situ thermal con-ductivity determination of cometary and asteroidmaterials. The sensor was made of platinum wire(resistance thermometer) and isotan wire (heatingelement) that could operate independently. A steadystate, bi-substrate technique for measurement of thethrough-thickness thermal conductivity of ceramiccoatings was developed by Tan et al.18 A thin-filmthermal conductivity meter was designed and builtby Subramanian et al.19 to measure the thermal con-ductivity of the thermal sensitive paints. A stationaryabsolute method for the thermal conductivity mea-surement of semiconductor materials was developedby Vahanyan.20
While reviewing the previous works, it can beobserved that most of the methods have beendeveloped for specific applications and operating
Experimental Techniques (2011) © 2011, Society for Experimental Mechanics 1

Thermal Conductivity Measuring Device M. Rehman et al.
conditions. Many methods involve measurement oftemperature by using a sensor followed by manualcalculation of thermal conductivity which is time con-suming. Some of them are very costly to manufacture.Hence the present work is aimed at developing a low-cost, reliable, portable, and user-friendly system fordirect measurement of thermal conductivity of solidsunder wide range of operating conditions. The deviceis successfully fabricated and performance test showssatisfactory results.
Basic Components of the System
The proposed device has been developed based on thelayout as shown in Fig. 1. The output of a platinumresistance thermometer (PT100 sensor) is amplified byLM324 Quad differential input operational amplifierand fed to Microchip PIC16F877A microcontrollerthrough an analog-to-digital converter (ADC). Themicrocontroller calculates the thermal conductivity ofthe material by a given set of temperature differenceand finally the result is displayed on a liquid crystaldisplay (LCD). The description of each component isgiven as follows:
Platinum resistance thermometer (PT100-RTD)
Figure 2 shows the structure of the thin-film plat-inum resistance thermometer PT100. The platinumresistance temperature detector is used today asan interpolation standard from the oxygen point(−182.96◦C) to the antimony point (630.74◦C). Themain advantage of platinum is that it can withstandhigh temperatures while maintaining excellent stabil-ity. As a noble metal, it has limited susceptibility tocontamination.
Signalconditioner
Circuit
Interfacewithmicro Controller
CalculationIn
MicroController
Display Using
LCD
InputSignalfrom thermal sensor
Outputsignal
Figure 1 General layout of the proposed system.
Figure 2 Thin-film platinum resistance thermometer (PT100).
LM324 Quad differential input operational amplifier
The LM324 series, the Op-amp used in this study arelow-cost, quad operational amplifiers with true differ-ential inputs. They have several distinct advantagesover standard operational amplifier types in singlesupply applications. The quad amplifier can operateat supply voltages as low as 3.0 V or as high as 32 V.The output voltage of the sensor is amplified (signalconditioning) in the Op-amp. The schematic of theLM324 Op-amp is shown in Fig. 3.
MAX232 line driver
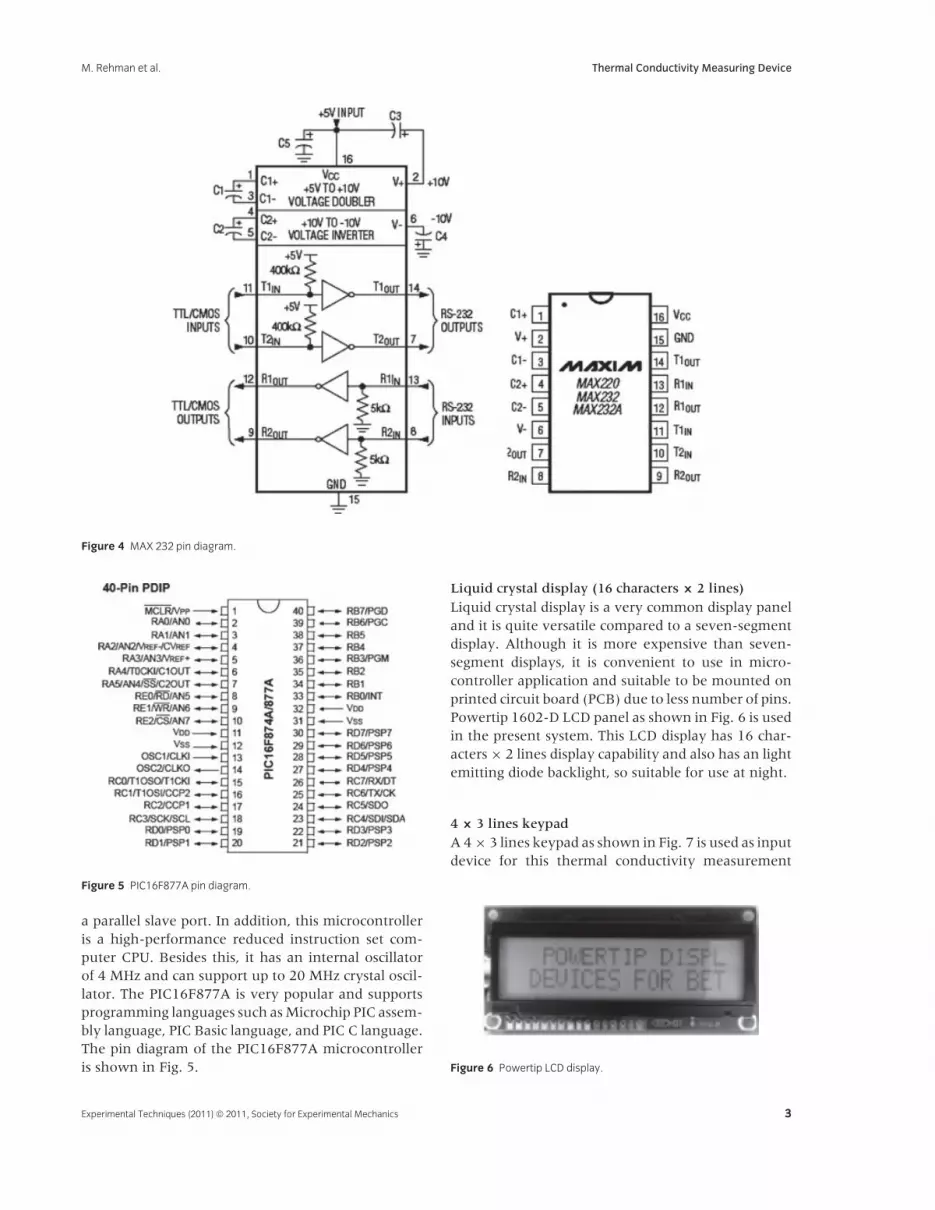
The purpose of MAX232 in this system is to convert a+5 V source input voltage to +10 V and −10 V volt-age. This +10 V and −10 V is used as a source voltagefor the LM324 Op-amp, hence requiring only onevoltage source for the whole device. MAX232 canprovide +10 V and −10 V because it has voltage dou-bler and voltage inverter circuits inside the integratedcircuit. The pin diagram for MAX232 is shown inFig. 4.
Microchip PIC16F877A microcontroller
It is a CMOS FLASH-based 8-bit microcontroller. Itfeatures 200 ns instruction execution, 256 bytesof EEPROM data memory, self-programming, anin-circuit debugger (ICD), two comparators, eightchannels of 10-bit ADC, two capture/compare/pulsewidth modulation functions, a synchronous serialport that can be configured as either three-wire serialperipheral interface or two-wire I2C bus, a universalsynchronous/asynchronous receiver/transmitter, and
Figure 3 LM324 pin diagram.
2 Experimental Techniques (2011) © 2011, Society for Experimental Mechanics
M. Rehman et al. Thermal Conductivity Measuring Device
Figure 4 MAX 232 pin diagram.
Figure 5 PIC16F877A pin diagram.
a parallel slave port. In addition, this microcontrolleris a high-performance reduced instruction set com-puter CPU. Besides this, it has an internal oscillatorof 4 MHz and can support up to 20 MHz crystal oscil-lator. The PIC16F877A is very popular and supportsprogramming languages such as Microchip PIC assem-bly language, PIC Basic language, and PIC C language.The pin diagram of the PIC16F877A microcontrolleris shown in Fig. 5.
Liquid crystal display (16 characters × 2 lines)
Liquid crystal display is a very common display paneland it is quite versatile compared to a seven-segmentdisplay. Although it is more expensive than seven-segment displays, it is convenient to use in micro-controller application and suitable to be mounted onprinted circuit board (PCB) due to less number of pins.Powertip 1602-D LCD panel as shown in Fig. 6 is usedin the present system. This LCD display has 16 char-acters × 2 lines display capability and also has an lightemitting diode backlight, so suitable for use at night.
4 × 3 lines keypad
A 4 × 3 lines keypad as shown in Fig. 7 is used as inputdevice for this thermal conductivity measurement
Figure 6 Powertip LCD display.
Experimental Techniques (2011) © 2011, Society for Experimental Mechanics 3

Thermal Conductivity Measuring Device M. Rehman et al.
Figure 7 Typical keypad.
device. The function of this keypad is to supply a high(+5 V) voltage to the row input and then get theoutput voltage from column output and vice versa.
PIC Basic pro programming language
PIC Basic programming language is a compiler lan-guage that is used to compile the BASIC code toassembly code and even machine code (HEX code).This is the programming language that is used toprogram the PIC microcontroller for this study. Thislanguage is a high level language and it is more con-venient to use compared to PIC assembly language.
PIC has the syntax like C language, so it is easierto learn. In addition, the PIC Basic pro compiler givesdirect access to all the PIC microcontroller registers—I/O ports, A/D converters, hardware serial ports, andso on. It can automatically take care of the pageboundaries and random access memory banks. More-over, it has built-in commands to control intelligentLCD modules. So with PIC Basic pro, it is easy tocontrol the LCD display.
OrCAD software
OrCAD is a software that was developed by CadenceInc. OrCAD has the main capability of doing elec-tronic circuit schematic design (Capture CIS), circuit
simulation (PSpice), and PCB layout (OrCAD layout).This software is used to design analog circuit and PCBlayout.
OrCAD Capture Component Information System
OrCAD Component Information System (CIS) is anelectronic part management system that is availableas an option for use with OrCAD Capture. OrCADCIS helps manage part properties (including partinformation required at each step in the printedcircuit board design process, from implementationthrough manufacturing) within schematic designs.Capture CIS provides access to local (preferred partsdatabase) and remote part databases that contain allrelevant information for the parts used in designs.This information may include company part numbers,part descriptions, PCB layout footprints, technicalparameters (such as speeds, tolerances, and ratings),and purchasing information. The interface of theOrCAD Capture CIS is shown in Fig. 8.
OrCAD Layout Plus
OrCAD Layout Plus is one of the software that isincluded in the OrCAD software package and is usedto do the PCB layout. OrCAD Layout Plus has thecapability of Auto route for the layout of PCB. It isvery user-friendly and easy to learn. The user justneeds to export the schematic design from OrCAD
Figure 8 Interface of the OrCAD Capture CIS.
4 Experimental Techniques (2011) © 2011, Society for Experimental Mechanics

M. Rehman et al. Thermal Conductivity Measuring Device
Figure 9 Interface of OrCAD Layout Plus.
Capture CIS to OrCAD Layout Plus, then put thecomponent in the desired place, and click the Autoroute function. The software will automatically routethe circuitry. The interface of the OrCAD Layout Plusis shown in Fig. 9.
Methodology
Software development
The tools used in software development are ICD2programmer board, MPLAB IDE, and PIC BasicPro compiler. Basically, the firmware of the pro-posed device is constructed from many subroutinesnamely the main routine, then welcome screen, key-pad reading, temperature display, key-in, thermalconductivity calculation, and thermal conductivitydisplay routines.
The main routine combines all the subroutines andproduces a fully functional firmware based on thedesign specification. Welcome screen routine is usedto display the welcome message ‘‘welcome to thermalconductivity measurement device.’’ Keypad readingroutine is used to detect which key is pressed by theuser. A normal keypad is organized in a matrix ofrows and columns. The microcontroller accesses both
rows and columns through its I/O port. The presentsystem needs only seven I/O ports to control the 4rows × 3 columns keypad, which is shown in Fig. 7.
In the temperature display routine, the temper-ature read by the microcontroller (in volts) willbe converted to digital by the ADC of the micro-controller. The digital value of the reading will beconverted to the temperature that can be displayedin the LCD display. Besides, this routine also hasa sequential technique to display the temperaturenicely. For instance, if +050◦C needs to be displayed,the routine will display ‘‘+0’’ first and then display50. For value less than 10, the routine will display‘‘+00’’ first and then display the value.
The Key-in routine is used to store the dimensionsof the tested material. The dimensions are area (A),length (L), and power (P). These three variables areused to calculate the thermal conductivity of thematerial. The storing technique uses multiplicationand addition of the input key. For example, 1234needs to be stored in a variable. So the value of thevariable is equal to the first keyed value multiplied by1000 plus second keyed value multiplied by 100 plusthird keyed value multiplied by 10 plus forth keyedvalue. The thermal conductivity calculation routine
Experimental Techniques (2011) © 2011, Society for Experimental Mechanics 5
Thermal Conductivity Measuring Device M. Rehman et al.
Figure 10 Schematic of the axial heat flow method.
calculates the thermal conductivity by Eq. 1 and isdisplayed in the display routine.
Thermal conductivity measurement
The procedure used to measure the thermal con-ductivity was the modification of the absolute axialheat flow method as shown schematically in Fig. 10.This is the simplest method to determine the thermalconductivity of an object, based on Eq. (1):
Thermal conductivity = K = Q/A
�T/L(1)
where L and A are the length and area of cross section(perpendicular to heat flow), respectively, and Q isthe rate of heat flow through the material whichis assumed to be equal to the rate of heat energypumped out (P) by the Peltier cooler, by neglectingthe radial heat loss.
Normally, one end of the specimen is heated bymeans of a heater to create a temperature difference(�T) within the test length (L) and this temperaturedifference is used to calculate K using Eq. 1. How-ever, in the axial heat flow method, better accuracy isassured if the experiment is conducted at subambienttemperatures. Accordingly, in the present system theheater is replaced by a Peltier cooler to cool one end(to temperature T2), while the other end is kept at theambient temperature (T1). The rate of heat removalby the cooler is estimated as Q (equal to power P inFig. 10).
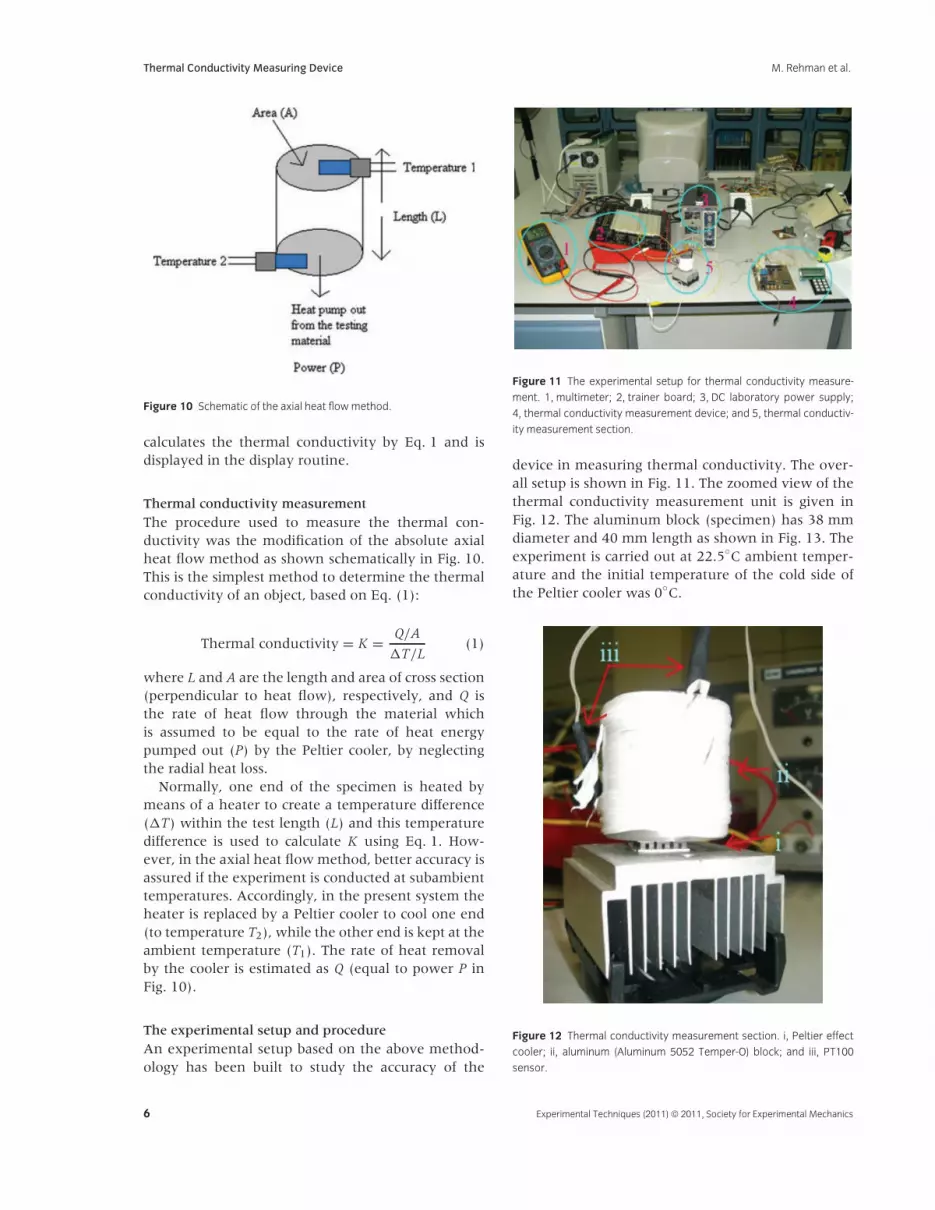
The experimental setup and procedure
An experimental setup based on the above method-ology has been built to study the accuracy of the
Figure 11 The experimental setup for thermal conductivity measure-
ment. 1, multimeter; 2, trainer board; 3, DC laboratory power supply;
4, thermal conductivity measurement device; and 5, thermal conductiv-
ity measurement section.
device in measuring thermal conductivity. The over-all setup is shown in Fig. 11. The zoomed view of thethermal conductivity measurement unit is given inFig. 12. The aluminum block (specimen) has 38 mmdiameter and 40 mm length as shown in Fig. 13. Theexperiment is carried out at 22.5◦C ambient temper-ature and the initial temperature of the cold side ofthe Peltier cooler was 0◦C.
Figure 12 Thermal conductivity measurement section. i, Peltier effect
cooler; ii, aluminum (Aluminum 5052 Temper-O) block; and iii, PT100
sensor.
6 Experimental Techniques (2011) © 2011, Society for Experimental Mechanics

M. Rehman et al. Thermal Conductivity Measuring Device
Figure 13 Dimensions of the aluminum block.
Figure 14 Fabricated thermal conductivity measurement device.
The Complete Assembly
The complete assembly of the proposed measurementsystem is shown in Fig. 14. It consists of (1) plat-inum resistance thermometer probe; (2) reset switch;(2) variable resistor; (4) LCD display; (5) keypad; and(6) PCB. The thermometer probe is 60 cm in lengthand is fabricated using a multicore wire. The multicorewire can be got from the IDE cable of the personalcomputer. The reset switch is used to reset the system.The variable resistor is used to change the contrastof the LCD display. The reset switch and variable resis-tor are put outside the PCB because it is convenientfor user when the PCB is fixed in a perspex box infuture. The LCD display and keypad are connected to
PCB through the IDE multicore cable which is easyto bend and is more wearable. The whole assemblyhas been accommodated in a compact, durable, andattractive casing.
Performance Testing and Results
Transient response test
The device is tested for its transient response whichis the response of temperature reading over testedtime. This is done using the PT100 sensor to measurea known temperature and noting the time taken togive the temperature reading. The test was conductedfor two known temperatures of water 64 and 57◦C ata room temperature of 31◦C. The results are shownin Figs. 15 and 16. The results show that the responseof the device is quite good and need only about 20 sto reach the actual temperature.
Reliability and stability test
This test was done to evaluate whether the device isstable and reliable in terms of its temperature reading.The temperature reading is recorded through a periodof time and the measured temperature is comparedwith actual temperature to find its error of reading.The actual temperature was found by measuring the
Temperature Vs Time
0
10
20
30
40
50
60
70
Time (seconds)
Tem
pera
ture
(°C
)
0 5 10 15 20 25 30 35 40
Figure 15 Transient response for 64◦C.
Temperature Vs Time
0
10
20
30
40
50
60
0 5 10 15 20 25 30 35 40
Time (Seconds)
Tem
pera
ture
(°C
)
Figure 16 Transient response for 57◦C.
Experimental Techniques (2011) © 2011, Society for Experimental Mechanics 7

Thermal Conductivity Measuring Device M. Rehman et al.
resistance of the PT100 and taking the equivalenttemperature from the data table. The percentage oferror was also calculated using the formula:
Percentage of error
= |Measured Temperature − Actual Temperature|Actual Temperature
× 100% (2)
Figure 17 shows the comparison between the mea-sured and actual temperatures. It can be observedthat the temperature reading of the device is fluc-tuated between 32 and 31◦C. So the tolerance is±1.899% ≈ ±2%, which is acceptable.
Thermal conductivity
The experiment is carried out at 22.5◦C ambienttemperature and the initial temperature of the coldside of the Peltier cooler was 0◦C. The power P ismeasured as 1.895 W assuming no radial heat loss. Aand L of the specimen are 1.134 × 10⁻³ m2 and 0.4 m,respectively. Accordingly, the thermal conductivityis obtained based on Eq. 1. The result is shown inTable 1, which shows that the thermal conductivity,
Temperature Vs Time
30.4
30.6
30.8
31
31.2
31.4
31.6
31.8
32
32.2
0 10 20 30 40 50 60 70
Time (seconds)
Tem
pera
ture
(°C
)
TemperatureMeasuredIdealTemperature
Figure 17 Measured temperature and actual temperature comparison.
Table 1 Thermal conductivity measurement data
Time (min) T1 (◦C) T2 (◦C) K = 66.84�T (W/m◦C)
1 21.5 21 133.72 20.5 20 133.73 20 19.5 133.74 19 18.5 133.75 18.5 18 133.76 18 17.5 133.77 17.5 17 133.78 17 16.5 133.79 16.5 16 133.7
10 16.5 16 133.7
measured for 10 min, at 1-min interval remainssteady at 133.7 W/m◦C. This value is fairly close to theactual thermal conductivity of the specimen, that is,144 W/m◦C, the error being 7% which is acceptable.
Conclusion
A low-cost, reliable, and user-friendly electronicdevice is being developed, which can measure boththermal conductivity and temperature directly withgood accuracy. The overall cost of fabrication wasonly within 150 USD (United States dollars), whichwould be extremely cheaper than any other similarinstruments commercially available. The performanceof the device is observed satisfactory in terms of accu-racy. There is enough scope to minimize the error ofthermal conductivity measurement and to develop adurable and compact device based on the proposedmethodology. We selected only one sample; how-ever, the device may be tested further for differentmaterials and geometries. Theoretically there shouldnot be any limiting value or range for the accuracyof the device. The upper or lower limit of thermalconductivity that could be measured by the proposedinstrument depends on the size, thickness, and mate-rial of the sample. A detailed comparative study mayalso be carried out to ensure the excellence of the pro-posed method compared to the existing techniques.The following modifications are recommended forimproved performance of the system.
1. The accuracy of the temperature measurementmay be improved using higher bits conversionADC like 10 bits or 12 bits.
2. Make the device as small as possible using surfacemount technology component.
3. Use constant current source to drive the platinumresistance thermometer so as to keep its outputconsistent which is possible using Op-amp.
4. Data acquisition system (using MATLAB or VisualBasic) may be added to the device so that is can beused to record data and plot graph.
5. For thermal conductivity measurement the com-parative cut bar method may be used to producemore accurate result.
References
1. Speyer, R.F., Thermal Analysis of Materials, MarcelDekker, New York, 1994.
2. Xaman, J., Lira, L., and Arce, J., ‘‘Analysis of thetemperature distribution in a guarded hot plateapparatus for measuring thermal conductivity,’’Applied Thermal Engineering, 29(4):617–623 (2009).
8 Experimental Techniques (2011) © 2011, Society for Experimental Mechanics

M. Rehman et al. Thermal Conductivity Measuring Device
3. Huang, B.L., Ni, Z., Millward, A., McGaughey,A.J.H., et al., ‘‘Thermal Conductivity of aMetal-Organic Framework (MOF-5): Part II.Measurement,’’ International Journal of Heat and MassTransfer, 50:405–411 (2007).
4. Assael, M.J., Antoniadis, K.D., and Tzetzis, D., ‘‘TheUse of the Transient Hot-Wire Technique forMeasurement of the Thermal Conductivity of anEpoxy-Resin Reinforced with Glass Fibers and/orCarbon Multi-Walled Nanotubes,’’ Composites Scienceand Technology, 68(15–16):3178–3183 (2008).
5. Parker, W.J., Jenkins, R.J., Butler, C.P., andAbbot, G.L., ‘‘FLASH Method of DeterminingThermal Diffusivity, Heat Capacity and ThermalConductivity,’’ Journal of Applied Physics,32:1679–1684 (1961).
6. Mathis, N., ‘‘Transient Thermal ConductivityMeasurements: Comparison of Destructive andNondestructive Techniques,’’ HighTemperatures—High Pressures, 32:321–327 (2000).
7. Cahill, D.G., ‘‘Thermal Conductivity Measurementfrom 30 to 750 K: The 3ω Method,’’ Review ofScientific Instruments, 61:802–808 (1990).
8. Cahill, D.G., Katiyar, M., and Abelson, J.R.,‘‘Thermal Conductivity of a-Si:H Thin Films,’’Physical Review B, 50:6077–6081 (1994).
9. Oh, D.-W., Jain, A., Eaton, J.K., Goodson, K.E., andLee, J.S., ‘‘Thermal conductivity Measurement andSedimentation Detection of Aluminum OxideNanofluids by Using the 3-ω Method,’’ International.Journal of Heat and Fluid Flow, 29:1456–1461 (2008).
10. Govorkov, S., Ruderman, W., Horn, M.W.,Goodman, R.B. and Rothschild, M., ‘‘A New Methodfor Measuring Thermal Conductivity of Thin Films,’’Review of Scientific Instruments, 68:3828–3834 (1997).
11. Jackson, W.B., Amer, N.M., Boccara, A.C., andFournier, D., ‘‘Photothermal DeflectionSpectroscopy and Detection,’’ Applied Optics,20:1333–1344 (1981).
12. Jeona, P.S., Kima, J.H., Kimb, H.J., and Yoob, J.,‘‘Thermal Conductivity Measurement of Anisotropic
Material Using Photothermal Deflection Method,’’Thermochimica Acta, 477:32–37 (2008).
13. Calzona, V., Cimberle, M.R., Ferdeghini, C.,Putti, M., and Siri, A.S., ‘‘Fully AutomatedApparatus for Thermal Diffusivity Measurements onHTSC in High Magnetic Field,’’ Review of ScientificInstruments, 64:766–773 (1993).
14. Solorzano, E., Reglero, J.A., Rodrıguez-Perez, M.A.,Lehmhus, D., Wichmann, M., and De Saja, J.A.,‘‘An Experimental Study on the ThermalConductivity of Aluminium Foams by Using theTransient Plane Source Method,’’ InternationalJournal of Heat and Mass Transfer,51(25–26):6259–6267 (2008).
15. Kuwahara, M., Suzuki, O., Takada, S., Hata N.,Fons, P., and Tominaga, J., ‘‘Thermal conductivityMeasurements of Low-k Films Using Thermo-reflectance Phenomenon,’’ MicroelectronicEngineering, 85:796–799 (2008).
16. Hu, M., Yu, D., and Wei, J., ‘‘Thermal ConductivityDetermination of Small Polymer Samples byDifferential Scanning Calorimetry,’’ Polymer Testing,26:333–337 (2007).
17. Banaszkiewicz, M., Seweryn, K., and Wawrza-szek, R., ‘‘A Sensor to Perform In-Situ ThermalConductivity Determination of Cometary andAsteroid Material,’’ Advances in Space Research,40:226–237 (2007).
18. Tan, J.C., Tsipas, S.A., Golosnoy, I.O., Curran, J.A.,Paul, S., and Clyne, T.W., ‘‘A Steady-StateBi-Substrate Technique for Measurement of theThermal Conductivity of Ceramic Coatings,’’ Surface& Coatings Technology, 201:1414–1420 (2006).
19. Subramanian, C.S., Amer, T., UpChurch, B.T.,Alderfer, D.W., Burkett, C., and Sealey, B., ‘‘NewDevice and Method for Measuring ThermalConductivity of Thin-Films,’’ ISA Transactions,45(3):313–318 (2006).
20. Vahanyan, A.I., ‘‘A Method for the ThermalConductivity Measurement of Semiconductors,’’Measurement 39:447–450 (2006).
Experimental Techniques (2011) © 2011, Society for Experimental Mechanics 9