A measure of sustainable national income for the Netherlands
18
Ecological Economics 41 (2002) 157 – 174 ANALYSIS A measure of sustainable national income for the Netherlands Reyer Gerlagh a, *, Rob Dellink b,1 , Marjan Hofkes a , Harmen Verbruggen a a IVM/VU, Institute for Enironmental Studies, Vrije Uniersiteit, De Boelelaan 1115, 1081 HV Amsterdam, The Netherlands b Enironmental Economics Group, Wageningen Uniersity, Hollandseweg 1, 6706 KN Wageningen, The Netherlands Received 20 August 2001; received in revised form 7 January 2002; accepted 4 February 2002 Abstract We present calculations on the sustainable national income (SNI) indicator, first proposed by Hueting, which corrects net national income (NNI) for the costs to bring back environmental resource use to a ‘sustainable’ level. Using an applied general equilibrium (AGE) model specifying 27 production sectors, we calculate different variants of SNI for the Netherlands in 1990, given a set of pre-determined sustainability standards. The AGE model is extended with emissions and abatement cost curves, based on large data sets for nine environmental themes. The model combines the advantages of a top-down approach (the AGE model) with the information of a bottom-up approach (the environmental data and data on emissions reductions costs). The presented numerical results show that in 1990 Dutch SNI is about 50% below NNI, though many uncertainties are still present in the data and the model. The enhanced greenhouse effect is the most expensive environmental theme. © 2002 Published by Elsevier Science B.V. Keywords: Accounting; Economic welfare; Green GDP; Sustainable income This article is also available online at: www.elsevier.com/locate/ecolecon 1. Introduction Modern national accounting is based on the equality of total income (wages, rents, interest, and profits) and total expenditures (private and public consumption, investments, taxes, and net export spending). In principle, all measurements involved should be based on observable transac- tions in the market. However, there is a long history of critique, which argues that aggregates such as Gross Domestic Product (GDP) and Net National Product (NNP) are often used as mea- sures of welfare and that such use is incorrect and may provide policy makers with the wrong sig- nals. In a famous paper, Nordhaus and Tobin (1972) discuss several corrections of conventional NNP in an early quantitative attempt to develop a more correct Measure of Economic Welfare (MEW). Most importantly, they find that non- market activities such as leisure time substantially * Corresponding author. Tel.: +31-20-4449555; fax: +31- 20-4449553; www.vu.nl/ivm. E-mail addresses: [email protected] (R. Gerlagh), [email protected] (R. Dellink). 1 Tel.: +31-317-482009; fax: +31-317-484933; http:// www.sls.wau.nl/me/staff/dellink/dellink.htm 0921-8009/02/$ - see front matter © 2002 Published by Elsevier Science B.V. PII:S0921-8009(02)00021-6
-
Upload
independent -
Category
Documents
-
view
0 -
download
0
Transcript of A measure of sustainable national income for the Netherlands

Ecological Economics 41 (2002) 157–174
ANALYSIS
A measure of sustainable national income for theNetherlands
Reyer Gerlagh a,*, Rob Dellink b,1, Marjan Hofkes a, Harmen Verbruggen a
a IVM/VU, Institute for En�ironmental Studies, Vrije Uni�ersiteit, De Boelelaan 1115, 1081 HV Amsterdam, The Netherlandsb En�ironmental Economics Group, Wageningen Uni�ersity, Hollandseweg 1, 6706 KN Wageningen, The Netherlands
Received 20 August 2001; received in revised form 7 January 2002; accepted 4 February 2002
Abstract
We present calculations on the sustainable national income (SNI) indicator, first proposed by Hueting, whichcorrects net national income (NNI) for the costs to bring back environmental resource use to a ‘sustainable’ level.Using an applied general equilibrium (AGE) model specifying 27 production sectors, we calculate different variantsof SNI for the Netherlands in 1990, given a set of pre-determined sustainability standards. The AGE model isextended with emissions and abatement cost curves, based on large data sets for nine environmental themes. Themodel combines the advantages of a top-down approach (the AGE model) with the information of a bottom-upapproach (the environmental data and data on emissions reductions costs). The presented numerical results show thatin 1990 Dutch SNI is about 50% below NNI, though many uncertainties are still present in the data and the model.The enhanced greenhouse effect is the most expensive environmental theme. © 2002 Published by Elsevier ScienceB.V.
Keywords: Accounting; Economic welfare; Green GDP; Sustainable income
This article is also available online at:www.elsevier.com/locate/ecolecon
1. Introduction
Modern national accounting is based on theequality of total income (wages, rents, interest,and profits) and total expenditures (private andpublic consumption, investments, taxes, and netexport spending). In principle, all measurements
involved should be based on observable transac-tions in the market. However, there is a longhistory of critique, which argues that aggregatessuch as Gross Domestic Product (GDP) and NetNational Product (NNP) are often used as mea-sures of welfare and that such use is incorrect andmay provide policy makers with the wrong sig-nals. In a famous paper, Nordhaus and Tobin(1972) discuss several corrections of conventionalNNP in an early quantitative attempt to developa more correct Measure of Economic Welfare(MEW). Most importantly, they find that non-market activities such as leisure time substantially
* Corresponding author. Tel.: +31-20-4449555; fax: +31-20-4449553; www.vu.nl/ivm.
E-mail addresses: [email protected] (R. Gerlagh),[email protected] (R. Dellink).
1 Tel.: +31-317-482009; fax: +31-317-484933; http://www.sls.wau.nl/me/staff/dellink/dellink.htm
0921-8009/02/$ - see front matter © 2002 Published by Elsevier Science B.V.
PII: S0 921 -8009 (02 )00021 -6

R. Gerlagh et al. / Ecological Economics 41 (2002) 157–174158
contribute to welfare but do not show up in theaccounting aggregates. Of special relevance for thispaper, they also correct income for environmentaldamage costs, and more explicitly for the disameni-ties of urbanization. Nordhaus and Tobin find thatfor the period 1929–1965 per capita MEW grew by1.1% per year, 0.6%-points slower than per capitaNNP. They conclude that the NNP is an acceptablemeasure, not precisely fitting welfare, but describ-ing the magnitude of growth correctly.
Daly and Cobb (1989) further elaborated uponthe concept to take better account of environmentaldamages and social inequity, presenting the Indexof Sustainable Economic Welfare (ISEW). Theyfind for the period 1951–1986 an increase of the percapita ISEW of 0.53% per year, as opposed to aGDP growth of 1.9% per year. Notably, the ISEWdeclined during the 1980s, whereas the GDP levelcontinued its growth. Thereby, Daly and Cobbmake the point, contrary to Nordhaus and Tobin,that common aggregates such as GDP are not goodmeasures of welfare and are misleading when usedfor evaluating economic growth. Since then, therehave been many environmental accounts, most ofthem focusing on valuing environmental damages;we mention Repetto et al. (1989), Castaneda, 1999;Cruz and Repetto (1991, 1992) and more recently,Thampapillai and Uhlin (1997), Liu (1998), Torras(1999). In these studies, a typical finding is thatnumerical results strongly depend on assumptionson both the future valuation of environmentalresources and the future substitutability betweenman-made goods and environmental goods.2 As itstands, there is still no set of commonly acceptedassumptions that provide the researchers withguidelines for empirical analyses in this field.
A number of authors have examined the assess-ment of sustainable national income (SNI) from atheoretical perspective. Often, a reference is madeto Hicks (1948) early definition of sustainableincome as the maximum value that a man canconsume in one period without impoverishing him-self. Two famous contributions following up onHicks’ analysis are Weitzman (1976), who showed
equivalence between the net product (consumptionplus net investments) and sustainable income, andHartwick (1977), based on Solow (1974), who madeclear that a non-decreasing consumption flow re-quires a non-negative net investment flow. How-ever, their results require strong assumptions to befulfilled and break down with multiple consumers,non-constant time preferences, technologicalchange and distortionary taxes (Withagen, 1998).
This is something of a paradox. The analyticalstudies show us how to calculate sustainable in-come in a perfect competitive world without exter-nalities, but the very reason for constructing asustainable income measure is that it is believedthat the current economy is far from such anefficient path (Aaheim and Nyborg, 1995). Uncer-tainty adds to the problem. Most of the analyzesassume perfect foresight, that is, all relevant aspectsof the future are known today with certainty. Yeteven if there were a complete understanding of theeconomic and physical mechanisms at play, nounique future and no unique sustainable incomewould exist. For example, variations in the distribu-tion of property rights for goods that are currentlynot in the market can cause substantial variationsin equilibrium allocations and prices, see Howarthand Norgaard (1992), Gerlagh and Keyzer (2001),Gerlagh and van der Zwaan (2001). In short, theseformal results are less useful when policy makersask for applied numerical calculations that can helpthem in developing sustainability policies (Huetingand de Boer, 2001). Further comments on greenaccounting estimates can be found in (Aronssonand Lofgren 1998; Holub et al., 1999; Nordhaus etal., 2000; Van Ierland et al., 2001).
In this paper, we present calculations forHueting’s (1980, 1992, 1995) SNI indicator, a‘green’ income measure that avoids problems re-lated to an uncertain future, and specifically touncertain future preferences. Hueting suggests thatwe should assume an absolute preference for con-servation of the natural environment. He arguesthat under this assumption, the value of environ-mental degradation is equal to the conservationcosts, i.e. the costs to preserve the environmentand remove existing environmental burden. Inthis sense, the SNI indicator resembles the
2 See Gerlagh and van der Zwaan (2000) for an analyticalstudy on the topic of substitutability and environmental valua-tion.

R. Gerlagh et al. / Ecological Economics 41 (2002) 157–174 159
maintenance cost approach (UN, 1993). The em-phasis on resource conservation, and the determi-nation not to count revenues from resourcedepletion as income, gives the SNI indicator aflavor of the strong sustainability paradigm. In thecontext of accounting systems, El Serafy (2001)opposes this position. Alternatively, he asserts thatrevenues from resource depletion are to be countedas income, but that this income should be dis-tributed over present and future generationsequally, an approach labeled the ‘user cost method’(Ahmad et al., 1989). In this paper, we will not givea full account of the differences in underlyingpresumptions, but we confine ourselves to the notethat the SNI indicator will typically calculate alower income value then the user cost method, thedifference in value dependent on the speed ofresource depletion.
The gap between the NNI and the SNI levelmeasures the dependence of the economy on thatpart of its natural resource use that exceeds thesustainable exploitation levels. If the NNI levelincreases substantially while the SNI level increasesless, that is if the gap between the two measuresincreases over time, it follows that the basis foreconomic growth is unsustainable. Growth is thenmainly driven by an increase in natural resourceuse, and the dependence of the economy on over-exploitation of natural resources increases. On theother hand, if the gap between the NNI level andthe SNI level decreases over time, this points to adecrease in the economy’s over-dependence onnatural resources. For policy makers, who aremainly interested in the economic and politicalfeasibility of environmental regulation, an increasein the gap signifies that an increasing effort will berequired to implement actual sustainability mea-sures, while a closing of the gap indicates a decreasein the economy’s dependence on natural resources.In this sense, the dynamics of the SNI vis-a-vis theNNI is of apparent relevance for actual environ-mental policy.3
From a methodological point of view, we candistinguish two steps in making the calculations ofa SNI indicator. First, sustainable resource use isdefined and compared with actual resource use.This procedure is based on insights from naturalsciences (Hueting and Reijnders, 1998).4 Second,direct and indirect changes in income caused by therequired changes in resource use are calculated byuse of an economic model such as an AppliedGeneral Equilibrium (AGE) model. The secondstep is familiar to many economic analysts. How-ever, it requires an extension of the standard AGEmodel to account for the specific data on theinteraction between environmental and economicvariables. And in this respect, our analysis alsocontributes to the literature as we describe and usea new methodology for incorporating extensivebottom-up data on abatement costs for variousenvironmental themes within a top-down generalequilibrium model.
Yet we emphasize that our motivation andinterpretation of results differs in an important wayfrom common exercises with AGE models. Ingeneral, AGE models are used to calculate econ-omy-wide consequences of specific policy instru-ments, for example energy taxes or carbon emissiontaxes, which aim at achieving certain environmen-tal objectives, e.g. Jorgenson and Wilcoxen(1993a,b), Boyd and Uri (1991). In such a context,the AGE model is used to test the economicfeasibility of specific policy instruments. Accord-ingly, a change in gross output of 1 or 2% of GDPis considered substantial. If we were to interpret ourcalculations as a standard policy analysis, we wouldsay that we simulate an economy that movestowards a strong sustainability policy where re-source use is substantially reduced, and we are notto be surprised if gross output and income decreaseby 10, 20%, or even more. But we do not exercisea standard environmental policy analysis; we donot suggest that the immediate reduction of re-source use that lies at the basis of
4 It should be noted that the assessment of the sustainablelevel of resource use, which we label sustainability standards,falls outside the scope of this study. We consider the sustain-ability standards as given and thus exogenous to our modelcalculations.
3 To be sure, we do not intend to discuss the fundamentalquestion whether continued economic growth can go togetherwith sustainable resource use, or that this is essentially impos-sible. In this paper, we do not take a position on this subject.

R. Gerlagh et al. / Ecological Economics 41 (2002) 157–174160
our calculations is politically feasible. Instead, weuse the model to calculate a measure of adjustedincome, the SNI according to Hueting.
In Section 2, we present the model. It has 27sectors, it describes nine environmental themes,and it includes abatement cost curves, based onlarge data sets and describing the direct costs persector of resource reduction, for all environmentalthemes. In Section 3, we elaborate on the method-ological choices and modeling assumptions thatare required. In Section 4, we present the numeri-cal results. We analyze the sensitivity of our re-sults regarding several assumptions, and wepresent a break up of the sustainable incomealong lines of sectors, production factors, andexpenditures. In Section 5, we conclude. A com-prehensive description of the model, its assump-tions and calibration, and the results can be foundin Gerlagh et al. (2001), Dellink et al. (2001) andVerbruggen et al. (2001), respectively.
2. Model set up and calibration
2.1. Description of the model
Initially, Hueting (1980) expected that the cal-culation of his sustainable income measure couldbe achieved by use of purely statistical methods.He gathered that it was sufficient to collect dataon the opportunities to reduce environmental re-source use, either through technical measures orthrough the reduction of through-put, which helabeled volume measures. However, the magni-tudes of changes in allocations are too substantialfor such a statistical approach. If environmentallosses have to be prevented or restored, an en-tirely different economic structure results. Wethen envisage a hypothetical sustainable economywith a hypothetical income. This can only beapproached through model calculations. For thatpurpose, a static AGE model for the Dutch econ-omy has been constructed to calculate a SNIindicator.
The model has 27 sectors, and is extended toaccount for the use and abatement of nine envi-ronmental themes. The SNI–AGE model iden-tifies domestically produced goods by the sectors
where these goods are produced. There are twoprimary production factors, labor and capital.5
The model distinguishes three consumers: the pri-vate households, the government, and the Rest ofthe World (ROW). In addition to these producersand consumers, there are several auxiliary agentsthat are necessary to shape specific features of themodel. In order to capture non-unitary incomeelasticities in the model, the consumption of theprivate households is split into a ‘subsistence’ anda ‘luxury’ part. There is an ‘investor’ who de-mands investment goods necessary for economicgrowth, and a ‘capital sector’ which fabricates thecomposite capital good. Trade is modeled usingthe Armington specification for imports and aConstant Elasticity of Transformation (CET) pro-duction structure for sectors producing for boththe domestic and the world market.6 Besides themodel elements mentioned above, common tomany other AGE models, the model distinguishesenvironmental themes such as the enhancedgreenhouse effect and acidification. With each ofthe environmental themes, emission units are as-sociated, e.g. greenhouse gas emissions are ex-pressed in CO2 equivalents.
The overview of the relationships in the modelis presented in Fig. 1. In the figure, black arrowsrepresent commodity flows that are balanced byinverse income flows; gray arrows represent pureincome transfers that are not balanced by com-modity flows.
Demand and supply meet on the markets forgoods and factors. The private consumers supplyendowments (labor), which are used as inputs forthe producers. The producers supply output ofproduced goods, which balances consumption by
5 In fact, capital is produced. The model accounts formaintenance costs and net investments.
6 The CET production function is used for production pro-cesses with multiple output goods. In analogy to the CESproduction function, it is assumed that the relative change inoutput for the various output goods is proportional to therelative change in prices. For example, if there are two goodsand their initial output levels are the same, then if the price ofthe first good increase by 1%, the relative output level of thefirst good will increase with �%, where � is the elasticity oftransformation parameter.

R. Gerlagh et al. / Ecological Economics 41 (2002) 157–174 161
Fig. 1. Overview of SNI–AGE model.
the private and public consumer and inputs forgross investments. Part of these investmentsreflects the depreciation of the capital stock, theremaining part, net investments, is used to sustaineconomic growth in the next period. The figurealso shows the market for emission units, suppliedby the government in an amount that is consistentwith the sustainability standards. Hence, the rev-enues from the sale of emission units enter thegovernment budget.
The government levies taxes on consumption(VAT), the supply of endowments (labor incometax), and capital use (profit income tax). Thesepublic revenues balance, together with revenuesfrom the sale of emission units, the public expen-ditures that consist of public consumption andlump sum subsidies for social security. Consumersspend their income from the sale of endowmentsand lump sum subsidies on consumption and netsavings. Net savings are transferred to the ‘in-vestor’, who spends it on the consumption ofcapital goods (thus: savings equal investments).
Production technologies are assumed to haveconstant returns to scale, which implies thatprofits, apart from a rate of return on capital, arezero, and hence, that the value of inputs is equalto the value of outputs. In Fig. 1, this is visualizedby placing a gray box around the agents, overwhich the net income and expenditure flows sumto zero. The same applies to clearing markets,
where (the value of) total supply matches totaldemand. This is visualized by a gray ellipse.
By a careful examination of the income flows inFig. 1, we find that the budgets close, except forthe budget balances of the private and publicconsumers. This is due to the omission of interna-tional trade from the figure. For the domesticeconomy as an entity, the budget surplus is equalto the surplus on the trade balance, representedthrough the well-known identity Y=C+I+(X−M), where Y−C−I is the income surplusof the consumers compared to the expenditureson consumption and investments, and (X−M) isthe surplus of export compared to the imports. Ofcourse, in case of a budget deficit the oppositeholds.
2.2. Calibration of the model
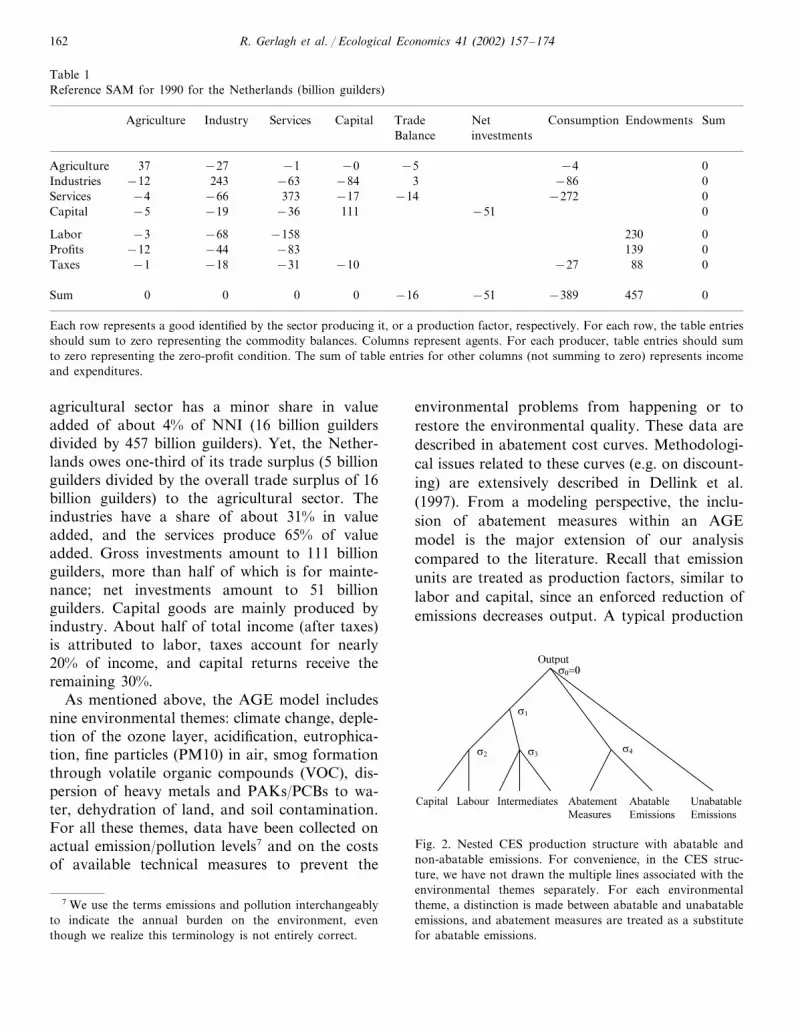
The model is calibrated using historical data for1990 for the Netherlands, provided by De Boer(2002). The main data source is the NAMEAaccounting system (Keuning, 1993), which cap-tures both the economic and environmental ac-counts. To save space, we present a condensedSocial Accounting Matrix (SAM) in Table 1. NetNational Income (NNI) at market prices amountsto 457 billion guilders. The value of goods pro-duced by the agricultural sectors amount to 37billion guilders, of which 21 billion guilders ac-counts for the value of inputs, and 16 billionguilders (3+12+1) is labeled value added. The
R. Gerlagh et al. / Ecological Economics 41 (2002) 157–174162
Table 1Reference SAM for 1990 for the Netherlands (billion guilders)
Net EndowmentsAgriculture Industry Services ConsumptionCapital Trade SumBalance investments
0Agriculture −437 −27 −1 −0 −5−86 0Industries −12 243 −63 −84 3
0Services −4 −66 −272373 −17 −14Capital −5 −19 0−36 111 −51
230 0Labor −3 −68 −158139Profits −12 −44 −83 0
0Taxes −1 −18 −27−31 88−10
−389 457Sum 0 0 0 0 0−16 −51
Each row represents a good identified by the sector producing it, or a production factor, respectively. For each row, the table entriesshould sum to zero representing the commodity balances. Columns represent agents. For each producer, table entries should sumto zero representing the zero-profit condition. The sum of table entries for other columns (not summing to zero) represents incomeand expenditures.
agricultural sector has a minor share in valueadded of about 4% of NNI (16 billion guildersdivided by 457 billion guilders). Yet, the Nether-lands owes one-third of its trade surplus (5 billionguilders divided by the overall trade surplus of 16billion guilders) to the agricultural sector. Theindustries have a share of about 31% in valueadded, and the services produce 65% of valueadded. Gross investments amount to 111 billionguilders, more than half of which is for mainte-nance; net investments amount to 51 billionguilders. Capital goods are mainly produced byindustry. About half of total income (after taxes)is attributed to labor, taxes account for nearly20% of income, and capital returns receive theremaining 30%.
As mentioned above, the AGE model includesnine environmental themes: climate change, deple-tion of the ozone layer, acidification, eutrophica-tion, fine particles (PM10) in air, smog formationthrough volatile organic compounds (VOC), dis-persion of heavy metals and PAKs/PCBs to wa-ter, dehydration of land, and soil contamination.For all these themes, data have been collected onactual emission/pollution levels7 and on the costsof available technical measures to prevent the
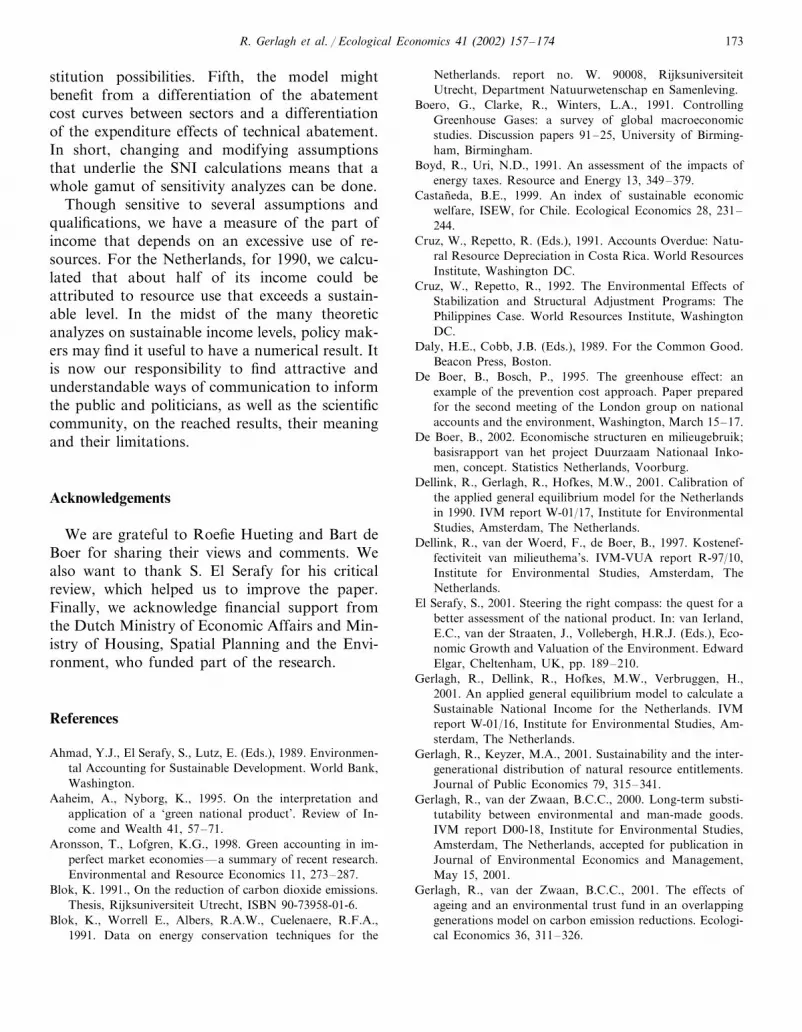
environmental problems from happening or torestore the environmental quality. These data aredescribed in abatement cost curves. Methodologi-cal issues related to these curves (e.g. on discount-ing) are extensively described in Dellink et al.(1997). From a modeling perspective, the inclu-sion of abatement measures within an AGEmodel is the major extension of our analysiscompared to the literature. Recall that emissionunits are treated as production factors, similar tolabor and capital, since an enforced reduction ofemissions decreases output. A typical production
Fig. 2. Nested CES production structure with abatable andnon-abatable emissions. For convenience, in the CES struc-ture, we have not drawn the multiple lines associated with theenvironmental themes separately. For each environmentaltheme, a distinction is made between abatable and unabatableemissions, and abatement measures are treated as a substitutefor abatable emissions.
7 We use the terms emissions and pollution interchangeablyto indicate the annual burden on the environment, eventhough we realize this terminology is not entirely correct.

R. Gerlagh et al. / Ecological Economics 41 (2002) 157–174 163
Fig. 3. Iso-output curve: the trade off between abatement andemissions.
The CES approximation of the abatement costcurve turns out to fit the data well. As an exam-ple, we describe the cost curve for greenhousegases (GHG). The GHG that cause climaticchange are mainly carbon dioxide (CO2), meth-ane, nitrous oxides, and CFCs and halons. Theeffects of these substances on climate change, aswell as the duration of their effects, vary. The wayin which these GHGs can be aggregated into CO2
equivalents is not unambiguous, but depending onthe mix of emissions (and emission reductions).The coefficients that were chosen to aggregate theGHGs into CO2 equivalents are based on long-term Global Warming Potentials and are de-scribed in De Boer and Bosch (1995). Technicalmeasures and costs to reduce fossil fuel use, andthus CO2 emissions, were taken from theICARUS database (Blok, 1991; Blok et al., 1991),which comprises about 300 measures, rangingfrom more efficient energy use and co-generationto local solar power systems, and from theMARKAL model (Okken, 1991; Okken et al.,1992). Measures to reduce methane emissionswere collected from various sources (see De Boerand Bosch, 1995) and comprise changes in thecomposition of animal fodder, more efficient useof manure, measures in the production and distri-bution of natural gas, and measures at wastedumps. The measures of changing animal fodderand of more efficient management of manure arealso effective for reduction of nitrous oxides. Andthe measures to reduce CFCs and halons consistof replacing them by HCFCs (with much lowerwarming potential) or by other substances(VROM, 1994, 1998).
structure employed in the model is presented inFig. 2. Capital and labor are combined in acapital– labor composite good, with substitutionelasticity �2. The values for the elasticities arebased on the Dutch TaxInc model (Keller, 1980;Statistics Netherlands, 1990) and are sector spe-cific. The values for �2 range from 0 to 0.9.Intermediates are combined into one compositeintermediate good, with substitution elasticity �3,the value of which is typically in the same rangeas �2. The capital– labor composite and compositeintermediate good are combined to produce thesector specific output good, with elasticity of sub-stitution �1, the value of which lies in the rangebetween 0 and 2. Some fraction of sectoral emis-sions cannot be reduced through technical mea-sures. These ‘non-abatable’ emissions areproportional to output, and enter the nested CESstructure at the highest level, at which there areno substitution possibilities. The remaining partof emissions is ‘abatable’, that is, they decrease ifthe input of abatement goods is increased. Inmodeling terms, abatement measures are a substi-tute for the abatable emissions; the substitutionelasticity is denoted by �4.
Viewed from another perspective, we can drawthe so-called iso-output curve that portrays thetrade off between abatement measures and abat-able emissions, given a fixed output level (Fig. 3).By definition, the mirror image of the iso-outputcurve is the abatement cost curve. Abatementcosts increase if the emission level has to decrease.The slope of the curve represents the marginalcosts of technical options that are open to theagents for reducing their emission levels. Fig. 4. Total annual costs of reduction of GHG.

R. Gerlagh et al. / Ecological Economics 41 (2002) 157–174164
Table 2Sustainability standards for the Netherlands, 1990
Sustainability standardEnvironmental theme Reduction (%)Unit Base 1990
Greenhouse effect bln kg CO2-eq 251 198 (−79%)539.8 (−94%)Ozone depletion mln kg CFC11-eq 0.510.4
10.0 28.4 (−74%)Acidification bln Acid eq 38.4184 (−59%)Eutrophication mln kg P−eq 312 128
Fine particles in air 200 (−46%)mln kg PM10 24044020Smog formation 24 (−55%)mln kg NMVOS 44
121 (−62%)Dispersion to water billion AETP eq 194 73Dehydration 100 (−100%)% affected area 0100Soil contamination c contaminated sites 600,000 600,000 (−100%)0
Fig. 4 shows the resulting abatement costscurve. Data collected from the database of techni-cal measures are plotted as diamonds and anestimated approximation through a CES curve isplotted as a solid line.8 As the figure shows, theapproximation fits well. For the other environ-mental themes, a similar procedure is followed.
Table 2 presents the sustainability standards forthe various environmental themes which functionas a reference for the alternative SNI calculations.Comparing the required reduction with availablereduction measures as presented in Fig. 4 forGHG, we see that of the 198 bln kg CO2 equiva-lents, only about 90 bln kg can be realizedthrough technical measures. The remainder of thereduction has to be realized through a restructur-ing of the economy.
3. Methodological choices and assumptions
Given the AGE model, calculation of the sus-tainable income follows the same procedure as aclassic policy analysis, in which one studies theconsequences of a policy that strictly observesenvironmental sustainability standards. It is thennecessary to make assumptions as to the timescale (e.g. static versus dynamic modeling), transi-tion costs, labor market, international trade, emis-sion reduction measures, ‘double counting’,private consumption and government budgets.
Below, we briefly explicate the choices made. Wehave to be aware that results may significantlydepend on the actual assumptions. It is thus notpossible to speak of the result as the unique SNI;preferably, we speak of a SNI calculation.
Correcting NNI for environmental losses ismeant to be a strictly static approach and wetherefore use a static general equilibrium model.The SNI calculations are not burdened with othercosts than environment-related loss of functions.To arrive at a sustainable economy in the realworld, a drastic restructuring and reallocation ofeconomic activities has to take place. This in-evitably involves a premature write-off of capitalgoods (transition or adaptation costs). However,these non-environment-related costs do not enterthe SNI. In a way of speaking, it is assumed thatthe change to a sustainable economy is foreseen inadvance, long enough that economic agents areable to integrate this transition in the planning oftheir investment decisions. By this way of reason-ing, it is implicitly assumed that the early an-nouncement enhances the substitution possibilitiesin the economy. This, in turn, should be expressedby applying medium to long-term substitutionelasticities in the model calculations, instead ofshort-term elasticities, which are common in staticmodeling. However, long-term substitution elas-ticities are not readily available for the Dutcheconomy. As it presently stands, elasticities of arather short to medium-term nature are applied.
The already mentioned premise that in the cal-culation of a SNI only environmental losses areconsidered as relevant corrections also means that
8 The database contains 332 measures; each tenth is plottedas a diamond.

R. Gerlagh et al. / Ecological Economics 41 (2002) 157–174 165
influences from the labor market on the SNI, be itpositive or negative, should be neglected. Accord-ing to Hueting, a sustainable economy will cer-tainly not worsen the employment situation. Weassume employment neutrality, through an exoge-nously given, inelastic, labor supply, and clearingmarkets through an adjusting wage rate.
To calculate a SNI for a particular country,assumptions have to be made with respect topolicies in the rest of the world. This is especiallyrelevant for a small and open economy such asthe Netherlands, as a unilateral sustainability pol-icy could cause a major international reallocationof relatively environment-intensive production ac-tivities. We assume that similar sustainabilitystandards are applied all over the world, takingdue account of local differences in environmentalconditions. However, it is not feasible to estimatethe resulting costs and changes in relative prices inother countries. Instead, we have to make somesimplifying assumptions, and in the results pre-sented in this paper, we calculate two variants.The first variant abstracts from changes in priceson the world market. As relative prices in theNetherlands change, it becomes feasible for theNetherlands to partly reach its sustainability stan-dards by importing relatively environment-inten-sive products, whose cost of production increaserelatively much in the Netherlands, and by ex-porting less environment-intensive products,whose cost of production will relatively decreasein the Netherlands. The second variant assumesprice changes on the world market proportionalto price changes in the Netherlands. This variantimplies a more stringent restructuring of theDutch economy, as shifting environmental prob-lems abroad is no longer possible.
In the same international context, we have tospecify an assumption concerning the trade bal-ance. In the AGE model, the standard macro-eco-nomic balance equations apply so that the sum ofthe public and private savings surpluses (ordeficits) equals the trade balance surplus (ordeficit). The savings surplus is assumed to consti-tute a constant share of NNI. This, in turn,determines the trade balance through adjustingthe exchange rate.
In addition to correcting NNI for the cost oftechnical and volume measures to meet the sus-tainability standards, NNI should also be cor-rected for so-called double counting. Doublecounting refers to the expenditures on compensa-tory, restoratory and preventive measures to re-es-tablish or maintain environmental functions,sometimes denoted as defensive measures. Ac-cording to Hueting and many others, these expen-ditures wrongly enter NNI as value added: theearlier loss of environmental functions was notwritten off, whereas restoration is written up. Thisline of reasoning can indeed be maintained in casedefensive measures are taken in the sphere ofconsumption, not entering a production processas intermediate input. In our SNI calculations, thecost to reduce dehydration and the clean up ofcontaminated soils are double counting cases.
For cleaning up soils that are contaminated inthe past, it seems fair to adjust past income forthe costs, and not to adjust current income. It isnot obvious which procedure to follow, and wedecided to use an ad-hoc solution. It is assumedthat the total cost of soil clean up (estimated toamount to 408 billion guilders) is borne by thegovernment. This can in all fairness not becharged to one particular year. Therefore, it isassumed that the soil clean-up activities arespread over a 20 years period. Each year, 5% ofthe total cost for soil clean up is contracted outand entered in the SNI calculations as a yearlydeduction of government income. The reductioncost of dehydration are also assumed to befinanced out of, and likewise deducted from, thegovernment budget and amount to 550 millionguilders on a yearly basis.
Since sustainable income will be substantiallybelow current income, and prices will substan-tially change, assumptions have to be made aboutthe economic behavior of consumers. In themodel, the effects of lower overall income levelsare approached by the use of different incomeelasticities for different consumer goods. Demandfor agricultural products decreases less than pro-portional, demand for services decreases morethan proportional, and the demand elasticity formanufactured products depends on the stage ofincome. In this way, consumption is thought of as

R. Gerlagh et al. / Ecological Economics 41 (2002) 157–174166
consisting of necessary goods for subsistence andluxury goods. If income falls, the consumption ofnecessary goods will remain relatively stable,which is compensated by a more than propor-tional decrease in the consumption of luxurygoods. For each consumption good in the model,an income elasticity is specified.
Moreover, relative price changes will affect con-sumption patterns, which will become more sus-tainable. In addition to income substitutioneffects, the model includes price elasticities. Ingeneral, the consumption of environment-inten-sive goods will decrease, whereas less environ-ment-intensive goods and services will show anincrease in relative consumption levels. It is as-sumed that private consumers have more substitu-tion possibilities than the public consumer (thegovernment), whose demand is determined bypublic services that have to be supplied.
In line with the neglect of transition costs andemployment neutrality, the government is sup-posed to obey budget neutrality. It is assumedthat the government is the owner of the environ-mental functions, constraining their use to a sus-tainable level. The use of these functions shouldbe paid for. Emissions to the environment arethus considered as public endowments, and asthese emissions are constrained by sustainabilitystandards, the value that is imputed in the contextof the modeling exercise entirely accrues to thegovernment. Put differently, the government sellsemission permits of which the price is endoge-nously determined in the model. To guaranteebudget neutrality, the revenues from the sale ofemission permits are recycled by a linearly homo-geneous reduction of taxes. In case revenues fromemission permits exceed the government budget,the surplus will be redistributed to private house-holds through a lump sum subsidy.
Finally, we have to explicate the use of pricesfor income measurement. This is not so much amodeling assumption, as well a matter of presen-tation. In a statistical calculation of sustainableincome, the correction of NNI is expressed inmarket or shadow prices. If, however, SNI calcu-lations are made with the help of an AGE model,relative prices change, i.e. prices of environment-intensive products increase compared to other
products. In all figures and tables below, we usethe Paasche price indexing. Values are calculatedby using prices of the new equilibrium, and pricesare scaled such that the value of consumption inthe reference case measured in new prices equalsthe value of consumption at old prices.
4. Numerical results
Table 3 presents the macro-economic results ofthe two SNI variants in comparison with thereference NNI situation. The table shows howNNI can be broken up in three different ways.First, expenditures are partitioned in private andpublic consumption, net investments, and thetrade balance. This break up corresponds to thevarious columns in the right half of the SAM(Tables 1, 4 and 5). Second, national product ispartitioned along the different sectors contribut-ing to the value added. This break up correspondsto the various columns at the left half of theSAM. The row entry ‘other’ in Table 3 corre-sponds to the capital and abatement sector, andto taxes and emission permits paid for directly byconsumers. Third, NNI is partitioned by incomesource: labor, capital, income from taxes, andincome from the sale of emission permits. Thisbreak up corresponds to the various rows in thelower half of the SAM. The last two divisions ofSNI have to be corrected for double counting (seeSection 3).
SNI variant 1 (with constant relative worldmarket prices) is 47% below NNI in the basesituation, whereas SNI variant 2 (with world mar-ket prices changing proportionally to domesticprices) is 56% lower. The extent to which SNIdrops is thus significantly determined by the spe-cification of international trade. The sustainableeconomy shows drastic compositional changes.This is particularly due to the imputed prices foremission permits.
The consumption of private households de-creases substantially in both variants, indicatingthat the sustainability policy not only affects thecomposition of the economy, but also the overalllevel of activity. The drop in private consumptionis however smaller than the drop in national

R. Gerlagh et al. / Ecological Economics 41 (2002) 157–174 167
income, as the private households have some pos-sibility to redirect their expenditures to less envi-ronment-intensive products. The decrease ingovernment consumption is larger than for theprivate households, even though the assumption ismade that the relative decrease in the size of thegovernment is equal to the relative decrease in theconsumption of private households. The largerdecrease for the government is caused by thechanges in relative prices, which affect the govern-ment (with its large demand share of services)differently from the private households.
Another common finding for both variants isthat, of the distinguished expenditure categoriespresented in Table 3, net investments, i.e. invest-ments in addition to replacement investments,decrease most sharply. This can be explained by areallocation of production from relatively envi-ronment-intensive sectors, which are on averagealso relatively capital-intensive, to cleaner andmore labor-intensive sectors, such as services. Thelower net investment share in SNI implies that theupward pressure on capital demand stemmingfrom increased abatement activities is more thanoffset by a fall in capital demand due to thisreallocation. All this results in a decreasing capitalstock. Another way to look at this is that con-
sumers shift part of their income from savings toconsumption in order to maximize their utility.
Perhaps remarkably, we find the sharpest de-crease in value added in the services sector, whichis the sector with lowest emission intensity. Incontrast, the agricultural sector shows virtually nodecrease in its value added, despite its intensiveuse of natural resources. This finding is the resultof two opposite effects. Though the volume ofoutput in agriculture decreases sharply (by 60%,not presented in this paper), its price level in-creases by roughly the same amount since agricul-tural goods have a low income elasticity. We alsonotice that almost the entire value added in theagricultural sector stems from the use of emissionpermits, which is considered a primary productionfactor (Tables 4 and 5). In the same line ofreasoning, we can explain that the value of con-sumption of agricultural goods increases from 4to 6 billion guilders (compare Table 1 with Table4 below). The opposite effects occur for services,where we find modest decreases in output levelscombined with strongly decreasing relative prices.For completeness, we also notice that the lastrow, labeled ‘double counting’, describes that partof value added that the government spends on thereduction of dehydration and soil clean up.
Table 3Macro-economic results (billion guilders)
SNI, variant 2 change (%)NNI SNI, variant 1 change (%)
201.4 (−56%)Expenditures 456.7 241.4 (−47%)314.0Private households consumption 187.9 (−40%) 159.4 (−49%)
Government consumption 75.1 23.5 (−69%)30.2 (−60%)51.5 10.9 (−79%)Net investments 14.2 (−72%)16.2Trade balance 9.0 (−44%) 7.7 (−53%)
456.7Value added 241.4 (−47%) 201.4 (−56%)15.9Agricultural production 15.9 (0%) 23.8 (+49%)
95.7 (−27%) 91.5 (−30%)Industrial production 130.8273.1Services production 118.2 (−57%) 81.2 (−70%)
36.3 (−1%) 29.1 (−21%)Other 36.9Double counting −24.2−24.80.0
241.4 (−47%) 201.4 (−56%)456.7Income sources56.9 (−75%) 30.7 (−87%)Labor 229.6
139.5Capital 38.5 (−72%) 29.5 (−79%)87.7 0.0 (−100%)Income from taxes 0.0 (−100%)
165.4170.7Emission permits 0.00.0Double counting −24.8 −24.2

R. Gerlagh et al. / Ecological Economics 41 (2002) 157–174168
Tab
le4
SAM
for
SNI
vari
ant
1(b
illio
ngu
ilder
s)
Cap
ital
Aba
tem
ent
Tra
deB
alan
ceN
etin
vest
men
tsC
onsu
mpt
ion
End
owm
ents
Sum
Indu
stry
Serv
ices
Agr
icul
ture
−0
2−
60
Agr
icul
ture
−17
22−
114
−74
0−
22In
dust
ries
−26
−21
134
−4
−25
−10
2Se
rvic
es−
00
−14
153
−5
−7
−14
0−
131
−11
−5
Cap
ital
Aba
tem
ent
−0
−26
0−
2−
231
−0
−1
570
−14
−42
Lab
or39
0P
rofit
s−
25−
12−
2T
axes
0
−35
.017
0.5
−52
.00
−70
.0−
13.5
GH
Gs
0.0
0O
zone
−0.
0−
0.0
0.2
0−
0.0
−0.
0A
cidi
ficat
ion
0.0
0E
utro
phic
atio
n−
0.0
PM
100.
00
−0.
00.
00
Smog
Dis
pers
ion
0.0
0−
0.0
00
−9
−14
−24
326
60
Sum
00
0
Inco
mpa
riso
nw
ith
the
refe
renc
eSA
M(T
able
1),
the
SAM
for
the
SNI
has
addi
tion
alro
ws
for
abat
emen
tac
tivi
ties
and
for
the
emis
sion
perm
its.
Whe
nco
mpa
ring
the
SAM
wit
hth
ere
sult
spr
esen
ted
inT
able
3,no
tice
that
beca
use
ofdo
uble
coun
ting
,th
eex
pend
itur
esan
dth
eva
lue
ofen
dow
men
tsin
the
SAM
amou
ntto
266
billi
ongu
ilder
s,th
atis
241
plus
25bi
llion
guild
ers
asde
fens
ive
expe
ndit
ures
are
capt
ured
aspa
rtof
the
cons
umpt
ion
colu
mn
(not
ably
the
cons
umpt
ion
ofab
atem
ent
good
s).
Em
pty
cells
refle
ctei
ther
cells
that
are
abse
ntor
zero
;ce
llen
trie
s‘−
0.0’
indi
cate
smal
lno
n-ze
rova
lues
.F
orth
elis
tof
envi
ronm
enta
lth
emes
,se
eT
able
2.

R. Gerlagh et al. / Ecological Economics 41 (2002) 157–174 169
Tab
le5
SAM
for
SNI
vari
ant
2(b
illio
ngu
ilder
s)
Cap
ital
Aba
tem
ent
Tra
deB
alan
ceN
etin
vest
men
tsC
onsu
mpt
ion
End
owm
ents
Sum
Indu
stry
Serv
ices
Agr
icul
ture
−0
−2
−6
0A
gric
ultu
re−
2634
−1
−0
−70
0−
23In
dust
ries
−20
−16
136
−7
−6
−78
Serv
ices
−1
0−
1110
5−
3−
6−
110
−1
24−
6−
5C
apit
alA
bate
men
t−
1−
250
−2
−2
30
−0
−1
310
−8
−22
Lab
or30
0P
rofit
s−
14−
12−
30
Tax
es
−28
.416
4.9
−44
.50
−71
.9−
20.1
GH
Gs
0.0
0O
zone
−0.
1−
0.0
0.3
0−
0.1
−0.
1A
cidi
ficat
ion
0.1
0E
utro
phic
atio
n−
0.0
PM
100.
00
−0.
00.
10
−0.
0Sm
ogD
ispe
rsio
n0.
10
−0.
0−
0.0
−8
−11
−20
722
60
00
Sum
00
0
For
the
list
ofen
viro
nmen
tal
them
es,
see
Tab
le2.

R. Gerlagh et al. / Ecological Economics 41 (2002) 157–174170
Fig. 5. Break up of income in expenditure categories, fromNNI to SNI.
Fig. 6. Break up of production in sectors, from NNI to SNI.
Fig. 7 presents the partitioning of national in-come in various income sources. Labor incomedecreases by 75%, and the share of labor in totalincome decreases from 50 to 25% under SNIvariant 1, and to about 15% under SNI variant 2.Income from capital also decreases substantially.The most striking result is the complete greeningof the tax system. The government revenues fromthe sale of emission permits exceed governmentexpenditure when about 70% of the sustainabilitystandards are met. At that point revenues fromemission permits replace all existing taxes. The
Fig. 5 presents changes in the break-up ofnational income per expenditure category on theway from NNI to variant 1 of a SNI in steps ofone-tenth of compliance with the sustainabilitystandards. We see that expenditures smoothly ad-just to the decrease in income. The most notice-able feature that can be learned from Fig. 5 is thatSNI starts to drop substantially only after 70% ofthe sustainability standards are met. The policyimplication that can be drawn from this figure isthat a less stringent, but still substantial, environ-mental policy can be implemented with relativelylimited economic costs. This result is in line withearlier studies, e.g. in the field of climateeconomics.
Fig. 6 presents changes in the break-up ofnational income per value added category on theway from NNI to a SNI, variant 1. The transitionis less smooth than for the expenditures: the firstpart of the process leads to only minor changes inthe components, and after 70% of the requiredemissions reductions are reached, the value addedproduced by the industry and services rapidlydeclines. As mentioned above, the agriculturalsector can maintain its value added (due to thehigher prices). The pattern for the ‘others’ sectoris caused by a combination of factors, a decreas-ing capital production and an increasing share ofthe abatement sector.
Fig. 7. Break up of income into income sources, from NNI toSNI.

R. Gerlagh et al. / Ecological Economics 41 (2002) 157–174 171
excess revenues are redistributed to private house-holds as lump-sum payments. The value of theseemission permits constitutes no less than abouttwo-thirds of the SNI.
Now, we will briefly further investigate thechanges in the economic structure as presented inthe SAMs for the two SNI variants (Tables 4 and5). As already pointed out above, value added inthe agricultural sector is mainly made up of thevalue of emission permits. Production of agricul-tural goods becomes rather expensive, and theDutch economy becomes a net importer of agri-cultural goods, in contrast with its strong export-ing position in the reference case. Apparently,under sustainability standards, the agriculturalsector cannot continue its bulk production in theNetherlands if the rest of the world is capable ofproducing agricultural goods in a sustainablemanner.
The SAM shows a specialization of the Dutcheconomy into services, which require less emissionpermits per guilder of value added, compared tothe other production sectors. The exports of ser-vices increase substantially, in contrast to theoverall decline of the Dutch economy. The tablesalso clearly show the uneven significance of differ-ent environmental themes. In both SNI variants,most expenditures on emission permits go to cli-mate change. The huge costs of greenhouse gasemission permits can be explained by the strictsustainability standard, especially in comparisonto the amount of emissions that can be avoidedthrough technical measures. Consequently, costlyvolume measures have to be taken to reducegreenhouse gas emissions. Once the economy hassufficiently restructured to satisfy the climatechange sustainability constraint, other environ-mental constraints are satisfied without the needfor very costly measures. This feature is partlyexplained by the fact that GHGs are associatedwith virtually all economic activity (especiallythrough energy use), and consequently, the re-structuring of the economy affects all sectors.Note that the value of the emission permits forthe other themes are not exactly zero, but just toosmall to be expressed in the table: they amount totens to hundreds million guilders.
Under variant 2, which assumes price changeson the world market proportional to pricechanges in the Netherlands, the SAM as presentedin Table 5 shows a different pattern of produc-tion, consumption, and trade. In this variant, it isnot possible to realize Dutch sustainability stan-dards by importing relatively environment-inten-sive products, and exporting lessenvironment-intensive products. Consequently,the Dutch economy cannot fully specialize to-wards services; agricultural remains a substantialexporter, using a substantial part of the emissionpermits. Though climate change is still the domi-nant environmental theme, the costs associatedwith the other themes are now somewhat higherthan in the previous variant. This shows thatthese environmental problems can no longer be‘exported’ to other countries, but have to betackled by domestic measures.
Being confronted with the sharp income reduc-tion caused by a decrease of greenhouse gas emis-sions by 79%, it seems an obvious challenge toexamine the model’s behavior when using it for amore standard policy analysis, and to compareour results with typical results in the literature.We calculate the costs, measured in loss of in-come, of a greenhouse gas emission tax that aimsat reducing greenhouse gas emissions by 50%.Though this aim represents a rather stringentenvironmental policy, comparable calculationshave been carried out in the literature, because ofthe understood urgency of the enhanced green-house effect. Boero et al. (1991) give an overviewof AGE models that are used for this purpose,and find a decrease of income ranging from 1 to4.5%. Similar to the calculations for the SNI, wehave two basic variants, one with world marketprices unchanged, and the other with world mar-ket prices changing proportionally to pricechanges in the Dutch economy. Table 6 presentsthe results, which roughly fall in the range foundin the literature.
Finally, we highlight the finding that costs ofemission reductions sharply increase from about4% of income for a 50% reduction to about 50%of income for a 79% reduction. Whereas the firsthalf of emissions can be reduced through techni-cal measures and by reallocating production fac-

R. Gerlagh et al. / Ecological Economics 41 (2002) 157–174172
Table 6Income effects of a 50% GHG emission reduction
50% reduction, variant 1 (change in %) 50% reduction, variant 2 (change in %)Base
434.5 (−4.9%)National income 441.2 (−3.2%)456.7
tors across sectors, a truly deep cut in emissionsrequires an inevitable cutback of the overall activ-ity levels. This finding stresses the consequence ofassuming the present state of technology un-changed. If a policy were directing economicgrowth towards more sustainable production andconsumption patterns, giving firms time to inno-vate and to adjust their production processes, it isnot unlikely that substantial emission reductionmeasures may be reached while requiring lesssevere reductions in overall economic activity.
5. Concluding comments
The main emphasis of the research was on theconstruction of an AGE model to calculate a SNIindicator for the Netherlands. We have been suc-cessful in the sense that we have shown that anAGE model can be extended with a list of envi-ronmental themes, and that abatement costs canbe included explicitly in the model to account forthe costs associated with emission reductionmeasures.
Our calculations indicate that climate change,caused by emissions of GHG, is the most pressingenvironmental issue, in terms of costs involved tomeet the sustainability standards. Whether thegap between NNI and the SNI level will increaseor decrease over time largely depends on theGHG policies that will be implemented in thecoming years. Energy is a necessary input forproduction and consumption, and the potentialfor reduction of carbon dioxide emissions (themajor greenhouse gas) through energy savings isinherently limited. If climate change policies stim-ulate the potential of alternative carbon-free en-ergy sources, such as various solar and windenergy sources or biomass, then emission reduc-tions can be achieved through a transition to-wards these alternative energy sources. Costs of
emission reductions will substantially fall, and thegap between the NNI and the SNI level willdecrease. In other words, another way of inter-preting the dynamic development of the gap isthat it measures whether the economy is develop-ing its potentials to meet more stringent environ-mental standards, or not. It is therefore ofapparent interest to extend the current analysisinto a dynamic context.
There are still many improvements, refinementsand sophistications to be made to our modelinganalysis. Many of these are already indicated inthe text. Without being exhaustive, we recall somefeatures that deserve special attention. First, thecoverage of relevant environmental functions(themes) can be extended. For the Netherlands,land use and waste disposal ask for inclusion.Moreover, there is need for a discussion aboutwhat level of resource use can be called sustain-able. We also note that the list of environmentalthemes included is biased to ‘sink’ functions of theenvironment, as opposed to the environmental‘source’ functions associated with forests, mineraldeposits, topsoil, fish stocks, and water resources.Our focus is typical for current Dutch environ-mental concerns. If the calculations would berepeated for other countries, one should considerincluding other natural resources. For manypoorer countries, the sustainable use of the envi-ronmental ‘source’ functions is of more immediateimportance then the sustainable use of the ‘sink’functions.
Second, the modeling of international trade canbe further worked out. Third, the information ontechnical options of abatement and their costsneeds to be kept up to date. Fourth, in the presentmodel, emissions are linked to outputs. Part ofthe emissions can better be linked to certain typesof inputs, for instance, CO2 emissions to fuelinputs. Modeling emissions through links with(fuel) inputs will allow a better reflection of sub-
R. Gerlagh et al. / Ecological Economics 41 (2002) 157–174 173
stitution possibilities. Fifth, the model mightbenefit from a differentiation of the abatementcost curves between sectors and a differentiationof the expenditure effects of technical abatement.In short, changing and modifying assumptionsthat underlie the SNI calculations means that awhole gamut of sensitivity analyzes can be done.
Though sensitive to several assumptions andqualifications, we have a measure of the part ofincome that depends on an excessive use of re-sources. For the Netherlands, for 1990, we calcu-lated that about half of its income could beattributed to resource use that exceeds a sustain-able level. In the midst of the many theoreticanalyzes on sustainable income levels, policy mak-ers may find it useful to have a numerical result. Itis now our responsibility to find attractive andunderstandable ways of communication to informthe public and politicians, as well as the scientificcommunity, on the reached results, their meaningand their limitations.
Acknowledgements
We are grateful to Roefie Hueting and Bart deBoer for sharing their views and comments. Wealso want to thank S. El Serafy for his criticalreview, which helped us to improve the paper.Finally, we acknowledge financial support fromthe Dutch Ministry of Economic Affairs and Min-istry of Housing, Spatial Planning and the Envi-ronment, who funded part of the research.
References
Ahmad, Y.J., El Serafy, S., Lutz, E. (Eds.), 1989. Environmen-tal Accounting for Sustainable Development. World Bank,Washington.
Aaheim, A., Nyborg, K., 1995. On the interpretation andapplication of a ‘green national product’. Review of In-come and Wealth 41, 57–71.
Aronsson, T., Lofgren, K.G., 1998. Green accounting in im-perfect market economies—a summary of recent research.Environmental and Resource Economics 11, 273–287.
Blok, K. 1991., On the reduction of carbon dioxide emissions.Thesis, Rijksuniversiteit Utrecht, ISBN 90-73958-01-6.
Blok, K., Worrell E., Albers, R.A.W., Cuelenaere, R.F.A.,1991. Data on energy conservation techniques for the
Netherlands. report no. W. 90008, RijksuniversiteitUtrecht, Department Natuurwetenschap en Samenleving.
Boero, G., Clarke, R., Winters, L.A., 1991. ControllingGreenhouse Gases: a survey of global macroeconomicstudies. Discussion papers 91–25, University of Birming-ham, Birmingham.
Boyd, R., Uri, N.D., 1991. An assessment of the impacts ofenergy taxes. Resource and Energy 13, 349–379.
Castaneda, B.E., 1999. An index of sustainable economicwelfare, ISEW, for Chile. Ecological Economics 28, 231–244.
Cruz, W., Repetto, R. (Eds.), 1991. Accounts Overdue: Natu-ral Resource Depreciation in Costa Rica. World ResourcesInstitute, Washington DC.
Cruz, W., Repetto, R., 1992. The Environmental Effects ofStabilization and Structural Adjustment Programs: ThePhilippines Case. World Resources Institute, WashingtonDC.
Daly, H.E., Cobb, J.B. (Eds.), 1989. For the Common Good.Beacon Press, Boston.
De Boer, B., Bosch, P., 1995. The greenhouse effect: anexample of the prevention cost approach. Paper preparedfor the second meeting of the London group on nationalaccounts and the environment, Washington, March 15–17.
De Boer, B., 2002. Economische structuren en milieugebruik;basisrapport van het project Duurzaam Nationaal Inko-men, concept. Statistics Netherlands, Voorburg.
Dellink, R., Gerlagh, R., Hofkes, M.W., 2001. Calibration ofthe applied general equilibrium model for the Netherlandsin 1990. IVM report W-01/17, Institute for EnvironmentalStudies, Amsterdam, The Netherlands.
Dellink, R., van der Woerd, F., de Boer, B., 1997. Kostenef-fectiviteit van milieuthema’s. IVM-VUA report R-97/10,Institute for Environmental Studies, Amsterdam, TheNetherlands.
El Serafy, S., 2001. Steering the right compass: the quest for abetter assessment of the national product. In: van Ierland,E.C., van der Straaten, J., Vollebergh, H.R.J. (Eds.), Eco-nomic Growth and Valuation of the Environment. EdwardElgar, Cheltenham, UK, pp. 189–210.
Gerlagh, R., Dellink, R., Hofkes, M.W., Verbruggen, H.,2001. An applied general equilibrium model to calculate aSustainable National Income for the Netherlands. IVMreport W-01/16, Institute for Environmental Studies, Am-sterdam, The Netherlands.
Gerlagh, R., Keyzer, M.A., 2001. Sustainability and the inter-generational distribution of natural resource entitlements.Journal of Public Economics 79, 315–341.
Gerlagh, R., van der Zwaan, B.C.C., 2000. Long-term substi-tutability between environmental and man-made goods.IVM report D00-18, Institute for Environmental Studies,Amsterdam, The Netherlands, accepted for publication inJournal of Environmental Economics and Management,May 15, 2001.
Gerlagh, R., van der Zwaan, B.C.C., 2001. The effects ofageing and an environmental trust fund in an overlappinggenerations model on carbon emission reductions. Ecologi-cal Economics 36, 311–326.

R. Gerlagh et al. / Ecological Economics 41 (2002) 157–174174
Hartwick, J.M., 1977. Intergenerational equity and the invest-ing of rents from exhaustible resources. American Eco-nomic Review 67, 972–974.
Hicks, J.R., 1948. Value and Capital, 2nd ed. Clarendon Press,Oxford.
Holub, H.W., Tappeiner, G., Tappeiner, U., 1999. Some re-marks on the ‘System of Integrated Environmental andEconomic Accounting’ of the United Nations. EcologicalEconomics 29 (3), 329–336.
Howarth, R.B., Norgaard, R.B., 1992. Environmental valua-tion under sustainable development. American EconomicReview 82, 473–477.
Hueting, R., 1980). New Scarcity and Economic Growth.North-Holland, Amsterdam.
Hueting, R., 1992). Correcting national income for environ-mental losses: a practical solution for a theoreticaldilemma. In: Krabbe, J.J., Heijman, W.J.M. (Eds.), Na-tional Income and Nature: Externalities, Growth andSteady State. Kluwer Academic Publishers, Dordrecht.
Hueting, R., 1995. Estimating sustainable national income. In:van Dieren, W. (Ed), Taking nature into account; towardsa sustainable national income. Springer-Verlag, New York,Chapter 13.
Hueting, R., Reijnders, L., 1998. Sustainability is an objectiveconcept. Ecological Economics 27, 139–147.
Hueting, R., de Boer, B., 2001. The parable of the carpenter.International Journal of Environment and Pollution 15,42–50.
Jorgenson, D.W., Wilcoxen, P.J., 1993a. Reducing U.S. car-bon dioxide emissions: an assessment of different instru-ments. Journal of Policy Modeling 15, 491–520.
Jorgenson, D.W., Wilcoxen, P.J., 1993b. Reducing US carbonemissions: an econometric general equilibrium assessment.Resource and Energy Economics 15, 7–25.
Keller, W.J., 1980. Tax Incidence. North-Holland,Amsterdam.
Keuning, S.J., 1993. An information system for environmentalindicators in relation to the national accounts. In: de Vries,W.F.M. (Ed.), The Value Added of National Accounting,Statistics Netherlands. SDU Publishers, The Hague.
Liu, X.L., 1998. Adjusted forest accounts for China. Ecologi-cal Economics 27, 283–298.
Nordhaus, W.D., Tobin, J., 1972. Economic Growth; IsGrowth Obsolete? Columbia University Press, New York.
Nordhaus, W.D., Kokkelenberg, E.C., Woodward, R.T.,2000. Nature’s numbers: expanding the national economicaccounts to include the environment. Land Economics 76,486–490.
Okken, P.A., 1991. CO2 reduction consensus? A conceptualframework for global CO2 reduction targets, the impor-tance of energy technology development. Report no. ECN-RX-91-093ECN, Petten.
Okken, P.A., Lako, P., Gerbers, D., Kram, T., Ybema, J.,1992. CO2 removal in competition with other options forreducing CO2 remissions. Energy Conversion and Manage-ment 33, 6–10.
Repetto, R., Magrath, W., Wells, M., et al., 1989. WastingAssets; Natural Resources in the National Income Ac-counts. World Resources Insitute, Washington DC.
Statistics Netherlands, 1990. Tax incidence in the Netherlands:accounting and simulations. Statistics Netherlands reportM42, SDU Publishers, The Hague.
Solow, R.M., 1974. Intergenerational equity and exhaustibleresources. Review of Economic Studies 41, 29–45.
Thampapillai, D.J., Uhlin, H.E., 1997. Environmental capitaland sustainable income: basic concepts and empirical tests.Cambridge Journal of Economics 21, 379–394.
Torras, M., 1999. Inequality, resource depletion, and welfareaccounting: applications to Indonesia and Costa Rica.World Development 27, 1191–1202.
UN, United Nations, 1993. Integrated Environmental andEconomic Accounting. United Nations, New York.
Van Ierland, E.C., Straaten, J.V.D., Vollebergh, H.R.J. (Eds.),2001. Economic Growth and Valuation of the Environ-ment. Edward Elgar Publishing Ltd, Cheltenham, UK.
Verbruggen, H., Dellink, R.B., Gerlagh, R., Hofkes, M.W.,Jansen, H.M.A., 2001. Alternative calculations of a sus-tainable national income for the Netherlands according toHueting. In: van Ierland, E.C., van der Straaten, J., Volle-bergh, H.R.J. (Eds.), Economic Growth and Valuation ofthe Environment. Edward Elgar, Cheltenham, UK, pp.275–312.
VROM (Ministry of housing, spatial planning and the envi-ronment), 1994. Methodiek Milieukosten. PublicatiereeksMilieubeheer 1994/1, The Hague.
VROM, 1998. Kosten en baten in het milieubeleid, definitiesen berekeningsmethoden. Publicatiereeks Milieustrategie1998/6, The Hague.
Weitzman, M.L., 1976. On the welfare significance of nationalproduct in a dynamic economy. Quarterly Journal of Eco-nomics 90, 156–162.
Withagen, C., 1998. Untested hypotheses in non-renewableresource economics. Environmental and Resource Eco-nomics 11, 623–634.