development of adventure-based mental toughness inventory ...
Upload
independentCategory
view
2download
0
ORIGINAL ARTICLE
A magnetic method for non destructive monitoring of fiberdispersion and orientation in steel fiber reinforcedcementitious composites—part 1: method calibration
Liberato Ferrara • Marco Faifer • Sergio Toscani
Received: 11 April 2011 / Accepted: 26 September 2011 / Published online: 12 October 2011
� RILEM 2011
Abstract Steel fiber reinforced concrete (SFRC) is a
composite material which is becoming more and more
widely employed in building construction. The
mechanical behaviour of the material and the perfor-
mance of structural elements may significantly depend
on the fiber dispersion and orientation with respect to
the stress pattern. Non-destructive monitoring of fiber
dispersion related issues hence becomes of the fore-
most importance in order to reliably anticipate the
structural performance of elements made with fiber
reinforced cementitious composites (FRCCs), as well
as for quality control during manufacturing. In this
paper a new method for the detection of fiber density
and orientation is presented, which is based on the
employment of a probe sensitive to the magnetic
properties of the steel fibers. The presence and the
relative position of steel fibers modify the flux linked
by the winding of the probe thus resulting in an
impedance variation. The local average concentration
and orientation of the fibers can be thus assessed by
measuring the variation of the probe inductance. The
performance of the method has been analyzed with
reference to a self-consolidating high performance
FRCC slab and thoroughly verified by means of
comparison with destructive monitoring of fiber local
concentration and orientation. Besides its good sensi-
tivity, the method is also characterized by ease of use,
since it just requires to lean the probe on the surface of
the specimen, without any particular care about the
coupling. This guarantees a high degree of repeatabil-
ity and low uncertainty in the measurements, even,
e.g. on vertical elements or slabs accessible from the
bottom.
Keywords Fiber reinforced cementitious
composites � Flow-induced orientation �Non-destructive fiber monitoring �Magnetical inductance
1 Introduction
Fifty years of continuing research, since the early
pioneering studies by Romualdi and Batson [1], have
led to consolidated knowledge about the multifold
aspects of the physical and mechanical behaviour of
steel fiber reinforced concrete (SFRC) and fiber
reinforced cementitious composites (FRCCs) as well
L. Ferrara (&)
Politecnico di Milano, Department of Structural
Engineering, Piazza Leonardo da Vinci 32, 20133 Milan,
Italy
e-mail: [email protected]
M. Faifer � S. Toscani
Politecnico di Milano, Department of Electrical
Engineering, Piazza Leonardo da Vinci 32, 20133 Milan,
Italy
e-mail: [email protected]
S. Toscani
e-mail: [email protected]
Materials and Structures (2012) 45:575–589
DOI 10.1617/s11527-011-9793-y

as to the development of more and more advanced
theory and modelling tools able to describe such
behaviour and explain reinforcing mechanisms. As a
consequence, continuous developments have been
promoted in new advanced materials and improved
products for buildings and other structures, even
‘‘tailored’’ to the intended application, as well as in
terms of processing and standardization. In order to
guarantee the prescribed levels of performance,
multiple targets have to be met which include not just
merely mechanical properties, but also durability, fire
and extreme loading resistance, constructability
energy efficiency, life-cycle cost effectiveness: in
one word, which may broadly encompass all the
aforementioned requisites, sustainability.
The recently issued fib 2010 Model Code [2] has
finally made available to the world engineering
community a set of internationally recognized design
guidelines to confidently employ these materials to
build structures and infrastructures able to meet the
higher and higher needs and demands of our society.
The dispersion of fibers inside a structural element
has been long time recognized as a crucial issue to
design and achieve safe and reliable SFRC applica-
tions. As a matter of fact, a spotty dispersion, where
zones with a reduced or even nil amount of fibers may
stand side by side with zones richer in fiber content or
even where fibers have clumped, may, either the
former or the latter acting as defects, seriously affect
the element load bearing capacity as well as trigger
failure mechanisms which have not been anticipated in
the design stage.
Over the past years several researchers have
pointed out that the aforementioned spotty dispersion
of fibers most likely occurs due to the negative effects
which the addition of fibers has on the fresh state
performance of the material [3, 4]. This requires, for
successful casting, manual compaction and/or strong
mechanical vibration, which may most likely amplify
the somewhat unavoidable downward settlement of
the fibers, further contributing to an uneven spatial
distribution of material mechanical properties inside
the element.
The synergy of the FRC with the Self Consolidating
Concrete (SCC) technology, which, thanks to the
higher deformability and rheological stability of the
latter, reduces or even eliminates the need for manual
compaction and mechanical vibration, has been
proved effective at guaranteeing a randomly uniform
dispersion of the fibers [4, 5]. This is also likely to have
positive outcomes in terms of experimental scattering
of material properties within the same casting. It has
been furthermore shown that, thanks to both a suitably
balanced set of fresh state properties and to a careful
design of the casting process, it is possible to
effectively orientate the fibers along the direction of
the casting flow [6–8]. All what said above paves the
way towards a challenging ‘‘holistic’’ approach to the
design of SFRC structural elements which tailors both
the material composition and the casting process to the
anticipated structural performance. This would require
the orientation of fibres to match as close as possible
with the direction of the principal tensile stress within
the structural element when in service, so to achieve a
more efficient structural use of the material [9–11]. In
this way a desirable closer correspondence between
the shape of an element and the function it performs in
a structure assembly could be pursued in the design.
A suitably balanced fresh-state performance of the
FRCC would allow to mould the shape of an element
and, thanks to a tailored casting process, to orient the
fibers along the direction of the principal tensile
stresses resulting from its structural function.
2 Non-destructive monitoring of fiber dispersion:
a literature survey
In the framework before discussed the assessment of
fiber dispersion and orientation related issues through
a non destructive both time- and cost-effective method
becomes a crucial need also in the sight of developing
‘‘ad-hoc’’ quality control procedures.
Research about not-destructive monitoring of fiber
dispersion and, in case, orientation in FRC elements,
dates back to the late 70s [12] but only in the very last
lustrum has undergone renewed interest and challeng-
ing advances have been made. This, besides the
evident progress in sensors and monitoring technolo-
gies, is due, in the authors’ opinion, to two peculiar
concurring issues. First of all, after about 50 years of
continuing research, a consensus has been achieved
about the feasibility and effectiveness of FRC struc-
tural applications and the knowledge thus garnered has
been transferred into reliable codified design
approaches, including the procedures for the identifi-
cation of relevant properties of the material. The issues
about quality control of the aforementioned
576 Materials and Structures (2012) 45:575–589

applications, including dispersion of the fibers, have
thus garnered renewed interest. This has been further-
more triggered by the ongoing tremendous develop-
ment in the SCC technology, the synergy of which
with FRC has been recognized, as above remarked, as
an effective tool to control the dispersion and orien-
tation of the fibers, thus providing added value to the
engineering applications.
In most of the so-far reported investigations, fiber
dispersion and orientation were (destructively) mon-
itored by manually counting the fibers on selected
‘‘specimen locations’’ (e.g. over fracture cross sec-
tions of specimens employed for toughness fracture
tests).
Manual counting is rather easy when low dosages
of longer fibers with average aspect ratios are
employed [13, 14] whereas image analysis techniques
are required for higher dosages of shorter fibers with
higher aspect ratios or whenever a quantitative infor-
mation on the orientation of fibers with respect to the
plane of the cut has to be sought [7, 15–17].
X-ray pictures of cores or of thin slices obtained by
sawing the specimens (the sample thickness is dictated
by the absorption properties of the material and power
of the equipment) were also taken in several investi-
gations [4, 12, 14] and can provide immediate and
effective visualization of the fiber orientation. Obtain-
ing quantitative information from X-ray pictures may
be cumbersome, either due to the loss of the third
dimension and, most of all, in the case of higher
percentages of short fibers.
A nice 3D visualization of the fiber arrangement
within a specimen can be obtained, as it was recently
shown, by means of Computed Axial Tomography
(CAT) scanning [6, 18]. The need of a dedicated
equipment (like in the case of X-rays) as well as of an
image analysis software for the quantitative process-
ing of the collected data, may be singled out, so far, as
a major drawback to a wider use of the method,
especially at an industrial scale.
Electrical methods, based on the effects of the fibers
on the resistivity/conductivity of the composite mate-
rial, has received lots of attention in the very last years.
Ozyurt et al. [19] and Woo et al. [20] employed the
Alternate Current Impedance Spectroscopy (AC-IS)
for the detection of fiber dispersion related issues and
demonstrated its reliability as well as its sensitivity to
fiber orientation, clumping, segregation etc. by means
of extensive comparison with results obtained from
destructive methods. Attempts were also made to
address the application of the aforementioned method
to industrial scale problems [21]. The method is based
on the frequency-dependant behaviour of cementitious
composites reinforced with conductive, such as steel
and carbon, fibers. These were in fact shown to be
practically insulating under Direct Current (DC) and
low frequency Alternate Current (AC) excitation
while they are conductive under high frequency AC.
The method consists of applying to the specimen a
voltage excitation over a range of frequencies (e.g.
10 MHz–1 Hz) and measuring the amplitude and
phase of the flowing current. When the real and
imaginary parts of the calculated impedance Z are
plotted on a Nyquist diagram, FRCCs exhibit the so
called dual-arc behaviour featured by a low-frequency
cusp (fibers are insulating), which gives the (higher)
resistance of the matrix, Rm, and a high frequency cusp
(fibers are conductive), which corresponds to the
(lower) resistance of the fiber reinforced composite R.
In order to overcome the drawback of the sensitivity to
moisture conditions of the resistivity of the concrete
matrix, the so-called matrix normalized conductivity
is used, from which information about local fiber
concentration should be easily obtained by means of a
simple mixture rule approach:
Rm
R¼ r
rm
¼ 1þ rfibers½ �Vf ð1Þ
where r and rm are the conductivity of the fiber
reinforced composite and of the matrix respectively,
[rfibers] is the intrinsic conductivity of the fibers which,
in the case of highly conductive fibers, only depends
on their geometrical properties (fiber aspect ratio) [22]
and Vf is the fiber volume fraction.
The method has been extensively employed to
assess the influence of the fresh state performance on
the dispersion of the fibers and their correlation with
the mechanical properties (e.g. fracture toughness) [5,
23]. Any direct quantitative comparison between, e.g.,
the concentration of fibers as evaluated from Eq. 1 and
data obtainable from destructive tests (e.g. crushing
samples, separating and weighing fibers) could hardly
be found in the literature. The need of a dedicated
expensive instrumentation, as required by the exten-
sion of the employed frequency range, and the
sensitivity of the method itself to the contact imped-
ance between the surface electrodes and the specimen/
structure surface, has led several researchers to
Materials and Structures (2012) 45:575–589 577
investigate different approaches and techniques in the
mainstream of electrical methods.
Lataste et al. [24] employed a method based on low
frequency resistance measurements, with a four elec-
trode arrangement, aimed at reducing the effects of the
poor electrical coupling. The method has been dem-
onstrated to be effective in detecting orientation
characteristics of fiber reinforcement, because of the
different resistance measured along the two directions
at right angle to each other; qualitative correlation
with mechanical properties measured according to the
same directions as above was also provided [25].
Anyway the method is not able to provide any
quantitative information about the local average
concentration of the fiber reinforcement, mainly due
to the uncertainty in the assessment of the concrete
matrix resistivity, because of its strong sensitivity to
aging, moisture content and presence of electrolytes in
the pores which also affect the measured resistivity
beside the effects of fiber concentration.
The effects of conductive fibers on the capacitive
properties of the fiber reinforced composite have led to
the development of another method, based on the
measurement of the effective permittivity through a
coaxial probe and microwave reflectometry tech-
niques [26]. The local average concentration of fibers
could be assessed by assuming a random orientation
and because of the known fiber geometry (aspect ratio)
which governs their capacitive behaviour: as a matter
of fact the method is unsuitable for FRCCs featured by
preferential fiber orientation.
In this paper a new method is proposed and validated
which employs a probe sensitive to the magnetic
properties of the steel fibers. The fundamentals of the
method rely on the fact that the presence and relative
position of the fibers in a fiber reinforced concrete
element modify the magnetic field lines due to the probe
winding, when leant on the element/structure surface,
thus resulting in a variation of the measured inductance.
Either fiber concentration can be quantitatively
assessed by calibrating the method and fibre preferen-
tial orientation can be estimated. As it will be further
elucidated, the method, besides its good sensitivity and
robustness, is also characterized by an intriguing ease of
use, due to the simple equipment which just needs to be
leant of the surface of a structural element, which can be
easily done even on vertical elements or slabs acces-
sible only from the bottom, without any dedicated care
about the electrical coupling.
The validation of the method has been performed
with reference to slabs (1 m long 9 0.5 wide 9
25 mm thick) cast with a high performance fiber
reinforced cementitious composite (HPFRCC), con-
taining either 50 or 100 kg/m3 of steel fibers 13 mm
long and 0.16 mm in diameter. The slab casting
process was designed so to have, thanks to the self-
compacting fresh-state properties of the material, a
preferential orientation of the fibers parallel to the
longer edge of slabs. A thorough comparison with
fiber dispersion and orientation related issues as
detected by means of destructive techniques has been
also performed. In a companion paper [27] the tensile
fracture toughness of the material will be evaluated,
both along and at a right angle to the preferential fiber
orientation, and correlated to the previously garnered
information on fiber dispersion and orientation.
3 Research programme
In order to validate the proposed method for non-
destructive monitoring of fiber dispersion and to
further establish quantitative correlation with tensile
fracture toughness properties of the material, a
HPFRCC containing 100 kg/m3 short steel fibers,
already thoroughly investigated in a previous research
project [7], has been assumed as a reference. Its mix
design is shown in Table 1. Two further mixes, with
either 50 kg/m3 fibers or no fibers at all (plain matrix)
have been designed to the purpose of this study, the
compositions of which are also detailed in Table 1.
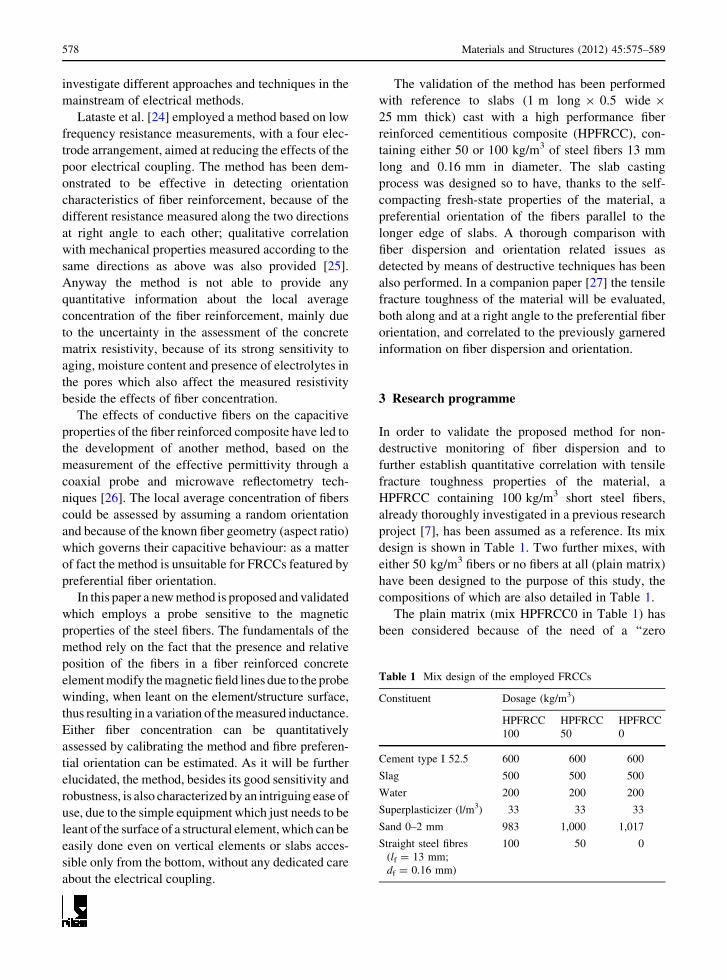
The plain matrix (mix HPFRCC0 in Table 1) has
been considered because of the need of a ‘‘zero
Table 1 Mix design of the employed FRCCs
Constituent Dosage (kg/m3)
HPFRCC
100
HPFRCC
50
HPFRCC
0
Cement type I 52.5 600 600 600
Slag 500 500 500
Water 200 200 200
Superplasticizer (l/m3) 33 33 33
Sand 0–2 mm 983 1,000 1,017
Straight steel fibres
(lf = 13 mm;
df = 0.16 mm)
100 50 0
578 Materials and Structures (2012) 45:575–589

reference point’’ for the calibration of the magnetic
test results, as it will be detailed in the forthcoming
sections.
The mixing protocol adopted for the mixes is
detailed in Table 2. As it clearly appears, the adopted
mix-design rationale when reducing the fiber content
was to replace them with an equivalent volume of
sand. This resulted in comparable fresh state perfor-
mance, as measured by means of the slump-flow and
V-funnel tests, irrespective of the fiber content, as
detailed in Table 3.
A thin slab 1 m long 9 0.5 m wide 9 25 mm
thick was cast with each of the three aforementioned
mixes: fresh concrete was poured at the center of one
short edge and, due to its self-levelling ability, after
having spread to the whole width of the slab,
completely filled the formwork flowing parallel to
the long side. A preferential orientation of the fibers
along the aforementioned direction was with high
probability obtained.
Fiber dispersion was monitored by means of the
magnetic method detailed in the following chapter and
according to the schematic shown in Fig. 1. A grid was
drawn on the slab surface dividing it into eighteen
cells: for each of the cells measurements were
garnered along four directions, i.e. parallel and
orthogonal to the flow direction and at ±45� with
respect to it (Fig. 1). In this way thorough information
on the orientation characteristics of the fiber rein-
forcement could be obtained. Along each direction
measures were repeated five times, for statistical
significance, and reference will be made hereafter to
their average.
After such a monitoring the slabs were cut into
square tiles according to the same schematic as the one
employed for the inductance measurements; the tile
specimens were employed to identify the tensile
stress-crack opening behaviour of the composite
according to a novel testing methodology called the
Double Edge Wedge Splitting test [28, 29], as
sketched in Fig. 2a. The groove and notch cutting
was done in such a way that the preordained fracture
plane resulted either parallel or perpendicular to the
preferential flow-induced fiber alignment. A detailed
scheme is provided in Fig. 2b, which shows as a
thorough characterization of the fiber orientation and
local concentration dependant tensile fracture tough-
ness was obtained from such a testing programme.
After mechanical tests, first fibers on the fracture
surface of each specimen were counted, for a ‘‘rough’’
evaluation of the fiber orientation factor [30], to be
correlated with information garnered either from
inductance measurements and fracture toughness
tests. Finally, some specimens were crushed (the ones
which are shadowed in Fig. 2b) and fibers were
separated and weighed, for a destructive evaluation of
local concentration, to be correlated once again with
non destructive predictions from the magnetic induc-
tance based method.
In this paper the fundamentals of the method will be
presented and the methodology which has been
adopted for the analysis of garnered measurements
and the obtainment of data in terms of fiber local
average concentration and orientation will be dis-
cussed. Validation through destructive assessment of
Table 2 Mixing protocol
Task Time
Mix raw cement and slag at 50 rpm 1 min
Add water and SP 1 min
Mix paste at 50 rpm 5 min
Add sand while mixing at 50 rpm 2 min
Mix mortar at 100 rpm 5 min
Add fibers while mixing at 100 rpm 2 min 30 s
Mix FRCC at 100 rpm 5 min
Table 3 Results of the fresh state characterization
Mix Slump flow test V-funnel test
Diameter (mm) T50 (s) Flow time TV (s)
HPFFRCC 100 750 6 30
HPFRCC 50 760 6 29
HPFRCC 0 775 5 25
Fig. 1 Scheme for the acquisition of magnetic measurements
on HPFRCC slabs (examples of measurement directions is given
for one cell, dimensions in mm)
Materials and Structures (2012) 45:575–589 579

the same quantities will finally demonstrate the
reliability of the method. Correlation with tensile
fracture toughness properties of the material will be
presented and analysed in a companion paper [27].
4 The proposed method: physics fundamentals
Low carbon steel fibers, employed in most of the
SFRC applications exhibit a ferromagnetic behaviour.
The FRCC hence consists of two phases with strongly
different magnetic properties: namely the cement-
based matrix, characterized by a magnetic permeabil-
ity l0, and the fibers, whose magnetic permeability lFe
is much higher than l0. Due to the generally quite low
volume fraction of fibers, the interactions between
inclusions may be neglected. Furthermore, both the
fiber length and the average fiber spacing are likely to
be much lower that the wavelength used for the
analyses.
Under the aforementioned assumptions the macro-
scopic magnetic properties of the composite material
and the effective magnetic permeability dyad leff of
the two-phase mixture can be defined [31]. It is
important to notice that the latter depends on the
volume fraction of the fibers, on their orientation, on
their aspect ratio but it does not depend on their size.
Therefore, it is evident that the measurement of a
parameter influenced by the effective permeability of
the SFRC can be used to asses both the concentration
and the orientation of the steel fibers. A possible
solution based on this approach consists in the
measurement of the equivalent inductance related to
a magnetic field which invests the SFRC specimen.
A C-shaped magnetic core with a N turn winding can
be used (Fig. 3) to this purpose. When the core is
placed on the surface of a SFRC element, the self-
inductance of the winding is influenced by the
concentration of the fibers: the higher the former, the
higher the latter. In addition, the inductance is also
influenced by the orientation of the magnetic core with
respect to the average direction of the fibers. When the
magnetic axis of the winding and the average direction
of the steel fibers are aligned the measured inductance
is maximum.
In Fig. 3 the permeances Kl, Kc, Kv assigned to the
various branches of the magnetic circuit and the
current iw flowing into the N-turn coil are shown.
Studying the equivalent circuit of the probe the
impedance evaluated at the terminals A–B of the coil
(Fig. 4) results:
ZAB ffi Rws þ jx Ll þLcLv
Lc þ Lv
� �ð2Þ
where Rws is the resistance of the coil.
(b)
(a)
Fig. 2 Scheme of the DEWS test specimen geometry and set-
up (a) and scheme of DEWS specimens cutting from the slab
with reference to casting flow lines (b—shadowed cells have
been crushed for destructive measurement of fiber concentra-
tion); dimensions in mm
Fig. 3 Schematic of the magnetic probe
580 Materials and Structures (2012) 45:575–589

As clearly indicated in Eq. 2, the real part of the
impedance does not depend on the presence of
the fibers, while the imaginary part may be affected
by the magnetic effects due to the fibers (inductance
Lv).
Since Lv can be split into two terms, Lv0 and DLv,
Eq. 2 can be re-written as:
ZAB ffi Rws þ jx Ll þLc Lv0 þ DLvð ÞLc þ Lv0 þ DLv
� �ð3Þ
Lv0 is the value assumed by Lv when the specimen
does not contain fibers. DLv is an additional term due
to presence of steel fibers.
Since the inductance Lc is surely much higher than
Lv, Eq. 3 can be approximated with the following
expression:
ZAB ffi Rws þ jx Ll þ Lv0 þ DLvð Þ ð4Þ
where DLv depends on the presence of fibers.
Equation 4 shows that the effect of the steel fibers
simply results in an increase of the probe inductance.
This increase can potentially be effective to assess
information about the concentration of the steel fibers.
In fact by considering Eq. 4 it can be written:
DLv ¼ ImZAB � ZAB0
x
� �ð5Þ
where ZAB0 is the impedance measured when the
probe is placed on a specimen without fibers. At the
same time, the average direction of the fiber can be
detected by rotating the magnetic probe around its axis
of symmetry and by finding the angular position where
the quantity Im(ZAB/x) becomes maximum.
Starting from the theoretical formulation of the
problem the experimental set-up shown in Fig. 5 has
been developed. The magnetic probe used to detect the
steel fiber reinforcement inside SFRC elements con-
sists of a C-shaped N87 ferrite core. The excitation is
provided by a 100 mA current flowing through a
78-turn coil. The measurement system has been made-
up by means of virtual instrument (VI) techniques. In
particular the implemented VI allows performing
automatic impedance versus frequency analysis. In
fact, it provides the generation of the excitation signal
producing the required magnetomotive force. Further-
more, it permits to measure the voltage applied to the
magnetic probe and the consequent current.
The acquisition of the two signals has been
performed by means of a National Instruments PCI
6143 DAQ board featuring a 16-bit resolution and a
maximum sampling frequency of 250 kHz. The exci-
tation signal has been provided by a digital signal
waveform generator (DSWG) controlled through a
GPIB interface. In order to avoid a ground loop
between the generation and the acquisition sections,
the excitation signal has been injected through a wide
bandwidth signal transformer.
The impedance measurement consists in a FFT
analysis of the voltage and the current signals. This
technique allows to reduce the requirements of low
harmonic distortion of the stimulus signal, thus
strongly relaxing the linearity requirement of the
decoupling transformer.
By means of a comparison with a high precision
LCR meter (Agilent E4980A) it has been estimated
that the system features a resolution better than
0.3 lH, which complies with the requirements
assessed through the finite element validation of the
set-up [31].
Fig. 4 Electrical model of the magnetic probe when the effect
of the steel fibre reinforced cementitious composite is taken into
account
Fig. 5 Schematics of the experimental setup
Materials and Structures (2012) 45:575–589 581

5 Data acquisition and analysis: assessing local
fiber concentration and orientation from
non-destructive magnetic measurements
As briefly recalled above in Sect. 2, for each, either
plain or fiber reinforced slab (respectively containing
50 and 100 kg/m3 of fibers), measurements of the
probe magnetic inductance were garnered with refer-
ence to the eighteen cells the slab was virtually
divided into and along four different directions as
sketched in Fig. 1. Measurements were taken in the
frequency range between 1 and 10.2 kHz. Figure 6
shows the measured inductance versus frequency
trends. As an example measurements have been done
on the same cell for each of the tested slab (No. 8 in
the schematic shown in Fig. 1). Measured trends
resulted similar everywhere else. The sensitivity of
the measured inductance to both the nominal fiber
content and to the local concentration and most likely
alignment of the fibers clearly appears. Furthermore, it
can be observed a certain frequency dependence of the
measurements, which is by the way insensitive to
either the fiber content and orientation, as highlighted
by the parallel curve trends. This depends on the
frequency dependent behaviour of the ferromagnetic
material the employed probe is made of. Significantly,
in fact, the same trend has also been detected for the
inductance of the plain matrix, showing no anisotropy
as expectable, which also coincided with the one
measured in free air.
By considering the latter value as the reference one,
the so called ‘‘compensated inductances’’ can be
calculated as the differences between the inductance
measured for each of the investigated cells and
directions and the reference free air value itself.
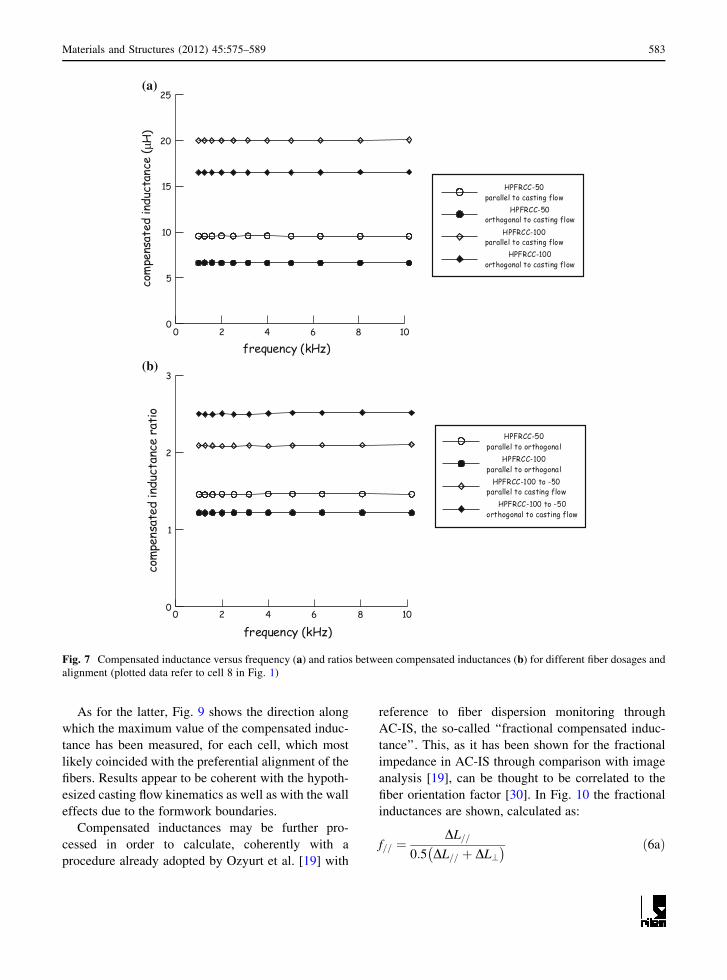
Because of the aforementioned statements, the com-
pensated inductances turned out independent of the
frequency (Fig. 7a). The ratios between compensated
inductances along two directions, respectively parallel
and perpendicular to the flow direction, confirm the
guessed orientation of the fibers. It can be also
observed (Fig. 7b) that the higher the nominal content
of the fibers, the smaller the aforementioned ratio. This
may be most likely attributed to the fact that because
of their higher number, fibers are supposed to form a
more isotropic network. The ratio between compen-
sated inductances along the same direction but for two
different fiber contents results significantly coherent
with the nominal fiber content itself. The aforemen-
tioned statement, illustrated in Fig. 7 with reference to
a single monitored cell and confirmed all over the slab
specimens, has hence dictated the criteria for further
processing the whole set of garnered data (as summa-
rized in detail in Fig. 8) in order to obtain a more
meaningful quantitative information about both the
local concentration and orientation of the fibers.
Fig. 6 Measured probe inductance for different fiber concentrations and both parallel (along) and orthogonal to fiber orientation (data
are referred to cell 8 in Fig. 1)
582 Materials and Structures (2012) 45:575–589
As for the latter, Fig. 9 shows the direction along
which the maximum value of the compensated induc-
tance has been measured, for each cell, which most
likely coincided with the preferential alignment of the
fibers. Results appear to be coherent with the hypoth-
esized casting flow kinematics as well as with the wall
effects due to the formwork boundaries.
Compensated inductances may be further pro-
cessed in order to calculate, coherently with a
procedure already adopted by Ozyurt et al. [19] with
reference to fiber dispersion monitoring through
AC-IS, the so-called ‘‘fractional compensated induc-
tance’’. This, as it has been shown for the fractional
impedance in AC-IS through comparison with image
analysis [19], can be thought to be correlated to the
fiber orientation factor [30]. In Fig. 10 the fractional
inductances are shown, calculated as:
f== ¼DL==
0:5 DL== þ DL?� � ð6aÞ
(a)
(b)
Fig. 7 Compensated inductance versus frequency (a) and ratios between compensated inductances (b) for different fiber dosages and
alignment (plotted data refer to cell 8 in Fig. 1)
Materials and Structures (2012) 45:575–589 583

f? ¼DL?
0:5 DL== þ DL?� � ð6bÞ
where subscripts //and \ are meant as parallel and
orthogonal to the supposed flow direction and 0.5 is
the expected value in the case of an in-plane isotropic
dispersion. The thus calculated values of the fractional
inductances are interestingly coherent, for either the
fiber content investigated, with fiber orientation fac-
tors evaluated in a previous investigation [7] by means
of image analysis for similar specimens similarly cast
with the same material.
As for the quantitative assessment of the local
concentration of fibers, the following approach has
been followed. First of all it has been assumed that, in
the average, the slab as a whole contains a specific
amount of fibers equal to the nominal fiber content in
the mix. This assumption reasonably holds if one
considers that an amount of material was cast just
slightly larger than the one necessary to fill the slab
moulds and that fiber losses, if any, in the mixer and
during casting may be neglected. Such a guessed
nominal reference fiber content has been plot versus a
‘‘nominal average compensated inductance’’ value,
(a) (b)
Fig. 8 a Compensated inductances as from measured induc-
tances along four directions for each cell of HPFRCC50 slab
(values refer to inductances measured at a frequency equal to
4 kHz; angles refer to the casting flow direction, positive if
clockwise; compensated inductances have been calculated to an
average inductance of the reference plain matrix equal to
Lv0 = 1,856,347 mH). b Compensated inductances as from
measured inductances along four directions for each cell of
HPFRCC100 slab (values refer to inductances measured at a
frequency equal to 4 kHz; angles refer to the casting flow
direction, positive if clockwise; compensated inductances have
been calculated to an average inductance of the reference plain
matrix equal to Lv0 = 185,635 mH)
584 Materials and Structures (2012) 45:575–589

defined as the average, over the whole slab, of the
averages of the values measured along the four
directions for each cell (see Fig. 8). The calibration
of the ‘‘nominal average compensated inductance’’
versus nominal fiber content correlation is shown in
Fig. 11. A linear dependence on the fiber content has
been hypothesized because of the low fiber volume
fraction and the consequently negligible interactions
between fibers, as from the physics fundamentals of
the approach. By means of such a calibrated law, the
average values of compensated inductance for each
cell could be processed to assess whether and to what
extent the local concentration of fibers differed from
the assumed nominal value. Results are shown in
Fig. 12. The detected dispersion of the fibers inside
the slabs appears to be featured by an acceptable
degree of homogeneity and once again coherently
understandable on the basis of the casting flow
kinematics. It can be observed that the initial higher
peak in the fiber content, which is most likely due to
the onset of the laminar casting flow after the
turbulence which occurs where the fresh cementitious
composite is poured, is followed by a slight progres-
sive impoverishment of the fibers (anyway lower than
20%) along the flow, as a result of a dynamic
segregation, which to some extent seems to be
unavoidable.
6 Verification: non-destructive versus destructive
measurements
Data about fiber concentration and orientation
assessed through the analysis of non-destructively
garnered measurements, as detailed in the previous
paragraph, have been finally validated through
destructive evaluation.
As already explained above, after magnetic survey,
each HPFRCC slab was cut into eighteen tiles and
tensile fracture toughness tests were performed on
those specimens with a notch-preordained fracture
plane either orthogonal or parallel (respectively odd
and even numbered cells in Fig. 2) to the casting flow
direction and hence to the preferential orientation of
the fibres.
After the aforementioned tests had been completed,
specimens were broken along the ligament and, also
through the aid of micro-imaging, fibers protruding
from either side of the fracture surface were counted.
Fig. 9 Directions of measured maximum inductance in
HPFRCC-50 (a) and HPFRCC-100 (b) slabs
(a)
(b)
Fig. 10 Fractional compensated inductances parallel and
orthogonal to the flow direction for HPFFRCC-50 (a) and
HPFRCC-100 (b) slabs
Fig. 11 Average compensated inductance versus nominal fiber
content
Materials and Structures (2012) 45:575–589 585
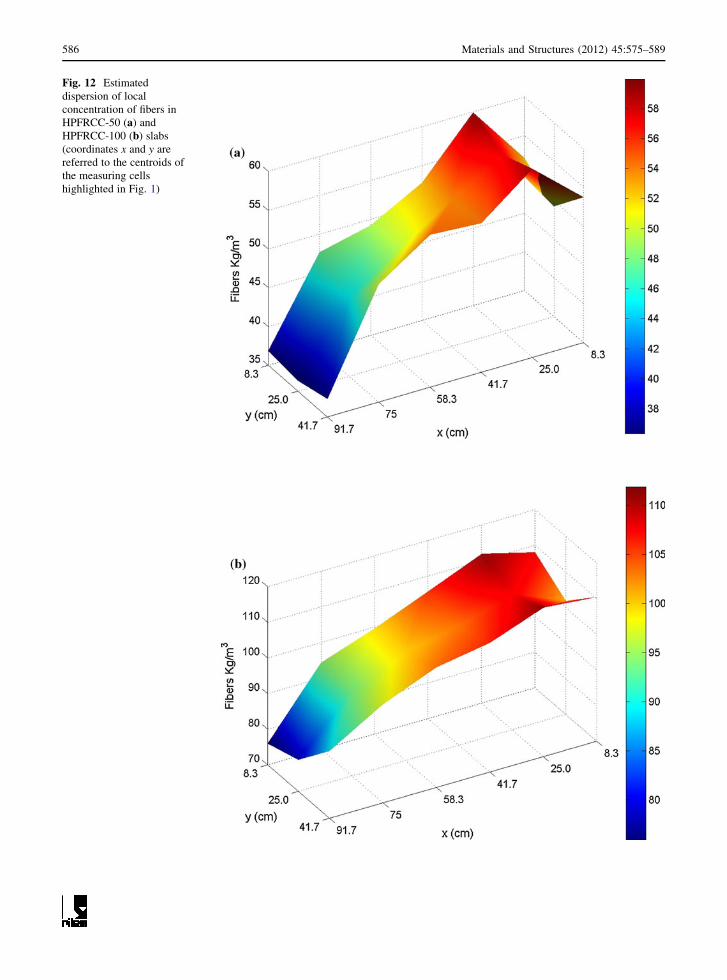
Fig. 12 Estimated
dispersion of local
concentration of fibers in
HPFRCC-50 (a) and
HPFRCC-100 (b) slabs
(coordinates x and y are
referred to the centroids of
the measuring cells
highlighted in Fig. 1)
586 Materials and Structures (2012) 45:575–589

This allowed the fiber orientation factor to be calcu-
lated according to the well known formula:
a ¼ nfibers
Af
Vf
ð7Þ
with nfibers specific number of fibers on the fracture
surface, Af cross section area of a single fiber and Vf
fiber volume fraction. With reference to the latter,
calculations have been made either assuming the
nominal fiber dosage (50 kg/m3—Vf = 0.64%;
100 kg/m3—Vf = 1.27%) or the actual one for each
single cell, as either assessed through the analysis of
non-destructively garnered measurements or quanti-
fied by means of destructive testing as it will be further
explained in details.
The acceptable correlation between the fiber ori-
entation factors calculated as above and the fractional
compensated inductances, along the same direction,
calculated according to Eq. 5 (Fig. 13) supports by
evidence the method reliability, at least with reference
to its sensitivity to fiber orientation.
Finally destructive evaluation of fiber concentra-
tion was performed by crushing specimens into a cast-
iron mortar, separating fibers with a magnet and
weighing them; weight was then referred to the
measured dimensions of each specimen. Such an
operation, because of its time consumption and labor
intensiveness, was performed for a limited number of
specimens (actually 10 out of 18 for each slab) and
namely the ones which appear shadowed in Fig. 2.
The data shown in Fig. 14 highlight once again the
reliability of the method which has been hence proved
to be able to detect with sharp sensitivity both fiber
orientation and local average concentration.
7 Conclusions
A new methodology for non-destructive monitoring of
fiber dispersion and orientation in steel fiber rein-
forced cementitious composites has been presented in
this paper. The method is based on ferromagnetic
properties of steel fibers commonly employed in most
of SFRC applications and hence on the modification
which results, as a function of the fiber concentration
and orientation, on the magnetic field path generated
by a probe when leant on the specimen/structure
surface. The main features of the method which are
worth being highlighted for its potential use in quality
control and monitoring of SFRC structural applica-
tions are its ease of use and its insensitiveness to
moisture content and gradients inside the specimen as
well as to the specimen/probe coupling.
The method has been thoroughly and successfully
validated through comparison with destructively mea-
sured dispersion and orientation of the fibers in thin
slabs (25 mm thickness) cast with a self-consolidating
Fig. 13 Correlation between fiber orientation factor and
fractional compensated inductance
(a)
(b)
Fig. 14 Fiber concentration (kg/m3): destructive (D) measure-
ments versus not-destructive (ND) estimates for HPFRCC-50
(a) and HPFRCC-100 (b) slabs
Materials and Structures (2012) 45:575–589 587
High Performance Fiber Reinforced Cementitious
Composite containing different amounts of fiber
reinforcement. Due to the self compactability of the
mixtures and to an ad-hoc designed casting process,
preferential orientation of the fibers was obtained,
which has been reasonably captured by the method.
Actually the method can work also with thicker slabs,
because, as it has been shown in [31], the probe
generates a significant magnetic flux density also at
depths greater than 25 mm, which allow the detection
of ferromagnetic materials in thicker elements. More-
over it is possible to further increase this capability by
suitably modifying the distance between the pole
pieces.
In a companion paper [27], the effects of the
aforementioned flow-induced orientation as well as of
fiber dispersion on the tensile fracture toughness of the
fiber reinforced composites will be thoroughly exper-
imentally analyzed and correlation with the measure-
ments garnered through the proposed non-destructive
method will be established. This will be also instru-
mental at paving the way to effectively incorporate
non-destructive testing methods into design oriented
procedures for the identification of relevant material
properties.
Work is also ongoing to address the applicability of
the proposed method and set-up to real scale precast
elements and correlate the results to their structural
performance.
Acknowledgments The authors wish to acknowledge the
help of Mr. Stefano Bufalino in performing experimental
measurements and tests and reducing data, in partial fulfilment
of the requirements for his BSc in Civil and Environmental
Engineering.
References
1. Romualdi JP, Batson GB (1964) Tensile strength of con-
crete affected by uniformly distributed and closely spaced
short lengths of wire reinforcement. ACI J 61(6):657–672
2. Model Code (2010) 1st complete draft, March 2010, 2 vol
3. Bayasi MZ, Soroushian P (1992) Effect of steel fiber rein-
forcement on fresh mix properties of concrete. ACI Mater J
89(2):369–374
4. Ferrara L, Meda A (2006) Relationships between fibre
distribution, workability and the mechanical properties of
SFRC applied to precast roof elements. Mater Struct
39(4):411–420
5. Ferrara L, Park YD, Shah SP (2008) Correlation among
fresh state behaviour, fiber dispersion and toughness prop-
erties of SFRCs. ASCE J Mater Civ Eng 20(7):493–501
6. Stahli P, Custer R, van Mier JGM (2008) On flow properties,
fibre distribution, fibre orientation and flexural behaviour of
FRC. Mater Struct 41(1):189–196
7. Ferrara L, Ozyurt N, di Prisco M (2011) High mechanical
performance of fiber reinforced cementitious composites:
the role of ‘‘casting-flow’’ induced fiber orientation. Mater
Struct 44(1):149–168
8. Martinie L, Roussel N (2010) Fiber reinforced cementitious
materials: from intrinsic isotropic behaviour to fiber align-
ment. In: Khayat KH, Feys D (eds) Design, production and
placement of self-consolidating concrete, proceedings of
the 6th international RILEM symposium on SCC and the 4th
North American conference on the design and use of SCC,
SCC 2010, 26–29 September 2010. Springer, Montreal,
pp 407–416
9. Brandt AM (1985) On the optimal direction of short metal
fibres in brittle matrix composites. J Mater Sci 20:3841–
3850
10. Brandt AM (1986) Influence of the fibre orientation on the
energy absorption at fracture of SFRC specimens. In: Brandt
AM, Marshall IH (eds) Brittle matrix composites 1. Elsevier
Applied Science Publishers, London, pp 403–420
11. Brandt AM (1987) Influence of the fibre orientation on the
mechanical properties of fibre reinforced cement (FRC)
specimens. In: Proceedings of international congress RI-
LEM, vol 2, pp 651–658
12. Stroeven P, Shah SP (1978) Use of radiography-image
analysis for steel fiber reinforced concrete. In: Swamy RN
(ed) Testing and test methods of fiber cement composites.
Construction Press, Lancaster, pp 345–353
13. Ferrara L, Dozio D, di Prisco M (2007) On the connections
between fresh state behavior, fiber dispersion and toughness
properties of steel fiber reinforced concrete. In: Naaman A,
Rheinhardt HW (eds) Proceedings of the 5th international
RILEM workshop on high performance fiber reinforced
cementitious composites, HPFRCC5, 11–13 July 2007,
Mainz, Germany. RILEM Publications. PRO 53, pp 249–
258
14. Vandewalle L, Heriman G, van Rickstal F (2008) Fibre
orientation in self-compacting fibre reinforced concrete. In:
Gettu R (ed) Fiber reinforced concrete: design and appli-
cations, proceedings of the 7th international RILEM sym-
posium, BEFIB 2008, 17–19 September 2008, Chennai,
India. RILEM Publications. PRO 60, pp 719–728
15. Grunewald S (2004) Performance based design of self
compacting steel fiber reinforced concrete. PhD Thesis,
Delft University of Technology
16. Torrijos MC, Barragan BE, Zerbino RL (2010) Placing
conditions, mesostructural characteristics and post-cracking
response of fiber reinforced self-compacting concretes.
Constr Build Mater 24:1078–1085
17. Sanal I, Ozyurt N (2010) Effects of formwork dimensions
on the performance of fiber-reinforced cement based
materials. In: Proceedings of the 9th international congress
on advances in civil engineering, 27–30 September 2010,
Trabzon, Turkey
18. Molins Borrel C, Martinez Martinez JA, Arnaiz Alvaro N
(2008) Distribucion de fibras de acero en probetas prism-
aticas de hormigon. In: Proceedings IV Congreso Inter-
nacional de Estructuras de la Asociacion Cientıfico-tecnica
del Hormigon Estructural, Valencia, Espana (in Spanish)
588 Materials and Structures (2012) 45:575–589
19. Ozyurt N, Woo LY, Mason TO, Shah SP (2006) Monitoring
fiber dispersion in fiber reinforced cementitious materials:
comparison of AC impedance spectroscopy and image
analysis. ACI Mater J 103(5):340–347
20. Woo LY, Wansom S, Ozyurt N, Mu B, Shah SP, Mason TO
(2005) Characterizing fiber dispersion in cement compos-
ites using AC Impedance Spectrometry. Cem Concr Com-
pos 27:627–636
21. Ozyurt N, Mason TO, Shah SP (2006) Non destructive
monitoring of fiber orientation using AC-IS: an industrial
scale application. Cem Concr Res 36:1653–1660
22. Douglas JF, Garboczi EJ (1995) Intrinsic viscosity and the
polarizability of particles having a wide range of shapes. In:
Advances in chemical physics, vol XCI. Wiley, New York,
pp 2265–2270
23. Ozyurt N, Mason TO, Shah SP (2007) Correlation of fiber
dispersion, rheology and mechanical performance of FRCs.
Cem Concr Compos 29:70–79
24. Lataste JF, Behloul M, Breysse D (2008) Characterisation
of fibres distribution in a steel fibre reinforced concrete with
electrical resistivity measurements. NDT & E Int 41(8):
638–647
25. Barnett S, Lataste JF, Parry T, Millard SG, Soutsos MN
(2010) Assessment of fibre orientation in ultra high per-
formance fiber reinforced concrete and its effect on flexural
strength. Mater Struct 43(7):1009–1023
26. Van Damme S, Franchois A, De Zutter D, Taerwe L (2009)
Nondestructive determination of the steel fiber content in
concrete slabs with an open-ended coaxial probe. IEEE
Trans Geosci Remote Sens 42(11):2511–2521
27. Ferrara L, Faifer M, Muhaxheri M, Toscani S (2011) A
magnetic method for non destructive monitoring of fiber
dispersion and orientation in steel fiber reinforced cemen-
titious composites. Part 2: correlation to tensile fracture
toughness. Mater Struct. doi:10.1617/s11527-011-9794-x
28. Ferrara L, di Prisco M, Lamperti MGL (2010) Identification
of the stress-crack opening behavior of HPFRCC: the role of
flow-induced fiber orientation. In: Oh BH et al (eds) Pro-
ceedings FraMCoS 7, 23–28 May 2010, Jiejiu, South Korea,
pp 1541–1550
29. di Prisco M, Lamperti MGL, Lapolla S (2010) On Double
Edge Wedge Splitting test: preliminary results. In: Oh BH
et al (eds) Proceedings FraMCoS 7, 23–28 May 2010, Jiejiu,
South Korea, pp 1533–1540
30. Soroushian P, Lee CD (1990) Distribution and orientation of
fibers in steel fiber reinforced concrete. ACI Mater J 87(5):
433–439
31. Faifer M, Ottoboni R, Toscani S, Ferrara L (2011) Non-
destructive testing of steel fiber reinforced concrete using a
magnetic approach. IEEE Trans Instrum Meas 60(5):
1709–1717
Materials and Structures (2012) 45:575–589 589
Copyright © 2022 FDOKUMEN