A Macroeconomic Study Applied to US FDI in the NAFTA and the MERCOSUR
25
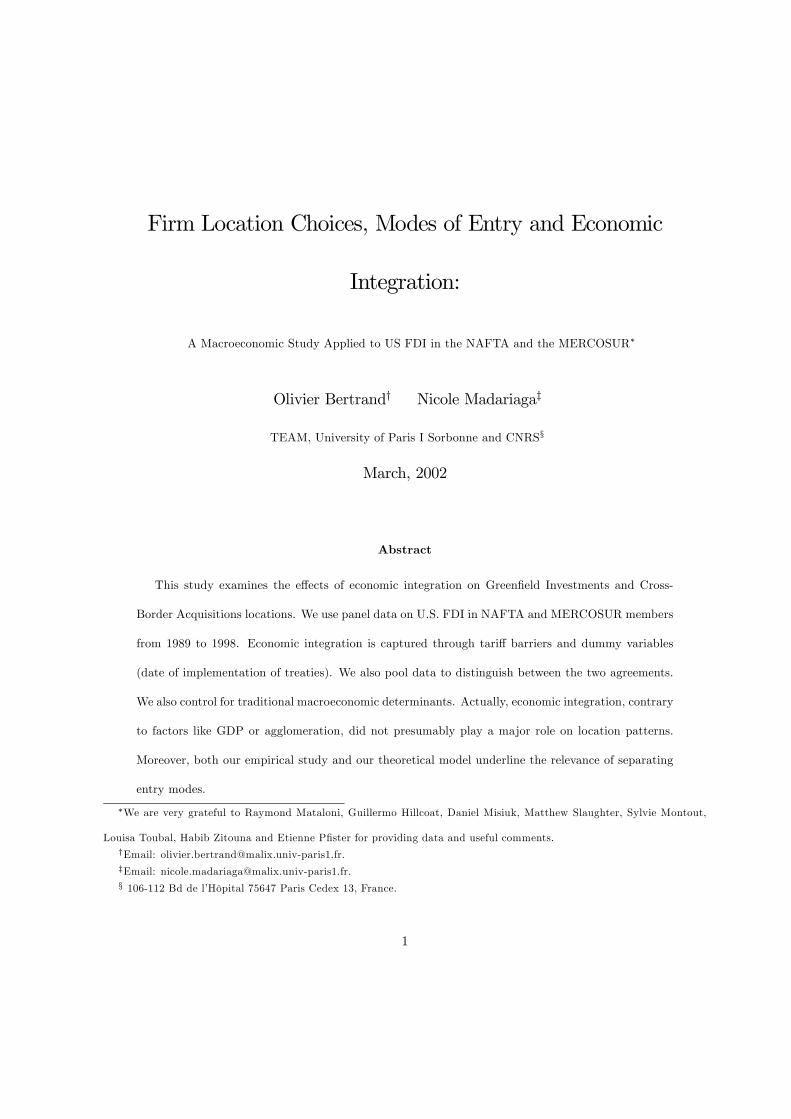
Firm Location Choices, Modes of Entry and Economic Integration: A Macroeconomic Study Applied to US FDI in the NAFTA and the MERCOSUR ∗ Olivier Bertrand † Nicole Madariaga ‡ TEAM, University of Paris I Sorbonne and CNRS § March, 2002 Abstract This study examines the effects of economic integration on Greenfield Investments and Cross- Border Acquisitions locations. We use panel data on U.S. FDI in NAFTA and MERCOSUR members from 1989 to 1998. Economic integration is captured through tariff barriers and dummy variables (date of implementation of treaties). We also pool data to distinguish between the two agreements. We also control for traditional macroeconomic determinants. Actually, economic integration, contrary to factors like GDP or agglomeration, did not presumably play a major role on location patterns. Moreover, both our empirical study and our theoretical model underline the relevance of separating entry modes. ∗ We are very grateful to Raymond Mataloni, Guillermo Hillcoat, Daniel Misiuk, Matthew Slaughter, Sylvie Montout, Louisa Toubal, Habib Zitouna and Etienne Pfister for providing data and useful comments. † Email: [email protected]. ‡ Email: [email protected]. § 106-112 Bd de l’Hôpital 75647 Paris Cedex 13, France. 1
-
Upload
independent -
Category
Documents
-
view
7 -
download
0
Transcript of A Macroeconomic Study Applied to US FDI in the NAFTA and the MERCOSUR
Firm Location Choices, Modes of Entry and Economic
Integration:
A Macroeconomic Study Applied to US FDI in the NAFTA and the MERCOSUR∗
Olivier Bertrand† Nicole Madariaga‡
TEAM, University of Paris I Sorbonne and CNRS§
March, 2002
Abstract
This study examines the effects of economic integration on Greenfield Investments and Cross-
Border Acquisitions locations. We use panel data on U.S. FDI in NAFTA and MERCOSUR members
from 1989 to 1998. Economic integration is captured through tariff barriers and dummy variables
(date of implementation of treaties). We also pool data to distinguish between the two agreements.
We also control for traditional macroeconomic determinants. Actually, economic integration, contrary
to factors like GDP or agglomeration, did not presumably play a major role on location patterns.
Moreover, both our empirical study and our theoretical model underline the relevance of separating
entry modes.
∗We are very grateful to Raymond Mataloni, Guillermo Hillcoat, Daniel Misiuk, Matthew Slaughter, Sylvie Montout,
Louisa Toubal, Habib Zitouna and Etienne Pfister for providing data and useful comments.†Email: [email protected].‡Email: [email protected].§ 106-112 Bd de l’Hôpital 75647 Paris Cedex 13, France.
1
J.E.L. classification: F15, F23, L10, L16, R12.
Keywords: FDI, integration, location, mode of entry.
1 Introduction
During the 1990s, a surge in outward U.S. FDI (Foreign Direct Investment) in the American continent
occurred. The U.S. FDI rose from 119 311 million U.S. dollars in 1988 to 294 955 in 19981. U.S. firms
invested especially in four main countries: Canada, Mexico, Argentina and Brazil. These four countries
accounted for more than a half of this growth. In the same period, two major regional areas - the NAFTA
(1994) and the MERCOSUR (1991) - emerged.
Although there is an interesting parallel to be drawn between the expansion of U.S. companies and
the formation of regional areas, we have actually no clear evidence from stylised facts that the economic
integration have an impact on the U.S. companies location choices. FDI in Mexico and Canada2 seem
to have considerably increased before the signature of the NAFTA even if U.S. outward FDI flows in
Mexico3 reached their highest point after 1994 (Blomström and Kokko, 1997). Besides, a boom in U.S.
FDI occurred after the MERCOSUR signature (a rise by 10% in Argentina and Brazil in 1991). But
inward FDI flows towards the MERCOSUR countries had already increased before the implementation
of the treaty.
1These figures evaluated on a historical-cost basis (BEA) include Canada, Latin America and other Western Hemisphere
.2Canada and the U.S. were already almost integrated in 1988 when they decided to sign for CUSFTA. The level of U.S.
FDI in Canada was high due to attractive canadian policies.3First reforms in favour of inward FDI in Mexico took place in the middle of the eighties.
2

We use data on U.S. outward FDI in the NAFTA (Canada and Mexico) and in the MERCOSUR (Ar-
gentina and Brazil) members over the years 1989-1998. We apply fixed effect (within) regression estimator
to deal with panel data. We perform an econometric analysis in order to separate economic integration
from other parameters influencing FDI location (for example market size effect or macroeconomic sta-
bilization). Different measures are used with a view to capture economic integration: transaction costs
(tariff barriers) and dummy variables refering to the date of implementation of the MERCOSUR and the
NAFTA. Furthermore, there is no reason to think that the NAFTA and the MERCOSUR has the same
impact since in the former case, the U.S. is an insider whereas in the latter one, it is an outsider. There-
fore, data are pooled in such a way that inter MERCOSUR and NAFTA differences are investigated.
The assessment of economic integration impacts could reveal a real political stake in the prospect of the
FTAA signature (Free Trade Agreement of the Americas) by 2005. All American continent countries are
in full negotiations to progress step by step into the formation of the FTAA.
Nevertheless, it would be insufficient to analyse aggregate FDI flows. Also, we must examine both
Greenfield Investments (G.I.)4 and Cross-border Mergers & Acquisitions5 (M&A). Thus in this article,
we relax both empirically and theoretically6 the traditional assumption in FDI literature that FDI can be
viewed as G.I. As Lipsey7 (2000) rightly points out, M&A should be better considered to understand the
industrial globalization process occurring in developed and developing countries. Indeed, Cross-Border
M&A represent almost 85% of worldwide FDI transactions value in 2000. The total number of Cross-
Border M&A has grown very quickly over the period 1991-1998. It has gone up from 4 149 transactions4We can define Greenfield Investment as the establishment of a new production facility in contrast to cross-border Merger
& Acquisition where a firm purchases shares in an existing foreign firm.5Even if our study actually focuses on acquisition strategy empirically and theoretically, we will report it under the
broader heading “M&A”.6Thanks to a simple Cournot model.7The first primary role of FDI could be not to finance capital formation since FDI flows between developed countries
mainly take the form of Cross-Border M&A. Thus, FDI flows could be regarded as a mean of transferring assets from less
efficient owners located in one country to more efficient owners located in an other country.
3
in 1991 to 5 373 transactions in 1998 (with a peak of 6 310 in 1995). Again, such a distinction may imply
important consequences in terms of economic policy (see WIR, 20008).
To sum up, the purpose of our article is twofold. On the one hand, we attempt to evaluate the impact
of macroeconomic location factors on U.S. outward FDI in Argentina, Brazil, Mexico and Canada over
the period 1989-1998. We particularly shed light on the role played by economic integration (NAFTA
and MERCOSUR agreements) on the location pattern of new U.S. foreign affiliates. On a second hand,
we try to assess if the two main kinds of FDI, i.e. G.I. and Cross-Border M&A, respond to the country
location determinants in a similar way. The paper proceeds as following: section 2 presents the related
literature. In the section 3, a simple Cournot model puts the stress on the difference between G.I and
M&A. Then, section 4 reports the econometric method and the variables used. Finally, before concluding,
section 5 discusses the empirical findings.
2 FDI location and mode of entry
Our work come from two fields of the literature: FDI location and mode of entry.
2.1 FDI location choices
2.1.1 Determinants of firms location
According to new theories of international trade and economic geography, product differentiation, im-
perfect competition, trade costs and economies of scale are essential to explain firms location choices
(Fujita and al., 1999 and Venables, 1996). They actually emphasize the importance of local demand
and agglomeration effects on FDI location patterns. A strong demand in a host country attracts foreign
companies (size market effect). Agglomeration influence (great number of firms in a given country) is
8World Investment Report (2000), “Cross-border mergers and acquisitions and development”, UNCTD.
4
more compound. Firstly, it increases competition between firms and deters them from locating in the
host country. Secondly, the proximity to numerous firms improves input markets access and strengthens
potential technological spillovers. For instance, according to Venables (1996), firms may not only be at-
tracted by the local availability of skilled labour or scientific knowledge but also by links with other firms
(called vertical links). The effect of agglomeration is to create internal and external economies of scale
determining the spatial growth process. A cumulative phenomenon can then happen (Myrdal, 1957).
Such insights into location choices have been confronted with empirical analysis. Many works test the
importance of agglomeration effects on the location of U.S. FDI in Europe (Barrell and Pain, 1999), in
Ireland (Barry and al., 2001) or in 42 different countries (Wheeler and Mody, 1992). At a macroeconomic
level, Bajo-Rubio and Sosvilla-Rivero (1994) have built a theoretical model, inspired by Barrel and Pain
(1996) where they analyse the determinants of FDI. The model underlines the impact of past stocks of
FDI (interpreted as an agglomeration proxy) on current inward investments. At a sectoral level, Mody
and Srinivasan (1998) confirm the persistence effect of past investment levels (See also Head and al., 1995
or Mayer and Mucchielli, 1999)
Other host country characteristics have been studied: market size effect, factor costs, difference in
corporate taxes between countries, country risk but also exchange rate or R&D expenditures. The table
1 gives some major macroeconomic factors which are usually mentioned in FDI determinants literature.
In this article we will focus on the economic integration process.
2.1.2 The economic integration impact on FDI
From a theoretical standpoint, the economic integration process can substantially alter industrial struc-
tures and location activity patterns through the two agglomeration effects identified above, in other
worlds centripetal (or concentration) forces and centrifugal (or dispersion) forces.
Using industry-level data, Mayer and Mucchielli (1999) support the intuition that location determi-
nants affect differently FDI according to the geographic level (infra-national level-i.e. regional level- and
5
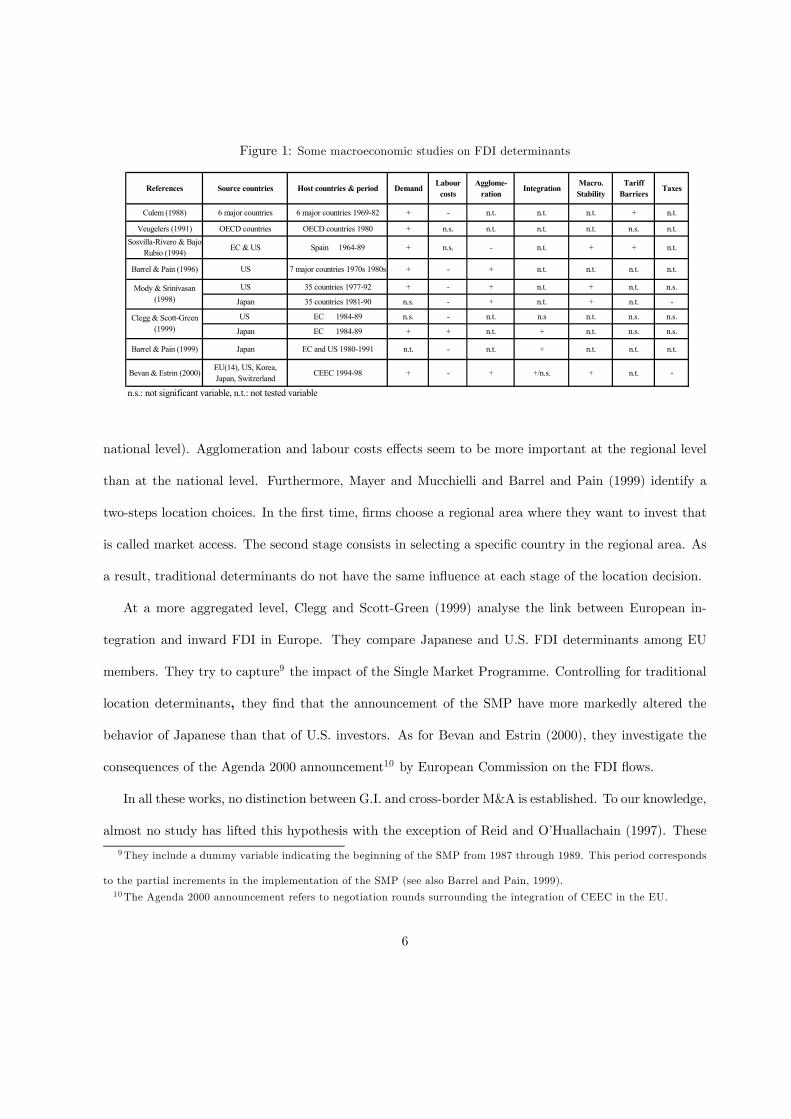
Figure 1: Some macroeconomic studies on FDI determinants
References Source countries Host countries & period Demand Labour costs
Agglome- ration
Integration Macro. Stability
Tariff Barriers
Taxes
Culem (1988) 6 major countries 6 major countries 1969-82 + - n.t. n.t. n.t. + n.t.
Veugelers (1991) OECD countries OECD countries 1980 + n.s. n.t. n.t. n.t. n.s. n.t.Sosvilla-Rivero & Bajo-
Rubio (1994) EC & US Spain 1964-89 + n.s. - n.t. + + n.t.
Barrel & Pain (1996) US 7 major countries 1970s 1980s + - + n.t. n.t. n.t. n.t.
US 35 countries 1977-92 + - + n.t. + n.t. n.s.
Japan 35 countries 1981-90 n.s. - + n.t. + n.t. -
US EC 1984-89 n.s. - n.t. n.s n.t. n.s. n.s.
Japan EC 1984-89 + + n.t. + n.t. n.s. n.s.
Barrel & Pain (1999) Japan EC and US 1980-1991 n.t. - n.t. + n.t. n.t. n.t.
Bevan & Estrin (2000)EU(14), US, Korea, Japan, Switzerland
CEEC 1994-98 + - + +/n.s. + n.t. -
n.s.: not significant variable, n.t.: not tested variable
Clegg & Scott-Green (1999)
Mody & Srinivasan (1998)
national level). Agglomeration and labour costs effects seem to be more important at the regional level
than at the national level. Furthermore, Mayer and Mucchielli and Barrel and Pain (1999) identify a
two-steps location choices. In the first time, firms choose a regional area where they want to invest that
is called market access. The second stage consists in selecting a specific country in the regional area. As
a result, traditional determinants do not have the same influence at each stage of the location decision.
At a more aggregated level, Clegg and Scott-Green (1999) analyse the link between European in-
tegration and inward FDI in Europe. They compare Japanese and U.S. FDI determinants among EU
members. They try to capture9 the impact of the Single Market Programme. Controlling for traditional
location determinants, they find that the announcement of the SMP have more markedly altered the
behavior of Japanese than that of U.S. investors. As for Bevan and Estrin (2000), they investigate the
consequences of the Agenda 2000 announcement10 by European Commission on the FDI flows.
In all these works, no distinction between G.I. and cross-border M&A is established. To our knowledge,
almost no study has lifted this hypothesis with the exception of Reid and O’Huallachain (1997). These
9They include a dummy variable indicating the beginning of the SMP from 1987 through 1989. This period corresponds
to the partial increments in the implementation of the SMP (see also Barrel and Pain, 1999).10The Agenda 2000 announcement refers to negotiation rounds surrounding the integration of CEEC in the EU.
6
authors examine the interaction between mode of entry and location decision of Japanese companies
penetrating into the U.S. market. They notice that M&A or G.I. locations are not sensible to the same
determinants. They also notice that M&A are less concentrated geographically than G.I. Indeed, M&A
locations are constrained in a given region by the scarcity of available purchasable target firm.
2.2 The entry mode of multinational companies : Greenfield Investments
and cross-border M&A analysis
We can distinguish two main empirical ways of dealing with entry modes of multinational companies in
a host country.
One way consist in examining explicitly the trade-off between Greenfield Investment and Cross-Border
M&A. The related literature usually deals with determinants at a sectoral level11 . The first major study
on this trade-off goes back to Caves and Mehra in 1986 (U.S. inward FDI). Kogut and Singh (1988)
evaluate the impact of cultural distance on the entry mode of foreign firms in the U.S. They observe that
the more host and home countries are culturally distant, the more foreign firms are inclined to undertake
G. I. Cultural distance hinders Cross-Border M&A by increasing the organizational cost of integration12.
Zejan (1990), then Andersson and Swensson (1996) examine Swedish overseas strategies. Zejan wonders
whether country factors, particularly the market size, and the country development level, intervene in
such a trade-off. When a higher country development level seems to ease M&A strategy, the market
size does not play a significant role. Andersson and Swensson (1996) cast doubt on “risk versus rate of
return” trade-off hypothesis13. Last instance: Hennart and Park in 1993 analyse foreign firm entry in
11The R&D intensity, the degree of diversification, the level of foreign experience, the cultural distance, the time of entry
and the growth rate of a sector are the most frequently industry and firm-specific variables used.12Nevertheless, we must not overlook intangible assets complementary cultural gap can bring.13 It is often considered that G.I. is riskier than Cross-Border M&A but also more profitable. By acquiring a company,
a foreign firm can secure market shares (at less in the short run), take control of an efficient distribution network, access
information on local condition ... On the other hand, the competition between potential acquirers in the corporate for
7
the U.S. market mostly in a transaction cost framework. The firm’s propensity to set up a new venture
rather than acquire an existing local company is related to firm-specific assets owned by the acquirer and
the purchased firm.
An other group of studies are interested in assessing the effect of specific factors on each mode of
entry (see also Reid and O’Huallachain above). Balwin and Gorecki (1987) analyse the entry process in
Canadian sector by standing out for both entry modes (internal or external growth) and the nationality
of involved firms (foreign or domestic firms). Swenson (1999) focuses on the link between trade and
foreign investment in the U.S. according to the entry mode. Various authors have explored the effects of
exchange rate movements on the FDI flows. For instance, Froot and Stein (1991) put forward a Wealth
Effect due to the imperfection of capital market. Other studies have focused exclusively on cross-border
M&A14.
Surprisingly, almost no empirical work has tackled the issue of M&A and G.I. locations and their
determinants while it has become a central question during the last decade. From a theoretical standpoint,
we have no reason to expect that M&A and G.I. respond to a same factor similarly. This can be
demonstrated easily with the help of a simple horizontal FDI model.
3 A simple Cournot model
We dot not aim at providing a full model of horizontal15 M&A and G.I. but just at giving theoretical
evidence that these two entry modes may not be sensible to traditional FDI determinants identically. We
consider a two firms - two countries model. We state that the home firm can enter the host market by
three ways: exports, G.I and M&A. The entry choice of the foreign market will have consequences on the
market control can drive the price of target firms upwards.14 See for example Louri (2001) at a microeconomic level and Kish and Vasconcellos (1993) for a macroeconomic approach.15 In 1999, 70% of Cross-Border M&A value corresponded to horizontal FDI. In 1989, this share was only of 59%. Vertical
M&A are also in progress but they haven’t exceeded 10% of total M&A.
8

host market structure.
The inverse demand for the homogeneous goods is linear : p = a− qT where qT is the total produc-
tion delivered in the host country. The marginal cost of production is constant. We suppose Cournot
competition if the firms meet each others in the market.
There are 3 potential market structures depending on the choice of home firm mode of entry.
• Case One: the home firm continues to serve the host market by exporting. Then, it bears trans-
action costs to deliver goods in the host country. The home firm is only taxed in its own country.
Consequently, profits in the host and home country respectiveley are:
π∗1 = (1− t∗) q∗[a− q∗ − q − d− c∗]
π1 = (1− t) q[a− q∗ − q − c]
Where a is the demand in the host country, t, c, t∗, c∗ are tax rates and production costs in the host
and the home country respectively and d is the transaction cost between host and home country.
• Case two : the home firm sets up a new factory in the host country. It does not bear transaction
costs anymore but has to pay an exogenously given fixed cost F . In this case, the home firm is
taxed by host country authorities.
π∗2 = (1− t) [q∗(a− q∗ − q − c)− F ]
π2 = (1− t) [q(a− q∗ − q − c)]
• Case three: the home firm takes over the domestic firm. M&A induce both efficiency gains and a
rise in the market power of the home firm. M&A imply rationalization gains16 since the acquirer
rationalizes output across its plants by transfering production from the lesser efficient firm to the
more efficient one. In another side, by taking over the local firm, the foreign firm secures a monopoly
position. The Mark-Up of the foreign firm increases, other things being equal.
16We assume there are no synergy gains.
9
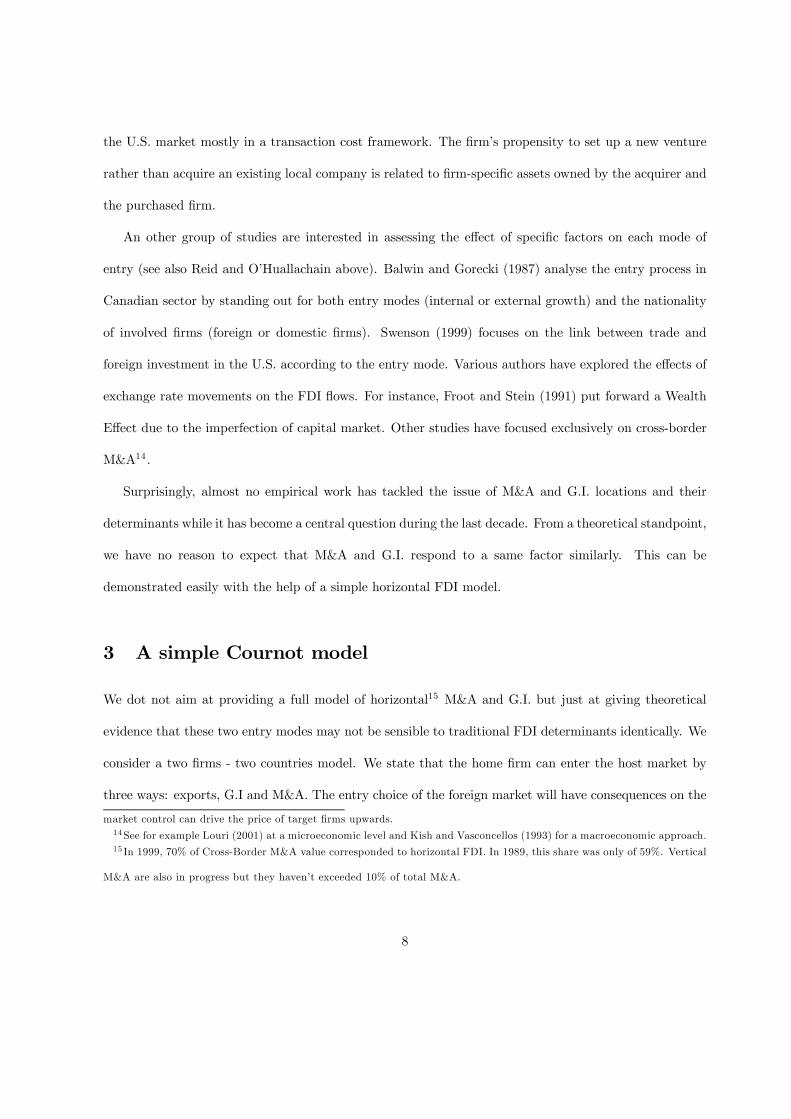
Figure 2: Some expected theoretical signs from a simple Cournot model
factors G.I. M&A
transaction costs between countries + +/-/?
home country production costs + +/-/?
host country production costs - -/?
home country tax rate + +
host country tax rate - -/?
host country demand +/-/? +/?
π∗3 = (1− t) [q∗(a− q∗ − c)−R]
π3 = R
where R is the endogenously determined acquisition price equal to the value of π1 at equilibrium. We
suppose the hypothese of “Take-Or-Leave-It”. The home country firm proposes an acquisition price to
the host country firm. The latter accept or refuse the proposition. The negociation power of the host firm
is then limited. However, the host firm do not accept any price. It claims a minimum price corresponding
to the profit it would gain if it refused to be saled. Thus it equals to the profit the host firm would get
if the foreign company carried on exporting.
Calculating the home and host firms profit at the equilibrium in this three cases, we get the change in
profits caused by building a new plant or acquiring the domestic firm. The figure 2 summarizes the sign
of change in profits derivatives (see Appendix B for further calculations). According to the values of the
different parameters, the effect of a factor on FDI strategy can be either negative, positive or unspecified.
The signs of derivative are clear and conform to intuition for the G.I. except for the market size effect.
A stronger market size attract G.I. with certainty only when both the tax rates and the production
costs (transaction cost included) are superior in the home country. On the other hand, signs are often
indeterminate for M&A. For instance, a rise in transaction costs always encourage the home country firm
to set up a plant overseas (tariff jumping argument). Such an impact is less obvious for M&A. When
10
transaction costs increase, the foreign firm will have more incentives to take over the local firm if two
conditions are respected. First, the production cost in the home country must be weaker than production
costs in the host country. It implies that the local firm is less competitive on its own market than the
home country firm. The minimum price claimed by the host country firm is low. Second, the home
country tax has not to be too high. Why? The acquisition price is determined endogenously. Rising
transaction costs shelter the host country firm. The profits of the firm improve if it refuses to be sold
and thus compels the foreign firm to serve the domestic market by exporting. The Tariff Jumping effects
can be offset by the increase in the acquisition price.
Now, we estimate empirically to what extent American firms react to FDI factors.
4 Data and methodology
This paper only takes into account macroeconomic characteristics of host country for the simple reason
that sectoral data per country are not available. We suppose that macroeconomic factors explain the
structure (intensity and orientation) of FDI flows while microeconomic determinants allow us to analyse
the feature of sectors or firms engaged in globalization process.
We use data on U.S. outward FDI in the NAFTA (Canada and Mexico) and in the MERCOSUR
(Argentina and Brazil) members over the period 1989-1998. Our dependent variable is the number of
new plant transactions in each country (decomposed into G.I. and M&A). Empirical analyses focus very
often on U.S. inward G.I. and M&A. We enlarge the geographic area to NAFTA and MERCOSUR
countries. U.S. outward FDI are recorded less exhaustively than U.S. inward FDI, thus our empirical
approach is more restricted in terms of the period and the countries collected17.
17 Indeed, statistical offices (with the exception of the USA and Argentina) in most countries do not record the mode of
entry. Consequently, what share of FDI flows is accounted by G.I. in one given country must be inferred from different
statistical sources. Hence, getting very accurate estimation in most countries (WIR, 2000) is very difficult.
11
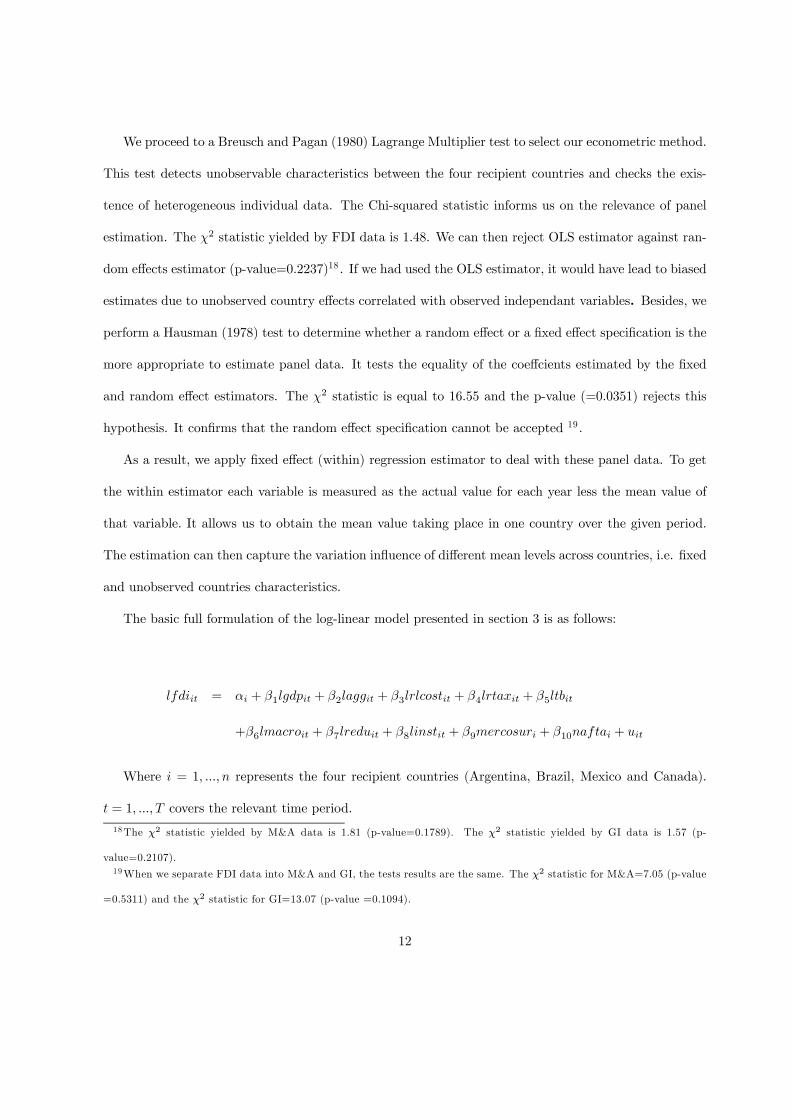
We proceed to a Breusch and Pagan (1980) Lagrange Multiplier test to select our econometric method.
This test detects unobservable characteristics between the four recipient countries and checks the exis-
tence of heterogeneous individual data. The Chi-squared statistic informs us on the relevance of panel
estimation. The χ2 statistic yielded by FDI data is 1.48. We can then reject OLS estimator against ran-
dom effects estimator (p-value=0.2237)18. If we had used the OLS estimator, it would have lead to biased
estimates due to unobserved country effects correlated with observed independant variables. Besides, we
perform a Hausman (1978) test to determine whether a random effect or a fixed effect specification is the
more appropriate to estimate panel data. It tests the equality of the coeffcients estimated by the fixed
and random effect estimators. The χ2 statistic is equal to 16.55 and the p-value (=0.0351) rejects this
hypothesis. It confirms that the random effect specification cannot be accepted 19.
As a result, we apply fixed effect (within) regression estimator to deal with these panel data. To get
the within estimator each variable is measured as the actual value for each year less the mean value of
that variable. It allows us to obtain the mean value taking place in one country over the given period.
The estimation can then capture the variation influence of different mean levels across countries, i.e. fixed
and unobserved countries characteristics.
The basic full formulation of the log-linear model presented in section 3 is as follows:
lfdiit = αi + β1lgdpit + β2laggit + β3lrlcostit + β4lrtaxit + β5ltbit
+β6lmacroit + β7lreduit + β8linstit + β9mercosuri + β10naftai + uit
Where i = 1, ..., n represents the four recipient countries (Argentina, Brazil, Mexico and Canada).
t = 1, ..., T covers the relevant time period.
18The χ2 statistic yielded by M&A data is 1.81 (p-value=0.1789). The χ2 statistic yielded by GI data is 1.57 (p-
value=0.2107).19When we separate FDI data into M&A and GI, the tests results are the same. The χ2 statistic for M&A=7.05 (p-value
=0.5311) and the χ2 statistic for GI=13.07 (p-value =0.1094).
12
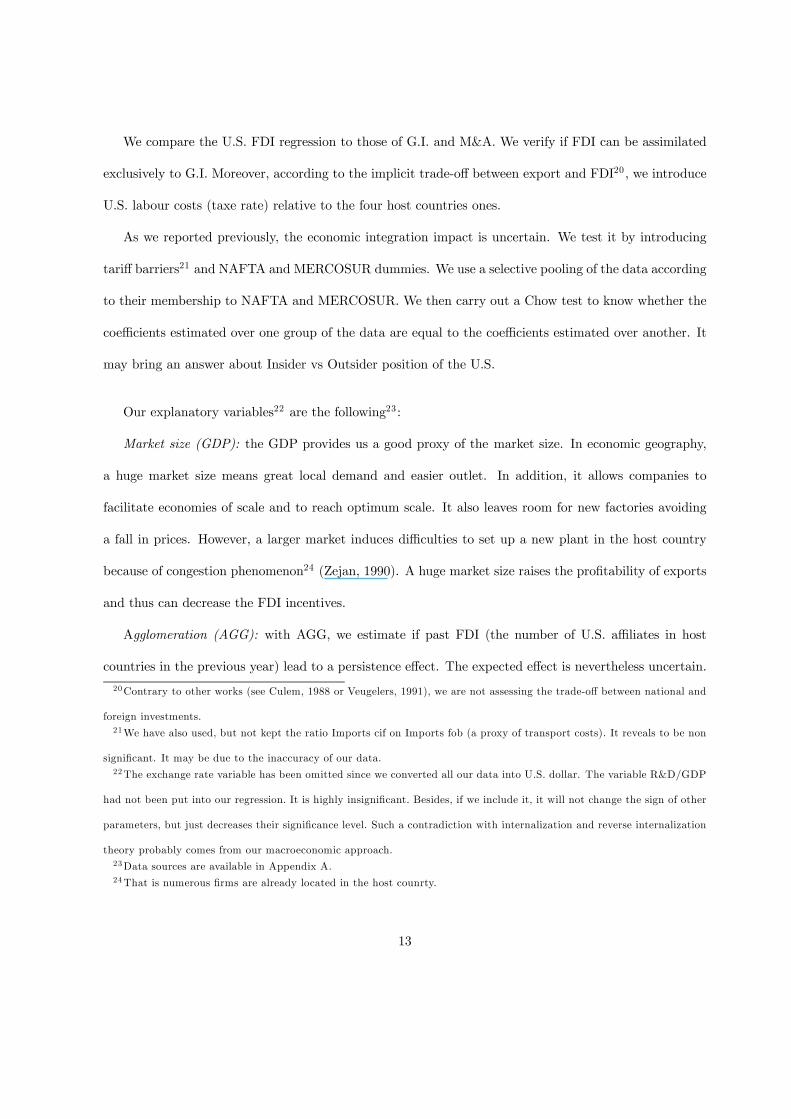
We compare the U.S. FDI regression to those of G.I. and M&A. We verify if FDI can be assimilated
exclusively to G.I. Moreover, according to the implicit trade-off between export and FDI20, we introduce
U.S. labour costs (taxe rate) relative to the four host countries ones.
As we reported previously, the economic integration impact is uncertain. We test it by introducing
tariff barriers21 and NAFTA and MERCOSUR dummies. We use a selective pooling of the data according
to their membership to NAFTA and MERCOSUR. We then carry out a Chow test to know whether the
coefficients estimated over one group of the data are equal to the coefficients estimated over another. It
may bring an answer about Insider vs Outsider position of the U.S.
Our explanatory variables22 are the following23:
Market size (GDP): the GDP provides us a good proxy of the market size. In economic geography,
a huge market size means great local demand and easier outlet. In addition, it allows companies to
facilitate economies of scale and to reach optimum scale. It also leaves room for new factories avoiding
a fall in prices. However, a larger market induces difficulties to set up a new plant in the host country
because of congestion phenomenon24 (Zejan, 1990). A huge market size raises the profitability of exports
and thus can decrease the FDI incentives.
Agglomeration (AGG): with AGG, we estimate if past FDI (the number of U.S. affiliates in host
countries in the previous year) lead to a persistence effect. The expected effect is nevertheless uncertain.
20Contrary to other works (see Culem, 1988 or Veugelers, 1991), we are not assessing the trade-off between national and
foreign investments.21We have also used, but not kept the ratio Imports cif on Imports fob (a proxy of transport costs). It reveals to be non
significant. It may be due to the inaccuracy of our data.22The exchange rate variable has been omitted since we converted all our data into U.S. dollar. The variable R&D/GDP
had not been put into our regression. It is highly insignificant. Besides, if we include it, it will not change the sign of other
parameters, but just decreases their significance level. Such a contradiction with internalization and reverse internalization
theory probably comes from our macroeconomic approach.23Data sources are available in Appendix A.24That is numerous firms are already located in the host counrty.
13
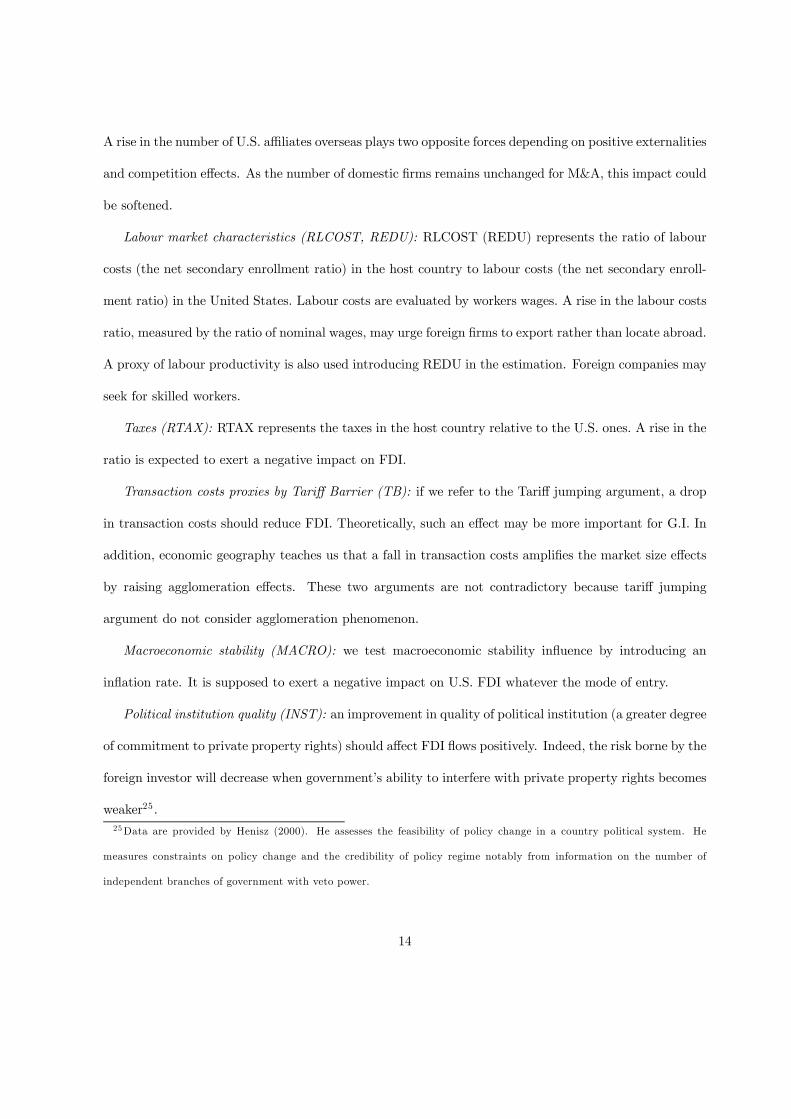
A rise in the number of U.S. affiliates overseas plays two opposite forces depending on positive externalities
and competition effects. As the number of domestic firms remains unchanged for M&A, this impact could
be softened.
Labour market characteristics (RLCOST, REDU): RLCOST (REDU) represents the ratio of labour
costs (the net secondary enrollment ratio) in the host country to labour costs (the net secondary enroll-
ment ratio) in the United States. Labour costs are evaluated by workers wages. A rise in the labour costs
ratio, measured by the ratio of nominal wages, may urge foreign firms to export rather than locate abroad.
A proxy of labour productivity is also used introducing REDU in the estimation. Foreign companies may
seek for skilled workers.
Taxes (RTAX): RTAX represents the taxes in the host country relative to the U.S. ones. A rise in the
ratio is expected to exert a negative impact on FDI.
Transaction costs proxies by Tariff Barrier (TB): if we refer to the Tariff jumping argument, a drop
in transaction costs should reduce FDI. Theoretically, such an effect may be more important for G.I. In
addition, economic geography teaches us that a fall in transaction costs amplifies the market size effects
by raising agglomeration effects. These two arguments are not contradictory because tariff jumping
argument do not consider agglomeration phenomenon.
Macroeconomic stability (MACRO): we test macroeconomic stability influence by introducing an
inflation rate. It is supposed to exert a negative impact on U.S. FDI whatever the mode of entry.
Political institution quality (INST): an improvement in quality of political institution (a greater degree
of commitment to private property rights) should affect FDI flows positively. Indeed, the risk borne by the
foreign investor will decrease when government’s ability to interfere with private property rights becomes
weaker25.25Data are provided by Henisz (2000). He assesses the feasibility of policy change in a country political system. He
measures constraints on policy change and the credibility of policy regime notably from information on the number of
independent branches of government with veto power.
14
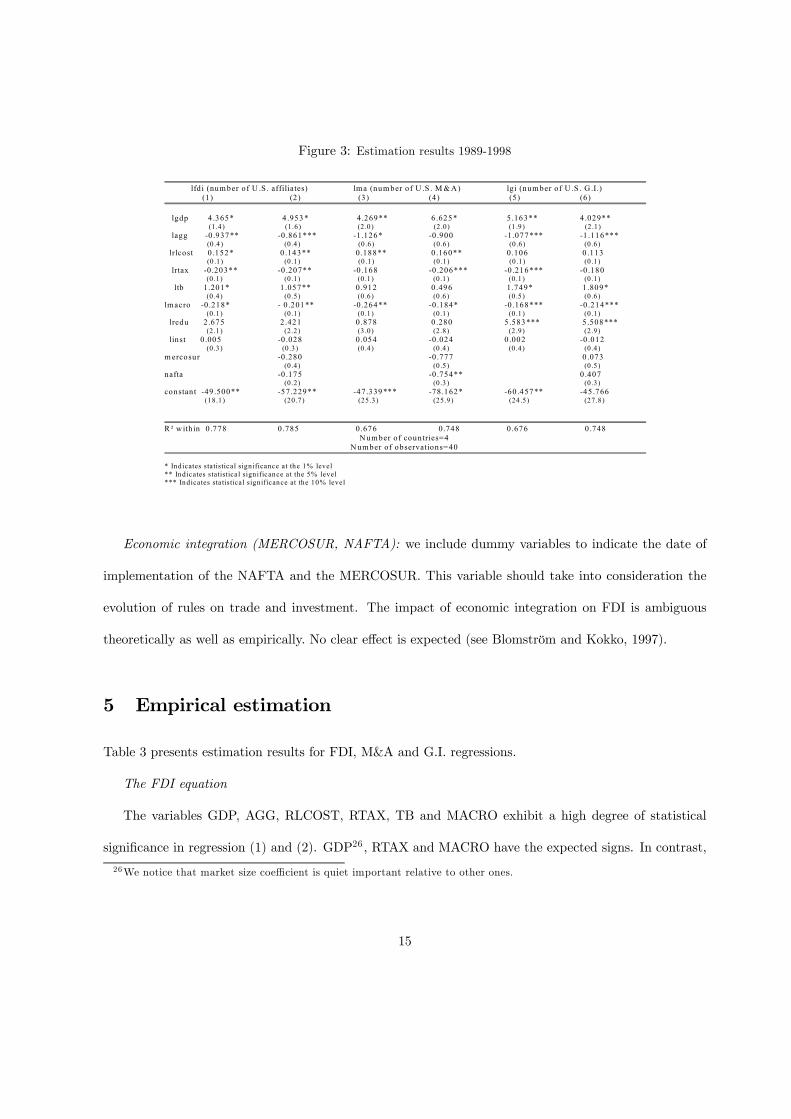
Figure 3: Estimation results 1989-1998
lfd i (num ber of U .S . affiliates) lm a (num ber of U .S . M & A ) lgi (num ber of U .S . G .I.)
(1 ) (2 ) (3 ) (4) (5 ) (6) lgdp 4 .365* 4 .953 * 4 .269 ** 6 .625* 5 .163** 4 .029** (1.4) (1.6) (2 .0) (2 .0) (1 .9) (2 .1) lagg -0 .937** -0 .861*** -1 .126* -0 .900 -1 .077*** -1 .116*** (0 .4) (0.4) (0 .6) (0 .6) (0 .6) (0 .6) lrlcost 0 .152 * 0 .143** 0 .188** 0 .160** 0 .106 0 .113 (0 .1) (0.1) (0 .1) (0 .1) (0 .1) (0 .1) lrtax -0.203** -0 .207** -0 .168 -0 .206*** -0 .216*** -0 .180 (0 .1) (0.1) (0 .1) (0 .1) (0 .1) (0 .1) ltb 1.201* 1 .057** 0 .912 0 .496 1 .749* 1 .809* (0 .4) (0.5) (0 .6) (0 .6) (0 .5) (0 .6) lm acro -0.218* - 0 .201** -0 .264** -0 .184* -0 .168*** -0 .214*** (0 .1) (0.1) (0 .1) (0 .1) (0 .1) (0 .1) lredu 2 .675 2 .421 0 .878 0 .280 5 .583*** 5 .508*** (2 .1) (2.2) (3 .0) (2 .8) (2 .9) (2 .9) linst 0.005 -0 .028 0 .054 -0 .024 0 .002 -0 .012 (0 .3) (0 .3) (0 .4) (0 .4) (0 .4) (0 .4) m ercosur -0 .280 -0 .777 0 .073 (0.4) (0 .5) (0 .5) nafta -0 .175 -0 .754** 0 .407 (0.2) (0 .3) (0 .3) constan t -49 .500** -57 .229 ** -47 .339 *** -78 .162 * -60 .457 ** -45 .766
(18.1) (20 .7) (25 .3) (25 .9) (24 .5) (27.8)
R ² w ith in 0 .778 0 .785 0 .676 0.748 0 .676 0 .748
N um ber of countries=4 N um ber of observations=40
* Indicates statistical significance at the 1% level ** Ind icates statistical sign ificance at the 5% level *** Indicates sta tistical significance at the 10% level
Economic integration (MERCOSUR, NAFTA): we include dummy variables to indicate the date of
implementation of the NAFTA and the MERCOSUR. This variable should take into consideration the
evolution of rules on trade and investment. The impact of economic integration on FDI is ambiguous
theoretically as well as empirically. No clear effect is expected (see Blomström and Kokko, 1997).
5 Empirical estimation
Table 3 presents estimation results for FDI, M&A and G.I. regressions.
The FDI equation
The variables GDP, AGG, RLCOST, RTAX, TB and MACRO exhibit a high degree of statistical
significance in regression (1) and (2). GDP26, RTAX and MACRO have the expected signs. In contrast,
26We notice that market size coefficient is quiet important relative to other ones.
15
AGG and above all RLCOST have unexpected impacts. For AGG, the competition effect seems to prevail
over positive externalities. It may result from our macroeconomic, and not sector-based, perspective.
Positive externalities caused by agglomeration have certainly a major impact at the sector level for
example concerning vertical links. RLCOST records a non-intuitive sign. It may reflect efficiency-seeking
strategy. U.S. companies seem to look for labour force with higher productivity and therefore higher
wage cost locations. This can be explained by the fact that Canada is the major recipient of U.S where
nominal wages are the highest. It should also be noted that the REDU coefficient has a positive sign
even if it is not significant.
The consequences of economic integration are not so clear: the decrease of tariff barriers pushes down-
ward U.S. FDI supporting the Tariff Jumping argument. However, institutional commitment following
economic integration could give credibility to government policies towards foreign companies and thus
attract foreign investors looking for stability27. Actually, the NAFTA and MERCOSUR dummies have a
non significant negative impact. Could we infer that economic integration has no repercussion on FDI?
It could be too hazardous to come to this conclusion mainly for two reasons: firstly, companies may have
anticipated the economic outcomes of institutional integration. From 1989 to 1994, U.S. FDI flows in
Mexico rose by 200% whereas it only went up by 57% during the 1994-1998 period. At the same time,
official negotiations for the NAFTA began in 1991 between the president of the U.S., George Bush, and
the president of Mexico, Carlos Salinas28 . Nevertheless, in Mexico, the Brady Plan implemented in 1989
may have also amplified the recovery in the investors confidence (Berthélemy and Girardin, 1993). The
Brady plan improved the credibility of macroeconomic policies. Secondly, economic integration could
boost FDI indirectly through an increasing market size or better labour productivity (lower internal or
27 It could stimulate vertical FDI. Political stability constitutes a necessary condition for the international division of
labour at the firm level (Blomtröm et Kokko, 1997).28 In the same way, the CUSFTA (Canada-U.S. Free Trade Agreement, 1988) seem to have stronger impact on trade than
on FDI (Blomström and Kokko,1997). Indeed, Canada and the U.S. were almost integrated when they decided to sign for
CUSFTA.
16
X-inefficiency because of increasing competitive pressures).
There is also another noteworthy finding. We perform a Chow test that yields an F statistic of 1.239
which is not significant. Splitting sample into two groups (i.e. NAFTA versus MERCOSUR members
over our entire period29) does not raise the statistical explanatory power of the regression. Our F statistic
testing the restricted versus unrestricted model is inferior to the tabled critical value. We may then not
reject the hypothesis that the coefficient vectors are identical in the two data samples. MERCOSUR and
NAFTA membership partition does not change the estimated coefficients of U.S. FDI location determi-
nants. The U.S. position with regard to the two agreements, that is insider (intra-NAFTA FDI) versus
outsider (inter-U.S./MERCOSUR FDI), does not seem to matter.
The Cross-Border M&A versus Greenfield Investment equations
Comparing the results between columns (3) to (6) and columns (1) and (2), FDI, M&A and G.I.
clearly response differently to our independent parameters. The market size and macroeconomic stability
are always significant. We find a positive (negative) relationship between GDP (MACRO) and the
dependant variable. All these coefficients have similar magnitude. The AGG variables also exercise
negative and significant (except in column (4)) effects but these coefficients are lower when we estimate
FDI. Aggregating the two modes of entry appears to soften negative externalities. The significance of
these coefficients is more persistent for G.I. than for M&A which is consistent with the fact that setting
up a new plant enhances more competition between firms than acquiring a firm in the host country. Then
investors are more sensible to agglomeration effects in the former case than in the latter one. Labour
costs coefficients are all positive but not significant in the case of G.I. It likely comes from the fact
that M&A are more seeking efficiency than G.I.: they are more specialized in production requiring high
skilled labour force. Nevertheless, as can be seen, REDU is significant for G.I. It could be explained
29 It means that integration includes both natural and institutional integration. We must bear in mind geographic or
cultural distance cannot be evaluated by a within regression estimator since they did not vary over the time. All these
effects are included in the constant
17
from maquiladoras (automobile assembling firms) established by U.S. companies during the 1990s in the
Mexican automobile sector. They wished to achieve an extensive production but did not really search
for skilled workers (no R&D expenditures). They just needed sufficiently educated labour force to be
productive and to use machines. When FDI are divided into G.I. and M&A, RTAX coefficients keep the
same sign but RTAX slightly looses its explanatory power30. Finally, as can be observed in table 3, the
variable INST performed very poorly. It may be linked to the measure of institutional quality.
Let us now investigate the effects of integration. Our results suggest different remarks. In the first
place, G.I. and M&A do not react to the variable TB in a similar way. The coefficient signs are always
positive but have lesser magnitude and are not significant for M&A. It is consistent with our theoretical
model. We predict ambiguous sign. Indeed, protectionism gives rent to host country firms, which then
claim for high acquisition prices. In other words, economic integration has a pro-competitive effect on
companies by intensifying export flows between countries. This increasing competition could encourage
firms to merge in order to reduce the level of competition and restore their market power. The search of
market power could partly offset lower transaction cost economies (Tariff Jumping argument).
Besides, the NAFTA and the MERCOSUR coefficients in equation (4) are negative and significant
only for the NAFTA. It may suggest that U.S. companies anticipated the signature of the NAFTA. The
dummy variables are never significant for G.I. but tariff barriers are highly significant. Finally, the Chow
test indicates again that separating countries into samples is not relevant whatever the entry mode31.
The Intra versus Inter-regional integration contrast is not pronounced.
30When we introduce dummy variables, the significativity of RTAX coefficients changes. The institutional commitment
resulting from treaty signatures may have modified the investor perception of tax regime.31The F statistics yielded by M&A and G.I. data are respectively 0.896 and 1.485. None of these statistics are significant.
18
6 Conclusion
The goal of the paper is to explore the effects of economic integration on U.S. FDI location patterns. We
wonder whether a deeper integration induces the same impact on the location of G.I. and cross-border
M&A. We control for other traditional macroeconomic determinants of FDI location prevailing in a host
country.
Two findings stand out. On the one hand, the MERCOSUR and the NAFTA do not appear to have
direct effects on the location pattern of new U.S. foreign affiliates. Concerning the membership partition,
neither proxy variables of these two agreements, nor pooling data are relevant. Only tariff barriers have
a positive and significant influence on FDI location choices. Traditional factors, such as market size or
agglomeration, seem to play a considerable role. Strikingly, agglomeration appears to affect negatively
FDI flows. The competition effect caused by numerous firms in a given country is probably superior
to positive externalities simultaneously induced (vertical links and technological spillovers). In addition,
labour costs are positively related to U.S. FDI, suggesting that U.S. investors are looking for workers
endowed with high productivity. Consequently, in the prospect of the formation of a free trade area in
the American continent, it is not unlikely that the official signature of the ZLEA in 2005 will have a weak
impact on U.S. FDI in the region. U.S. investors will probably anticipate the outcome of this economic
integration. In fact, integration effects mainly pass through cost and demand parameters.
On the second hand, both our empirical study and our theoretical Cournot model highlight the interest
to distinguish G.I. from M&A when studying FDI determinants all the more because these entry modes
may exercise different consequences on the host country welfare.
Appendix A: Data description and sources
Number of G.I., M&A and affiliates (Source: BEA-Survey of Current Business, CEP). Our data on
19

the number of majority-owned foreign affiliates (MOFA’s)32 are available for the four countries. Data on
the number of G.I. and cross-border M&A are only known for Canada, Brazil and Mexico. We are very
grateful to Raymond Mataloni for having given them to us. Data for Argentina has been provided by
the CEP33.
GDP (Source: CHELEM CD-Rom, Cepii) : GDP is in M$ US 1995.
Inflation rate (Source: Statistical and financial Yearbook of the FMI), Tax rates (Source: Price
Waterhouse Cooper statutory average tax rates, World Bank Indicators): they are expressed in percent.
labour costs (Source: ILO yearbook of labour statistics): they correspond to men and women wages
evaluated in US$ per wage earner for one hour (except for Brazil34) in economic activity.
Secondary net enrollment ratio (Source: World Bank indicators): net enrollment ratios in percent
show the proportion of children of secondary school age who are enrolled in school or who are out of
school.
Institutional quality (Source: Henisz (2000)): the variable provides a rating of political institutions
quality.
Tariff Barriers (Source: World Bank): it consists of an average tariff rates for developing and indus-
trial countries (unweighted in percent)
Appendix B: Mathematical extensions
Further notations are introduced:
A represents the total cost production of the home firm (A = c∗ + d) when it exports to the host
country.
4c is the difference between host firm and home firm production cost (4c = A− c).32MOFA’s are foreign affiliates in which the combined ownership of all U.S. parents exceeds 50 percent33We thank the director of the CEP (Argentina Ministery of Economy), Ricardo Rozemberg, for his help.34 In Brazil case, wages are calculated per employee per month.
20

4t accounts for the difference between host firm and home firm tax rates (4t = t∗ − t).
The profit of home and host firms at the equilibrium are the following :
Case One: the home firm continues to serve the host market by exporting.
π∗ = (1− t∗)[ (a−A)+(c−A)3 ]2
π = (1− t)[ (a−c)+(A−c)3 ]2
with
q∗ = a+c−2(d+c∗)3 ≥ 0
q = a−2c+d+c∗3 ≥ 0
We set the following constraint values on parameters
a+ c− 2(d+ c∗) ≥ 0
a− 2c+ d+ c∗ ≥ 0
Case two : the home firm sets up a new factory in the host country.
π∗ = (1− t)[(a−c3 )2 − F ]
π = (1− t)[(a−c3 )2 − F ]
with
q∗ = q = a−c3
We set the following constraint values on parameters
a ≥ c
(a−c3 )2 ≥ F
Case three: the home firm takes over the domestic firm.
π∗ = (1− t)[(a−c2 )2 −R] where R = (1− t)[ (a−c)+(A−c)3 ]2
so π∗ = (1−t36 )[9(a− c)2 − 4(1− t)(a− c+4c]2]
with
21
q∗ = q = a−c2 ≥ 0
We set the following constraint values on parameters
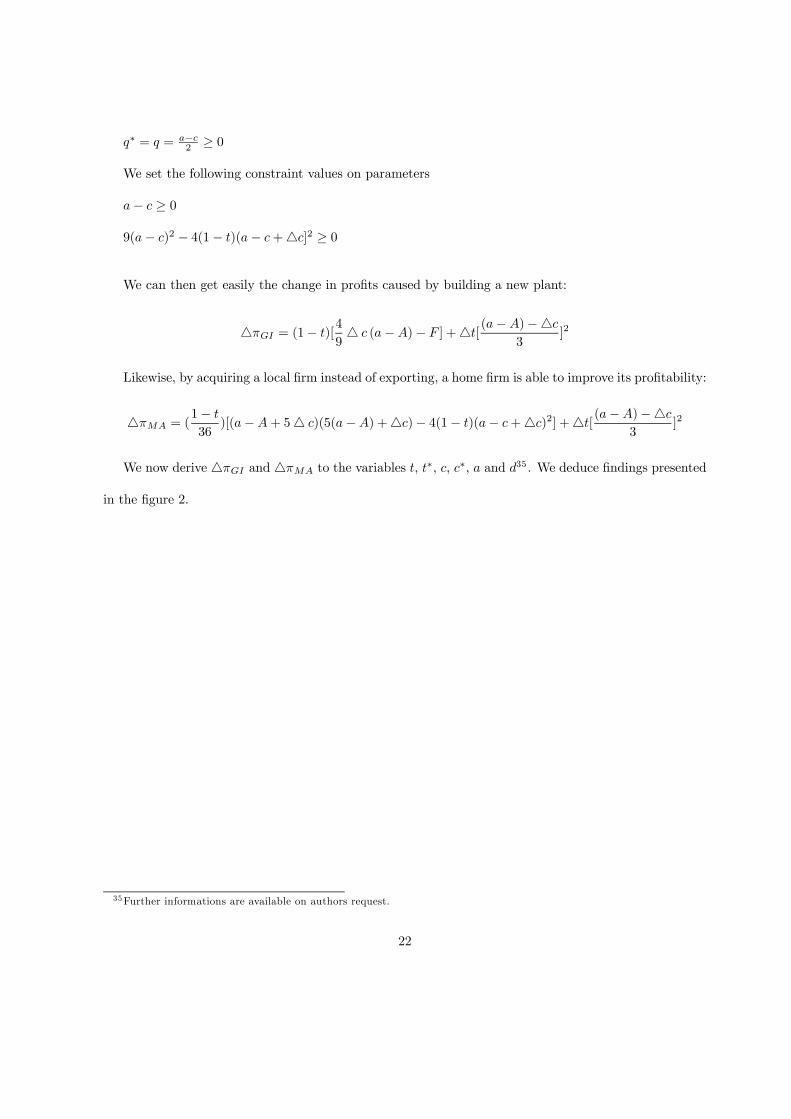
a− c ≥ 0
9(a− c)2 − 4(1− t)(a− c+4c]2 ≥ 0
We can then get easily the change in profits caused by building a new plant:
4πGI = (1− t)[494 c (a−A)− F ] +4t[ (a−A)−4c
3]2
Likewise, by acquiring a local firm instead of exporting, a home firm is able to improve its profitability:
4πMA = (1− t36
)[(a−A+ 54 c)(5(a−A) +4c)− 4(1− t)(a− c+4c)2] +4t[ (a−A)−4c3
]2
We now derive 4πGI and 4πMA to the variables t, t∗, c, c∗, a and d35 . We deduce findings presented
in the figure 2.
35Further informations are available on authors request.
22

References
Andersson T., Swensson R., (1996), “Entry modes for Direct Investment Determined by the
Composition of Firm-Specific Skills”, Scandinavian Journal of Economics, n◦4, pp.551-560
Bajo-Rubio O., Sosvilla-Rivero S., (1994), “An Econometric Analysis of Foreign Direct Invest-
ment in Spain, 1964-1989”, Southern Economic Journal, vol.61, n◦1, pp.104-120.
Baldwin J., Gorecki P. (1987), “Plant Creation Versus Plant Acquisition : the Entry Process in
Canadian Manufacturing”, International Journal of Industrial Organization, n◦5, pp.27-41.
Barrell R., Pain N., (1996), “An Econometric Analysis of U.S. Foreign Direct Investment”, The
Review of Economics and Statistics, n◦2, pp.200-207.
Barrell R., Pain N., (1999), “Domestic Institutions, Agglomerations and Foreign Direct Investment
in Europe”, European Economic Review, n◦43, pp.925-934.
Berthélemy J-C., Girardin E., (1993), “L’intégration régionale Nord-Sud et stabilisation macroé-
conomique : le cas du Mexique dans l’ALENA”, Revue d’Economie du Développement, n◦2, pp.113-133.
Bevan J., Estrin S., (2000), “The Determinants of Foreign Direct Investment in Transition
Economies”, CEPR Discussion Paper, n◦2638.
Blomström M., Kokko A. (1997), “Regional Integration and Foreign Direct Investment”, The
World Bank International Economics Department, Policy Research Working Paper n◦1750.
Breusch T., Pagan A. (1980), “The Lagrange Multiplier Test and Its Applications to Model
Specification in Econometrics”, Review of Economic studies, Vol.47, pp.239-253.
Caves R., Mehra S. (1986), “Entry of Foreign Multinationals into U.S. Manufacturing Industries”
in Porter, Competition in Global Industries, Harvard Business School Press.
Clegg A., Scott-Green S., (1999), “The Determinants of New FDI Capital Flows into the EC:
A Statistical Comparison of the USA and Japan”, Journal of Common Market Studies, vol.37, n◦4,
pp.597-616.
23
Culem C., (1988), “The Locational Determinants of Direct Investments Among Industrialized Coun-
tries”, European Economic Review, vol.32, pp.885-904.
Froot K., Stein J. (1991), “Exchange Rates and Foreign Direct Investment: An Imperfect Capital
Markets Approach”, The Quarterly Journal of Economics, pp.1191-1217.
Fujita M., Krugman P., Venables A., (1999), The Spatial Economy: Cities, Regions and Inter-
national Trade, London School of Economics.
Hausman J.., (1978), “Specification tests in econometrics”, Econometrica, vol. 46, n◦6, pp.1251-
1271.
Head K., Ries J., Swenson D., (1995), “Agglomeration Benefits and Location Choices: Evidence
from Japanese Manufacturing Investments in the United States”, Journal of International Economics,
n◦38, pp.223-247.
Henisz W. (2000), “The Institutional Environment for Economic Growth”, Economics and politics,
n◦12, pp.1-31.
Hennart J-F, Park Y-R (1993), “Greenfield Vs Acquisition : the Strategy of Japanese Investors
in the United States”, Management Science, Vol.39, n◦9, pp.1054-1070.
Kish R., Vasconcellos G.,(1993), “An Empirical Analysis of Factors Affecting Cross-Border Ac-
quisitions: U.S.- Japon”, Management International Review, Vol.33, n◦3,pp.227-245
Kogut B., Singh H. (1988), “The Effect of National Culture on the Choice of Entry Mode”,
Journal of International Business Studies, Fall, pp.411-432.
Lipsey R., (2000), “Interpreting Developed Countries’ Foreign Direct Investment”, NBER Working
Paper, n◦7810.
Louri H. (2001), “Entry Through Acquisition: Determinants of Multinational Firm Choices”, Re-
view of Industrial Organization, n◦19, pp.199-209.
Mayer T., Mucchielli J-L. (1999), “La localisation à l’étranger des entreprises multinationales:
24
Une approche d’économie géographique hiérarchisée appliquée aux entreprises japonaises en Europe”,
Economie et Statistique, n◦326-327, pp.159-176.
Mody A., Srinivasan K. (1998), “Japanese and U.S. Firms as Foreign Investors: Do They March
to the Same Tune?”, Canadian Journal of Economics, vol.31, n◦4, pp.778-799.
Myrdal G., (1957), “Economic Theory and Under-developped Regions”, Londres: Duckworth.
Reid N., O’ Huallachain B., (1997), “Acquisition Versus Greenfield Investment: the Location and
the Growth of Japanese Manufacturers in the United States”, Journal of the Regional Studies Association,
vol.31, n◦4, pp.403-416.
Swenson D.(1999), “Foreign Investment Transactions and International Trade Linkages”, 7th In-
ternational Conference of Sorbonne, Multinational Firms strategy.
Venables A., (1996), “Equilibrium Locations of Vertically Linked Industries”, International Eco-
nomic Review, vol.37, n◦2, pp.341-359.
Veugelers R., (1991), “Locational Determinants and Ranking of Host Countries: An Empirical
Assessment”, Kyklos, vol.44, n◦3, pp.363-382.
Wheeler D., Mody A., (1992), “International Investment Location Decisions, The Case of U.S.
Firms”, Journal of International Economics, n◦33, pp.77-104.
Zejan M., (1990), “New Ventures or Acquisitions. The choice of Swedish Multinational Enterprises”,
Journal of Industrial Economics, vol.38, n◦3, pp.349-355.
25