A limited set of transcriptional programs define major cell types
14
A limited set of transcriptional programs define major cell types Alessandra Breschi, 1,2,3,9 Manuel Muñoz-Aguirre, 1,4,9 Valentin Wucher, 1,9 Carrie A. Davis, 5 Diego Garrido-Martín, 1,2 Sarah Djebali, 1,2,6 Jesse Gillis, 3 Dmitri D. Pervouchine, 1,7 Anna Vlasova, 8 Alexander Dobin, 5 Chris Zaleski, 5 Jorg Drenkow, 5 Cassidy Danyko, 5 Alexandra Scavelli, 5 Ferran Reverter, 1,2 Michael P. Snyder, 3 Thomas R. Gingeras, 5 and Roderic Guigó 1,2 1 Centre for Genomic Regulation (CRG), The Barcelona Institute of Science and Technology, E-08003 Barcelona, Catalonia, Spain; 2 Universitat Pompeu Fabra (UPF), E-08003 Barcelona, Catalonia, Spain; 3 Department of Genetics, Stanford University, Stanford, California 94305, USA; 4 Universitat Politècnica de Catalunya. Departament d’Estadística i Investigació Operativa, 08034 Barcelona, Catalonia, Spain; 5 Cold Spring Harbor Laboratory, Cold Spring Harbor, New York 11742, USA; 6 Institut National de Recherche en Santé Digestive (IRSD), Université de Toulouse, Institut National de la Santé et de la Recherche Médicale (INSERM), Institut National de Recherche pour l’Agriculture, l’Alimentation et l’Environnement (INRAE), École Nationale Vétérinaire de Toulouse (ENVT), Université Paul Sabatier (UPS), 31024 Toulouse, France; 7 Skolkovo Institute for Science and Technology, Moscow, Russia 143025; 8 Research Institute of Molecular Pathology (IMP), Vienna Biocenter (VBC), 1030 Vienna, Austria We have produced RNA sequencing data for 53 primary cells from different locations in the human body. The clustering of these primary cells reveals that most cells in the human body share a few broad transcriptional programs, which define five major cell types: epithelial, endothelial, mesenchymal, neural, and blood cells. These act as basic components of many tis- sues and organs. Based on gene expression, these cell types redefine the basic histological types by which tissues have been traditionally classified. We identified genes whose expression is specific to these cell types, and from these genes, we estimat- ed the contribution of the major cell types to the composition of human tissues. We found this cellular composition to be a characteristic signature of tissues and to reflect tissue morphological heterogeneity and histology. We identified changes in cellular composition in different tissues associated with age and sex, and found that departures from the normal cellular composition correlate with histological phenotypes associated with disease. [Supplemental material is available for this article.] Transcriptional profiles reflect cell type, condition, and function. In tissues and organs, they are monitored in RNA extracted from millions to billions of cells (11 6 –10 9 ) (Haque et al. 2017), likely in- cluding multiple cell types. As a consequence, the transcriptional profiles obtained from tissue samples represent the average expres- sion of genes across heterogeneous cellular collections, and gene expression differences measured in bulk tissue transcriptomes may thus reflect changes in cellular composition rather than changes in the expression of genes in individual cells. Single-cell RNA sequencing (scRNA-seq) has indeed revealed large cellular heterogeneity in many tissues and organs (Trapnell 2015), and the Human Cell Atlas (HCA) project (Regev et al. 2017) has been recently initiated to define all human cell types and to infer the cellular taxonomy of the human body. As a step in that direction and to bridge the transcriptomes of tissues with the transcriptomes of the constituent primary cells, and to understand how these im- pact tissue phenotypes, we have generated bulk expression profiles of 53 primary cell lines isolated from 10 different anatomical sites in the human body. These profiles include long- and short-strand- specific RNA-seq and RAMPAGE data (Fig. 1A; Supplemental Tables S1–S4). Results Major cell types in the human body Clustering of the primary cells based on gene expression profiles revealed a number of well-defined clusters (Fig. 1B,C; Supple- mental Figs. S1, S2A,B; Supplemental Methods 1). One cluster was composed of endothelial cells; a second large cluster included a mixture of cell types: fibroblasts, stem cells, and muscle cells, among others, which we collectively termed as mesenchymal. Two smaller clusters, which clustered together, were composed of epithelial cells; finally, the melanocytes clustered separately. Almost all of the individual primary cells are assigned to the proper major cell type. The exceptions are renal mesangial cells, which have contractile properties but are classified as epithelial, and lung epithelial cells, that are classified as mesenchymal. These two cell types, however, are of embryonic origin—in contrast to the vast majority of primary cells in our study, which are adult 9 These authors contributed equally to this work. Corresponding authors: [email protected], [email protected] Article published online before print. Article, supplemental material, and publi- cation date are at http://www.genome.org/cgi/doi/10.1101/gr.263186.120. Freely available online through the Genome Research Open Access option. © 2020 Breschi et al. This article, published in Genome Research, is available un- der a Creative Commons License (Attribution-NonCommercial 4.0 Internation- al), as described at http://creativecommons.org/licenses/by-nc/4.0/. Resource 30:1–13 Published by Cold Spring Harbor Laboratory Press; ISSN 1088-9051/20; www.genome.org Genome Research 1 www.genome.org Cold Spring Harbor Laboratory Press on September 15, 2022 - Published by genome.cshlp.org Downloaded from
-
Upload
khangminh22 -
Category
Documents
-
view
0 -
download
0
Transcript of A limited set of transcriptional programs define major cell types
A limited set of transcriptional programs define majorcell types
Alessandra Breschi,1,2,3,9 Manuel Muñoz-Aguirre,1,4,9 Valentin Wucher,1,9
Carrie A. Davis,5 Diego Garrido-Martín,1,2 Sarah Djebali,1,2,6 Jesse Gillis,3
Dmitri D. Pervouchine,1,7 Anna Vlasova,8 Alexander Dobin,5 Chris Zaleski,5
Jorg Drenkow,5 Cassidy Danyko,5 Alexandra Scavelli,5 Ferran Reverter,1,2
Michael P. Snyder,3 Thomas R. Gingeras,5 and Roderic Guigó1,21Centre for Genomic Regulation (CRG), The Barcelona Institute of Science and Technology, E-08003 Barcelona, Catalonia, Spain;2Universitat Pompeu Fabra (UPF), E-08003 Barcelona, Catalonia, Spain; 3Department of Genetics, Stanford University, Stanford,California 94305, USA; 4Universitat Politècnica de Catalunya. Departament d’Estadística i Investigació Operativa, 08034 Barcelona,Catalonia, Spain; 5Cold Spring Harbor Laboratory, Cold Spring Harbor, New York 11742, USA; 6Institut National de Recherche enSanté Digestive (IRSD), Université de Toulouse, Institut National de la Santé et de la Recherche Médicale (INSERM), Institut Nationalde Recherche pour l’Agriculture, l’Alimentation et l’Environnement (INRAE), École Nationale Vétérinaire de Toulouse (ENVT),Université Paul Sabatier (UPS), 31024 Toulouse, France; 7Skolkovo Institute for Science and Technology, Moscow, Russia 143025;8Research Institute of Molecular Pathology (IMP), Vienna Biocenter (VBC), 1030 Vienna, Austria
We have produced RNA sequencing data for 53 primary cells from different locations in the human body. The clustering of
these primary cells reveals that most cells in the human body share a few broad transcriptional programs, which define five
major cell types: epithelial, endothelial, mesenchymal, neural, and blood cells. These act as basic components of many tis-
sues and organs. Based on gene expression, these cell types redefine the basic histological types by which tissues have been
traditionally classified. We identified genes whose expression is specific to these cell types, and from these genes, we estimat-
ed the contribution of the major cell types to the composition of human tissues. We found this cellular composition to be a
characteristic signature of tissues and to reflect tissue morphological heterogeneity and histology. We identified changes in
cellular composition in different tissues associated with age and sex, and found that departures from the normal cellular
composition correlate with histological phenotypes associated with disease.
[Supplemental material is available for this article.]
Transcriptional profiles reflect cell type, condition, and function.In tissues and organs, they are monitored in RNA extracted frommillions to billions of cells (116–109) (Haque et al. 2017), likely in-cluding multiple cell types. As a consequence, the transcriptionalprofiles obtained from tissue samples represent the average expres-sion of genes across heterogeneous cellular collections, and geneexpression differences measured in bulk tissue transcriptomesmay thus reflect changes in cellular composition rather thanchanges in the expression of genes in individual cells. Single-cellRNA sequencing (scRNA-seq) has indeed revealed large cellularheterogeneity in many tissues and organs (Trapnell 2015), andthe Human Cell Atlas (HCA) project (Regev et al. 2017) has beenrecently initiated to define all human cell types and to infer thecellular taxonomy of the human body. As a step in that directionand to bridge the transcriptomes of tissueswith the transcriptomesof the constituent primary cells, and to understand how these im-pact tissue phenotypes, we have generated bulk expression profilesof 53 primary cell lines isolated from 10 different anatomical sitesin the human body. These profiles include long- and short-strand-
specific RNA-seq and RAMPAGE data (Fig. 1A; SupplementalTables S1–S4).
Results
Major cell types in the human body
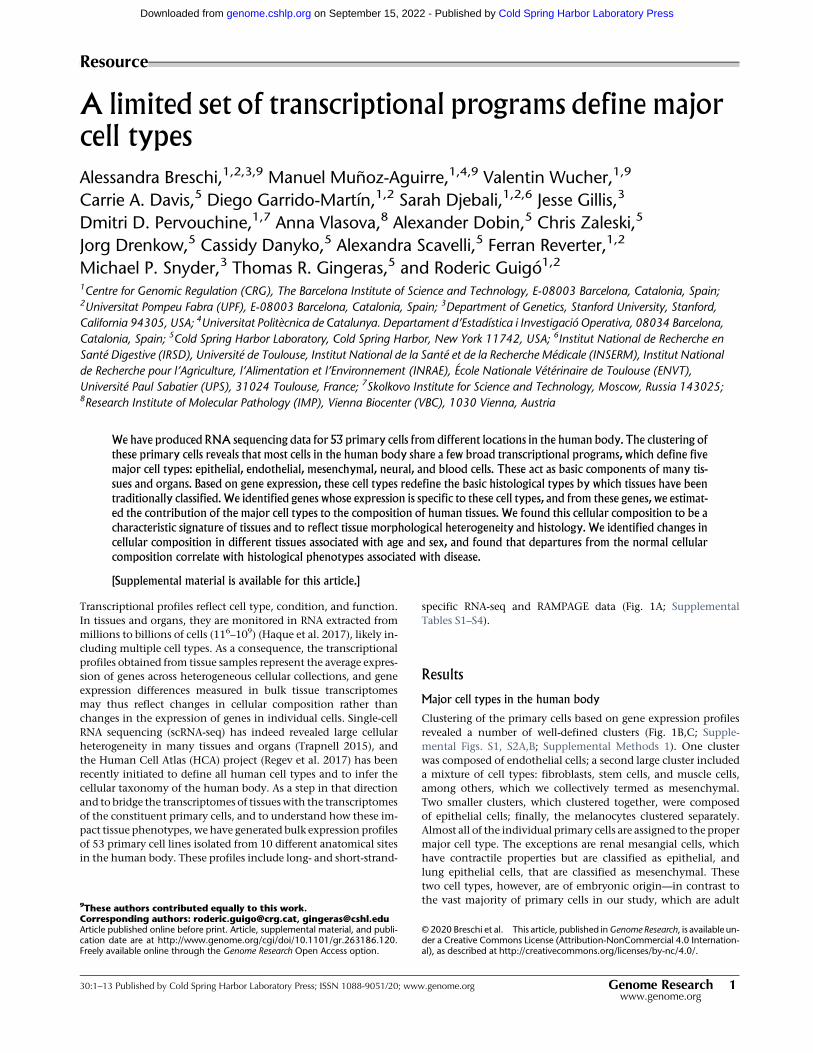
Clustering of the primary cells based on gene expression profilesrevealed a number of well-defined clusters (Fig. 1B,C; Supple-mental Figs. S1, S2A,B; Supplemental Methods 1). One clusterwas composed of endothelial cells; a second large cluster includeda mixture of cell types: fibroblasts, stem cells, and muscle cells,among others, which we collectively termed as mesenchymal.Two smaller clusters, which clustered together, were composedof epithelial cells; finally, the melanocytes clustered separately.Almost all of the individual primary cells are assigned to the propermajor cell type. The exceptions are renal mesangial cells, whichhave contractile properties but are classified as epithelial, andlung epithelial cells, that are classified as mesenchymal. Thesetwo cell types, however, are of embryonic origin—in contrast tothe vast majority of primary cells in our study, which are adult
9These authors contributed equally to this work.Corresponding authors: [email protected], [email protected] published online before print. Article, supplemental material, and publi-cation date are at http://www.genome.org/cgi/doi/10.1101/gr.263186.120.Freely available online through the Genome Research Open Access option.
© 2020 Breschi et al. This article, published inGenome Research, is available un-der a Creative Commons License (Attribution-NonCommercial 4.0 Internation-al), as described at http://creativecommons.org/licenses/by-nc/4.0/.
Resource
30:1–13 Published by Cold Spring Harbor Laboratory Press; ISSN 1088-9051/20; www.genome.org Genome Research 1www.genome.org
Cold Spring Harbor Laboratory Press on September 15, 2022 - Published by genome.cshlp.orgDownloaded from
(Supplemental Table S1)—and their transcriptomes may not re-flect the transcriptomes of fully differentiated cells.
The clustering of primary cells does not appear to be dominat-ed by body location or embryological origin. Body location con-tributes very little to the expression profile of primary cells,explaining only ∼4% of the variance in gene expression
(Supplemental Fig. S2C). Variation of gene expression among or-gans is similar for the different clusters (Supplemental Fig. S2D).The transcriptional diversity among cells within a given organcan be as high as that across the entire humanbody (SupplementalFig. S2E). A similar clustering is obtained using FANTOM CAGE-based transcriptomic data on 105 primary cells (Fig. 1D;
E
F
B
A C
D
Figure 1. Basic transcriptional programs of human primary cells. (A) Overview of primary cells analyzed in this study and the body location they are ex-tracted from. (B) Hierarchical clustering of human primary cells based on the correlation of gene expression. The clustering in four major clusters is sup-ported by the silhouette analysis and the elbow method (Supplemental Fig. S2A,B). t-SNE of human primary cells based on gene expression measuredhere (C), on gene expression measured by CAGE by the FANTOM Consortium (D), and on candidate regulatory elements (cREs) by the ENCODEEncyclopedia scored DNase I hypersensitivity signal (E). (F) Correspondence between transcriptionally derived major cell types and classical histologicaltypes.
Breschi et al.
2 Genome Researchwww.genome.org
Cold Spring Harbor Laboratory Press on September 15, 2022 - Published by genome.cshlp.orgDownloaded from
Supplemental Fig. S3A,B; Supplemental Table S5; SupplementalMethods 2; The FANTOM Consortium and the RIKEN PMI andCLST (DGT) 2014), which reveals, in addition, two clusters corre-sponding to blood and neural cells, which were not representedin our set of primary cells. The analysis of a different set of primarycells from the ENCODE Encyclopedia Registry of candidate regula-tory elements (cREs) (Supplemental Table S6; The ENCODE ProjectConsortium 2020), based on DNase I hypersensitive sites (DHSs),also recapitulates the clustering (Fig. 1E; Supplemental Fig. S3C;Supplemental Methods 3). The clustering remains in the set of146 nonredundant primary cells that results from merging theRNA-seq, the CAGE, and the DHS data. The clustering is thus con-served despite the heterogeneity of the underlying assays and ex-perimental protocols used to generate these different data sets(Supplemental Fig. S4). In the clustering, neural cells (mostly astro-cytes from different brain regions and neurons) cluster togetherwith a few neuroepithelial primary cells (we labeled them epithe-lial, but they are mostly ciliated cells from different sites in theeye). Although the neural cells profiled by CAGE seem to have adistinct transcriptional signature (Supplemental Fig. S3A), neuralcells profiled by DNase-seq show a gene expression pattern similarto mesenchymal cells (Supplemental Fig. S3C). However, the neu-ral cells profiled byDNase-seq are, in contrast tomost primary cellsinvestigated here, of embryonic origin; thus, they are unlikely toexpress the transcriptional program characteristic of adult neuralcells. The analysis of publicly available transcriptomics data fromnervous tissues, including single-cell and bulk RNA-seq, stronglysupport that the neural cell type is a proper major type differenti-ated from the other types (Supplemental Figs. S5–S7; Supplemen-tal Methods 1).
Comparable multitissue RNA-seq data have become recentlyavailable at the single-cell level for 20 mouse organs and tissuesthrough the Tabula Muris project (The Tabula Muris Consortium2018). Principal component analysis (PCA) of the individual cellsand hierarchical clustering of the primary cell types show thatmost individual cells, andmost cell types, clustered into the afore-mentioned five major cell types, irrespective of the organ of origin(Supplemental Figs. S8, S9; Supplemental Methods 4). As in thecase of melanocytes, we also found a few specialized cell typeswhich do not properly belong to these types. Hepatocytes are a no-table example (Supplemental Figs. S8A, S9A). Although closer tothe epithelial cells than to cells of other types, they seem to havea quite specialized transcriptional program.
Altogether, these results suggest the existence of a limitednumber of core transcriptional programs encoded in the humangenome, and likely inmammalian genomes, in general. These pro-grams underlie the morphology and function common to a fewmajor cellular types, which are at the root of the hierarchy of themany cell types that exist in the human body (Table 1). They allshow similar transcriptional heterogeneity, with blood and epithe-lial within the solid tissues being themost transcriptionally diverse(Supplemental Fig. S10). These transcriptionally definedmajor celltypes correspond broadly, but not exactly, the basic histologicaltypes in which tissues are usually classified (e.g., Eroschenko2013;Mescher 2013; Young et al. 2013): epithelial, of which endo-thelial is often considered a subtype; muscular; connective, whichincludes blood; and neural. However, from the transcriptionalstandpoint, endothelial constitutes a separate type, closer, if any,to themesenchymal than to the epithelial type. Blood is also a sep-arate major cell type, and the connective (but not blood) and themuscular histological types cluster together into a single mesen-chymal transcriptional type (Fig. 1F).
Within each of themajor types, further hierarchical organiza-tion of cell typesmay exist. Althoughwe have not profiled enoughdiversity of primary cells to resolve the taxonomic substructurewithin each major cell type, hints of this substructure can beseen in the epithelial type. Within the epithelial cluster, twowell-defined subclusters can be identified (Fig. 1B–E; SupplementalFig. S2A). One of the clusters is mademostly by renal cells, indicat-ing that body location may play a role in subtype specialization.The epithelial cluster includes primary cells of all embryonic ori-gins (ectoderm, endoderm, and mesoderm), suggesting that thetranscriptional programs of cells may not be fully inheritedthrough development, but partially adopted through function.The more heterogeneous composition of the epithelial type isalso apparent in the mouse scRNA-seq (Supplemental Figs. S8, S9).
Our results also suggest that althoughmany cells are likely toadhere to these basic transcriptional programs, many other prima-ry cells are likely highly specialized and very tissue-specific. Aswithmelanocytes and hepatocytes in our analyses, these specializedcells are likely to have their unique transcriptional program.
Cell-type-specific genes
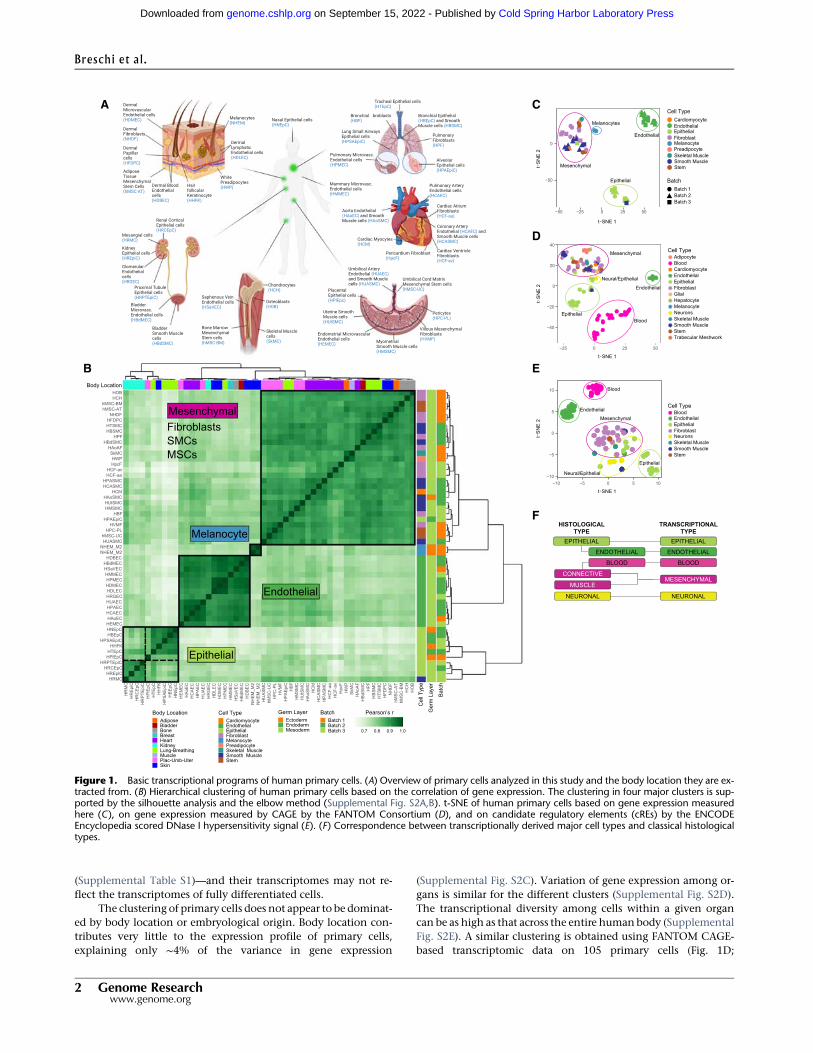
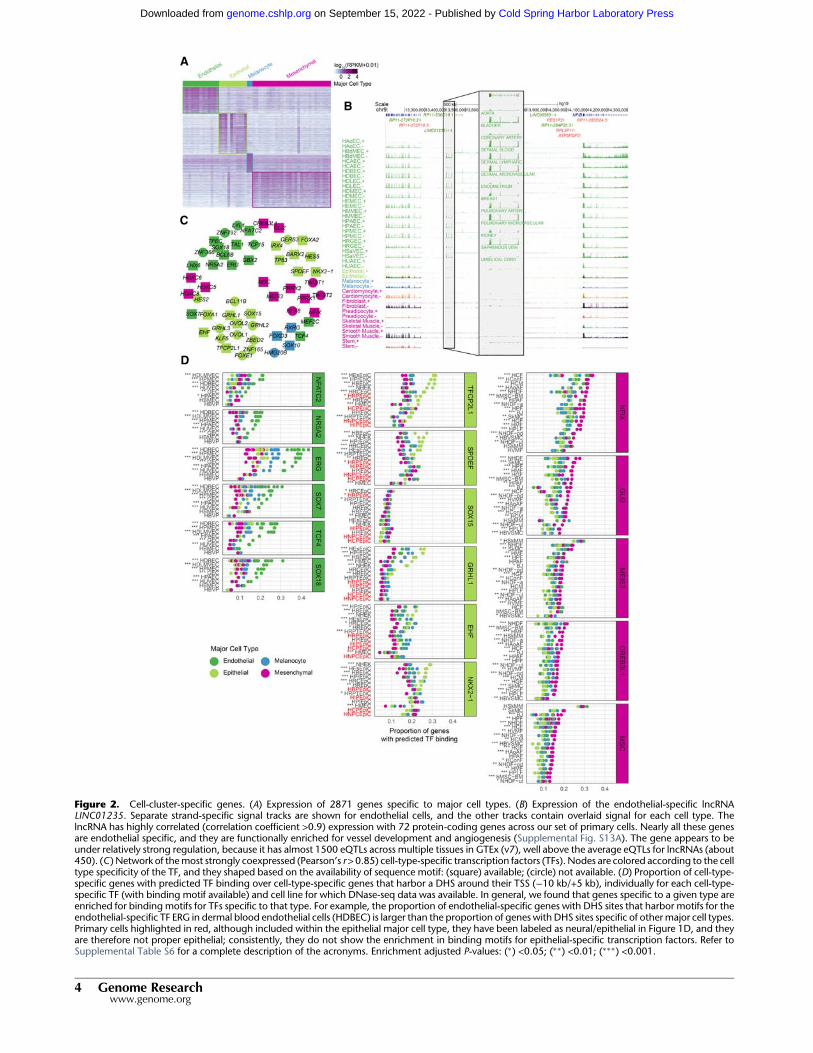
We identified a total of 2871 genes (including 2463 protein-codinggenes, 283 long noncoding RNAs, and 125 pseudogenes), the ex-pression of which is specific to epithelial, endothelial, mesenchy-mal or melanocyte cell types (Fig. 2A; Supplemental Fig. S11;Supplemental Table S7). These cell-type-specific genes includenearly all genes that we identified as the major drivers of the clus-tering (Supplemental Fig. S12; Supplemental Methods 1).Examples of these genes include collagen (COL1A2, COL3A1,COL6A1/A2/A3), expressed in mesenchymal cells; epithelial tran-scription factors genes OVOL1/2; VWF gene encoding for the en-dothelial marker von Willebrand Factor; and TYR gene encodingfor the melanocyte-specific enzyme tyrosinase (for a list of manu-ally curated driver genes, see Supplemental Table S8). Figure 2Bshows the expression pattern of LINC01235, an endothelial-specif-ic long noncoding RNA (lncRNA) of unknown function. The geneis expressed in nearly all endothelial cells analyzed here, but not incells from other types, and its expression is correlated to protein-coding genes with endothelial-related functions (Supplemental
Table 1. Cell types in the human body
Cell type Sets of cells with similar phenotype (morphologyand functions). The similarity thresholdinduces a taxonomic hierarchy of cell types, bymeans of which similar cell types arerecursively aggregated into higher order types.
Primary cell type Cell types at the bottom of the taxonomichierarchy. They denote specialized cellsphenotypically identical (to some resolution);they cannot further be segregated intobiologically meaningful subtypes; for example,pancreatic beta cells. In our work, we do notinclude cell lines here, which are primary cellsthat have been transformed to proliferateindefinitely.
Major cell type Cell types at the root of the taxonomic hierarchy.They cannot be further aggregated inbiologically meaningful higher order types; forexample, epithelial cells.
Tissue-specific celltype
Cell type topologically restricted to a specificanatomical region (tissue, organ, bodylocation); for example, hepatocytes.
Transcriptionalprogram
The pattern of gene expression characteristic of agiven cell type.
Transcriptional programs define major cell types
Genome Research 3www.genome.org
Cold Spring Harbor Laboratory Press on September 15, 2022 - Published by genome.cshlp.orgDownloaded from
B
A
C
D
Figure 2. Cell-cluster-specific genes. (A) Expression of 2871 genes specific to major cell types. (B) Expression of the endothelial-specific lncRNALINC01235. Separate strand-specific signal tracks are shown for endothelial cells, and the other tracks contain overlaid signal for each cell type. ThelncRNA has highly correlated (correlation coefficient >0.9) expression with 72 protein-coding genes across our set of primary cells. Nearly all these genesare endothelial specific, and they are functionally enriched for vessel development and angiogenesis (Supplemental Fig. S13A). The gene appears to beunder relatively strong regulation, because it has almost 1500 eQTLs across multiple tissues in GTEx (v7), well above the average eQTLs for lncRNAs (about450). (C) Network of themost strongly coexpressed (Pearson’s r>0.85) cell-type-specific transcription factors (TFs). Nodes are colored according to the celltype specificity of the TF, and they shaped based on the availability of sequence motif: (square) available; (circle) not available. (D) Proportion of cell-type-specific genes with predicted TF binding over cell-type-specific genes that harbor a DHS around their TSS (−10 kb/+5 kb), individually for each cell-type-specific TF (with binding motif available) and cell line for which DNase-seq data was available. In general, we found that genes specific to a given type areenriched for binding motifs for TFs specific to that type. For example, the proportion of endothelial-specific genes with DHS sites that harbor motifs for theendothelial-specific TF ERG in dermal blood endothelial cells (HDBEC) is larger than the proportion of genes with DHS sites specific of othermajor cell types.Primary cells highlighted in red, although included within the epithelial major cell type, they have been labeled as neural/epithelial in Figure 1D, and theyare therefore not proper epithelial; consistently, they do not show the enrichment in binding motifs for epithelial-specific transcription factors. Refer toSupplemental Table S6 for a complete description of the acronyms. Enrichment adjusted P-values: (∗) <0.05; (∗∗) <0.01; (∗∗∗) <0.001.
4 Genome Researchwww.genome.org
Cold Spring Harbor Laboratory Press on September 15, 2022 - Published by genome.cshlp.orgDownloaded from
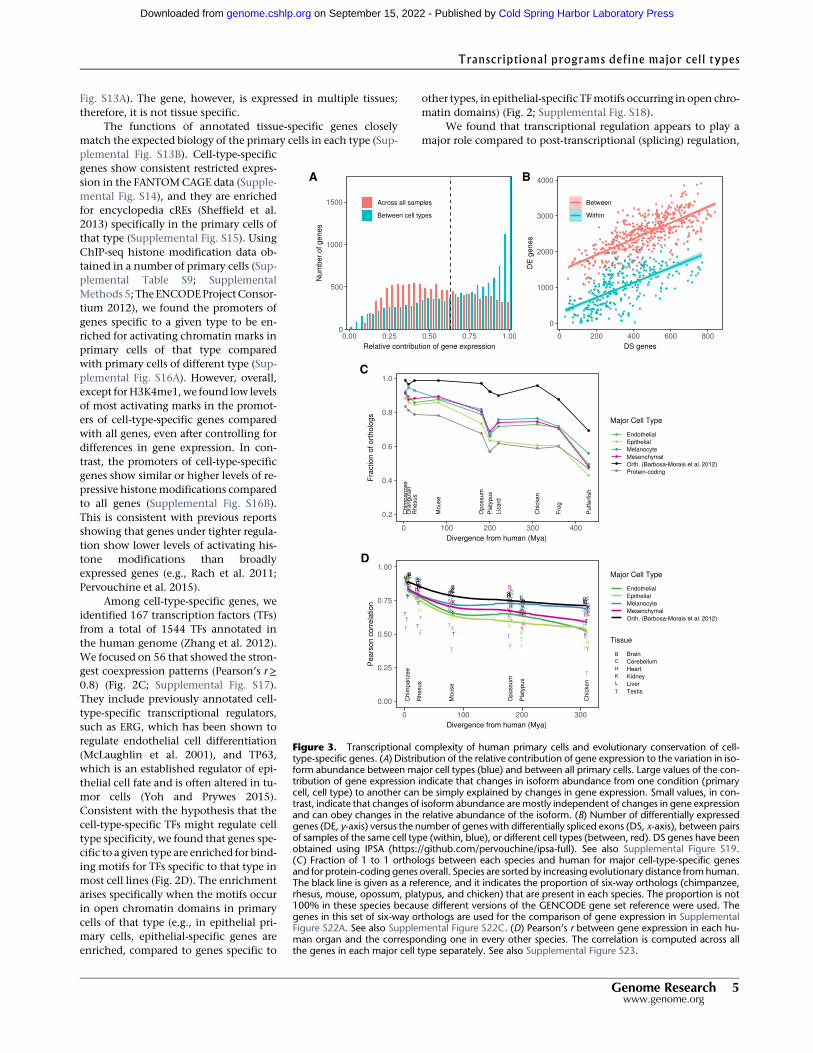
Fig. S13A). The gene, however, is expressed in multiple tissues;therefore, it is not tissue specific.
The functions of annotated tissue-specific genes closelymatch the expected biology of the primary cells in each type (Sup-plemental Fig. S13B). Cell-type-specificgenes show consistent restricted expres-sion in the FANTOMCAGE data (Supple-mental Fig. S14), and they are enrichedfor encyclopedia cREs (Sheffield et al.2013) specifically in the primary cells ofthat type (Supplemental Fig. S15). UsingChIP-seq histone modification data ob-tained in a number of primary cells (Sup-plemental Table S9; SupplementalMethods5; TheENCODEProjectConsor-tium 2012), we found the promoters ofgenes specific to a given type to be en-riched for activating chromatin marks inprimary cells of that type comparedwith primary cells of different type (Sup-plemental Fig. S16A). However, overall,except for H3K4me1,we found low levelsof most activating marks in the promot-ers of cell-type-specific genes comparedwith all genes, even after controlling fordifferences in gene expression. In con-trast, the promoters of cell-type-specificgenes show similar or higher levels of re-pressive histonemodifications comparedto all genes (Supplemental Fig. S16B).This is consistent with previous reportsshowing that genes under tighter regula-tion show lower levels of activating his-tone modifications than broadlyexpressed genes (e.g., Rach et al. 2011;Pervouchine et al. 2015).
Among cell-type-specific genes, weidentified 167 transcription factors (TFs)from a total of 1544 TFs annotated inthe human genome (Zhang et al. 2012).We focused on 56 that showed the stron-gest coexpression patterns (Pearson’s r≥0.8) (Fig. 2C; Supplemental Fig. S17).They include previously annotated cell-type-specific transcriptional regulators,such as ERG, which has been shown toregulate endothelial cell differentiation(McLaughlin et al. 2001), and TP63,which is an established regulator of epi-thelial cell fate and is often altered in tu-mor cells (Yoh and Prywes 2015).Consistent with the hypothesis that thecell-type-specific TFs might regulate celltype specificity, we found that genes spe-cific to a given type are enriched for bind-ing motifs for TFs specific to that type inmost cell lines (Fig. 2D). The enrichmentarises specifically when the motifs occurin open chromatin domains in primarycells of that type (e.g., in epithelial pri-mary cells, epithelial-specific genes areenriched, compared to genes specific to
other types, in epithelial-specific TFmotifs occurring in open chro-matin domains) (Fig. 2; Supplemental Fig. S18).
We found that transcriptional regulation appears to play amajor role compared to post-transcriptional (splicing) regulation,
BA
C
D
(Barbosa-Morais et al. 2012)
(Barbosa-Morais et al. 2012)
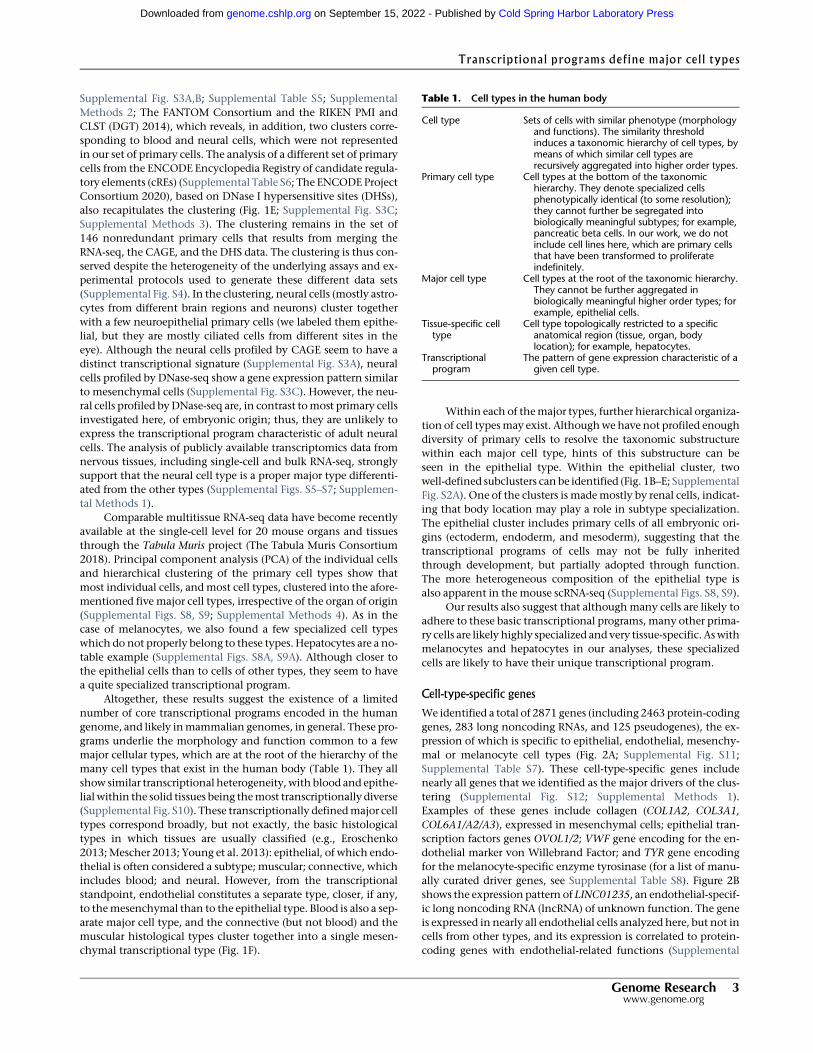
Figure 3. Transcriptional complexity of human primary cells and evolutionary conservation of cell-type-specific genes. (A) Distribution of the relative contribution of gene expression to the variation in iso-form abundance between major cell types (blue) and between all primary cells. Large values of the con-tribution of gene expression indicate that changes in isoform abundance from one condition (primarycell, cell type) to another can be simply explained by changes in gene expression. Small values, in con-trast, indicate that changes of isoform abundance aremostly independent of changes in gene expressionand can obey changes in the relative abundance of the isoform. (B) Number of differentially expressedgenes (DE, y-axis) versus the number of genes with differentially spliced exons (DS, x-axis), between pairsof samples of the same cell type (within, blue), or different cell types (between, red). DS genes have beenobtained using IPSA (https://github.com/pervouchine/ipsa-full). See also Supplemental Figure S19.(C) Fraction of 1 to 1 orthologs between each species and human for major cell-type-specific genesand for protein-coding genes overall. Species are sorted by increasing evolutionary distance fromhuman.The black line is given as a reference, and it indicates the proportion of six-way orthologs (chimpanzee,rhesus, mouse, opossum, platypus, and chicken) that are present in each species. The proportion is not100% in these species because different versions of the GENCODE gene set reference were used. Thegenes in this set of six-way orthologs are used for the comparison of gene expression in SupplementalFigure S22A. See also Supplemental Figure S22C. (D) Pearson’s r between gene expression in each hu-man organ and the corresponding one in every other species. The correlation is computed across allthe genes in each major cell type separately. See also Supplemental Figure S23.
Transcriptional programs define major cell types
Genome Research 5www.genome.org
Cold Spring Harbor Laboratory Press on September 15, 2022 - Published by genome.cshlp.orgDownloaded from
both in defining the major cell types as well as the individualprimary cells within the types. We estimated the fraction ofthe variation in isoform abundance explained by variation ingene expression (Gonzalez-Porta et al. 2012) to be on average67% across transcriptional types and 55% across primary cells(Fig. 3A). The lower proportion of variance explained across pri-mary cells suggests that splicing plays a comparatively more im-portant role in defining the transcriptomes of primary cellswithin a given type than in setting the transcriptional programsof the major cell types. In additional support of this conclusion,we found that although the number of differentially expressedgenes in pairwise comparisons of primary cells is much larger be-tween than within cell types, the number of differentially splicedgenes is similar (Fig. 3B; Supplemental Fig. S19; SupplementalMethods 6).
Although bulk gene expression is the main contributor todefine cell-type specificity, other transcriptional events are alsocell-type specific. First, using the RNA-seq data, we identified cell-type-specific splicing events, independent of the tissue of origin(Supplemental Fig. S20; Supplemental Table S10; SupplementalMethods 6). Second, using the RAMPAGE data, we identified cell-type-specific TSSs (Supplemental Fig. S21; Supplemental TableS11; Supplemental Methods 7).
The basic human transcriptional programs seem to have beenestablished early in vertebrate evolution: genes orthologous of cell-type-specific genes are underrepresented compared to orthologs ofall genes in invertebrate genomes (Supplemental Fig. S22A,B), butthey are overrepresented in vertebrates, as early as in tetrapoda.One exception is epithelial genes, which are overrepresentedonly in mammals (Fig. 3C; Supplemental Fig. S22C). Within theset of orthologous genes across tetrapoda (Barbosa-Morais et al.2012), the expression of cell-type-specific genes is less conservedthan that of protein-coding genes overall, especially at larger evo-lutionary distances (Fig. 3D; Supplemental Figs. S22D, S23;Supplemental Methods 1). This suggests an important role in theevolution of gene expression regulation in shaping the basic tran-scriptional programs in the human genome. Epithelial-specificgenes also show the lowest conservation of expression levels.The transcriptional program characteristic of the epithelium ap-pears to be, therefore, the most dynamic evolutionarily—possiblyreflecting a greater need for adaptation of the epithelial layer inconstant interaction with the environment—and it is also consis-tent with the greater transcriptional heterogeneity of this majorcell type.
Estimation of the cellular composition of complex organs from
the expression of cell-type-specific genes
Weused the patterns of expression of cell-type-specific genes to es-timate the cellular composition of human tissues and organs fromGTEx bulk tissue transcriptome data (version 6, 8555 samples, 31tissues, 544 individuals) (The GTEx Consortium 2017). We usedxCell (Aran et al. 2017), using the sets of genes specific to epithelial,endothelial, and mesenchymal major cell types derived from EN-CODE, and specific to brain (neural) and blood derived fromGTEx (Yang et al. 2018) as signatures, and computed the enrich-ments of these cell types in eachGTEx tissue sample (SupplementalMethods 8).
The xCell enrichments (Fig. 4A; Supplemental Table S12) arelargely consistent with the histology of the tissues. For example,esophagus mucosa is enriched for epithelial cells, whereas esopha-gus muscularis is enriched for mesenchymal cells. Skin (both ex-
posed and unexposed) is enriched in epithelial cells andfibroblasts in mesenchymal cells. Blood and brain are only en-riched in blood and neural cells, respectively. Most other tissuesare not enriched in these two major cell types, with the expectedexceptions of spleen enriched in blood cells and pituitary enrichedin neural cells. Testis, which has widespread transcription(Soumillon et al. 2013), is also enriched in neural cells, a reflectionof the similarity of the expression programs of these two organs(Guo et al. 2005). Consistent with previous observations(Frontini et al. 2012), we found enrichment of cells of endothelialtype in adipose tissue. The analysis of the pathology reports of thesubcutaneous adipose tissue shows that it is often contaminatedwith other tissues, in particular blood vessels, which would ex-plain the enrichment in cells of the endothelial type.We have fur-ther processed and analyzed the histopathology images availablefrom the GTEx adipose samples (Supplemental Methods 8) and es-timated that, on average, ∼84% of the adipose tissue correspondsto adipocytes (Supplemental Fig. S24), which would explain theendothelial enrichment. In skeletal muscle, we do not observe aparticularly large enrichment in cells of the mesenchymal type,in apparent contradiction with our initial classification (Fig. 1B,F). The samples in GTEx, however, are all from differentiated skel-etal muscle, whereas the ENCODE primary cells that we used toidentify the mesenchymal-specific genes are undifferentiated sat-ellite cells (SkMC) and smooth muscle cells (Supplemental TableS1).We analyzed single-cell RNA-seq data produced during skeletalmyoblast differentiation (Trapnell et al. 2014) and found that dif-ferentiating skeletal muscle cells retain the mesenchymal signa-ture through most of the differentiation pathway, acquiring onlythe GTEx muscle specific signature when fully differentiated(Supplemental Fig. S25A–C). Further supporting that muscle is in-deed of mesenchymal type, potentially forming a well-definedsubtype, gene expression profiles cluster together myoblast differ-entiating single cells with ENCODE mesenchymal cells, ratherthanwith epithelial or endothelial cells, or forming a separate clus-ter (Supplemental Fig. S25D).
To independently assess the xCell enrichments, we analyzedthe histological images of the few tissues in which samples wereobtained from different subregions. These are most notable in thecase of transverse colon and stomach. The GTEx stomach sam-ples are all from the gastric body, whose walls consist of twobroad layers: the mucosa, which is mostly epithelial, and themuscularis, which is smooth muscle (Fig. 4B). We processed thehistological images and identified a subset of samples that pre-sented mostly the muscularis or the mucosa layer (SupplementalMethods 8). The enrichment of epithelial cells in the samplesfrom the muscularis layer is much lower than in the samplesfrom the mucosa layer; conversely, the enrichment of mesenchy-mal cells is much higher in the muscularis than in the mucosalayer. The two sets of samples are almost perfectly separated byour cellular enrichments (Fig. 4C), explaining the bimodality inthe distribution of cell type enrichments observed specificallyin the stomach samples (Fig. 4A). Consistently, we found thatepithelial-specific genes were exclusively expressed in the mucosalayer, and mesenchymal-specific genes were exclusively ex-pressed in the muscularis layer (Fig. 4D). Next, we used theclassification of stomach images to train an SVM model (Supple-mental Fig. S26A,B) and used this model to predict the presenceof the two layers in 196 transverse colon samples, with histologysimilar to that of stomach (Supplemental Methods 8). TheSVM-predicted classification closely matches the differences ob-served at the transcriptional level and confirms that the
Breschi et al.
6 Genome Researchwww.genome.org
Cold Spring Harbor Laboratory Press on September 15, 2022 - Published by genome.cshlp.orgDownloaded from

B
A
C D
Figure 4. Expression of cell-type-cluster-specific genes in GTEx organs. (A) Enrichment of eachmajor cell type in GTEx tissues, estimated from bulk tissueRNA-seq using the xCell method. As a control, we also include, at the bottom of the plot, the enrichments of the endothelial, epithelial, and mesenchymalprimary cells monitored here (Fig. 1B). As expected, since the gene signatures have been derived from these very same cells, endothelial primary cells areheavily enriched in the endothelial type, but not in the other types, epithelial cells in the epithelial type andmesenchymal cells in themesenchymal type. (B)Example of stomach histological slides, which represent the twomain tissue layers and the procedure for themanual annotation of the images based on thepresence of those layers. Each GTEx histological image displays up to six tissue slices. For the stomach samples, we scored each slice for the presence (1) orabsence (0) of the muscularis and mucosa layers, summed up the values for each layer separately and divided by the number of slices. If the proportion ofslices with mucosa layer, or muscularis layer, is more than 50%we classify the entire slide as mc1, or ms1, respectively. If the proportion is lower, we classifythe slide asmc0 orms0. A combined class, for examplemc0ms1, is assigned to the slides. Thus, samples labeledmc0ms1 aremostlymuscularis, and sampleslabeledmc1ms0 aremostlymucosa. (C) Enrichment of cells of epithelial andmesenchymal types in stomach samples containingmostly themucosa (green)or mostly the muscularis (purple) layer. (D) Expression of the cell-type-specific genes that drive the separation of stomach samples in mostly muscularis ormostly mucosa samples. Among discriminant cell-type-specific genes, mucosa-only samples express almost exclusively epithelial-specific genes, whereasmuscularis-only samples express exclusively mesenchymal-specific genes.
Genome Research 7www.genome.org
Cold Spring Harbor Laboratory Press on September 15, 2022 - Published by genome.cshlp.orgDownloaded from
bimodality of cellular composition (Fig. 4A) is again related to theunbalanced presence of the two tissue layers across samples (Sup-plemental Fig. S26C). Considering that stomach and colon werenot represented in our primary cell collection, this constitutes astrong validation of our estimates of the cellular enrichmentsin tissues.
Alterations of cellular composition in pathological states
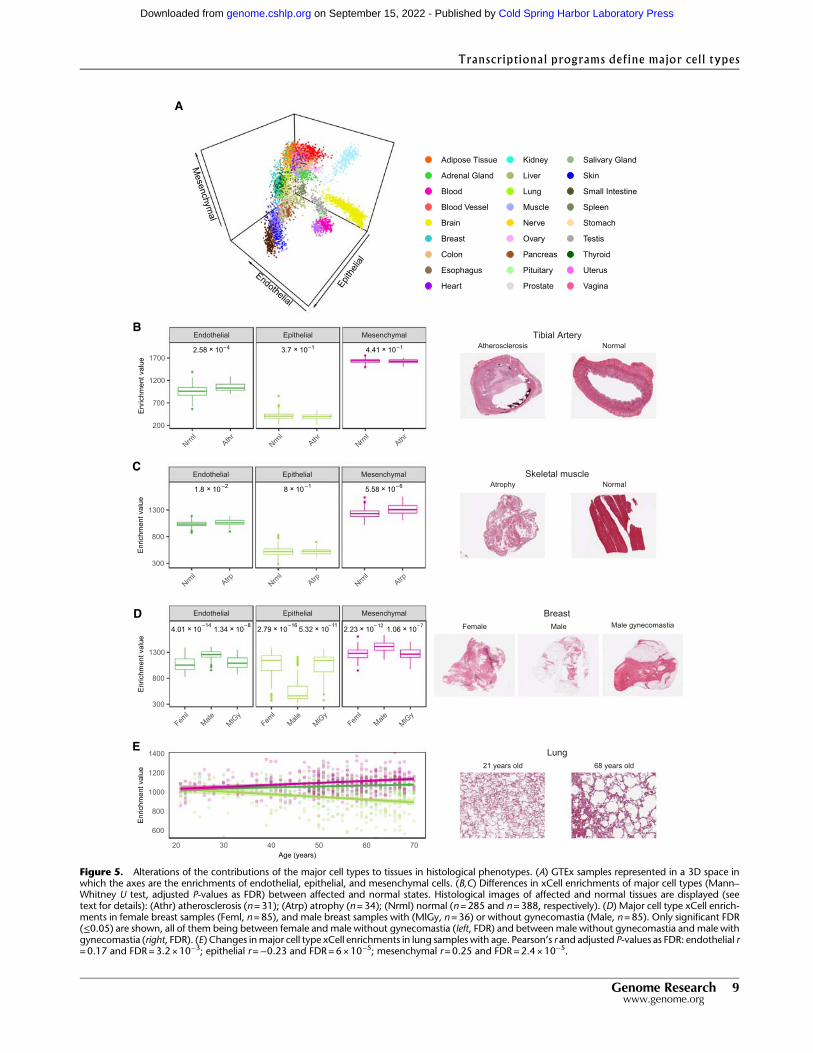
We projected the solid non-neural GTEx tissue samples on a three-dimensional space according to the enrichments of epithelial, en-dothelial, and mesenchymal cell types in each sample (Fig. 5A;Supplemental Fig. S27). The spatial arrangement of the samples re-capitulates tissue type as strongly as the clustering based on geneexpression (Supplemental Fig. S28). This suggests that the basiccell type composition is a characteristic signature of tissues andthat departures from this composition may reflect pathologicalor diseased states. To assess this hypothesis, we analyzed the histo-logical reports associated with the GTEx images (7911 reports).Weused fuzzy string search and parse trees to convert the natural lan-guage annotations produced by the pathologists to annotations ina controlled vocabulary that can be analyzed automatically(Supplemental Methods 8; Supplemental Table S13). In this way,we identified 19 histological phenotypes affecting one or more tis-sues for which there were at least 30 affected samples. From these,we identified six conditions with significant (FDR<0.01) alteredcontributions of major cell types when comparing the composi-tion of affected and normal tissue (Fig. 5B–E). Atherosclerosis inthe tibial artery, which is more prevalent in older donors(Supplemental Fig. S29A), is associated with an increase in endo-thelial cells (Fig. 5B); this might be attributed to endothelial prolif-eration stimulated in peripheral artery occlusion (Ziegler et al.2010). Atrophic skeletalmuscle, a phenotype that is also correlatedwith age (Supplemental Fig. S29B), is associatedwith an increase inmesenchymal cells, which is consistent with the reported increaseof connective tissue (Appell 1990) and intermuscular fat (Maniniet al. 2007; Addison et al. 2014) in atrophy (Fig. 5C). Indeed, anal-ysis of the pathology reports of GTEx muscle histological imagesreveals that the proportion of fat is almost twice as high in atrophicthan in non-atrophic muscle (24% vs. 13%) (SupplementalMethods 8). Elevated enrichments of mesenchymal cells are alsoobserved in liver congestion (Supplemental Fig. S30A), a conditionthat often precedes fibrosis, which is characterized by an activationof matrix-producing cells, including fibroblasts, fibrocytes, andmyofibroblasts (Elpek 2014). Despite the low presence of cells ofthe major cell types in the testis, we found a further reduction ofenrichment of endothelial cells in testis undergoing spermatogen-esis (Supplemental Fig. S30B). In lung pneumonia, we also observealteration of all cell types (Supplemental Fig. S30C). The sixth con-dition is gynecomastia, a pathology that is characterized by ductalepithelial hyperplasia (Cuhaci et al. 2014). We investigated differ-ences in cellular composition between males and females andfound them significant only in mammary tissue, where femalebreasts show much higher enrichment in epithelial cells thanmale breasts, possibly owing to the presence of epithelial ductsand lobules (Fig. 5D). Males diagnosed with gynecomastia showa cellular composition similar to that of females, mirroring tissuemorphology.
We also observed specific age-related changes in cellular com-position in lung and ovarian tissues. In lung samples we observechanges of all cell types, in particular, a significant reduction of ep-ithelial cells in older donors (Fig. 5E), which is consistent with the
impaired recellularization of lung epithelium that has been ob-served in decellularized lungs of aged mice (Sokocevic et al.2013). Consistently, a similar pattern can be observed in the lungsof the individuals that died of respiratory-related causes(Supplemental Fig. S30D,E). In ovarian samples of women olderthan 48, a lower bound for menopause occurrence, we observe adecrease in endothelial cells (Supplemental Fig. S30F), potentiallyrelated to an age-dependent decline in ovarian follicle vascularity(Tatone et al. 2008).
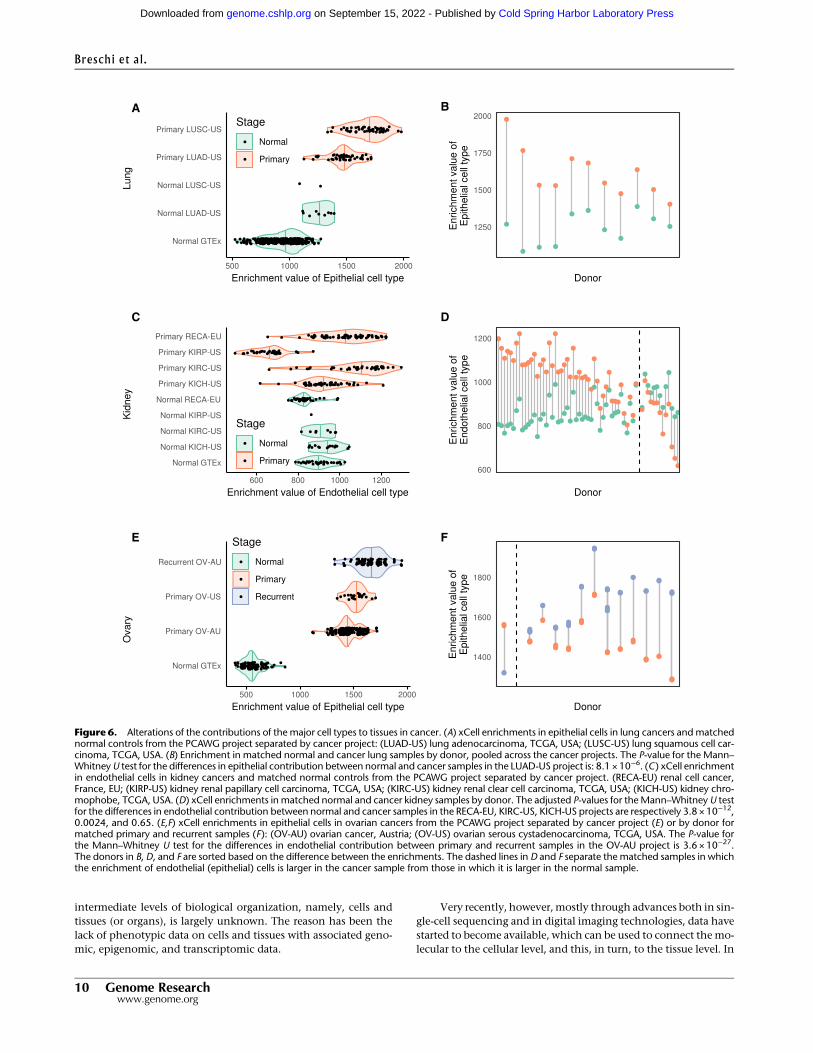
Altered cellular composition is likely to be particularly rele-vant in cancer. Therefore, we analyzed transcriptome data fromThe Cancer Genome Atlas Pan-Cancer Analysis of WholeGenomes Project (PCAWG) (The Cancer Genome Atlas ResearchNetwork et al. 2013) for 19 cancers affecting tissues also profiledin the GTEx collection and estimated the cellular enrichments ofthe major cell types (Supplemental Fig. S31; SupplementalMethods 9). In some cases, there is also transcriptome data for nor-mal samples from the same cancer project, which serves as a con-trol for the highly different methodologies used in GTEx and thecancer projects. Thus, in lung cancer, there is an increase in epithe-lial cells (Fig. 6A,B), likely reflecting the epithelial origin of mostlung cancers. In kidney primary tumors, in contrast, there is anoverall increase of endothelial cells across most cancer subtypes,consistent with the increased vascularity associated with the can-cer (Fig. 6C,D). The exceptions are renal papillary cell carcinomas,which instead present reduced vascularity (Aziz et al. 2013). Inboth cases, the cellular composition of GTEx samples and normalsamples from the cancer projects are similar, supporting the ro-bustness of our cellular characterization. Alterations in cellularcomposition can also reflect cancer progression. For ovary, eventhough we lack a comparable set of normal samples from the can-cer projects, there are data on different stages of the disease, whichserve as an internal control (Fig. 6E,F). Compared to GTEx normaldata, there is an increase in epithelial cells in cancer, which ismoreevident as the severity of the cancer progresses, from primary torecurrent.
Discussion
The ultimate aim of human genetics is to understand how varia-tions in the sequence of DNA impact organismal traits. However,the path connecting the DNA sequence of the genome to the phe-notypic traits of the organism remains mostly unknown, involv-ing a hierarchy of levels of increasing organizational complexity.This path, which unfolds during development, initiates with thetranscription of DNA into RNA and its subsequent processing tofunctionalmature RNAs. These,mostly through translation to pro-teins, determine cell morphology and function. Cells with similarfunctions aggregate to form tissues, and tissues organize into or-gans. Systems aremade of different types of organs thatwork coop-eratively to perform a particular function. Owing mostly togenome-wide association studies (GWASs), thousands of geneticvariants have been connected to human traits and diseases.GWASs, however, uncover only statistical association. Fully under-standing the causes and themechanisms throughwhich DNA var-iation impacts organismal phenotypes requires understandinghow this variation impacts through each of the intermediate levelsof organizational complexity. The advent of high throughputtechnologies to monitor transcription—microarrays first, thenRNA sequencing—made possible the identification of genetic var-iants affecting gene expression. However, how DNA variants andthe resulting molecular phenotypes propagate through
8 Genome Researchwww.genome.org
Breschi et al.
Cold Spring Harbor Laboratory Press on September 15, 2022 - Published by genome.cshlp.orgDownloaded from
E
B
A
C
D
–4 –1 –1
–2
–14 –8 –16 –11
–1 –6
Figure 5. Alterations of the contributions of the major cell types to tissues in histological phenotypes. (A) GTEx samples represented in a 3D space inwhich the axes are the enrichments of endothelial, epithelial, and mesenchymal cells. (B,C) Differences in xCell enrichments of major cell types (Mann–Whitney U test, adjusted P-values as FDR) between affected and normal states. Histological images of affected and normal tissues are displayed (seetext for details): (Athr) atherosclerosis (n=31); (Atrp) atrophy (n=34); (Nrml) normal (n=285 and n=388, respectively). (D) Major cell type xCell enrich-ments in female breast samples (Feml, n=85), and male breast samples with (MlGy, n =36) or without gynecomastia (Male, n=85). Only significant FDR(≤0.05) are shown, all of them being between female and male without gynecomastia (left, FDR) and between male without gynecomastia and male withgynecomastia (right, FDR). (E) Changes inmajor cell type xCell enrichments in lung samples with age. Pearson’s r and adjusted P-values as FDR: endothelial r=0.17 and FDR=3.2 × 10⁻³; epithelial r=−0.23 and FDR=6×10⁻⁵; mesenchymal r=0.25 and FDR=2.4 × 10⁻⁵.
Transcriptional programs define major cell types
Genome Research 9www.genome.org
Cold Spring Harbor Laboratory Press on September 15, 2022 - Published by genome.cshlp.orgDownloaded from
intermediate levels of biological organization, namely, cells andtissues (or organs), is largely unknown. The reason has been thelack of phenotypic data on cells and tissues with associated geno-mic, epigenomic, and transcriptomic data.
Very recently, however,mostly through advances both in sin-gle-cell sequencing and in digital imaging technologies, data havestarted to become available, which can be used to connect themo-lecular to the cellular level, and this, in turn, to the tissue level. In
E F
BA
C D
Figure 6. Alterations of the contributions of the major cell types to tissues in cancer. (A) xCell enrichments in epithelial cells in lung cancers andmatchednormal controls from the PCAWG project separated by cancer project: (LUAD-US) lung adenocarcinoma, TCGA, USA; (LUSC-US) lung squamous cell car-cinoma, TCGA, USA. (B) Enrichment in matched normal and cancer lung samples by donor, pooled across the cancer projects. The P-value for the Mann–WhitneyU test for the differences in epithelial contribution between normal and cancer samples in the LUAD-US project is: 8.1 × 10⁻⁶. (C) xCell enrichmentin endothelial cells in kidney cancers and matched normal controls from the PCAWG project separated by cancer project. (RECA-EU) renal cell cancer,France, EU; (KIRP-US) kidney renal papillary cell carcinoma, TCGA, USA; (KIRC-US) kidney renal clear cell carcinoma, TCGA, USA; (KICH-US) kidney chro-mophobe, TCGA, USA. (D) xCell enrichments in matched normal and cancer kidney samples by donor. The adjusted P-values for theMann–WhitneyU testfor the differences in endothelial contribution between normal and cancer samples in the RECA-EU, KIRC-US, KICH-US projects are respectively 3.8 × 10−12,0.0024, and 0.65. (E,F) xCell enrichments in epithelial cells in ovarian cancers from the PCAWG project separated by cancer project (E) or by donor formatched primary and recurrent samples (F): (OV-AU) ovarian cancer, Austria; (OV-US) ovarian serous cystadenocarcinoma, TCGA, USA. The P-value forthe Mann–Whitney U test for the differences in endothelial contribution between primary and recurrent samples in the OV-AU project is 3.6 × 10⁻²⁷.The donors in B, D, and F are sorted based on the difference between the enrichments. The dashed lines in D and F separate the matched samples in whichthe enrichment of endothelial (epithelial) cells is larger in the cancer sample from those in which it is larger in the normal sample.
Breschi et al.
10 Genome Researchwww.genome.org
Cold Spring Harbor Laboratory Press on September 15, 2022 - Published by genome.cshlp.orgDownloaded from
this regard, the data collected here on the transcriptomics of hu-man primary cells, and the links that we have established betweenthese data and the phenotypic traits of organs constitute a uniqueresource, serving as an intermediate resolution of complexity be-tween single-cell and whole-organ transcriptomics. This resourcewill contribute to the understanding of how the interplay betweentranscription and cellular composition shapes tissue histology andultimately impacts human phenotypes. Our analyses suggest thata large fraction of human cells and cell types in tissues belong to afewmajor cell types, providing a high-level transcriptionally basedhierarchical classification of human cells. Extending the variety ofprofiled cell types, achieving single-cell resolution, and integratingexpression datawith epigenetics data, as proposed in the HCA pro-ject (Regev et al. 2017), will enrich our understanding of the con-stitutive cell types in the human body and their functionalrelationship.
Methods
RNA isolation, library construction, and sequencing
For each cell type to bemade into a library, we obtained cell pelletsthat were stored in RNAlater (Thermo Fisher Scientific) as catalogitems from PromoCell (https://www.promocell.com) and Scien-Cell (https://www.sciencellonline.com/) (for a list of primary cells,see Supplemental Table S1). In short, the RNA was isolated fromsorted cells based on cell morphology and cell surface markers.Each cell type was passaged to expand the cell numbers for 24–48 h (1-2 doublings) before total RNA extraction and shipping.Thus, this protocol represents a minimum of exposure to non-na-tive conditions. The cell morphologies are checked at this time. Al-though it is clear that the molecular context (influence of externalcytokins and neighboring cells) of these cells has changed, theycluster in a very similar fashion to profiles shown by single-cellisolates of the corresponding types. Thus, the limited passagehas an unlikely effect on the gene expression program. We relyon the providers’ standards for quality assurance. Quality sheetsare available through the ENCODE portal (https://www.encodeproject.org/search/?type=Biosample&organism.scientific_name=Homo+sapiens&biosample_ontology.classification=primary+cell&lab.title=Thomas+Gingeras%2C+CSHL&source.title=PromoCell&award.rfa=ENCODE3). We ordered three vials per cell type perdonor for a total of 3 million cells. The three vials were combined,and we isolated total RNA from them using the Ambion mirVanamiRNA Isolation kit (AM1561). The rRNA was removed using theRiboZero Gold Protocol (RZG1224). The libraries are made usinga homebrew “dUTP” protocol (Parkhomchuk et al. 2009), whichgenerates stranded libraries. They were sequenced on the Illuminaplatform inmate-pair fashion and processed through the data pro-cessing pipeline at the ENCODE DCC. Additional informationabout each of these steps, metadata, and files can be found athttps://www.encodeproject.org/.
RAMPAGE sample preparation
Isolation of RNA is described in the preceding section. The RAM-PAGE protocol (Batut and Gingeras 2013) was used to make librar-ies. Each library was sequenced in mate-pair fashion on theIllumina platform. Detailed protocol and quality-control imagesand metrics on a per library basis can be found in the “ProductionDocuments” appended to each RAMPAGE assay at the ENCODEData Coordination Center (https://www.encodeproject.org/).
Small RNA isolation, library construction, and sequencing
Isolation of RNA is described in the preceding section. TheIllumina TruSeq protocol was used to make libraries. Each librarywas sequenced in single end fashion on the Illumina platform.Detailed protocol and quality-control images and metrics on aper library basis can be found in the “Production Documents”appended to each Small RNA assay at the ENCODE DataCoordination Center (https://www.encodeproject.org/).
RNA-seq processing pipeline
Raw reads from the 106 RNA-seq libraries (for a list of ENCODE li-brary IDs, see Supplemental Table S1; for submitted FASTQ files,see https://www.encodeproject.org/) were aligned with STARv2.3.1z (Dobin et al. 2013) to the human genome assemblyhg19. Readsmapping tomore than 20multiple positions were dis-carded. Read counts for all long genes annotated inGENCODEv19(Harrow et al. 2012) were computed with RSEM 1.2.19 (expectedread counts) (Li andDewey 2011). Statistics on the number of readsand mapping are available on Supplemental Table S14.Furthermore, we verified using liftOver that the cell-type-specificgenes are consistent between GRCh37/hg19 and GRCh38/hg38,with a successful conversion of 2855 of the 2871 genes.
For most of the analyses, we average expression values for agiven pair of replicates and sometimes the two biological replicatesare fromdonors of the opposite sex; therefore, we remove genes onChromosome Y. The lack of an enrichment step for polyadeny-lated transcripts preserves the presence of some short biotypegenes, which are still longer than 200 bp. Thus, we remove geneswith at least one transcript annotated as short RNA inGENCODE. These genes are often of repetitive nature, whichmakes the quantification of their expression problematic; this iswhy we decided to remove them.
Read counts which are not reproducible between two repli-cates (npIDR>0.1) (Djebali et al. 2012) are set to 0. The matrix ofread counts after npIDR is provided as Supplemental Table S2. Af-ter filtering for reproducibility, read counts are normalized to aslightly modified version of RPKM (reads per kilobase of exonmodel per million mapped reads) (Mortazavi et al. 2008). Specifi-cally, read counts were first normalized to counts per million(cpm), in which the library sizes are the trimmedmean ofM values(TMM) (Robinson and Oshlack 2010) scaled sums of exonic reads,and then normalized by gene length. Finally, RPKM values fromthe two replicates were averaged, and genes with RPKM<1 in allsamples were discarded, resulting in 16,265 genes, including13,990 protein coding, 1380 long noncoding RNAs, and 895 pseu-dogenes. Statistical analyses were performed with R version 3.6.1(R Core Team 2019).
As the samples were prepared and sequenced in three knowndistinct batches (Supplemental Table S1), we used theremoveBatchEffect() function from R limma package (Ritchie et al.2015) to build a linear model with the batch information andthe cell types on log10-transformed RPKM (with a pseudocountof 0.01), and we regressed out the batch variable.
Data access
All experimental protocols for the samples described here, and alldata generated for this study, are publicly available on theENCODE portal (https://www.encodeproject.org/). GTEx gene ex-pression is available in the GTEx portal (https://www.gtexportal.org).
Transcriptional programs define major cell types
Genome Research 11www.genome.org
Cold Spring Harbor Laboratory Press on September 15, 2022 - Published by genome.cshlp.orgDownloaded from
Competing interest statement
The authors declare no competing interests.
Acknowledgments
This project was supported by awards U54HG007004,U41HG007234, and R01MH101814 from the National HumanGenome Research Institute of the National Institutes of Health,as well as from the SpanishMinistry of EconomyandCompetitive-ness, Centro de Excelencia Severo Ochoa 2013–2017, SEV-2012-0208, Programa de Ayudas FPI del Ministerio de Economía y Com-petitividad BES-2012-055848 to A.B., and Ministerio de Educa-ción, Cultura y Deporte, under the FPU programme (Formaciónde Profesorado Universitario) with predoctoral fellowship FPU15/03635 to M.M.A., as well as the support of the CERCA pro-gramme/Generalitat de Catalunya. D.G.M. is supported by a “laCaixa”-Severo Ochoa predoctoral fellowship LCF/BQ/SO15/52260001. We also acknowledge support from the European Re-search Council (ERC) under the EuropeanUnion’s Seventh Frame-work Programme (FP7/2007-2013)/ERC grant agreement 294653.We thank Kristin Ardlie and Detlev Arendt for useful discussions.We acknowledge and thank the donors and their families for theirgenerous gifts of organ donation for transplantation and tissue do-nations for the GTEx research study. The Genotype-Tissue Expres-sion (GTEx) project was supported by the Common Fund of theOffice of the Director of the National Institutes of Health (https://commonfund.nih.gov/GTEx). The content is solely the respon-sibility of the authors and does not necessarily represent the offi-cial views of the National Institutes of Health. We acknowledgethe Spanish Ministry of Economy, Industry and Competitiveness(MEIC) to the EMBL partnership. Figure 1A was created withhttps://biorender.com/. R.G. dedicates this work to the Catalanleaders and the people in jail and exile for defending freedomand democracy, without which science cannot flourish.
Author contributions: A.B., C.A.D., M.M.A., V.W., R.G., andT.R.G. conceived and designed the experiments and analyses.J.D., C.A.D., A.S., and C.D. performed the experiments. A.B.,M.M.A., V.W., and D.G.M. analyzed the data. J.G., D.D.P., A.V.,A.D., C.Z., D.G.M., F.R., and M.P.S. contributed ideas and statisti-cal advice. A.B., M.M.A., V.W., R.G., and T.R.G. wrote themanuscript.
References
Addison O, Marcus RL, LaStayo PC, Ryan AS. 2014. Intermuscular fat: a re-view of the consequences and causes. Int J Endocrinol 2014: 309570.doi:10.1155/2014/309570
Appell HJ. 1990. Muscular atrophy following immobilisation. Sports Med10: 42–58. doi:10.2165/00007256-199010010-00005
Aran D, Hu Z, Butte AJ. 2017. xCell: digitally portraying the tissue cellularheterogeneity landscape. Genome Biol 18: 220. doi:10.1186/s13059-017-1349-1
Aziz SA, Sznol J, Adeniran A, Colberg JW, Camp RL, Kluger HM. 2013.Vascularity of primary and metastatic renal cell carcinoma specimens.J Transl Med 11: 15. doi:10.1186/1479-5876-11-15
Barbosa-Morais NL, Irimia M, Pan Q, Xiong HY, Gueroussov S, Lee LJ,Slobodeniuc V, Kutter C, Watt S, Colak R, et al. 2012. The evolutionarylandscape of alternative splicing in vertebrate species. Science 338:1587–1593. doi:10.1126/science.1230612
Batut P, Gingeras TR. 2013. RAMPAGE: promoter activity profiling bypaired-end sequencing of 5′-complete cDNAs. Curr Protoc Mol Biol104. doi:10.1002/0471142727.mb25b11s104
The Cancer Genome Atlas Research Network, Weinstein JN, Collisson EA,Mills GB, Shaw KRM, Ozenberger BA, Ellrott K, Shmulevich I, SanderC, Stuart JM. 2013. The cancer genome atlas pan-cancer analysis project.Nat Genet 45: 1113–1120. doi:10.1038/ng.2764
Cuhaci N, Polat S, Evranos B, Ersoy R, Cakir B. 2014. Gynecomastia: clinicalevaluation and management. Indian J Endocrinol Metab 18: 150–158.doi:10.4103/2230-8210.129104
Djebali S, Davis CA,Merkel A, Dobin A, Lassmann T,Mortazavi A, Tanzer A,Lagarde J, LinW, Schlesinger F, et al. 2012. Landscape of transcription inhuman cells. Nature 489: 101–108. doi:10.1038/nature11233
Dobin A, Davis CA, Schlesinger F, Drenkow J, Zaleski C, Jha S, Batut P,ChaissonM,Gingeras TR. 2013. STAR: ultrafast universal RNA-seq align-er. Bioinformatics 29: 15–21. doi:10.1093/bioinformatics/bts635
Elpek GÖ. 2014. Cellular andmolecular mechanisms in the pathogenesis ofliver fibrosis: an update. World J Gastroenterol 20: 7260–7276. doi:10.3748/wjg.v20.i23.7260
The ENCODE Project Consortium. 2012. An integrated encyclopedia ofDNA elements in the human genome. Nature 489: 57–74. doi:10.1038/nature11247
The ENCODE Project Consortium, Moore JE, Purcaro MJ, Pratt HE, EpsteinCB, Shoresh N, Adrian J, Kawli T, Davis CA, Dobin A, et al. 2020.Expanded encyclopedias of DNA elements in the human andmouse ge-nomes. Nature (in press) doi:10.1038/s41586-020-2493-4
Eroschenko VP. 2013. DiFiore’s atlas of histology with functional correlations.Lippincott Williams & Wilkins, Baltimore.
The FANTOM Consortium and the RIKEN PMI and CLST (DGT). 2014. Apromoter-level mammalian expression atlas. Nature 507: 462–470.doi:10.1038/nature13182
Frontini A, Giordano A, Cinti S. 2012. Endothelial cells of adipose tissues: aniche of adipogenesis. Cell Cycle 11: 2765–2766. doi:10.4161/cc.21255
Gonzalez-Porta M, Calvo M, Sammeth M, Guigo R. 2012. Estimation of al-ternative splicing variability in human populations. Genome Res 22:528–538. doi:10.1101/gr.121947.111
The GTEx Consortium. 2017. Genetic effects on gene expression across hu-man tissues. Nature 550: 204–213. doi:10.1038/nature24277
Guo JH, Huang Q, Studholme DJ, Wu CQ, Zhao Z. 2005. Transcriptomicanalyses support the similarity of gene expression between brain andtestis in human as well as mouse. Cytogenet Genome Res 111: 107–109.doi:10.1159/000086378
Haque A, Engel J, Teichmann SA, Lönnberg T. 2017. A practical guide to sin-gle-cell RNA-sequencing for biomedical research and clinical applica-tions. Genome Med 9: 75. doi:10.1186/s13073-017-0467-4
Harrow J, Frankish A, Gonzalez JM, Tapanari E, Diekhans M, Kokocinski F,Aken BL, Barrell D, Zadissa A, Searle S, et al. 2012. GENCODE: the refer-ence human genome annotation for The ENCODE Project. Genome Res22: 1760–1774. doi:10.1101/gr.135350.111
Li B, Dewey CN. 2011. RSEM: accurate transcript quantification from RNA-seq data with or without a reference genome. BMC Bioinformatics 12:323. doi:10.1186/1471-2105-12-323
Manini TM, Clark BC, Nalls MA, Goodpaster BH, Ploutz-Snyder LL, HarrisTB. 2007. Reduced physical activity increases intermuscular adipose tis-sue in healthy young adults. Am J Clin Nutr 85: 377–384. doi:10.1093/ajcn/85.2.377
McLaughlin F, Ludbrook VJ, Cox J, von Carlowitz I, Brown S, Randi AM.2001. Combined genomic and antisense analysis reveals that the tran-scription factor Erg is implicated in endothelial cell differentiation.Blood 98: 3332–3339. doi:10.1182/blood.V98.12.3332
Mescher AL. 2013. Junqueira’s basic histology: text and atlas. McGraw-HillMedical, New York.
Mortazavi A, Williams BA, McCue K, Schaeffer L, Wold B. 2008. Mappingand quantifying mammalian transcriptomes by RNA-Seq. Nat Methods5: 621–628. doi:10.1038/nmeth.1226
Parkhomchuk D, Borodina T, Amstislavskiy V, Banaru M, Hallen L,Krobitsch S, Lehrach H, Soldatov A. 2009. Transcriptome analysis bystrand-specific sequencing of complementary DNA. Nucleic Acids Res37: e123. doi:10.1093/nar/gkp596
PervouchineDD,Djebali S, Breschi A, Davis CA, Barja PP, Dobin A, Tanzer A,Lagarde J, Zaleski C, See LH, et al. 2015. Enhanced transcriptome mapsfrom multiple mouse tissues reveal evolutionary constraint in gene ex-pression. Nat Commun 6: 5903. doi:10.1038/ncomms6903
Rach EA, Winter DR, Benjamin AM, Corcoran DL, Ni T, Zhu J, Ohler U.2011. Transcription initiation patterns indicate divergent strategies forgene regulation at the chromatin level. PLoS Genet 7: e1001274.doi:10.1371/journal.pgen.1001274
R Core Team. 2019. R: a language and environment for statistical computing. RFoundation for Statistical Computing, Vienna, Austria. http://www.R-project.org/.
Regev A, Teichmann SA, Lander ES, Amit I, Benoist C, Birney E, BodenmillerB, Campbell P, Carninci P, Clatworthy M, et al. 2017. The human cellatlas. eLife 6: e27041. doi:10.7554/eLife.27041.001
Ritchie ME, Phipson B, Wu D, Hu Y, Law CW, Shi W, Smyth GK. 2015.limma powers differential expression analyses for RNA-sequencingand microarray studies. Nucleic Acids Res 43: e47. doi:10.1093/nar/gkv007
Breschi et al.
12 Genome Researchwww.genome.org
Cold Spring Harbor Laboratory Press on September 15, 2022 - Published by genome.cshlp.orgDownloaded from
Robinson MD, Oshlack A. 2010. A scaling normalization method for differ-ential expression analysis of RNA-seq data. Genome Biol 11: R25. doi:10.1186/gb-2010-11-3-r25
SheffieldNC, ThurmanRE, Song L, Safi A, Stamatoyannopoulos JA, LenhardB, Crawford GE, Furey TS. 2013. Patterns of regulatory activity acrossdiverse human cell types predict tissue identity, transcription factorbinding, and long-range interactions. Genome Res 23: 777–788. doi:10.1101/gr.152140.112
Sokocevic D, Bonenfant NR, Wagner DE, Borg ZD, Lathrop MJ, Lam YW,Deng B, DeSarno MJ, Ashikaga T, Loi R, et al. 2013. The effect of ageand emphysematous and fibrotic injury on the re-cellularization ofde-cellularized lungs. Biomaterials 34: 3256–3269. doi:10.1016/j.biomaterials.2013.01.028
Soumillon M, Necsulea A, Weier M, Brawand D, Zhang X, Gu H, Barthès P,Kokkinaki M, Nef S, Gnirke A, et al. 2013. Cellular source and mecha-nisms of high transcriptome complexity in the mammalian testis. CellRep 3: 2179–2190. doi:10.1016/j.celrep.2013.05.031
The Tabula Muris Consortium. 2018. Single-cell transcriptomics of 20mouse organs creates a Tabula Muris. Nature 562: 367–372. doi:10.1038/s41586-018-0590-4
Tatone C, Amicarelli F, Carbone MC, Monteleone P, Caserta D, Marci R,Artini PG, Piomboni P, Focarelli R. 2008. Cellular and molecular aspectsof ovarian follicle ageing.Hum Reprod Update 14: 131–142. doi:10.1093/humupd/dmm048
Trapnell C. 2015. Defining cell types and states with single-cell genomics.Genome Res 25: 1491–1498. doi:10.1101/gr.190595.115
Trapnell C, Cacchiarelli D, Grimsby J, Pokharel P, Li S, MorseM, LennonNJ,Livak KJ, Mikkelsen TS, Rinn JL. 2014. The dynamics and regulators ofcell fate decisions are revealed by pseudotemporal ordering of singlecells. Nat Biotechnol 32: 381–386. doi:10.1038/nbt.2859
Yang RY, Quan J, Sodaei R, Aguet F, Segrè AV, Allen JA, Lanz TA, Reinhart V,Crawford M, Hasson S, et al. 2018. A systematic survey of human tissue-specific gene expression and splicing reveals new opportunities for ther-apeutic target identification and evaluation. bioRxiv doi: 10.1101/311563
Yoh K, Prywes R. 2015. Pathway regulation of p63, a director of epithelialcell fate. Front Endocrinol (Lausanne) 6: 51. doi:10.3389/fendo.2015.00051
Young B, O’Dowd G, Woodford P. 2013. Wheater’s functional histology.Elsevier Health Sciences, New York.
Zhang HM, Chen H, Liu W, Liu H, Gong J, Wang H, Guo AY. 2012.AnimalTFDB: a comprehensive animal transcription factor database.Nucleic Acids Res 40: D144–D149. doi:10.1093/nar/gkr965
Ziegler MA, Distasi MR, Bills RG, Miller SJ, AllooshM,MurphyMP, AkingbaAG, Sturek M, Dalsing MC, Unthank JL. 2010. Marvels, mysteries, andmisconceptions of vascular compensation to peripheral artery occlu-sion. Microcirculation 17: 3–20. doi:10.1111/j.1549-8719.2010.00008.x
Received March 10, 2020; accepted in revised form April 29, 2020.
Transcriptional programs define major cell types
Genome Research 13www.genome.org
Cold Spring Harbor Laboratory Press on September 15, 2022 - Published by genome.cshlp.orgDownloaded from

10.1101/gr.263186.120Access the most recent version at doi: published online July 29, 2020Genome Res.
Alessandra Breschi, Manuel Muñoz-Aguirre, Valentin Wucher, et al. A limited set of transcriptional programs define major cell types
Material
Supplemental
http://genome.cshlp.org/content/suppl/2020/07/22/gr.263186.120.DC1
P<P
Published online July 29, 2020 in advance of the print journal.
Open Access
Open Access option.Genome ResearchFreely available online through the
License
Commons Creative
.http://creativecommons.org/licenses/by-nc/4.0/Commons License (Attribution-NonCommercial 4.0 International), as described at
, is available under a CreativeGenome ResearchThis article, published in
ServiceEmail Alerting
click here.top right corner of the article or
Receive free email alerts when new articles cite this article - sign up in the box at the
https://genome.cshlp.org/subscriptionsgo to: Genome Research To subscribe to
© 2020 Breschi et al.; Published by Cold Spring Harbor Laboratory Press
Cold Spring Harbor Laboratory Press on September 15, 2022 - Published by genome.cshlp.orgDownloaded from