A HISTORY OF SOLUTIONS TOP-DOWN, BOTTOM-UP
36
Bio Radiations 129 A Resource for Life Science Research In this issue: Busting myths about RNA integrity assessment Strategies for purifying and generating native, tag-free protein in a single step Conducting mutational analysis of the breast cancer–associated ATM gene Advancing fibrillogenic protein disease–related research A HISTORYOF SOLUTIONS Continued in Current Innovations TOP-DOWN, BOTTOM-UP The Merging of Two High-Performance Technologies
-
Upload
khangminh22 -
Category
Documents
-
view
3 -
download
0
Transcript of A HISTORY OF SOLUTIONS TOP-DOWN, BOTTOM-UP

BioRadiations129
A Resource for Life Science Research
In this issue:Busting myths about RNA integrity assessmentStrategies for purifying and generating native, tag-free protein in a single stepConducting mutational analysis of the breast cancer–associated ATM geneAdvancing fibrillogenic protein disease–related research
A HISTORY OF SOLUTIONSContinued in Current Innovations
TOP-DOWN, BOTTOM-UPthe Merging of two High-performance technologies
To find your local sales office, visit www.bio-rad.com/contact/ In the U.S., call toll free at 1-800-4BIORAD (1-800-424-6723) Visit us at www.bio-rad.com
gene transfer // electroporation
transfectionist.
Improved transfection. Unrestricted parameters. Universal protocols.You need the best electroporation technology available. But you also want the ability to transfect primary cells with a flexible system. We understand. Bio-Rad’s Gene Pulser MXcell™ electroporation system with the ShockPod™ accessory gives you the ability to quickly and seamlessly transfect primary cells like never before.
Generate reproducible data by selecting the parameters ideally suited for your specific mammalian cells. Carry out your experiment using whole or fractional plates for limited cells or use a single cuvette for scaling up primary cell numbers.
To learn more about Gene Pulser MXcell, please visit www.bio-rad.com/ad/mxcell/ or contact your local sales representative.
research. together.
Australia 61-2-9914-2800
Austria 43-1-877-89-01
Belgium 32-9-385-55-11
Brazil 55-21-3237-9400 Canada 905-364-3435
China 86-21-6426-0808
Czech Republic 420-241-430-532
Denmark 45-44-52-10-00
Finland 358-9-804-22-00
France 33-1-47-95-69-65
Germany 49-89-31884-0
Greece 30-210-777-4396
Hong Kong 852-2-789-3300
Hungary 36-1-455-8800
India 91-124-402-9300
Israel 03-963-6050
Italy 39-02-216091
Japan 81-3-6361-7000
Korea 82-2-3473-4460
Mexico 52-555-488-7670
The Netherlands 31-318-540666
New Zealand 0508-805-500
Norway 47-23-38-41-30
Poland 48-22-331-99-99
Portugal 351-21-472-7700
Russia 7-495-721-14-04
Singapore 65-6415-3188
South Africa 27-861-246-723
Spain 34-91-590-5200
Sweden 46-8-555-12700
Switzerland 41-61-717-9555
Taiwan 88-62-2578-7189
Thailand 662-651-8311
United Kingdom 44-20-8328-2000
USA Toll free 1-800-4BIORAD (1-800-424-6723)
www.bio-rad.com
On the cover: Conceptual illustration by Joann Ma
BioRadiations magazine is published by Bio-Rad Laboratories, Inc.2000 Alfred Nobel DriveHercules, CA 94547 USA
© 2009 Bio-Rad Laboratories, Inc.Copyright reverts to individual authors upon publication. Reprographic copying for personal use is allowed, provided credit is given to Bio-Rad Laboratories.
If you have comments or suggestions regarding BioRadiations, please email us at [email protected].
Bio-Rad SuBSidiaRy Telephone numBeRS
BioRadiations issue 129, 2009
BioRadiations 129 1
To ouR ReadeRS
Bio-Rad has built a reputation for expertise in surface-enhanced laser desorption/ionization (SELDI) technologies, an application used by researchers engaged in the top-down approach to protein profiling for biomarker discovery. Bruker Daltonics is well known for the flexibility, speed, and high-resolution capabilities of its MALDI time-of-flight (TOF) mass spectrometers — instruments widely used by researchers employing bottom-up approaches to proteomics research. Recently, Bio-Rad and Bruker have partnered to combine the advantages of SELDI applications with the now even more versatile Bruker instruments. The result is the Lucid Proteomics System™, a line of SELDI-based kits that bring Bio-Rad ProteinChip® arrays and top-down methods together with Bruker’s TOF/TOF instrument platforms. Researchers now have the ability to perform both top-down and bottom-up approaches to protein biomarker discovery research on one integrated platform, as well as apply SELDI technology to protein profiling and identification.
coveR SToRy
16 Top-Down, Bottom-Up: The Merging of Two High-Performance Technologies E Dalmasso, D Casenas, and S Miller, Bio-Rad Laboratories, Inc., Hercules, CA USA
depaRTmenTS
2 What’s New
10 Product Focus
12 Tips and Techniques
28 Dimensions
30 Solutions
32 Looking Back
Technical RepoRTS
22 Using Bio-Plex® Phosphoprotein Assays to Study EGFR Signaling in Human Patient–Derived Xenografts Treated With Cetuximab R Krumbach, J Schüler, T Metz, HH Fiebig, and T Beckers Oncotest GmbH, Institute for Experimental Oncology, Freiburg, Germany
24 Regeneration of Prepacked IMAC Cartridges on the Profinia™ Protein Purification System JM François1, E Baise1, J Siino2, F Patrice1, G Giles1, D Hardy2, and W Liu2 1 Macromolécules Biologiques, Centre for Protein Engineering, Institut de Chimie, Université de Liège, Liège, Belgium
2 Bio-Rad Laboratories, Inc., Hercules, CA USA
26 Mutational Analysis of the ATM Gene in Familial Breast Cancer Using iProof™ High-Fidelity DNA Polymerase C Feuchtinger and S Hinreiner, Institute of Functional Genomics, University of Regensburg, Regensburg, Germany
Legal Notices — See page 32.

WHAT’S NEW
2
WHAT’S NEW
BioRadiations 129 © 2009 Bio-Rad Laboratories, Inc.
CFX Automation System for Real-Time PCRThe CFX automation system works with the CFX96™ and CFX384™ real-time PCR detection systems to enable walk-away, high-throughput operation in a simplified format that does not compromise precision. The plug-and-go benchtop plate handler has the capacity to load up to 20 PCR plates at a time. This system facilitates the automation of workflows, generation of large volumes of data, and rapid analysis of that data. The system is ideally suited to meet the high-throughput requirements of today’s drug discovery workflows, letting you process up to 7,680 samples in a single run of twenty 384-well plates on the CFX384 system.
The CFX automation system makes it easy to:
• Maximize laboratory throughput by integrating 1 CFX96 or CFX384 real-time PCR detection system with hands-free running of up to 20 plates
• Improve experimental workflow and automation tasks to ensure maximum productivity
• Track samples using the integrated bar code reader
• Navigate, set up, and execute multiple PCR experiments using intuitive CFX automation controller software
• Define PCR protocols for an entire plate stack at once
• Receive email notification with an attached data file or report upon completion of a single run
System Requirements Minimum Recommended
Operating system Windows XP Professional SP2, Windows XP Professional SP2, Windows Vista Home Premium Windows Vista Home Premium
Processor 2 GHz 2 GHz
RAM 1 GB (2 GB for Windows Vista) 2 GB
Hard drive space 10 GB 20 GB
Screen resolution 1,024 x 768 with true-color mode 1,280 x 1,024 with true-color mode
Drive CD-ROM CD-RW
USB port 2.0 Hi-Speed 2.0 Hi-Speed
Internet browser Internet Explorer Internet Explorer
Additional software — Microsoft Office Suite
Ordering InformationCatalog # Description 184-5072 CFX Automation System, includes robotic plate handler, base tray, bar code scanner,
CFX automation control software CD
WHAT’S NEW
3Visit us on the Web at www.bio-rad.com BioRadiations 129
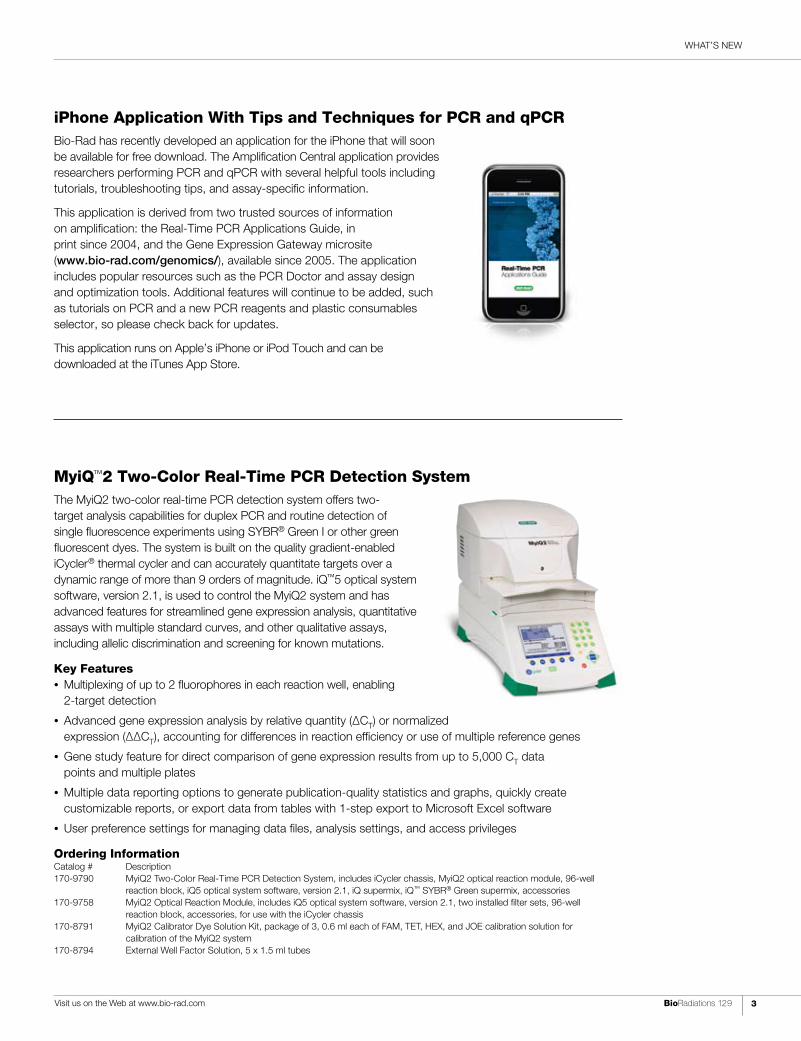
MyiQ™2 Two-Color Real-Time PCR Detection SystemThe MyiQ2 two-color real-time PCR detection system offers two-target analysis capabilities for duplex PCR and routine detection of single fluorescence experiments using SYBR® Green I or other green fluorescent dyes. The system is built on the quality gradient-enabled iCycler® thermal cycler and can accurately quantitate targets over a dynamic range of more than 9 orders of magnitude. iQ™5 optical system software, version 2.1, is used to control the MyiQ2 system and has advanced features for streamlined gene expression analysis, quantitative assays with multiple standard curves, and other qualitative assays, including allelic discrimination and screening for known mutations.
Key Features • Multiplexing of up to 2 fluorophores in each reaction well, enabling
2-target detection
• Advanced gene expression analysis by relative quantity (ΔCT) or normalized expression (ΔΔCT), accounting for differences in reaction efficiency or use of multiple reference genes
• Gene study feature for direct comparison of gene expression results from up to 5,000 CT data points and multiple plates
• Multiple data reporting options to generate publication-quality statistics and graphs, quickly create customizable reports, or export data from tables with 1-step export to Microsoft Excel software
• User preference settings for managing data files, analysis settings, and access privileges
Ordering InformationCatalog # Description 170-9790 MyiQ2 Two-Color Real-Time PCR Detection System, includes iCycler chassis, MyiQ2 optical reaction module, 96-well
reaction block, iQ5 optical system software, version 2.1, iQ supermix, iQ™ SYBR® Green supermix, accessories170-9758 MyiQ2 Optical Reaction Module, includes iQ5 optical system software, version 2.1, two installed filter sets, 96-well
reaction block, accessories, for use with the iCycler chassis170-8791 MyiQ2 Calibrator Dye Solution Kit, package of 3, 0.6 ml each of FAM, TET, HEX, and JOE calibration solution for
calibration of the MyiQ2 system170-8794 External Well Factor Solution, 5 x 1.5 ml tubes
iPhone Application With Tips and Techniques for PCR and qPCRBio-Rad has recently developed an application for the iPhone that will soon be available for free download. The Amplification Central application provides researchers performing PCR and qPCR with several helpful tools including tutorials, troubleshooting tips, and assay-specific information.
This application is derived from two trusted sources of information on amplification: the Real-Time PCR Applications Guide, in print since 2004, and the Gene Expression Gateway microsite (www.bio-rad.com/genomics/), available since 2005. The application includes popular resources such as the PCR Doctor and assay design and optimization tools. Additional features will continue to be added, such as tutorials on PCR and a new PCR reagents and plastic consumables selector, so please check back for updates.
This application runs on Apple’s iPhone or iPod Touch and can be downloaded at the iTunes App Store.

WHAT’S NEW
BioRadiations 129 © 2009 Bio-Rad Laboratories, Inc.4
SsoFast™ Probes Supermix SsoFast probes supermix is part of Bio-Rad’s next-generation family of high-performance, real-time PCR reagents. This supermix uses patented* Sso7d fusion protein technology to deliver excellent performance in a wide range of qPCR applications. By combining a novel engineered hot-start fusion polymerase with an optimized buffer, robust qPCR results can be generated in less time and with increased reliability and sensitivity. Benefits include:
• Robust, simultaneous detection of up to 2 different gene targets under fast or standard qPCR conditions• Instant polymerase activation and rapid polymerization kinetics for fast qPCR results in less than 30 min• Compatible with any real-time detection chemistry
* U.S. patent 6,627,424.
For more information, go to www.bio-rad.com/supermixes/.
Ordering InformationCatalog # Description 172-5230 SsoFast Probes Supermix, 200 x 20 µl reactions, 2x mix contains dNTPs,
Sso7d fusion polymerase, MgCl2, stabilizers172-5231 SsoFast Probes Supermix, 500 x 20 µl reactions172-5232 SsoFast Probes Supermix, 1,000 x 20 µl reactions172-5233 SsoFast Probes Supermix, 2,000 x 20 µl reactions, 20 ml bottle
SsoFast probes supermix delivers superior results for gene expression analysis of two targets on the CFX96™ real-time PCR detection system, with no difference in detection of a low-expressing gene in duplex or singleplex. cDNA from human liver (100 ng) was used in each 20 µl reaction. (—), HEX-labeled GAPDH probe duplex reaction; (—), Texas Red-labeled IL-2 probe duplex reaction; (—), HEX-labeled GAPDH probe simplex reaction; (—), Texas Red-labeled IL-2 probe simplex reaction. Total qPCR run time = 38 min. RFU, relative fluorescence units.
Exceptional reproducibility can be achieved on the CFX384™ real-time PCR detection system with SsoFast probes supermix. Efficient discrimination and reliable quantification can be obtained from 1.33-fold serial dilutions of input template. The GAPDH gene was amplified from varying amounts of HeLa cDNA (1 ng to 100 pg). From left to right: (—) = 1 ng, 565 pg, 320 pg, 181 pg, and 102 pg; (—) = 752 pg, 425 pg, 240 pg, and 136 pg. GAPDH efficiency = 91.5%, R2 = 0.997. Insert shows the standard curve for the various dilutions. RFU, relative fluorescence units.
105
104
103
102
0 10 20 30 40
Cycles
RFU
104
103
102
101
0 10 20 30 40
Cycles
Standard Curve
Thre
shol
d cy
cle 24
23
22
21
0 0.2 0.4 0.6 0.8 1.0Log starting quantity

WHAT’S NEW
Visit us on the Web at discover.bio-rad.com BioRadiations 129 5
* U.S. patent 6,627,424.
SsoFast™ Probes Supermixes With ROXSsoFast probes supermixes with ROX are part of Bio-Rad’s next-generation family of high-performance, real-time PCR reagents designed for use on Applied Biosystems (ABI) 7500 and 7900 HT real-time PCR systems. These supermixes use patented* Sso7d fusion protein technology to deliver excellent performance in a wide range of qPCR applications. By combining a novel engineered hot-start fusion polymerase with an optimized buffer and ROX passive reference dye, robust qPCR results can be generated in less time and with increased reliability and sensitivity. Benefits include:
• Robust, simultaneous detection of up to 2 different gene targets in fast or standard qPCR conditions
• Convenient 1-tube formulation, preblended with the appropriate amount of ROX to correct for interwell signal variation on ABI 7500 and 7900 HT real-time PCR systems
• Instant polymerase activation and rapid polymerization kinetics for fast qPCR results in 40 min
Ordering InformationCatalog # Description 172-5240 SsoFast Probes Supermix With Low ROX, 200 x 20 µl reactions, 2x mix contains dNTPs,
Sso7d fusion polymerase, MgCl2, ROX passive reference dye, stabilizers172-5241 SsoFast Probes Supermix With Low ROX, 500 x 20 µl reactions172-5242 SsoFast Probes Supermix With Low ROX, 1,000 x 20 µl reactions172-5243 SsoFast Probes Supermix With Low ROX, 2,000 x 20 µl reactions, 20 ml bottle172-5250 SsoFast Probes Supermix With ROX, 200 x 20 µl reactions, 2x mix contains dNTPs,
Sso7d fusion polymerase, MgCl2, ROX passive reference dye, stabilizers172-5251 SsoFast Probes Supermix With ROX, 500 x 20 µl reactions172-5252 SsoFast Probes Supermix With ROX, 1,000 x 20 µl reactions172-5253 SsoFast Probes Supermix With ROX, 2,000 x 20 µl reactions, 20 ml bottle
Robust duplex qPCR results with SsoFast probes supermix with ROX on the ABI 7500 fast real-time PCR system. Serial dilutions (10-fold) of 100 ng to 100 pg of cDNA from human liver were used in each 20 µl reaction. (—), VIC-labeled 18S rRNA probe duplex reaction; (—), FAM-labeled 2M probe duplex reaction. 18S rRNA efficiency = 89.7%, R2 = 0.999; 2M efficiency = 101.5%, R2 = 0.999.
100,000
10,000
1,000
0.100
0.010
Del
ta R
n
Cycle number
2 4 6 8 10 12 14 16 18 20 22 24 26 28 30 32 34 36 38 40 2 4 6 8 10 12 14 16 18 20 22 24 26 28 30 32 34 36 38 40

WHAT’S NEW
BioRadiations 129 © 2009 Bio-Rad Laboratories, Inc.6
SsoFast™ EvaGreen® Supermixes With ROXSsoFast EvaGreen supermixes with ROX are part of Bio-Rad’s next-generation family of high-performance, real-time PCR reagents designed for use on the Applied Biosystems (ABI) 7500 and 7900 HT real-time PCR systems. These supermixes use patented* Sso7d fusion protein technology to deliver excellent performance in a wide range of qPCR applications. By combining a novel engineered hot-start fusion polymerase with an optimized buffer and ROX passive reference dye, robust qPCR results can be generated in less time and with increased reliability and sensitivity. Benefits include:
• Unique Sso7d fusion polymerase and optimized buffer deliver unrivaled speed and performance for a variety of qPCR applications
• Convenient 1-tube formulation, preblended with the appropriate amount of ROX to correct for interwell signal variation on ABI 7500 and 7900 HT real-time PCR systems
• Instant polymerase activation and rapid polymerization kinetics for fast qPCR results in 40 min
Ordering InformationCatalog # Description 172-5210 SsoFast EvaGreen Supermix With Low ROX, 200 x 20 µl reactions, 2x mix
contains dNTPs, Sso7d fusion polymerase, MgCl2, ROX passive reference dye, stabilizers172-5211 SsoFast EvaGreen Supermix With Low ROX, 500 x 20 µl reactions172-5212 SsoFast EvaGreen Supermix With Low ROX, 1,000 x 20 µl reactions172-5213 SsoFast EvaGreen Supermix With Low ROX, 2,000 x 20 µl reactions, 20 ml bottle172-5220 SsoFast EvaGreen Supermix With ROX, 200 x 20 µl reactions, 2x mix contains dNTPs,
Sso7d fusion polymerase, MgCl2, ROX passive reference dye, stabilizers172-5221 SsoFast EvaGreen Supermix With ROX, 500 x 20 µl reactions172-5222 SsoFast EvaGreen Supermix With ROX, 1,000 x 20 µl reactions172-5223 SsoFast EvaGreen Supermix With ROX, 2,000 x 20 µl reactions, 20 ml bottle
* U.S. patent 6,627,424.
SsoFast EvaGreen supermix with ROX generates linear results over 6 orders of magnitude on the ABI 7500 fast real-time PCR system. Serial dilutions (10-fold) of 100 ng to 100 fg of cDNA from HeLa total RNA were used in each 20 µl reaction designed to detect 18S rRNA (—). 18S rRNA efficiency = 98.6%, R2 = 0.999.
Cycle number
100,000
10,000
1,000
0.100
0.010
Del
ta R
n
2 4 6 8 10 12 14 16 18 20 22 24 26 28 30 32 34 36 38 40
WHAT’S NEW
Visit us on the Web at discover.bio-rad.com BioRadiations 129 7
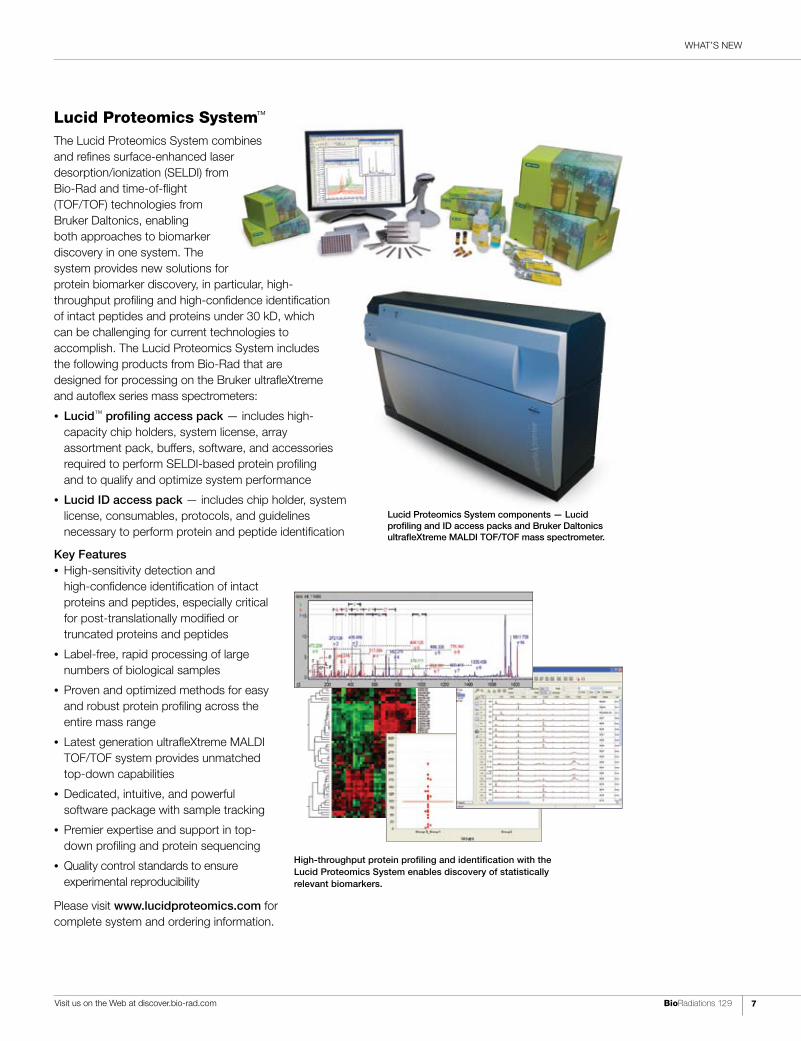
Lucid Proteomics System™
The Lucid Proteomics System combines and refines surface-enhanced laser desorption/ionization (SELDI) from Bio-Rad and time-of-flight (TOF/TOF) technologies from Bruker Daltonics, enabling both approaches to biomarker discovery in one system. The system provides new solutions for protein biomarker discovery, in particular, high-throughput profiling and high-confidence identification of intact peptides and proteins under 30 kD, which can be challenging for current technologies to accomplish. The Lucid Proteomics System includes the following products from Bio-Rad that are designed for processing on the Bruker ultrafleXtreme and autoflex series mass spectrometers:
• Lucid™ profiling access pack — includes high- capacity chip holders, system license, array assortment pack, buffers, software, and accessories required to perform SELDI-based protein profiling and to qualify and optimize system performance
• Lucid ID access pack — includes chip holder, system license, consumables, protocols, and guidelines necessary to perform protein and peptide identification
Key Features • High-sensitivity detection and
high-confidence identification of intact proteins and peptides, especially critical for post-translationally modified or truncated proteins and peptides
• Label-free, rapid processing of large numbers of biological samples
• Proven and optimized methods for easy and robust protein profiling across the entire mass range
• Latest generation ultrafleXtreme MALDI TOF/TOF system provides unmatched top-down capabilities
• Dedicated, intuitive, and powerful software package with sample tracking
• Premier expertise and support in top- down profiling and protein sequencing
• Quality control standards to ensure experimental reproducibility
Please visit www.lucidproteomics.com for complete system and ordering information.
High-throughput protein profiling and identification with the Lucid Proteomics System enables discovery of statistically relevant biomarkers.
Lucid Proteomics System components — Lucid profiling and ID access packs and Bruker Daltonics ultrafleXtreme MALDI TOF/TOF mass spectrometer.
WHAT’S NEW
BioRadiations 129 © 2009 Bio-Rad Laboratories, Inc.8
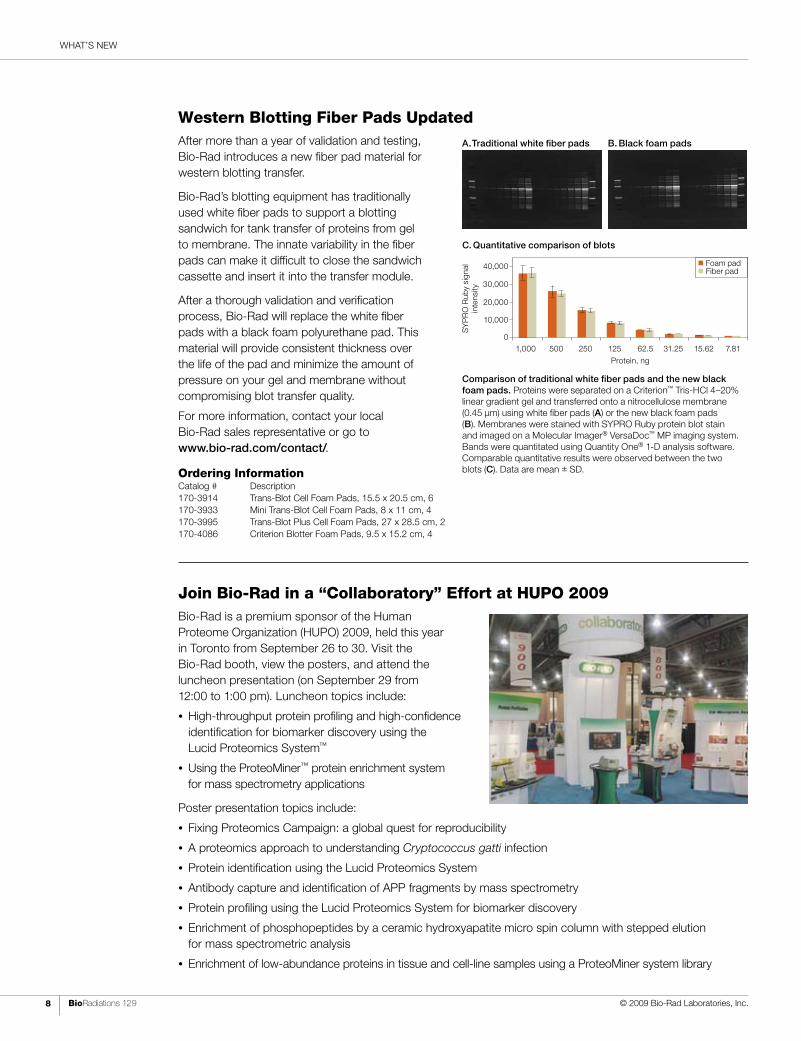
Western Blotting Fiber Pads UpdatedAfter more than a year of validation and testing, Bio-Rad introduces a new fiber pad material for western blotting transfer.
Bio-Rad’s blotting equipment has traditionally used white fiber pads to support a blotting sandwich for tank transfer of proteins from gel to membrane. The innate variability in the fiber pads can make it difficult to close the sandwich cassette and insert it into the transfer module.
After a thorough validation and verification process, Bio-Rad will replace the white fiber pads with a black foam polyurethane pad. This material will provide consistent thickness over the life of the pad and minimize the amount of pressure on your gel and membrane without compromising blot transfer quality.
For more information, contact your local Bio-Rad sales representative or go to www.bio-rad.com/contact/.
Ordering InformationCatalog # Description 170-3914 Trans-Blot Cell Foam Pads, 15.5 x 20.5 cm, 6170-3933 Mini Trans-Blot Cell Foam Pads, 8 x 11 cm, 4170-3995 Trans-Blot Plus Cell Foam Pads, 27 x 28.5 cm, 2170-4086 Criterion Blotter Foam Pads, 9.5 x 15.2 cm, 4
Comparison of traditional white fiber pads and the new black foam pads. Proteins were separated on a Criterion™ Tris-HCl 4–20% linear gradient gel and transferred onto a nitrocellulose membrane (0.45 µm) using white fiber pads (A) or the new black foam pads (B). Membranes were stained with SYPRO Ruby protein blot stain and imaged on a Molecular Imager® VersaDoc™ MP imaging system. Bands were quantitated using Quantity One® 1-D analysis software. Comparable quantitative results were observed between the two blots (C). Data are mean ± SD.
A. Traditional white fiber pads
C. Quantitative comparison of blots
B. Black foam pads
1,000 500 250 125 62.5 31.25 15.62 7.81
Protein, ng
40,000
30,000
20,000
10,000
0
SY
PR
O R
uby
sign
al
inte
nsity
Foam pad Fiber pad
Join Bio-Rad in a “Collaboratory” Effort at HUPO 2009 Bio-Rad is a premium sponsor of the Human Proteome Organization (HUPO) 2009, held this year in Toronto from September 26 to 30. Visit the Bio-Rad booth, view the posters, and attend the luncheon presentation (on September 29 from 12:00 to 1:00 pm). Luncheon topics include:
• High-throughput protein profiling and high-confidence identification for biomarker discovery using the Lucid Proteomics System™
• Using the ProteoMiner™ protein enrichment system for mass spectrometry applications
Poster presentation topics include:
• Fixing Proteomics Campaign: a global quest for reproducibility
• A proteomics approach to understanding Cryptococcus gatti infection
• Protein identification using the Lucid Proteomics System
• Antibody capture and identification of APP fragments by mass spectrometry
• Protein profiling using the Lucid Proteomics System for biomarker discovery
• Enrichment of phosphopeptides by a ceramic hydroxyapatite micro spin column with stepped elution for mass spectrometric analysis
• Enrichment of low-abundance proteins in tissue and cell-line samples using a ProteoMiner system library

To find your local sales office, visit www.bio-rad.com/contact/ In the U.S., call toll free at 1-800-4BIORAD (1-800-424-6723) Visit us at www.bio-rad.com
chromatogr aphy // affinit y purification
Automated antibody and protein affinity purification made easy.Purification of your antibodies and affinity-tagged proteins takes time and energy. Bio-Rad saves you both with fast and easy automated purification. The Profinia™ protein purification system gives you purified antibodies or proteins in as little as 30 minutes.
No chromatography expertise necessary and no neutralization or dialysis step needed. Just automated, one-step affinity purification. It’s simply phenomenal.
Simplify your purification with the Profinia system. For more information and to download our latest technical bulletins on using the Profinia protein purification system for antibody and protein affinity purification, please visit us at www.bio-rad.com/ad/antibody/ or contact your Bio-Rad sales representative.
research. together.
purifenomenal.

proDUct FocUS
BioRadiations 129 © 2009 Bio-Rad Laboratories, Inc.10
proDuct focuS
According to the recently published quantitative real-time PCR experiment publication guidelines, or MIQE (Bustin et al. 2009; http://medgen.ugent.be/rdml/guidelines.php), providing RNA integrity data is essential when publishing real-time reverse transcription quantitative PCR (RT-qPCR) data. RNA integrity is critical in RT-qPCR experiments in order to obtain gene expression results that are reliable and reproducible, and therefore publishable.
The Experion™ automated electrophoresis system provides an automatic assessment of RNA integrity by providing the RNA quality indicator (RQI) in addition to the electropherogram, gel view, and 28S/18S ratio and concentration (Figure 1, Table 1). Here we illustrate that the NanoDrop (ND-1000) spectrophotometer can also assess concentration and provide some purity data (via A260/280 nm and A260/230 nm readings) for the same mouse liver total RNA sample that has been degraded to varying degrees (Table 1). However, the ND-1000 spectrophotometer does not provide RNA integrity data.
When mouse liver samples (with varying degrees of integrity, as generated by heating samples at 90°C) were run on both the Experion and ND-1000 systems, Experion system results show:
• Samples 1, 2, and 3 (RQI 9.8, 9.2, and 8.1, respectively) are highly intact and can be used in downstream applications with confidence
• Samples 4 and 5 (RQI 6.5 and 5.9, respectively) are somewhat degraded and may or may not be useable depending on the application
• Samples 6, 7, and 8 are highly degraded (RQI 2.2, 2.0, and 1.8, respectively) and should not be used for downstream applications (Figure 2)
ND-1000 spectrophometer results indicate that all samples are good quality.
ConclusionsNanoDrop ND-1000 spectrophotometric readings provide only part of the information needed for reliable RT-qPCR results. Conversely, the Experion system provides a complete evaluation of total RNA, with all results automatically generated, saved, and easily exported.
ReferenceBustin SA et al. (2009). The MIQE guidelines: minimum information for publication of quantitative real-time PCR experiments. Clin Chem 55:4, 611-622.
Myth Busted: A NanoDrop ND-1000 Spectrophotometric Reading is Insufficient to Determine RNA Integrity
Table 1. Experion system and ND-1000 spectrophotometer assessment of the same mouse liver total RNA sample. Experion system results give fast (11–12 samples in 30 min) and the most complete information (electropherogram and virtual gel profile, RQI value, and 28S/18S ratio) to help determine RNA integrity. (n), very little or no degradation; (n), some degradation; (n), significant degradation.
Experion Automated NanoDrop ND-1000 Electrophoresis System Spectrophotometer
Sample Ratio RQI Conc, Number Sample Name 28S/18S RQI Class ng/µl A260/280* A260/230*
1 Control — no heat 1.60 9.8 n 115 1.90 2.44 2 3 min @ 90°C 1.23 9.2 n 114 1.93 2.40 3 5 min @ 90°C 0.89 8.1 n 115 2.06 2.37 4 10 min @ 90°C 0.50 6.5 n 115 2.03 2.37 5 15 min @ 90°C 0.15 5.9 n 116 2.02 2.31 6 1.0 hr @ 90°C 0.46 2.2 n 109 1.99 2.18 7 2.0 hr @ 90°C 0.81 2.0 n 117 2.00 2.32 8 4.0 hr @ 90°C 0.00 1.8 n 118 1.89 2.23
* Note: Generally accepted ratios (A260/280 and A260/230) for good quality RNA are >1.8; the ND-1000 spectrophotometric readings indicate that all samples are good quality.
Fig. 1. Experion system electropherogram overlay of mouse liver total RNA sample progressively degraded with heat. With longer heat exposure, there is an observed decrease in the 28S and 18S peaks with degradation peaks appearing between the lower marker and the 18S peak.
L 1 2 3 4 5 6 7 8
6,000
4,0003,0002,0001,5001,000
500
200
50Fig. 2. Experion system virtual gel clearly shows that samples 6, 7, and 8 are highly degraded.

proDUct FocUS
Visit us on the Web at www.bio-rad.com BioRadiations 129 11
Electroporation is a commonly used method for delivering siRNA, DNA, and other molecules into cells. The Gene Pulser MXcell electroporation system is particularly effective for gene delivery into primary and difficult-to-transfect cells. The system’s enhanced user interface contains preset protocols, which can be used as is or easily customized for many cell types.
Bio-Rad has compiled a comprehensive list of reliable protocols that have been developed internally or submitted by our customers and collaborators. In the table below we summarize a list of resources that describe the recommended starting conditions to use in determining optimal electroporation conditions for various mammalian cells using the Gene Pulser MXcell electroporation system and Gene Pulser® electroporation buffer.
For information about obtaining copies of Bio-Rad literature or to download PDFs of the bulletins listed, go to www.bio-rad.com/mxcell/.
Electroporation Protocols for Various Applications Using the Gene Pulser MXcell™ Electroporation System
ReferenceJordan ET et al. (2008). Optimizing electroporation conditions in primary and other difficult-to-transfect cells. J Biomol Tech 19, 328-334.
5F2C 5641
CHO 5641 5704 5858
CHO-DG44 5733
CHO-K1 5687 0108
COS-7 5858
General 5622 5760
HeLa 5641 5687 0108
HL-60 5778
Human neuroblastoma 5720 cells Jordan ET et al. (2008). J Biomol Tech 19, 328-334.
Human primary 5684 fibroblasts 5603 Jordan ET et al. (2008). J Biomol Tech 19, 328-334.
HUVEC 5684 Jordan ET et al. (2008). J Biomol Tech 19, 328-334.
Jurkat 5686 Jordan ET et al. (2008). J Biomol Tech 19, 328-334.
5684
Mast cells 5823
MCF-7 0108
N2A 5684
Namalwa 5842 5860
Neuro-2a Jordan ET et al. (2008). J Biomol Tech 19, 328-334.
Neutrophils 5774
Ramos 5842
Literature describing recommended conditions for electroporation of various mammalian cells on the Gene Pulser MXcell system.
Cell Line Bulletin/Journal Article Cell Line Bulletin/Journal Article
WHAT’S NEW
BioRadiations 129 © 2009 Bio-Rad Laboratories, Inc.12
TIPS AND TECHNIQUES
Using the Profinity eXact™ Fusion-Tag System: Strategies for Success
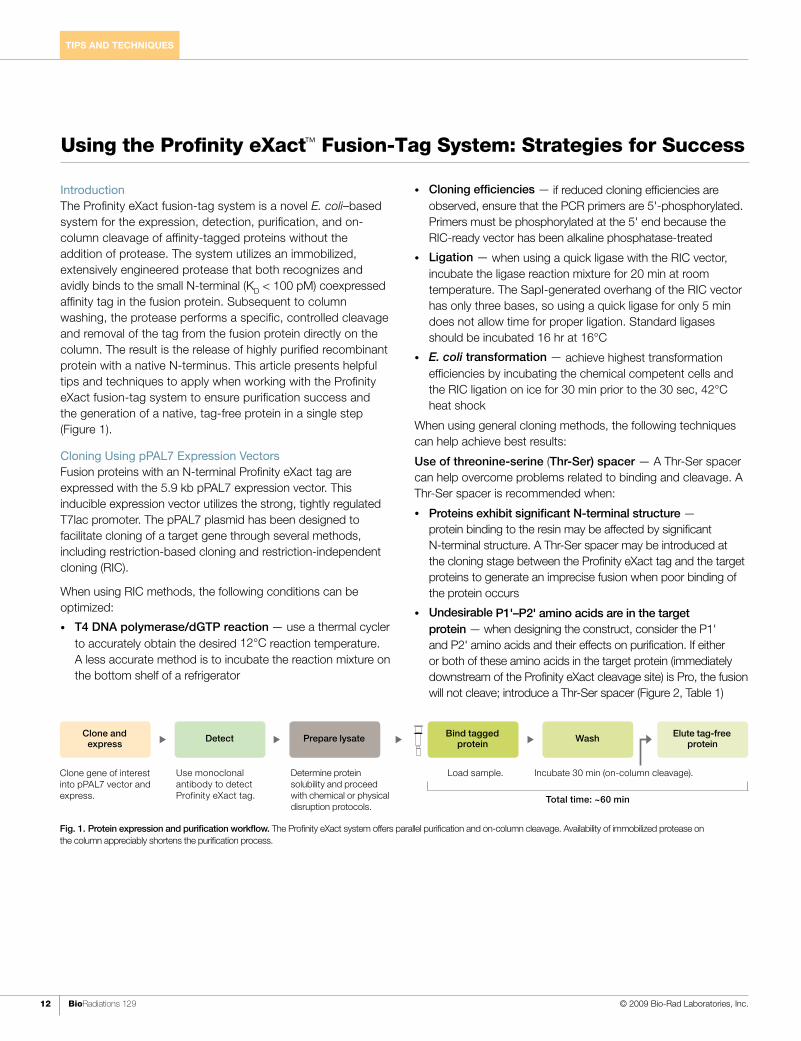
IntroductionThe Profinity eXact fusion-tag system is a novel E. coli–based system for the expression, detection, purification, and on-column cleavage of affinity-tagged proteins without the addition of protease. The system utilizes an immobilized, extensively engineered protease that both recognizes and avidly binds to the small N-terminal (KD < 100 pM) coexpressed affinity tag in the fusion protein. Subsequent to column washing, the protease performs a specific, controlled cleavage and removal of the tag from the fusion protein directly on the column. The result is the release of highly purified recombinant protein with a native N-terminus. This article presents helpful tips and techniques to apply when working with the Profinity eXact fusion-tag system to ensure purification success and the generation of a native, tag-free protein in a single step (Figure 1).
Cloning Using pPAL7 Expression VectorsFusion proteins with an N-terminal Profinity eXact tag are expressed with the 5.9 kb pPAL7 expression vector. This inducible expression vector utilizes the strong, tightly regulated T7lac promoter. The pPAL7 plasmid has been designed to facilitate cloning of a target gene through several methods, including restriction-based cloning and restriction-independent cloning (RIC).
When using RIC methods, the following conditions can be optimized:
• T4 DNA polymerase/dGTP reaction — use a thermal cycler to accurately obtain the desired 12°C reaction temperature. A less accurate method is to incubate the reaction mixture on the bottom shelf of a refrigerator
• Cloning efficiencies — if reduced cloning efficiencies are observed, ensure that the PCR primers are 5'-phosphorylated. Primers must be phosphorylated at the 5' end because the RIC-ready vector has been alkaline phosphatase-treated
• Ligation — when using a quick ligase with the RIC vector, incubate the ligase reaction mixture for 20 min at room temperature. The SapI-generated overhang of the RIC vector has only three bases, so using a quick ligase for only 5 min does not allow time for proper ligation. Standard ligases should be incubated 16 hr at 16°C
• E. coli transformation — achieve highest transformation efficiencies by incubating the chemical competent cells and the RIC ligation on ice for 30 min prior to the 30 sec, 42°C heat shock
When using general cloning methods, the following techniques can help achieve best results:
Use of threonine-serine (Thr-Ser) spacer — A Thr-Ser spacer can help overcome problems related to binding and cleavage. A Thr-Ser spacer is recommended when:
• Proteins exhibit significant N-terminal structure — protein binding to the resin may be affected by significant N-terminal structure. A Thr-Ser spacer may be introduced at the cloning stage between the Profinity eXact tag and the target proteins to generate an imprecise fusion when poor binding of the protein occurs
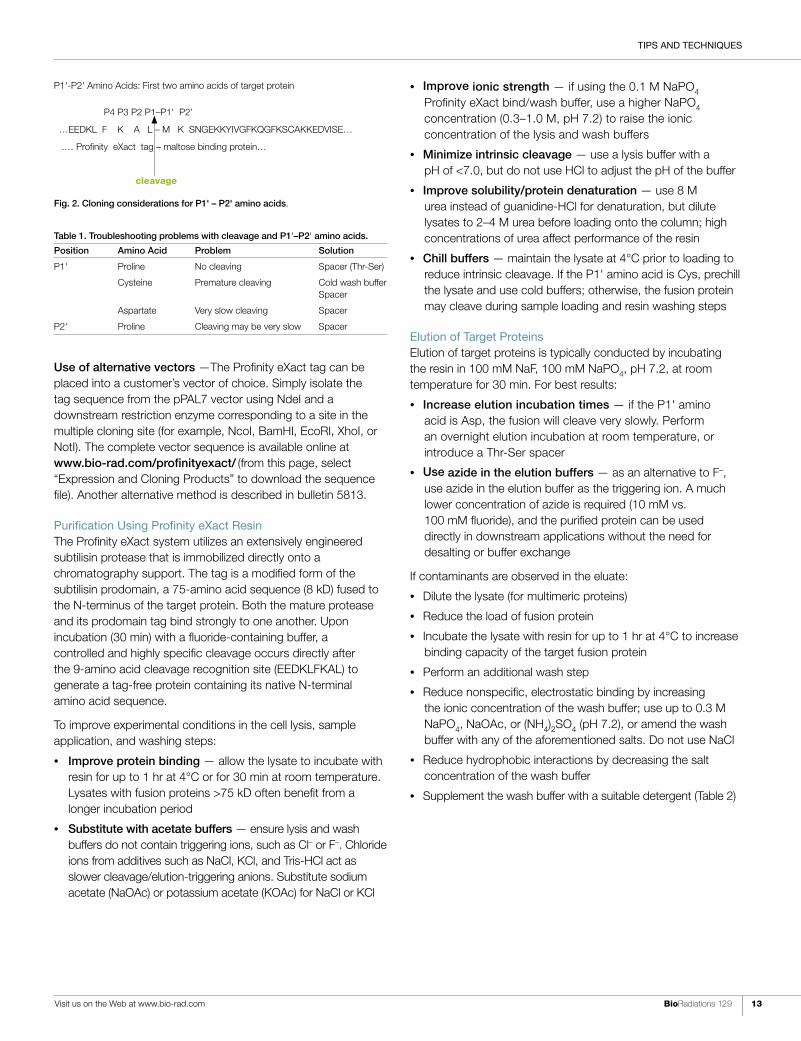
• Undesirable P1'–P2' amino acids are in the target protein — when designing the construct, consider the P1' and P2' amino acids and their effects on purification. If either or both of these amino acids in the target protein (immediately downstream of the Profinity eXact cleavage site) is Pro, the fusion will not cleave; introduce a Thr-Ser spacer (Figure 2, Table 1)
Fig. 1. Protein expression and purification workflow. The Profinity eXact system offers parallel purification and on-column cleavage. Availability of immobilized protease on the column appreciably shortens the purification process.
Total time: ~60 min
Load sample.Clone gene of interest into pPAL7 vector and express.
Incubate 30 min (on-column cleavage).Use monoclonal antibody to detect Profinity eXact tag.
Determine protein solubility and proceed with chemical or physical disruption protocols.
WashDetect Elute tag-free protein
Prepare lysate Bind tagged protein
Clone and express
TIPS AND TECHNIQUES
Visit us on the Web at www.bio-rad.com BioRadiations 129 13
Use of alternative vectors —The Profinity eXact tag can be placed into a customer’s vector of choice. Simply isolate the tag sequence from the pPAL7 vector using NdeI and a downstream restriction enzyme corresponding to a site in the multiple cloning site (for example, NcoI, BamHI, EcoRI, XhoI, or NotI). The complete vector sequence is available online at www.bio-rad.com/profinityexact/ (from this page, select “Expression and Cloning Products” to download the sequence file). Another alternative method is described in bulletin 5813.
Purification Using Profinity eXact Resin The Profinity eXact system utilizes an extensively engineered subtilisin protease that is immobilized directly onto a chromatography support. The tag is a modified form of the subtilisin prodomain, a 75-amino acid sequence (8 kD) fused to the N-terminus of the target protein. Both the mature protease and its prodomain tag bind strongly to one another. Upon incubation (30 min) with a fluoride-containing buffer, a controlled and highly specific cleavage occurs directly after the 9-amino acid cleavage recognition site (EEDKLFKAL) to generate a tag-free protein containing its native N-terminal amino acid sequence.
To improve experimental conditions in the cell lysis, sample application, and washing steps:
• Improve protein binding — allow the lysate to incubate with resin for up to 1 hr at 4°C or for 30 min at room temperature. Lysates with fusion proteins >75 kD often benefit from a longer incubation period
• Substitute with acetate buffers — ensure lysis and wash buffers do not contain triggering ions, such as Cl– or F–. Chloride ions from additives such as NaCl, KCl, and Tris-HCl act as slower cleavage/elution-triggering anions. Substitute sodium acetate (NaOAc) or potassium acetate (KOAc) for NaCl or KCl
• Improve ionic strength — if using the 0.1 M NaPO4 Profinity eXact bind/wash buffer, use a higher NaPO4 concentration (0.3–1.0 M, pH 7.2) to raise the ionic concentration of the lysis and wash buffers
• Minimize intrinsic cleavage — use a lysis buffer with a pH of <7.0, but do not use HCl to adjust the pH of the buffer
• Improve solubility/protein denaturation — use 8 M urea instead of guanidine-HCl for denaturation, but dilute lysates to 2–4 M urea before loading onto the column; high concentrations of urea affect performance of the resin
• Chill buffers — maintain the lysate at 4°C prior to loading to reduce intrinsic cleavage. If the P1' amino acid is Cys, prechill the lysate and use cold buffers; otherwise, the fusion protein may cleave during sample loading and resin washing steps
Elution of Target ProteinsElution of target proteins is typically conducted by incubating the resin in 100 mM NaF, 100 mM NaPO4, pH 7.2, at room temperature for 30 min. For best results:
• Increase elution incubation times — if the P1' amino acid is Asp, the fusion will cleave very slowly. Perform an overnight elution incubation at room temperature, or introduce a Thr-Ser spacer
• Use azide in the elution buffers — as an alternative to F–, use azide in the elution buffer as the triggering ion. A much lower concentration of azide is required (10 mM vs. 100 mM fluoride), and the purified protein can be used directly in downstream applications without the need for desalting or buffer exchange
If contaminants are observed in the eluate:
• Dilute the lysate (for multimeric proteins)
• Reduce the load of fusion protein
• Incubate the lysate with resin for up to 1 hr at 4°C to increase binding capacity of the target fusion protein
• Perform an additional wash step
• Reduce nonspecific, electrostatic binding by increasing the ionic concentration of the wash buffer; use up to 0.3 M NaPO4, NaOAc, or (NH4)2SO4 (pH 7.2), or amend the wash buffer with any of the aforementioned salts. Do not use NaCl
• Reduce hydrophobic interactions by decreasing the salt concentration of the wash buffer
• Supplement the wash buffer with a suitable detergent (Table 2)
Fig. 2. Cloning considerations for P1' – P2' amino acids.
P1'-P2' Amino Acids: First two amino acids of target protein
P4 P3 P2 P1–P1' P2'
…EEDKL F K A L – M K SNGEKKYIVGFKQGFKSCAKKEDVISE…
.… Profinity eXact tag – maltose binding protein…
cleavage
Table 1. Troubleshooting problems with cleavage and P1'–P2' amino acids.
Position Amino Acid Problem Solution
P1' Proline No cleaving Spacer (Thr-Ser)
Cysteine Premature cleaving Cold wash buffer Spacer
Aspartate Very slow cleaving Spacer
P2' Proline Cleaving may be very slow Spacer

TIPS AND TECHNIQUES
BioRadiations 129 © 2009 Bio-Rad Laboratories, Inc.14
Confirming Generation of Target ProteinUse mass spectrometry (MS) methods to confirm the generation of a tag-free protein. The following experimental results are included to illustrate a suggested method.
Purified maltose binding protein (MBP) from a Profinity eXact column is free of extraneous amino acids, as evidenced by MS data (data not shown). MBP eluates purified from a Profinity eXact column were analyzed by LC/MS using a QSTAR quadrupole-time of flight mass spectrometer. The expected mass of the purified, tag-free MBP (calculated from the amino acid sequence using the ExPASy compute MW tool) was 40,339.89 Da; experimental mass from spectra was 40,343.9 Da.
The terminal residue of the tag is a leucine, which has a molecular mass of 113 Da. The first residue of MBP is methionine, which has a molecular mass of 131 Da (Figure 2). If any miscleavage occurred, the mass spectrometer-measured mass of the purified protein would be off by greater than 100 Da — compared to the 4 Da difference demonstrated by these results (observed vs. expected mass difference is within the 100 ppm mass accuracy of the instrument).
Resin Storage and Cleaning To ensure maximum shelf life of the Profinity eXact resin:
• Store it at 4°C. However, the subtilisin mutant is stable in incubations of 30 min at 60°C and 5 days at 37°C
• Regenerate it by stripping off the cleaved Profinity eXact tag from the mutant subtilisin ligand by incubating the resin in 0.1 M H3PO4. This also effectively removes contaminants from the resin
• Immediately after cleaning, re-equilibrate the resin with bind/wash buffer or storage buffer (100 mM NaPO4, 0.02% sodium azide, pH 7.2) to prevent loss of activity
• Remove any other residual contaminants by washing the resin with 0.1 M NaOH (the resin is base stable). After cleaning with NaOH, equilibrate the resin with bind/wash buffer
• Do not store the resin in 0.1 M H3PO4, 0.1 M NaOH, or water for long periods of time (>1 hr)
For more information, visit www.bio-rad.com/profinityexact/.
Table 2. Chemical compatibility.*
Reagent Type Compatible With Profinity eXact System
Lysis solutions Bacterial lysis and extraction reagent (Bio-Rad) B-PER protein extraction reagent in Pi buffer (Thermo Fisher Scientific) B-PER protein extraction reagent in Tris buffer** BugBuster protein extraction reagent** (Novagen) FastBreak cell lysis reagent** (Promega Corporation)
Protease 1x Protease inhibitor cocktail (BD Pharmingen) inhibitors 2x Protease inhibitor cocktail set 1 (Calbiochem) Complete protease inhibitor tablets (Roche Diagnostics) 0.5 mM PMSF 0.1 mM TLCK 0.1 mM TPCK
Detergents 5% (v/v) Triton X-100 5% (v/v) NP-40 5% (v/v) Tween -20 5% (w/v) octylthioglucoside 5% (w/v) n-dodecyl b-D-maltoside 5% (w/v) CHAPS 5% (w/v) CHAPSO
Reducing 20 mM b-mercaptoethanol reagents 10 mM DTT 5 mM TCEP
Chelating 20 mM EDTA reagents 20 mM EGTA
Buffer 50 mM Tris-acetate, pH 7.2 reagents 50 mM Tris-phosphate, pH 7.2 50 mM HEPES, pH 7.2 50 mM PIPES, pH 7.2 50 mM MOPS, pH 7.2 50 mM MES, pH 7.2
Additives 20% (v/v) glycerol 20% (v/v) ethylene glycol 20% (v/v) ethanol 20% (w/v) sorbitol 20% (w/v) sucrose 200 mM imidazole 200 mM sodium acetate 100 mM sodium borate 100 mM sodium citrate 100 mM sodium sulfate 15% (w/v) ammonium sulfate 5% (v/v) DMSO 20 mM b-mercaptoethanol 5 mM MgCl2** 5 mM CaCl2**
* Compatibilities determined using Profinity eXact control lysate; some reagents, like ammonium sulfate, are protein dependent.
** Chloride ions trigger slow cleavage of target proteins from the column.

TIPS AND TECHNIQUES
Visit us on the Web at www.bio-rad.com BioRadiations 129 15
Sample Compatibility Considerations After Processing With the ProteoMiner™ Protein Enrichment Kit
ProteoMiner System’s Elution Methods As a protein enrichment technology for biomarker discovery, the ProteoMiner protein enrichment system is used upstream of many protein analysis methods. This article addresses compatibilities that should be considered between the ProteoMiner system and various downstream analysis methods.
Proteins bind to ProteoMiner beads through classical protein-protein interactions such as ionic interactions, hydrophobic interactions, hydrogen bonding, and van der Waals forces. Therefore, to ensure efficient elution of proteins from the beads, the elution reagent must be able to disrupt these forces. ProteoMiner kits are available in two formats:
• Single elution — utilizes a single elution reagent designed for maximum disruption of binding
• Sequential elution — utilizes multiple elution reagents for preferential elution of proteins based on unique binding interactions such as charge or hydrophobicity
Sample processing and downstream application compatibility considerations.
Analytical Technique Compatibility Considerations Recommendations for Improving Compatibility*
1-D – LC-MS/MS and There are no compatibility issues with the elution buffer Elution yields may be increased by eluting with an elution buffer western blotting for 1-D applications. containing up to 10% SDS with a reducing agent (for example, 50 mM DTT).
2-D DIGE Acetic acid will interfere with dye labeling (Cy dyes Elute with DIGE labeling buffer: 20 mM Tris, 7 M urea, 2 M thiourea, 4% CHAPS, require pH 8–9) and IPG separation. pH 8.5. This may result in a decrease in yield compared to the standard elution protocol. Alternatively, adjust the pH of the eluent to approximately 8.5 with 4 M sodium carbonate (add approximately 30 µl of 4 M sodium carbonate to 300 µl of eluent to bring the pH up to 8.5).
2-D electrophoresis Acetic acid will interfere with IPG separation, resulting If loading <50 µg of protein on the IPG strip, streakiness will be minimized. For in streakiness. best results, it is recommended that you clean up your sample using the ReadyPrep™ 2-D cleanup kit (163-2130) or Micro Bio-Spin™ 6 columns (732-6200).**
Immunochemistry The elution reagent causes proteins to be denatured, To improve compatibility, use a nondenaturing buffer such as (Bio-Plex® suspension which may prevent antibody-target binding. 0.2 M glycine-HCl, 2% NP-40, pH 2.4; 0.1 M acetic acid, 2% NP-40; 1 M array system) NaCl, 2% NP-40; or 0.1 M acetic acid containing 40% ethylene glycol. Success of eluting proteins with a nondenaturing elution reagent is protein dependent. If using the alternate elution buffer above, the acidic eluates may need to be neutralized with 3 M Tris base.
SELDI MS There are no compatibility issues with the elution buffer Eluted sample is still very complex; resolution may be improved by using the for this application. ProteoMiner sequential elution kit (163-3010 or 163-3011).
Trypsin hydrolysis – MS CHAPS will reduce the enzymatic activity of trypsin When using the standard elution buffer, it is recommended that you utilize inline LC or and can interfere with ionization processes. clean up your sample using the ReadyPrep 2-D cleanup kit (163-2130) or Micro Bio-Spin 6 columns (732-6200).** Alternatively, you may perform on-bead digestion, in which the trypsin digest occurs directly in the column instead of after elution.
Other applications If your downstream analysis technique is negatively Elute with standard elution buffer, then buffer exchange the sample with impacted by low pH, detergents, or salts, you will need Micro Bio-Spin 6 columns (732-6221 or 732-6200) pre-equilibrated with the to remove the incompatible components of the appropriate buffer (for example, 7 M urea, 2 M thiourea, 2% CHAPS, optional elution buffer. 15 mM Tris, pH 8.5) or use the ReadyPrep 2-D cleanup kit (163-2130).
* For more information on these recommendations, please contact our technical support team at [email protected].** When using Micro Bio-Spin 6 columns (732-6200) for cleanup of your sample, buffer exchange will be required. It is recommended to exchange with
7 M urea, 2 M thiourea, 2% CHAPS.
The single elution method provides the highest level of enrichment and excellent recovery while utilizing a simplified protocol. It is therefore the preferred elution method for most researchers. For this reason, we will focus on the single elution protocol when examining what steps need to be taken prior to analyzing ProteoMiner eluates with various downstream techniques.
Preparation for Various Downstream ApplicationsFirst, you may need to quantitate the amount of protein in your sample. For this we recommend the Quick Start™ Bradford protein assay 1 (500-0201); this kit is easy to use and has been tested for compatibility with the ProteoMiner system.
The ProteoMiner single elution protocol utilizes an elution buffer containing 8 M urea, 2% CHAPS, and 5% acetic acid. The table below identifies buffer compatibilities with a number of analytical techniques and provides guidance for improving compatibility.
For more information, visit www.bio-rad.com/proteominer/.

BioRadiations 129 © 2009 Bio-Rad Laboratories, Inc.16
Authors: Enrique Dalmasso, Dominic Caseñas, and Shawn Miller
TOP-DOWN, BOTTOM-UP The Merging of Two High-Performance Technologies
Visit us on the Web at www.bio-rad.com BioRadiations 129 17
Bio-Rad Laboratories introduced the ProteinChip® SELDI system in 2006 to provide researchers engaged in biomarker discovery with a high-throughput, high-sensitivity approach to protein expression profiling. The ProteinChip system
incorporates chip-based applications with top-down mass spectrometry (MS) for protein profiling, an area of
research that has typically relied on more conventional approaches such as 2-D gel electrophoresis. Since
its introduction, the ProteinChip system has been used by researchers in many fields of study to discover
biomarker candidates from a variety of sample types.
Until now, researchers have had to choose between such top-down intact protein profiling methods and
digest-based bottom-up methods utilizing high-performance MS for biomarker discovery. Bio-Rad has
recently partnered with Bruker Daltonics to combine the benefits of the SELDI chromatographic retention
sample preparation technology with the high-performance mass spectrometers also used for bottom-up
proteomic analyses, providing researchers with both discovery methods on one platform.
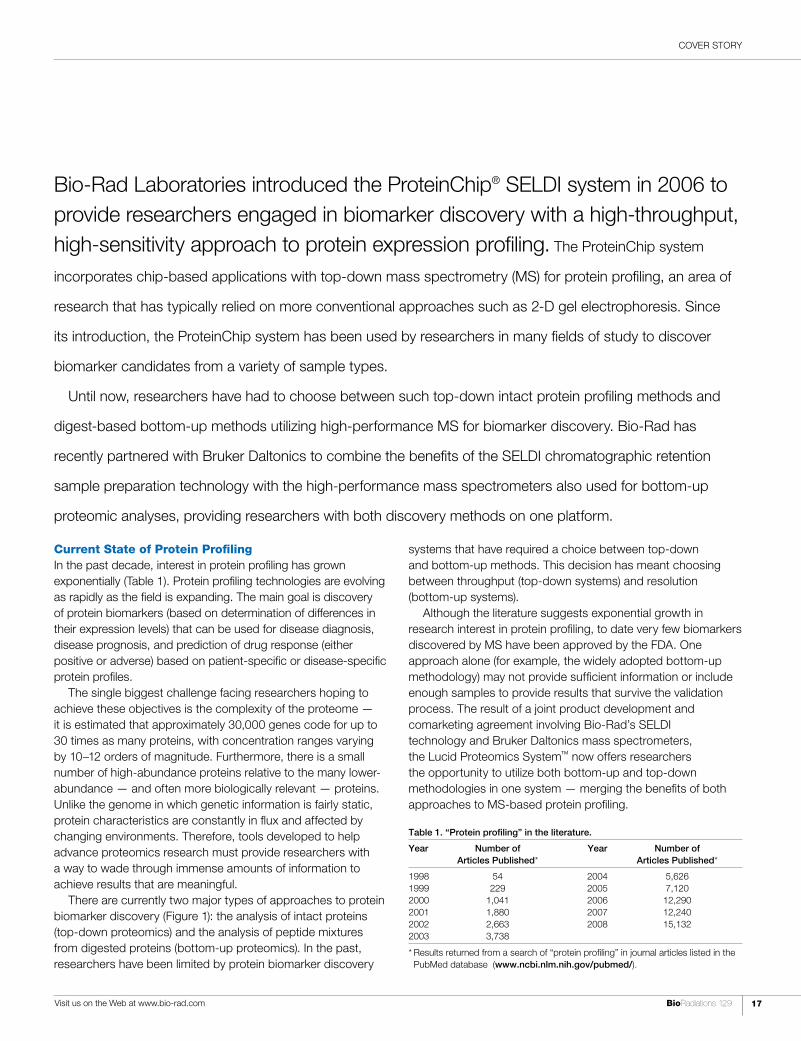
Current State of Protein ProfilingIn the past decade, interest in protein profiling has grown exponentially (Table 1). Protein profiling technologies are evolving as rapidly as the field is expanding. The main goal is discovery of protein biomarkers (based on determination of differences in their expression levels) that can be used for disease diagnosis, disease prognosis, and prediction of drug response (either positive or adverse) based on patient-specific or disease-specific protein profiles.
The single biggest challenge facing researchers hoping to achieve these objectives is the complexity of the proteome — it is estimated that approximately 30,000 genes code for up to 30 times as many proteins, with concentration ranges varying by 10–12 orders of magnitude. Furthermore, there is a small number of high-abundance proteins relative to the many lower-abundance — and often more biologically relevant — proteins. Unlike the genome in which genetic information is fairly static, protein characteristics are constantly in flux and affected by changing environments. Therefore, tools developed to help advance proteomics research must provide researchers with a way to wade through immense amounts of information to achieve results that are meaningful.
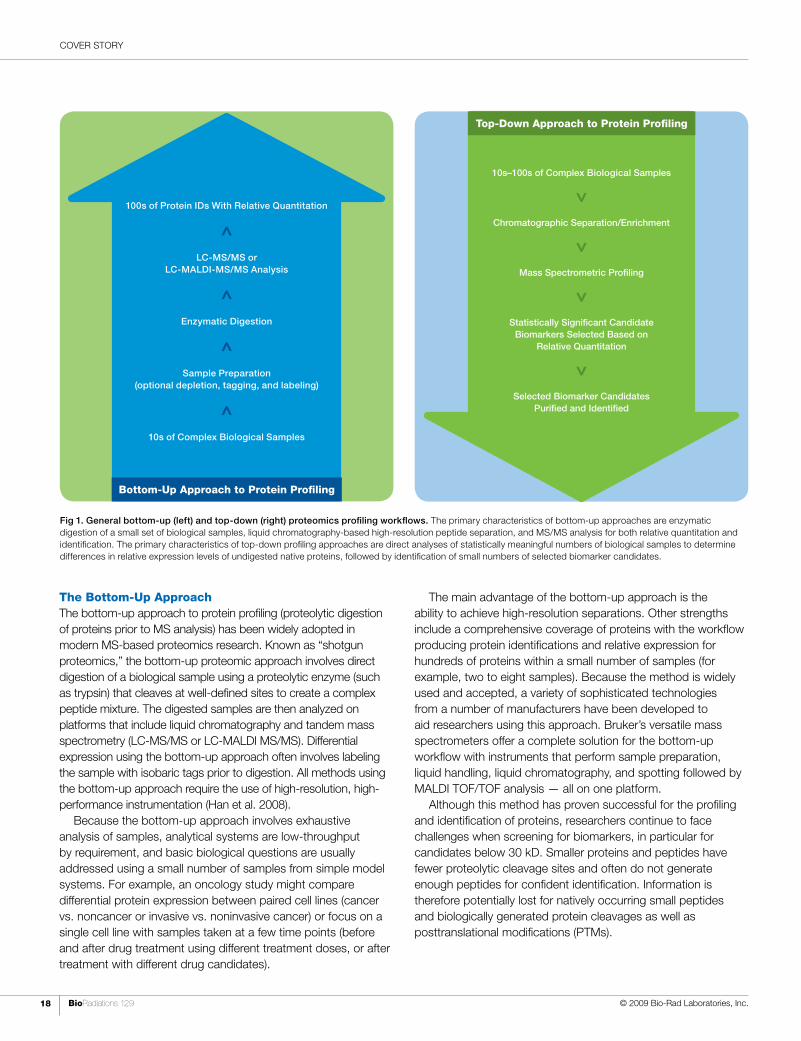
There are currently two major types of approaches to protein biomarker discovery (Figure 1): the analysis of intact proteins (top-down proteomics) and the analysis of peptide mixtures from digested proteins (bottom-up proteomics). In the past, researchers have been limited by protein biomarker discovery
COVER STORY
systems that have required a choice between top-down and bottom-up methods. This decision has meant choosing between throughput (top-down systems) and resolution (bottom-up systems).
Although the literature suggests exponential growth in research interest in protein profiling, to date very few biomarkers discovered by MS have been approved by the FDA. One approach alone (for example, the widely adopted bottom-up methodology) may not provide sufficient information or include enough samples to provide results that survive the validation process. The result of a joint product development and comarketing agreement involving Bio-Rad’s SELDI technology and Bruker Daltonics mass spectrometers, the Lucid Proteomics System™ now offers researchers the opportunity to utilize both bottom-up and top-down methodologies in one system — merging the benefits of both approaches to MS-based protein profiling.
Table 1. “Protein profiling” in the literature.
Year Number of Year Number of Articles Published* Articles Published*
1998 54 2004 5,6261999 229 2005 7,1202000 1,041 2006 12,2902001 1,880 2007 12,2402002 2,663 2008 15,1322003 3,738
* Results returned from a search of “protein profiling” in journal articles listed in the PubMed database (www.ncbi.nlm.nih.gov/pubmed/).
COVER STORY
BioRadiations 129 © 2009 Bio-Rad Laboratories, Inc.18
The Bottom-Up ApproachThe bottom-up approach to protein profiling (proteolytic digestion of proteins prior to MS analysis) has been widely adopted in modern MS-based proteomics research. Known as “shotgun proteomics,” the bottom-up proteomic approach involves direct digestion of a biological sample using a proteolytic enzyme (such as trypsin) that cleaves at well-defined sites to create a complex peptide mixture. The digested samples are then analyzed on platforms that include liquid chromatography and tandem mass spectrometry (LC-MS/MS or LC-MALDI MS/MS). Differential expression using the bottom-up approach often involves labeling the sample with isobaric tags prior to digestion. All methods using the bottom-up approach require the use of high-resolution, high-performance instrumentation (Han et al. 2008).
Because the bottom-up approach involves exhaustive analysis of samples, analytical systems are low-throughput by requirement, and basic biological questions are usually addressed using a small number of samples from simple model systems. For example, an oncology study might compare differential protein expression between paired cell lines (cancer vs. noncancer or invasive vs. noninvasive cancer) or focus on a single cell line with samples taken at a few time points (before and after drug treatment using different treatment doses, or after treatment with different drug candidates).
Fig 1. General bottom-up (left) and top-down (right) proteomics profiling workflows. The primary characteristics of bottom-up approaches are enzymatic digestion of a small set of biological samples, liquid chromatography-based high-resolution peptide separation, and MS/MS analysis for both relative quantitation and identification. The primary characteristics of top-down profiling approaches are direct analyses of statistically meaningful numbers of biological samples to determine differences in relative expression levels of undigested native proteins, followed by identification of small numbers of selected biomarker candidates.
The main advantage of the bottom-up approach is the ability to achieve high-resolution separations. Other strengths include a comprehensive coverage of proteins with the workflow producing protein identifications and relative expression for hundreds of proteins within a small number of samples (for example, two to eight samples). Because the method is widely used and accepted, a variety of sophisticated technologies from a number of manufacturers have been developed to aid researchers using this approach. Bruker’s versatile mass spectrometers offer a complete solution for the bottom-up workflow with instruments that perform sample preparation, liquid handling, liquid chromatography, and spotting followed by MALDI TOF/TOF analysis — all on one platform.
Although this method has proven successful for the profiling and identification of proteins, researchers continue to face challenges when screening for biomarkers, in particular for candidates below 30 kD. Smaller proteins and peptides have fewer proteolytic cleavage sites and often do not generate enough peptides for confident identification. Information is therefore potentially lost for natively occurring small peptides and biologically generated protein cleavages as well as posttranslational modifications (PTMs).
Top-Down Approach to Protein Profiling
10s–100s of Complex Biological Samples^
Chromatographic Separation/Enrichment^
Mass Spectrometric Profiling^
Statistically Significant Candidate Biomarkers Selected Based on
Relative Quantitation^
Selected Biomarker Candidates Purified and Identified
Bottom-Up Approach to Protein Profiling
100s of Protein IDs With Relative Quantitation
^LC-MS/MS or
LC-MALDI-MS/MS Analysis
^Enzymatic Digestion
^Sample Preparation
(optional depletion, tagging, and labeling)
^10s of Complex Biological Samples

Visit us on the Web at www.bio-rad.com BioRadiations 129 19
COVER STORY
The Top-Down ApproachIn the field of proteomics, the term “top-down” describes two different techniques. Top-down as applied to protein identification, also known as “top-down sequencing,” is so named because of its similarity to DNA sequencing methods and is typically conducted on highly purified protein preparations. Top-down as applied to protein profiling, also known as “top-down proteomics,” involves separating intact proteins from complex biological samples using traditional separation techniques such as liquid chromatography or 2-D gel electrophoresis, followed by differential expression analysis using spectrum analysis or gel imaging platforms. Spots or fractions that are predicted to contain biomarkers are identified using MS. The top-down methods discussed in this article focus on proteomic profiling of intact proteins.
The strength of top-down approaches lies in direct detection of the native molecular mass of biological protein species. Mass information is retained for natively occurring small peptides, biologically generated protein cleavages, and PTMs — all of which are postulated to be relevant in many diseases and other biological processes. Other major advantages of top-down strategies are simplified sample preparation and elimination of the time-consuming protein digestion required for bottom-up methods.
Unlike bottom-up methods in which biomarker discovery is driven from more specific and limited sample sets, the starting point for top-down proteomics can be hundreds of different complex biological samples. Scientists using top-down approaches are generally interested in addressing clinical questions requiring larger numbers of samples; for example, biomarker discovery using body fluids (plasma, serum, cerebrospinal fluid, urine) from humans or from animal models.
SELDI-TOF MS is a widely used top-down biomarker discovery method that combines the selectivity of chromatography with the sensitivity of mass spectrometry. In the ProteinChip SELDI system, complex samples are applied to chromatographic arrays for separation based on physicochemical interactions. The chromatographic surfaces reduce the sample complexity and facilitate washing to remove salts and detergents that interfere with MS-based detection, thereby significantly increasing the number of detected protein species. The array footprint is compatible with liquid handling robotics systems, facilitating high-throughput analysis. High throughput is particularly important for clinical biomarker studies, which generally require large patient cohorts to compensate for patient-to-patient variability and generate results with sufficient statistical power to accurately assess the predictive value of a potential biomarker. Until now, the major challenge for this approach was the requirement for off-line enrichment and purification of the selected biomarker candidates followed by MS/MS identification using a different MS platform.
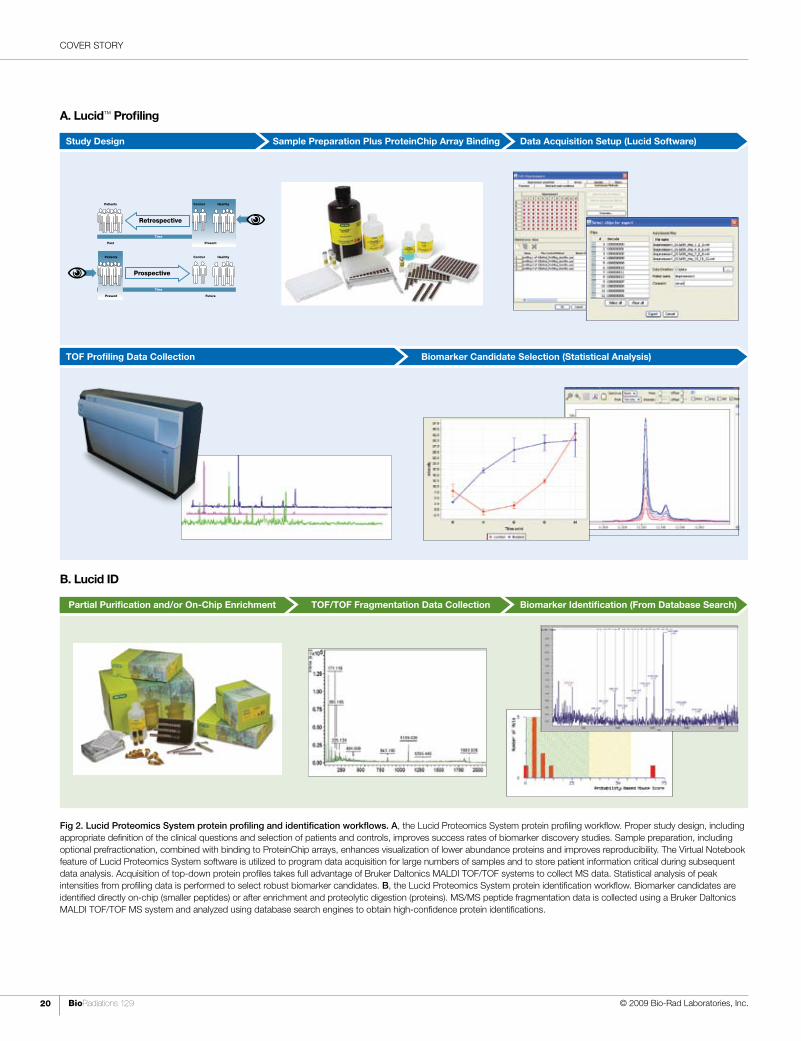
Introducing the Lucid Proteomics System Bio-Rad has partnered with Bruker Daltonics, a leading manufacturer of MS instruments and accessories for life science, pharmaceutical, biochemical, and chemical research, to bring all the
Case Study: Identification of a Neuropeptide From Cerebrospinal Fluid Using the Lucid Proteomics System
Neuroendocrine protein 7B2 (also known as secretogranin V) is known to be posttranslationally cleaved into N-terminal (27–176) and C-terminal (200–212) peptides. Neuropeptide 7B2 has been shown to be a good marker of neuroendocrine tumors (Mbikay et al. 2001), and increased levels of the C-terminal fragment (7B2CT) have been detected in amyotrophic lateral sclerosis and frontotemporal dementia (Ranganathan et al. 2005). The fragment found in this study does not correspond to any of the predicted peptides and its presence would have been missed in a digestion-based (bottom-up) discovery approach. Top-down profiling of biological samples provides valuable information about a biological system’s true proteomic state, and direct, on-chip capture and identification of peptides can accelerate biomarker-driven functional studies.
The 3,511 Da peptide from this CSF profiling study was directly identified from the CM10 cation exchange ProteinChip array surface by MALDI TOF/TOF analysis using the same Bruker ultraflex III system.
The protein was identified as a fragment of neuroendocrine protein 7B2, corresponding to amino acids 182–212.
R.SVNPYLQGQRLDNVVAKKSVPHFSDEDKDPE
Human cerebrospinal fluid (CSF) enriched using reverse-phase chromatography beads and eluted with 30% acetonitrile, 0.5% TFA was profiled on three different ProteinChip array surfaces (cation exchange, metal affinity, and anion exchange) followed by addition of 25% CHCA as the matrix. The arrays were analyzed using a Bruker ultraflex III MALDI TOF/TOF system in linear MS mode. For biomarker discovery, profiling on multiple surfaces captures different subsets of proteins within complex samples and increases the potential of finding peaks that are differentially expressed between study groups.
COVER STORY
BioRadiations 129 © 2009 Bio-Rad Laboratories, Inc.20
Fig 2. Lucid Proteomics System protein profiling and identification workflows. A, the Lucid Proteomics System protein profiling workflow. Proper study design, including appropriate definition of the clinical questions and selection of patients and controls, improves success rates of biomarker discovery studies. Sample preparation, including optional prefractionation, combined with binding to ProteinChip arrays, enhances visualization of lower abundance proteins and improves reproducibility. The Virtual Notebook feature of Lucid Proteomics System software is utilized to program data acquisition for large numbers of samples and to store patient information critical during subsequent data analysis. Acquisition of top-down protein profiles takes full advantage of Bruker Daltonics MALDI TOF/TOF systems to collect MS data. Statistical analysis of peak intensities from profiling data is performed to select robust biomarker candidates. B, the Lucid Proteomics System protein identification workflow. Biomarker candidates are identified directly on-chip (smaller peptides) or after enrichment and proteolytic digestion (proteins). MS/MS peptide fragmentation data is collected using a Bruker Daltonics MALDI TOF/TOF MS system and analyzed using database search engines to obtain high-confidence protein identifications.
B. Lucid ID
Biomarker Identification (From Database Search)TOF/TOF Fragmentation Data CollectionPartial Purification and/or On-Chip Enrichment
A. Lucid™ Profiling
Data Acquisition Setup (Lucid Software)Sample Preparation Plus ProteinChip Array BindingStudy Design
Prospective
ControlPatients
Present Future
Healthy
Time
Retrospective
ControlPatients
Past Present
Healthy
Time
Biomarker Candidate Selection (Statistical Analysis)TOF Profiling Data Collection
COVER STORY
Visit us on the Web at www.bio-rad.com BioRadiations 129 21
advantages of Bio-Rad’s ProteinChip SELDI technology to Bruker’s high-resolution mass spectrometers. This collaboration enables both bottom-up and top-down approaches on the same MALDI TOF/TOF systems, as well as a complete SELDI-based biomarker discovery solution that includes both protein profiling and, for the first time in a SELDI-based workflow, protein identification of biomarker candidates, either by direct on-chip TOF/TOF analysis (suitable for small peptides) or by enrichment, purification, and digestion followed by TOF/TOF analysis (for larger proteins) (Figure 2).
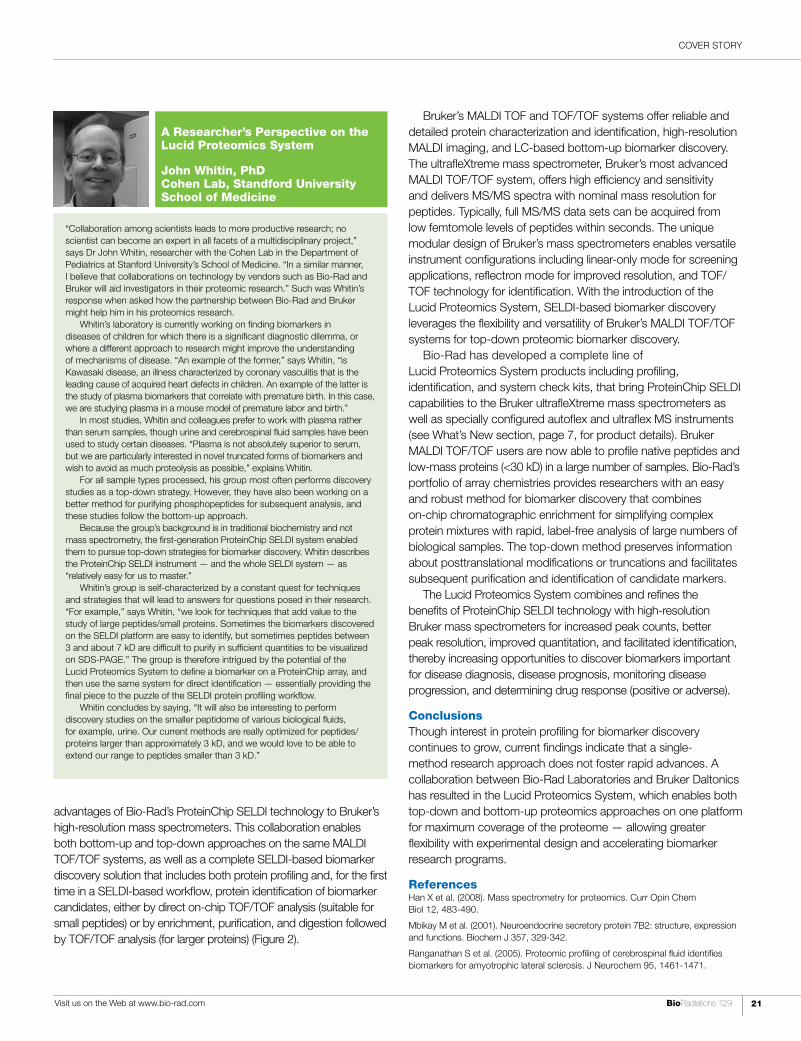
“Collaboration among scientists leads to more productive research; no scientist can become an expert in all facets of a multidisciplinary project,” says Dr John Whitin, researcher with the Cohen Lab in the Department of Pediatrics at Stanford University’s School of Medicine. “In a similar manner, I believe that collaborations on technology by vendors such as Bio-Rad and Bruker will aid investigators in their proteomic research.” Such was Whitin’s response when asked how the partnership between Bio-Rad and Bruker might help him in his proteomics research.
Whitin’s laboratory is currently working on finding biomarkers in diseases of children for which there is a significant diagnostic dilemma, or where a different approach to research might improve the understanding of mechanisms of disease. “An example of the former,” says Whitin, “is Kawasaki disease, an illness characterized by coronary vasculitis that is the leading cause of acquired heart defects in children. An example of the latter is the study of plasma biomarkers that correlate with premature birth. In this case, we are studying plasma in a mouse model of premature labor and birth.”
In most studies, Whitin and colleagues prefer to work with plasma rather than serum samples, though urine and cerebrospinal fluid samples have been used to study certain diseases. “Plasma is not absolutely superior to serum, but we are particularly interested in novel truncated forms of biomarkers and wish to avoid as much proteolysis as possible,” explains Whitin.
For all sample types processed, his group most often performs discovery studies as a top-down strategy. However, they have also been working on a better method for purifying phosphopeptides for subsequent analysis, and these studies follow the bottom-up approach.
Because the group’s background is in traditional biochemistry and not mass spectrometry, the first-generation ProteinChip SELDI system enabled them to pursue top-down strategies for biomarker discovery. Whitin describes the ProteinChip SELDI instrument — and the whole SELDI system — as “relatively easy for us to master.”
Whitin’s group is self-characterized by a constant quest for techniques and strategies that will lead to answers for questions posed in their research. “For example,” says Whitin, “we look for techniques that add value to the study of large peptides/small proteins. Sometimes the biomarkers discovered on the SELDI platform are easy to identify, but sometimes peptides between 3 and about 7 kD are difficult to purify in sufficient quantities to be visualized on SDS-PAGE.” The group is therefore intrigued by the potential of the Lucid Proteomics System to define a biomarker on a ProteinChip array, and then use the same system for direct identification — essentially providing the final piece to the puzzle of the SELDI protein profiling workflow.
Whitin concludes by saying, “It will also be interesting to perform discovery studies on the smaller peptidome of various biological fluids, for example, urine. Our current methods are really optimized for peptides/proteins larger than approximately 3 kD, and we would love to be able to extend our range to peptides smaller than 3 kD.”
A Researcher’s Perspective on the Lucid Proteomics System
John Whitin, PhD Cohen Lab, Standford University School of Medicine
Bruker’s MALDI TOF and TOF/TOF systems offer reliable and detailed protein characterization and identification, high-resolution MALDI imaging, and LC-based bottom-up biomarker discovery. The ultrafleXtreme mass spectrometer, Bruker’s most advanced MALDI TOF/TOF system, offers high efficiency and sensitivity and delivers MS/MS spectra with nominal mass resolution for peptides. Typically, full MS/MS data sets can be acquired from low femtomole levels of peptides within seconds. The unique modular design of Bruker’s mass spectrometers enables versatile instrument configurations including linear-only mode for screening applications, reflectron mode for improved resolution, and TOF/TOF technology for identification. With the introduction of the Lucid Proteomics System, SELDI-based biomarker discovery leverages the flexibility and versatility of Bruker’s MALDI TOF/TOF systems for top-down proteomic biomarker discovery.
Bio-Rad has developed a complete line of Lucid Proteomics System products including profiling, identification, and system check kits, that bring ProteinChip SELDI capabilities to the Bruker ultrafleXtreme mass spectrometers as well as specially configured autoflex and ultraflex MS instruments (see What’s New section, page 7, for product details). Bruker MALDI TOF/TOF users are now able to profile native peptides and low-mass proteins (<30 kD) in a large number of samples. Bio-Rad’s portfolio of array chemistries provides researchers with an easy and robust method for biomarker discovery that combines on-chip chromatographic enrichment for simplifying complex protein mixtures with rapid, label-free analysis of large numbers of biological samples. The top-down method preserves information about posttranslational modifications or truncations and facilitates subsequent purification and identification of candidate markers.
The Lucid Proteomics System combines and refines the benefits of ProteinChip SELDI technology with high-resolution Bruker mass spectrometers for increased peak counts, better peak resolution, improved quantitation, and facilitated identification, thereby increasing opportunities to discover biomarkers important for disease diagnosis, disease prognosis, monitoring disease progression, and determining drug response (positive or adverse).
ConclusionsThough interest in protein profiling for biomarker discovery continues to grow, current findings indicate that a single-method research approach does not foster rapid advances. A collaboration between Bio-Rad Laboratories and Bruker Daltonics has resulted in the Lucid Proteomics System, which enables both top-down and bottom-up proteomics approaches on one platform for maximum coverage of the proteome — allowing greater flexibility with experimental design and accelerating biomarker research programs.
ReferencesHan X et al. (2008). Mass spectrometry for proteomics. Curr Opin Chem Biol 12, 483-490.
Mbikay M et al. (2001). Neuroendocrine secretory protein 7B2: structure, expression and functions. Biochem J 357, 329-342.
Ranganathan S et al. (2005). Proteomic profiling of cerebrospinal fluid identifies biomarkers for amyotrophic lateral sclerosis. J Neurochem 95, 1461-1471.
TECHNICAL REPORT
BioRadiations 129 © 2009 Bio-Rad Laboratories, Inc.22
Using Bio-Plex® Phosphoprotein Assays to Study EGFR Signaling in Human Patient–Derived Xenografts Treated With Cetuximab
Rebekka Krumbach, Julia Schüler, Thomas Metz, Heinz-Herbert Fiebig, and Thomas Beckers Oncotest GmbH, Institute for Experimental Oncology, Am Flughafen 12-14, 79108 Freiburg, Germany
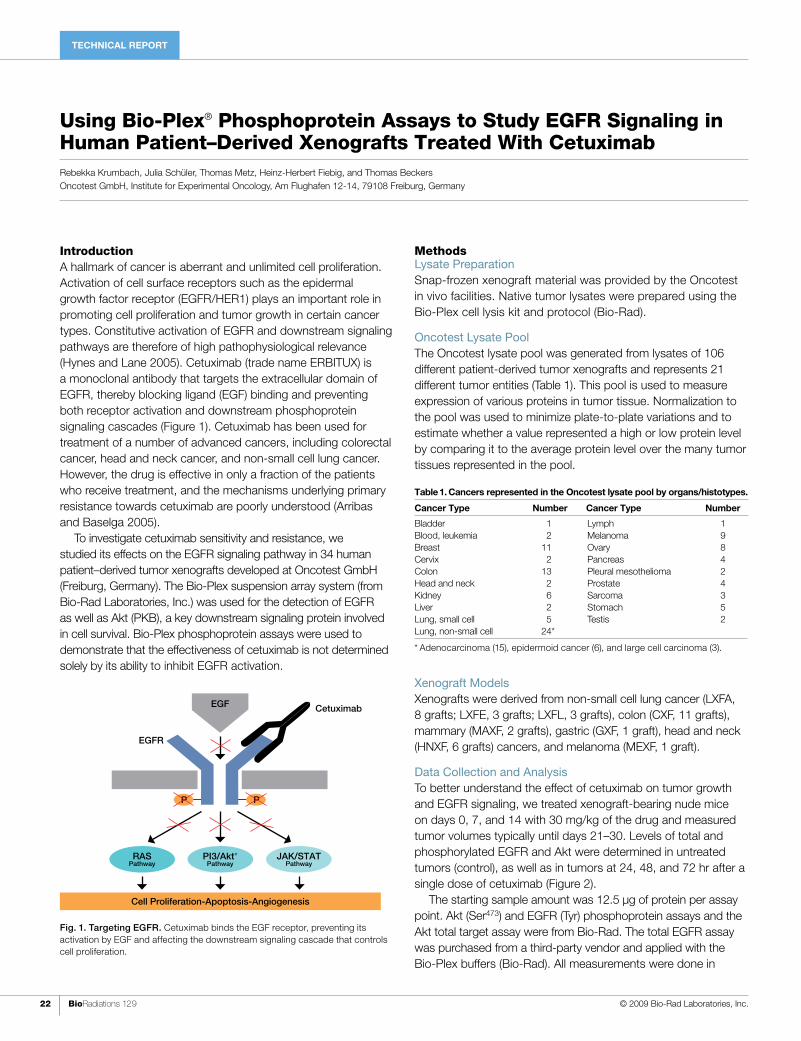
IntroductionA hallmark of cancer is aberrant and unlimited cell proliferation. Activation of cell surface receptors such as the epidermal growth factor receptor (EGFR/HER1) plays an important role in promoting cell proliferation and tumor growth in certain cancer types. Constitutive activation of EGFR and downstream signaling pathways are therefore of high pathophysiological relevance (Hynes and Lane 2005). Cetuximab (trade name ERBITUX) is a monoclonal antibody that targets the extracellular domain of EGFR, thereby blocking ligand (EGF) binding and preventing both receptor activation and downstream phosphoprotein signaling cascades (Figure 1). Cetuximab has been used for treatment of a number of advanced cancers, including colorectal cancer, head and neck cancer, and non-small cell lung cancer. However, the drug is effective in only a fraction of the patients who receive treatment, and the mechanisms underlying primary resistance towards cetuximab are poorly understood (Arribas and Baselga 2005).
To investigate cetuximab sensitivity and resistance, we studied its effects on the EGFR signaling pathway in 34 human patient–derived tumor xenografts developed at Oncotest GmbH (Freiburg, Germany). The Bio-Plex suspension array system (from Bio-Rad Laboratories, Inc.) was used for the detection of EGFR as well as Akt (PKB), a key downstream signaling protein involved in cell survival. Bio-Plex phosphoprotein assays were used to demonstrate that the effectiveness of cetuximab is not determined solely by its ability to inhibit EGFR activation.
MethodsLysate Preparation Snap-frozen xenograft material was provided by the Oncotest in vivo facilities. Native tumor lysates were prepared using the Bio-Plex cell lysis kit and protocol (Bio-Rad).
Oncotest Lysate Pool The Oncotest lysate pool was generated from lysates of 106 different patient-derived tumor xenografts and represents 21 different tumor entities (Table 1). This pool is used to measure expression of various proteins in tumor tissue. Normalization to the pool was used to minimize plate-to-plate variations and to estimate whether a value represented a high or low protein level by comparing it to the average protein level over the many tumor tissues represented in the pool.
Xenograft ModelsXenografts were derived from non-small cell lung cancer (LXFA, 8 grafts; LXFE, 3 grafts; LXFL, 3 grafts), colon (CXF, 11 grafts), mammary (MAXF, 2 grafts), gastric (GXF, 1 graft), head and neck (HNXF, 6 grafts) cancers, and melanoma (MEXF, 1 graft).
Data Collection and AnalysisTo better understand the effect of cetuximab on tumor growth and EGFR signaling, we treated xenograft-bearing nude mice on days 0, 7, and 14 with 30 mg/kg of the drug and measured tumor volumes typically until days 21–30. Levels of total and phosphorylated EGFR and Akt were determined in untreated tumors (control), as well as in tumors at 24, 48, and 72 hr after a single dose of cetuximab (Figure 2).
The starting sample amount was 12.5 μg of protein per assay point. Akt (Ser473) and EGFR (Tyr) phosphoprotein assays and the Akt total target assay were from Bio-Rad. The total EGFR assay was purchased from a third-party vendor and applied with the Bio-Plex buffers (Bio-Rad). All measurements were done in
Bladder 1 Blood, leukemia 2 Breast 11Cervix 2 Colon 13Head and neck 2 Kidney 6Liver 2Lung, small cell 5 Lung, non-small cell 24*
Lymph 1Melanoma 9 Ovary 8 Pancreas 4Pleural mesothelioma 2Prostate 4Sarcoma 3Stomach 5 Testis 2
Table 1. Cancers represented in the Oncotest lysate pool by organs/histotypes.
Cancer Type Number Cancer Type Number
* Adenocarcinoma (15), epidermoid cancer (6), and large cell carcinoma (3).
TECHNICAL REPORT
Fig. 1. Targeting EGFR. Cetuximab binds the EGF receptor, preventing its activation by EGF and affecting the downstream signaling cascade that controls cell proliferation.
Cell Proliferation-Apoptosis-Angiogenesis
P P
EGF
EGFR
Cetuximab
RAS Pathway
PI3/Akt* Pathway
JAK/STAT Pathway
TECHNICAL REPORT
Visit us on the Web at www.bio-rad.com BioRadiations 129 23
duplicate and only included in this report if the %CV was <20. The Oncotest lysate pool was run as a normalization control at the start and at the end of every plate. Average median fluorescence intensity (MFI) values from the pool were set as 1 and the sample MFIs were normalized against the pool (nMFI) for each plate.
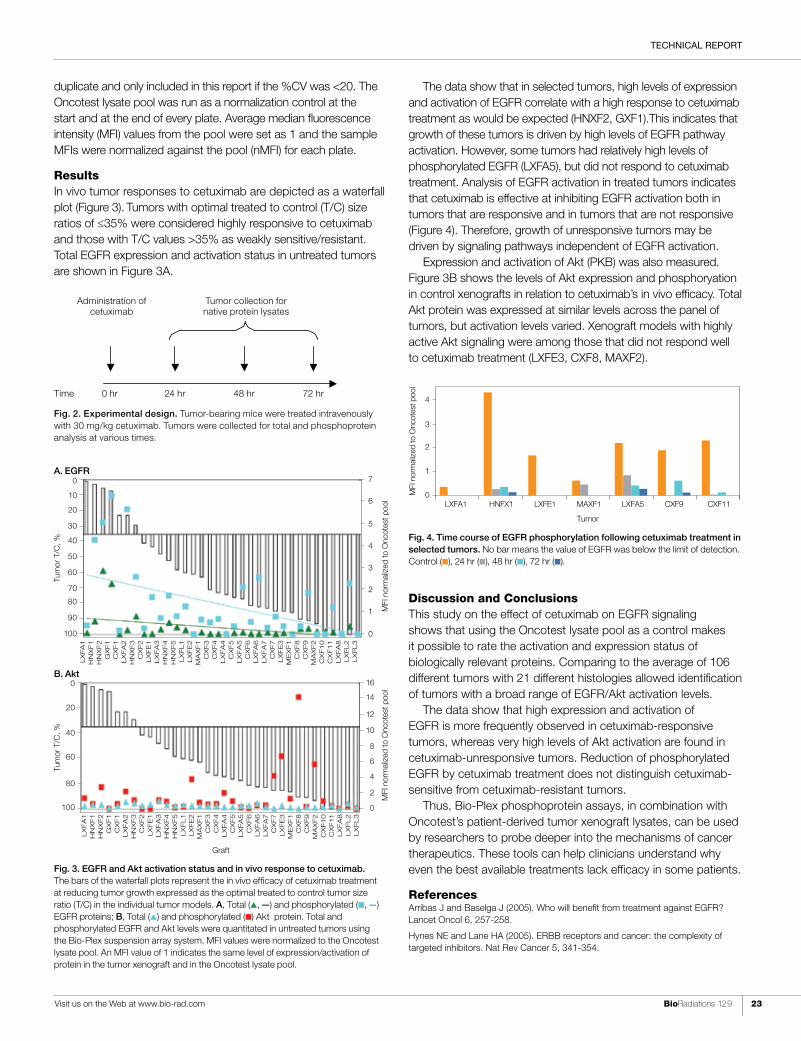
ResultsIn vivo tumor responses to cetuximab are depicted as a waterfall plot (Figure 3). Tumors with optimal treated to control (T/C) size ratios of ≤35% were considered highly responsive to cetuximab and those with T/C values >35% as weakly sensitive/resistant. Total EGFR expression and activation status in untreated tumors are shown in Figure 3A.
The data show that in selected tumors, high levels of expression and activation of EGFR correlate with a high response to cetuximab treatment as would be expected (HNXF2, GXF1).This indicates that growth of these tumors is driven by high levels of EGFR pathway activation. However, some tumors had relatively high levels of phosphorylated EGFR (LXFA5), but did not respond to cetuximab treatment. Analysis of EGFR activation in treated tumors indicates that cetuximab is effective at inhibiting EGFR activation both in tumors that are responsive and in tumors that are not responsive (Figure 4). Therefore, growth of unresponsive tumors may be driven by signaling pathways independent of EGFR activation.
Expression and activation of Akt (PKB) was also measured. Figure 3B shows the levels of Akt expression and phosphoryation in control xenografts in relation to cetuximab’s in vivo efficacy. Total Akt protein was expressed at similar levels across the panel of tumors, but activation levels varied. Xenograft models with highly active Akt signaling were among those that did not respond well to cetuximab treatment (LXFE3, CXF8, MAXF2).
Discussion and ConclusionsThis study on the effect of cetuximab on EGFR signaling shows that using the Oncotest lysate pool as a control makes it possible to rate the activation and expression status of biologically relevant proteins. Comparing to the average of 106 different tumors with 21 different histologies allowed identification of tumors with a broad range of EGFR/Akt activation levels.
The data show that high expression and activation of EGFR is more frequently observed in cetuximab-responsive tumors, whereas very high levels of Akt activation are found in cetuximab-unresponsive tumors. Reduction of phosphorylated EGFR by cetuximab treatment does not distinguish cetuximab-sensitive from cetuximab-resistant tumors.
Thus, Bio-Plex phosphoprotein assays, in combination with Oncotest’s patient-derived tumor xenograft lysates, can be used by researchers to probe deeper into the mechanisms of cancer therapeutics. These tools can help clinicians understand why even the best available treatments lack efficacy in some patients.
ReferencesArribas J and Baselga J (2005). Who will benefit from treatment against EGFR? Lancet Oncol 6, 257-258.
Hynes NE and Lane HA (2005). ERBB receptors and cancer: the complexity of targeted inhibitors. Nat Rev Cancer 5, 341-354.
Fig. 2. Experimental design. Tumor-bearing mice were treated intravenously with 30 mg/kg cetuximab. Tumors were collected for total and phosphoprotein analysis at various times.
Time 0 hr 24 hr 48 hr 72 hr
Time 24h 48h 72h 0h
Administration of Cetuxima b
Tum or collection for na tive protein lysates Administration of
cetuximabTumor collection for native protein lysates
Fig. 3. EGFR and Akt activation status and in vivo response to cetuximab. The bars of the waterfall plots represent the in vivo efficacy of cetuximab treatment at reducing tumor growth expressed as the optimal treated to control tumor size ratio (T/C) in the individual tumor models. A, Total (▲, —) and phosphorylated (n, —) EGFR proteins; B, Total (▲) and phosphorylated (n) Akt protein. Total and phosphorylated EGFR and Akt levels were quantitated in untreated tumors using the Bio-Plex suspension array system. MFI values were normalized to the Oncotest lysate pool. An MFI value of 1 indicates the same level of expression/activation of protein in the tumor xenograft and in the Oncotest lysate pool.
Tum
or T
/C, %
MFI
nor
mal
ized
to O
ncot
est p
ool
LX
FA
1H
NX
F1
HN
XF2
GX
F1
CX
F1
LX
FA
2H
NX
F3
CX
F2
LX
FE
1LX
FA
3H
NX
F4
HN
XF5
LX
FL1
LX
FE
2M
AX
F1
CX
F3
CX
F4
LX
FA
4C
XF5
LX
FA
5C
XF6
LX
FA
6LX
FA
7C
XF7
LX
FE
3M
EX
F1
CX
F8
CX
F9
MA
XF2
CX
F10
CX
F11
LX
FA
8LX
FL2
LX
FL3
0
10
20
30
40
50
60
70
80
90
100
7
6
5
4
3
2
1
0
MFI
nor
mal
ized
to O
ncot
est p
ool
Tum
or T
/C, %
LX
FA
1H
NX
F1
HN
XF2
GX
F1
CX
F1
LX
FA
2H
NX
F3
CX
F2
LX
FE
1LX
FA
3H
NX
F4
HN
XF5
LX
FL1
LX
FE
2M
AX
F1
CX
F3
CX
F4
LX
FA
4C
XF5
LX
FA
5C
XF6
LX
FA
6LX
FA
7C
XF7
LX
FE
3M
EX
F1
CX
F8
CX
F9
MA
XF2
CX
F10
CX
F11
LX
FA
8LX
FL2
LX
FL3
0
20
40
60
80
100
16
14
12
10
8
6
4
2
0
Graft
A. EGFR
B. Akt
Fig. 4. Time course of EGFR phosphorylation following cetuximab treatment in selected tumors. No bar means the value of EGFR was below the limit of detection. Control (n), 24 hr (n), 48 hr (n), 72 hr (n).
MFI
nor
mal
ized
to O
ncot
est p
ool
4
3
2
1
0 LXFA1 HNFX1 LXFE1 MAXF1 LXFA5 CXF9 CXF11
Tumor

TECHNICAL REPORT
BioRadiations 129 © 2009 Bio-Rad Laboratories, Inc.24
Regeneration of Prepacked IMAC Cartridges on the Profinia™ Protein Purification System
Jean-Marie François1, Etienne Baise1, Joseph Siino2, Filée Patrice1, Gaspard Giles1, Donna Hardy2, and Wei Liu2 1 Macromolécules Biologiques, Centre for Protein Engineering, Institut de Chimie, B6, Université de Liège, Sart Tilman, 4000 Liège, Belgium 2 Bio-Rad Laboratories, Inc., Hercules, CA 94547 USA
Table 1. Custom program steps to regenerate an IMAC cartridge using the native IMAC methods template (for 1 ml and 5 ml cartridges). Step values specific for 5 ml cartridges are shown in parentheses.
Step Flow Rate, Step Number Step ml/min CV Time, min Conc Fraction
01 Water wash — — — DI —02 Equilibrate DI C1 2 (10) 2 1 DI W03 Equilibrate C1 2 (10) 20 10 B1, 1x W04 Load S1 to C1 2 (10) 0 0 S1 1A05 Wash 1 C1 2 (10) 0 0 B1, 1x 1B06 Wash 2 C1 2 (10) 10 5 B2, 1x 1C07 Elute 1 C1 2 (10) — 3.1 B3, 5x W08 Elute 2 C1 2 (10) 1 0.5 B3, 5x 1D09 Clean 1 C1 2 (10) 10 5 B5, 1x W10 Clean 2 C1 2 (10) 5 2.5 B6, 1x W11 Clean 3 C1 2 (10) 10 5 DI W12 Store C1 2 (10) 7 3.5 B7, 2x W
IntroductionImmobilized metal affinity chromatography (IMAC) is the most common affinity method used to isolate recombinant proteins. Prepacked IMAC cartridges charged with nickel can often be used several times. However, regeneration of the column may be necessary or desirable if: 1) some or all of the bound metal ion is lost, resulting in decreased protein binding activity, 2) the resin needs to be stripped and sanitized prior to purification of a different protein, or 3) a metal ion other than nickel (such as cobalt) is needed to enhance the binding of a particular protein and tag combination.
The Profinia protein purification system performs automated and fast purification of recombinant proteins and antibodies by affinity chromatography (Berkelman T and Urban M 2006, Bernardini M et al. 2008, Hui S and Usinger L 2006, Ngo et al. 2008). One of the applications for the Profinia system is metal affinity chromatography using prepacked IMAC cartridges of either 1 ml or 5 ml size. Here, we demonstrate that prepacked cartridges can be easily regenerated with nickel and cobalt directly on the Profinia system and that the newly regenerated IMAC cartridges function with performance similar to a brand new cartridge.
MethodsMaterials and InstrumentationProfinia control lysate (E. coli ), prepacked Bio-Scale Mini™
Profinity™ IMAC cartridges (1 ml and 5 ml), native IMAC purification kit, and Profinia protein purification system were all from Bio-Rad Laboratories, Inc.
Regeneration of Prepacked CartridgesThe cartridges were cleaned with 20 column volumes (CV) of 0.5 M NaOH and rinsed with 10 CV deionized (DI) water. Metal ions were stripped with 1 CV of 0.1 M EDTA followed by a rinse with 10 CV DI water. The cartridges were then recharged with 5 CV of 0.1 M nickel sulfate or cobalt sulfate, pH 4.5, rinsed with 10 CV of water, and then rinsed with 7 CV of 2% benzyl alcohol for storage.
The buffer port positions on the Profinia system and buffer concentrates used for cartridge regeneration were: B1, 150 ml 0.5 M NaOH (1x); B2, 100 ml DI water; B3, 100 ml 0.5 M EDTA, pH 8.0 (5x); B4, 100 ml DI water (not used); B5, 100 ml DI water; B6, 100 ml NiSO4 (1x); B7, 100 ml storage solution (4% benzyl alcohol) (2x); B8, 125 ml 20% ethanol. Sample positions S1 and S2 both were both 50 ml DI water.
The IMAC regeneration method on the Profinia system can be programmed starting from the home screen. Select Program Methods, IMAC, then press Next. On the Select Method Type & Options screen, select Native IMAC, 1 Sample, and 1 ml or 5 ml Cartridges (depending on the cartridge size to be regenerated), then press Next. Enter a method name (for example, 1 ml IMAC regeneration) and a username. Press Edit Methods at the bottom of the screen and use the down arrow on the right side of the screen to scroll from steps 1 to 12. At each step, modify only the CV and buffer concentration (Conc) to match the values in Table 1. Press Save. From the home screen, select Saved Methods, IMAC, and then the newly saved regeneration method. Make sure to enter a sample volume of 1 ml before starting the program.
SDS-PAGE AnalysisThe fractions from each purification were loaded along with unstained Precision Plus Protein™ standards on a Bio-Rad Criterion™ Tris-HCl gel (4–20% acrylamide), run for 60 min (200 V), fixed, and stained with Bio-Safe™ Coomassie stain.
Results and DiscussionWe tested the regeneration program on the Profinia system using prepacked Bio-Scale Mini Profinity IMAC cartridges. A 1 ml and 5 ml cartridge were previously used for polyhystidine tag protein purifications (four cycles) prior to regeneration. We also took an unused, uncharged IMAC cartridge and charged it with nickel sulfate using the regeneration procedure. After
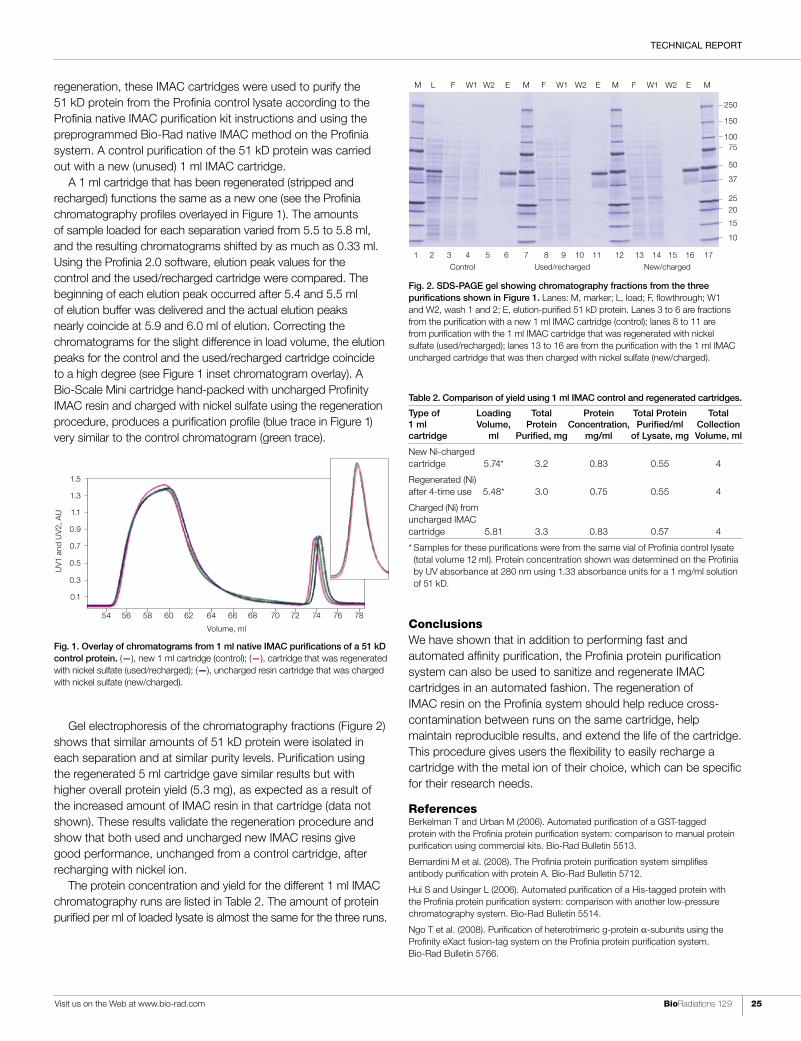
TECHNICAL REPORT
Visit us on the Web at www.bio-rad.com BioRadiations 129 25
regeneration, these IMAC cartridges were used to purify the 51 kD protein from the Profinia control lysate according to the Profinia native IMAC purification kit instructions and using the preprogrammed Bio-Rad native IMAC method on the Profinia system. A control purification of the 51 kD protein was carried out with a new (unused) 1 ml IMAC cartridge.
A 1 ml cartridge that has been regenerated (stripped and recharged) functions the same as a new one (see the Profinia chromatography profiles overlayed in Figure 1). The amounts of sample loaded for each separation varied from 5.5 to 5.8 ml, and the resulting chromatograms shifted by as much as 0.33 ml. Using the Profinia 2.0 software, elution peak values for the control and the used/recharged cartridge were compared. The beginning of each elution peak occurred after 5.4 and 5.5 ml of elution buffer was delivered and the actual elution peaks nearly coincide at 5.9 and 6.0 ml of elution. Correcting the chromatograms for the slight difference in load volume, the elution peaks for the control and the used/recharged cartridge coincide to a high degree (see Figure 1 inset chromatogram overlay). A Bio-Scale Mini cartridge hand-packed with uncharged Profinity IMAC resin and charged with nickel sulfate using the regeneration procedure, produces a purification profile (blue trace in Figure 1) very similar to the control chromatogram (green trace).
ConclusionsWe have shown that in addition to performing fast and automated affinity purification, the Profinia protein purification system can also be used to sanitize and regenerate IMAC cartridges in an automated fashion. The regeneration of IMAC resin on the Profinia system should help reduce cross-contamination between runs on the same cartridge, help maintain reproducible results, and extend the life of the cartridge. This procedure gives users the flexibility to easily recharge a cartridge with the metal ion of their choice, which can be specific for their research needs.
ReferencesBerkelman T and Urban M (2006). Automated purification of a GST-tagged protein with the Profinia protein purification system: comparison to manual protein purification using commercial kits. Bio-Rad Bulletin 5513.
Bernardini M et al. (2008). The Profinia protein purification system simplifies antibody purification with protein A. Bio-Rad Bulletin 5712.
Hui S and Usinger L (2006). Automated purification of a His-tagged protein with the Profinia protein purification system: comparison with another low-pressure chromatography system. Bio-Rad Bulletin 5514.
Ngo T et al. (2008). Purification of heterotrimeric g-protein a-subunits using the Profinity eXact fusion-tag system on the Profinia protein purification system. Bio-Rad Bulletin 5766.
Gel electrophoresis of the chromatography fractions (Figure 2) shows that similar amounts of 51 kD protein were isolated in each separation and at similar purity levels. Purification using the regenerated 5 ml cartridge gave similar results but with higher overall protein yield (5.3 mg), as expected as a result of the increased amount of IMAC resin in that cartridge (data not shown). These results validate the regeneration procedure and show that both used and uncharged new IMAC resins give good performance, unchanged from a control cartridge, after recharging with nickel ion.
The protein concentration and yield for the different 1 ml IMAC chromatography runs are listed in Table 2. The amount of protein purified per ml of loaded lysate is almost the same for the three runs.
Fig. 1. Overlay of chromatograms from 1 ml native IMAC purifications of a 51 kD control protein. (—), new 1 ml cartridge (control); (—), cartridge that was regenerated with nickel sulfate (used/recharged); (—), uncharged resin cartridge that was charged with nickel sulfate (new/charged).
UV1
and
UV
2, A
U
54 56 58 60 62 64 66 68 70 72 74 76 78
Volume, ml
1.5
1.3
1.1
0.9
0.7
0.5
0.3
0.1
Table 2. Comparison of yield using 1 ml IMAC control and regenerated cartridges.
Type of Loading Total Protein Total Protein Total 1 ml Volume, Protein Concentration, Purified/ml Collection cartridge ml Purified, mg mg/ml of Lysate, mg Volume, ml
New Ni-charged cartridge 5.74* 3.2 0.83 0.55 4
Regenerated (Ni) after 4-time use 5.48* 3.0 0.75 0.55 4
Charged (Ni) from uncharged IMAC cartridge 5.81 3.3 0.83 0.57 4
* Samples for these purifications were from the same vial of Profinia control lysate (total volume 12 ml). Protein concentration shown was determined on the Profinia by UV absorbance at 280 nm using 1.33 absorbance units for a 1 mg/ml solution of 51 kD.
Fig. 2. SDS-PAGE gel showing chromatography fractions from the three purifications shown in Figure 1. Lanes: M, marker; L, load; F, flowthrough; W1 and W2, wash 1 and 2; E, elution-purified 51 kD protein. Lanes 3 to 6 are fractions from the purification with a new 1 ml IMAC cartridge (control); lanes 8 to 11 are from purification with the 1 ml IMAC cartridge that was regenerated with nickel sulfate (used/recharged); lanes 13 to 16 are from the purification with the 1 ml IMAC uncharged cartridge that was then charged with nickel sulfate (new/charged).
1 2 3 4 5 6 7 8 9 10 11 12 13 14 15 16 17
Control Used/recharged New/charged
250
150
100 75
50
37
25 20
15
10
M L F W1 W2 E M F W1 W2 E M F W1 W2 E M

TECHNICAL REPORT
BioRadiations 129 © 2009 Bio-Rad Laboratories, Inc.26
Mutational Analysis of the ATM Gene in Familial Breast Cancer Using iProof™ High-Fidelity DNA PolymeraseCorinna Feuchtinger and Sophie Hinreiner, Institute of Functional Genomics, University of Regensburg, Regensburg, Germany
IntroductionBreast cancer is the most common cancer among women in the developed world. In 5–10% of the cases it is thought to be heritable. Two highly penetrant breast cancer genes have been identified (BRCA1 and BRCA2). However, a large number of cases with a familial predisposition to breast cancer cannot be explained by mutations in these two genes. Therefore, other genes predisposing to breast cancer can be assumed to exist. One candidate is the ATM gene, which is mutated in the recessive neurodegenerative disorder ataxia telangiectasia (AT). AT is characterized by progressive neuronal degeneration, oculocutaneous telangiectasia, immunodeficiency, hypersensitivity to ionizing radiation, and an increased risk of lymphoma and leukemia, as well as breast cancer. More than 80% of the mutations found in patients with AT are nonsense mutations.
The ATM gene is located on human chromosome 11q22.3. It consists of 66 exons, of which four are noncoding. The ATM gene expresses a 370 kD serine protein kinase that consists of 3,056 amino acid residues and is located primarily in the nucleus. It is activated by ionizing radiation and DNA damage. The activated ATM protein phosphorylates and regulates proteins involved in DNA repair and cell cycle control.
Several epidemiological studies have reported an increased risk of breast cancer in female relatives of patients with AT who are obligate heterozygous carriers of ATM mutations. However, several subsequent case-control studies have failed to detect a higher frequency of ATM mutation carriers in breast cancer patients. These conflicting results may have been caused by the inclusion in the studies of cases without a familial history of breast cancer. Moreover, most of the case-control studies used methods that detected only protein truncating mutations. Therefore, a possible association of missense mutations with an increased risk of breast cancer could have been missed.
In order to clarify the role of the ATM gene in familial breast cancer, an international NIH joint project with the Queensland Institute of Medical Research in Australia was initiated. The aim was to perform mutational analysis of the ATM gene in a large number of familial breast cancer cases using a combination of bidirectional dideoxysequencing and the multiplex ligation-dependent probe amplification (MLPA) assay (Schouten et al. 2002). To that end, all exons and adjacent intronic sequences of the ATM gene were amplified in a total of 65 fragments for sequence analysis. Concurrently, the performance of iProof high-fidelity DNA polymerase from Bio-Rad Laboratories, Inc. was compared to that of a widely used hot-start non-proofreading Taq polymerase from a different vendor.
MethodsFor comparison of the iProof polymerase with the alternative Taq polymerase, seven exons were amplified with both polymerases and sequenced. Primers with similar melting temperatures were designed, which enabled the use of the same cycling protocol for all fragments (Table 1).
PCR amplification with 0.3 U iProof polymerase was carried out in a 15 µl volume containing 25 ng of genomic DNA, iProof HF master mix (Bio-Rad), 400 µM of each dNTP, and 0.48 µM of each forward and reverse primer. Thermocycling was performed in a 96-well GeneAmp PCR system 9700 thermocycler (Applied Biosystems). Initial denaturation of DNA at 98°C for 30 sec was followed by 35 cycles of denaturation at 98°C for 10 sec, primer annealing at 60°C for 10 sec, and primer extension at 72°C for 10 sec. A final elongation step was performed at 72°C for 10 min. Different times for annealing and elongation had been tested, but the best results were achieved with the indicated times.
For the competing Taq polymerase, PCR was also carried out in a 15 µl volume containing 25 ng of genomic DNA. Reactions contained 0.38 U Taq polymerase, 30 mM Tris-HCl, 100 mM KCl, 400 µM of each dNTP, 5 mM MgCl2, and 0.16 µM of each forward and reverse primer. Thermocycling was performed in a 96-well GeneAmp PCR system 9700 thermocycler under the following conditions: initial denaturation at 94°C for 5 min was followed by 40 cycles of denaturation at 94°C for 30 sec, primer annealing at 60°C for 45 sec, and primer extension at 72°C for 45 sec. The final elongation was performed at 72°C for 10 min.
The quality of the PCR amplicons was evaluated by electrophoresis on a 2% agarose gel in 1x Tris-boric acid-EDTA buffer (TBE). Amplicons generated by either polymerase were then cleaned up with Agencourt AMPure kit (Agencourt Bioscience Corporation) on a Biomek NX laboratory automation workstation (Beckman Coulter, Inc.). The purified DNA was eluted in 20 µl of HPLC water (Merck KGaA).
Sequence reactions were carried out with a BigDye Terminator v1.1 cycle sequencing kit (Applied Biosystems). Reactions were performed in a total volume of 10 µl, containing 2 µl PCR product, 2 µl 5x sequencing buffer, 0.32 µM M13 forward or M13 reverse primer, and 0.25 µl BigDye. Cycle sequencing was conducted in a 96-well GeneAmp PCR system 9700 thermocycler with the following program: initial denaturation at 96°C for 1 min was followed by 25 cycles of denaturation at 96°C for 10 sec, primer annealing at 50°C for 5 sec, and primer extension at 60°C for 90 sec. Unincorporated ddNTPs, dNTPs, and primers were removed with a CleanSEQ kit (Agencourt Bioscience Corporation). The purified products were eluted in 30 µl 0.1 mM EDTA.
TECHNICAL REPORT
Visit us on the Web at www.bio-rad.com BioRadiations 129 27
The DNA cycle sequencing reaction products were analyzed with a 3730 DNA analyzer and SeqScape software version 2.5 (Applied Biosystems).
Results and DiscussionThe hot-start non-proofreading Taq polymerase commonly used in our laboratory repeatedly failed to yield sufficient products for some of the ATM gene fragments (Figure 1). As a consequence, sequencing either failed or yielded sequence traces of a quality too low for unambiguous base calling. In contrast, the iProof polymerase yielded amplicons of high quality for the same sequences. There was no or little background in the sequence traces, and the base signals were of sufficient quality for unambiguous base calling (Figure 2).
Table 1. Primer sequences and amplicon sizes of the ATM gene fragments used in the comparative analysis of the iProof polymerase from Bio-Rad and a hot-start Taq polymerase obtained from a different vendor.
Amplicon Length, bp Forward Primer, 5'–3' Reverse Primer, 5'–3'
Exon promoter 595 TCAACTCGTAAGCTGGGAGGCA CGCATCCAGTATCACGCGGTExon 1a 600 GAAATGAAACCCGCCTCCGT GAGGGAGGAGTCAAGGGCCAExon 35 581 AAGGAAGTTCAGATTCATTCCCTA TGAATACTACAGGCAACAGAAAACAExon 53 600 CACACTCAGATCACATTTGTCTTCC AAAGGCAGAGGCCTATGAGGAATExon 60 554 CCCAATGCTGTGATGCCACC CCTGCCAAACAACAAAGTGCTCAExon MLPA 30* 1,987 GAGCTGTCTTGACGTTC GCAGTCTTTCTATCCTGTTCTT
* The primers for exon MLPA 30 have been designed with Primer3.
A further advantage of the iProof polymerase was the reduced PCR cycling time of 28 min compared to 95 min for the Taq polymerase. The short elongation time of 10 sec worked well for amplicons of different length without a loss of quantity or quality. Consequently, all ATM gene fragments that had failed to amplify with the Taq polymerase were subjected to PCR amplification with the iProof polymerase. Consistently excellent amplification (Figure 3) and sequencing results were obtained. The iProof polymerase was also tested for the high-throughput PCR amplification and sequencing of ATM exons 35 and 53 in a 384-well format. Again, the iProof polymerase consistently yielded amplicons of high quality and quantity and thereby maximized productivity (not shown).
The iProof polymerase also worked well for the amplification of DNA fragments larger than 1 kilobase in length that were required for the analysis of break points of exons that were found to be duplicated or deleted using the MLPA assay (Figure 4). Successful PCR amplification of these fragments took only 53 min.
ConclusionsIn summary, the iProof polymerase has significantly reduced PCR cycling time and successfully and reliably amplified sequencing quality DNA fragments that had failed repeatedly with the Taq polymerase from another vendor.
ReferenceSchouten JP et al. (2002). Relative quantification of 40 nucleic acid sequences by multiplex ligation-dependent probe amplification. Nucleic Acids Res 30, e57.
Fig. 2. Sequencing of PCR-amplified DNA. Comparison of analyzed DNA sequence trace records of a sample of exon 35 PCR-amplified with either hot-start nonproofreading Taq polymerase (top) or iProof polymerase (bottom).
Fig. 1. Analysis of PCR fragments. Comparison of PCR yield for eight different samples of exon 35 of the ATM gene amplified with either hot-start non-proofreading Taq polymerase (left) or the iProof polymerase (right).
Taq polymerase iProof polymerase
Fig. 3. Effective amplification of ATM gene sequences 600–750 bp in length that are difficult to amplify. PCR yields, with the iProof polymerase, of different samples and exons that had proven difficult or impossible to amplify with hot-start non-proofreading Taq polymerase. Lanes 1–4, exon 53; lanes 5–8, exon 60; lanes 9–12, promoter region; and lanes 13–16, exon 1a.
bp5,0003,0002,0001,5001,000
750500300100
1 2 3 4 5 6 7 8 9 10 11 12 13 14 15 16
Fig. 4. Amplification of DNA fragments ~1.2 kb in length. Lanes 1 and 2, negative control; lanes 3 and 4, with hot-start non-proofreading Taq polymerase; lanes 5 and 6, with iProof polymerase.
bp
2,000
1,500
1,000
1 2 3 4 5 6
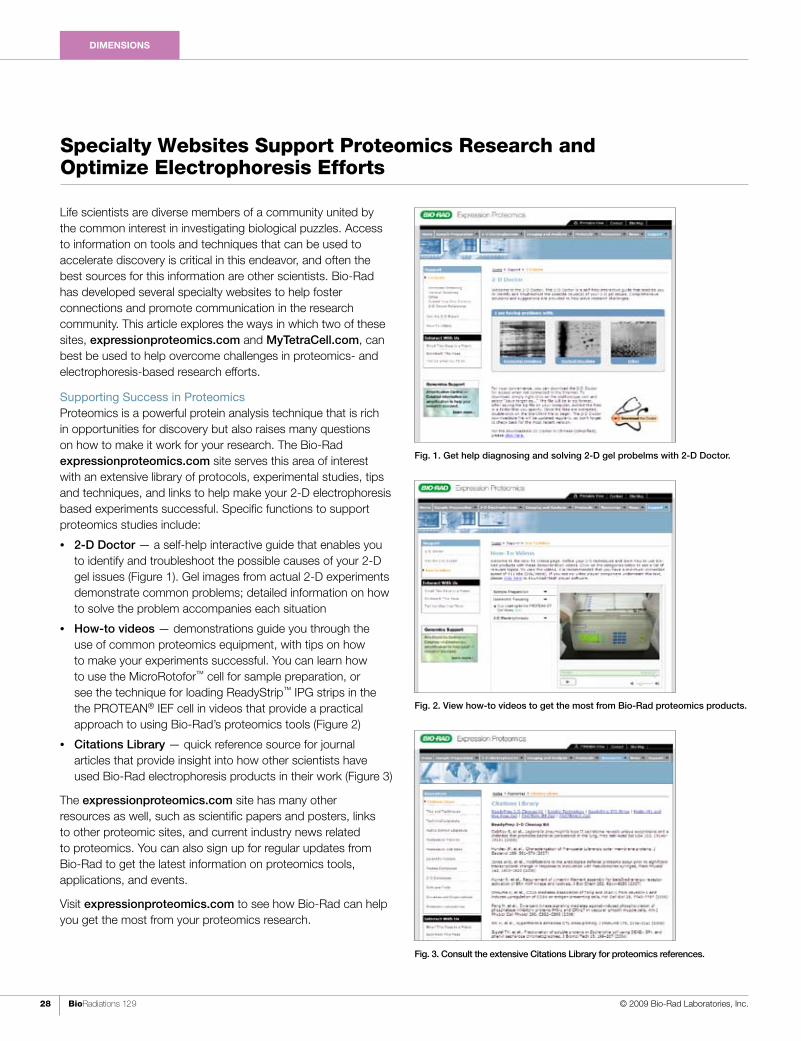
TIPS AND TECHNIQUES
BioRadiations 129 © 2009 Bio-Rad Laboratories, Inc.28
Specialty Websites Support Proteomics Research and Optimize Electrophoresis Efforts
Life scientists are diverse members of a community united by the common interest in investigating biological puzzles. Access to information on tools and techniques that can be used to accelerate discovery is critical in this endeavor, and often the best sources for this information are other scientists. Bio-Rad has developed several specialty websites to help foster connections and promote communication in the research community. This article explores the ways in which two of these sites, expressionproteomics.com and MyTetraCell.com, can best be used to help overcome challenges in proteomics- and electrophoresis-based research efforts.
Supporting Success in Proteomics Proteomics is a powerful protein analysis technique that is rich in opportunities for discovery but also raises many questions on how to make it work for your research. The Bio-Rad expressionproteomics.com site serves this area of interest with an extensive library of protocols, experimental studies, tips and techniques, and links to help make your 2-D electrophoresis based experiments successful. Specific functions to support proteomics studies include:
• 2-D Doctor — a self-help interactive guide that enables you to identify and troubleshoot the possible causes of your 2-D gel issues (Figure 1). Gel images from actual 2-D experiments demonstrate common problems; detailed information on how to solve the problem accompanies each situation
• How-to videos — demonstrations guide you through the use of common proteomics equipment, with tips on how to make your experiments successful. You can learn how to use the MicroRotofor™ cell for sample preparation, or see the technique for loading ReadyStrip™ IPG strips in the the PROTEAN® IEF cell in videos that provide a practical approach to using Bio-Rad’s proteomics tools (Figure 2)
• Citations Library — quick reference source for journal articles that provide insight into how other scientists have used Bio-Rad electrophoresis products in their work (Figure 3)
The expressionproteomics.com site has many other resources as well, such as scientific papers and posters, links to other proteomic sites, and current industry news related to proteomics. You can also sign up for regular updates from Bio-Rad to get the latest information on proteomics tools, applications, and events.
Visit expressionproteomics.com to see how Bio-Rad can help you get the most from your proteomics research.
Fig. 1. Get help diagnosing and solving 2-D gel probelms with 2-D Doctor.
Fig. 2. View how-to videos to get the most from Bio-Rad proteomics products.
Fig. 3. Consult the extensive Citations Library for proteomics references.
DIMENSIONS

Visit us on the Web at www.bio-rad.com BioRadiations 129 29
DIMENSIONS
MyTetraCell.com Social Networking Site Electrophoresis is a workhorse technique in science, and the green-lidded Bio-Rad Mini-PROTEAN® electrophoresis cell is a common sight in laboratories. Developed for researchers to share interests and knowledge, MyTetraCell.com (Figure 4) provides a portal through which to engage with colleagues around the world, whether to help solve electrophoresis issues, find tips on techniques, or connect just for fun to chat about the outcome of the next Super Bowl or World Cup. As you use the features of the site, you build up TetraPoints that can be redeemed for great Tetra swag in the TetraStore. MyTetraCell.com is a place that unites Mini-PROTEAN cell users in their common passion for sharing ideas and information.
The site’s features include:
• The Forum — a place for electrophoresis enthusiasts to share experiences and information from the bench. Anyone is welcome to sign in and post a question or comment (Figure 5). The Forum allows fellow scientists to help each other solve electrophoresis problems. For example, past discussions have centered on casting stacking and resolving gels, concentrating samples in loading buffer, and improving western blot results
• Video tutorials — see how to solve electrophoresis issues (Figure 6). We put our expertise to work by sharing tips and techniques in videos to help you solve common questions and problems. We’re also interested in hearing from you about what you would like to see added to our video library
Explore all the ways in which you can collaborate with Bio-Rad on your electrophoresis efforts at MyTetraCell.com.
ConclusionsTwo Bio-Rad specialty websites, expressionproteomics.com and MyTetraCell.com, provide places on the Web where people from laboratories around the world can share their experiences and gain insights from others with similar interests. If you are involved in proteomics research or working at the bench running gels, these sites can help you get more from your efforts.
Fig. 4. Select from several resources on the MyTetraCell.com home page.
Fig. 5. Post questions and ideas on the MyTetraCell.com Forum.
Fig. 6. Watch videos on MyTetraCell.com that provide tips to help you achieve best results.
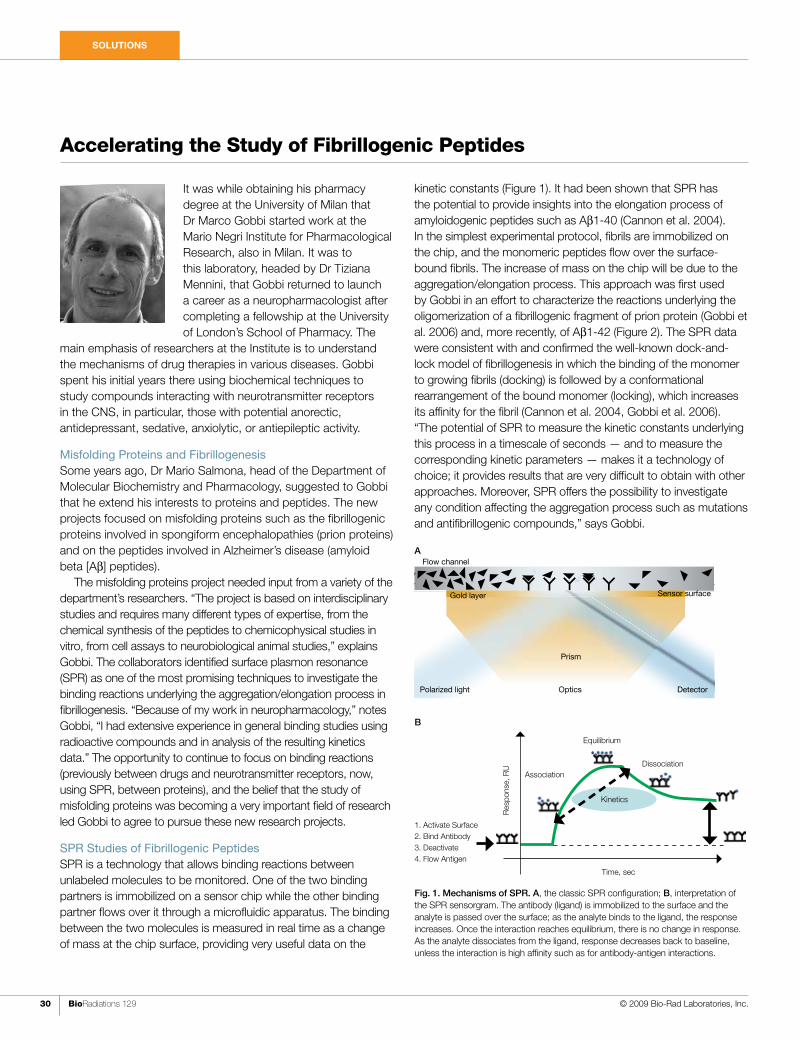
WHAT’S NEWWHAT’S NEW
30
SOLUTIONS
BioRadiations 129 © 2009 Bio-Rad Laboratories, Inc.
Accelerating the Study of Fibrillogenic Peptides
It was while obtaining his pharmacy degree at the University of Milan that Dr Marco Gobbi started work at the Mario Negri Institute for Pharmacological Research, also in Milan. It was to this laboratory, headed by Dr Tiziana Mennini, that Gobbi returned to launch a career as a neuropharmacologist after completing a fellowship at the University of London’s School of Pharmacy. The
main emphasis of researchers at the Institute is to understand the mechanisms of drug therapies in various diseases. Gobbi spent his initial years there using biochemical techniques to study compounds interacting with neurotransmitter receptors in the CNS, in particular, those with potential anorectic, antidepressant, sedative, anxiolytic, or antiepileptic activity.
Misfolding Proteins and FibrillogenesisSome years ago, Dr Mario Salmona, head of the Department of Molecular Biochemistry and Pharmacology, suggested to Gobbi that he extend his interests to proteins and peptides. The new projects focused on misfolding proteins such as the fibrillogenic proteins involved in spongiform encephalopathies (prion proteins) and on the peptides involved in Alzheimer’s disease (amyloid beta [Ab] peptides).
The misfolding proteins project needed input from a variety of the department’s researchers. “The project is based on interdisciplinary studies and requires many different types of expertise, from the chemical synthesis of the peptides to chemicophysical studies in vitro, from cell assays to neurobiological animal studies,” explains Gobbi. The collaborators identified surface plasmon resonance (SPR) as one of the most promising techniques to investigate the binding reactions underlying the aggregation/elongation process in fibrillogenesis. “Because of my work in neuropharmacology,” notes Gobbi, “I had extensive experience in general binding studies using radioactive compounds and in analysis of the resulting kinetics data.” The opportunity to continue to focus on binding reactions (previously between drugs and neurotransmitter receptors, now, using SPR, between proteins), and the belief that the study of misfolding proteins was becoming a very important field of research led Gobbi to agree to pursue these new research projects.
SPR Studies of Fibrillogenic PeptidesSPR is a technology that allows binding reactions between unlabeled molecules to be monitored. One of the two binding partners is immobilized on a sensor chip while the other binding partner flows over it through a microfluidic apparatus. The binding between the two molecules is measured in real time as a change of mass at the chip surface, providing very useful data on the
kinetic constants (Figure 1). It had been shown that SPR has the potential to provide insights into the elongation process of amyloidogenic peptides such as Ab1-40 (Cannon et al. 2004). In the simplest experimental protocol, fibrils are immobilized on the chip, and the monomeric peptides flow over the surface-bound fibrils. The increase of mass on the chip will be due to the aggregation/elongation process. This approach was first used by Gobbi in an effort to characterize the reactions underlying the oligomerization of a fibrillogenic fragment of prion protein (Gobbi et al. 2006) and, more recently, of Ab1-42 (Figure 2). The SPR data were consistent with and confirmed the well-known dock-and-lock model of fibrillogenesis in which the binding of the monomer to growing fibrils (docking) is followed by a conformational rearrangement of the bound monomer (locking), which increases its affinity for the fibril (Cannon et al. 2004, Gobbi et al. 2006). “The potential of SPR to measure the kinetic constants underlying this process in a timescale of seconds — and to measure the corresponding kinetic parameters — makes it a technology of choice; it provides results that are very difficult to obtain with other approaches. Moreover, SPR offers the possibility to investigate any condition affecting the aggregation process such as mutations and antifibrillogenic compounds,” says Gobbi.
Fig. 1. Mechanisms of SPR. A, the classic SPR configuration; B, interpretation of the SPR sensorgram. The antibody (ligand) is immobilized to the surface and the analyte is passed over the surface; as the analyte binds to the ligand, the response increases. Once the interaction reaches equilibrium, there is no change in response. As the analyte dissociates from the ligand, response decreases back to baseline, unless the interaction is high affinity such as for antibody-antigen interactions.
Flow channel
Gold layer
Prism
Sensor surface
Polarized light Optics Detector
1. Activate Surface 2. Bind Antibody 3. Deactivate 4. Flow Antigen
Time, sec
Equilibrium
AssociationDissociation
Res
pons
e, R
U
Kinetics
A
B
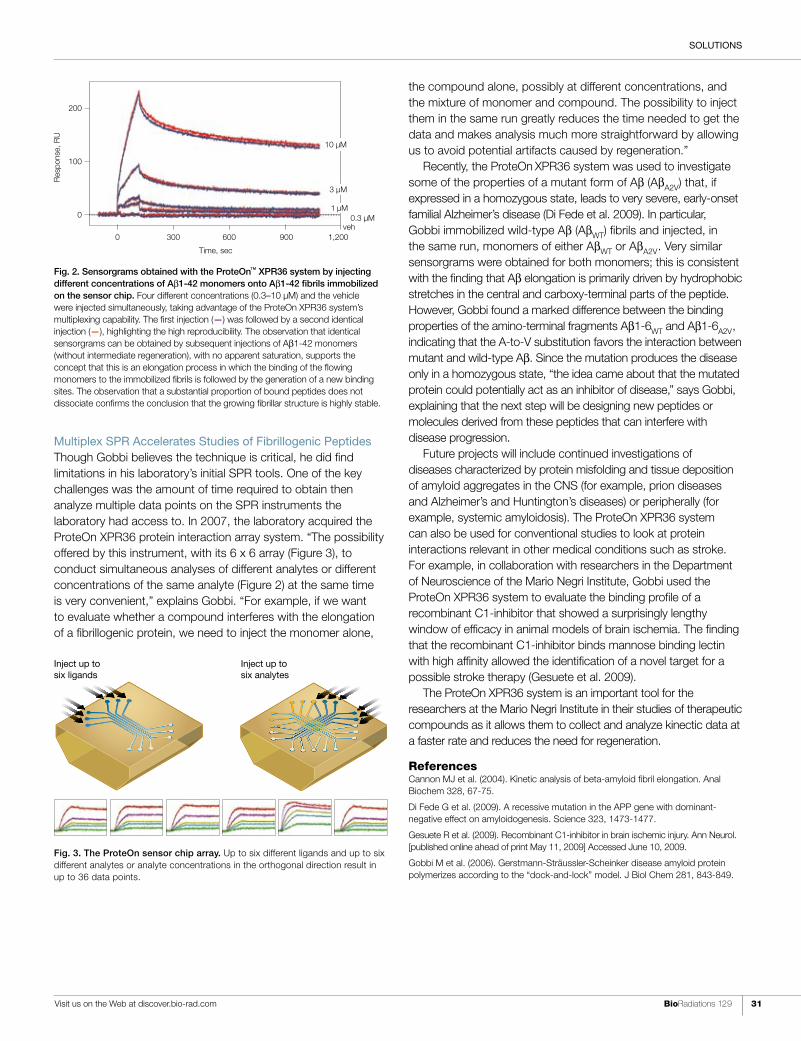
Visit us on the Web at discover.bio-rad.com BioRadiations 129 31
SOLUTIONS
Multiplex SPR Accelerates Studies of Fibrillogenic PeptidesThough Gobbi believes the technique is critical, he did find limitations in his laboratory’s initial SPR tools. One of the key challenges was the amount of time required to obtain then analyze multiple data points on the SPR instruments the laboratory had access to. In 2007, the laboratory acquired the ProteOn XPR36 protein interaction array system. “The possibility offered by this instrument, with its 6 x 6 array (Figure 3), to conduct simultaneous analyses of different analytes or different concentrations of the same analyte (Figure 2) at the same time is very convenient,” explains Gobbi. “For example, if we want to evaluate whether a compound interferes with the elongation of a fibrillogenic protein, we need to inject the monomer alone,
the compound alone, possibly at different concentrations, and the mixture of monomer and compound. The possibility to inject them in the same run greatly reduces the time needed to get the data and makes analysis much more straightforward by allowing us to avoid potential artifacts caused by regeneration.”
Recently, the ProteOn XPR36 system was used to investigate some of the properties of a mutant form of Ab (AbA2V) that, if expressed in a homozygous state, leads to very severe, early-onset familial Alzheimer’s disease (Di Fede et al. 2009). In particular, Gobbi immobilized wild-type Ab (AbWT) fibrils and injected, in the same run, monomers of either AbWT or AbA2V. Very similar sensorgrams were obtained for both monomers; this is consistent with the finding that Ab elongation is primarily driven by hydrophobic stretches in the central and carboxy-terminal parts of the peptide. However, Gobbi found a marked difference between the binding properties of the amino-terminal fragments Ab1-6WT and Ab1-6A2V, indicating that the A-to-V substitution favors the interaction between mutant and wild-type Ab. Since the mutation produces the disease only in a homozygous state, “the idea came about that the mutated protein could potentially act as an inhibitor of disease,” says Gobbi, explaining that the next step will be designing new peptides or molecules derived from these peptides that can interfere with disease progression.
Future projects will include continued investigations of diseases characterized by protein misfolding and tissue deposition of amyloid aggregates in the CNS (for example, prion diseases and Alzheimer’s and Huntington’s diseases) or peripherally (for example, systemic amyloidosis). The ProteOn XPR36 system can also be used for conventional studies to look at protein interactions relevant in other medical conditions such as stroke. For example, in collaboration with researchers in the Department of Neuroscience of the Mario Negri Institute, Gobbi used the ProteOn XPR36 system to evaluate the binding profile of a recombinant C1-inhibitor that showed a surprisingly lengthy window of efficacy in animal models of brain ischemia. The finding that the recombinant C1-inhibitor binds mannose binding lectin with high affinity allowed the identification of a novel target for a possible stroke therapy (Gesuete et al. 2009).
The ProteOn XPR36 system is an important tool for the researchers at the Mario Negri Institute in their studies of therapeutic compounds as it allows them to collect and analyze kinectic data at a faster rate and reduces the need for regeneration.
ReferencesCannon MJ et al. (2004). Kinetic analysis of beta-amyloid fibril elongation. Anal Biochem 328, 67-75.
Di Fede G et al. (2009). A recessive mutation in the APP gene with dominant-negative effect on amyloidogenesis. Science 323, 1473-1477.
Gesuete R et al. (2009). Recombinant C1-inhibitor in brain ischemic injury. Ann Neurol. [published online ahead of print May 11, 2009] Accessed June 10, 2009.
Gobbi M et al. (2006). Gerstmann-Sträussler-Scheinker disease amyloid protein polymerizes according to the “dock-and-lock” model. J Biol Chem 281, 843-849.
Bound ligand
Fig. 3. The ProteOn sensor chip array. Up to six different ligands and up to six different analytes or analyte concentrations in the orthogonal direction result in up to 36 data points.
Inject up to six ligands
Inject up to six analytes
200
100
0
0 300 600 900 1,200
Time, sec
Res
pons
e, R
U
10 µM
1 µM
3 µM
0.3 µMveh
Fig. 2. Sensorgrams obtained with the ProteOn™ XPR36 system by injecting different concentrations of Ab1-42 monomers onto Ab1-42 fibrils immobilized on the sensor chip. Four different concentrations (0.3–10 µM) and the vehicle were injected simultaneously, taking advantage of the ProteOn XPR36 system’s multiplexing capability. The first injection (—) was followed by a second identical injection (—), highlighting the high reproducibility. The observation that identical sensorgrams can be obtained by subsequent injections of Ab1-42 monomers (without intermediate regeneration), with no apparent saturation, supports the concept that this is an elongation process in which the binding of the flowing monomers to the immobilized fibrils is followed by the generation of a new binding sites. The observation that a substantial proportion of bound peptides does not dissociate confirms the conclusion that the growing fibrillar structure is highly stable.

WHAT’S NEW
32
Legal Notices AMPure and CleanSEQ are trademarks of Agencourt Bioscience Corporation. autoflex and ultrafleXtreme are trademarks of Bruker Daltonics. BigDye, GeneAmp, HEX, ROX, SeqScape, and VIC are trademarks of Applera Corporation. Biomek is a trademark of Beckman Coulter, Inc. B-PER is a trademark of Thermo Fisher Scientific. BugBuster is a trademark of EMD Chemicals, Inc. Coomassie is a trademark of BASF Aktiengesellschaft. Cy is a trademark of GE Healthcare group companies. ERBITUX is a trademark of ImClone Systems, Inc. EvaGreen is a trademark of Biotium, Inc. Excel, Microsoft Office, Windows, and Windows Vista are trademarks of Microsoft Corporation. FastBreak is a trademark of Promega Corporation. iPhone, iPod touch, and iTunes are trademarks of Apple Inc. NanoDrop is a trademark of NanoDrop Technologies, Inc. QSTAR is a registered trademark of Applied Biosystems/MDS SCIEX. Super Bowl is a trademark of the National Football League. SYBR and Texas Red are trademarks of Life Technologies Corporation. World Cup is a trademark of Fifa.
LabChip and the LabChip logo are trademarks of Caliper Life Sciences, Inc. Bio-Rad Laboratories, Inc. is licensed by Caliper Life Sciences, Inc. to sell products using the LabChip technology for research use only. These products are licensed under U.S. patents 5,863,753; 5,658,751; 5,436,134; and 5,582,977, and pending patent applications, and related foreign patents, for internal research and development use only in detecting, quantitating, and sizing macromolecules, in combination with microfluidics, where internal research
and development use expressly excludes the use of this product for providing medical, diagnostic, or any other testing, analysis, or screening services, or providing clinical information or clinical analysis, in any event in return for compensation by an unrelated party. Bio-Rad’s real-time thermal cyclers are licensed real-time thermal cyclers under Applera’s United States Patent 6,814,934 B1 for use in research, human in vitro diagnostics, and all other fields except veterinary diagnostics. This product is covered by one or more of the following U.S. patents or their foreign counterparts owned by Eppendorf AG: U.S. Patents 6,767,512 and 7,074,367. Bio-Rad Laboratories, Inc. is licensed by Invitrogen Corporation to sell reagents containing SYBR Green I for use in real-time PCR, for research purposes only. Practice of the patented 5' Nuclease Process requires a license from Applied Biosystems. The purchase of these products includes an immunity from suit under patents specified in the product insert to use only the amount purchased for the purchaser’s own internal research when used with the separate purchase of Licensed Probe. No other patent rights are conveyed expressly, by implication, or by estoppel. Further information on purchasing licenses may be obtained from the Director of Licensing, Applied Biosystems, 850 Lincoln Centre Drive, Foster City, California 94404, USA. The SELDI process is covered by U.S. patents 5,719,060; 6,225,047; 6,579,719; and 6,818,411 and other issued patents and pending applications in the U.S. and other jurisdictions. Profinity exact vectors, tags, and resins are exclusively licensed under patent rights of Potomac Affinity Proteins. This product is intended for research purposes only. For commercial applications or manufacturing using these products, commercial licenses can be obtained by contacting the Life Science Group Chromatography Marketing Manager, Bio-Rad Laboratories, Inc., 6000 Alfred Nobel Drive, Hercules, CA 94547, Tel (800)4BIORAD. The composition and/or use of the T7 expression system is claimed in one or more patents licensed to Bio-Rad by Brookhaven Science Associates, LLC. A separate license is required for any commercial use, including use of these materials for research or production purposes by any commercial entity Purification of fusion proteins may require a license from third parties. The Bio-Plex suspension array system includes fluorescently labeled microspheres and instrumentation licensed to Bio-Rad Laboratories, Inc. by the Luminex Corporation. CST antibodies exclusively developed and validated for Bio-Plex phosphoprotein and total target assays.
LOOKING BACK
BioRadiations 129 © 2009 Bio-Rad Laboratories, Inc.
BioRadiations 1969: Introducing Purified Acrylamide for Stain-Free ElectrophoresisIn this column, we look back at previously published issues of BioRadiations to see how tools and applications have changed since Bio-Rad first began publishing the journal in 1965.
Then!
Now!Since the 1960s, Bio-Rad has developed complete solutions for electrophoresis applications encompassing 1-D, 2-D, and IEF, including electrophoresis cells, precast gels, and reagents. Bio-Rad continues to take the lead in stain-free technologies with the Criterion Stain Free™ gel imaging system, enabling researchers to obtain results faster with an environmentally friendly shortened workflow and optimized imager.

To find your local sales office, visit www.bio-rad.com/contact/ In the U.S., call toll free at 1-800-4BIORAD (1-800-424-6723) Visit us at www.bio-rad.com
PROTEIN SAMPLE PREP // PROTEOMINER
proteomining.
Excavate a greater number of low-abundance proteins.The presence of high-abundance proteins in your samples can obscure the detection of low-abundance proteins. Bio-Rad’s ProteoMiner™ protein enrichment kits help you dig your way out and find the low-abundance proteins you need for discovering protein biomarkers.
ProteoMiner gives you superior enrichment over immunodepletion products, allowing you to detect up to three times as many low-abundance proteins.
Increase your chances of discovering biomarkers with the ProteoMiner protein enrichment kits. Please visit www.bio-rad.com/ad/proteominer/ for more information.
Research. Together.

To find your local sales office, visit www.bio-rad.com/contact/ In the U.S., call toll free at 1-800-4BIORAD (1-800-424-6723) Visit us at www.bio-rad.com
protein inter action // proteon
Full kinetic data in half the time.With Bio-Rad’s ProteOn™ XPR36 system, experiment optimization never has to get in the way of your project deadlines again. The ProteOn 6x6 array allows you to look at 36 different protein interactions in a single experiment with no need for regeneration, more than any other available system.
Our One-shot Kinetics™ approach provides you with a full kinetic profile in a single run. With less regeneration, you can optimize experiment conditions faster than ever. See how your colleagues are generating their SPR data in half the time. Please visit www.bio-rad.com/ad/proteininteraction/ or contact your Bio-Rad sales representative for more information.
research. together.
interactionary.