A GIS-Based Methodology to Estimate the Regional Balance ...
30
Journal of Geographic Information System, 2016, 8, 633-662 http://www.scirp.org/journal/jgis ISSN Online: 2151-1969 ISSN Print: 2151-1950 DOI: 10.4236/jgis.2016.85052 October 31, 2016 A GIS-Based Methodology to Estimate the Regional Balance of Potential and Demand of Forest Chips Mikko Nivala 1 , Perttu Anttila 2 , Juha Laitila 2 , Olli Salminen 2 , Martti Flyktman 3 1 University of Eastern Finland, Joensuu, Finland 2 Natural Resources Institute of Finland, Joensuu, Finland 3 VTT Technical Research Centre of Finland Ltd, Jyväskylä, Finland Abstract Finland’s national aim for annual consumption of forest chips is 25 terawatt hours (TWh) (equivalent to 13.5 million solid cubic metres) in combined heat and power (CHP) production and heat production in 2020. On average, the techno-economic potential of forest chips enables reaching the target at the national level. However, there is a geographical mismatch between the supply and demand regions. In this study, the regional balance of potential and demand from 2012 until 2020 was as- sessed using GIS-based methods. Economical, technical and ecological constraints were taken into account when different scenarios for municipality-level potentials were calculated. The forest chips’ consumption scenarios for plant-level were deter- mined statistically (2012) or predicted (2020) by assuming that the total consump- tion of forest chips will reach the 13.5 Mm 3 . With help of procurement model, the use of different forest energy fuel types (stumps, logging residues and small-sized thinning wood) was spread to the procurement ring with the help of GIS coding. The forest chips’ regional balance map was made by subtracting the use of heat and com- bined heat and power plants’ (CHP) forest chips’ consumption from the municipality level potential data. The GIS-based method for balance calculation requires a signifi- cant amount of computer power but works well for local, municipality, regional and national-level balance calculations. The study showed that there are enough forest chips to supply the current and future demand when all forest energy assortments are used efficiently and in a sustainable manner. However, the results indicate that al- ready at the present rate of forest chip consumption, in some areas there will not be any extra potential left. When consumption increases, the zero-potential area, in par- ticular on the coast, expands. The highest free potential can be found in eastern and northern areas of Finland while the western and southern areas lack free potential. How to cite this paper: Nivala, M., Anttila, P., Laitila, J., Salminen, O. and Flyktman, M. (2016) A GIS-Based Methodology to Esti- mate the Regional Balance of Potential and Demand of Forest Chips. Journal of Geo- graphic Information System, 8, 633-662. http://dx.doi.org/10.4236/jgis.2016.85052 Received: September 26, 2016 Accepted: October 28, 2016 Published: October 31, 2016 Copyright © 2016 by authors and Scientific Research Publishing Inc. This work is licensed under the Creative Commons Attribution International License (CC BY 4.0). http://creativecommons.org/licenses/by/4.0/ Open Access
-
Upload
khangminh22 -
Category
Documents
-
view
2 -
download
0
Transcript of A GIS-Based Methodology to Estimate the Regional Balance ...
Journal of Geographic Information System, 2016, 8, 633-662 http://www.scirp.org/journal/jgis
ISSN Online: 2151-1969 ISSN Print: 2151-1950
DOI: 10.4236/jgis.2016.85052 October 31, 2016
A GIS-Based Methodology to Estimate the Regional Balance of Potential and Demand of Forest Chips
Mikko Nivala1, Perttu Anttila2, Juha Laitila2, Olli Salminen2, Martti Flyktman3
1University of Eastern Finland, Joensuu, Finland 2Natural Resources Institute of Finland, Joensuu, Finland 3VTT Technical Research Centre of Finland Ltd, Jyväskylä, Finland
Abstract Finland’s national aim for annual consumption of forest chips is 25 terawatt hours (TWh) (equivalent to 13.5 million solid cubic metres) in combined heat and power (CHP) production and heat production in 2020. On average, the techno-economic potential of forest chips enables reaching the target at the national level. However, there is a geographical mismatch between the supply and demand regions. In this study, the regional balance of potential and demand from 2012 until 2020 was as-sessed using GIS-based methods. Economical, technical and ecological constraints were taken into account when different scenarios for municipality-level potentials were calculated. The forest chips’ consumption scenarios for plant-level were deter- mined statistically (2012) or predicted (2020) by assuming that the total consump-tion of forest chips will reach the 13.5 Mm3. With help of procurement model, the use of different forest energy fuel types (stumps, logging residues and small-sized thinning wood) was spread to the procurement ring with the help of GIS coding. The forest chips’ regional balance map was made by subtracting the use of heat and com-bined heat and power plants’ (CHP) forest chips’ consumption from the municipality level potential data. The GIS-based method for balance calculation requires a signifi-cant amount of computer power but works well for local, municipality, regional and national-level balance calculations. The study showed that there are enough forest chips to supply the current and future demand when all forest energy assortments are used efficiently and in a sustainable manner. However, the results indicate that al-ready at the present rate of forest chip consumption, in some areas there will not be any extra potential left. When consumption increases, the zero-potential area, in par-ticular on the coast, expands. The highest free potential can be found in eastern and northern areas of Finland while the western and southern areas lack free potential.
How to cite this paper: Nivala, M., Anttila, P., Laitila, J., Salminen, O. and Flyktman, M. (2016) A GIS-Based Methodology to Esti-mate the Regional Balance of Potential and Demand of Forest Chips. Journal of Geo-graphic Information System, 8, 633-662. http://dx.doi.org/10.4236/jgis.2016.85052 Received: September 26, 2016 Accepted: October 28, 2016 Published: October 31, 2016 Copyright © 2016 by authors and Scientific Research Publishing Inc. This work is licensed under the Creative Commons Attribution International License (CC BY 4.0). http://creativecommons.org/licenses/by/4.0/
Open Access
M. Nivala et al.
634
Keywords GIS-Based Methodology, Forest Chips, Potential, Balance, Bioenergy
1. Introduction
Finland has been committed to the EU’s policy framework for climate and energy until 2020. EU member countries should produce 20% of their energy using renewable sources by the year 2020. Finland’s national target is to increase the use of renewables from 28.5% to 38% in total energy consumption [1]. Wood-based energy, especially forest chips, will have an important role when increasing renewable energy use in Finland.
Forest chips originate from harvesting of small-sized thinning wood in young forests, logging residues from regeneration cuttings (branches, crowns and other wood materi-als that have no industrial use), and regeneration cutting area stumps, roots and de-cayed stems that have no industrial purposes. Wood energy that comes from side products or by-products of the wood industry, for example, bark, sawdust and black liquor, is already exploited fully, which means that there is no chance to increase wood energy usage other than to increase the use of forest chips if the use of industrial roundwood does not increase in Finland.
Finland’s national renewable energy action plan [2] and Energy and Climate Strat-egy’s [3] aim for annual consumption of forest chips in combined heat and power (CHP) production and separate heat production in Finland in 2020 is 25 terawatt hours (TWh), which is equivalent to 13.5 million solid cubic metres (Mm3). The strategy also aims to increase significantly the use of forest chips as feedstock for transportation fu-els. The national target for transportation fuels is 7 TWh in the year 2020 originating from renewable sources [2].
The estimated total consumption of energy in Finland in 2012 was 382 TWh. The use of wood energy in the year 2012 was, in total, 92 TWh. Forest chip consumption was 8.3 Mm3 [4]. The major users of forest chips (7.6 Mm3) were heat and combined heat and power plants (CHP). Around 0.7 Mm3 of forest chips were used in the farms and properties’ heating systems [4]. In the year 2015 the use of forest chips was slightly de-creased to 8 Mm3 which is including the use of forest chips in heating and CHP plants (7.3 Mm3) and in small households (0.7 Mm3) [5].
When estimating the amount of forest chips, the basis for the estimation is the theo-retical maximum potential [6]. Theoretical potential includes the thinning wood bio-mass coming from forest management practices and the felled trees that stay in the for-est after thinning, logging residues, stumps and roots. Theoretical potential can also in-clude the cutting savings, which means the difference between the annual growth and its reduction. Theoretical potential is not possible to exploit fully because many techni-cal, economical, ecological and social factors limit the potential, and each of these needs

M. Nivala et al.
635
to be estimated separately [6]. These kinds of limitations are, for example, the technical capability or recovery rate in the harvesting site, storage losses, quality need of raw ma-terial (can the plant use a wholetree or only delimbed stemwood), the size of the har-vesting area and the average harvesting volume per hectare (economic aspect), forest owners’ willingness to sell the wood and forest management guidelines and good prac-tices, which are meant to reduce harmful effects on forest growth or the environment. In addition to these, also the forest energy competitiveness compared to other fuels re-duces the theoretical potential [6].
There have been several earlier studies aimed at estimating the forest chips supply and demand problems in Finland. Anttila et al. [7] used the National Forest Inventory plot information to estimate the annual small-sized thinning wood potential to be 6.2 - 10.4 Mm3 depending on harvesting methods. The logging residues potential was 4.0 - 6.6 Mm3 and spruce (Picea abies) stump potential was 1.5 - 2.5 Mm3, depending on the annual cutting level. In the study, the municipality level cutting statistic was converted to the forest energy potential using coefficients from earlier studies [8] [9]. This prob-lem with this approach is that it is only limited to current cutting levels. Also, this study did not include the regional differences in the proportion of logs from clearcutting in different parts of Finland. Ranta did a study on logging residue potential and estimated also the balance based on the usage of selected plants [10]. In another study by Ranta [11], a GIS approach similar to that used in this study was employed, but only the 50 biggest plants’ forest chip demands were taken into account.
A similar study has also been done in Japan [12] where logging residues, thinned trees, and selectively cut trees from broad-leaved forests were defined as the forest bio-mass and the availability of biomass was calculated based on the supply costs and to-pographical conditions. This study was done for a specific mountainous region of Japan and not for the whole nation. Also, several similar regional potentials of wood or forest biomass have been carried out for example in the United States [13], in Northern Spain [14], in Canada [15] Norway [16] and Slovakia [17]. In Japan also a study of the usage of forest biomass has been carried out with the help of GIS [18]. There are several European-level studies of wood or forest biomass potential on a European scale [19] [20] [21] [22] as well as several national-level potential studies which are not based on GIS-methods.
GIS-based methods have also been used in other biomass potential evaluations, for example, Voivontas [23] studied agricultural residues potential for power production on the island of Crete. In the study, electricity generation cost was used as a criterion for the identification of the sites of economically exploited biomass potential. Also, bioenergy potential has been estimated in England, where spatial data was used on po-tential supply and demand to predict bioenergy potential [24]. The study was concen-trated on miscanthus biomass and the costs of biomass feedstock transportation is taken into account, as well as the energy use and the spatial relationship between po-tential supply and demand. Several regional-level studies have also been carried out in, for example, Northern Italy [25] [26], Portugal [27] [28], India [29] [30] and Chinese
M. Nivala et al.
636
Taipei [31]. In Finland, biomass potential for biogas production was examined by using a GIS-based methodology, which also included biomass transport optimization con- sidering the existing road network and spatially varied biomass sources [32]. The study used a method where the Kernel Density (KD) maps were calculated to pinpoint areas with high biomass concentration.
There are only a few national-level forest energy potential calculations that are based on GIS [7] [10] [33] [34]. Only the study by Anttila and a study by Ranta have taken into account the demand, as well as the balance, of supply and demand. Both studies had some limitations. For example, the study by Ranta concentrated only on one forest chip assortment. There is a clear need to create a new study of this topic and create a calculation method and process for a national-level forest balance calculation that could also be used in other regions or locally to support renewable energy use.
The aim of the study was to 1) estimate and visualize forest chips’ potential in Finland 2) calculate and estimate forest chips’ use in heat and CHP plants in Finland in 2020 and 3) calculate the difference between the potential and use of forest chips, which can be referred to as the forest chips’ balance map, in Finland from 2012 to 2020. The forest chips’ balance is calculated as solid cubic metres (m3).
2. Materials and Methods 2.1. Forest Chips Potential
The forest chips potential consists of small-sized thinning wood from the young forest and logging residues and stumps from regeneration cuttings.
2.1.1. Small-Sized Thinning Wood from Young Forest The small-sized thinning wood potential is based on Finland’s 10th National Forest In-ventory (NFI 10) data [35]. The field plots have been measured between years 2004- 2008. Potentials have been calculated for the municipality level using three different harvesting options.
In all these harvesting options, the minimum yield of harvested energy wood was set to be 25 m3/ha, which was assumed to be the level at which harvesting would be econ- omical. Two of the options were energy wood only harvesting (delimbed stemwood and wholetree), where the maximum yield of industrial roundwood was set to 45 m3/ha and stands which have higher accumulation, were allocated to industrial roundwood use. In the wholetree option, also living branches were added to the potential. In the third op-tion, the harvesting method was integrated energy wood and industrial wood harvest-ing. In this integrated option, only pure coniferous tree or birch plots, where the domi-nant tree species accumulation was greater than 20 m3/ha, the average size of harvested tree was greater than 30 dm3 and energy wood harvesting accumulation was greater than 25 m3/ha, were included to the potential. Energy wood from this integrated option was assumed to be delimbed stemwood, as harvesting will be done with the same har-vester and at the same time as the industrial roundwood harvesting. If the roundwood accumulation was less than 20 m3/ha, the plot was assumed to be energy wood only us-

M. Nivala et al.
637
ing the wholetree harvesting method. In all these options the stemwood and branches technical recovery rates were assumed to be 100%. In the wholetree harvesting, dead branches were assumed to fall off during harvesting and transporttation.
The NFI results were in MS Excel format and they were moved to the ArcGIS 10.2. environment using municipality layer and municipality ID. The visualization process is described in Figure 1.
2.1.2. Logging Residues and Stump Biomass Potentials from Regeneration Cuttings
In this study, the estimation of logging residues and stumps is based on the regional cutting possibility results available at http://www.metla.fi/metinfo/mela and which were made using the MELA program, a forest planning tool of Natural Resources Institute Finland (Luke) [36]. The used MELA results are based on the National Forest Inventory plots measured during the years 2008-2012 (http://www.metla.fi/metinfo/vmi/). The maximum scenario (MAX) maximizes the net present value at a 4% discounted rate subject to non-declining periodic total roundwood and energy wood removals, saw log removals and net income. There are no sustainability constraints concerning tree
Figure 1. Process of forest chips potential creation using GIS. In the figure, the letter P inside the box indicates that the function is pa-rametrized and allows analyses for different fuel sources.
M. Nivala et al.
638
species, cutting methods, age classes or the growth/drain ratio in order to efficiently utilize the dynamics of forest structure. In the business as usual (BAU) scenario, the net present value is maximized with a 4% discount rate subject to realized cutting levels in studied regions during the years 2009-2012.
The estimated forest energy potentials from regeneration cuttings were brought into the GIS environment joined with the municipality layer, and then converted using the process described in Figure 1 with the production forest layer.
2.2. Forest Chips Use in Finland
We apply two scenarios for the future use of forest chips in this study. The first scenario is based on the realized usage of forest chips in the year 2012 (http://stat.luke.fi/en). The second scenario is based on the official target that Finland will achieve forest chips use equal to 13.5 Mm3/year by the year 2020 [3].
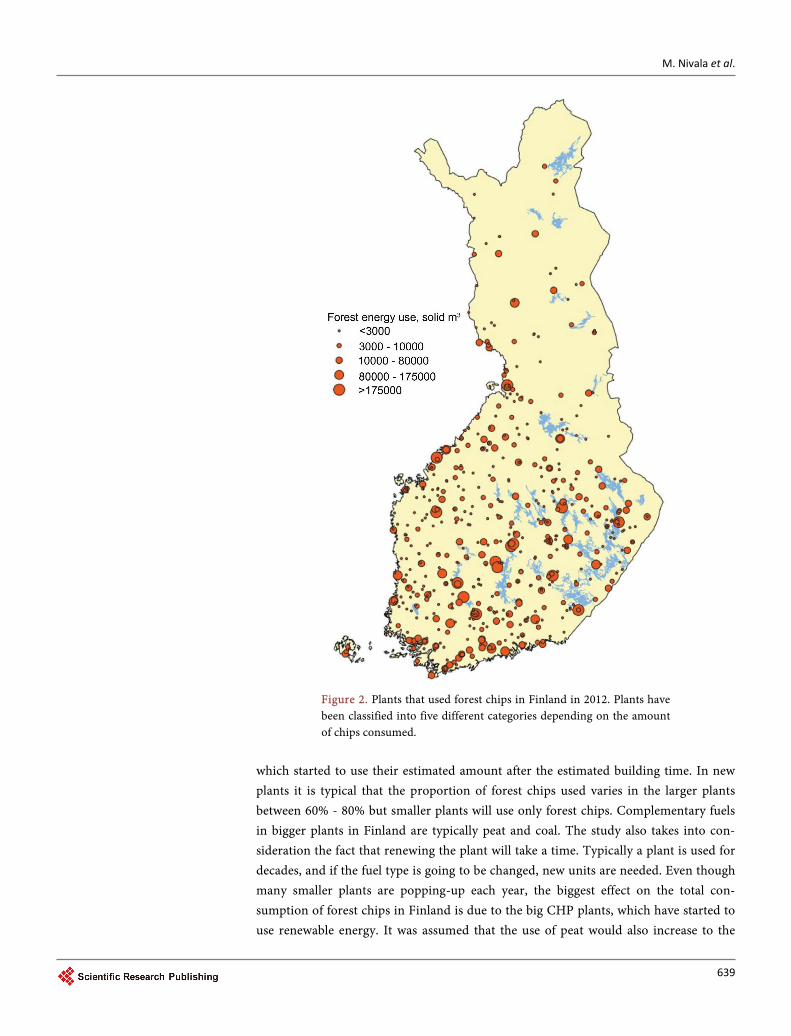
2.2.1. Use of Forest Chips in 2012 In the year 2012, there were 860 plants using forest chips and their total consumption of forest chips in solid cubic metres was 7.6 Mm3 [37]. The proportion of imported wood from this sum was 400,000 m3. Most of the forest chips users were small plants (Figure 2). There were only 21 plants that used more than 100,000 m3 forest chips, but they represented more than half of the total forest chips consumption. The statistic in-cluded information about plant size, fuel types, size and city. The exact location was collected during the study and each plant was geocoded into GIS using ArcGIS 10.2.
2.2.2. Use of Forest Chips in 2020 VTT, the Technical Research Centre of Finland, has collected data of Finland’s forest chips end-use facilities for over 30 years. The database includes more than 400 plants with basic in-formation: combustion technology, boiler size and efficiency, year of building or renovation year and raw material used. With the help of the database, a prediction of the plants that need to be renovated in the coming years was made. The smaller plants that were not in the database were assumed to use the same amount of forest chips in the year 2020 than in 2012. The use of forest chips was planned in a way that Finland will achieve its 13.5 Mm3 target of forest chips use in the year 2020.
The use of forest chips in 2020 was estimated to be primary energy consumption, and it was converted to the solid cubic metres of energy wood using the coefficient 2 MWh/m3. The forest chips source proportion (fuel types: stumps, logging residues and thinning wood) was assumed to be similar as in a 2012 statistic [37]. The imported wood energy was also assumed to be at a similar level as it was in 2012, meaning that the amount was increasing from 400,000 m3 to 600,000 m3 in the year 2020. It was also assumed that the plants will not start immediately to use the higher amount of wood energy, but will slowly increase the use of forest chips until reaching their set value in the year 2020. This decision was based on the fact that the increased use of forest chips requires also more resources, which might mean that it will take time before the plants are ready to operate at full capacity. The only exception to this rule was the new plants
M. Nivala et al.
639
Figure 2. Plants that used forest chips in Finland in 2012. Plants have been classified into five different categories depending on the amount of chips consumed.
which started to use their estimated amount after the estimated building time. In new plants it is typical that the proportion of forest chips used varies in the larger plants between 60% - 80% but smaller plants will use only forest chips. Complementary fuels in bigger plants in Finland are typically peat and coal. The study also takes into con- sideration the fact that renewing the plant will take a time. Typically a plant is used for decades, and if the fuel type is going to be changed, new units are needed. Even though many smaller plants are popping-up each year, the biggest effect on the total con- sumption of forest chips in Finland is due to the big CHP plants, which have started to use renewable energy. It was assumed that the use of peat would also increase to the
M. Nivala et al.
640
level of 16 TWh for the year 2020 when allocating and estimating the use of forest chips in the year 2020. At the same time, it was assumed that the condensing power produc-tion using forest chips would decrease when the new planned nuclear plants are ready in Finland. To achieve the target of 2020, new big plants that use forest chips will be needed in Finland. For example, in this study, it was estimated that in the Helsinki re-gion, the use of forest chips will increase to the level of three TWh because of the new forest energy projects.
2.2.3. Modelling the Procurement of End-Use Facilities The plant database was converted and geocoded to the GIS environment where the modelling of the procurement was done for each plant. The procurement area was based on earlier research [38]. The plants were categorized into five different classes according to the size of the plant. For each class, the maximum procurement distance was determined using the same distances as in [38] Table 1.
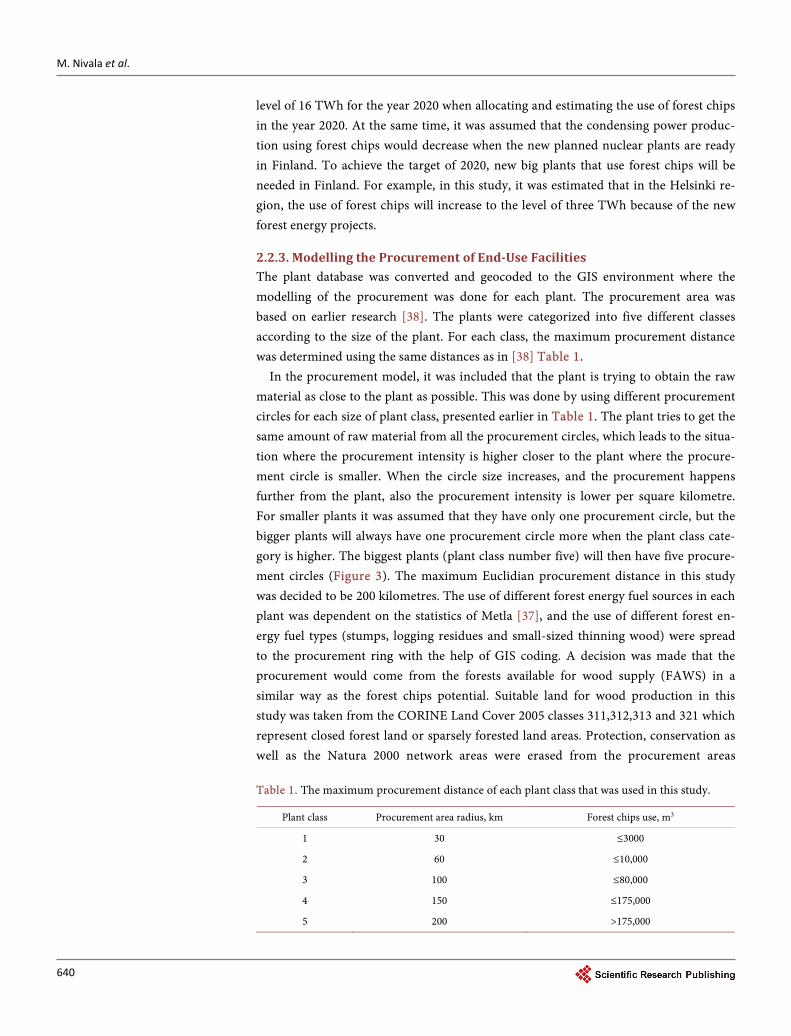
In the procurement model, it was included that the plant is trying to obtain the raw material as close to the plant as possible. This was done by using different procurement circles for each size of plant class, presented earlier in Table 1. The plant tries to get the same amount of raw material from all the procurement circles, which leads to the situa-tion where the procurement intensity is higher closer to the plant where the procure-ment circle is smaller. When the circle size increases, and the procurement happens further from the plant, also the procurement intensity is lower per square kilometre. For smaller plants it was assumed that they have only one procurement circle, but the bigger plants will always have one procurement circle more when the plant class cate-gory is higher. The biggest plants (plant class number five) will then have five procure-ment circles (Figure 3). The maximum Euclidian procurement distance in this study was decided to be 200 kilometres. The use of different forest energy fuel sources in each plant was dependent on the statistics of Metla [37], and the use of different forest en-ergy fuel types (stumps, logging residues and small-sized thinning wood) were spread to the procurement ring with the help of GIS coding. A decision was made that the procurement would come from the forests available for wood supply (FAWS) in a similar way as the forest chips potential. Suitable land for wood production in this study was taken from the CORINE Land Cover 2005 classes 311,312,313 and 321 which represent closed forest land or sparsely forested land areas. Protection, conservation as well as the Natura 2000 network areas were erased from the procurement areas Table 1. The maximum procurement distance of each plant class that was used in this study.
Plant class Procurement area radius, km Forest chips use, m3
1 30 ≤3000
2 60 ≤10,000
3 100 ≤80,000
4 150 ≤175,000
5 200 >175,000
M. Nivala et al.
641
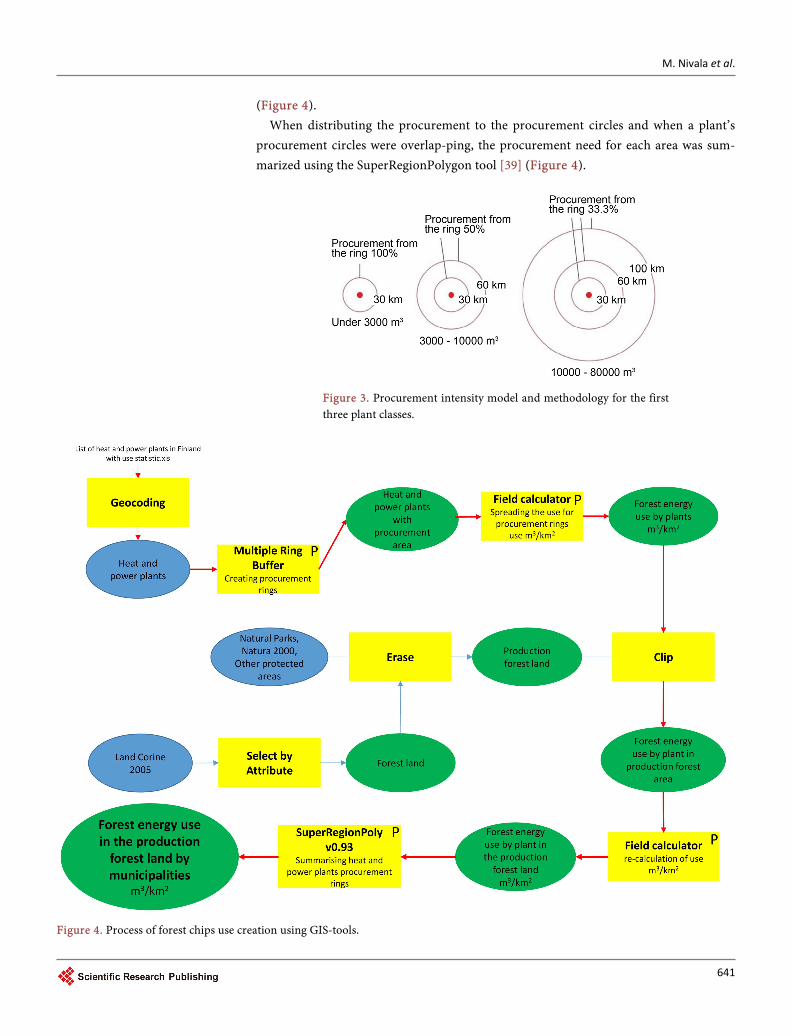
(Figure 4). When distributing the procurement to the procurement circles and when a plant’s
procurement circles were overlap-ping, the procurement need for each area was sum- marized using the SuperRegionPolygon tool [39] (Figure 4).
Figure 3. Procurement intensity model and methodology for the first three plant classes.
Figure 4. Process of forest chips use creation using GIS-tools.
M. Nivala et al.
642
2.3. Forest Chips Balance
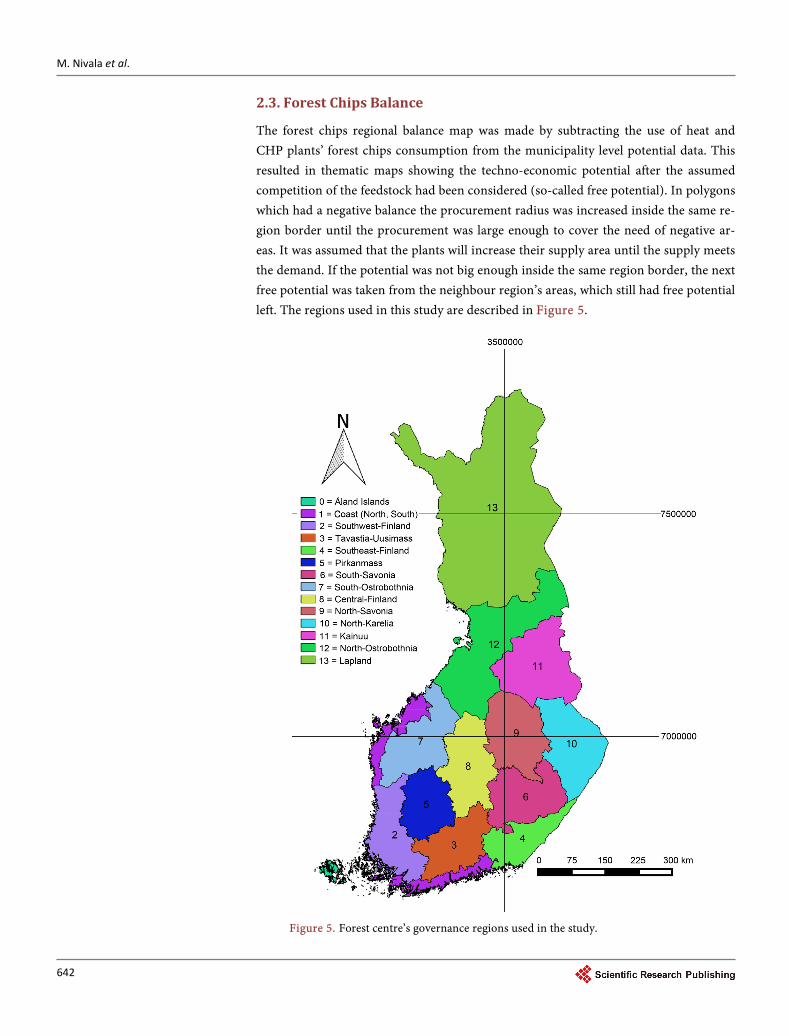
The forest chips regional balance map was made by subtracting the use of heat and CHP plants’ forest chips consumption from the municipality level potential data. This resulted in thematic maps showing the techno-economic potential after the assumed competition of the feedstock had been considered (so-called free potential). In polygons which had a negative balance the procurement radius was increased inside the same re-gion border until the procurement was large enough to cover the need of negative ar-eas. It was assumed that the plants will increase their supply area until the supply meets the demand. If the potential was not big enough inside the same region border, the next free potential was taken from the neighbour region’s areas, which still had free potential left. The regions used in this study are described in Figure 5.
Figure 5. Forest centre’s governance regions used in the study.
M. Nivala et al.
643
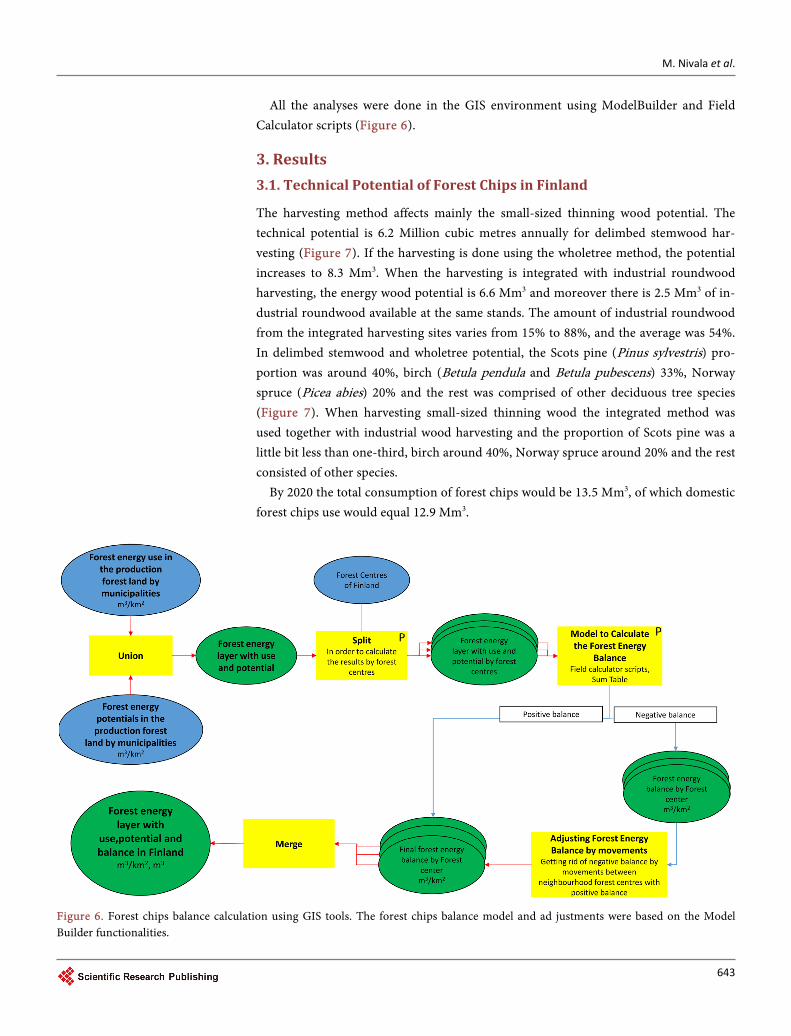
All the analyses were done in the GIS environment using ModelBuilder and Field Calculator scripts (Figure 6).
3. Results 3.1. Technical Potential of Forest Chips in Finland
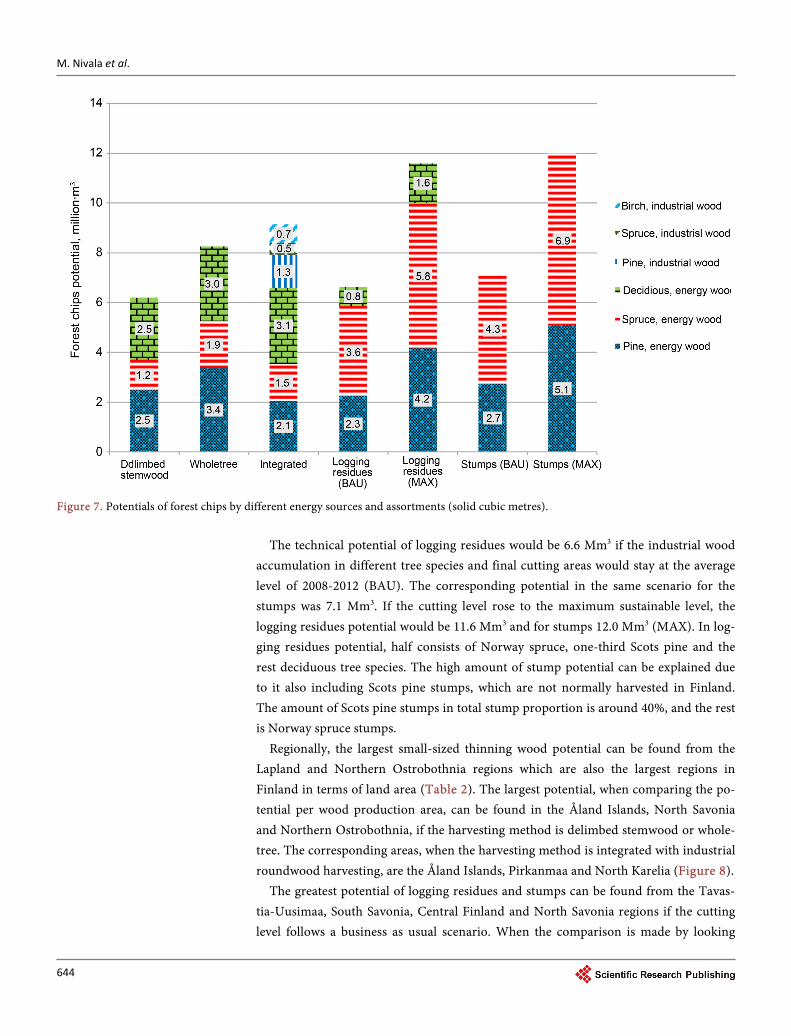
The harvesting method affects mainly the small-sized thinning wood potential. The technical potential is 6.2 Million cubic metres annually for delimbed stemwood har-vesting (Figure 7). If the harvesting is done using the wholetree method, the potential increases to 8.3 Mm3. When the harvesting is integrated with industrial roundwood harvesting, the energy wood potential is 6.6 Mm3 and moreover there is 2.5 Mm3 of in-dustrial roundwood available at the same stands. The amount of industrial roundwood from the integrated harvesting sites varies from 15% to 88%, and the average was 54%. In delimbed stemwood and wholetree potential, the Scots pine (Pinus sylvestris) pro-portion was around 40%, birch (Betula pendula and Betula pubescens) 33%, Norway spruce (Picea abies) 20% and the rest was comprised of other deciduous tree species (Figure 7). When harvesting small-sized thinning wood the integrated method was used together with industrial wood harvesting and the proportion of Scots pine was a little bit less than one-third, birch around 40%, Norway spruce around 20% and the rest consisted of other species.
By 2020 the total consumption of forest chips would be 13.5 Mm3, of which domestic forest chips use would equal 12.9 Mm3.
Figure 6. Forest chips balance calculation using GIS tools. The forest chips balance model and ad justments were based on the Model Builder functionalities.
M. Nivala et al.
644
Figure 7. Potentials of forest chips by different energy sources and assortments (solid cubic metres).
The technical potential of logging residues would be 6.6 Mm3 if the industrial wood
accumulation in different tree species and final cutting areas would stay at the average level of 2008-2012 (BAU). The corresponding potential in the same scenario for the stumps was 7.1 Mm3. If the cutting level rose to the maximum sustainable level, the logging residues potential would be 11.6 Mm3 and for stumps 12.0 Mm3 (MAX). In log-ging residues potential, half consists of Norway spruce, one-third Scots pine and the rest deciduous tree species. The high amount of stump potential can be explained due to it also including Scots pine stumps, which are not normally harvested in Finland. The amount of Scots pine stumps in total stump proportion is around 40%, and the rest is Norway spruce stumps.
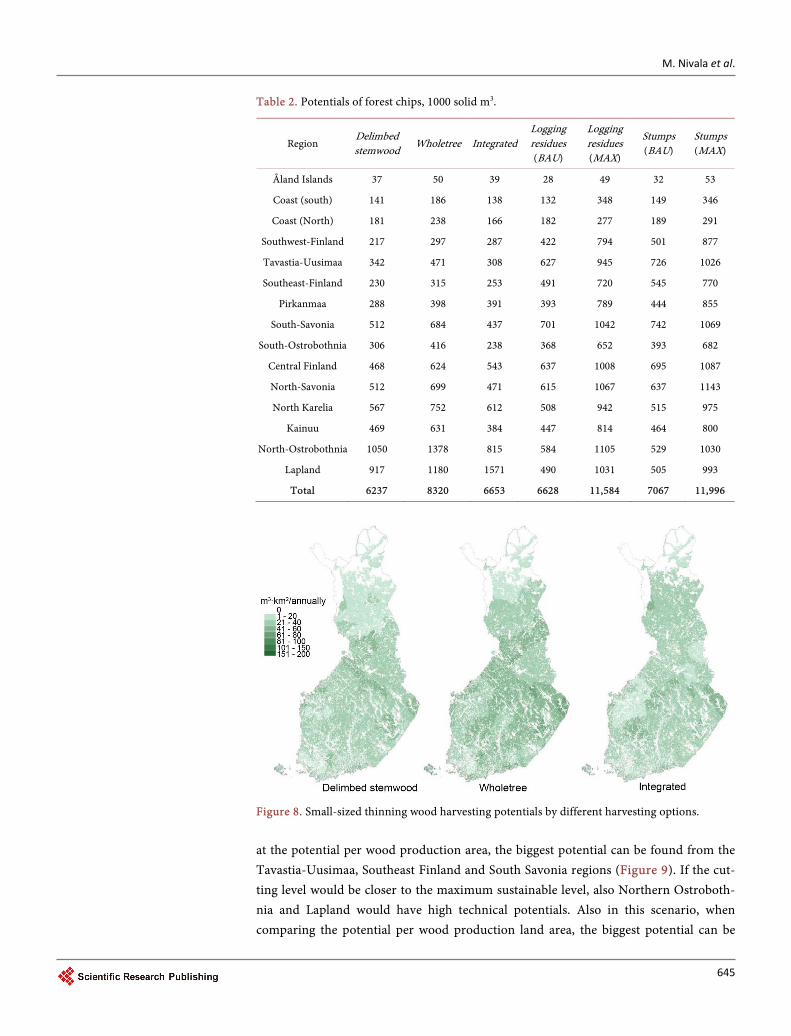
Regionally, the largest small-sized thinning wood potential can be found from the Lapland and Northern Ostrobothnia regions which are also the largest regions in Finland in terms of land area (Table 2). The largest potential, when comparing the po-tential per wood production area, can be found in the Åland Islands, North Savonia and Northern Ostrobothnia, if the harvesting method is delimbed stemwood or whole-tree. The corresponding areas, when the harvesting method is integrated with industrial roundwood harvesting, are the Åland Islands, Pirkanmaa and North Karelia (Figure 8).
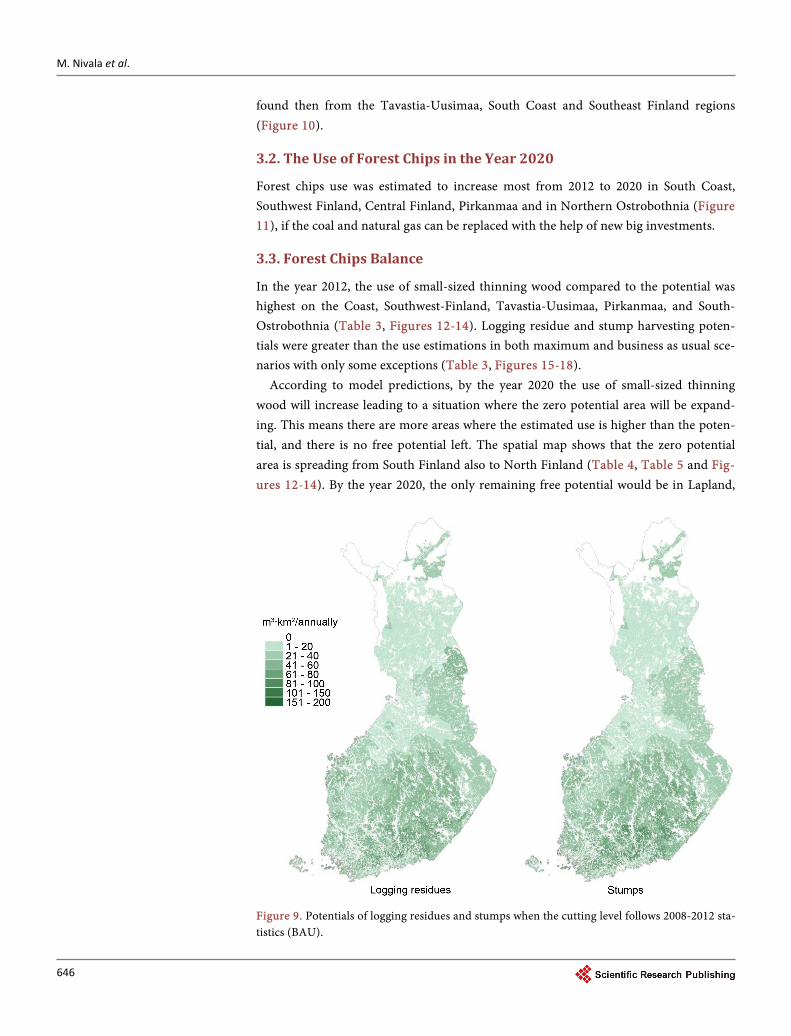
The greatest potential of logging residues and stumps can be found from the Tavas-tia-Uusimaa, South Savonia, Central Finland and North Savonia regions if the cutting level follows a business as usual scenario. When the comparison is made by looking
M. Nivala et al.
645
Table 2. Potentials of forest chips, 1000 solid m3.
Region Delimbed stemwood Wholetree Integrated
Logging residues (BAU)
Logging residues (MAX)
Stumps (BAU)
Stumps (MAX)
Åland Islands 37 50 39 28 49 32 53
Coast (south) 141 186 138 132 348 149 346
Coast (North) 181 238 166 182 277 189 291
Southwest-Finland 217 297 287 422 794 501 877
Tavastia-Uusimaa 342 471 308 627 945 726 1026
Southeast-Finland 230 315 253 491 720 545 770
Pirkanmaa 288 398 391 393 789 444 855
South-Savonia 512 684 437 701 1042 742 1069
South-Ostrobothnia 306 416 238 368 652 393 682
Central Finland 468 624 543 637 1008 695 1087
North-Savonia 512 699 471 615 1067 637 1143
North Karelia 567 752 612 508 942 515 975
Kainuu 469 631 384 447 814 464 800
North-Ostrobothnia 1050 1378 815 584 1105 529 1030
Lapland 917 1180 1571 490 1031 505 993
Total 6237 8320 6653 6628 11,584 7067 11,996
Figure 8. Small-sized thinning wood harvesting potentials by different harvesting options. at the potential per wood production area, the biggest potential can be found from the Tavastia-Uusimaa, Southeast Finland and South Savonia regions (Figure 9). If the cut-ting level would be closer to the maximum sustainable level, also Northern Ostroboth-nia and Lapland would have high technical potentials. Also in this scenario, when comparing the potential per wood production land area, the biggest potential can be
M. Nivala et al.
646
found then from the Tavastia-Uusimaa, South Coast and Southeast Finland regions (Figure 10).
3.2. The Use of Forest Chips in the Year 2020
Forest chips use was estimated to increase most from 2012 to 2020 in South Coast, Southwest Finland, Central Finland, Pirkanmaa and in Northern Ostrobothnia (Figure 11), if the coal and natural gas can be replaced with the help of new big investments.
3.3. Forest Chips Balance
In the year 2012, the use of small-sized thinning wood compared to the potential was highest on the Coast, Southwest-Finland, Tavastia-Uusimaa, Pirkanmaa, and South- Ostrobothnia (Table 3, Figures 12-14). Logging residue and stump harvesting poten- tials were greater than the use estimations in both maximum and business as usual sce- narios with only some exceptions (Table 3, Figures 15-18).
According to model predictions, by the year 2020 the use of small-sized thinning wood will increase leading to a situation where the zero potential area will be expand-ing. This means there are more areas where the estimated use is higher than the poten-tial, and there is no free potential left. The spatial map shows that the zero potential area is spreading from South Finland also to North Finland (Table 4, Table 5 and Fig-ures 12-14). By the year 2020, the only remaining free potential would be in Lapland,
Figure 9. Potentials of logging residues and stumps when the cutting level follows 2008-2012 sta-tistics (BAU).
M. Nivala et al.
647
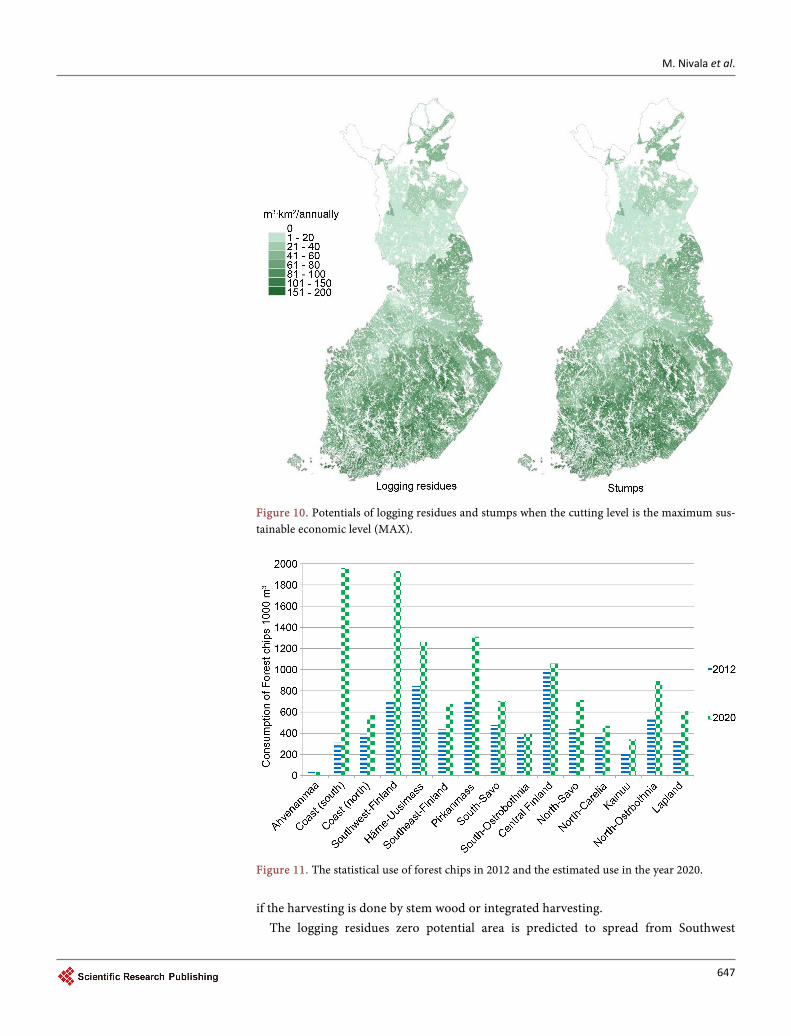
Figure 10. Potentials of logging residues and stumps when the cutting level is the maximum sus-tainable economic level (MAX).
Figure 11. The statistical use of forest chips in 2012 and the estimated use in the year 2020. if the harvesting is done by stem wood or integrated harvesting.
The logging residues zero potential area is predicted to spread from Southwest
M. Nivala et al.
648
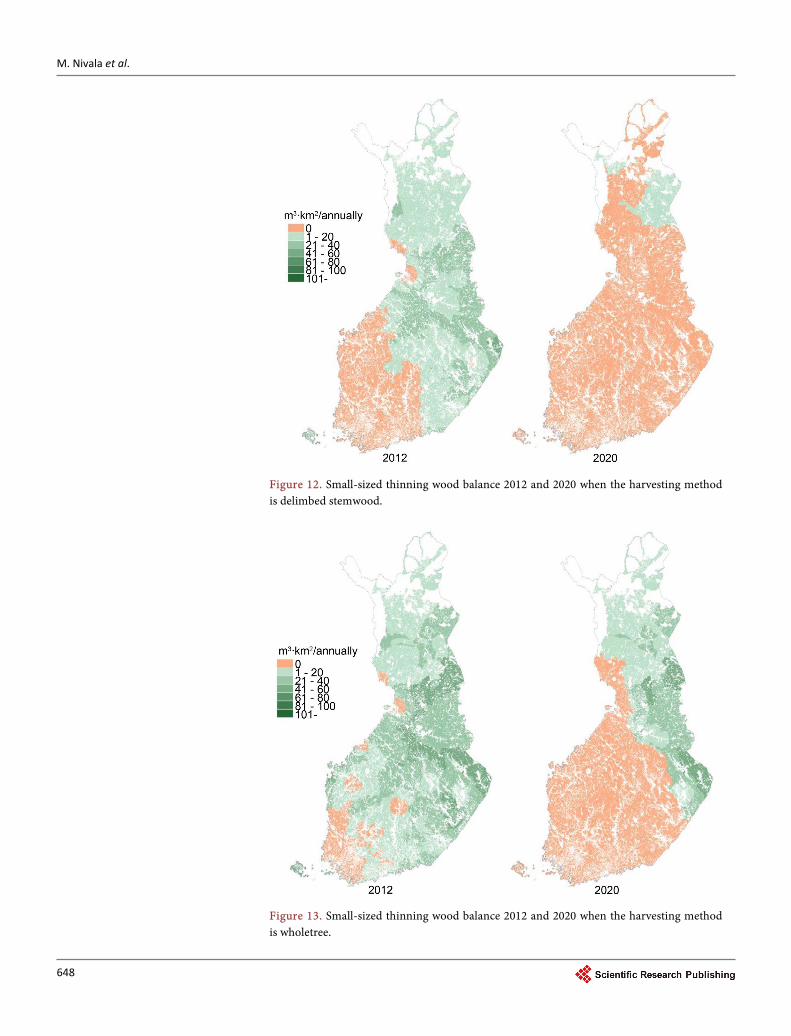
Figure 12. Small-sized thinning wood balance 2012 and 2020 when the harvesting method is delimbed stemwood.
Figure 13. Small-sized thinning wood balance 2012 and 2020 when the harvesting method is wholetree.

M. Nivala et al.
649
Figure 14. Small-sized thinning wood balance 2012 and 2020 when the harvesting method is integrated.
Figure 15. Logging residues balance 2012 and 2020 when the cutting level follows the 2008-2012 average statistic (BAU).
M. Nivala et al.
650
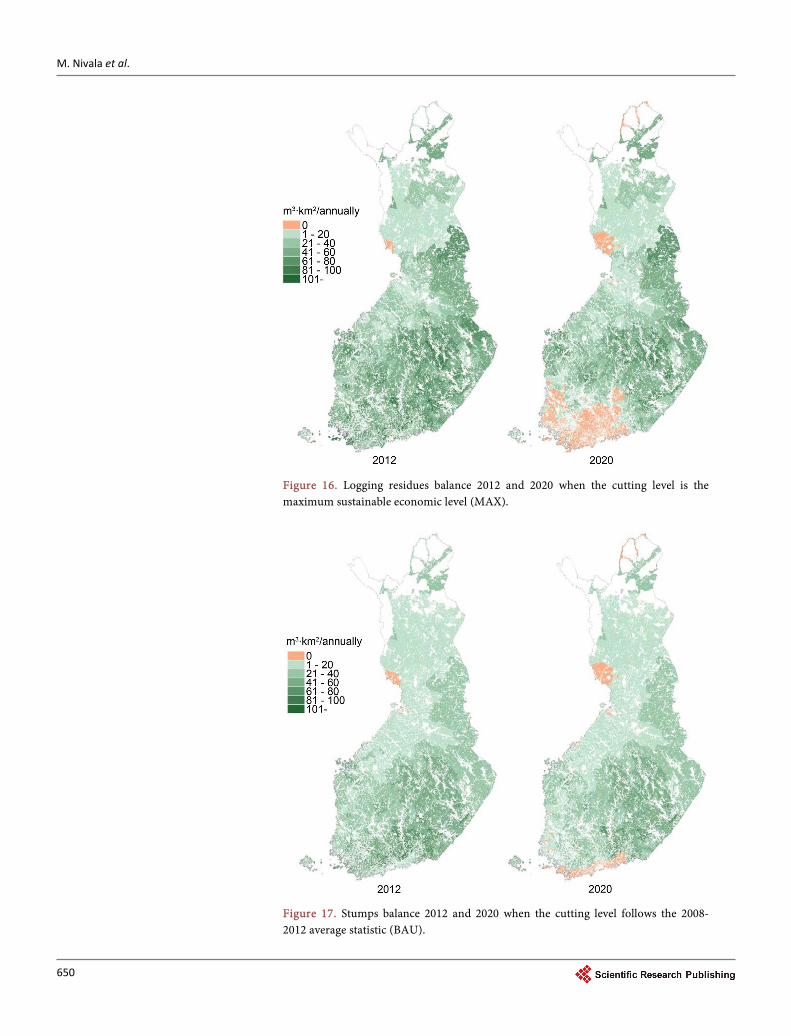
Figure 16. Logging residues balance 2012 and 2020 when the cutting level is the maximum sustainable economic level (MAX).
Figure 17. Stumps balance 2012 and 2020 when the cutting level follows the 2008- 2012 average statistic (BAU).
M. Nivala et al.
651
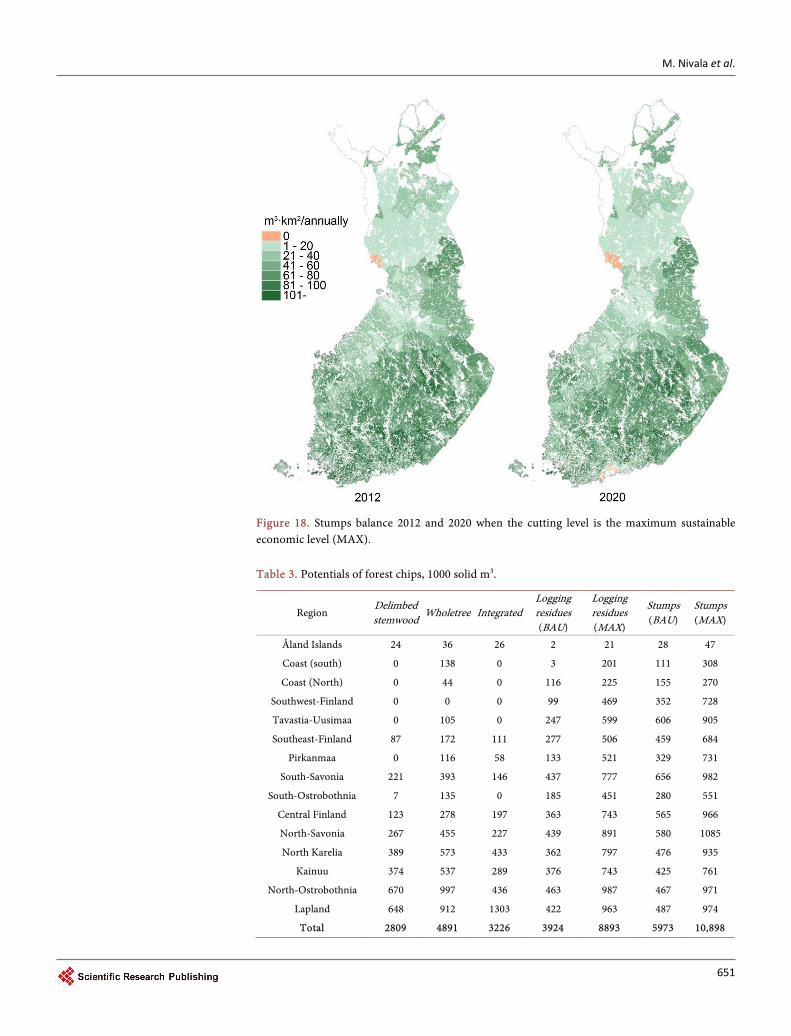
Figure 18. Stumps balance 2012 and 2020 when the cutting level is the maximum sustainable economic level (MAX). Table 3. Potentials of forest chips, 1000 solid m3.
Region Delimbed stemwood
Wholetree Integrated Logging residues (BAU)
Logging residues (MAX)
Stumps (BAU)
Stumps (MAX)
Åland Islands 24 36 26 2 21 28 47
Coast (south) 0 138 0 3 201 111 308
Coast (North) 0 44 0 116 225 155 270
Southwest-Finland 0 0 0 99 469 352 728
Tavastia-Uusimaa 0 105 0 247 599 606 905
Southeast-Finland 87 172 111 277 506 459 684
Pirkanmaa 0 116 58 133 521 329 731
South-Savonia 221 393 146 437 777 656 982
South-Ostrobothnia 7 135 0 185 451 280 551
Central Finland 123 278 197 363 743 565 966
North-Savonia 267 455 227 439 891 580 1085
North Karelia 389 573 433 362 797 476 935
Kainuu 374 537 289 376 743 425 761
North-Ostrobothnia 670 997 436 463 987 467 971
Lapland 648 912 1303 422 963 487 974
Total 2809 4891 3226 3924 8893 5973 10,898
M. Nivala et al.
652
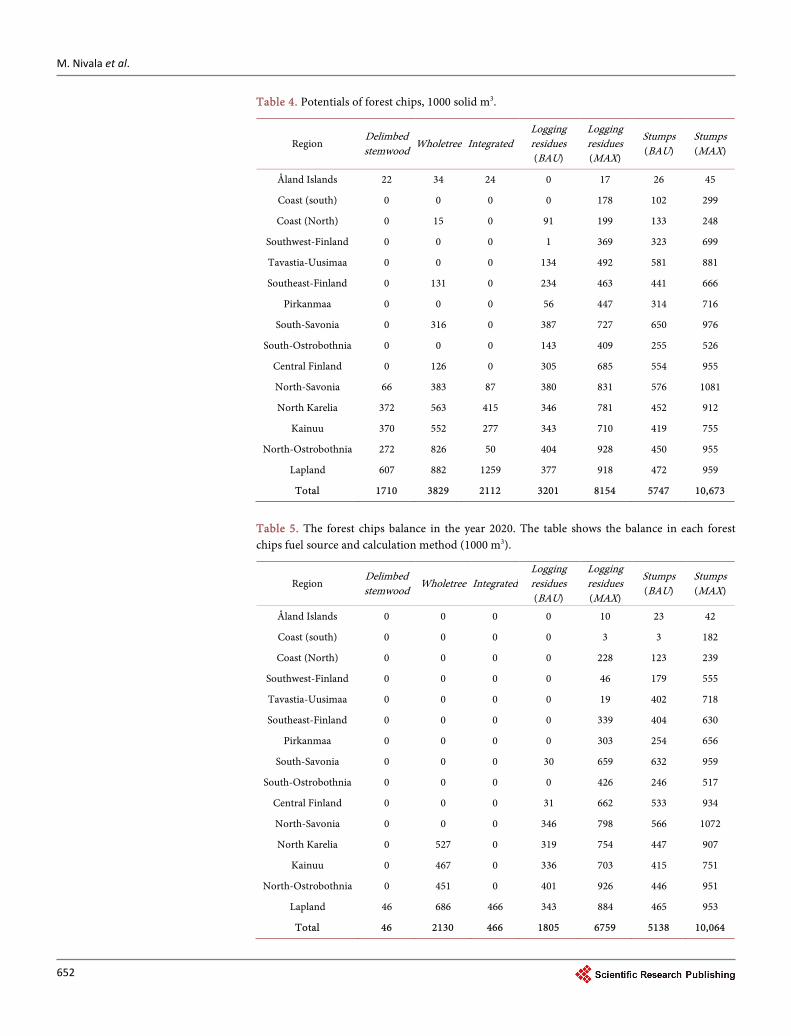
Table 4. Potentials of forest chips, 1000 solid m3.
Region Delimbed stemwood
Wholetree Integrated Logging residues (BAU)
Logging residues (MAX)
Stumps (BAU)
Stumps (MAX)
Åland Islands 22 34 24 0 17 26 45
Coast (south) 0 0 0 0 178 102 299
Coast (North) 0 15 0 91 199 133 248
Southwest-Finland 0 0 0 1 369 323 699
Tavastia-Uusimaa 0 0 0 134 492 581 881
Southeast-Finland 0 131 0 234 463 441 666
Pirkanmaa 0 0 0 56 447 314 716
South-Savonia 0 316 0 387 727 650 976
South-Ostrobothnia 0 0 0 143 409 255 526
Central Finland 0 126 0 305 685 554 955
North-Savonia 66 383 87 380 831 576 1081
North Karelia 372 563 415 346 781 452 912
Kainuu 370 552 277 343 710 419 755
North-Ostrobothnia 272 826 50 404 928 450 955
Lapland 607 882 1259 377 918 472 959
Total 1710 3829 2112 3201 8154 5747 10,673
Table 5. The forest chips balance in the year 2020. The table shows the balance in each forest chips fuel source and calculation method (1000 m3).
Region Delimbed stemwood
Wholetree Integrated Logging residues (BAU)
Logging residues (MAX)
Stumps (BAU)
Stumps (MAX)
Åland Islands 0 0 0 0 10 23 42
Coast (south) 0 0 0 0 3 3 182
Coast (North) 0 0 0 0 228 123 239
Southwest-Finland 0 0 0 0 46 179 555
Tavastia-Uusimaa 0 0 0 0 19 402 718
Southeast-Finland 0 0 0 0 339 404 630
Pirkanmaa 0 0 0 0 303 254 656
South-Savonia 0 0 0 30 659 632 959
South-Ostrobothnia 0 0 0 0 426 246 517
Central Finland 0 0 0 31 662 533 934
North-Savonia 0 0 0 346 798 566 1072
North Karelia 0 527 0 319 754 447 907
Kainuu 0 467 0 336 703 415 751
North-Ostrobothnia 0 451 0 401 926 446 951
Lapland 46 686 466 343 884 465 953
Total 46 2130 466 1805 6759 5138 10,064
M. Nivala et al.
653
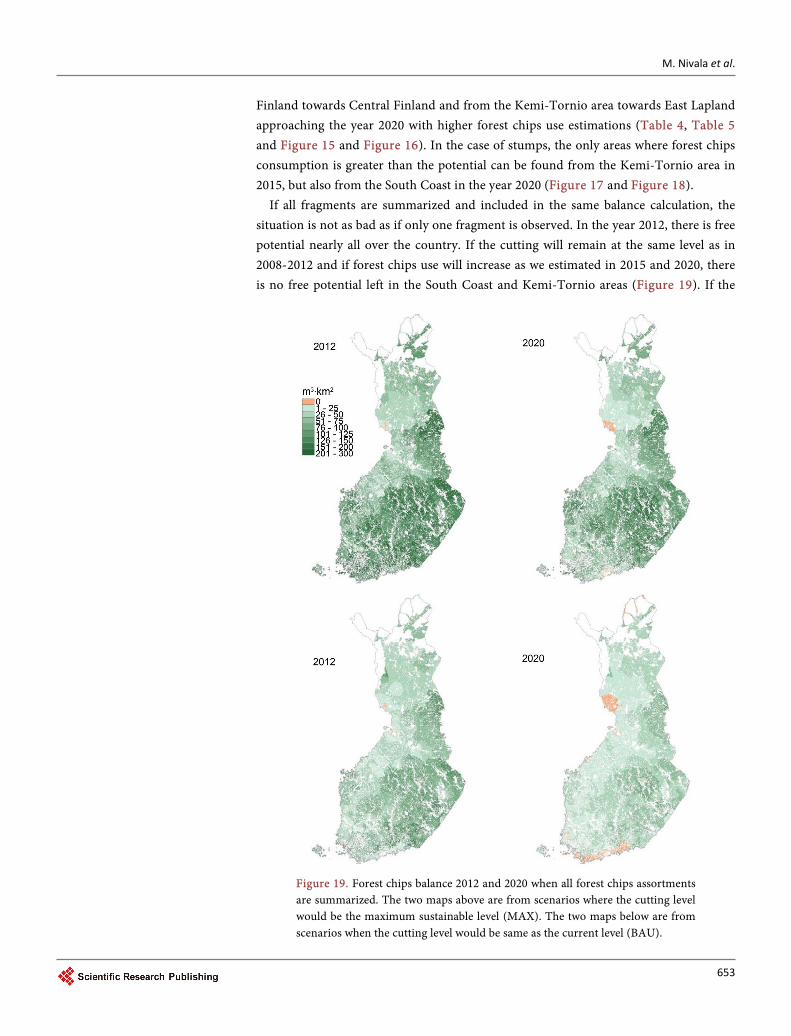
Finland towards Central Finland and from the Kemi-Tornio area towards East Lapland approaching the year 2020 with higher forest chips use estimations (Table 4, Table 5 and Figure 15 and Figure 16). In the case of stumps, the only areas where forest chips consumption is greater than the potential can be found from the Kemi-Tornio area in 2015, but also from the South Coast in the year 2020 (Figure 17 and Figure 18).
If all fragments are summarized and included in the same balance calculation, the situation is not as bad as if only one fragment is observed. In the year 2012, there is free potential nearly all over the country. If the cutting will remain at the same level as in 2008-2012 and if forest chips use will increase as we estimated in 2015 and 2020, there is no free potential left in the South Coast and Kemi-Tornio areas (Figure 19). If the
Figure 19. Forest chips balance 2012 and 2020 when all forest chips assortments are summarized. The two maps above are from scenarios where the cutting level would be the maximum sustainable level (MAX). The two maps below are from scenarios when the cutting level would be same as the current level (BAU).
M. Nivala et al.
654
cutting level would be higher in the future, there would be much more forest chips po-tential throughout Finland and zero potential areas could be found only in some small areas of the South Coast and Kemi-Tornio area.
4. Discussion
The new GIS-based method for forest chips calculation worked well at the national level but also for regional, municipality and local levels. Earlier studies have not been able to create maps with as accurate resolution in Finland (reference) as we reached with this method. In our study, the resolution was 1 ha, which was the limitation com-ing from the lowest resolution data, natural parks and protection areas. Also, the com-puting power of a normal PC cannot handle a more accurate calculation without changing the data first to the raster format, which has the limitation of data storage when the resolution is increases and similarly depends on the lowest-resolution data. With the help of created layers, further analysis concerning logistics or supply chains or optimal locations of new or planned heat and CHP plants are possible. The results can also be used in many kinds of procurement analysis and decision making of policy re-lated to renewable energy and especially wood energy. The study can be repeated in other regions or countries but is dependent on the source data and some small adjust-ments to the process models might be needed (Figure 1, Figure 4 and Figure 6). This study aimed at the forest chips balance calculation, but by changing the source data it could be used for industrial wood supply and demand balance mapping as well as simi-lar analyses in other sectors.
In this study, the estimation of procurement areas, transportation distances and procurement models are rough assumptions based on the survey. There is no public data available for actual procurement areas or the market shares of each forest energy fraction. This could be studied in future research projects.
Furthermore, there were only two scenarios for the potentials and two for the con-sumption. While these represent the likely extremes in the future, more scenarios could be added in the following studies to describe alternative futures. Moreover, a sensitivity analysis of the estimation parametres should be carried out.
When analysing the results and comparing the potential to the current use, the big-gest free potential is in stumps. To increase the use of stumps, the logistics of stumps need to be improved as well as the quality management throughout the supply chain [40] [41]. The potential calculation did not take into account the new forest law that was implemented in 2014 which allows uneven-aged treatment in forest management. In our study, we assumed that the cuttings would be similar to earlier years. Also, this study did not include the forest chips used by small households. At the whole country level in the year 2012, forest chips use equalled 7.6 Mm3 and 0.7 Mm3 of forest chips, mainly from thinning wood, were used in farms and household heating [4]. In the fu-ture, the use of forest chips will increase in small-sized heating enterprises that typically have boilers in the size range of 100 kW to 1.5 MW and in some large power plants that will require renovation in the near future. The main user group will still be the large

M. Nivala et al.
655
Combined Heat and Power Plants (CHP plants) that operate for the industrial and cen-tral heating network purposes. These plants’ proportions of the total consumption of forest chips equal about 70%.
Forest chips balance development seems to be logical relating to time as the use is increasing most in South Finland assuming the target in 2020 will be met. As the big-gest increase potential in consumption will be in replacing fossil fuels in large-scale plants located mainly on the coast of Finland, the zero-potential region spreads from South-West Finland towards East and North. The zero potential areas in Lapland are mainly caused because of the small harvesting potential of forest chips, not because of the high demand or use. However, the development in consumption of forest chips in recent years suggests that it will be difficult to reach the 2020 target. The consumption peaked in 2013, but has been declining in 2014 and 2015. In 2015 the use of forest chips was 7.3 Mm3 in plants and 0.7 Mm3 in small-scale housing [42]. If the estimated use is not achieved, it means that there will be a lot more free potential left than our spatial maps and calculations showed. The free potential does not automatically mean availa- bility, which also depends on the forest owners’ willingness to sell the wood. Also, the company that owns the right for the regeneration cutting can own the right for the log-ging residues and stumps, and it could be that the company may not be interested in making use of the potential of the forest chips. The forest owners’ willingness to sell the wood has been studied, but because the business environment has changed a lot since that time, it was not possible to include that part in the calculation. The study results vary a lot but the trend for the forest owners’ willingness to sell the energy wood is positive [43] [44] [45]. The real availability is anyway less than the free potential, which can be seen in our results. On the other hand, this study concentrates on showing the regions where use could be still increased or where the free potential is greater than the use. In the real situation of course, all the forest chips are under the competition of plants that use it, but it is complicated to model. In this study, this is taken into account by defining the procurement models for each plant size class.
As forest chips use increases, the wood that fulfils the size and quality requirements for industrial wood (mainly pulp wood), might end up in the combustion furnace more often, especially if the industrial plant is located far away from the stand, or there is no demand for that wood because of the market situation or if the energy industry is able to pay a better price than the forest industry. This is the reason why in the real life situation the bigger wood sizes are used in the heat and CHP plants. This factor is re-sponsible for underestimation of the small-sized thinning wood free potential in our results, as larger-sized thinning wood is not included in our potential but is then in-cluded in the forest chips use estimation. This statistic of used forest chips would need to be improved in the future, to do a more detailed analysis of the small-sized thinning wood balance.
There have been some signs that the consumption of industrial roundwood (mainly pulp) will increase significantly in Finland [46]. On the other hand, when the industrial use of wood increases, also the supply of solid by-products increase which means a
M. Nivala et al.
656
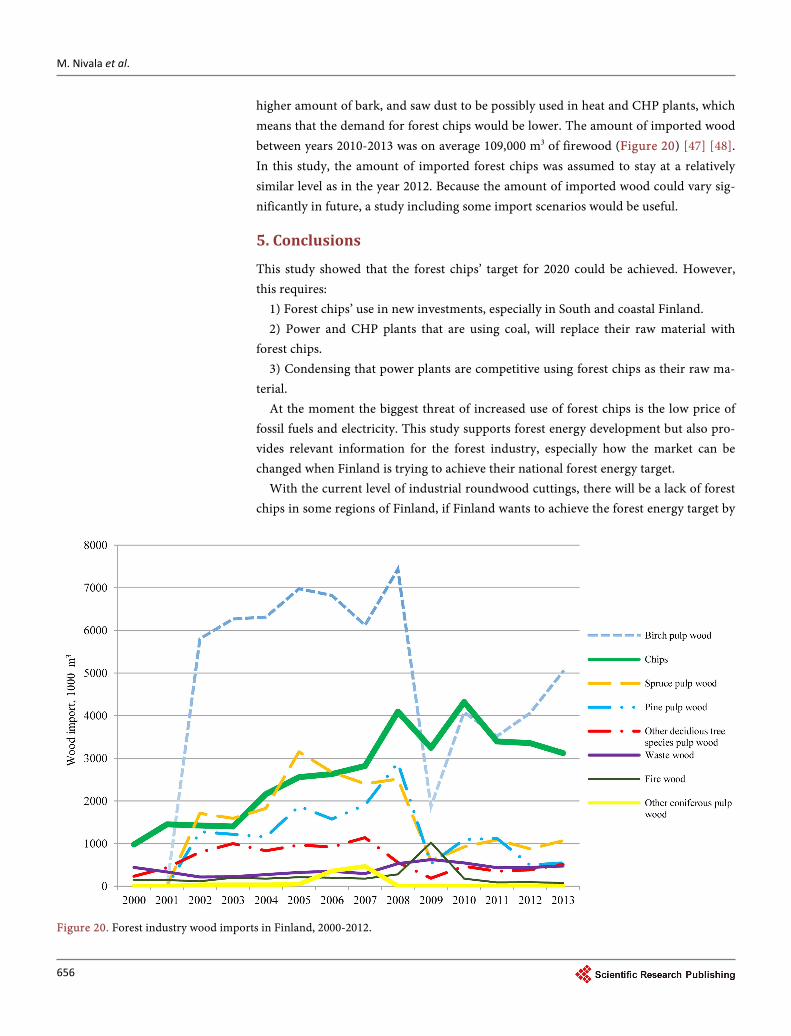
higher amount of bark, and saw dust to be possibly used in heat and CHP plants, which means that the demand for forest chips would be lower. The amount of imported wood between years 2010-2013 was on average 109,000 m3 of firewood (Figure 20) [47] [48]. In this study, the amount of imported forest chips was assumed to stay at a relatively similar level as in the year 2012. Because the amount of imported wood could vary sig-nificantly in future, a study including some import scenarios would be useful.
5. Conclusions
This study showed that the forest chips’ target for 2020 could be achieved. However, this requires:
1) Forest chips’ use in new investments, especially in South and coastal Finland. 2) Power and CHP plants that are using coal, will replace their raw material with
forest chips. 3) Condensing that power plants are competitive using forest chips as their raw ma-
terial. At the moment the biggest threat of increased use of forest chips is the low price of
fossil fuels and electricity. This study supports forest energy development but also pro-vides relevant information for the forest industry, especially how the market can be changed when Finland is trying to achieve their national forest energy target.
With the current level of industrial roundwood cuttings, there will be a lack of forest chips in some regions of Finland, if Finland wants to achieve the forest energy target by
Figure 20. Forest industry wood imports in Finland, 2000-2012.
M. Nivala et al.
657
2020 using only domestic wood resources. The biggest gap between the forecasted use and estimated potential can be found from the southern coast of Finland and the Kemi-Tornio area. Before the year 2012, the greatest increase in the use of forest chips was still in small-sized thinning wood, but in the year 2020 there will be a lack of small-sized thinning wood when the use is increased after the investments in the plants using forest chips are realized. After 2020, the biggest free potential of forest chips is in regeneration cutting logging residues and stumps. On the other hand, logging residues will be in full use South-Finland, if the cutting level remains at the actual level of 2008-2012.
The biggest free potential of forest chips can be found in Central Finland, Eastern Finland and Kainuu. The biggest increase in the use of forest chips is located on the coast of Finland, which will lead to the situation where the transportation distances are going to be longer. Because of these reasons, there is a need to reduce the cost of long- distance transportation and research the possibilities and benefits of round-trip trans-portation. There is great potential and possibilities to increase the use of stumps if the harvesting costs can be reduced and if the quality of forest chips from stumps can be improved. In the renewable energy target of Finland, the importance of the forest en-ergy is significant. When the use of forest chips increases, the challenges in forest chips’ procurement will grow. However, there are several ways to increase the use of forest energy. One option is to increase timber harvesting which would increase the potential coming from the logging residues and stumps, but it would also increase the wood en-ergy coming from the forest industries’ by-products. Even though this study focuses on forest chips, wood energy coming from the forest industry is a renewable energy source as the energy is produced by using domestic forest chips’ resources. It is also possible to broaden the forest chips’ raw material sources. In this study, the small-sized thinning wood potential did not include the small-sized pulp wood harvesting sites; some of them are used for forest chips’ purposes already now. This kind of wood combustion is sensible when the forest industry use points are located far away, demand is low and the quality of wood is weak for industrial purposes. On the coast of Finland, it is also possi-ble to import forest chips using sea transportation, but this is not recommended if Finland wants to keep a positive trade balance, keep the revenues high for forest own-ers, increase employment and continue the sustainability plan. Domestic forest chips can also be transported using waterways or railways. Lastly, the forest chips’ increase depends on political decisions that must ensure that the forest chips can be comparable to fossil fuels in heat and CHP plants.
References [1] Valtioneuvosto (2008) Pitkän aikavälin ilmasto-ja energiastrategia [Long-Term Climate and
Energy Strategy]. Valtioneuvoston selonteko Eduskunnalle 6. Päivänä marraskuuta 2008. (In Finnish) https://www.eduskunta.fi/FI/vaski/Selonteko/Documents/vns_6+2008.pdf
[2] Työ-ja elinkeinoministeriö (2010) Suomen kansallinen toimintasuunnitelma uusiutuvista lähteistä peräisin olevan energian edistämisestä direktiivin 2009/28/EY mukaisesti [Fin- land’s National Action Plan for Development of Renewables According to the Directive
M. Nivala et al.
658
2009/28/EY], Energiaosasto. (In Finnish) http://www.buildup.eu/sites/default/files/content/national_renewable_energy_action_plan_finland_fi.pdf
[3] Työ-ja elinkeinoministeriö (2013) Kansallinen energia-ja ilmastostrategia, taustaraportti [National Energy and Climate Strategy, Background Report]. Eri ministeriöiden (TEM, YM, MMM, LVM, VM, UM, OKM) yhteinen viranomaisyhdysverkko. (In Finnish) https://www.eduskunta.fi/FI/vaski/Selonteko/Documents/vns_2+2013.pdf
[4] Ylitalo, E. (2013) Metsätilastollinen vuosikirja 2013 [Finnish Statistical Yearbook of For-estry 2013], SVT Maa-, metsä-ja kalatalous. Metsäntutkimuslaitos, Vantaa, 273-294.
[5] Suomen virallinen tilasto (SVT): Puun energia käyttö 2015 [Energy Wood Generation of Finland 2015]. Luonnonvarakeskus, Helsinki, Viitattu: 02.09.2016. http://stat.luke.fi/en/wood-energy-generation-2015_en
[6] Hakkila, P. (2004) Wood Energy Technology Programme 1999-2003. Final Report. Tech-nology Programme Report 5/2004.
[7] Anttila, P., Nivala, M., Laitila, J. and Korhonen, K.T. (2013) Metsähakkeen alueellinen kor-juupotentiaali ja käyttö [Forest Energy Regional Harvesting Potential and Use]. Metlan työraportteja/Working Papers of the Finnish Forest Research Institute, 267. (In Finnish) http://www.metla.fi/julkaisut/workingpapers/2013/mwp267.Htm
[8] Helynen, S., Flyktman, M., Asikainen, A. and Laitila, J. (2007) Metsätalouteen ja metsäteol-lisuuteen perustuvan energialiiketoiminnan mahdollisuudet [Potentials of Energy Business Based on Forestry and Forest Industry]. VTT Tiedotteita-Research Notes 2397. (In Finnish)
[9] Laitila, J., Asikainen, A., Anttila, P., Kuusinen, M. and Ilvesniemi, H. (2008) Energiapuuva-rat [Wood Energy Resources]. In: Kuusinen, M. and Ilvesniemi, H., Eds., Energiapuun korjuun ympäristövaikutukset, Tutkimusraportti, Forestry Development Centre Tapio and Finnish Forest Research Institute, 6-12. (In Finnish)
[10] Ranta, T. (2005) Logging Residues from Regeneration Fellings for Biofuel Production—A GIS-Based Availability Analysis in Finland. Biomass Bioenergy, 28, 171-182. http://dx.doi.org/10.1016/j.biombioe.2004.08.010
[11] Ranta, T., Korpinen, O.-J., Jäppinen, E. and Karttunen, K. (2012) Forest Biomass Availabil-ity Analysis and Large-Scale Supply Options. Open Journal of Forestry, 2, 33. http://dx.doi.org/10.4236/ojf.2012.21005
[12] Yoshioka, T., Sakurai, R., Aruga, K., Sakai, H., Kobayashi, H. and Inoue, K. (2011) A GIS- Based Analysis on the Relationship between the Annual Available Amount and the Pro-curement Cost of Forest Biomass in a Mountainous Region in Japan. Biomass Bioenergy, 35, 4530-4537. http://dx.doi.org/10.1016/j.biombioe.2011.03.029
[13] Noon, C.E. and Daly, M.J. (1996) Strategic Benefits of Biomass and Wasteful Fuels GIS- Based Biomass Resource Assessment with BRAVO. Biomass Bioenergy, 10, 101-109. http://dx.doi.org/10.1016/0961-9534(95)00065-8
[14] Sánchez-García, S., Canga, E., Tolosana, E. and Majada, J. (2015) A Spatial Analysis of Woodfuel Based on WISDOM GIS Methodology: Multiscale Approach in Northern Spain. Applied Energy, 144, 193-203. http://dx.doi.org/10.1016/j.apenergy.2015.01.099
[15] Bouchard, S., Landry, M. and Gagnon, Y. (2013) Methodology for the Large Scale Assess-ment of the Technical Power Potential of Forest Biomass: Application to the Province of New Brunswick, Canada. Biomass Bioenergy, 54, 1-17. http://dx.doi.org/10.1016/j.biombioe.2013.03.014
[16] Rørstad, P.K., Trømborg, E., Bergseng, E. and Solberg, B. (2010) Combining GIS and Forest Modelling in Estimating Regional Supply of Harvest Residues in Norway. Silva Fennica, 44,
M. Nivala et al.
659
435-451. http://dx.doi.org/10.14214/sf.141
[17] Ilavský, J., Laitila, J., Tahvanainen, T., Tucek, J., Koreò, M., Pápaj, V., Jankovský, J. and Zi-aková, M. (2008) Analysis of Biomass Resources and Logistics of Its Procurement for Co- Firing with Brown Coal in the Zvolen CHP Plant. Zpravy Lesnickeho Vyzkume-Reports on Forestry Research, 53, 223-228.
[18] Kinoshita, T., Inoue, K., Iwao, K., Kagemoto, H. and Yamagata, Y. (2009) A Spatial Evalua-tion of Forest Biomass Usage Using GIS. Applied Energy, 86, 1-8. http://dx.doi.org/10.1016/j.apenergy.2008.03.017
[19] Karjalainen, T., Asikainen, A., Ilavsky, J., Zamboni, R., Hotari, K. and Röser, D. (2004) Es-timation of Wood Energy Potential in Europe. Working Papers of the Finnish Forest Re-search Institute, 6. http://www.metla.fi/julkaisut/workingpapers/2004/mwp006.Htm
[20] Asikainen, A., Liiri, H., Peltola, S., Karjalainen, T. and Laitila, J. (2008) Forest Energy Po-tential in Europe (EU27). Working Papers of the Finnish Forest Research Institute, Finnish Forest Research Institute, Vantaa, 69. http://www.metla.fi/julkaisut/workingpapers/2008/mwp069.pdf
[21] Verkerk, P.J., Anttila, P., Eggers, J., Lindner, M. and Asikainen, A. (2011) The Realisable Potential Supply of Woody Biomass from Forests in the European Union. Forest Ecology and Management, 261, 2007-2015. http://dx.doi.org/10.1016/j.foreco.2011.02.027
[22] Díaz-Yáñez, O., Mola-Yudego, B., Anttila, P., Röser, D. and Asikainen, A. (2013) Forest Chips for Energy in Europe: Current Procurement Methods and Potentials. Renewable and Sustainable Energy Reviews, 21, 562-571. http://dx.doi.org/10.1016/j.rser.2012.12.016
[23] Voivontas, D., Assimacopoulos, D. and Koukios, E. (2001) Assessment of Biomass Potential for Power Production: A GIS Based Method. Biomass Bioenergy, 20, 101-112. http://dx.doi.org/10.1016/S0961-9534(00)00070-2
[24] Thomas, A., Bond, A. and Hiscock, K. (2013) A GIS Based Assessment of Bioenergy Poten-tial in England within Existing Energy Systems. Biomass Bioenergy, 55, 107-121. http://dx.doi.org/10.1016/j.biombioe.2013.01.010
[25] Fiorese, G. and Guariso, G. (2010) A GIS-Based Approach to Evaluate Biomass Potential from Energy Crops at Regional Scale. Environmental Modelling & Software, 25, 702-711. http://dx.doi.org/10.1016/j.envsoft.2009.11.008
[26] Zambelli, P., Lora, C., Spinelli, R., Tattoni, C., Vitti, A., Zatelli, P. and Ciolli, M. (2012) A GIS Decision Support System for Regional Forest Management to Assess Biomass Avail-ability for Renewable Energy Production. Environmental Modelling & Software, 38, 203- 213. http://dx.doi.org/10.1016/j.envsoft.2012.05.016
[27] Viana, H., Cohen, W.B., Lopes, D. and Aranha, J. (2010) Assessment of Forest Biomass for Use as Energy. GIS-Based Analysis of Geographical Availability and Locations of Wood- Fired Power Plants in Portugal. Applied Energy, 87, 2551-2560. http://dx.doi.org/10.1016/j.apenergy.2010.02.007
[28] Lourinho, G. and Brito, P. (2015) Assessment of Biomass Energy Potential in a Region of Portugal (Alto Alentejo). Energy, 81, 189-201. http://dx.doi.org/10.1016/j.energy.2014.12.021
[29] Hiloidhari, M., Baruah, D., Mahilary, H. and Baruah, D.C. (2012) GIS Based Assessment of Rice (Oryza sativa) Straw Biomass as an Alternative Fuel for Tea (Camellia sinensis L.) Drying in Sonitpur District of Assam, India. Biomass Bioenergy, 44, 160-167. http://dx.doi.org/10.1016/j.biombioe.2012.05.016
[30] Natarajan, K., Latva-Käyrä, P., Zyadin, A. and Pelkonen, P. (2016) New Methodological Approach for Biomass Resource Assessment in India Using GIS Application and Land
M. Nivala et al.
660
Use/Land Cover (LULC) Maps. Renewable and Sustainable Energy Reviews, 63, 256-268. http://dx.doi.org/10.1016/j.rser.2016.05.070
[31] Hu, M., Huang, A. and Wen, T. (2013) GIS-Based Biomass Resource Utilization for Rice Straw Cofiring in the Taiwanese Power Market. Energy, 55, 354-360. http://dx.doi.org/10.1016/j.energy.2013.03.013
[32] Höhn, J., Lehtonen, E., Rasi, S. and Rintala, J. (2014) A Geographical Information System (GIS) Based Methodology for Determination of Potential Biomasses and Sites for Biogas Plants in Southern Finland. Applied Energy, 113, 1-10. http://dx.doi.org/10.1016/j.apenergy.2013.07.005
[33] Nord-Larsen, T. and Talbot, B. (2004) Assessment of Forest-Fuel Resources in Denmark: Technical and Economic Availability. Biomass Bioenergy, 27, 97-109. http://dx.doi.org/10.1016/j.biombioe.2004.01.007
[34] Kinoshita, T., Ohki, T. and Yamagata, Y. (2010) Woody Biomass Supply Potential for Thermal Power Plants in Japan. Applied Energy, 87, 2923-2927. http://dx.doi.org/10.1016/j.apenergy.2009.08.025
[35] Korhonen, K.T., Ihalainen, A., Viiri, H., Heikkinen, J., Henttonen, H.M., Hotanen, J., Mäkelä, H., Nevalainen, S. and Pitkänen, J. (2013) Suomen metsät 2004-2008 ja niiden ke-hitys 1921-2008 [Finland’s Forests 2004-2008 and Development of Forests in Finland 1921-2008]. Metsätieteen Aikakauskirja 3/2013, 269-608. (In Finnish) http://www.metla.fi/aikakauskirja/full/ff13/ff133269.pdf
[36] Redsven, V., Hirvelä, H., Härkönen, K., Salminen, O. and Siitonen, M. (2013) MELA 2012 Reference Manual. 2nd Edition, Finnish Forest Research Institute. http://mela2.metla.fi/mela/julkaisut/oppaat/mela2012_2nd_ed.pdf
[37] Ylitalo, E. (2013) Puun energiakäyttö 2012 [Wood Energy Use in 2012]. Metsätilastotiedote 15/2013. (In Finnish) http://www.metla.fi/metinfo/tilasto/julkaisut/mtt/2013/puupolttoaine2012.pdf
[38] Kurki, P., Mutanen, A. and Anttila, P. (2012) Energiapuumarkkinat—Käytännön koke-mukset ja tilastointimahdollisuudet [Energy Wood Markets—Practical Experiences and Statistical Possibilities]. Metlan Työraportteja/Working Papers of the Finnish Forest Re-search Institute, 228. (In Finnish) http://www.metla.Fi/julkaisut/workingpapers/2012/mwp228.Htm
[39] Snyder, C. (2009) Washington State Dept. of Natural Resources, SuperRegionPoly_v93 [Software], Python. http://arcscripts.esri.com/details.asp?dbid=16700
[40] Laitila, J., Leinonen, A., Flyktman, M., Virkkunen, M. and Asikainen, A. (2010) Metsähak-keen hankinta-ja toimituslogistiikan haasteet ja kehittämistarpeet [Challenges and Devel-opment Needs of Forest Chips Procurement and Delivery Logistics]. VTT Tiedotteita Re-search, Notes 2564. (In Finnish)
[41] Laitila, J. and Nuutinen, Y. (2015) Efficiency of Integrated Grinding and Screening of Stump Wood for Fuel at Roadside Landing with a Low-Speed Double-Shaft Grinder and a Star Screen. Croatian Journal of Forest Engineering, 36, 19-32.
[42] Ylitalo, E. The Consumption of Forest Chips Decreased in 2015, Research News of Luke. https://www.luke.fi/en/news/the-consumption-of-forest-chips-decreased-in-2015/
[43] Maidell, M., Pyykkönen, P. and Toivonen, R. (2008) Metsäenergiapotentiaalit Suomen ma-akunnissa [Potentials of Energy Wood in the Provinces of Finland]. Pellervo Economic Re-search Institute Working Papers, 106. (In Finnish)
[44] Järvinen, E., Rämö, A. and Silvennoinen, H. (2006) Energiapuun tuotanto ja markkinat: Metsänomistajakysely [Forest Energy Production and Markets: Survey of Forest Owners].

M. Nivala et al.
661
Pellervon taloudellisen tutkimuslaitoksen taportteja nro 199. (In Finnish)
[45] Mynttinen, S., Karttunen, K. and Handelberg, J. (2010) Energiapuun tarjontahalukkuus [Forest Owners’ Willingness to Supply Energy Wood]. In: Karttunen, K., Föhr, J. and Ranta, T., Eds., Energiapuuta Etelä-Savosta [Energy Wood from South-Savonia], Lappeen-rannan Teknillinen Yliopisto, Teknillinen tiedekunta, LUT Energia, Tutkimusraportti 7, 11-32. (In Finnish)
[46] Härkönen, K. (2014) Puuvarojen käyttö [Use of Wood Resources]. In: Viitanen, J. and Mu-tanen, A., Eds., Metsäsektorin Suhdannekatsaus 2014-2015 [Forest Sector’s Outlook 2014- 2015], 33-35. (In Finnish) http://www.metla.fi/julkaisut/isbn/978-951-40-2491-7/suhdannekatsaus-2014-2015.pdf
[47] MetINFO Database (2014) Forest Energy Use in Finland. http://www.metla.fi/metinfo/index-en.htm
[48] Peltola, A. (2014) Metsäteollisuuden ulkomaankauppa joulukuu 2013 [Foreign Trade of Forest Industry in Finland, December 2013]. Metsätilastotiedote (SVT Maa-, Metsä-Ja Kalatalous) 2014 (9/2014). (In Finnish) http://www.metla.fi/tiedotteet/metsatilastotiedotteet/2014/uk13_12.htm

M. Nivala et al.
662
Abbreviations
BAU: Business as usual scenario; CHP: Combined Heat and Power; CORINE: Coordination of information on the environment/CORINE program; EU: European Union; FAWS: The forests available for wood supply; KD: Kernel Density; MAX: Maximum sustainable scenario; MELA: Forest decision support system tool generated for Finnish conditions; Mm3: Million solid cubic meter; NFI: National Forest Inventory; P: Parametrised/Parameter; TWh: Terawatt hours; VTT: VTT Technical Research Centre of Finland Ltd.
Submit or recommend next manuscript to SCIRP and we will provide best service for you:
Accepting pre-submission inquiries through Email, Facebook, LinkedIn, Twitter, etc. A wide selection of journals (inclusive of 9 subjects, more than 200 journals) Providing 24-hour high-quality service User-friendly online submission system Fair and swift peer-review system Efficient typesetting and proofreading procedure Display of the result of downloads and visits, as well as the number of cited articles Maximum dissemination of your research work
Submit your manuscript at: http://papersubmission.scirp.org/ Or contact [email protected]