A geophysical investigation of a newly discovered Early Bronze Age site near Petra, Jordan
13
A geophysical investigation of a newly discovered Early Bronze Age site near Petra, Jordan Thomas M. Urban a, * , Clive Vella b , Emanuela Bocancea b , Christopher A. Tuttle c , Susan E. Alcock b a University of Oxford, United Kingdom b Brown University, United States c American Center of Oriental Research, Jordan article info Article history: Received 7 December 2012 Received in revised form 25 October 2013 Accepted 18 November 2013 Keywords: Petra Bronze Age Geophysics Ground-penetrating radar (GPR) Magnetometry Potential-field transformation Reduction to the pole (RTP) Pseudo-gravity transformation Upward continuation abstract The hinterland of the famed Nabataean city of Petra in southwestern Jordan has yielded archaeological remains ranging from the Paleolithic to the Medieval Period, with a time-span of approximately one- million years of human and hominin activity represented in the archaeological record of the region. Bronze Age sites, however, have been grossly underrepresented for reasons that are not presently well understood, even to the extent that some past researchers have assumed that the region was sparsely occupied during this period. Our team has conducted a preliminary investigation at a previously un- documented Early Bronze Age site, located on an isolated hilltop in the northern hinterland of Petra. The site was recently noted during a pedestrian survey in the area as part of the Brown University Petra Archaeological Project (BUPAP). Follow up documentation and investigation included the production of a site plan, a geophysical survey with magnetometry and ground-penetrating radar, and small scale exploratory excavation. The geophysical results revealed a number of archaeological features in addition to yielding information about site taphonomy. Qualitative examination of the survey results indicated evidence of structures, burnt features, and modern disturbance, while potential-field transformations offered additional insights on the distribution of some of these features. Ó 2013 Elsevier Ltd. All rights reserved. 1. Introduction The Early Bronze Age (EBA) in the Levant has typically been seen from a uni-linear evolutionary perspective (Philip, 2008: 160). This period is characterized by growing urban centers in several parts of the Levant, but, the region surrounding Petra has provided only small, dispersed EBA settlements (Lindner and Genz, 2000). The recent discovery of Jabal al-Qarn (Vella et al., 2012, http://www. antiquity.ac.uk/projgall/vella334/) adds another settlement to only five Bronze Age sites previously documented in the Petra re- gion. The subsequent investigation of Jabal al-Qarn relied heavily on non-invasive geophysical methods. While geophysical methods have been used successfully in past investigations at Petra, these studies have focused primarily on the Nabataean and Roman his- tory of the ancient city rather than earlier periods of occupation (Hammond 1973; Conyers et al., 2002; Urban et al., 2012, http:// www.antiquity.ac.uk/projgall/urban331/; Urban et al., 2013a). Studies in the broader Levant region, however, have seen success with geophysical investigations of sites ranging from the Neolithic through Late Bronze Age (e.g. Witten et al., 2000, 2003; Rowan et al., 2012, http://www.antiquity.ac.uk/projgall/rowan334/; Urban et al., 2013b). Here we describe the geophysical investigation of Jabal al-Qarn, an Early Bronze Age site recently discovered in the northern hin- terland of Petra. The site was surveyed with magnetometry and ground-penetrating radar (GPR), followed by two small-scale ex- cavations, in order to assess both archaeological potential and the current state of site preservation. Interpretation of the geophysical survey results is the focus of this article. 1.1. Site description The Early Bronze Age site, Jabal al-Qarn, occupies a free- standing hill several kilometers north of Petra, Jordan (Fig. 1). The hill is situated strategically as a vantage point from which all ave- nues of approach through surrounding natural corridors may be easily observed. The southern side of the hill declines steeply to- wards a wadi, which is fed by the Shara mountain range. As * Corresponding author. E-mail address: [email protected] (T.M. Urban). Contents lists available at ScienceDirect Journal of Archaeological Science journal homepage: http://www.elsevier.com/locate/jas 0305-4403/$ e see front matter Ó 2013 Elsevier Ltd. All rights reserved. http://dx.doi.org/10.1016/j.jas.2013.11.017 Journal of Archaeological Science 42 (2014) 260e272
-
Upload
independent -
Category
Documents
-
view
0 -
download
0
Transcript of A geophysical investigation of a newly discovered Early Bronze Age site near Petra, Jordan

lable at ScienceDirect
Journal of Archaeological Science 42 (2014) 260e272
Contents lists avai
Journal of Archaeological Science
journal homepage: http: / /www.elsevier .com/locate/ jas
A geophysical investigation of a newly discovered Early Bronze Agesite near Petra, Jordan
Thomas M. Urban a,*, Clive Vella b, Emanuela Bocancea b, Christopher A. Tuttle c,Susan E. Alcock b
aUniversity of Oxford, United KingdombBrown University, United StatescAmerican Center of Oriental Research, Jordan
a r t i c l e i n f o
Article history:Received 7 December 2012Received in revised form25 October 2013Accepted 18 November 2013
Keywords:PetraBronze AgeGeophysicsGround-penetrating radar (GPR)MagnetometryPotential-field transformationReduction to the pole (RTP)Pseudo-gravity transformationUpward continuation
* Corresponding author.E-mail address: [email protected] (T.M
0305-4403/$ e see front matter � 2013 Elsevier Ltd.http://dx.doi.org/10.1016/j.jas.2013.11.017
a b s t r a c t
The hinterland of the famed Nabataean city of Petra in southwestern Jordan has yielded archaeologicalremains ranging from the Paleolithic to the Medieval Period, with a time-span of approximately one-million years of human and hominin activity represented in the archaeological record of the region.Bronze Age sites, however, have been grossly underrepresented for reasons that are not presently wellunderstood, even to the extent that some past researchers have assumed that the region was sparselyoccupied during this period. Our team has conducted a preliminary investigation at a previously un-documented Early Bronze Age site, located on an isolated hilltop in the northern hinterland of Petra. Thesite was recently noted during a pedestrian survey in the area as part of the Brown University PetraArchaeological Project (BUPAP). Follow up documentation and investigation included the production of asite plan, a geophysical survey with magnetometry and ground-penetrating radar, and small scaleexploratory excavation. The geophysical results revealed a number of archaeological features in additionto yielding information about site taphonomy. Qualitative examination of the survey results indicatedevidence of structures, burnt features, and modern disturbance, while potential-field transformationsoffered additional insights on the distribution of some of these features.
� 2013 Elsevier Ltd. All rights reserved.
1. Introduction
The Early Bronze Age (EBA) in the Levant has typically been seenfrom a uni-linear evolutionary perspective (Philip, 2008: 160). Thisperiod is characterized by growing urban centers in several parts ofthe Levant, but, the region surrounding Petra has provided onlysmall, dispersed EBA settlements (Lindner and Genz, 2000). Therecent discovery of Jabal al-Qarn (Vella et al., 2012, http://www.antiquity.ac.uk/projgall/vella334/) adds another settlement toonly five Bronze Age sites previously documented in the Petra re-gion. The subsequent investigation of Jabal al-Qarn relied heavilyon non-invasive geophysical methods. While geophysical methodshave been used successfully in past investigations at Petra, thesestudies have focused primarily on the Nabataean and Roman his-tory of the ancient city rather than earlier periods of occupation(Hammond 1973; Conyers et al., 2002; Urban et al., 2012, http://www.antiquity.ac.uk/projgall/urban331/; Urban et al., 2013a).
. Urban).
All rights reserved.
Studies in the broader Levant region, however, have seen successwith geophysical investigations of sites ranging from the Neolithicthrough Late Bronze Age (e.g. Witten et al., 2000, 2003; Rowanet al., 2012, http://www.antiquity.ac.uk/projgall/rowan334/;Urban et al., 2013b).
Here we describe the geophysical investigation of Jabal al-Qarn,an Early Bronze Age site recently discovered in the northern hin-terland of Petra. The site was surveyed with magnetometry andground-penetrating radar (GPR), followed by two small-scale ex-cavations, in order to assess both archaeological potential and thecurrent state of site preservation. Interpretation of the geophysicalsurvey results is the focus of this article.
1.1. Site description
The Early Bronze Age site, Jabal al-Qarn, occupies a free-standing hill several kilometers north of Petra, Jordan (Fig. 1). Thehill is situated strategically as a vantage point from which all ave-nues of approach through surrounding natural corridors may beeasily observed. The southern side of the hill declines steeply to-wards a wadi, which is fed by the Shara mountain range. As

Fig. 1. Site location. The Early Bronze Age site of Jabal al-Qarn was recently located inthe northern hinterland of Petra, Jordan.
T.M. Urban et al. / Journal of Archaeological Science 42 (2014) 260e272 261
discovered by our team during the course of the site investigation,the hilltop, with no natural breaks nearby, is also subject to strong,unchecked winds. The settlement of Jabal al-Qarn appears to haveincluded the construction of a perimeter wall, presently interpretedas a boundary demarcation. Indeed, it appears that the wall, largelycomprised of sub-angular sandstone, would not have originallybeen higher than 1.5 m (Fig. 2). The construction style of the wallcould therefore be taken to imply that it was not meant fordefensive reasons, but rather, for containment. Jabal al-Qarn pres-ently exhibits the remains of multiple stone walls that encircle thehill, while on the apex of the hill some discernible structuralalignments could be identified in the current surface (Fig. 3). Toground truth the results of the geophysical survey, described below,a trench (2 � 2 m) was placed in the southernmost portion of the
Fig. 2. Jabal al-Qarn settlement and pe
hilltop, over what originally appeared to be a structural wall visiblein the surface. However, as soon as excavations began it becameclear that the uppermost topsoil deposit ran underneath theapparent surface alignment, demonstrating that it was nothingmore than a fortuitous placement of rubble. Within this top layer, itbecame obvious that the majority of recovered ceramics and lithicswere typical of the Early Bronze Age, quite similar to artifactspreviously published at nearby Umm Saysaban (Lindner et al.,2001: 302e303). Beneath the topsoil, a rubble deposit appears tohave been a collapse of structures that contained some later re-sidual ceramics (including at least two Nabataean sherds) in addi-tion to an abundance of EBA ceramics and lithics.
After the removal of the rubble deposit, a linear structuralalignment was uncovered as indicated by the geophysical survey.The uncovered portion of the alignment appears to be only a smallpart of a larger axis that seems to cross the southernmost part of thehilltop, whose function remains unknown (Fig. 4). After the con-struction of this wall, a burnt beaten surface was installed, as wellas a chippings deposit that was contemporary to the wall, and adoorway that included a beaten lime surface (Fig. 4). The burntsurface, interpreted as a cooking feature, was well indicated in themagnetic survey results and included six discernible depressions(perhaps for placing stones to elevate foodstuffs), and a quern withpestle. Underneath this cooking surface, the remains of a hutstructure was observed during the last day of fieldwork, which wasleft for future research at Jabal al-Qarn (Vella et al., 2012).
Evidence of modern use of the hill, which is on land owned bythe Amareen tribe of Bedouin, is also apparent. This includesseveral modern burials on a lower terrace of the hill (work in thisarea was avoided), occasional modern trash, two areas where theremains of very small camp fires are evident, and at least onelooting trench at the top of the hill. Surface observations alsosuggested that part of the hilltop had likely been filled withexternal limestone gravel to make a flattened surface, possibly forthreshing activities. This latter observation was later supported bythe results of the geophysical survey and excavation. In spite ofthese modern disturbances, however, the site appears to beincredibly rich with well preserved archaeological material.
2. Methods
The geophysical methods employed at the investigation of Jabalal-Qarn included magnetic gradiometry and ground-penetratingradar (GPR). These were undertaken respectively with a G-858alkali-vapor magnetometer by Geometrics and a Noggin series250 MHz GPR system by Sensors and Software.
2.1. Magnetic survey
The magnetic survey was conducted with the instrument invertical gradiometry configuration. The lower sensor was
rimeter wall. View looking west.

Fig. 3. Site plan. The site rests on an isolated hill adjacent to a Bedouin village. The village, hill, and standing walls are visible in the satellite image on the left, where the dotted lineindicates the outline of the hill and the inset shows a drawn plan of standing walls for greater clarity. The geophysical survey area was limited to the relatively flat hilltop shown onthe right.
T.M. Urban et al. / Journal of Archaeological Science 42 (2014) 260e272262
deployed at 20 cm above grade with a 1.5 m separation from theupper sensor. A base station was established prior to the survey inorder to implement diurnal corrections to total field data so thatthis could be assessed in addition to the gradient. This was re-occupied every 15 min during the course of the survey (mag-netic data were collected at a time of day when the slope of thediurnal change was minimal, so a closer time interval was un-necessary). Transects were collected unidirectionally with a 50 cm
Fig. 4. Test excavation. The excavation revealed a wall (STU 3) and burnt cookingsurface (STU 6) both indicated in the magnetic survey.
interval between each traverse. The initial survey covered a40 � 40 m grid that included most of the hilltop. Magneticsurveying was then suspended at this site for a two day period dueto projected interference from an X-class solar flare, after which asmaller 20� 5 m sectionwas added to the east of the original grid.Another small section of the hilltop, south of this addition, was leftun-surveyed due to large amounts architectural rubble that madesurface traverse impractical.
Initial processing of the magnetic data included despiking anddrop-out removal with linear interpolation in order to normalizeany data inconsistencies associated with random noise. Diurnaltrend removal using the base station measurements was under-taken for total field measurements at both sensors (upper andlower). The regional geomagnetic field was removed from the up-per sensor total field measurements using the 2010 InternationalGeomagnetic Reference Field (IGRF) model (InternationalAssociation of Geomagnetism and Aeronomy, Working Group V-MOD, 2010) (such models are reproduced at 5 year intervalshttp://www.ngdc.noaa.gov/IAGA/vmod/igrf.html). Additionally, abi-linear least squares background removal procedure was appliedto the upper sensor data to remove low frequency trends, thusenhancing the appearance of residual anomalous fields fromsmaller magnetic sources. This high-pass procedure, by acting toremove the lowest frequency trends from the data allowed closercomparison between the upper sensor total field readings and thevertical gradient. This can be useful at sites that exhibit underlyinggeologic variability, such as Jabal al-Qarn, as the magnetic trendfrom the geology may be minimized by the procedure. These pro-cedures were only applied to total field measurements taken at theupper sensor.
The vertical gradient on the other hand, as a relative measure-ment, eliminates the diurnal and regional trend without suchadditional processing, and can also have an additional high-passeffect that acts to enhance the shallower trends most often of in-terest to archeology (Silliman et al., 2000). While this differentialmeasurement is most often the only metric sought in archaeolog-ical magnetic surveys, the total field measurements can yieldadditional useful information in many instances. Examination of

Fig. 5. Magnetic gradient and topographic model. Here the magnetic gradient is shown draped into a topographic model of the hilltop for additional context. The survey area shownis the original 40 � 40 m magnetic survey grid.
Fig. 6. Magnetic gradient and site plan. A number of apparent architectural features were identified with the magnetic gradient. These features are depicted above within thecontext of known features visible at the site. This survey area shown includes the original 40 � 40 m grid and a smaller 20 � 5 m addition.
T.M. Urban et al. / Journal of Archaeological Science 42 (2014) 260e272 263
the total field data in addition to the gradient was therefore anintegral part of the magnetic data analysis. During the analysis ofthese data, several potential-field transformations were under-taken, including a reduction to the pole (RTP), upward continua-tion, and pseudo-gravity transformation. These were applied to theupper sensor total field data with only the diurnal trend andmagnitude of the average value of the geomagnetic field removed.The transformations were therefore applied only to the residualanomalies. The potential-field transformations are discussed ingreater detail later in the article. For a more extensive discussion ofthe procedures described above see Baranov (1975), Blakely (1995),Kearey et al. (2002: ch.7) Burger et al. (2006: ch.7), and Aspinallet al. (2008).
2.2. Ground-penetrating radar survey
Coverage with GPR was not as broad as with magnetometry,owing primarily to a sloping, rocky surface in some areas whichprevented proper deployment of the system. In the areas where GPRdata collection was possible, the instrument was deployed bi-directionally (anti-parallel) with a 25 cm interval between eachtraverse. The system was deployed on a sled configuration tomaximize coupling of the antenna to survey surface as well asmaneuverability of the instrument, and in-line distances were log-ged with both a calibrated odometer and a survey tape. A moderategain was adequate to observe collected data in real time, and eight-fold stacking was applied as a random-noise reduction strategy.

Fig. 7. Visual interpretation of magnetic results. Features revealed in the magnetic gradient (upper left) were analyzed visually, developing the interpretation shown in the lowerleft, where the symbol X represents discrete dipoles. The readings of the lower sensor were contoured (upper right) in order to indicate the relative strength of dipolar anomalies,while the upper sensor readings were evaluated (lower right) in order the minimize smaller, weaker anomalies in favor of broad trends. Here the background removal procedure hasrevealed a smoothed version of the lower frequency trends appearing in the gradient. Note how the large dipole in the southeast quadrant of the survey area was isolated.
T.M. Urban et al. / Journal of Archaeological Science 42 (2014) 260e272264
During post-processing of the GPR data, sub-surface velocitieswere determined using a hyperbola fitting procedure. With averagevelocity satisfactorily determined, two-way travel times were thenconverted to depths. Additional processing included backgroundremoval (average of all traces in grid), signal saturation removal ordewow (high-pass procedure to remove low frequency trendsgenerated by induction currents), enveloping (Hilbert transform)and velocity-migration to provide renderings closer to the true di-mensions of features by eliminating the oscillatory nature of thetrace and by reducing tails of diffraction hyperbolas respectively. Amoderate spreading and exponential compensation gain (SEC) wasalso applied to compensate for energy losses associated with thegeometric spread of the wave, and to partially compensate forelectromagnetic attenuation.With these procedures complete, time-slicing was implemented at 10 cm intervals for rendering as plan-view common-depth surfaces, and a hierarchical data format (HDF)file was generated for true 3-D rendering. For more extensive dis-cussion of these processing procedures see Annan (2004), Daniels(2004), Jol (2009), Conyers (2013), Goodman and Piro (2013).
3. Results, analysis, and discussion
A number of features were detected with both geophysicalmethods. Many of these warranted further analysis and
interpretation to be of use in understanding the site from botharchaeological and taphonomic standpoints. Qualitative interpre-tation was undertaken in the form of visual pattern analysis torecognize potential sub-surface features. Quantitative analysis wasalso undertaken. In particular, a number of potential-field trans-formationswere applied to themagnetic data to better estimate thedistribution and parameters of observed anomalies. Some topo-graphic trends were also assessed as an interpretation aid. Thesurvey results are presented in the sections below, integrated withdescriptions of associated analyses, and discussion of possibleinterpretations.
3.1. Qualitative pattern analysis
This type of qualitative analysis and interpretation is the mostcommon type with archaeological geophysical data. It is simplyvisual inspection to identify trends in the data that represent likelyarchaeological features (e.g. wall, floor, ditch). This is an excellentstarting point for interpretation and is quite often the most robustand only necessary analysis to be undertaken with such data sets.With this type of analysis, many trends were identified in both themagnetic and GPR data, some of which are clearer and lessambiguously interpreted as anthropogenic than others. Many ofthese trends likely represent the remains of collapsed and

Fig. 8. GPR results. GPR revealed several trends that closely matched the magnetic gradient results, and also detected some prominent sub-surface interfaces likely related to sitemorphology. The magnetic gradient is shown on the left, with a white dotted-line indicating the GPR survey area. The GPR survey is shown on the right as a sliced surface at 1.7 mdeep (upper right) and as a complete volume indicating subterranean interfaces in profile view (lower right) with white dotted-line.
T.M. Urban et al. / Journal of Archaeological Science 42 (2014) 260e272 265
disturbed structures in the shallow sub-surface, while others maybe related to more recent activities.
Among the most prominent trends appearing in the magneticgradient is a linear anomaly in the southwest of the survey area(Figs. 5 and 6). Provisionally interpreted as a wall, an excavation inthe southeast of the survey area (east of the anomaly) revealed aburied wall of similar strike and dimensions, supporting thisinterpretation (even though the excavated portion was not visiblein the magnetic data due to a cluster of strong dipoles in its
Fig. 9. Upward continuation. The left-hand image shows the magnetic total field data of theshows an upward continued version of the left-hand image, where the field has been projecand generating a smoothed field more suitable for an RTP procedure.
immediate vicinity). Other features appearing just north of thesupposed wall, exhibit layout and dimensions appropriate for thestorage silos known to have existed during the EBA (Figs. 5e7)such as those described by Milevski et al., (2012) (http://www.antiquity.ac.uk/projgall/milevski331/). Yet other obvious featuresmanifest as discrete or clustered dipoles of variable responseamplitudes (Fig. 7). Of these, it was assumed that some of thestronger responses represented modern ferrous trash (laterconfirmed for several anomalies with a thorough surface
upper sensor with the diurnal trend and regional field removed. The right-hand imageted an additional meter above the original observational plane, thereby relaxing noise
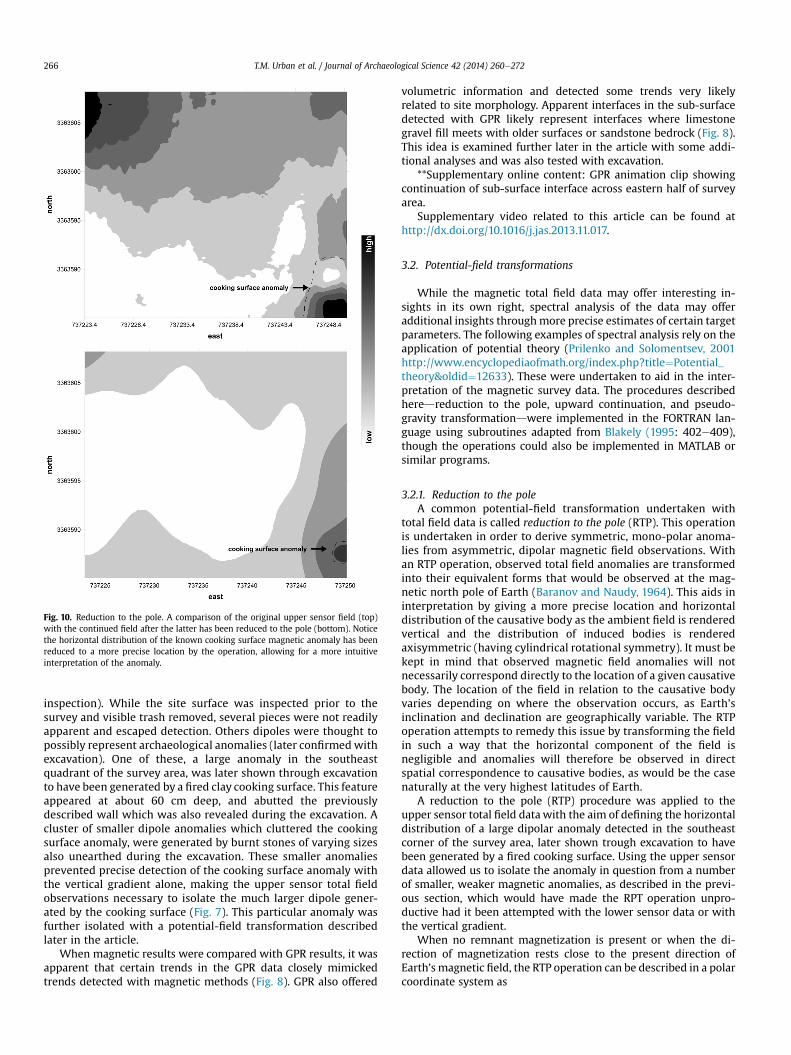
Fig. 10. Reduction to the pole. A comparison of the original upper sensor field (top)with the continued field after the latter has been reduced to the pole (bottom). Noticethe horizontal distribution of the known cooking surface magnetic anomaly has beenreduced to a more precise location by the operation, allowing for a more intuitiveinterpretation of the anomaly.
T.M. Urban et al. / Journal of Archaeological Science 42 (2014) 260e272266
inspection). While the site surface was inspected prior to thesurvey and visible trash removed, several pieces were not readilyapparent and escaped detection. Others dipoles were thought topossibly represent archaeological anomalies (later confirmedwithexcavation). One of these, a large anomaly in the southeastquadrant of the survey area, was later shown through excavationto have been generated by a fired clay cooking surface. This featureappeared at about 60 cm deep, and abutted the previouslydescribed wall which was also revealed during the excavation. Acluster of smaller dipole anomalies which cluttered the cookingsurface anomaly, were generated by burnt stones of varying sizesalso unearthed during the excavation. These smaller anomaliesprevented precise detection of the cooking surface anomaly withthe vertical gradient alone, making the upper sensor total fieldobservations necessary to isolate the much larger dipole gener-ated by the cooking surface (Fig. 7). This particular anomaly wasfurther isolated with a potential-field transformation describedlater in the article.
When magnetic results were compared with GPR results, it wasapparent that certain trends in the GPR data closely mimickedtrends detected with magnetic methods (Fig. 8). GPR also offered
volumetric information and detected some trends very likelyrelated to site morphology. Apparent interfaces in the sub-surfacedetected with GPR likely represent interfaces where limestonegravel fill meets with older surfaces or sandstone bedrock (Fig. 8).This idea is examined further later in the article with some addi-tional analyses and was also tested with excavation.
**Supplementary online content: GPR animation clip showingcontinuation of sub-surface interface across eastern half of surveyarea.
Supplementary video related to this article can be found athttp://dx.doi.org/10.1016/j.jas.2013.11.017.
3.2. Potential-field transformations
While the magnetic total field data may offer interesting in-sights in its own right, spectral analysis of the data may offeradditional insights throughmore precise estimates of certain targetparameters. The following examples of spectral analysis rely on theapplication of potential theory (Prilenko and Solomentsev, 2001http://www.encyclopediaofmath.org/index.php?title¼Potential_theory&oldid¼12633). These were undertaken to aid in the inter-pretation of the magnetic survey data. The procedures describedheredreduction to the pole, upward continuation, and pseudo-gravity transformationdwere implemented in the FORTRAN lan-guage using subroutines adapted from Blakely (1995: 402e409),though the operations could also be implemented in MATLAB orsimilar programs.
3.2.1. Reduction to the poleA common potential-field transformation undertaken with
total field data is called reduction to the pole (RTP). This operationis undertaken in order to derive symmetric, mono-polar anoma-lies from asymmetric, dipolar magnetic field observations. Withan RTP operation, observed total field anomalies are transformedinto their equivalent forms that would be observed at the mag-netic north pole of Earth (Baranov and Naudy, 1964). This aids ininterpretation by giving a more precise location and horizontaldistribution of the causative body as the ambient field is renderedvertical and the distribution of induced bodies is renderedaxisymmetric (having cylindrical rotational symmetry). It must bekept in mind that observed magnetic field anomalies will notnecessarily correspond directly to the location of a given causativebody. The location of the field in relation to the causative bodyvaries depending on where the observation occurs, as Earth’sinclination and declination are geographically variable. The RTPoperation attempts to remedy this issue by transforming the fieldin such a way that the horizontal component of the field isnegligible and anomalies will therefore be observed in directspatial correspondence to causative bodies, as would be the casenaturally at the very highest latitudes of Earth.
A reduction to the pole (RTP) procedure was applied to theupper sensor total field datawith the aim of defining the horizontaldistribution of a large dipolar anomaly detected in the southeastcorner of the survey area, later shown trough excavation to havebeen generated by a fired cooking surface. Using the upper sensordata allowed us to isolate the anomaly in question from a numberof smaller, weaker magnetic anomalies, as described in the previ-ous section, which would have made the RPT operation unpro-ductive had it been attempted with the lower sensor data or withthe vertical gradient.
When no remnant magnetization is present or when the di-rection of magnetization rests close to the present direction ofEarth’s magnetic field, the RTP operation can be described in a polarcoordinate system as

Fig. 11. A comparison of original and transformed data. The upper left shows the magnetic total field as observed at the upper sensor after diurnal and regional field removal. Theupper right shows the smoothed field after the upward continuation was implemented as a noise reduction strategy. The lower left shows the upward continued field after thereduction to the pole was implemented. The lower right shows the pseudo-gravity transformation of the upward continued field. The similarities between the RPT and pseudo-gravity operation are readily apparent.
T.M. Urban et al. / Journal of Archaeological Science 42 (2014) 260e272 267
RðqÞ ¼ 1
½sinðIÞ þ i cosðIÞcosðD� qÞ�2(1)
Where R(q) is the reduced field, I is inclination and D is declinationof Earth’s field at the location in question. A successful RTP oper-ation, means achieving singularity defined as I ¼ 0� andD� q¼�90� after the transformation. This represents the anomalyas would be observed at the magnetic north pole.
The operation in the Fourier domain can be described as
F½DTr� ¼ F½jr�F ½DT � (2)
Where F [f] denotes the Fourier transformation, T is the total fieldintensity, r is rotational potential, and j indicates the impulseresponse (a Green’s function), DT is the total field anomaly, DTr isthen the total field anomaly as it would be observed at the northpole, thus applying (2) with F [jr], as described below, yields theRTP, where
F½jr� ¼1
2m2f
With the parameters
2m ¼ bmz þ ibmxkx þ ky
jkj
and
2f ¼ bf z þ ibf xkx þ bf yky
jkj
where bm ¼ ð bmx bmy bmzÞ represents unit vectors in the direction ofmagnetization and bf ¼ ðbf xbf ybf zÞ represents unit vectors in the di-rection of the ambient field, and k is the wave number (inverselyrelated to wavelength l as k ¼ 2p/l). Which in turn,

Fig. 12. Psuedo-gravity transformation and GPR. Comparison of the pseudo-gravity field with GPR results and site topography offers supporting evidence of an erosional troughinfilled with limestone gravel in order to create a flat surface at the top of the hill.
T.M. Urban et al. / Journal of Archaeological Science 42 (2014) 260e272268
¼ jkj2a1k2x þ a2k2y þ a3kxky þ ikjkj�b1kx þ b2ky
�where
a1 ¼ bmzbf z � bmx
bf xa2 ¼ bmz
bf z � bmybf y
a3 ¼ bmybf x � bmx
bf yb1 ¼ bmx
bf z � bmzbf x
b2 ¼ bmybf z � bmz
bf yand
jkjs0
With the large magnetic dipole observed at Jabal al-Qarn, whilesome remnant magnetization is likely present, the apparentorientation of the dipole is closely aligned with the currentgeomagnetic field direction, thus making it a good candidate forRTP.
The success of the RTP operation is closely tied to the amount ofnoise in the data. For this reason, the smoothed field of the uppermagnetic sensor was used rather than the lower sensor, whichdetected many smaller anomalies that obscured the feature of in-terest (i.e. acting as noise). At low magnetic latitudes, whereinclination is small, RTP can be an unstable operation, which isgreatly exacerbated by noise in the data. In practice this is partic-ularly problematic as inclination approaches 20� or less (Li, 2008),though success of the operation at lower latitudes is also largelydependent on noise. While the inclination for the Petra region iswell above this threshold, an additional noise reduction procedure,the upward continuation, was implemented to ensure a stableresult. This procedure is described below before presenting theresults of the RTP.
3.2.2. Upward continuationThe upward continuation, another potential-field trans-
formation, was applied to the upper sensor magnetic data prior toundertaking the RTP. In order to implement the RTP operation, thesmoother field of the upper sensor was used to reduce noise (byeliminating smaller interfering sources). The additional procedureof upward continuation allowed noise to be relaxed even further.This procedure calculates a would-be observation plane above thatof the actual observations, resulting in a smoothed field that sup-presses noisy short-wave components in the data (thus acting as alow-pass filter). This procedure for a level surface to level surfacecontinuation can be described as the following two-dimensional
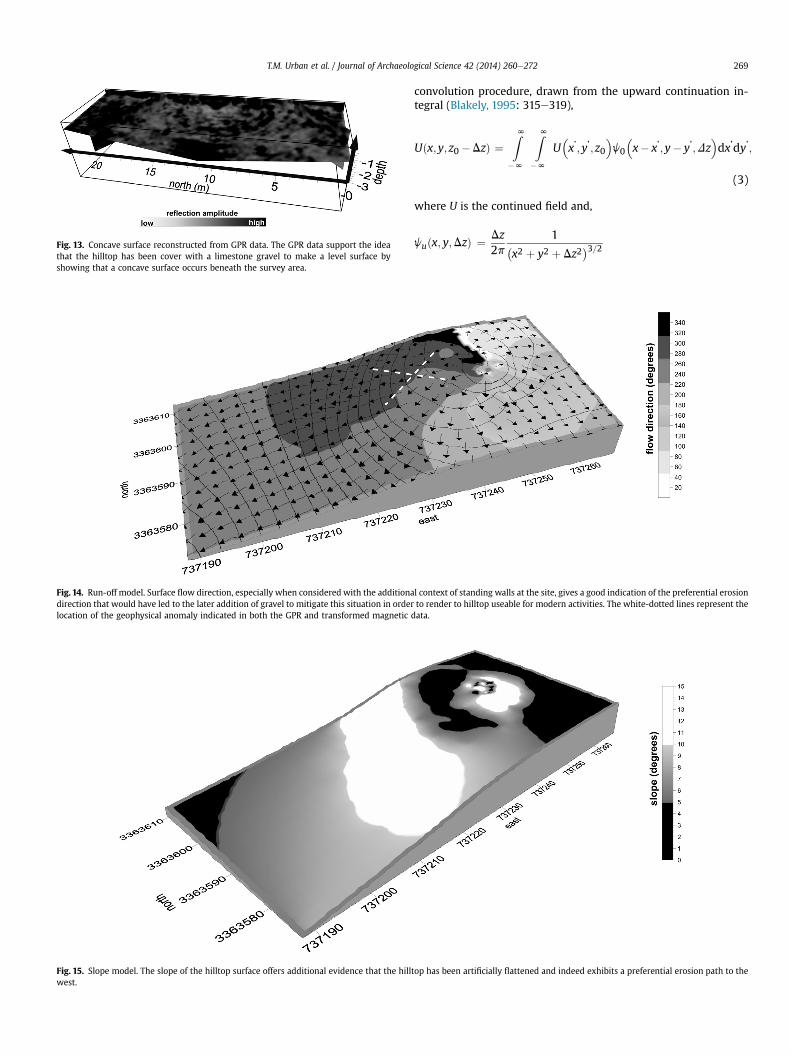
Fig. 13. Concave surface reconstructed from GPR data. The GPR data support the ideathat the hilltop has been cover with a limestone gravel to make a level surface byshowing that a concave surface occurs beneath the survey area.
Fig. 14. Run-off model. Surface flow direction, especially when considered with the additionadirection that would have led to the later addition of gravel to mitigate this situation in orderlocation of the geophysical anomaly indicated in both the GPR and transformed magnetic d
Fig. 15. Slope model. The slope of the hilltop surface offers additional evidence that the hillwest.
T.M. Urban et al. / Journal of Archaeological Science 42 (2014) 260e272 269
convolution procedure, drawn from the upward continuation in-tegral (Blakely, 1995: 315e319),
Uðx;y; z0 �DzÞ ¼ZN
�N
ZN�N
U�x’;y’;z0
�j0
�x� x’;y� y’;Dz
�dx’dy’;
(3)
where U is the continued field and,
juðx; y;DzÞ ¼ Dz2p
1�x2 þ y2 þ Dz2
�3=2
l context of standing walls at the site, gives a good indication of the preferential erosionto render to hilltop useable for modern activities. The white-dotted lines represent theata.
top has been artificially flattened and indeed exhibits a preferential erosion path to the

T.M. Urban et al. / Journal of Archaeological Science 42 (2014) 260e272270
and the procedure may also be described and implemented as aFourier convolution
FjUuj ¼ FjUjF jjuj; (4)
whereFjUuj is the Fourier transform of the upward continued field,and with the expression Fjjuj, where
juðx; y;DzÞ ¼ � 12p
v
vDz1r;
and r ¼ffiffiffiffiffiffiffiffiffiffiffiffiffiffiffiffiffiffiffiffiffiffiffiffiffiffiffiffiffiffix2 þ y2 þ Dz2
p, with the Fourier transform of the latter
being,
Fjjuj ¼ � 12p
vvDzF
�1r
�¼ v
vDze�jkjDzjkj
¼ e�Dzjkj;Dz > 0:
By simulating an elevated magnetic surface in this fashion, ananomaly of sufficient strength to be detected at the upper sensormay be examined while unobstructed by smaller, weakeranomalies, which are greatly suppressed in the continued data.The upward continuation (1 m) is compared to the original re-sidual total field anomaly in Fig. 9. In this case, it is obvious thatthe upward continuation resulted in a much smoother version ofthe total field data, thus greatly reducing noise that couldpotentially interfere with the RTP. The RTP result is shown inFig. 10, along with the original residual anomaly. It is clear in thefigure that the RTP has resulted in a precise horizontal renderingof the magnetized cooking surface anomaly in comparison to thebroadly distributed dipole observed in the original data,which encompassed areas extending up to 2 m from the causa-tive body in all directions. The anomaly footprint was reduced to1/10 of the original dipole distribution, and later through exca-vation shown to be in direct spatial correlation to the cookingsurface.
3.2.3. Pseudo-gravity transformationAn additional operation that is sometimes undertaken with
magnetic total field data is the pseudo-gravity transformation(Garland, 1951). This derivative technique is fairly common ingeologic prospecting to better estimate the edges of magneticbodies, but seldom finds use in archeology (Cheyney et al. 2011),possibly due to the limited applications of the procedure wheretypical archaeological magnetic data are concerned. The pseudo-gravity transformation takes advantage of Poisson’s relation,where the magnetic potential and gravitational potential of auniformly magnetized and dense body relate to one another byway of a directional derivative. This can be described in simpleterms as,
V ¼ �Cmg
Mrcm$VpU
¼ �Cmg
Mr gm
(5)
where V is the magnetic potential, U is the gravity potential, Mcm isthe distribution of magnetization with M representing magneticintensity and cm representing the direction of magnetization, r isdensity, gm is the component of gravity in the direction of magne-tization, Cm is the proportionality constant, g is the gravitationalconstant in SI units and p is the point of gravitational attraction(Baranov, 1957; Blakely and Simpson, 1986; Blakely, 1995). Thisestablishes the relationship between the magnetic total fieldanomaly and the gravity field.
The vertical component of the related gravity field, which is ofprimary interest here, can be described in the Fourier domain forthe pseudo-gravity transformation F [DTpsg] as
F�DTpsg
� ¼ F½DTr �F ½j� (6)
where
Fhjpsg
i¼ g
Cmjkj2m2f
r
M
and jkj s 0 with a constant ratio of density to magnetization.A pseudo-gravity transformation of the magnetic total field data
(upper sensor) from the site in question is shown in Fig. 11 forcomparisonwith previous potential-field operations. It is clear thatthe lower frequency trend from the underlying geology in relationto the thickness of anthropogenic limestone fill has been defined bythe operation. It will be obvious in comparing the resulting pseudo-gravity transformation with the previous RTP, that the two yield asimilar result, as both are phase shifting operations that transformdipolar anomalies into mono-polar anomalies. The relationshipbetween (2) and (6) can be described as
Fhjpsg
i¼ A
jkj F ½jr� (7)
Where A is a constant and all other terms are as previouslydescribed (Blakely, 1995: 345). It should be obvious from this resultthat the two operations can be used for similar purposes in manycases. It must be noted, however, that the operations have differentprerequisites for use, with RTP working best for isolated dipolesexhibiting primarily induced magnetization (or remnant magneti-zation oriented close to magnetic north) and the pseudo-gravitytransformation being suitable when magnetization and densityare expected to be fairly uniform and horizontal contrast in theseproperties with adjacent material to be instructive. Both pro-cedures are more stable in low-noise data sets. These conditions foruse do not fit the description of many archaeological magnetic datasets, however. As such, broader application is limited to situationsthat both warrant and permit productive use of the procedures.
3.2.4. Assessment of limestone fill from geophysical andtopographic data
The addition of limestone rubble as fill material seems to bevariable across the hilltop and was likely done to produce asomewhat level surface in the post-occupational (and likely mod-ern) period. Therefore the thickness of the material varies. Thelimestone rubble is a less magnetic material than the underlyingred-sandstone bedrock, which owes its coloration to the presenceof iron oxides. The limestone fill is also correspondingly less dense.This situation therefore makes a favorable condition for dis-tinguishing between the distributions of the two materials on thebasis of contrasting physical properties (magnetic and gravimetric),as was the purpose of the pseudo-gravity transformation. Webelieve that the transformation has detected the relative thicknessof the limestone rubble layer in relation to bedrock and delineatedthe boundary this deposit by contrasting it with areas where themore magnetic bedrock is close to the surface. This hypothesis issupported by the GPR results which show the same phenomena inprofile view, allowing depth estimates to be added to the sitemodel(Figs. 12 and 13). This hypothesis was also tested with excavation,which indeed revealed a deposit of limestone rubble fill in thecenter of the anomaly. The extreme western portion of the mag-netic survey area appears to exhibit a greater volume of uncon-solidated (therefore less dense, less magnetic per unit volume)

T.M. Urban et al. / Journal of Archaeological Science 42 (2014) 260e272 271
material from downhill erosion, and offers a potential explanationof why a greater amount of fill would be necessary in this area if thegoal was to create a level surface. A three-dimensional recon-struction of the area surveyed by GPR indicates a concave surfacethat is approximately 2m deep at the center (Fig.13) and exhibitingclose spatial distribution to the pseudo-gravity data, thus furthersupporting the case for limestone fill over the sandstone bed.
Terrain models of surface slope and run-off direction also sup-port the scenario just described (Figs. 14 and 15). These demon-strate that the apparent primary erosion path had to be filled with agreater amount of material in order to construct a flat surface. Thefilled feature would likely have been a wadi-like run-off drainagetrough of natural origin. This scenario likely also explains observeddistributions of down-slope artifacts that appear to have beentransported by erosional forces down to lower terraces of westernslope of the hill. These include a variety of lithics and ceramics fromthe EBA as well as some later periods. Fig. 14 demonstrates thisscenario by showing that water flows from the geophysical surveyarea primarily in awestward direction, illustrated by flow-direction3-D surface overlain with a flow net, where contour lines representhydraulic head and orthogonal vectors represent flow direction(Hermance, 1998: 59e71). The scenario further illustrated by thesurface slope model shown in Fig. 15 which indicates the extent towhich the hilltop has been flattened. Other potential flow di-rections from the geophysical survey area are largely constrainedby the existing walls, making the westward flow direction a pref-erential path. When considered from this perspective, it is possiblethat the addition of the limestone gravel, by encasing a largeportion of the site, inadvertently acted to stave off additionalerosion of the underlying archaeological deposits.
4. Conclusion
It is always useful to constrain geophysical interpretations withother observations. In this instance, ground-penetrating radar andexcavation results both support several interpretations drawn frommagnetic data. By combining two geophysical methods withexcavation, survey, and topographic trend analysis, a more com-plete understanding of this site was possible thanwould have beenwith any one method alone. The results have contributed to ourunderstanding of site morphology and preservation. Additionally,the geophysical survey has located a number of archaeologicalfeatures important to developing a complete understanding of thesite, some of which are presently inaccessible by excavation, andothers of which have already been further investigated with exca-vation. It has also been demonstrated here that quantitativeanalyses of geophysical data, such as the potential-field trans-formations carried out for this study, can sometimes offer addi-tional insights or yield information not readily apparent in initialresults when circumstance are appropriate for such analyses. It isclear from our analyses, for example, that using the vertical mag-netic gradient as the sole metric for an archaeological magneticsurvey is not always ideal. While the gradient is certainly the mostconvenient and, under a majority of circumstances, the most usefulmetric, in some instances useful information is lost when only thegradient is used. Such is the case when underlying geologic trendsmay be informative, or when it may be instructive to isolateanomalies of varying strengths, as was the case here. Indeed, withthe gradient alone, the cooking surface anomaly could not havebeen isolated from shallow noise and important information aboutsite morphology in relation to modern use would not have beeneasily obtained. Finally, the results presented here demonstrate thepotential for the broader application of geophysical methods inhinterland of Petra for the study of the full occupational history ofthe region.
Acknowledgments
We thank the Department of Antiquities and the HashemiteKingdom of Jordan, as well as Dr. Imad Hijazeen, Tahani al-Salhi,our local DOA representative Akram Atoom and Talal Amarin. Wealso thank the Curtiss T. and Mary G. Brennan Foundation, theASOR Platt Fellowship, the Joukowsky Institute for Archaeologyand the Ancient World at Brown University, and the WeidenfeldResearch Fellowship for their generous support. Finally, wethank Susan Herringer, Jana Falkenberg, Milena Zafirova, Alex R.Knodell, Felipe A. Rojas, Michelle L. Berenfeld, and Gary O. Roll-efson for their contributions and advice on various stages of thiswork, and two anonymous reviewers who improved thismanuscript.
Appendix A. Supplementary data
Supplementary data related to this article can be found at http://dx.doi.org/10.1016/j.jas.2013.11.017.
References
Annan, J.P., 2004. Ground Penetrating Radar: Principles, Procedures and Applica-tions. Sensors and Software Inc, Ontario.
Aspinall, A., Gaffney, C., Schmidt, A., 2008. Magnetometry for Archaeologists.Altamira Press, Lanham, MD.
Baranov, V., 1957. A new method for interpretation of aeromagnetic maps: pseudo-gravimetric anomalies. Geophysics 22, 359e383.
Baranov, W., 1975. Potential Fields and Their Transformations in AppliedGeophysics. Gerbruder Borntreger, Berlin.
Baranov, V., Naudy, H., 1964. Numerical calculation of the formula of reduction tothe magnetic pole. Geophysics 29, 67e79.
Blakely, R.J., 1995. Potential Theory in Gravity & Magnetic Applications. CambridgeUniversity Press, New York.
Blakely, R.J., Simpson, R.W., 1986. Approximating edges of source bodies frommagnetic or gravity anomalies. Geophysics 51, 1494e1498.
Burger, H.R., Sheehan, A.F., Jones, C.H., 2006. Introduction to Applied Geophysics:Exploring the Shallow Subsurface. W.W. Norton & Co, New York, London.
Cheyney, S., Hill, I., Linford, N., 2011. Advantages to using the pseudogravitytransformation to aid edge detection of total field archaeomagnetic datasets.Archaeol. Prospect. 18, 81e93.
Conyers, L.B., 2013. Ground-penetrating Radar for Archaeology, third ed. AltamiraPress, Lanham, MD.
Conyers, L.B., Ernenwein, E.G., Bedal, L.A., 2002. Ground penetrating radar discoveryat Petra, Jordan. Antiquity 76, 339e340.
Daniels, D.J., 2004. Ground Penetrating Radar, second ed. The Institute of ElectricalEngineers, London, U. K.
Garland, G.D., 1951. Combined analysis of gravity and magnetic anomalies.Geophysics 16, 51e62.
Goodman, D., Piro, S., 2013. GPR Remote Sensing in Archaeology. In: Geo-technologies and the Environment, vol. 9. Springer Science, NY.
Hammond, P.C., 1973. Magnetometer/resistivity survey at Petra, Jordan. Bull. Am.Schools Orient. Res. 214, 39e41.
Hermance, J.F., 1998. A Mathematical Primer on Groundwater Flow: An Introductionto the Mathematical and Physical Concepts of Saturated Flow in the Subsurface.Prentice Hall, NJ.
International Association of Geomagnetism and Aeronomy, Working Group V-MOD,Participating Members, Finlay, C.C., Maus, S., Beggan, C.D., Bondar, T.N.,Chambodut, A., Chernova, T.A., Chulliat, A., Golovkov, V.P., Hamilton, B.,Hamoudi, M., Holme, R., Hulot, G., Kuang, W., Langlais, B., Lesur, V., Lowes, F.J.,Lühr, H., Macmillan, S., Mandea, M., McLean, S., Manoj, C., Menvielle, M.,Michaelis, I., Olsen, N., Rauberg, J., Rother, M., Sabaka, T.J., Tangborn, A., Tøffner-Clausen, L., Thébault, E., Thomson, A.W.P., Wardinski, I., Wei, Z., Zvereva, T.I.,2010. International geomagnetic reference field: the eleventh generation.Geophys. J. Int. 183, 1216e1230.
Jol, H.M. (Ed.), 2009. Ground Penetrating Radar (GPR) Theory and Applications.Elsevier Science, Amsterdam.
Kearey, P., Brooks, M., Hill, I., 2002. An Introduction to Geophysical Exploration,third ed. Blackwell Science, London, UK.
Li, Xiong, 2008. Magnetic reduction-to-the-pole at low latitudes: observations andconsiderations. Lead. Edge, 990e1002. August.
Lindner, M., Genz, H., 2000. Five Early Bronze Age sites north of Petra (Jordan)Discovered in 1993-1997. In: Bienert, H.D., Muller-Neuhof, B. (Eds.), At theCrossroads: Essays on the Archaeology, History and Current Affairs of theMiddle East. German Protestant Institute of Archaeology in Amman.
Lindner, M., Hübner, U., Genz, H., 2001. Early Bronze Age settlement on UmmSaysaban north of Petra (Jordan) and its topographical context: report on 1998/1999 Survey. Ann. Dep. Antiq. Jordan 45, 287e310.

T.M. Urban et al. / Journal of Archaeological Science 42 (2014) 260e272272
Milevski, I., Braun, E., Varga, D., Israel, Y., 2012. A newly-discovered Early Bronze Agesettlement and silo complex at Amaziya, Israel. Antiquity 086, 331.
Philip, G., 2008. The Early Bronze Age I-III. In: Adams, R. (Ed.), Jordan: An Archae-ological Reader. Equinox.
Prilenko, A.I., Solomentsev, E.D., 2001. Potential theory. Hazewinkel, Michiel,Encyclopedia of Mathematics. Springer, NY.
Rowan, Y.M., Urban, T.M., Kersel, M., 2012. Recent ground penetrating radar dis-coveries at Marj Rabba, Israel. Antiquity 86, 334.
Silliman, S.W., Farnsworth, P., Lightfoot, K.G., 2000. Magnetometer prospecting inhistorical archaeology: evaluating survey options at a 19th century Rancho sitein California. Hist. Archaeol. 34 (2), 89e109.
Urban, T.M., Alcock, S., Tuttle, C., 2012. Virtual discoveries at a wonder of the world:geophysical investigations and ancient plumbing at Petra, Jordan. Antiquity 85, 331.
Urban, T.M., Bocancea, E., Vella, C., Herringer, S., Tuttle, C., Alcock, S., 2013a.Investigating ancient dams in Petra’s northern hinterland with ground-penetrating radar. Lead. Edge 32, 258e260.
Urban, T.M., Leon, J.F., Manning, S.W., Fisher, K.D., Kearns, C.M., Gerard-Little, P.A.,2013b. Ground-penetrating radar investigations at Kalavasos Ayios-Dhimitriosoffer a new look at Late Bronze Age Cyprus. Antiquity 87, 338.
Vella, C., Urban, T.M., Bocancea, E., Tuttle, C., Alcock, S., 2012. Discovery of an EarlyBronze Age settlement at Jabal al-Qarn near Petra, Jordan. Antiquity 86, 334.
Witten, A.J., Levy, T.E., Adams, R.B., Won, I.J., 2000. Geophysical surveys in JebelHamrat Fidan, Jordan. Geoarchaeology 15, 135e150.
Witten, A.J., Calvert, G., Witten, B., Levy, T.E., 2003. Magnetic and electromagneticinduction studies at archaeological sites in southwestern Jordan. J. Environ. Eng.Geophys. 8, 209e215.