A genomic-library based discovery of a novel, possibly synthetic, acid-tolerance mechanism in...
27
A genomic-library based discovery of a novel, possibly synthetic, acid-tolerance mechanismin Clostridium acetobutylicum involving non-coding RNAs and ribosomal RNA processing Jacob R. Borden 1,2,† , Shawn W. Jones 1,3,† , Dinesh Indurthi 3 , Yili Chen 3 , and Eleftherios Terry Papoutsakis 1,3,* 1 Department of Chemical and Biological Engineering, Northwestern University, Evanston, IL 60208, USA. 3 Department of Chemical Engineering & Delaware Biotechnology Institute, University of Delaware, 15 Innovation Way, Newark, DE 19711, USA Abstract We generated a genomic library from sheared Clostridium acetobutylicum 824 DNA, whereby inserts can be expressed in both directions from the thiolase promoter, P thl . Serial transfer of library-bearing C. acetobutylicum cultures exposed to increasing butyrate concentrations enriched for inserts containing fragments of rRNA genetic loci. The selected library inserts were placed so that antisense (to the rRNAs) non-coding RNAs (ncRNAs) would be transcribed from P thl . Different enriched inserts imparted similar butyrate-tolerance characteristics. A minimal tolerance fragment (RDNA7) was identified as the 16S-rRNA promoter region. Expressed on plasmid pRD7 off P thl , RDNA7 can produce putative ncRNAs termed ncRNA RD7 . C. acetobutylicum 824(pRD7) showed superior resistance to butyrate and other carboxylic acids. Transcriptional analysis of butyrate stress identified 120 differentially expressed genes between 824(pRD7) and 824(pSOS95del). The few upregulated genes included the ffh gene of the putative signal recognition particle (SRP) system. Northern analysis of ncRNA RD7 and corresponding antisense RNAs demonstrated multiple ncRNA RD7 molecules in 824(pRD7). Several corresponding antisense RNA molecules were identified both in 824(pRD7) and 824(pSOS95del), but at much higher levels in 824(pRD7). Northern analysis of 16S rRNA expression suggested complex RDNA7-dependent rRNA processing. Our data suggest that by hybridizing against unprocessed rRNA precursors, ncRNA RD7 alters rRNA processing, and these alterations result in acid tolerance, possibly through a mechanism involving the Ffh protein. © 2009 Elsevier Inc. All rights reserved. * To whom correspondence should be addressed at: Delaware Biotechnology Institute, University of Delaware, 15 Innovation Way, Newark, DE 19711, USA. Phone: (302) 831-8376; Fax: (302) 831-4841. [email protected]. 2 Current address: BP America, Naperville, IL, USA. † The authors wish it to be known that, in their opinion, the first two authors should be regarded as joint First Authors. Publisher's Disclaimer: This is a PDF file of an unedited manuscript that has been accepted for publication. As a service to our customers we are providing this early version of the manuscript. The manuscript will undergo copyediting, typesetting, and review of the resulting proof before it is published in its final citable form. Please note that during the production process errors may be discovered which could affect the content, and all legal disclaimers that apply to the journal pertain. NIH Public Access Author Manuscript Metab Eng. Author manuscript; available in PMC 2011 May 1. Published in final edited form as: Metab Eng. 2010 May ; 12(3): 268–281. doi:10.1016/j.ymben.2009.12.004. NIH-PA Author Manuscript NIH-PA Author Manuscript NIH-PA Author Manuscript
-
Upload
independent -
Category
Documents
-
view
2 -
download
0
Transcript of A genomic-library based discovery of a novel, possibly synthetic, acid-tolerance mechanism in...

A genomic-library based discovery of a novel, possiblysynthetic, acid-tolerance mechanismin Clostridiumacetobutylicum involving non-coding RNAs and ribosomal RNAprocessing
Jacob R. Borden1,2,†, Shawn W. Jones1,3,†, Dinesh Indurthi3, Yili Chen3, and EleftheriosTerry Papoutsakis1,3,*1 Department of Chemical and Biological Engineering, Northwestern University, Evanston, IL60208, USA.3 Department of Chemical Engineering & Delaware Biotechnology Institute, University ofDelaware, 15 Innovation Way, Newark, DE 19711, USA
AbstractWe generated a genomic library from sheared Clostridium acetobutylicum 824 DNA, wherebyinserts can be expressed in both directions from the thiolase promoter, Pthl. Serial transfer oflibrary-bearing C. acetobutylicum cultures exposed to increasing butyrate concentrations enrichedfor inserts containing fragments of rRNA genetic loci. The selected library inserts were placed sothat antisense (to the rRNAs) non-coding RNAs (ncRNAs) would be transcribed from Pthl.Different enriched inserts imparted similar butyrate-tolerance characteristics. A minimal tolerancefragment (RDNA7) was identified as the 16S-rRNA promoter region. Expressed on plasmid pRD7off Pthl, RDNA7 can produce putative ncRNAs termed ncRNARD7. C. acetobutylicum 824(pRD7)showed superior resistance to butyrate and other carboxylic acids. Transcriptional analysis ofbutyrate stress identified 120 differentially expressed genes between 824(pRD7) and824(pSOS95del). The few upregulated genes included the ffh gene of the putative signalrecognition particle (SRP) system. Northern analysis of ncRNARD7 and corresponding antisenseRNAs demonstrated multiple ncRNARD7 molecules in 824(pRD7). Several correspondingantisense RNA molecules were identified both in 824(pRD7) and 824(pSOS95del), but at muchhigher levels in 824(pRD7). Northern analysis of 16S rRNA expression suggested complexRDNA7-dependent rRNA processing. Our data suggest that by hybridizing against unprocessedrRNA precursors, ncRNARD7 alters rRNA processing, and these alterations result in acidtolerance, possibly through a mechanism involving the Ffh protein.
© 2009 Elsevier Inc. All rights reserved.* To whom correspondence should be addressed at: Delaware Biotechnology Institute, University of Delaware, 15 Innovation Way,Newark, DE 19711, USA. Phone: (302) 831-8376; Fax: (302) 831-4841. [email protected] address: BP America, Naperville, IL, USA.†The authors wish it to be known that, in their opinion, the first two authors should be regarded as joint First Authors.Publisher's Disclaimer: This is a PDF file of an unedited manuscript that has been accepted for publication. As a service to ourcustomers we are providing this early version of the manuscript. The manuscript will undergo copyediting, typesetting, and review ofthe resulting proof before it is published in its final citable form. Please note that during the production process errors may bediscovered which could affect the content, and all legal disclaimers that apply to the journal pertain.
NIH Public AccessAuthor ManuscriptMetab Eng. Author manuscript; available in PMC 2011 May 1.
Published in final edited form as:Metab Eng. 2010 May ; 12(3): 268–281. doi:10.1016/j.ymben.2009.12.004.
NIH
-PA Author Manuscript
NIH
-PA Author Manuscript
NIH
-PA Author Manuscript

Keywordsgenomic library; rRNA processing; non-coding RNA; acid tolerance; synthetic phenotype; ffh;signal recognition particle; sense and antisense libraries
INTRODUCTIONFor fermentative bacteria, such as Clostridium acetobutylicum, substrate-levelphosphorylation leading to acid production is the primary means of ATP generation. Acidaccumulation during active growth is toxic to cells (Papoutsakis et al., 1987; Russell, 1992;Warnecke and Gill, 2005). Although clostridia are generally viewed as acid tolerant,accumulation of acetate and butyrate lowers the culture pH leading either to a genetic switchto solvent production in solventogenic clostridia (e.g., C. acetobutylicum ATCC 824, C.beijerinkii, and C. cellulolyticum) (Paredes et al., 2005; Zhao et al., 2005) or cessation ofmetabolism in non-solventogenic clostridia (C. acetobutylicum M5, C. butyricum, and C.tyrobutyricum). Undissociated organic-acid metabolites diffuse freely across the cellmembrane and affect cellular physiology through both free proton and anion interactions(Herrero et al., 1985; Kell et al., 1981; Papoutsakis et al., 1987; Russell, 1992; Russell andDiez-Gonzalez, 1998; Walter and Gutknecht, 1984; Warnecke and Gill, 2005). Excess freeprotons tend to dissipate the membrane proton gradient, while also potentially impactingpurine bases of DNA (Russell, 1992; Russell and Diez-Gonzalez, 1998). Thus, short-chainfatty acids like acetate and butyrate have an antibacterial activity, which likely plays a rolein the health of the low-pH human gut environment by protecting the growth of pathogens;however, bacteria that adapt to high concentrations of these acids may have an advantage inpathogenesis (Russell and Diez-Gonzalez, 1998). In the context of bioprocessing for theproduction of chemicals and biofuels such as butyrate and butanol, development of acid-tolerant strains is essential for achieving higher cell densities and growth (Papoutsakis,2008).
A major genetic system contributing to acid tolerance characterized in such diverseorganisms as E. coli, C. perfringens, Chlamydia pneumoniae, and Salmonella enterica(Foster, 2004) involves the decarboxylation of the amino acids glutamate and arginine.Amino acid decarboxylation results in CO2 production, proton consumption, and generationof either γ-amino butyric acid (GABA) or agmatine (by decarboxylation of glutamate andarginine, respectively) which are exchanged by an antiporter for glutamate or arginine,respectively (Foster, 2004; Richard and Foster, 2004). Therefore decarboxylation coupledwith antiport of the decarboxylation products for additional amino acid reactants results in anet efflux of cytoplasmic protons and an increase in cytoplasmic pH. The genes involvedinclude gadA, gadB, and gadC, which code for two decarboxylation isozymes and thecognate glutamate/GABA antiporter, respectively, and adiA and adiC which code for anarginine decarboxylase and arginine/agmative antiporter, respectively (Foster, 2004).Although no such decarboxylase/antiporter system has yet been characterized in C.acetobutylicum, the gene CAC3285 shows 44% sequence identity with the E. coli genegadC, while several C. acetobutylicum genes show some homology to adiA (CAC0297[18% identity] and CAC2338 [19% identity]) and adiC (CAC0727 [22% identity],CAC0852 [20% identity], CAC2719 [20% identity], CAC3164 [21% identity], andCAC3347 [22% identity]).
An emerging mechanism of acid tolerance has been investigated in Streptococcus mutans(Gutierrez et al., 1999; Kremer et al., 2001), and involves the fifty-four homologue (Ffh)protein, a GTPase. Loss of Ffh activity results in loss of acid tolerance (Kremer et al., 2001).Ffh is part of the prokaryotic counterpart to the well-studied mammalian system of signal
Borden et al. Page 2
Metab Eng. Author manuscript; available in PMC 2011 May 1.
NIH
-PA Author Manuscript
NIH
-PA Author Manuscript
NIH
-PA Author Manuscript

recognition particle (SRP), which is responsible for the cotranslational membrane targetingof signal-peptide-bearing secretory and membrane proteins to the plasma membrane. Ineubacteria, the SRP ribonucleotide–protein complex is composed of a small cytoplasmicRNA (scRNA) and Ffh. SRP functions by direct interaction with the ribosome, although theprecise mechanism of this apparently complex interaction is not well known (Gu et al.,2005; Rinke-Appel et al., 2002).
Previously, our lab was able to identify multiple gene fragments from a genomic library(pLib1) that confer improved tolerance to 1-butanol (Borden and Papoutsakis, 2007). Here,we wanted to examine the hypothesis that a similar approach might be useful in identifyinggenomic loci conferring tolerance to butyrate. In addition to discovering potentially newmechanisms of acid tolerance, genetic loci that confer increased acid tolerance areanticipated to be beneficial for the construction of strains with robust acid-tolerancecharacteristics that could benefit strain productivity and metabolite titers. Two features ofthe pLib1 library used in the butanol-tolerance study (Borden and Papoutsakis, 2007) mayhave potentially limited the diversity of library inserts capable of contributing to a tolerantphenotype. First, the genomic library inserts preferentially taken up upon electroporation ofC. acetobutylicum were smaller than the average gene size. Second, the pIMP1 cloningvector used to generate the pLib1 library did not contain a strong constitutive-like promoterand terminator flanking the insert site, which would have ensured transcription of allgenomic library inserts. In this work, we sought to fix these two potential librarydeficiencies. An additional advantage of the new library constructed is that it can select forDNA fragments that might downregulate gene expression by antisense or non-coding RNAtype of mechanisms. Using this library, we identified and examined genetic fragments thatresulted from serial enrichment of the genomic library-bearing C. acetobutylicum culturesagainst increasing butyrate concentrations. All enriched fragments contained some portionof one of the ribosomal RNA-gene clusters, all in an antisense orientation relative to theconstitutive plasmid promoter. Furthermore, a minimal insert region was identified as thepromoter region upstream of the 16S ribosomal gene, also in the antisense orientationrelative to the strong promoter.
MATERIALS AND METHODSBacterial strains and plasmids
TOP10 chemically competent E. coli (Invitrogen Corp., Carlsbad, CA) were used for routinecloning and library generation. The wildtype (WT) strain Clostridium acetobutylicum ATCC824 was used in this study. Prior to electroporation of C. acetobutylicum, plasmid DNA wasmethylated in E. coli ER2275(pAN1) to prevent restriction by a membrane-boundendonuclease (Mermelstein and Papoutsakis, 1993).
The pSOS95 plasmid, which contains the thiolase promoter and a rho-independentterminator (Supplementary Fig. 1), was modified for use as a destination vector in theGateway Recombination system (Invitrogen Corp.). First, pSOS95 was digested sequentiallywith BamHI and then KasI (New England Biolabs, Ipswich, MA) per manufacturer'srecommendations to remove the ctfA-ctfB-adc gene cassette. The ~5 kb fragment containingthe Gram-positive and Gram-negative replication origins, MLS and ampicillin resistancemarkers, the thiolase promoter (Pthl) and rho-independent terminator was gel-excised, wasblunt-ended using Klenow Fragment (New England Biolabs) and dephosphorylated withCalf Intestinal Phosphotase (CIP – New England Biolabs). Finally, the blunt-ended fragmentwas ligated to the Gateway ® Reading Frame Cassette A (RfA) using the Quick Ligase Kit(New England Biolabs) and transformed into TOP10 E. coli. Individual clones ofpSOS_ENT and pSOS_ENT_REV (differing in the direction of the Reading Frame Cassette,and therefore the direction of a library insert upon recombination) were selected and the
Borden et al. Page 3
Metab Eng. Author manuscript; available in PMC 2011 May 1.
NIH
-PA Author Manuscript
NIH
-PA Author Manuscript
NIH
-PA Author Manuscript

direction of the RfA cassette was confirmed by sequencing as well as restriction digestanalysis.
Microbial culturesE. coli cultures were grown aerobically at 37°C in liquid Luria-Bertani (LB) media or solidLB agar plates, supplemented with ampicillin (100 μg/ml), spectinomycin (100 μg/ml), orchloramphenicol (35 μg/ml), as necessary. C. acetobutylicum was revived from −85°Cstorage by plating on 2xYTG (pH 5.8) solid media under anaerobic conditions at 37°C.Individual colonies at least 5 days old were transferred to 10 mL tubes of liquid CGM(Wiesenborn et al., 1988) buffered with 30 mM acetate and adjusted to pH 7.0, and heatshocked at 70-80°C for 10 min to induce germination. Recombinant strains weresupplemented with erythromycin as necessary (40 μg/ml for plates and 100 μg/ml for liquidcultures).
Analytical methodsCell growth was monitored by A600 using a Thermo Spectronic (Rochester, N.Y.) Biomate3spectrophotometer. Supernatant samples from C. acetobutylicum cultures were analyzed forglucose, acetate, butyrate, acetoin, ethanol, acetone, and butanol using a Waters (Milford,MA) HPLC (Tomas et al., 2003b). DNA concentration and purity were measured at 260 and280 nm, respectively, using a NanoDrop Spectrophotometer (NanoDrop Technologies,Wilmington, DE).
DNA and RNA isolationPlasmid DNA was isolated from E. coli using Hurricane plasmid mini and maxi-prep kits(Gerard Biotech, Oxford, OH). Isolation of genomic and plasmid DNA from C.acetobutylicum strains were carried out as described (Harris et al., 2002). Sampling andisolation of C. acetobutylicum RNA for Northern and microarray analysis have beenpreviously described (Tomas et al., 2003a). RNA used for Q-RT-PCR was processeddifferently. Instead of adding 500 μL of isopropanol to the aqueous phase from the TRIzoland chloroform separation, 500 μL of RNase-free 70% ethanol was added to the aqueousphase and mixed by vortexing. This solution was then purified using the miRNeasy Mini Kit(Qiagen, Valencia, CA) following the manufacturer's instructions, including the optionalDNase treatment steps.
Genomic library generationC. acetobutylicum genomic DNA was fragmented by sonication using a Branson Sonifier150 (Branson Ultrasonics, Danbury, CT) at a power setting of 7 to generate an averagefragment size of ~3 kb. Sonicated DNA was size-selected on a 0.7% agarose gel to includeonly fragments larger than 2 kb and smaller than 5 kb and purified using a Qiagen gel-purification column (Qiagen, Valencia, CA). One microgram of size-selected DNA was thenblunt-ended by combining it with 1 μL of T4 DNA Polymerase (New England Biolabs,Ipswich, MA), 5 μL of 100 μg/mL BSA, 5 μl of New England Biolabs Buffer #2 (100 mMTris-HCl, 100 mM MgCl2, 500mM NaCl), and 1 μL of 10 mM dNTPs in 50 μl total volumeand incubating for 2 h at 12°C. T4 DNA polymerase was next deactivated by incubating at75°C for 20 minutes, and the blunt-ended DNA was dephosphorylated by addition of 0.5 μLof CIP (New England Biolabs) directly to the blunt-ending reaction mixture followed byincubation for 1 hour at 37°C. Size-selected, blunt-ended, dephosphorylated DNA was thenpurified using a Qiagen purification column, and finally single-A overhangs were added tothe purified DNA by incubation with 1 uL of Taq Polymerase (New England Biolabs), 6 μlof New England Biolabs Standard Taq Polymerase Buffer (100 mM Tris-HCl, 500 mM KCl,15 mM MgCl2) and 1 μL of 10 mM dNTPs for 30 minutes at 72°C. Finally, DNA with
Borden et al. Page 4
Metab Eng. Author manuscript; available in PMC 2011 May 1.
NIH
-PA Author Manuscript
NIH
-PA Author Manuscript
NIH
-PA Author Manuscript

single-A overhangs was reacted with TOPO vector pCR8/GW/TOPO (Invitrogen) asrecommended by the manufacturer, and ten TOP10 E. coli aliquots (Invitrogen) weretransformed with 2 μL of the TOPO-isomerization reaction. After the 1 h outgrowth periodrecommended by the manufacturer, the 10 transformation reactions were combined into 250mL of LB containing 100 μg/mL of spectinomycin and incubated for 8 hours at 37°C.Representative plates streaked with 100 μL of the pooled transformation mixtures indicatedapproximately 78,000 total insert-bearing library colonies. The number of colonies (N)required to ensure a coverage probability (P) is based on the fraction (f) of the insert sizerelative to the entire genome (Clarke and Carbon, 1976) and is N= ln(1-P)/ln(1-f). For aconservative average of 2 kb inserts, the low end of the 2 – 5 kb range of DNA fragmentsused, the number of clones for 99% coverage is:
Thus, the 78k clones obtained in the initial library give > 8-fold coverage.
TOPO-based library plasmids were isolated using a Hurricane mini-prep kit (GerardBiotech), and the genomic inserts were transferred into the clostridia entry vectorspSOS_ENT and pSOS_ENT_REV using the Gateway Recombination System (Invitrogen)according the manufacturer's recommendations. Each insert can go in either of the twodestination vectors randomly, so one vector should have sufficed for both sense and anti-sense orientation/expression off the Pthl promoter of all possible library inserts.Nevertheless, just in case there is any bias as to of the full representation of the wholegenome in both the sense and anti-sense orientation and on similar size fragments, wedecided to use both destination vectors. This is why the libraries from the two destinationvectors were combined to generate an even larger coverage of the whole genome in bothorientation if all inserts could be expressed off the Pthl promoter. As before, ten TOP10 E.coli aliquots were transformed with 2 μL of the recombination reaction, combined into 250mL of LB containing 250 μg/mL ampicillin, and grown for 8 hours before sampling forminipreps and frozen stocks. Representative plates indicate approximately 80,000 and34,000 genomic inserts were recombined into the pSOS_ENT and pSOS_ENT_REVvectors, respectively, generating the pLib2thl genomic library. The number of clonesobtained (the 80,000 and 34,000 genomic inserts for each vector) are >8.5 and >3.7 foldhigher, respectively, than what is needed to provide genome coverage with 99% probability.Thus, the difference in the number of inserts between the two libraries is not very importantsince each contains sufficient genomic DNA to screen the entire genome. The combinedlibrary then provides a very large coverage of the genome in both orientations.
Serial enrichment of library culturesSerial enrichment of C. acetobutylicum 824(pLib2thl) cultures against increasing butyrateconcentrations was performed as described previously for library enrichment with 1-butanol(Borden and Papoutsakis, 2007). Electroporation of C. acetobutylicum with methylatedpLib2thl yielded ~3.2×10⁵ total transformants, which were grown to an A600 of 0.6, and 50μL frozen stock aliquots were prepared using CGM containing 15% glycerol. To initiate aserial-enrichment experiment, two frozen-stock aliquots were thawed and used to inoculate10 mL tubes of CGM, grown to mid-exponential growth phase (A600 of 0.6), and used toinoculate 50 mL flasks containing CGM, 100 ug/mL erythromycin, and 0.6% (v/v) butyricacid. The butyric-acid solution was adjusted to pH 6.7 with 10 M NaOH prior to challenge.Serial transfers were then conducted into media containing increasing butyrateconcentrations, with transfers approximately every 24 hours using a 5 mL inoculum into
Borden et al. Page 5
Metab Eng. Author manuscript; available in PMC 2011 May 1.
NIH
-PA Author Manuscript
NIH
-PA Author Manuscript
NIH
-PA Author Manuscript

each fresh challenge flask. Plasmid library samples were collected from each challenge flaskfor identification of enriched genomic library inserts.
Growth inhibition and acid tolerance assaysGrowth inhibition by butyrate was determined as described (Borden and Papoutsakis, 2007).Briefly, 400 mL of CGM with 100 μg/mL clarithromycin were grown to an A600 of 1.0, induplicate for each strain tested. Ten mL of culture was then aliquoted into individual testtubes containing butyrate (pH~6.7) to generate a final concentration of 0 to 2% (v/v)butyrate, with four independent test tubes per challenge level (i.e., four technical replicatesfor each of two biological replicates per strain). Challenge tubes were sampled for growth(A600) after 12 hours of incubation, and replicate values averaged at each challenge level.
Tolerance of a recombinant strain to acetic, lactic, butyric, and isovaleric acid was alsomeasured in a similar method. Briefly, 800 mL of CGM with 100 μg/mL clarithromycinwere grown to an A600 of 1.0, in duplicate for each strain tested. Ten mL of culture wasaliquoted into individual test tubes containing pH-adjusted acid (pH of 5.3, 5.0, 6.7, and 6.7for acetic, lactic, butyric, and isovaleric acid, respectively) to generate final concentrations,with two independent test tubes per challenge level. The pH values were chosen in order tomaintain approximately the same molar ratio of protonated / unprotonated acid as in theoriginal butyrate enrichment experiments. After 12 and 24 hours of incubation in challengedmedia, all tubes were sampled for growth (A600) and metabolite analysis by HPLC, andreplicate values averaged at each challenge level. For lactic acid, a racemic mixture of bothL-(+)-lactic acid and D-(–)-lactic acid was used because it has previously been found thatboth are present for C. acetobutylicum (Meyer et al., 1986).
Tolerance to butyric acid was also tested after preconditioning in butyrate in a similargrowth assay. Briefly, 220 mL of CGM with 100 μg/mL clarithromycin and 0.6% (v/v)butyrate (pH 6.7) were grown to an A600 of 1.0, in duplicate for each strain. Ten mL ofculture was then aliquoted into individual test tubes containing additional butyrate (pH 6.7)to raise the final level of butyrate to the desired amount, namely 0.7%, 0.9%, 1.0%, 1.1%,1.2%, 1.4%, and 1.65%, with three independent test tubes for each biological replicate. A600measurements were taken 12, 24, and 48 hrs after aliquoting into the test tubes, and at 48hrs, supernatants were collected and used for HPLC analysis.
Quantitative (real-time) reverse transcription PCR (Q-RT-PCR)Reverse transcription of 2 μg of purified total RNA was carried out using the High CapacitycDNA Reverse Transcription Kit (Applied Biosystems, Foster City, CA) following themanufacturer's instructions. After reverse transcription, 80 μL of RNase-free H2O was addedto the reactions to give a cDNA concentration of 20 ng/μL. Each PCR reaction contained 1μL of cDNA, 1 μM of each primer, and the Power SYBR® Green PCR Master Mix(Applied Biosystems) in a total volume of 25 μL. Reactions for each sample were performedon an iCycler Thermal Cycler (Bio-Rad, Hercules, CA) using the iQ5 Real-Time PCRDetection System (Bio-Rad) and the following parameters: 2 min incubation at 50°C, 10min incubation at 95°C, forty cycles of 15 sec at 95°C and 1 min at 60°C. A melt curve wasconstructed after the 40 cycles by starting at 55°C and increasing the temperature 0.5°Cevery 10 sec until 95°C. CAC3571 was used as the housekeeping gene, and the primersequences used are in Supplementary Table 1.
Northern analysisSingle stranded γ-32P end labeled oligo (ssOligo) probes were used for probing senseRDNA7, anti-sense RDNA7, and 16S RNA transcripts. Oligo sequences used are listed inSupplementary Table 1. Ten pmol of ssOligo probes were end labeled with γ-32P (7,000 Ci/
Borden et al. Page 6
Metab Eng. Author manuscript; available in PMC 2011 May 1.
NIH
-PA Author Manuscript
NIH
-PA Author Manuscript
NIH
-PA Author Manuscript

mmol; MP Biomedicals, Solon, OH) using OptiKinase™ Kit (USB, Cleveland, OH)following the manufacturer's instructions. Unincorporated radio nucleotides were removedusing Micro Bio-Spin 30 columns (Bio-Rad, Hercules, CA). In each lane for the Northernblot, 20 μg of total RNA were loaded and electrophoretically resolved on a 1.5% denaturingMOPS-agarose gel. A Millennium™ Marker (0.5-9 kb) (Ambion, Austin, TX) and anotherRNA marker (0.1-1 kb) (USB, Cleveland, OH) were used as size standards. Pre-hybridization, hybridization and washing were all carried out at 42°C. Positively chargednylon membranes (Roche Applied Science, Indianapolis, IN) were pre-hybridized for 2 hrswith ULTRAhyb®-Oligo Hybridization Buffers (Ambion). Membranes were hybridized inthe same buffer as used for pre-hybridization for 16-20 hrs. Membranes were washed twicewith 2× SSC, 0.5% SDS for 15 min. Membranes were exposed on to a phosphor screen andimaged using a phosphor imager (GE Healthcare, Piscataway, NJ).
Transcriptional analysis using DNA microarraysDesign and validation of the Agilent-platform (Agilent Technologies, Santa Clara, CA)based C. acetobutylicum oligonucleotide microarrays employed in this study have beendescribed (Paredes et al., 2007). Within one week of RNA purification, fluorescently labeledcDNA was generated by random hexamer-primed reverse transcription in the presence ofamino-allyl (aa) dUTP (Sigma-Aldrich Corp., St. Louis, MO) using SuperScript II(Invitrogen Corp., Carlsbad, CA) reverse transcriptase as described (Alsaker et al., 2005).Labeled DNA was quantified by measuring A260, and dye incorporation estimated bymeasuring A549 and A650 for Cy3 and Cy5, respectively. Agilent 22K arrays (GEOaccession # GPL4412) were hybridized, washed, and scanned per Agilent'srecommendations. Spot quantitation employed Agilent's eXtended Dynamic Rangetechnique with gains of 100% and 10%. Normalization and slide averaging was carried outas described (Yang et al., 2003) except that ratios and mean intensities for spots of the sameORF were averaged after normalization. Microarray data have been deposited in the GeneExpression Omnibus (GEO) database under accession number GSE14433.
RESULTSAll genomic library inserts enriched by serial transfer in the presence of butyrate containat least part of the 5’ region upstream of three 16S ribosomal RNA genes
Two biological replicates of library-bearing C. acetobutylicum (pLib2thl) cultures wereenriched in the presence of butyrate. Both replicate cultures were able to survive 10 transfersinto media containing up to 1.3% (v/v) butyrate. When the cultures stopped growing, within24-hours post inoculation, plasmid DNA from the final surviving C. acetobutylicum cultureswas used to transform TOP10 E. coli (Invitrogen), and plasmid DNA from individual E. colicolonies was analyzed by sequencing individual plasmid inserts. The sequence identities ofthese 18 C. acetobutylicum library insert colonies (9 from each biological replicate) areshown in Supplementary Table 2. All 18 inserts contained portions of the genome involvedin synthesis of 16S ribosomal RNA. All bacteria contain multiple ribosomal RNA operonsfor the synthesis of 5S, 16S, and 23S ribosomal RNA molecules, and C. acetobutylicumcontains 11 such operons, representing 0.8% of the genome (Nolling et al., 2001). Each ofthe 18 sequenced library inserts contained at least some portion of one of these operons, andthese 18 inserts could be divided into 4 sub-classes. A cartoon of the contents of each insertsub-class is shown in Fig. 1. It can be seen that all of the sequenced inserts contain the 5’region upstream of three 16S ribosomal RNA genes (16Sg, 16Sh, and 16Sj) which containsthe promoter for the corresponding entire ribosomal operon (rrnG, rrnH, rrnJ).
Borden et al. Page 7
Metab Eng. Author manuscript; available in PMC 2011 May 1.
NIH
-PA Author Manuscript
NIH
-PA Author Manuscript
NIH
-PA Author Manuscript

Growth-inhibition assays of library-bearing culturesWe desired to verify that the inserts isolated after the library enrichment process did in factconfer tolerance to butyrate, in excess of a plasmid control strain. Therefore, threesequenced inserts with different insert identities were selected from the 18 sequenced inserts(Supplementary Table 2) for sub-cloning back into WT C. acetobutylicum. Singlerecombinant C. acetobutylicum colonies were then grown and plasmid inserts verifiedbefore generating frozen stocks. Growth-inhibition assays of actively growing cultures (OD~ 1.0) were performed with each of the three strains carrying individual library inserts andthe plasmid control strain C. acetobutylicum 824(pSOS95del) (Tomas et al., 2003b). Theresults of these growth-inhibition assays are shown in Fig. 2. At all butyrate concentrations,except for 0.8% and 1.0% butyrate, the strains harboring library inserts grew to higher celldensities than the plasmid-control strain. For example, at the different butyrateconcentrations (0.0%, 0.2%, 0.4%, and 0.6%), insert F had a 29%, 38%, 39%, and 25%,respectively, higher cell density than the plasmid control strain. This growth advantage wasseen across all the different library inserts. Insert C grew to 25%, 45%, 37%, and 24%higher cell densities, respectively, and insert A grew to 26%, 39%, 39%, and 28 % highercell densities, respectively. For all inserts, the greatest difference (37% - 45%) between theinserts and the plasmid control strain are seen at 0.2% and 0.4% butyrate. The 25% growthadvantage in the extent of growth (higher cell densities) in the absence of butyrate stresssuggests that the library-insert containing cells grow faster than the plasmid control strain.
It is also noteworthy that in the growth-inhibition assay no growth was observed for any ofthe tested strains past 1.0% (v/v) butyrate, whereas serially enriched cultures were able totolerate up to 1.3% butyrate, although the growth assay conditions were different from theenrichment conditions. This difference in tolerance levels may be due to the conditioning ofthe culture to butyrate through slowly increasing the butyrate concentration during the serialenrichment. We address this possibility with additional assays described below.
Determination of a minimal DNA insert sizeAs mentioned above, all library inserts harbor at least one common region – the 5’ upstreamregion of the 16S ribosomal coding region which contains the promoter region of the entireribosomal operon. It was next desired to identify if a subsection of these similar libraryinserts was responsible for the observed tolerant phenotype. A sub-library of the enrichedand sequenced genomic inserts was synthesized whereby PCR products were generatedusing the enriched library plasmids as template to generate smaller sub-fragments of thesequenced inserts (Supplementary Fig. 2). These PCR sub-fragments, 7 in total, weredesigned so as to cover all relevant permutations of key features contained in the butyrate-enriched library inserts (compare Supplementary Table 2 with Fig. 1 and SupplementaryFig. 2). Partial or intact open reading frames (CAC0964 and the 5S ribosomal gene) werecloned for constitutive expression from Pthl, and intergenic regions (i.e., the ribosomaloperon promoter region found in all sequenced inserts and the intergenic region between the5S and 23S ribosomal genes) were also cloned because these regions may impart tolerantphenotypes by a mechanism such as by titrating regulatory elements.
The set of 7 sub-fragments were then cloned into the TOPO-TA cloning vector, recombinedinto both pSOS_ENT and pSOS_ENT_REV (so that each fragment will express both thesense and antisense transcripts from the Pthl), methylated, and transformed into C.acetobutylicum. This microbial library of minimal fragments was then subjected to serialbutyrate enrichment as before, to identify which fragment(s) provided the best survivalunder increasingly stringent selection. After the 14th transfer into media containing 1.25%(v/v) butyrate, plasmid DNA was isolated and inserts identified by sequencing. Fifteen ofthe 18 sequenced inserts contained the 353 bp intergenic region upstream of the 16Sh
Borden et al. Page 8
Metab Eng. Author manuscript; available in PMC 2011 May 1.
NIH
-PA Author Manuscript
NIH
-PA Author Manuscript
NIH
-PA Author Manuscript

ribosomal gene and downstream of the 5Sg ribosomal gene (rDNA PCR Product 7 inSupplementary Fig. 2), while the other three sequenced inserts contained a shorter, 240 bpregion upstream of the 16Sg ribosomal gene and downstream of the CAC0290 gene (rDNAPCR Product 6 in Supplementary Fig. 2). These two sequences shared a large degree ofsimilarity with 60.4% identity between them. Based on these data we conclude that butyratetolerance associated with the enriched library fragments is largely due to the intergenicregion upstream of the 16S ribosomal genes. Hereafter, this minimal tolerance-conferringpromoter DNA fragment is referred to as rDNA7 (and the corresponding plasmid carryingthis fragment as pRD7), so named due to its origination as a ribosomal operon promoterregion and being the seventh insert as labeled and shown in Supplementary Fig. 2.
RDNA7 imparts broader general acid toleranceTo examine whether the pRD7 plasmid provided general acid tolerance, the ability to growin media containing acetic, lactic, butyric, or isovaleric acid was also examined. Acetic acidand lactic acid were chosen because they are primary metabolites. While isovaleric acid isnot a primary metabolite, it has been shown to be produced from leucine in some clostridia(Britz and Wilkinson, 1982; Britz and Wilkinson, 1983). As with the previous growth-inhibition assays, 824(pRD7) was able to grow to higher optical densities in the presence ofany of the acids tested (Fig. 3A, B, Supplementary Table 3). Both acetic and lactic aciddemonstrated some stimulatory effect leading to higher optical densities under acid stressthan unstressed cultures, but 824(pRD7) still grew to higher A600 values than the plasmidcontrol 824(pSOS95del) (Supplementary Table 3). In addition to just comparing A600 valuesunder butyric and isovaleric acid, A600 measurements were converted into biomassconcentrations using a mass index coefficient (Roos et al., 1985), and yield coefficients(YX/S, g/mol) for the two strains were calculated (Fig. 3C&D). 824(pRD7) exhibited greateryield coefficients, meaning expression of the insert stimulated greater biomass formationwith less glucose consumption. This growth advantage can be particularly seen after 24hours of growth under isovaleric acid stress (Fig. 3D). These data indicate that the pRD7plasmid provides robust tolerance to a variety of primary-metabolite and other carboxylicacids.
Preconditioning culture in sub-lethal level of butyrate imparts greater butyrate tolerance in824(pRD7)
Though 824(pRD7) generally outperformed 824(pSOS95del) at all butyrate levels up to0.75% (Fig. 3A), it was desired to demonstrate this ability at higher levels of butyrate. Asmentioned earlier, the initial library survived up to 1.3% butyrate, but when the enrichedinserts were tested again, they were barely surviving the 1.0% butyrate stress (Fig. 2). It washypothesized that the initial library could survive higher levels of butyrate because it wasconditioned in butyrate and the level of stress slowly increased. If the benefit of the insertinvolves induction of gene expression, stressing the cells right away with a high level ofbutyrate would not allow this induction to occur. To test this, biological replicates of824(pRD7) and (pSOS95del) were grown up in media containing 0.6% (v/v) of butyrate (pH6.7), and once the cultures reached an A600 of 1.0, they were stressed with additional levelsof butyrate until the final concentrations were reached. A summary of the data are shown inFig. 4. Significantly, 824(pRD7) maintained positive growth through 48 hrs up to 1.0%butyrate and at 1.1% and 1.2% was able to sustain its optical density. In contrast,824(pSOS95del) could only achieve positive growth through 48 hrs with no additional stressonly at 0.6% butyrate. Even though neither culture could sustain their optical density at1.4%, 824(pRD7) still grew to a greater A600 than the plasmid control (Fig. 4A). In addition,at all stress levels 824(pRD7) consumed more glucose (Fig. 4B) and produced more butanol(Fig. 4D). Before the additional stress, glucose levels were at 451 (± 3.2) mM and thebutanol concentration was 2.8 (± 0.3) mM. Butyric acid levels were also lower for the
Borden et al. Page 9
Metab Eng. Author manuscript; available in PMC 2011 May 1.
NIH
-PA Author Manuscript
NIH
-PA Author Manuscript
NIH
-PA Author Manuscript
824(pRD7) cultures, indicating that a significant amount of butyrate was reassimilated toproduce butanol (Fig. 4C). For both strains, the level of butyrate before the additional stresswas 53 (± 0.9) mM, or ca. 0.5% (v/v). Overall, 824 (pRD7) could survive, grow, andproduce solvents at significantly higher concentrations of butyric acid than the plasmidcontrol strain. Under unstressed culture conditions the two strains produced similar levels ofsolvents. Indeed, cultures of C. acetobutylicum 824(pRD7) (n=2) and 824(pSOS95del)(n=3) were grown for 168 – 192 hours and analyzed by HPLC for end-point metabolitelevels. Strains 824(pRD7) and (pSOS95del) strains produced an average of 171 mM (± 0.7)and 154 mM (± 6.9) butanol, respectively, while consuming 358 mM (± 1.4) and 319 mM (±15.2) glucose, respectively.
Analysis of non-coding RNA expression from rDNA7 in the tolerant 824 (pRD7) and theplasmid control strain 824(pSOS95del)
In order to confirm expression of transcripts from pRD7 and to determine if similartranscripts are also produced in the plasmid control strain, we used both Q-RT-PCR andNorthern blot analysis. For Northern analysis, we used single-stranded DNA in order toprobe both possible sense (ncRNARD7, with respect to Pthl, see Supplementary Fig. 2) andantisense to putative ncRNARD7 transcripts. Biological replicates of both stressed andunstressed cultures were prepared for each strain. For the stressed cultures, both strains weregrown to the mid-exponential growth phase (OD ~ 1.0), at which time a bolus of pH 6.7butyrate (the same pH used for the serial enrichment experiments) was added to each flaskto a final concentration of 0.6% (v/v) butyrate. Supernatant and RNA samples were takenfrom each culture to track the response to butyrate addition in terms of metabolic andtranscriptional activities. The first RNA sample was taken immediately prior to butyrateaddition, when each culture was at an OD ~ 1.0. Cell and supernatant samples were thentaken 15, 40, 120, 240, and 360 minutes after butyrate addition. Unstressed cultures weregrown in parallel with the stressed cultures and were sampled at the same time. For Q-RT-PCR analysis, RNA was treated with DNase I to minimize any contaminating genomicDNA, since these samples would be undergoing DNA amplification. Northern analysis wascarried out on RNA without DNase I treatment.
First, the expression of potential non-coding RNA transcripts, under stressed and unstressedconditions, in both 824 (pRD7) and the plasmid control strain 824(pSOS95del) wasinvestigated by Q-RT-PCR. Using Q-RT-PCR, a distinction between the ncRNARD7transcript and the reverse complement transcript, part of the pre-processed 16S rRNA,cannot be made, because the primers do not distinguish between the transcripts, but the levelof expression of either transcript can be determined and compared between the strains.Under both stressed and unstressed conditions, 824(pRD7) displayed significantly higherexpression (lower threshold cycle, Ct, values; the ratio of targets is roughly proportional to2−ΔCt, where ΔCt is the difference in Ct values) of transcripts (as captured by these PCRprobes; Fig. 5A) compared to 824(pSOS95del) (Fig. 5B). In the control strain824(pSOS95del), expression of transcripts was virtually constant under both stress and no-stress conditions (Fig. 5B) and high (Ct values lower than ca. 15 are indicative of highexpression in this organism; data not shown). This high level of expression in the plasmidcontrol strain indicates that the Q-RT-PCR primers could be amplifying pre-processed 16SmRNA in addition to any native ncRNARD7 transcript. In contrast, expression of ncRNARD7transcripts in 824(pRD7) decreased significantly (Fig. 5B) under both stress and no stress ina virtually identical manner, likely reflecting the activity of the Pthl promoter. Forcomparison, we also examined expression by Q-RT-PCR of the mature 16S rRNA that iscoded by the adjacent rrn operon (Fig. 5C). 16S RNA expression, by the PCR probe in themiddle of the mature 16S RNA, was somewhat lower in 824(pRD7) compared to824(pSOS95del), and in both strains there was a small initial stress response, but overall,
Borden et al. Page 10
Metab Eng. Author manuscript; available in PMC 2011 May 1.
NIH
-PA Author Manuscript
NIH
-PA Author Manuscript
NIH
-PA Author Manuscript

16S RNA levels remained largely invariant in 824(pSOS95del), but increased slightly in824(pRD7) (Fig. 5C). Notice that at time 0, the Ct values of 16S RNA are quite similar tothe Ct values for the ncRNARD7 transcripts in 824(pRD7). As a control, the Q-RT-PCR wasrepeated using RNA not reverse transcribed with each set of primers. The Ct values rangedfrom 24 to 26, more than 10 Ct values higher than the greatest Ct value using reversetranscribed RNA, indicating no significant genomic DNA contamination. Though Q-RT-PCR demonstrated high expression of putative transcripts corresponding to RDNA7, the sizeof the transcripts and, significantly, the orientation of the transcript(s) cannot be determinedwith Q-RT-PCR. Thus, we employed Northern analysis.
Initial Northern analysis using double-stranded DNA probes demonstrated the presence ofmultiple bands. To determine the nature of transcripts that could be transcribed from therDNA7 fragment, we used single-stranded DNA probes (Fig. 6A). RNA from 0, 15, 120,and 360 min post butyrate stress from both 824(pRD7) and 824(pSOS95del) were prepared(Fig. 6B). This RNA was then probed with radio-labeled single-stranded oligonucleotideprobes for both expression orientations of RDNA7: probe II to capture transcripts in thedirection of 16S rRNA expression and probe I to capture putative ncRNARD7 transcripts offthe Pthl (Fig. 6A). When probe I was used, no transcripts were observed in any of the824(pSOS95del) samples (Fig. 6C). In the 824(pRD7) strain, there was a 400-nt faint bandat t=0 (more visible in a biological replicate shown as Supplementary Fig. 3), and up to fourbands after butyrate stress. The ca. 400 nt band would correspond to the 353 nt transcriptthat could be produced from pRD7 using the Pthl (Fig. 6C). After stripping, probe II washybridized to the same membrane to visualize any possible transcripts in the sameorientation as 16S rRNA. In this case, both the plasmid control and the recombinant straindisplayed a number of different bands, from 1700 to less than 100 nts, most of whichappeared perfectly matched between the two strains, although they were significantly moreintense in 824(pRD7) (Fig. 6D). We also note that the pRD7 strain displays some bands notdetectable in the control, of which most notable are the bands below the 1400 nt and 400 ntbands (Fig. 6D). The 1700 nt molecule just above the mature 16S band (Fig. 6B) is probablya precursor 16.3S or 17S molecule similar to what has been previously reported for E. coli(Li et al., 1999). Among the larger molecules, there was a 1400-nt molecule just below the16S mature molecule, as well as a slightly smaller molecule more visible in the 824(pRD7)lanes. There was also a prominent 900-nt molecule (and a slightly larger molecule betterseen in the 824(pRD7) strain). The 700-nt molecule corresponds to the rRNA band of thesame size observed in methylene-blue stained RNA gels (Fig. 6B). We note that unlike E.coli and most other prokaryotes, instead of the usual two large bands of rRNA (16S and23S), C. acetobutylicum RNA gels display 4 major distinct bands such as those shown inFig. 6B, namely: the 23S (ca. 3,000 nts), a 2,000+ nt band, the 16S (ca. 1,500 nts), and theaforementioned ca. 700-nt band. We assume that these are processed rRNA from the rrnoperons, and the data of Fig. 6 as well other data (see below) support this assumption. Fig.5A shows the putative promoters and transcriptional start site of the rRNA molecules(typically first as a single long 30S molecule (Britton et al., 2007)) transcribed from theserrn operons (namely rrnC, D, H and I). These transcripts, as in other prokaryotes (Britton etal., 2007), start over 100 nts upstream of the DNA sequences coding for the mature 16Smolecule, and contain several ribonuclease processing sites, whose action leads to theformation of the trimmed, mature 16S and other rRNA molecules. For 16S rRNA, based onpromoter predictions in C. acetobutylicum (Paredes et al., 2004) and the phylogeneticallyclosely related lactobacilli (de Vries et al., 2006), as well as on folding models of precursor16S RNA molecules in E. coli and B. subtilis (Britton et al., 2007), a folding model of theprecursor 16S rRNA in C. acetobutylicum is shown in Fig. 5D. The long double-strandedstalk of this precursor molecule presumably contains several RNase processing sites, whichare used to generate the mature 16S rRNA molecule through a sequence of cleavage stepsthat make up the rRNA processing pathway (Britton et al., 2007). The predicted unprocessed
Borden et al. Page 11
Metab Eng. Author manuscript; available in PMC 2011 May 1.
NIH
-PA Author Manuscript
NIH
-PA Author Manuscript
NIH
-PA Author Manuscript

rRNA would hybridize against probe II of Fig. 6A and also against a large portion ofncRNARD7 molecules produced from the rDNA7 fragment on pRD7 off the Pthl. From thedata of Fig. 6, we conclude that in strain 824(pRD7) there are 4 short ncRNARD7 moleculesproduced in a butyrate-stress dependent manner. If there are any such molecules in thecontrol strain, their levels are not detectable in this assay. These data suggest that expressionof ncRNARD7 molecules from pRD7 alters rRNA expression and processing, leading to theaccumulation of significantly higher levels of precursor rRNA molecules mostly of sizelower than 1,700 nt, but likely also of higher sizes as the faint bands, up to 3,000 nts, of Fig.6D (strain 824(pRD7)) suggest. These data also suggest that rRNA processing is morecomplex than anticipated and strongly affected by pRD7. We wanted to probe the rRNAprocessing complexity further by using probes against the mature 16S rRNA.
Since the rDNA7 fragment is just upstream of the 16S rRNA gene and dramatic differencesin the expression of rRNA precursor molecules were observed between the two strains (Fig.6D), Northern blots were also prepared to visualize the 16S rRNA. Two radio-labeledsingle-stranded oligonucleotide probes were designed to probe the 16S rRNA: one in the 5’region of the mature 16S rRNA (probe III) and a second in the middle of the mature 16SrRNA (probe IV). The hybridization patterns on the two membranes of Fig. 7 (7C and 7E;we used different membranes to avoid potential artifacts due to probe stripping) aresomewhat similar between the strains but different between probes. These unexpectedpatterns suggest unusual complexity of rRNA processing in both strains, which is the mainreason for showing these gels. The methylene blue stains (Figs. 7B and D) were used toassess that the overall loading of RNA in the various lanes was approximately equal.Between the two strains, overall there are few discernable differences in the expression ofthe mature 16S rRNA. One difference though is observed when probing for the middle ofthe 16S (Fig. 7C): expression of the mature 16S in 824(pRD7) drops off more dramaticallyat 360 min than in the plasmid control strain, but this same drop is not seen when probed forthe first half of the 16S. Another is the difference at 120 and 360 min on the gel of Fig. 7E inthe rRNA species between 700 and just above 1100 nts: these lanes are less distinct ornonexistent in 824(pRD7) (see also details in the overexposed image of Supplementary Fig.4). Both membranes (Fig. 7 C&E) share a band of about 700 nts, which corresponds to a ca.700 nts rRNA band seen on the methylene blue strained membranes (Fig. 7B&D). Asdiscussed above (Fig. 6B&D), this is a previously unidentified band seen on all RNA gels ofthis organism with the 16S rRNA and 23S rRNA bands when stained with methylene blue orethidium bromide. The membrane of Fig. 7C displays bands (at ca. 900, 500 and 300 nts)not seen in the membrane of Fig. 7E, which displays bands (at ca. 1100, 200-300, 100-200and the less than 100 nt bands; see also Supplementary Fig. 4 for these small size bands inan overexposed image of the membrane). Based on these images and the images of Fig. 6D,we conclude that rRNA processing is more complex than was anticipated based onpublished reports in clostridia and other organisms, and that the ncRNARD7 moleculesproduced from plasmid pRD7 dramatically impact the expression levels and processing ofthe precursor rRNA molecules, and this is associated with the observable acid-tolerancephenotype.
Microarray analysis of the tolerant C. acetobutylicum 824(pRD7) strainIn order to obtain a better understanding of the differences in the transcriptional programimparted by pRD7 for a butyrate-tolerant phenotype, microarray analysis was carried out onreplicate cultures of the 824(pRD7) and the plasmid control 824(pSOS95del) strains usingthe same type of experiments as those used for the Northern analysis of Figs. 6 and 7.Briefly, the strains were grown to the mid-exponential growth phase (OD ~ 1.0), at whichtime a bolus of pH 6.7 butyrate was added to each flask to a final concentration of 0.6% (v/v) butyrate. Supernatant and RNA samples were taken from each culture to track the
Borden et al. Page 12
Metab Eng. Author manuscript; available in PMC 2011 May 1.
NIH
-PA Author Manuscript
NIH
-PA Author Manuscript
NIH
-PA Author Manuscript

metabolic and transcriptional patterns of the cells. The first RNA sample was takenimmediately prior to butyrate addition, when each culture was at an OD ~ 1.0. RNA andsupernatant samples were then taken 15, 40, 120, 240, and 360 minutes after butyrateaddition in order to identify the short-term transcriptional differences between the twostrains. The short-term response was chosen in order to capture the immediate rather thanthe secondary patterns of differential gene expression.
As before with the growth-inhibition assays on actively growing cultures (Figs. 2-4), thestrain harboring pRD7 was better able to utilize glucose and grow following butyrateaddition, as indicated by the higher OD and total glucose consumption post-butyratechallenge. 824(pRD7) began producing butanol very early in the culture, at an OD less than0.2, corresponding to the very early exponential and acidogenic growth phase prior toexternal butyrate addition. Initiation of solventogenesis in batch culture has been correlatedto critical levels of intracellular undissociated butyric acid (Huesemann and Papoutsakis,1986;Huesemann and Papoutsakis, 1988;Zhao et al., 2005). Following butyrate addition,strain pRD7 continued to produce butanol more rapidly than the plasmid control culture.After isolating RNA from all cultures and samples, RNA was reverse transcribed to cDNAand fluorescently labeled. DNA microarrays were then hybridized for each timepoint, withone biological replicate of 824(pRD7) cDNA hybridized against cDNA from the sametimepoint pre or post-challenge but from one of the 824(pSOS95del) cultures. To eliminatepotential dye bias, all timepoints were hybridized in duplicate with a dye-swapconfiguration. In order to eliminate false positives due to biological variability, twoindependent sets of biological replicate experiments were analyzed. In total, 24 microarrayswere hybridized – 12 for each biological replicate challenge experiment.
Genes were identified that were differentially regulated with greater than 95% confidence inat least three time points of both replicate butyrate challenge experiments. The expressionratios of ten genes with consistently increased expression in 824(pRD7) are shown in Fig. 8,and 110 genes with generally lower expression in 824(pRD7) are shown in SupplementaryFig. 5. An additional set of 55 genes that showed consistent temporal patterns of differentialregulation, but were not differentially expressed with greater than 95% confidence in at leastthree time points of one of the two replicate experiments, are shown in Supplementary Fig.6. Among the upregulated genes (Fig. 8 and Supplementary Fig. 6) with an identifiable rolein acid tolerance is CAC1754, the ffh gene. As discussed, the Ffh protein is a component ofthe SRP system for transport of proteins to the cytosolic membrane and interacts with anscRNA. This scRNA was identified in C. acetobutylicum based on similarity to those foundin E. coli and B. subtilis, and its expression was probed and verified by Northern analysis(data not shown). Furthermore, its expression pattern in 824(pRD7) and 824(pSOS95del)after butyrate stress was probed with Q-RT-PCR along with the ffh, to confirm itsupregulation in 824(pRD7). Expression of the scRNA was similar in both 824(pRD7) and824(pSOS95del) with no significant up or down regulation. Expression of ffh by Q-RT-PCRdisplayed a similar 3-fold higher expression in 824(pRD7) over 824(pSOS95del) as seen inthe microarray data. CAC2473, a predicted transcriptional regulator of the xenobiotic-responsive element (XRE) family, with roles in acid tolerance in Lacobacillus acidophilus(Azcarate-Peril et al., 2004) and solvent tolerance in C. acetobutylicum (Borden andPapoutsakis, 2007), was also among the upregulated genes. Also, several genes withhomology to transporter genes of the E. coli acid decarboxylation/transport system of acidtolerance were consistently upregulated, including CAC1984,CAP0128, CAC0297 andCAC3285 (Fig. 8 and Supplementary Fig. 6). As discussed earlier, CAC3285 has highsimilarity to gadC, which codes for a cognate glutamate/GABA antiporter in E. coli, andCAC0297 has similarity to adiA, which codes for an arginine decarboxylase in E. coli. Theupregulation of these genes may also play a role in the acid tolerance phenotype of824(pRD7), but how they relate back to the overexpression of ncRNARD7 is not known.
Borden et al. Page 13
Metab Eng. Author manuscript; available in PMC 2011 May 1.
NIH
-PA Author Manuscript
NIH
-PA Author Manuscript
NIH
-PA Author Manuscript

Among downregulated genes (Supplementary Figs. 5 and 6), genes in the operon coding forthe KdpATPase complex (CAC3679 – 3682), which is an essential osmosensor responsiblefor potassium ion transport and homeostasis in many Gram-positive and Gram-negativebacteria (Ballal et al., 2007;Wood, 2006), and the associated two-component signaltransduction system (CAC3677 and CAC3678) showed the largest fold-decrease inexpression.
Three findings are worthy of note. First, we note that the relatively few differentiallyexpressed genes (Fig. 8 and Supplementary Figs. 5 and 6) are enriched in genes coding formembrane-associated proteins. Of the 10 genes with increased expression, half (CAC1291,CAC1779, CAC1984, CAC3545, and CAP0128) are predicted to be membrane-associatedproteins. Second, the majority of differentially expressed genes are organized in a rathersmall number of operons (transcriptional units), many made up of hypothetical proteins.This would suggest that these operons belong to the regulon of a transcriptional regulator,whose activity is altered in the 824(pRD7) strain. Third, by far the largest fraction ofdifferentially expressed genes were downregulated in the 824(pRD7) strain; this wouldsuggest a mechanism of transcriptional suppression typical of non-coding regulatory RNAs(Bouvier et al., 2008).
DISCUSSIONThe pLib2thl library generates double diversity by expressing both sense and antisensetranscripts off the thiolase promoter (Pthl)
Both the pLib2thl library and subfragment libraries were constructed such that any genomicfragment used in the original library construction would be inserted in both possibleorientations relative to the constitutive thiolase promoter (Pthl) (see Supplementary Fig. 1).The intent of such a design was to double the diversity of possible effects, by expressingboth sense and antisense transcripts, from a single library of cloned genomic fragments.Such a design makes possible to explore the impact of not only overexpressing a gene orneighboring genes in the sense orientation, by significantly also whether an insertcontributes to tolerance (or, generally, any desirable and testable phenotype) throughgeneration of antisense transcripts (downregulation of gene expression or protein synthesissimilar to mechanisms employed by small non-coding RNAs (Bouvier et al., 2008)), or bytitration of regulatory elements that may indirectly impart the tolerant phenotype. Forinstance, if the inserts identified after butyrate enrichment existed in both the sense andantisense direction (i.e., independent of insert orientation), this would suggest an indirectlyderived phenotype based on titration of regulator elements. Interestingly, both in the originallibrary enrichment experiment, as well as the experiment using subfragments of the enrichedlibrary DNA, all resulting enriched fragments were oriented such that the Pthl generated anantisense transcript, and no fragments were enriched with the opposite, sense orientation.We conclude that the butyrate-tolerant phenotype is sensitive to library insert orientation,and such an effect might have been captured by a library that would have expressed onlynaturally occurring transcripts.
The unexpected diversity of ribosomal RNAs and their processingWe demonstrated that C. acetobutylicum displays a larger number of large-size rRNA bandsbeyond the expected 16S and 23S, namely those of ca. 2000 and 700 nts (Figs. 6 and 7). Wealso demonstrated that rRNA processing appears considerably more complex and dynamicunder butyrate stressed culture conditions (Figs. 6D and 7C&E), although there appears tobe very little change in the concentration of the predicted mature 16S rRNA (Fig. 5C). Strain824(pRD7) appears to produce higher concentrations of precursor molecules of rRNAssmaller than the mature 16S rRNA (Fig. 6D). The physiological significance of these
Borden et al. Page 14
Metab Eng. Author manuscript; available in PMC 2011 May 1.
NIH
-PA Author Manuscript
NIH
-PA Author Manuscript
NIH
-PA Author Manuscript

molecules and of the apparent complexity of rRNA processing is unknown. It has beensuggested however that at least some molecules of processed rRNA, which are differentfrom the mature rRNA molecules, may still be functional in ribosome assembly (Li et al.,1999). While the diversity of rRNA processing has been suggested in the literature (e.g.,(Song et al., 1999)), the physiological significance of that diversity is not known.
Natural or synthetic mechanism of acid tolerance?The impact of the library inserts from the rRNA-coding chromosomal loci and of the insertin the pRD7 plasmid in producing a robust acid tolerant phenotype is clear and reproduciblein all assays employed in this study. It is significant to note the enhanced growth andbiomass yields (YX/S) of 824(pRD7) (Fig. 4) (and of selected library clones; Fig. 2)) even inthe absence of external acid stress, which would indicate the enhanced ability of thesestrains to cope with the acid stress due to the accumulation of butyrate and acetate as a resultof cell growth.
How might a ribosomal RNA promoter region, when transcribed in an antisense orientation,impart an acid-tolerant phenotype, such profound changes in the expression and processingand of rRNAS, and, finally, the consistent alteration of 179 mRNAs? One possibility is thatthe inclusion of the 16S ribosomal promoter element within a multi-copy plasmid mayimpact the regulation of ribosomal RNA molecules by titration of transcription factors thatbind rRNA promoter regions and regulate rRNA transcription. This is however unlikely dueto the fact that the observable effect is orientation sensitive, i.e., only the antisense-expression orientation was enriched in four independent enrichment experiments, whichargues against a DNA-titration effect and in favor of an effect deriving from the ncRNARD7transcripts, which apparently hybridize to unprocessed nascent rRNAs (e.g., Fig. 5D) to altertheir processing by ribonucleases. One can then hypothesize the formation of ribosomevariants based on differently processed rRNAs, and such variants might affect the functionand possibly the targeting of the ribosome to the membrane or the mother vs. endosporecompartments (Paredes et al., 2005) of the cells.
Transcriptionally, the improved metabolic robustness of the 824(pRD7) strain wasassociated with the differential expression of osmotic responsive elements, amino aciddecarboxylation components, and significantly the key protein (Ffh) of the SRP system. InS. mutants, the ffh gene is the second gene of the quatrocistromic sat (secretion and acidtolerance) operon. The first gene of the sat operon is an ortholog to the ylxM B. subtilisgenes and is apparently a transcriptional regulator affecting genes of the SRP system(Kremer et al., 2001). We note here that the ylxM ortholog is also strongly upregulatedtogether with the ffh gene (Fig. 8). The SRP ribonucleotide–protein complex requires the so-called small cytoplasmic RNA (scRNA), which in E. coli is known as 4.5S RNA. SomeGram-positive bacteria have a longer SRP RNA than the 4.5S (ca. 100 nts) RNA in E. coli.For example, the size of scRNA in Bacillus subtilis is 271 nucleotides (Nakamura et al.,1992). In C. acetobutylicum, we have predicted the scRNA to be 312-315 nt long. Northernanalysis verified its expression and determined its size to be ca. 400 nt long (data notshown). Interestingly, the expression of ffh along with CAC1753, the ylxM ortholog, reachedpeak expression during acid production for a batch culture of C. acetobutylicum(Supplementary Fig. 7) (Jones et al., 2008). These data would suggest that the observabletolerant phenotype might be related to a SRP-dependent tolerance mechanism similar to thatin S. mutants.
We would have expected higher levels of expression of ncRNARD7 molecules in Fig. 6Cdue to the fact that the Pthl is strong promoter (Tummala et al., 1999). The reasons we likelyobserve relatively low levels of such transcripts is the relatively low sensitivity of theNorthern-blot assay using single-stranded DNA probes, but more significantly because
Borden et al. Page 15
Metab Eng. Author manuscript; available in PMC 2011 May 1.
NIH
-PA Author Manuscript
NIH
-PA Author Manuscript
NIH
-PA Author Manuscript

hybridization of these transcripts against the complimentary rRNA transcripts likely resultsin unstable heteroduplexes that are readily degraded.
Supplementary MaterialRefer to Web version on PubMed Central for supplementary material.
AcknowledgmentsThis work was supported by National Science Foundation grants BES-0331402 and CBET-0756451, Department ofEnergy grant DE-FG36-03GO13160, and an NIH/NIGMS biotechnology training grant T32-GM08449 fellowshipto Jacob R. Borden.
We thank the Northwestern University Biotechnology Core Laboratory for assistance with sequencing of plasmidlibrary inserts. We also thank Bryan Tracy and Haw Siang Ang for assistance in generating the library, SergiosNicolaou and Ryan Sillers for assistance in HPLC analysis of multiple acid stresses, and Dr. Carlos Paredes forassistance with promoter predictions.
REFERENCESAlsaker KV, et al. Design, optimization and validation of genomic DNA microarraysfor examining the
Clostridium acetobutylicum transcriptome. Biotechnol. BioprocessEng 2005;10:432–443.Azcarate-Peril MA, et al. Identification and inactivation of genetic loci involved with Lactobacillus
acidophilus acid tolerance. Appl. Environ. Microbiol 2004;70:5315–22. [PubMed: 15345415]Ballal A, et al. The Kdp-ATPase system and its regulation. J. Biosci 2007;32:559–68. [PubMed:
17536175]Borden JR, Papoutsakis ET. Dynamics of genomic-library enrichment and identification of solvent
tolerance genes for Clostridium acetobutylicum. Appl. Environ. Microbiol 2007;73:3061–8.[PubMed: 17337545]
Bouvier M, et al. Small RNA binding to 5′ mRNA coding region inhibits translational initiation. Mol.Cell 2008;32:827–837. [PubMed: 19111662]
Britton RA, et al. Maturation of the 5′ end of Bacillus subtilis 16S rRNA by the essential ribonucleaseYkqC/RNase J1. Mol. Microbiol 2007;63:127–38. [PubMed: 17229210]
Britz ML, Wilkinson RG. Leucine dissimilation to isovaleric and isocaproic acids by cell suspensionsof amino acid fermenting anaerobes: The Stickland reaction revisited. Can. J. Microbiol1982;28:291–300. [PubMed: 6805929]
Britz ML, Wilkinson RG. Partial purification and characterization of two enzymes involved inisovaleric acid synthesis in Clostridium bifermentans. J. Gen. Microbiol 1983;129:3227–37.[PubMed: 6655460]
Clarke L, Carbon J. Colony bank containing synthetic Col El hybrid plasmids representative of entireEscherichia coli genome. Cell 1976;9:91–99. [PubMed: 788919]
de Vries MC, et al. Comparative and functional analysis of the rRNA-operons and their tRNA genecomplement in different lactic acid bacteria. Syst. Appl. Microbiol 2006;29:358–367. [PubMed:16338113]
Foster JW. Escherichia coli acid resistance: Tales of an amateur acidophile. Nat. Rev. Microbiol2004;2:898–907. [PubMed: 15494746]
Gu SQ, et al. Conformation of 4.5S RNA in the signal recognition particle and on the 30S ribosomalsubunit. RNA 2005;11:1374–84. [PubMed: 16043501]
Gutierrez JA, et al. Streptococcus mutans ffh, a gene encoding a homologue of the 54 kDa subunit ofthe signal recognition particle, is involved in resistance to acid stress. Microbiol 1999;145(Pt 2):357–66.
Harris LM, et al. Northern, morphological, and fermentation analysis of spo0A inactivation andoverexpression in Clostridium acetobutylicum ATCC 824. J. Bacteriol 2002;184:3586–3597.[PubMed: 12057953]
Borden et al. Page 16
Metab Eng. Author manuscript; available in PMC 2011 May 1.
NIH
-PA Author Manuscript
NIH
-PA Author Manuscript
NIH
-PA Author Manuscript

Herrero AA, et al. Growth-inhibition of Clostridium thermocellum by carboxylic-acids - A mechanismbased on uncoupling by weak acids. Appl. Microbiol. Biotechnol 1985;22:53–62.
Huesemann M, Papoutsakis ET. Effect of acetoacetate, butyrate, and uncoupling ionophores on growthand product formation of Clostridium acetobutylicum. Biotechnol. Bioeng 1986;8:37–42.
Huesemann M, Papoutsakis ET. Solventogenesis in Clostridium acetobutylicum fermentations relatedto carboxylic acid and proton concentrations. Biotechnol. Bioeng 1988;32:843–852. [PubMed:18587795]
Jones SW, et al. The transcriptional program underlying the physiology of clostridial sporulation.Genome Biol 2008;9:R114. [PubMed: 18631379]
Kell DB, et al. On the permeability to weak acids and bases of the cytoplasmic membrane ofClostridium pasteurianum. Biochem. Biophys. Res. Commun 1981;99:81–8. [PubMed: 7236271]
Kremer BH, et al. Characterization of the sat operon in Streptococcus mutans: Evidence for a role ofFfh in acid tolerance. J. Bacteriol 2001;183:2543–52. [PubMed: 11274114]
Li Z, et al. RNase G (CafA protein) and RNase E are both required for the 5′ maturation of 16Sribosomal RNA. EMBO J 1999;18:2878–85. [PubMed: 10329633]
Mermelstein LD, Papoutsakis ET. In vivo methylation in Escherichia coli by the Bacillus subtilisphage phi 3T I methyltransferase to protect plasmids from restriction upon transformation ofClostridium acetobutylicum ATCC 824. Appl. Environ. Microbiol 1993;59:107710–81.
Meyer CL, et al. Carbon-monoxide gasing leads to alcohol production and butyrate uptake withoutacetone formation in continuous cultures of Clostridium acetobutylicum. Appl. Microbiol.Biotechnol 1986;24:159–167.
Nakamura K, et al. Small cytoplasmic RNA of Bacillus subtilis - Functional-relationship with humansignal recognition particle 7S RNA and Escherichia coli 4.5S RNA. J. Bacteriol 1992;174:2185–2192. [PubMed: 1372600]
Nolling J, et al. Genome sequence and comparative analysis of the solvent-producing bacteriumClostridium acetobutylicum. J. Bacteriol 2001;183:4823–38. [PubMed: 11466286]
Papoutsakis ET. Engineering solventogenic clostridia. Curr. Opin. Biotechnol 2008;19:420–9.[PubMed: 18760360]
Papoutsakis ET, et al. Transport of substrates and metabolites and their effect on cell metabolism (inbutyric-acid and methylotrophic fermentations). Ann. N.Y. Acad. Sci 1987;506:24–50. [PubMed:2829684]
Paredes CJ, et al. A comparative genomic view of clostridial sporulation and physiology. Nat. Rev.Microbiol 2005;3:969–78. [PubMed: 16261177]
Paredes CJ, et al. Transcriptional organization of the Clostridium acetobutylicum genome. NucleicAcids Res 2004;32:1973–1981. [PubMed: 15060177]
Paredes CJ, et al. A general framework for designing and validating oligomer-based DNA microarraysand its application to Clostridium acetobutylicum. Appl. Environ. Microbiol 2007;73:4631–8.[PubMed: 17526797]
Richard H, Foster JW. Escherichia coli glutamate- and arginine-dependent acid resistance systemsincrease internal pH and reverse transmembrane potential. J. Bacteriol 2004;186:6032–6041.[PubMed: 15342572]
Rinke-Appel J, et al. Crosslinking of 4.5S RNA to the Escherichia coli ribosome in the presence orabsence of the protein Ffh. RNA 2002;8:612–25. [PubMed: 12022228]
Roos JW, et al. The effect of pH on nitrogen supply, cell lysis, and solvent production in fermentationsof Clostridium acetobutylicum. Biotechnol. Bioeng 1985;27:681–94. [PubMed: 18553724]
Russell JB. Another explanation for the toxicity of fermentation acids at low pH - Anion accumulationversus uncoupling. J. Appl. Bacteriol 1992;73:363–370.
Russell JB, Diez-Gonzalez F. The effects of fermentation acids on bacterial growth. Adv. Microb.Physiol 1998;39:205–34. [PubMed: 9328648]
Song XM, et al. Fragmentation heterogeneity of 23S ribosomal RNA in Haemophilus species. Gene1999;230:287–293. [PubMed: 10216268]
Borden et al. Page 17
Metab Eng. Author manuscript; available in PMC 2011 May 1.
NIH
-PA Author Manuscript
NIH
-PA Author Manuscript
NIH
-PA Author Manuscript

Tomas CA, et al. DNA array-based transcriptional analysis of asporogenous, nonsolventogenicClostridium acetobutylicum strains SKO1 and M5. J. Bacteriol 2003a;185:4539–47. [PubMed:12867463]
Tomas CA, et al. Overexpression of groESL in Clostridium acetobutylicum results in increased solventproduction and tolerance, prolonged metabolism, and large changes in the cell's transcriptionalprogram. Appl. Environ. Microbiol 2003b;69:4951–4965. [PubMed: 12902291]
Tummala SB, et al. Development and characterization of a gene expression reporter system forClostridium acetobutylicum ATCC 824. Appl. Environ. Microbiol 1999;65:3793–9. [PubMed:10473377]
Walter A, Gutknecht J. Monocarboxylic acid permeation through lipid bilayer membranes. J. Membr.Biol 1984;77:255–64. [PubMed: 6699907]
Warnecke T, Gill RT. Organic acid toxicity, tolerance, and production in Escherichia coli biorefiningapplications. Microb. Cell. Fact 2005;4:25. [PubMed: 16122392]
Wiesenborn DP, et al. Thiolase from Clostridium acetobutylicum ATCC 824 and its role in thesynthesis of acids and solvents. Appl. Environ. Microbiol 1988;54:2717–2722. [PubMed:16347774]
Wood JM. Osmosensing by bacteria. Sci. STKE 20062006:pe43. [PubMed: 17047223]Yang H, et al. A segmental nearest neighbor normalization and gene identification method gives
superior results for DNA-array analysis. Proc. Natl. Acad. Sci. U.S.A 2003;100:1122–7. [PubMed:12529501]
Zhao Y, et al. Intracellular butyryl phosphate and acetyl phosphate concentrations in Clostridiumacetobutylicum and their implications for solvent formation. Appl. Environ. Microbiol2005;71:530–7. [PubMed: 15640230]
Borden et al. Page 18
Metab Eng. Author manuscript; available in PMC 2011 May 1.
NIH
-PA Author Manuscript
NIH
-PA Author Manuscript
NIH
-PA Author Manuscript

Fig. 1.Cartoon of butyrate-enriched genomic fragments from the library. Regions between thedashed brackets indicate the library inserts, which are flanked by the thl promoter and a rho-independent terminator. All inserts contain part, if not all, of the 5’ upstream region of the16S ribosomal RNA gene, which includes the promoter for the ribosomal operon(16S-23S-5S).
Borden et al. Page 19
Metab Eng. Author manuscript; available in PMC 2011 May 1.
NIH
-PA Author Manuscript
NIH
-PA Author Manuscript
NIH
-PA Author Manuscript

Fig. 2.Optical density measurements (A600) of butyrate-challenged cultures of C. acetobutylicumharboring enriched genomic library inserts A, C, and F and plasmid control strainpSOS95del. All optical density measurements were taken after 12 hours of growth followingthe butyrate stress. Measurements were taken from two biological replicates, with fourtechnical replicates for each biological replicate (total of eight measurements). Valuesshown are the average of all eight measurements and the standard deviation between thoseeight measurements. Asterisks indicate statistically significant differences between thegenomic library inserts and the plasmid control (p-values ≤ 0.05).
Borden et al. Page 20
Metab Eng. Author manuscript; available in PMC 2011 May 1.
NIH
-PA Author Manuscript
NIH
-PA Author Manuscript
NIH
-PA Author Manuscript

Fig. 3.Optical density measurements (A600) and yield coefficients, YX/S (g/mol), of C.acetobutylicum (pRD7) and (pSOS95del) challenged with 0.00%, 0.25%, 0.50%, and 0.75%(v/v) of butyric acid (pH 6.7) (A&C) and 0.00%, 0.20%, 0.30%, and 0.40% (v/v) ofisovaleric acid (pH 6.7) (B&D). A600 measurements were taken 12 hours and 24 hoursfollowing acid stress (A&B). The initial A600 measurements (~1.0) were subtracted off themeasurements after 12 and 24 hours so that only growth after acid challenge is shown.Measurements were taken from two biological replicates, with two technical replicates foreach biological replicate (total of four measurements). Error bars show the standarddeviation between the measurements. For the yield coefficients (C&D), the A600 valueswere converted into dry cell weight per volume (g/L) and divided by the amount of glucoseconsumed (mol/L). Raw data for the yield coefficients is in Supplementary Table 4.Asterisks indicate statistically significant differences between 824(pRD7) and824(pSOS95del) (p-values ≤ 0.05).
Borden et al. Page 21
Metab Eng. Author manuscript; available in PMC 2011 May 1.
NIH
-PA Author Manuscript
NIH
-PA Author Manuscript
NIH
-PA Author Manuscript
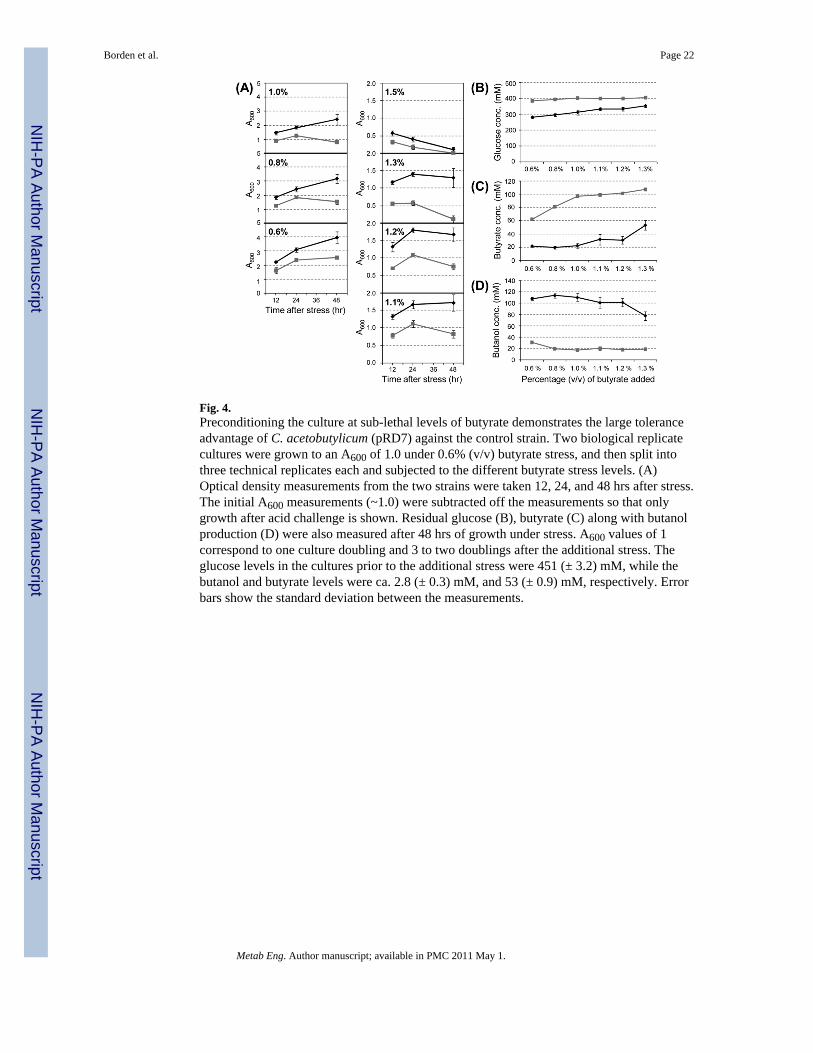
Fig. 4.Preconditioning the culture at sub-lethal levels of butyrate demonstrates the large toleranceadvantage of C. acetobutylicum (pRD7) against the control strain. Two biological replicatecultures were grown to an A600 of 1.0 under 0.6% (v/v) butyrate stress, and then split intothree technical replicates each and subjected to the different butyrate stress levels. (A)Optical density measurements from the two strains were taken 12, 24, and 48 hrs after stress.The initial A600 measurements (~1.0) were subtracted off the measurements so that onlygrowth after acid challenge is shown. Residual glucose (B), butyrate (C) along with butanolproduction (D) were also measured after 48 hrs of growth under stress. A600 values of 1correspond to one culture doubling and 3 to two doublings after the additional stress. Theglucose levels in the cultures prior to the additional stress were 451 (± 3.2) mM, while thebutanol and butyrate levels were ca. 2.8 (± 0.3) mM, and 53 (± 0.9) mM, respectively. Errorbars show the standard deviation between the measurements.
Borden et al. Page 22
Metab Eng. Author manuscript; available in PMC 2011 May 1.
NIH
-PA Author Manuscript
NIH
-PA Author Manuscript
NIH
-PA Author Manuscript

Fig. 5.Nucleotide sequence of RDNA7 and Q-RT-PCR analysis of its expression. (A) Nucleotidesequence of the four RDNA7 sequences found on the genome. Gray boxes indicatepredicted −10 and −35 binding sites for σA. The asterisk and arrow indicate predictedtranscriptional start site for the rRNA operon, while the dashed vertical line indicates thestart of the mature 16S rRNA. Dashed box region indicates the region probed for theNorthern analysis (Fig. 6). Q-RT-PCR primers were designed for the underlined sequences.(B) Q-RT-PCR analysis of RDNA7 in C. acetobutylicum (pRD7), both under butyrate stress(solid black triangle) and unstressed (solid black square), and (pSOS95del), both underbutyrate stress (open black triangle) and unstressed (open black square). (C) Q-RT-PCRanalysis of 16S rRNA in C. acetobutylicum (pRD7), both under butyrate stress (solid gray
Borden et al. Page 23
Metab Eng. Author manuscript; available in PMC 2011 May 1.
NIH
-PA Author Manuscript
NIH
-PA Author Manuscript
NIH
-PA Author Manuscript

triangle) and unstressed (solid gray square), and (pSOS95del), both under butyrate stress(open gray triangle) and unstressed (open gray square). Cycle threshold (Ct) values are theaverage between two biological replicates for each condition and three technical replicateson the PCR plate for each biological replicate (total of 6 values for each condition). Errorbars show the standard error between the values. The scales for the graphs in (B) and (C)were kept the same in order to enable easy comparison of Ct values for the pRD7 vs. the 16SrRNA. The insert with the more narrow scale of the Ct axis is to allow better comparisonamong the two strains and two conditions for the Ct values of 16S rRNA. (D) Predictedfolding structure of the precursor 16S rRNA. Black lines indicate sequences trimmed off ofthe mature 16S rRNA (gray line). Negative numbers indicate nucleotides upstream of themature 16S rRNA, while primed numbers indicate nucleotides downstream of the mature16S rRNA.
Borden et al. Page 24
Metab Eng. Author manuscript; available in PMC 2011 May 1.
NIH
-PA Author Manuscript
NIH
-PA Author Manuscript
NIH
-PA Author Manuscript

Fig. 6.Northern blot analysis of RDNA7 and its complementary transcript. Oligonucleotide radio-labeled probes were prepared for both the RDNA7 transcript (probe I) and itscomplementary transcript (probe II) (A). The RDNA7 probe was designed for the transcriptproduced from pRD7 and the potential native transcript on the negative strand of theintergenic region between RNA operons rrnB/C, rrnC/D, rrnG/H, and rrnH/I. A probe wasalso designed for the complementary RDNA7 sequence to probe the positive strand betweenthe RNA operons. Since the length of any potential native transcript in the intergenic regionis not known, dotted lines and double arrows indicate this potential transcript. Total RNAwas extracted at 0, 15, 120, and 360 min after butyrate stress from pRD7 and pSOS95del(plasmid control). (B) After staining the membrane with methylene blue, four prominentbands are seen: 2,800 nt (23S), 2,400 nt, 1,600 nt (16S) and 700 nt. M1 and M2 are RNAmarkers from USB (0.1-1kb) and Ambion (0.5-9kb), respectively. (C) After probing withprobe I, complementary to positions 120–147 nt of RDNA7, four prominent bands are seenin pRD7. Membrane was exposed for 48 hours. (D) After stripping probe I, complementaryprobe II was used to probe the same membrane. Membrane was exposed for 3 hours.
Borden et al. Page 25
Metab Eng. Author manuscript; available in PMC 2011 May 1.
NIH
-PA Author Manuscript
NIH
-PA Author Manuscript
NIH
-PA Author Manuscript

Fig. 7.Northern blot analysis of 16S rRNA. Two radio-labeled oligonucleotide probes weredesigned for the 16S ribosomal RNA gene: one for 16-43 nt of the 16S gene (probe III) andthe other for 819-919 nt of the 16S gene (probe IV) (A). Total RNA was extracted at 0, 15,120, and 360 min after butyrate stress from pRD7 and pSOS95del (plasmid control). (B&D)After staining the membrane with methylene blue, four prominent bands are seen: 2,800 nt(23S), 2,400 nt, 1,600 nt (16S) and 700 nt. M1 and M2 are RNA markers from USB(0.1-1kb) and Ambion (0.5-9kb), respectively. (C) Visualization of the membrane in (B)probed with probe III. (E) Visualization of the membrane in (D) probed with probe IV. Bothmembranes were exposed for 10 min.
Borden et al. Page 26
Metab Eng. Author manuscript; available in PMC 2011 May 1.
NIH
-PA Author Manuscript
NIH
-PA Author Manuscript
NIH
-PA Author Manuscript

Fig. 8.Genes upregulated following butyrate challenge. Genes shown were upregulated with 95%confidence in three of six timepoints from two biological replicate butyrate challengeexperiments. Color scheme shows red for genes with higher expression in the pRD7 strainand green for lower expression in the pRD7 strain.
Borden et al. Page 27
Metab Eng. Author manuscript; available in PMC 2011 May 1.
NIH
-PA Author Manuscript
NIH
-PA Author Manuscript
NIH
-PA Author Manuscript