A genomic approach to understanding the molecular epidemiology ...
505
i A genomic approach to understanding the molecular epidemiology and clinical burden of multi-drug resistant Enterobacterale Infections in Bangladesh by Refath Farzana A thesis submitted for the degree of Doctor of Philosophy at Cardiff University 2020
-
Upload
khangminh22 -
Category
Documents
-
view
1 -
download
0
Transcript of A genomic approach to understanding the molecular epidemiology ...

i
A genomic approach to understanding the molecular epidemiology and
clinical burden of multi-drug resistant Enterobacterale Infections in
Bangladesh
by
Refath Farzana
A thesis submitted for the degree of Doctor of Philosophy at Cardiff
University
2020

ii
Summary
This PhD was the first comprehensive study in South-Asia, investigating epidemiology
of AMR in a Bangladeshi health setting by aligning demographic, clinical, and
genomic data. Carbapenem-resistant Enterobacterales (CRE) from clinical specimens
were 11.1% (210/1893) and carbapenem-sensitive Enterobacterales (CSE) were
22.8% (433/1893). CRE was associated with age (6-25 years), gender, burn unit and
ICU patients. Additionally, with patients given levofloxacin, amikacin, clindamycin,
and meropenem during hospital stay (p<0.05). CRE cases were associated with all-
cause in-hospital 30-days mortality (27.8%) than CSE (13.5%) (p<0.05). Clinical CRE
clustered in particular clonal types compared to CSE e.g. ST167, ST448, ST8346,
ST405, and ST648 in E. coli, ST16; and ST231, ST11, ST515, and ST23 in K.
pneumoniae (p<0.05). CRE clades were associated with direct clonal transmission in
putative outbreak clusters (contained isolates of 0-2 SNPs differences), designated as
KP5 (K. pneumoniae ST23), KP1 (K. pneumoniae ST15), EC9 (E. coli ST648), and
Eco1 (E. cloacae ST113). Plasmid-mediated horizontal transfer of CRE was linked
mostly linked to IncFII and IncX3.
CRE faecal carriage was 34.8% (244/700) and significantly higher among inpatients
(53.8%) than the outpatients (12%) (p<0.05). The clinical and colonisation studies
were undertaken about a year apart; however, clusters were found across clinical and
faecal isolates (≤20 SNP); these were, EC4 (E. coli ST8346), EC6 (E. coli ST405),
EC7 (E. coli ST5954), KP1 (K. pneumoniae ST15), and Eco1 (E. cloacae ST113).
Additionally, this PhD describes outbreaks at Dhaka Medical College Hospital e.g. an
MDR Klebsiella variicola clone (ST771) in neonatal unit from October 2016 to
January 2017, associated with high mortality (54.5%), and by Burkholderia cepacia
ST1578 from burn sepsis cases. This study reported the first human-associated mobile
colistin resistance in Bangladesh (mcr-1 in faecal colonisation and mcr-8 in clinical
infections).
Data derived from this study indicate an urgent need of antibiotic stewardship program
and standard infection control policy in Bangladeshi hospitals.

iii
Publications and Presentations
Publications resulting from data presented in this thesis:
1. Farzana R, Jones LS, Rahman MA, Andrey DO, Sands K, Portal E, Watkins WJ,
Pervin M, Banerjee M, Walsh TR. Outbreak of Hypervirulent Multidrug-resistant
Klebsiella variicola Causing High Mortality in Neonates in Bangladesh. Clin Infect
Dis. 2019;68(7):1225-1227. doi: 10.1093/cid/ciy778.
2. Farzana R, Jones LS, Rahman MA, Toleman MA, Sands K, Portal E, Boostrom I,
Kalam MA, Hassan B, Uddin AN, Walsh TR. Emergence of mcr-1 mediated colistin
resistant Escherichia coli from a hospitalized patient in Bangladesh. J Infect Dev
Ctries. 2019;13(8):773-776. doi: 10.3855/jidc.11541.
3. Farzana R, Jones LS, Rahman MA, Sands K, Portal E, Boostrom I, Kalam MA, Hasan
B, Khan A, Walsh TR. Molecular and epidemiological analysis of a Burkholderia
cepacia sepsis outbreak from a tertiary care hospital in Bangladesh. PLoS Negl Trop
Dis. 2020;14(4):e0008200. doi: 10.1371/journal.pntd.0008200.
4. Farzana R, Jones LS, Barratt A, Rahman MA, Sands K, Portal E, Boostrom I, Espina
L, Pervin M, Uddin AKMN, Walsh TR. Emergence of Mobile Colistin Resistance
(mcr-8) in a Highly Successful Klebsiella pneumoniae Sequence Type 15 Clone from
Clinical Infections in Bangladesh. mSphere. 2020;5(2):e00023-20. doi:
10.1128/mSphere.00023-20.
5. Farzana R, Jones LS, Rahman MA, Sands K, Portal E, Criollo JM, Martyn Guest M,
Van-Tonder AJ, Parkhill J, Uddin AN, Hasan B, Ian Boostrom, Walsh TR.
Determining the burden of carbapenem resistance in a tertiary public heath setting in
Bangladesh: an epidemiological, clinical, and molecular study (manuscript in
preparation).
6. Farzana R, Jones LS, Rahman MA, Sands K, Portal E, Criollo JM, Martyn Guest M,
Van-Tonder AJ, Parkhill J, Jove T, Walsh TR. Horizontal spread of carbapenem
resistance in a Bangladeshi health setting (manuscript in preparation).

iv
Presentations resulting from data presented in this thesis:
1. Farzana R et al. Outbreak of Hypervirulent Multi-Drug Resistant Klebsiella
variicola Causing High Mortality in Neonates in Bangladesh. Paper poster
presentation at ECCMID 2018.
2. Farzana R et al. Epidemiology and impact of carbapenem-resistant Escherichia
coli in a Bangladeshi clinical setting. Paper poster presentation at ECCMID 2019
3. Farzana R et al. Double blinded study evaluating the GenePOC™ Carba assay and
revogene™ instrument for rapid detection of carbapenemase-producing organisms
in rectal swab samples. Paper poster presentation at ECCMID 2019.
4. Farzana R et al. The emergence of blaNDM-5 positive Escherichia coli in a
Bangladeshi hospital: linkage between clinical infections and faecal carriage.
Paper poster presentation at ICPIC 2019.
5. Farzana R et al. Molecular and epidemiological analysis of a Burkholderia cepacia
sepsis outbreak from a tertiary care hospital in Bangladesh. Oral presentation at
I&I Annual meeting 2019.
6. Farzana R et al. Burden and impact of carbapenem resistance caused by
Enterobacterales in a Bangladeshi hospital: an epidemiological, clinical and
molecular study. Accepted for oral presentation at ECCMID 2020 (the meeting
was cancelled due to pandemic COVID 19).
7. Farzana R et al. Emergence of mobile mcr-8 colistin resistance in Klebsiella
pneumoniae from clinical infections of hospitalised patients in Bangladesh.
Accepted for paper poster presentation at ECCMID 2020 (the meeting was
cancelled due to pandemic COVID 19).

v
Acknowledgements
I would like to thank the following people for helping with this research project:
Firstly, to my supervisor, Prof. Timothy R. Walsh for his unbridled support and
guidance since the writing of my scholarship application. I am grateful to Prof Walsh
for teaching me the art of writing grant applications, and project management which I
believe, would aid me to sustain in the research field beyond my PhD.
To my supervisor, Dr Lim S. Jones for unabated encouragement and constructive
criticism to improve my research thoughts.
To Dr Anisur Rahman for his assistance in sampling and clinical data collection.
To my funder, Commonwealth Scholarship Commission, for providing financial
support for my study.
To Dr Kirsty Sands, Prof. Julian Parkhill, and Dr. Andries J Van Tonder for their
imperative suggestions in bioinformatic analysis.
To Edward Portal for helping in Illumina MiSeq sequencing.
To Jose Munoz Criollo, and Prof. Martyn Guest for benchmarking analysis to improve
the performance of software used for bioinformatic analysis in Advanced Research
Computing at Cardiff (ARCCA).
To my colleagues in our department, Dr. Owen B. Spiller, Dr. Mark A. Toleman, Janis
Weeks, Ian Boostrom Mei Li, Dr Qiue Yang, Dr Yang Yu, Dr Brekhna Hassan, Dr Ali
Aboklaish, Dr Laura E. Cadena, Dr Jonathan Tyrrell, Katy Thomson, and Dr Diego
Andrey for their continuous support and kindness during my study period.
To my mentors and colleagues at Dhaka Medical College Hospital (DMCH), Prof.
Ismail Khan, Prof. Abul Kalam, and Dr Monira Pervin for allowing me to collect
patients’ samples and to undertake initial processing of clinical specimens at DMCH.
Finally, to my parents for giving me strength to reach for the stars and chase my
dreams.

vi
LIST OF FIGURES
Figure 1.1 Death attributable to AMR by 2050 compared to other disease
condition……………………………………………………………………………...3
Figure 1.2 The timeline of discovery and resistance of antimicrobials……………….7
Figure 1.3 Peptidoglycan biosynthesis……………………………………………...12
Figure 1.4 Mechanism of action of carbapenems……………………………………17
Figure 1.5 Structure of metallo β-lactamases and their binding sites with β-lactam
antibiotics……………………………………………………………………………21
Figure 1.6 Global distribution of NDM producers…………………………………24
Figure 1.7 Geographical distribution of predominant clones of E. coli harbouring
blaNDM based on E. coli genomes in NCBI archive until 31 July 2020
(n=575)……................................................................................................................25
Figure 1.8 Geographical distribution of predominant clones of K. pneumoniae
harbouring blaNDM based on K. pneumoniae genomes in NCBI archive until 31 July
2020 (n=735)………………………………………………………………………...27
Figure 1.9 Global distribution of OXA-48 producers……………………………….40
Figure 1.10 Global distribution of OXA-181 and OXA-232 producers……………..41
Figure 1.11 Mechanism of action of colistin………………………………………..46
Figure 1.12 Mechanism of colistin resistance……………………………………….48
Figure 1.13 Global distribution of mcr-like mechanism…………………………….51
Figure 1.14 Chronological discovery of mcr variants from animal and
human………………………………………………………………………………..53
Figure 1.15 Geographical distribution of different mcr variants…………………….54
Figure 3.1 Flowchart diagram of clinical sample collection at
DMCH……………………………………………………………………………..100
Figure 3.2 Susceptibility patterns of Salmonella spp. (n=5), P. agglomerans (n=1), E.
hermannii (n=1), and L. adecarboxylata (n=1)……………………………………..109

vii
Figure 3.3 Comparative distribution of carbapenemase alleles among different species
of clinical Enterobacterales………………………………………………………...113
Figure 3.4 Susceptibility patterns of clinical Enterobacterales against the antibiotics
tested……………………………………………………………………………….116
Figure 3.5 Distribution of age and sex among the patients with Enterobacterales
infections…………………………………………………………………………...124
Figure 3.6 Locality of the participants enrolled in this study……………………….125
Figure 3.7 Overview of socio-economic status of the patients admitted at
DMCH……………………………………………………………………………..126
Figure 3.8 The distribution of Enterobacterales isolation from the patients admitted in
different wards of DMCH according to age groups………………………………...127
Figure 3.9 Antibiotics usage in different wards of DMCH…………………………128
Figure 3.10 The overall outcome of the participants with Enterobacterale
infections…………………………………………………………………………...134
Figure 3.11 Kaplan–Meier plot representing the cumulative proportion of all-cause in-
hospital 30-days mortality of CRE patients compared to CSE patients with a timescale
‘time from infection’ to outcome…………………………………………………...140
Figure 3.12 Scattered plot representing the distribution of patients’ outcome data by
merging with genomic profile (the relation between the cumulative number of ARGs
and that of VF of respective isolate) of E. coli and K. pneumoniae isolated from the
respective patient…………………………………………………………………...143
Figure 4.1 Flowchart diagram of colonisation study at DMCH……………………153
Figure 4.2 The frequency of isolation of different species of Enterobacterales from
RSs at DMCH (n=700)……………………………………………………………..154
Figure 4.3 The prevalence CRE carriage among inpatients versus the prevalence
among outpatients………………………………………………………………….158
Figure 4.4 Comparative distribution of carbapenemase alleles among different species
of faecal Enterobacterales………………………………………………………….161

viii
Figure 4.5 Susceptibility patterns of faecal Enterobacterales against the antibiotics
tested……………………………………………………………………………….165
Figure 4.6 A. Phylogenetic tree generated with blaNDM-5-positive isolates from binary
presence and absence of accessory genes using roary (v3.12.0). B. Distribution of
isolates (n=167) in the cluster shared blaNDM-5, blaTEM-1, aadA2, rmtB, sul1, and dfrA12
among different species isolated from different source……………………………..170
Figure 4.7 A. Phylogenetic tree generated with blaNDM-1-positive isolates from binary
presence and absence of accessory genes using roary (v3.12.0). B. Distribution of
isolates (n=31) in the cluster shared blaNDM-1, blaOXA-1, armA, and mph among
different species isolated from different source…………………………………….171
Figure 4.8 Locality of participants enrolled in this study…………………………..173
Figure 4.9 Antibiotics usage in different wards of DMCH among the participants
enrolled for the colonisation study………………………………………………….175
Figure 5.1 ML tree generated from core-genome analysis of E. coli isolated in this
study………………………………………………………………………………..187
Figure 5.2 The distribution of clinical E. coli among different clonal types………..188
Figure 5.3 A. The distribution of faecal E. coli among different clonal types. B. The
distribution of faecal E. coli among different clonal types isolated from patients
attended to OPD……………………………………………………………………190
Figure 5.4 Bubble plot representing the relation between the prevalence of different
E. coli clonal types and the frequency of carbapenemase producers to pertinent clonal
types………………………………………………………………………………..191
Figure 5.5 The distribution of major carbapenemase alleles among different clonal
types of E. coli……………………………………………………………………...192
Figure 5.6 ML tree generated from core-genome analysis of K. pneumoniae isolated
in this study………………………………………………………………………...195
Figure 5.7 The distribution of clinical K. pneumoniae among different clonal
types………………………………………………………………………………..196

ix
Figure 5.8 A. The distribution of faecal K. pneumoniae among different clonal types.
B. The distribution of faecal K. pneumoniae among different clonal types isolated from
patients attended in OPD…………………………………………………………...198
Figure 5.9 Bubble plot representing the relation between the prevalence of different
K. pneumoniae clonal types of and the frequency of carbapenemase producers to
pertinent clonal types……………………………………………………………….199
Figure 5.10 The distribution of major carbapenemase alleles among different clonal
types of K. pneumoniae…………………………………………………………….200
Figure 5.11 ML tree generated from core-genome analysis of Proteus spp. isolated in
this study…………………………………………………………………………...203
Figure 5.12 ML tree generated from core-genome analysis of Enterobacter spp.
isolated in this study………………………………………………………………..204
Figure 5.13 ML tree generated from core-genome analysis of Citrobacter spp. isolated
in this study………………………………………………………………………...205
Figure 5.14 ML tree generated from core-genome analysis of Providencia spp.
isolated in this study………………………………………………………………..206
Figure 5.15 Core-genome SNP tree of isolates belonged to major clones of E. coli
associated with carbapenem resistance and screening of outbreaks in E.
coli………………………………………………………………………………….209
Figure 5.16 Network map generated with the isolates of a putative outbreak cluster of
E. coli ST648……………………………………………………………………….210
Figure 5.17 Time calibrated phylogenetic tree generated from of E. coli genomes
belonged to ST167 along with closely related isolates from other STs (ST10, ST1702,
and novel allele) (n=97)…………………………………………………………….211
Figure 5.18 Time calibrated phylogenetic tree generated from of E. coli genomes
belonged to ST448 along with closely related isolates from other STs (ST2083,
ST1702, and novel allele) (n=45)…………………………………………………..212

x
Figure 5.19 Time calibrated phylogenetic tree generated from of E. coli genomes
belonged to ST8346 (n=32). E. coli ST8346 was recognised as an emerging clone in
Bangladesh…………………………………………………………………………213
Figure 5.20 Time calibrated phylogenetic tree generated from of E. coli genomes
belonged to ST405 along with closely related isolates from ST5954
(n=77)………………………………………………………………………………214
Figure 5.21 Time calibrated phylogenetic tree generated from of E. coli genomes
belonged to ST648 along with closely related isolates from other STs (ST2011,
ST6870, and ST9666) (n=57)………………………………………………………215
Figure 5.22 Core-genome SNP tree of isolates of major clones of K. pneumoniae
associated with carbapenem resistance, and screening of outbreaks in K.
pneumoniae………………………………………………………………………...216
Figure 5.23 Network map generated with the isolates of an outbreak cluster of K.
pneumoniae ST23…………………………………………………………………..217
Figure 5.24 Network map generated with the isolates of a putative outbreak cluster of
K. pneumoniae ST15……………………………………………………………….218
Figure 5.25 Network map generated with the isolates of putative outbreak cluster of
K. pneumoniae ST16 [A], and E. cloacae ST113 [B]....................................……….219
Figure 5.26 ML tree generated from core-genome SNP analysis of K. pneumoniae
isolates found in putative outbreak clusters………………………………………...220
Figure 5.27 Time calibrated phylogenetic tree generated from of K. pneumoniae
genomes belonged to ST15 along with a closely related isolate of novel allele
(n=54)………………………………………………………………………………222
Figure 5.28 Time calibrated phylogenetic tree generated from of K. pneumoniae
genomes belonged to ST16 (n=37)…………………………………………………223
Figure 6.1 Phylogenetic tree was built with the complete, circular sequences of
plasmids harbouring blaNDM (n=133) based on presence and absence of genes using
roary (v3.12.0)……………………………………………………………………...236
Figure 6.2 Investigating the horizontal transfer plasmids at DMCH……………….237

xi
Figure 6.3 Clustering of plasmids in different plasmids’ groups based on identical
resistance pattern…………………………………………………………………...240
Figure 6.4 The prevalence of resistance to different antimicrobials among the plasmids
harbouring blaNDM………………………………………………………………….241
Figure 6.5 Genetic context of mcr-9 in plasmid belonged to C3 (IncH12)…………242
Figure 6.6 A. Schematic layout of IncFII plasmid of subgroup A1-b carrying blaNDM-
5 identified in this study. B. Colinear alignment of IncFII plasmids harbouring blaNDM-
5 of sub-group A1-b (n=13)…………………………………………………………248
Figure 6.7 A. Schematic layout of IncFII plasmid of subgroup A2-b carrying blaNDM-
5 identified in this study. B. Colinear alignment of IncFII plasmids harbouring blaNDM
of sub-group A2-b (n=3)……………………………………………………………249
Figure 6.10 A. Schematic layout of IncFIB(pQil) plasmid of subgroup F3 carrying
blaNDM identified in this study. B. Colinear alignment of IncFIB(pQil) plasmids
harbouring blaNDM of sub-group F3 (n=2)………………………………………….252
Figure 6.11 Genetic context around blaNDM-5 in different plasmid backgrounds.…..255
Figure 6.12 Genetic context around blaNDM-1 in different plasmid backgrounds…...257
Figure 6.13 Genetic context around blaNDM-7 and blaNDM-4 in different plasmid
backgrounds…..........................................................................................................259
Figure 7.1 Study flowchart………………………………………………………...269
Figure 7.2 The species isolated from blood specimens from neonates during October
2016 to March 2017………………………………………………………………...270
Figure 7.3 Antimicrobial resistance phenotypes and genetic profile of outbreak
strains………………………………………………………………………………271
Figure 7.4 Capsular loci (K) to Klebsiella variicola ST771………………………..278
Figure 7.5 Pulsed-field gel of S1 nuclease digested gDNA carrying blaCTX-M and in-
gel hybridization with blaCTX-M probe………………………………………………279
Figure 7.6 Pulsed-field gel of S1 nuclease digested gDNA carrying blaNDM and in-gel
hybridization with blaNDM probe…………………………………………………...280

xii
Figure 7.7 In vivo pathogenicity testing in Galleria mellonella model to compare the
virulence of K. Variicola Vs K. Pneumoniae……………………………………….284
Figure 8.1 Structural organization of plasmid, pRS571-MCR-1.1 (accession no:
CP034390)…………………………………………………………………………294
Figure 8.2 Linear comparison of plasmid sequence pRS571-MCR-1.1 (accession no:
CP034390), pSA186_MCR1 (accession no: CP022735.1) and pSA26-MCR-1
(accession no: KU743384.1)……………………………………………………….295
Figure 8.3 Phylogenetic tree of K. pneumoniae ST15 identified in this study
(n=29)……………………………………………………………………………....300
Figure 8.4 Linear comparison of plasmid sequence pKP914 (accession no: CP046952)
and pKP782 (accession no: CP046384), recovered in this study…………………...304
Figure 8.5 Genetic organization of plasmid harbouring of mcr-8.1. Circular view of
pKP914 (accession no: CP046952)………………………………………………...305
Figure 8.6 Pulsed-field gel of S1 nuclease digested gDNA carrying mcr-8.1 and in-
gel hybridization with mcr-8.1 probe……………………………………………….306
Figure 8.7 Schematic layout of sequence comparison of pKP914 (accession no:
CP046952) against FDAARGOS_440 plasmid unnamed2 (accession no: CP023922.1)
and pMR0617ctx (accession no: CP024040.1)……………………………………..307
Figure 8.8 Comparison of genetic environments of mcr-8.1……………………….309
Figure 8.9 Stability of plasmid mediated colistin resistance in K.
pneumoniae………………………………………………………………………...311
Figure 9.1 A maximum likelihood phylogenetic tree of members of the genus
Burkholderia based conserved proteins…………………………………………….320
Figure 9.2 β-lactam resistance mediated by ampC overexpression………………...323
Figure 9.3 Study flowchart………………………………………………………...327
Figure 9.4 Length of hospital stay of the patients with B. cepacia
bacteraemia………………………………………………………………………...330

xiii
Figure 9.5 A maximum likelihood tree of B. cepacia by core genome SNPs with
epidemiological data and ARGs……………………………………………………332
Figure 9.6 Minimum spanning tree of B. cepacia by MLST type………………….333
Figure 9.7 Substitutions of amino acid in ampD compared to ampD (BCAL3430) of
B. cenocepacia strain J2315………………………………………………………..337
Figure 9.8 Heatmap showing the presence of virulence genes in B.
cepacia……………………………………………………………………………..339
Figure 10.1 Bangladesh National Account 1997 to 2012…………………………..346
Figure 10.2 Percentage of population served by different type of sanitation system
across the world (Nominal, 2014)…………………………………………………..352
Figure 10.3 Hand hygiene practices in the hospitals of Bangladesh………………..353
Figure 10.4 Factors facilitate the dissemination of AMR…………………………..357
Figure 10.5 Report of mcr from Bangladesh from different sources………………360

xiv
LIST OF TABLES
Table 1.1 Classification of carbapenemases………………………………………...19
Table 1.2 Key properties of variants of blaNDM……………………………………...30
Table 1.3 Key properties of OXA carbapenemases…………………………………36
Table 1.4 Key properties of blaOXA-48-like……………………………………………42
Table 1.5 Nucleotide identity among the mcr variants………………………………53
Table 1.6 Key properties of mcr variants……………………………………………55
Table 1.7 The recent update of AMR surveillance in the countries of SA according to
GLASS Early Implementation Report 2020…………………………………………57
Table 1.8 WHO listed priority pathogens…………………………………………...59
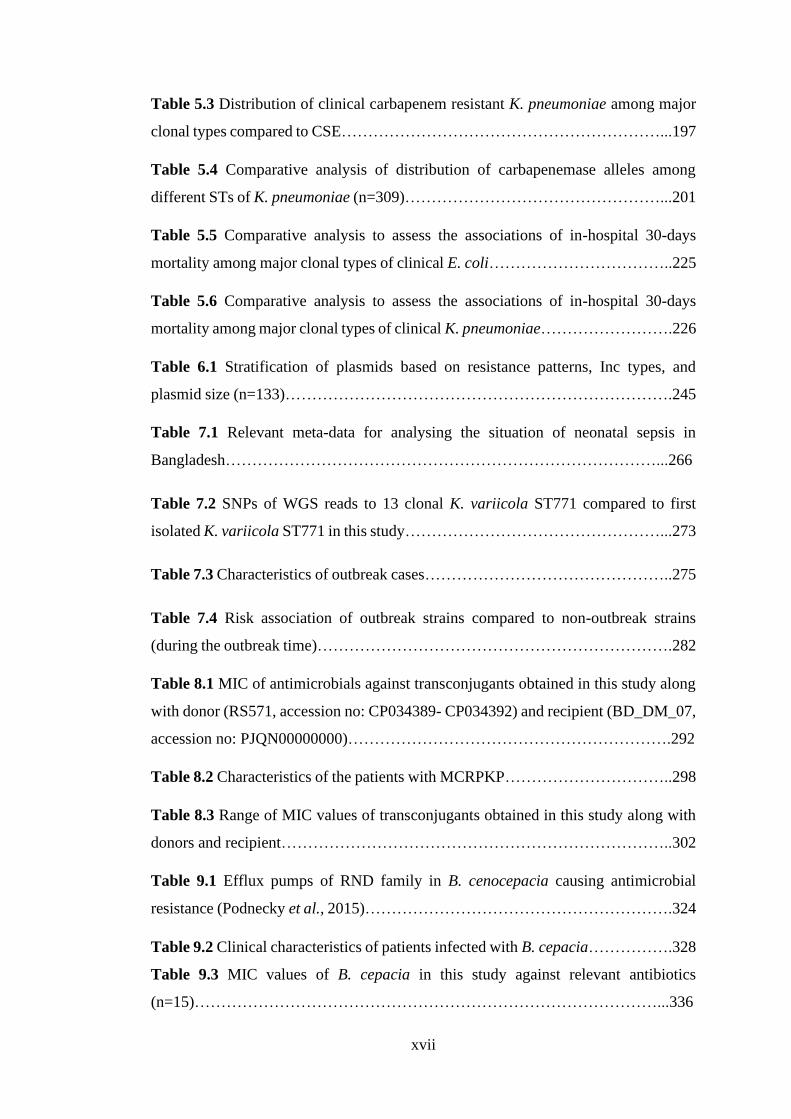
Table 1.9 Scoping findings relevant to this study from previous literature
searches……………………………………………………………………………...61
Table 2.1 Utilization of services in DMCH (nominal, 2019) (MOHFW,
2016)*……………………………………………………………………………….72
Table 2.2 Assessment of socio-economic status…………………………………….75
Table 2.3 Details of antimicrobials used in this study for susceptibility testing……..78
Table 2.4 Serial dilution of antimicrobials to reach desired concentration…………..79
Table 2.5 Primers used in this study…………………………………………………81
Table 2.6 Sequences of primers and probes for qPCR designed in this study……….92
Table 3.1 Total number of culture-positive clinical specimens from different wards of
DMCH in this study (n=1892*)…………………………………………………….101
Table 3.2 Total number of clinical isolates identified in this study (n=1583)………102
Table 3.3 MIC ranges of clinical Enterobacterales………………………………...105
Table 3.4 Antimicrobial susceptibility patterns of clinical Enterobacterales………108

xv
Table 3.5 Comparative analysis for the distribution of carbapenem resistance among
the species of Enterobacterales (n=642)……………………………………………110
Table 3.6 The distributions of carbapenemases alleles among the species of clinical
Enterobacterales (n=642)…………………………………………………………..112
Table 3.7 Range of carbapenems’ MIC of OXA-232 producers…………………..114
Table 3.8 Comparative resistance profile to non-β-lactam antibiotics between CRE
and CSE……………………………………………………………………………117
Table 3.9 Comparative resistance profile to non-β-lactam antibiotics between
carbapenem-resistant E. coli and carbapenem-sensitive E. coli……………………118
Table 3.10 Comparative resistance profile to non-β-lactam antibiotics between
carbapenem-resistant K. pneumoniae and carbapenem-sensitive K. pneumoniae.....119
Table 3.11 The associations of prevalent ARGs with blaNDM-1-positive clinical isolates
compared to blaNDM-1-negative clinical isolates…………………………...120
Table 3.12 The associations of prevalent ARGs with blaNDM-5-positive clinical isolates
compared to blaNDM-5-negative clinical isolates…………………………...121
Table 3.13 The associations of prevalent ARGs with blaOXA-181-positive clinical
isolates compared to blaOXA-181-negative clinical isolates………………………….122
Table 3.14 The frequency of patients with at least one effective antimicrobial stratified
based on patients’ outcome………………………………………………………...129
Table 3.15 Comparative analysis to assess the associations of patients’ overall
mortality with at least one effective antimicrobial therapy…………………………133
Table 3.16 Descriptive statistics for risk assessment of CRE clinical cases compared
to CSE cases………………………………………………………………………..136
Table 3.17 Descriptive statistics for risk assessment of CRE clinical cases compared
to CSE cases with burn infections………………………………………………….137
Table 3.18 Descriptive statistics for risk assessment of CRE clinical cases compared
to CSE cases excluding burn cases…………………………………………………138

xvi
Table 3.19 Cox proportional hazards models to analyse for the impact carbapenem
resistance on patients’ outcome…………………………………………………….141
Table 3.20 Comparative analysis to assess the associations of all-cause 30-days
mortality with genomic profiles (ARG and VF scores) of Enterobacterales isolated
from respective patients……………………………………………………………142
Table 4.1 Antimicrobial susceptibility pattern of faecal Enterobacterales…………155
Table 4.2 Antimicrobial susceptibility patterns of faecal Enterobacterales………..157
Table 4.3 The distributions of carbapenemases alleles among the species of faecal
Enterobacterales (n=425)…………………………………………………………..160
Table 4.4 Range of carbapenems’ MIC of carbapenemase producing Enterobacterales
having lower clinical breakpoints………………………………………………….162
Table 4.5 Comparative resistance profile to non-β-lactam antibiotics between CRE
and CSE……………………………………………………………………………166
Table 4.6 The associations of prevalent ARGs with blaNDM-1-positive faecal isolates
compared to blaNDM-1-negative faecal isolates……………………………………..167
Table 4.7 The associations of prevalent ARGs with blaNDM-5-positive faecal isolates
compared to blaNDM-5-negative faecal isolates……………………………………..168
Table 4.8 The associations of prevalent ARGs with blaNOXA-181-positive faecal isolates
compared to blaNOXA-181-negative faecal isolates………………………….169
Table 4.9 Overall hygiene status of the participants according to socioeconomic
condition (n=700)………………………………………………………………….174
Table 4.10 Descriptive statistics for risk assessment of faecal carriage of CRE
compared to participants without CRE……………………………………………..177
Table 5.1 Distribution of clinical carbapenem-resistant E. coli among major clonal
types compared to carbapenem-sensitive E. coli…………………………………...189
Table 5.2 Comparative analysis of distribution of carbapenemase alleles among
different STs of E. coli (n=521)…………………………………………………….193
xvii
Table 5.3 Distribution of clinical carbapenem resistant K. pneumoniae among major
clonal types compared to CSE……………………………………………………...197
Table 5.4 Comparative analysis of distribution of carbapenemase alleles among
different STs of K. pneumoniae (n=309)…………………………………………...201
Table 5.5 Comparative analysis to assess the associations of in-hospital 30-days
mortality among major clonal types of clinical E. coli……………………………..225
Table 5.6 Comparative analysis to assess the associations of in-hospital 30-days
mortality among major clonal types of clinical K. pneumoniae…………………….226
Table 6.1 Stratification of plasmids based on resistance patterns, Inc types, and
plasmid size (n=133)……………………………………………………………….245
Table 7.1 Relevant meta-data for analysing the situation of neonatal sepsis in
Bangladesh………………………………………………………………………...266
Table 7.2 SNPs of WGS reads to 13 clonal K. variicola ST771 compared to first
isolated K. variicola ST771 in this study…………………………………………...273
Table 7.3 Characteristics of outbreak cases………………………………………..275
Table 7.4 Risk association of outbreak strains compared to non-outbreak strains
(during the outbreak time)………………………………………………………….282
Table 8.1 MIC of antimicrobials against transconjugants obtained in this study along
with donor (RS571, accession no: CP034389- CP034392) and recipient (BD_DM_07,
accession no: PJQN00000000)…………………………………………………….292
Table 8.2 Characteristics of the patients with MCRPKP…………………………..298
Table 8.3 Range of MIC values of transconjugants obtained in this study along with
donors and recipient………………………………………………………………..302
Table 9.1 Efflux pumps of RND family in B. cenocepacia causing antimicrobial
resistance (Podnecky et al., 2015)………………………………………………….324
Table 9.2 Clinical characteristics of patients infected with B. cepacia…………….328
Table 9.3 MIC values of B. cepacia in this study against relevant antibiotics
(n=15)……………………………………………………………………………...336

xviii
Table 10.1 Brief description of microbiology capacity of the major MCHs of
Bangladesh………………………………………………………………………...347
Table 10.2 AMR programmes at the national level in Bangladesh………………...348

xix
LIST OF ABBREVIATIONS
AA Amino acid
ACT Artemis comparison tool
AMR Antimicrobial resistance
ANC Antenatal care
API Active pharmaceutical ingredient
ARGs Antimicrobial resistance genes
AST Antimicrobial susceptibility testing
Bcc Burkholderia cepacia complex
BDT Bangladeshi Taka
BEAST Bayesian Evolutionary Analysis by Sampling Trees
BFs Bayes factors
bla β-lactamase
BSIs Bloodstream infections
CAI Community acquired infections
CARD Comprehensive Antibiotic Resistance Database
CF Conversion Factor
cfu Colony forming unit
CGE Center for Genomic Epidemiology
CLRW Clinical Laboratory Reagent Water
CPI Consumer price index
CRE Carbapenem-resistant Enterobacterales
CSE Carbapenem-sensitive Enterobacterales
CU Cardiff University
DAMA Discharge against medical advice
DHP Dehydropeptidase
DLS Department of Livestock Services
DMCH Dhaka Medical College Hospital
ECOFF Epidemiological cut-off
EEA European Economic Area
EOS Early-onset neonatal sepsis
ERC Ethical Review Committee
ESBL Extended-spectrum β-lactamase

xx
EU European Union
EUCAST European Committee on Antimicrobial Susceptibility Testing
FF Fleming Fund
GDP Gross domestic product
GLASS Global Antimicrobial Resistance Surveillance System
GTR General time reversible
GWASs Genome-wide association studies
HDU High dependency unit
HGT Horizontal gene transfer
HICs High-income countries
HKG Housekeeping gene
HMM High molecular mass
IAIs Intra-abdominal infections
ICU Intensive care unit
IEDCR Institute of Epidemiology Disease Control and Research
INR Indian Rupee
IPC Infection prevention and control
IR Inverted repeat
IS Insertion sequence
LBW Low-birth weight
LMICs Low- and middle-income countries
LMM Low molecular mass
LoS Length of hospital stay
LOS Late-onset neonatal sepsis
MBL Metallo beta-lactamase
MCC Maximum clade credibility
MCH Medical College Hospital
MCMC Markov Chain Monte Carlo
MCRPEC MCR-1.1-positive E. coli
MCRPKP MCR-8.1-positive K. pneumoniae
MDR Multi-drug resistant
MIC Minimum inhibitory concentration
ML Maximum likelihood
MLST Multi-locus sequence typing

xxi
MODS Multiple organ dysfunction syndrome
MOHFW Ministry of Health and Family Welfare
MRSA Methicillin-resistant Staphylococcus aureus
n.d. no date
NAP National Action Plan
NCC National Coordinating Centre
NDMs New Delhi metallo-β-lactamases
NICU Neonatal intensive care unit
OD Optical density
OMPs Outer membrane proteins
OPD Out-patient department
OXA Oxacillinase
PBPs Penicillin-binding proteins
PBRT PCR-based replicon typing
PCR Polymerase chain reaction
PFGE Pulsed-field gel electrophoresis
PROM prolonged rupture of the chorioamniotic membrane
RND Resistance nodulation cell division
RSs Rectal swabs
SA South-Asia
SDG Sustainable development goal
SDS Sodium dodecyl sulfate
SEA Southeast Asia
SEAR SEA region
SNP Single nucleotide polymorphism
TBSA Total body surface area
TMRCA The most recent common ancestor
UNICEF United Nations Children's Fund
US United States
UTIs Urinary tract infections
VAP Ventilator-associated pneumoniae
VF Virulence factor
VFDB Virulence Factor Database
WGS Whole Genome Sequencing

xxii
WHO World Health Organization
XDR Extensively drug-resistant

xxiii
CONTENTS
Title page i
Summary ii
Publications iii
Acknowledgements v
Declaration vi
List of figures vii
List of tables xv
List of abbreviations xx
Section One
General Introduction
1.1 Antimicrobial resistance: A global public health concern 2
1.2 Antibiotics experience in the pre-antibiotic era and evolution of AMR 5
1.3 Discovery of antibiotics and subsequent resistance 6
1.4 Mechanism of AMR
1.4.1 Genetic basis of AMR 9
1.4.2 Mechanistic basis of AMR 9
1.5 AMR and bacterial production of β-lactamase 10
1.6 Penicillin-binding proteins 11
1.7 Extended-spectrum-β-lactamases 13
1.8 Carbapenemases
1.8.1 Discovery and introduction of carbapenem in clinical practice 15
1.8.2 Antibacterial spectrum and mechanism of action of carbapenem 15
1.8.3 Carbapenem Resistance: An Overview 18
1.8.4 Metallo-β-lactamases 20
1.8.5 New Delhi metallo-β-lactamase
1.8.5.1 Discovery 22
1.8.5.2 Epidemiology and spread of blaNDM 22
1.8.5.3 Variants of blaNDM 29
1.8.6 OXA carbapenemases 35

xxiv
1.8.6.1 OXA-48 β-lactamase 38
1.8.6.2 Discovery and origin of OXA-48 β-lactamase 38
1.8.6.3 Epidemiology and spread of blaOXA-48 39
1.9 Mobile colistin resistance
1.9.1 Introduction of colistin as an antibacterial agent 45
1.9.2 Antibacterial spectrum and mode of action of colistin 45
1.9.3 Mechanism of colistin resistance 47
1.9.4 Discovery of mcr 50
1.9.5 Epidemiology and spread of mcr 50
1.9.6 Variants of mcr 52
1.10 Rationale for the study design in this PhD 56
Section Two
Materials and Methods
2.1 Collection of samples
2.1.1 Hospital setting 72
2.1.2 Ethical considerations 73
2.1.3 Study design 73
2.1.4 Collection of clinical specimens 73
2.1.5 Collection of rectal swabs 74
2.1.6 Collection of patients’ demographic and clinical data 74
2.1.6.1 Assessment of socio-economic status 74
2.2 Transfer of biological specimens 76
2.3 Cultivation of bacteria 76
2.4 Immortalization 76
2.5 Determination of phenotypic resistance patterns 77
2.6 Operational definition of carbapenem-resistant Enterobacterales 80
2.7 Polymerase chain reaction 81
2.8 Whole genome sequencing
2.8.1 DNA extraction 82
2.8.2 DNA quantitation 82
2.8.3 Illumina MiSeq sequencing
2.8.3.1 Preparation of genomic libraries 82

xxv
2.8.3.2 Bioinformatic analysis of raw reads (fastq) from Illumina MiSeq
system 83
2.8.4 MinION sequencing
2.8.4.1 Preparation of genomic libraries 84
2.8.4.2 Bioinformatic analysis of raw Nanopore reads 84
2.8.5 Phylogenetic analysis 85
2.8.6 Phylogeographic analysis 86
2.8.6.1 Genomes retrieved from National Center for Biotechnology
Information 87
2.8.7 Analysis using publicly available database 87
2.9 Pulsed-field gel electrophoresis
2.9.1 Making of plugs 88
2.9.2 Lysis of Cells and washing in Agarose Plugs 88
2.9.3 Digestion of DNA in agarose plugs
2.9.3.1 Digestion by restriction enzyme 88
2.9.3.2 Digestion by S1 enzyme 89
2.9.4 Electrophoresis 89
2.10 In-gel hybridization of gene of interest
2.10.1 Pre-hybridization processing of gel 89
2.10.2 Preparation of radioactive probe 89
2.10.3 In gel hybridization step 90
2.11 Investigating the stability of plasmid 91
2.12 Conjugation experiment 93
2.13 In vitro time-growth studies 94
2.14 In vivo pathogenicity testing in Galleria mellonella 95
2.15 Statistical analysis 96

xxvi
Section Three
Estimating Prevalence, Risks, and Burden of Carbapenem-Resistant
Enterobacterales in Clinical Infections of a Bangladeshi Health Setting
3.1 Introduction 98
3.2 Results
3.2.1 Prevalence of Enterobacterales infections in 99
a clinical setting of Bangladesh
3.2.2 Characterization of clinical Enterobacterales 104
for carbapenem resistance and susceptibility
patterns of other relevant antimicrobials
3.2.3 The prevalence of carbapenemases alleles in 111
clinical Enterobacterales
3.2.4 Investigating the associations of non-β-lactam 115
resistance in clinical CRE
3.2.5 Baseline data of patients with Enterobacterales infections 123
3.2.6 Risk assessment of baseline variables 135
3.2.7 Outcome analysis of CRE cases compared to CSE 139
3.3 Discussion 144
Section Four
Molecular Epidemiology and Risk Analysis of Carbapenem-Resistant
Enterobacterales in Faecal Carriage
4.1 Introduction 150
4.2 Results
4.2.1 Study outline and prevalence of CRE carriage 152
in a clinical setting of Bangladesh
4.2.2 The prevalence of carbapenemases alleles in 159
faecal Enterobacterales
4.2.3 Investigating the associations of non-β-lactam 163
resistance in faecal CRE
4.2.4 Baseline data of the participants enrolled in carriage study 172

xxvii
4.2.5 Risk assessment of baseline variables 176
4.3 Discussion 179
Section Five
Investigating Clonal Dissemination of Carbapenem-Resistant Enterobacterales
5.1 Introduction 184
5.2 Results
5.2.1 Screening of high-risk clones for carbapenem resistance
5.2.1.1 Population structure of E. coli 185
5.2.1.2 Population structure of K. pneumoniae 194
5.2.1.3 Population structure of other species of Enterobacterales 202
5.2.2 Investigating possible transmissibility in putative 207
outbreak clusters associated with carbapenem resistance
5.2.3 Time-calibrated evolutionary analysis of high-risk 221
clones emerged with carbapenem resistance
5.2.4 Impact of high-risk clone on patients’ outcome 224
5.3 Discussion 227
Section Six
Investigating the Spread of New-Delhi metallo-β-lactamase due to Horizontal
Gene Transfer
6.1 Introduction 232
6.2 Results
6.2.1 Molecular epidemiology of plasmids 235
harbouring blaNDM at DMCH
6.2.2 Analysing the associations of blaNDM with other ARGs 238
6.2.3 Investigating transmission of blaNDM due to 243
horizontal transfer of plasmid
6.2.4 Investigating possible role of mobile genetic elements in the spread of
blaNDM
6.2.4.1 Evaluating the genetic context of blaNDM-5 253
6.2.4.2 Evaluating the genetic context of blaNDM-1 256

xxviii
6.2.4.3 Evaluating the genetic context of blaNDM-4 and blaNDM-7 258
6.3 Discussion 260
Section Seven
Outbreak of Hypervirulent Multi-Drug Resistant Klebsiella variicola Causing
High Mortality in Neonates in Bangladesh
7.1 Introduction 265
7.2 Results
7.2.1 Tracking the outbreak by K. variicola 268
7.2.2 Overview of the outbreak by K. variicola 274
7.2.3 Resistance and virulence profiling of K. variicola 277
7.2.4 Risk assessment of the outbreak by K. variicola 281
7.2.5 In vivo pathogenicity testing of K. variicola 283
in G. mellonella
7.3 Discussion 285
Section Eight
Emergence of Mobile Colistin Resistance in a Clinical Setting in Bangladesh
8.1 Introduction 288
8.2 Results
8.2.1 Prevalence of human-associated mcr in a Bangladeshi health setting 289
8.2.2 Description of the case colonised by MCRPEC 290
8.2.3 Resistance profile of MCRPEC 291
8.2.4 Genetic context of plasmids carrying mcr-1.1 in this study 293
8.2.5 Description of cases with infections by MCRPKP 297
8.2.6 Investigation of clonal relatedness of MCRPKP 299
8.2.7 Resistance profile of MCRPKP 301
8.2.8 Genetic context of plasmids carrying mcr-8.1 in this study 303
8.2.9 Determining the stability of plasmid carrying mcr-8.1 310
8.2.10 Determining fitness cost of MCRPKP 312
8.3 Discussion 314

xxix
Section Nine
Molecular and Epidemiological Analysis of a Burkholderia cepacia sepsis
outbreak from a Tertiary Care Hospital in Bangladesh
9.1 Introduction
9.1.1 Bloodstream infections and Burkholderia cepacia complex 318
9.1.2 Risk factors for burn infections briefly 318
9.1.3 The genus Burkholderia 319
9.1.4 Burkholderia cepacia complex 321
9.1.4.1 Pathogenesis of Bcc 321
9.1.4.1.1 AMR in Bcc 322
9.1.4.1.2 Colonisation factors 325
9.1.4.1.3 Cell surface properties 325
9.1.4.1.4 Cellular invasion 325
9.2 Result
9.2.1 Study population and overview of B. cepacia cases 326
9.2.2 Investigating possible outbreak by B. cepacia 331
9.2.3 Clonal relationship of Bangladeshi outbreak 334
strains of B. cepacia with the global B. cepacia
9.2.4 Background on resistance 335
9.2.5 Analysis of Bcc virulence 338
9.3 Discussion 340
Section Ten
General Discussion
10.1A general overview on Bangladeshi health system and AMR 344
10.2The reasons behind the indiscriminate antimicrobial 350
usage in Bangladesh
10.3Hygiene baselines in Bangladesh and spread of AMR 351
10.4The magnitude of hospital outbreak in Bangladesh 354
10.5Significance of faecal AMR screening in Bangladesh 356
10.6Emergence of colistin resistance in Bangladesh: situation analysis 358
10.7Limitation of the study 361

xxx
10.8Research prospects accomplished following this PhD 362
and concluding remark
Section Eleven
Appendices
Appendix A
Classification of antimicrobials 364
Appendix B
Classification of β-lactamases 368
Appendix C
Genome attributes of blaNDM-positive E. coli and 370
K. pneumoniae retrieved from NCBI
Appendix D
Ethical approval letter 398
Appendix E
Recipes for reagents prepared locally 400
Appendix F
Genome attributes of the isolates (retrieved from NCBI) 402
used in the phylogenetic analysis
Section Twelve
Bibliography 422

1
Section One
General Introduction

2
1.1 Antimicrobial resistance: A global public health concern
The magnitude of antimicrobial resistance (AMR) as a foremost public health
threat in the 21st century has been established on a global scale. The continual
evolution of resistance is unexpectedly ominous; propelling us into catastrophic ‘post-
antibiotic era’ as antibiotics underpin modern medicine to dealing not only with simple
bacterial sore throat but to performing all aspects of medical procedures from gut
surgery to organ transplantation (Hwang and Gums, 2016). World Health Organization
(WHO)’s report on 2014 has demonstrated the manifestation of AMR worldwide, even
to ‘last reserve antibiotics’, endorsing no country or region is exempt from the
consequences of AMR; however, there is scarcity of data on epidemiology of AMR in
WHO African and Southeast Asian (SEA) region and systemic approaches to collect
data are yet to be developed. This data reflects the gap in our understanding of the
current situation of AMR across developing countries. High prevalence of resistance
to 3rd generation cephalosporins indicates the necessity of carbapenem usage in
clinical practice which is likely to drive the emergence and dissemination of
carbapenem resistance in the health setting, limiting options to manage multi-drug
resistant (MDR) infections. Carbapenem-resistant Enterobacterales (CRE) has been
highlighted as one of the critical WHO priority pathogens. Rapid emergence of
carbapenem resistance leads to invariable usage of tigecycline and colistin - either
singularly or in combination with other antibiotics in human infections. Hence, the
discovery of plasmid mediated colistin resistance, mcr-1 in China in 2015 poses a
significant public health concern. The MCR-like mechanisms have been shown to be
widespread across five continents (WHO, 2017; Liu et al., 2016; Wang et al., 2018a;
Durante-Mangoni et al., 2019).
Forecasts predict that deaths due to AMR will reach 10 million lives each year
by 2050, which specifies the death of one person in every three seconds; however, it
is more likely to be an underestimate due to significant lack of surveillance data from
developing countries (O’Neill J, 2016; WHO, 2020a). A recent report estimates that
about 33000 people die each year in the European Union (EU) and European
Economic Area (EEA) as a direct consequence of MDR infections (Cassini et al.,
2019). According to report by Centers for Disease Control and Prevention (CDC),
MDR organisms are accountable for the 35,000 annual deaths in the United States
(US) (CDC, 2019).

3
Figure 1.1 Death attributable to AMR by 2050 compared to other disease condition
(O’Neill J, 2016).
Further to health risks, AMR would significantly impact on the global
economy and is a threat to attaining global sustainable development goals (SDGs).
AMR would consume 1.1–3.8% of its gross domestic product (GDP) annually by 2050
which would affect more the Low- and middle-income countries (LMICs). A
reduction of 0.1–2.5% in GDP has been anticipated in the sub-Saharan Africa region
(The World Bank, 2016). Economic assessment in high-income countries (HICs)
calculates the expenditure of excess $2.9 billion only for five pathogens such as
Staphylococcus aureus, Escherichia coli, Klebsiella pneumoniae, Acinetobacter
baumannii, and Pseudomonas aeruginosa in the US (Shrestha et al, 2018), and €1.1–
1.5 billion for extra healthcare costs and lost productivity in the EU/EEA each year
due to AMR (European Commission, 2020). An approximation of 24 million people
in the world would face extreme poverty by 2030, particularly in LMICs, if there is no
action to combat AMR (The World Bank, 2016).
The recent pandemic COVID-19 caused by severe respiratory syndrome
coronavirus 2 (SARSCoV-2) has drawn massive attention globally due to very rapid
spread, drastic economic breakdown, and death toll caused by the disease. Given that

4
pandemic COVID-19 contracts 5.2% of global GDP in 2020. Gross growth
downgrades to 7.2% in Latin America; 4.7% Europe and Central Asia, 4.2% in Middle
East and North Africa, 2.8% in Sub-Saharan Africa, 2.7% in South-Asia (SA), and
0.5% in East Asia and the Pacific, and tip tens of millions of people back into extreme
poverty (The World Bank, 2020a). The number of deaths globally from COVID-19 is
1,099,586 by October 2020, estimated by WHO (WHO, 2020b). The health and
economic impact due to this pandemic in nine months period is extremely abrupt and
would take years to reverse towards the developmental goals. Nevertheless, the
number of deaths from AMR would be 10 million, and the costs would be $300 billion
to more than $1 trillion per annum by 2050 which has been predicted to be still higher
than the COVID shock (Dadgostar, 2019; Nieuwlaat et al., 2020). Moreover, the vast
majority of COVID-19 patients receiving intensive care unit (ICU) care have been
prescribed with antibiotics because of difficulties of ruling out bacterial co-infection
or secondary bacterial infections which perhaps exacerbates the burden of pre-existing
pandemic AMR (Langford et al., 2020).

5
1.2 Antibiotics experience in the pre-antibiotic era and evolution of AMR
The proof of antibiotic or antibiotic-like properties have been revealed in the
ancient practices where naturally available substances such as herbs, honey, animal
faeces and mouldy bread were used for the treatment of infections (Gould, 2016).
Tetracyclines were traced in the skeleton of ancient Sudanese Nubia dating back to
350–550 CE and Dakhleh Oasis, postulating intake of tetracycline-like materials in
their diet which had been documented to be protective against infections. However,
only archaic anecdotal or cultural facts provide few evidence of using antibiotic-like
properties, for example, use of antibiotic-like properties of red soils for skin infections
in Jordan or Artemisia plants in Chinese traditional medicine. Given the circumstances,
actinomycete bacteria was isolated from these soils, producing actinomycin C2 and
actinomycin C3 which are polypeptide antibiotics and anti-malarial drug, qinghaosu
(artemisinin) was discovered from Artemisia plants in the 1970s. Genomic
evolutionary analysis proposed that most of the resistance genes originated billion
years ago (Aminov, 2010). Presumably, the primordial resistant gene pool originated
from environmental bacterial communities and therefore, diversified and mobilized
into genetically distinct bacterial populations including pathogens. The existence of
AMR in nature is, therefore, not an event that happened by chance as selective
antibiotic pressure and other factors contribute to the spread of AMR (Aminov and
Mackie, 2007).

6
1.3 Discovery of antibiotics and subsequent resistance
Pyocyanase (liberates from P. aeruginosa) was the first antibacterial agent
which was introduced for human infections based on the observation by Rudolf
Emmerich (1856–1914) and Oscar Löw (1844–1941); however, Salvarsan is an
arsenic-based chemical, first truly modern antimicrobial agent, discovered by Paul
Ehrlich and his team in 1909. Alexander Fleming discovered penicillin in 1928 and
Howard Florey (1898–1968) and Ernst Chain (1906–1979) illustrated a purification
method, resulting penicillin available for clinical use in the 1940s. During the same
time, Klarer (1898–1953) and Mietzsch (1896–1958), synthesized Prontosil in 1932
by combing sulphonamide (was synthetized on 1909) with a dye which was a prodrug
and metabolized to sulphonamide and was proved to be effective in treating
streptococcal infections. Later the dye component was removed in the commercial
sulphonamide. The introduction of penicillin and sulphonamide in medicine was the
breakthrough in establishing golden era of antibiotic, saved thousands of lives during
World War II (Zaffiri et al., 2012; Gould, 2016; Wikipedia, 2020a; Wikipedia, 2020b).
Following the discovery early three antibiotics, the period between 1950s and 1970s
was the milestone in the development of new antibiotic classes. Simultaneously,
resistance to antimicrobials was becoming apparent following the discovery of each
class of drug (Gould, 2016).

7
Figure 1.2 The timeline of discovery and resistance of antimicrobials (Zakeri and Wright, 2008; Zaffiri et al., 2012; Gould, 2016; Iredell et al.,
2016).

8
In response to the decline of novel drugs discovery in the 1970s, the
mainstream approach to overcome the situation of AMR was to the modification of
older classes for the management of infections; however, bacteria have a natural
tendency to confer resistance to new drugs through rapid modification of existing
resistance mechanisms or the lateral transfer of acquired resistance mechanisms. AMR
has now become a complex problem, resulting significant health and economic burden
for a nation. Policy makers, national stakeholders, constitutional bodies including
clinical microbiologists and the public need to be involved to tackle the situation
(Aminov and Mackie, 2007; Aminov, 2010; WHO, 2015).

9
1.4 Mechanism of AMR
1.4.1 Genetic basis of AMR
Bacteria have remarkable genetic plasticity, allowing them to alter gene and/or
protein expression because of exposure to an environmental trigger, e.g., stress,
nutrient conditions, growth state, and subinhibitory levels of the antibiotics
themselves. Bacteria have two major genetic strategies to adapt in adverse conditions:
1. mutation 2. horizontal gene transfer (HGT). Once a resistant mutant emerges, the
antibiotic eliminates the susceptible population and the resistant bacteria predominate,
though often leading to decreased bacterial fitness. Mutation results in AMR due to
either modifications of the antimicrobials’ target or transport system in the cell
membrane controlling drug uptake, or resistance due to cell adaptation. HGT is the
most significant driver of evolution and dissemination AMR genes among bacterial
populations. The main three strategies of HGT include transformation (incorporation
of naked DNA), transduction (phage mediated), and conjugation (by “sex” pili)
(Munita and Arias, 2016; Kapoor et al., 2017).
1.4.2 Mechanistic basis of AMR
There are four major mechanisms that mediate resistance to antimicrobial
agents: including 1. bacterial production of drug inactivating enzymes 2. modification
of drug binding sites 3. reduce permeability of drug to bacterium (e.g. porin loss) or
export of drug by ‘efflux pump’ or ‘MDR pump’ 4. global cell adaptations. AMR due
to efflux of antibiotics either due to mutations in chromosomally encoded regulatory
genes or the acquisition of plasmid mediated genes causing overexpression of ‘MDR’
efflux pump and/or drug‐specific efflux pumps encoded by plasmids (Poole, 2007; Li
et al., 2015; Munita and Arias, 2016; Kapoor et al., 2017).

10
1.5 AMR and bacterial production of β-lactamase
β-lactam antibiotics are the most widely prescribed antimicrobials classes
worldwide. β-lactamases are the enzymes that inactivate the action of β-lactams by
hydrolysing the β-lactam ring. Based on the sequence analysis, β-lactamases, and the
penicillin-binding proteins (PBPs) are believed to diverge from a common ancestor.
All PBPs possess β-lactam catalysing capability to a smaller extent. To date, four
classes of β-lactamases are recognized (A-D), correlating with the functional
classification. Classes A, C, and D act by a serine based mechanism, whereas class B
or metallo-β-lactamases (MBLs) need zinc for their action (Kong et al., 2010; Bush,
2018). Classifications of antibiotics and β-lactamase are described in appendices
(appendix A, and appendix B).
The first β-lactamase, capable to destroy antibiotics of penicillin family was
described in 1940 by Edward Abraham and Ernst Chain (Davies and Davies, 2010).
Many genera of bacteria possessing chromosomal β-lactamase, supposed to be owned
by selective pressure of environmental β-lactam producing soil organisms. The earliest
transferrable β-lactamase in Gram-negatives was the TEM-1 in E. coli, named after
the patient Temoniera in Greece from whom it was recovered in 1965. Hitherto, this
enzyme was found to be distributed worldwide also into the other species. Another β-
lactamase, SHV-1 (for sulphydryl variable) was instigated as a chromosomal gene in
Klebsiella spp. and was later incorporated into plasmid and therefore disseminated into
other species. These enzymes did not confer resistance to oxyimino-cephalosporins
(Bradford, 2001; Shaikh et al., 2015).

11
1.6 Penicillin-binding proteins
PBPs are transpeptidases or carboxypeptidases, involved in peptidoglycan
biosynthesis (Figure 1.3). PBPs have been divided into two main categories, the high
molecular mass PBPs and the low molecular mass PBPs. Generally, HMM PBPs have
transpeptidase and glycosyltransferase activity. To illustrate the function LMM PBPs,
the PBPs of E. coli have been used as an example. LMM PBPs of E. coli are involved
in cell separation, peptidoglycan maturation or recycling. PBP4 and PBP7 have
endopeptidases activity, cleaving cross-bridges between two glycan strands. PBP5,
PBP6, and PBP6b have carboxypeptidase activities, of which PBP5 are the most
abundant, cleaving the terminal d-Ala-d-Ala bond, and making the stem peptide
unavailable for transpeptidation (Sauvage et al., 2008).

12
Figure 1.3 Peptidoglycan biosynthesis. Reproduced from (Teo et al., 2015) with
permission. i. Conversion of UDP-N-acetylglucosamine (UDP-GlcNAc) to UDP-N-
acetylmuramic acid (UDP-MurNAc) by MurA and MurB ii. Conversion of UDP-
MurNAc to UDP-MurNAc-pentapeptide by MurC to MurF iii. Adding of soluble
precursor to the membrane-bound undecaprenyl phosphate (C55-P) carrier lipid MraY
to form Lipid I. iv. Lipid I is then glycosaminylated by a membrane-associated
glycosyltransferase, MurG, with UDP-GlcNAc to yield Lipid II v. Lipid II is
translocated through the cytoplasmic membrane vi. Lipid II is polymerised by
glycosyltransferase enzymes vii. Peptide cross linking by transpeptidases.

13
1.7 Extended-spectrum-β-lactamases
Generally extended-spectrum β-lactamases (ESBLs) are the β-lactamases,
capable to hydrolyse penicillin, first-, second- and third-generation cephalosporins and
monobactams (but not cephamycins or carbapenems) and inhibited by β-lactamase
inhibitors, has been attained attention in the scientific community and clinicians since
the first report of SHV-2, derived from point mutation of SHV-1, found in a single
strain of Klebsiella ozaenae in Germany in1983. TEM-3, variants of TEM-1 has
reported as ESBL phenotype in 1989, settled by substitution of one amino acid (AA),
though various subtle alterations of AAs have been observed in other TEM derivatives
belongs to ESBLs. As of August 2020, there are 92 TEM-type and 45 SHV-type
ESBLs have reported (Naas et al., 2017). Another growing family of ESBL are OXAs,
having high hydrolysing capacity against oxacillin and cloxacillin which were devised
due to mutations of OXA-10 and OXA-2. Whilst OXAs are mostly found in P.
aeruginosa, other sorts of ESBLs are predominant among the E. coli, K. pneumoniae
and other Enterobacterales (Bradford, 2001; Shah et al., 2004). Over the last decades,
CTX-M being the most prevalent ESBL worldwide (Bevan et al., 2017).
Owing to preferential hydrolysing capacity against cefotaxime than
ceftazidime, the enzyme was named as CTX-M, and ‘M’ was derived from Munich
from where blaCTX-M was first reported. This resistance mechanism has been reported
simultaneously in Europe and South America at the early 1989 and by 2000,
worldwide dissemination of the members of this phenotype have been recognised.
Despite the initial evidence among E. coli, K. pneumoniae and Salmonella spp., rapid
emergence of this enzyme into other Enterobacteriaceae and rarely to non-fermenters
has been reported. The gene, blaCTX-M originated from chromosomal bla gene of
Kluyvera species mainly by insertion sequence (IS) element and therefore evolved into
five clusters of CTX-M-1, CTX-M-2, CTX-M-8, CTX-M-9 and CTX-M-25 and
diverted into new variants. Different IS elements (ISEcp1, ISCR1, IS10, IS26) have
been described associated with blaCTX-M genes and contributing to their over-
expression, selection and further sequestration and dissemination of the genes. The
most intensely diffused member of this family, CTX-M-15 that belongs to CTX-M-1
cluster, is an ESBLs has been found to be associated with ISEcp1. Further to
incorporation into incompatibility group FII plasmids and dispersion into high-risk

14
international clone ST131, blaCTX-M-15 have been distributed globally (Cantón et al.,
2012; Lartigue et al., 2004; Toleman et al., 2006; Bevan et al., 2017).

15
1.8 Carbapenemases
1.8.1 Discovery and introduction of carbapenem in clinical practice
Emergence of β-lactamase in the late 1960s limited the therapeutic use of
earliest penicillin. The first β-lactam possessing a “carbapenem backbone” was
olivanic acids, discovered in 1970s from Streptomyces clavuligerus. Within a few
years’ interval, series of carbapenems were discovered, of which a naturally derived
product of Streptomyces cattleya, thienamycin was the most potent. However, both
olivanic acids and thienamycin were not adopted for medical application because of
their chemical instability. Series of clinically effective carbapenems were devised
during 1970s and 1980s (Birnbaum et al., 1985; Bush and Bradford, 2016).
Imipenem/cilastatin was the first carbapenem, approved for medical use on 1985
(Lyon, 1985).
1.8.2 Antibacterial spectrum and mechanism of action of carbapenem
β-lactam antibiotics contain a β-lactam ring in their structure. A β-lactam ring
is a four-membered cyclic amide (Tahlan and Jensen, 2013). Carbapenems have four-
membered β-lactam structure fused to a novel five-membered ring in which carbon
rather than sulphur was present at the C-1 position, a double bond between C-2 and C-
3 and hydroxyethyl side chain. The structural complexity of carbapenems compared
to penicillins and cephalosporins results in increased antimicrobial spectrum of these
drugs. The stability of earlier carbapenem (thienamycin) was achieved by adding the
N-formimidoyl group to the 2-position, resulting in imipenem. Imipenem is broad
spectrum antibiotic, having effects on Gram-positive, Gram-negative, non-
fermentative, and anaerobic bacteria, however, is required to administer with human
renal dehydropeptidase (DHP) inhibitor such as cilastatin because of its liability by
DHP. Later carbapenems (meropenem, biapenem, ertapenem, and doripenem) DHP
stable due to 1-β-methyl group in their structure. Several modifications of
carbapenems were made in subsequent two decades which introduced novel
carbapenems. The novel carbapenems included antipseudomonal carbapenems, anti-
MRSA carbapenems (i.e., cationic and dithiocarbamate carbapenems), orally available
carbapenems, trinem carbapenems, a dual quinolonyl-carbapenem, and others
(Birnbaum et al., 1985; Bush and Bradford, 2016). Carbapenems act on peptidoglycan

16
biosynthesis like other β-lactam antibiotics. The mechanism of action of β-lactams are
depicted in Figure 1.4.

17
Figure 1.4 Mechanism of action of carbapenems (Birnbaum et al., 1985; Bush and Bradford, 2016). i. Carbapenems enter into the Gram-negative
bacteria through outer membrane proteins (OMPs), called porins ii. In the periplasmic space, carbapenems inhibit transpeptidases and therefore,
prevent peptide cross-linking.

18
1.8.3 Carbapenem Resistance: An Overview
Carbapenemases denote as member of β-lactamases, having capacity to
degrade carbapenems. Although termed as “carbapenemases,” many of these enzymes
hydrolyse almost all β-lactams, and most are not inhibited by all commercially viable
β-lactamase inhibitors. The substrate specificity of individual carbapenemase is
described in Table 1.1. The first carbapenemases were characterized in the 1980s from
the environmental strains, Bacillus cereus (BCII), Bacteroides fragilis (CfiA) and
Stenotrophomonas maltophilia (L1). Carbapenemases were initially reported as
chromosomally encoded β-lactamases. The magnitude of carbapenem resistance was
exaggerated in medicine when the horizontal spread took place (Queenan and Bush,
2007; Walsh, 2010; Codjoe and Donkor, 2017). The carbapenemases, New Delhi
metallo-β-lactamases (NDMs) and the oxacillinase, OXA-48-like have been addressed
here in details as these resistance mechanisms are contextually vital in the regions of
SA (Hsu et al., 2017) and especially pertinent to this PhD.

19
Table 1.1 Classification of carbapenemases.
Molecular
class
Functional
group
Enzymes Penicillins
Early
cephalosporins
Extended-
spectrum
cephalosporins
Aztreonam
Carbapenems
A 2f NMC + + + + +
IMI + + + + +
SME + + ± + +
KPC + + + + +
GES + + + - ±
B 3 IMP + + + - +
VIM + + + - +
GIM + + + - +
SPM + + + - +
NDM + + + - +
D 2d OXA + + ± - ±

20
1.8.4 Metallo-β-lactamases
MBLs include diverse range of enzymes with less than 25% sequence
homology between some enzymes, can be subdivided into subclasses B1, B2 and B3.
B1 (appendix B). MBLs have a characteristic αβ/βα fold which supports up to six
residues at the active site which coordinate either one or two zinc ions that are central
to the catalytic mechanism. The zinc binding motifs around the active site can
distinguish the subclasses of MBLs. B1 has two zinc binding sites, Zn1 and Zn2,
contains H116, H118, and H196 at Zn1 and D120-C221-H263 at Zn2, respectively,
while the zinc ligands for the other subclasses are N116-H118-H196 and D120-C221-
H263 for B2 and H/G116-H118-H196 and D120-H121-H262 for B3 (Figure 1.5). B1
and B3 are most active with binding of two zinc ions at Zn1 and Zn2 but binding of
the second zinc in the B2 enzymes inhibits catalysis. The degrading effect of B1 and
B3 is broad-spectrum such as penicillins, cephalosporins, and carbapenems while the
B2 enzymes can only degrade carbapenems (Palzkill, 2013; Sawa et al., 2020).
β-lactam ring is cleaved by B1 and B2 enzymes via attack of a hydroxide ion
on the carbonyl carbon. The hydroxide ion is stabilized by Zn1 and Zn2 and resides
between the metal ions to attack the carbonyl carbon. Enzyme catalysis initiates with
the binding of carbonyl oxygen of β-lactam ring with Zn1 and the carboxyl group on
the 5- or 6-membered fused ring of β-lactam with Zn2 (Figure 1.5) (Palzkill, 2013;
Sawa et al., 2020).

21
Figure 1.5 Structure of metallo β-lactamases and their binding sites with β-lactam antibiotics. A. Schematic layout of the amino acid residues that
serve as zinc binders in the active sites of subclass B1, B2, and B3 metallo-β-lactamases. B. Schematic layout of binding of β-lactam with the
active site of β-lactamase. The Figure has been reproduced (Palzkill, 2013).

22
1.8.5 New Delhi metallo-β-lactamase
1.8.5.1 Discovery
NDM was first reported in 2009 in a K. pneumoniae, and E. coli from a
Swedish patient of Indian origin who had a history of hospitalisation in India (Yong et
al., 2009). Literature reviews following the initial characterization of blaNDM-1 reveal
that resistance had a strong link with the Indian subcontinent and blaNDM-1 had been
widespread in India, Pakistan, and Bangladesh around the year of its first isolation.
SENTRY Antimicrobial Surveillance Program, 2006-2007 indicated that blaNDM-1 had
been circulating in India since 2006 (Castanheira et al., 2011). However, NDM-
producers were reported from the Balkan states, the Middle East and China without
any connection to Indian subcontinent. It was speculated that the Balkan states and the
Middle East might the secondary source of global NDM dissemination (Kumarasamy
et al., 2010; Nordmann et al., 2011; Farzana et al., 2013; Islam et al., 2013; Khan et
al., 2017; Dadashi et al., 2019).
1.8.5.2 Epidemiology and spread of blaNDM
Since the discovery of blaNDM, it has been disseminated worldwide rapidly
from the early geographical settings. The global distribution of NDM-producers is
depicted in Figure 1.6. The spread of blaNDM is not either associated with a specific
clone or specific plasmid background. The gene, blaNDM can be located either on the
chromosome or on plasmids. The enzyme, NDM has been predominantly found
among the species of Enterobacterales such as K. pneumoniae, E. coli, Enterobacter
cloacae; however, wide range of bacterial families, Aeromonadaceae, Alcaligenaceae,
Cardiobacteriaceae, Enterobacterales, Moraxellaceae, Morganellaceae, Neisseriaceae,
Pseudomonadaceae, Shewanellaceae, Vibrionaceae, and Xanthomonadaceae have
been found to be the reservoir for blaNDM-1 and its variants, often in association with
wide varieties of plasmid replicon types (IncC, IncB/O/K/Z, IncFIA, IncFIB, IncFIC,
IncFIII, IncHI1, IncHI2, IncHI3, IncN, IncN2, IncL/M, IncP, IncR, IncT, IncX1,
IncX3, IncX4, IncY, and ColE10), however, the gene mostly belonged to IncFII, IncC,
and IncX3. The plasmids having blaNDM usually harbour the determinants of other
antimicrobial resistance genes (ARGs), confer resistance to quaternary ammonium
compounds, aminoglycosides, sulphonamides, and trimethoprim. The gene, blaNDM
are generally located in a plasmid carrying multiple ARGs (aadA, dfrA, mphA, APH,

23
AAC(6')-Ib-cr, blaOXA, blaTEM). In the recent years, IncX3 appears to be one of the
common types of plasmid of low molecular weight (~46 kb), carrying different
variants of blaNDM without the association of other ARGs, retrieved from diverse host
scale including human, animal and environment. Genetic environment around the
blaNDM revealed the presence of complete or truncated IS, ISAba125 at the 5’ end and
bleMBL gene (bleomycin resistance gene) at the 3’ end. A composite transposon, Tn125
formed by two copies of ISAba125 along with blaNDM was described in A. baumannii
and perhaps transferred to the species of Enterobacterales through insertion of
truncated Tn125 (ISAba125-blaNDM-bleMBL). Other IS elements, including ISKpn14,
IS26, IS5, ISCR1 or Tn3-like elements, which have been also identified in
Enterobacterales, involving the dissemination of blaNDM through a combination of
transposition and homologous recombination. Additionally, certain clonal lineages
such as E. coli ST167, E. coli ST617, K. pneumoniae ST11, Enterobacter hormaechei
ST78, E. hormaechei ST114, E. xiangfangensis ST171, A. baumannii ST85 and P.
aeruginosa ST308 have been emerged as high-risk clones for the spread of blaNDM.
(Dortet et al., 2014; Marquez-Ortiz et al., 2017; Khan et al., 2017; Choudhury et al.,
2018; Peirano et al., 2018; Tang et al., 2019; Wu et al., 2019). The geographical
distributions of predominant clones of E. coli, and K. pneumoniae harbouring blaNDM
are described in Figure 1.7 and Figure 1.8. The distributions have been assessed by
analysing genomes harbouring blaNDM in NCBI archive by 31 July 2020. The genome
attributes are mentioned in appendix C.

24
Figure 1.6 Global distribution of NDM producers. *Map has been generated based on published reports and relevant metadata available in NCBI
until 31 July 2020.

25
Figure 1.7 Geographical distribution of predominant clones of E. coli harbouring blaNDM based on E. coli genomes in NCBI archive until 31 July
2020 (n=575). Size of the pie charts is proportional to the number of genomes. The number of whole genome sequence data for NDM-positive E.
coli in NCBI as per isolation from different geographical locations was: China (n=410), India (n=37), Switzerland (n=14), US (n=13), Egypt
(n=12), Lebanon (n=9), Norway (n=7), UK (n=7), France (n=6), South Korea (n=6), Thailand (n=6), Canada (n=5), Italy (n=4), Bangladesh (n=2),

26
Brazil (n=2), Malaysia (n=2), South Africa (n=2), Vietnam (n=2), Australia (n=1), Cambodia (n=1), Colombia (n=1), Czech Republic (n=1),
Denmark (n=1), Ghana (n=1), Hong Kong (n=1), Japan (n=1), Pakistan (n=1), Peru (n=1), Singapore (n=1), Taiwan (n=1). Country data are not
available for 17 genomes.

27
Figure 1.8 Geographical distribution of predominant clones of K. pneumoniae harbouring blaNDM based on K. pneumoniae genomes in NCBI
archive until 31 July 2020 (n=735). Size of the pie charts is proportional to the number of genomes. The number of whole genome sequence data
for NDM-positive K. pneumoniae in NCBI as per isolation from different geographical locations was: Thailand (n=161), China (n=133), India
(n=38), Pakistan (n=34), US (n=32), Serbia (n=30), South Africa (n=24), Russia (n=20), Egypt (n=17), Canada (n=16), Lebanon (n=16), Greece

28
(n=15), Romania (n=13), Turkey (n=12), Vietnam (n=12), Norway (n=11), UK (n=11), Malaysia (n=9), Montenegro (n=8), France (n=7),
Philippines (n=7), Spain (n=7), Switzerland (n=7), South Korea (n=5), Brazil (n=4), Czech Republic (n=4), Germany (n=4), Italy (n=4), Nigeria
(n=4), Austria (n=3), Bangladesh (n=3), Denmark (n=3), Ireland (n=3), Poland (n=3), Israel (n=2), Singapore (n=2), Slovenia (n=2), Tunisia (n=2),
Belgium (n=1), Bulgaria (n=1), Chile (n=1), Colombia (n=1), Mexico (n=1), Nepal (n=1), Saudi Arabia (n=1), Sweden (n=1), Syria (n=1), Taiwan
(n=1), Venezuela (n=1). Country data are not available for 36 genomes.

29
1.8.5.3 Variants of blaNDM
NDM enzymes are composed of 813 nucleotides, resulting 270 AAs. Till date,
28 variants of blaNDM have been reported which evolved from AA substitutions of
blaNDM. The key properties of blaNDM variants with relevant references are summarized
in Table 1.2.

30
Table 1.2 Key properties of variants of blaNDM.
NDM-1
variants
AA
substitutions*
Country &
Year of
isolation
Geographical
distribution
Host species Location of
gene
Plasmid Inc
group
Associated
mobile
element
References
NDM-2 Pro28Ala Egypt, 2009 Colombia, Egypt,
Israel, Switzerland,
UAE
A. baumannii,
Acinetobacter
nosocomialis, E.
coli
Cr - ISAba125 Espinal et al., 2011;
Kaase et al., 2011;
Ghazawi et al., 2012;
Espinal et al., 2013
NDM-3 Asp95Asn Japan, 2013 China, Japan E. coli, K.
pneumoniae
Pl Un tnpA Tada et al., 2014a; Hu
et al., 2017
NDM-4 Met154Leu India, 2010 India, China, France,
Malaysia, Thailand,
Vietnam
Enterobacter
aerogenes, E. coli,
K. pneumoniae,
Pl IncF, IncX3,
IncFIA
ISAba125,
IS26
Nordmann et al, 2012;
Khalifa et al., 2016;
Qin et al., 2016;
Ahmad et al., 2018;
Choudhury et al.,
2018; Zhang et al.,
2018
NDM-5 Val88Leu
Met154Leu
UK, 2011 Algeria, Bangladesh,
Canada, Cambodia,
Chad, China, Czech
Republic, Denmark,
Egypt, Finland,
France, Japan,
Lebanon, Malaysia,
Myanmar, Nigeria,
Pakistan, Soudi
Arabia, South Korea,
Switzerland,
Thailand, UK, USA
Citrobacter
freundii, E.
cloacae, E. coli, E.
hormaechei K.
pneumoniae,
Klebsiella
quasipneumoniae,
Proteus mirabilis,
Salmonella
enterica
Cr, Pl IncFIA/IncFIB,
IncFII, IncX3
ISAba125,
IS5
Hornsey et al., 2011;
Balm et al., 2013a;
Nakano et al., 2014;
Rahman et al., 2014;
Cho et al., 2015;
Yousfi et al., 2015;
Gamal et al., 2016;
Khalifa et al., 2016;
Soliman et al., 2016;
Zhang et al., 2016;
Zhu et al., 2016;
Almakki et al., 2017;
Rojas et al., 2017; Abd
El Ghany et al., 2018;
Ahmad et al., 2018;
Grönthal et al., 2018;

31
Li et al., 2018a; Shen
et al., 2018; Uchida et
al., 2018; Ahn et al.,
2019; Baek et al.,
2019; Brinkac et al.,
2019; Ouchar
Mahamat et al., 2019;
Sekizuka et al., 2019;
Tang et al., 2019; Cole
et al., 2020; Flerlage et
al., 2020; Hong et al.,
2020; Tian et al., 2020;
Zou et al., 2020
NDM-6 Ala233Val New Zealand,
2012
China, Guatemala,
India, Iran, New
Zealand, USA
E. coli, E.
hormaechei, K.
pneumoniae
Pl IncA/C IncF NC Williamson et al.,
2012; Rahman et al.,
2014; Bahramian et
al., 2019
NDM-7 Asp130Asn
Met154Leu
France, 2008 Arabian Peninsula,
Canada, China,
France, Gabon,
Germany, India,
Norway, Pakistan,
South Korea, UK,
USA
E. coli, K.
pneumoniae
Pl IncX3 IncR, ISAba125 Cuzon et al., 2013;
Göttig et al., 2013; Lee
et al., 2014; Rahman et
al., 2014; Moussounda
et al., 2017; Pál et al.,
2017; Hao et al., 2018;
Qamar et al., 2019; Xu
et al., 2019
NDM-8 Asp130Gly
Met154Leu
Nepal, 2013 Nepal E. coli NC - - Tada et al., 2013
NDM-9 Glu152Lys China, 2013 China, South Korea,
Switzerland, Taiwan
Cronobacter
sakazakii, E.
aerogenes, E. coli,
K. pneumoniae,
Klebsiella
variicola, S.
enterica
Pl IncH IncFII(Y)
IncB/O
ISAba125,
IS15, IS26
Wang et al., 2014; Di
et al., 2017; Lai et al.,
2017; Liu et al., 2017a
NDM-10 Arg32Ser India, 2013 India K. pneumoniae Pl IncFII NC Khajuria et al., 2016

32
Gly36Asp
Gly69Ser
Ala74Thr
Gly200Arg
NDM-11 Met154Val India, 2013 China, India E. coli, K.
pneumoniae
Pl IncF NC Rahman et al., 2018
NDM-12 Gly222Asp
Met154Leu
Nepal, 2013 Nepal, South Africa E. coli Pl IncF tnpA Tada et al., 2014b
NDM-13 Asp95Asn
Met154Leu
Nepal, 2013 China, Nepal, South
Korea
E. coli Cr, Pl IncFIB Inx3 ISAba125 Shrestha et al., 2015;
Lv et al., 2016; Kim et
al., 2019
NDM-14 Asp130Gly China, 2011 China Acinetobacter
lwoffii
Pl Un ISAba125 Zou et al., 2015
NDM-15** Ala233Val
Met154Leu
India, NA India E. coli NC - -
NDM-16 Arg264His Russia, 2013 China, Lebanon,
Russia, Thailand,
Tunisia
A. baumannii, E.
coli, E.
hormaechei, K.
pneumoniae
Pl IncF IS15DIV Kazmierczak et al.,
2015; Li et al., 2018b
NDM-17 Val88Leu
Met154Leu
Glu170Lys
China, 2015 China E. coli Pl IncX3 ISAba125,
IS5
Liu et al., 2017b
NDM-18 Identical to
NDM-1;
tandem repeat
of 5 AAs
(QRFGD, AA
positions 44 to
48)
Germany, 2016 Germany, India,
South Africa
E. coli,
Providencia
rettgeri
Pl NC NC Ntshobeni et al., 2019

33
NDM-19 Asp130Asn
Met154Leu
Ala233Val
Egypt, 2015 Canada, China,
Egypt, Lebanon
E. coli, K.
pneumoniae
Pl IncX3, IncFII ISAba125,
IS5,
IS3000,
tnpA
Liu et al., 2019a;
Mancini et al., 2019
NDM-20 Gly62Thr
Ala460Cys
Gly809Ala
USA, 2013 China, USA E. coli, K.
pneumoniae
Pl IncX3 ISAba125,
IS5, IS3000
Liu et al., 2018a
NDM-21 Val88Leu
Met154Leu
Gly69Ser
USA, 2012 China, USA E. coli, E.
hormaechei, K.
pneumoniae
Pl IncX3 ISAba125,
IS5
Liu et al., 2018b
NDM-22** Met248Leu China, 2015 China, India,
Philippines, Thailand
E. cloacae, E. coli,
E. hormaechei, K.
pneumoniae
NC - - -
NDM-23** Ile101Leu Spain, 2017 Spain K. pneumoniae NC - - -
NDM-24** Val88Leu Georgia, 2017 Georgia Providencia
stuartii
NC - - -
NDM-25** Ala55Ser India, 2016 India K. pneumoniae, P.
aeruginosa
NC - - -
NDM-26** Val88Leu
Met154Leu
Gly222Ser
China, 2016 China E. coli NC - - -
NDM-27** Asp95Asn
Ala233Val
USA, 2015 USA E. coli NC - - -
NDM-28** Ala266Val China, 2015 China, India K. pneumoniae NC - - -
Cr, chromosome; NA, information not available; NC, not characterized; Pl, plasmid; UAE, United Arab Emirates; Un, Not assigned to known
plasmid type; UP, unpublished. *AA substitutions compared to blaNDM-1. AAs: Ala, Alanine; Arginine, Arg; Asn, Asparagine; Asp, Aspartic acid;

34
Cys, Cysteine; Glu, Glutamic acid; Gly, Glycine; His, Histidine; Ile, Isoleucine; Leu, Leucine; Lys, Lysine; Met, Methionine; Pro, Proline; Ser,
Serine; Thr, Threonine; Val, Valine. **Data available in NCBI archive (unpublished) are also included.

35
1.8.6 OXA carbapenemases
The class D β-lactamases are termed as oxacillinases (OXAs) due to their
hydrolytic capacity for oxacillin and cloxacillin is much faster than penicillins i.e.
benzylpenicillin. This group of enzymes are functionally serine β-lactamases and
poorly inhibited by clavulanic acid and EDTA. Early OXAs, OXA-1, -2 & -3 have
been described in the late 1970s and early 1980s. The first OXA ESBL, OXA-11
(derivatives of OXA-10) was identified in P. aeruginosa from a patient in Turkey in
1991. Eventually other OXA ESBLs, OXA-13, -14, -16, -17, -19, -28, -35, -145, and
-147 (derived from OXA-10) and OXA-15, and -36 (derived from OXA-2) have been
detected. Although most of OXAs (up to ESBLs) had been originally identified in P.
aeruginosa, these enzymes have been later described in a wide variety of Gram-
negatives. The first OXA β-lactamase with carbapenemase activity was OXA-23, was
reported in A. baumannii in 1985. The enzyme showed 36% AA identity to OXA-5
and OXA-10. Other major OXA carbapenemases identified afterwards includes OXA-
24 and OXA-40, OXA-51, OXA-58, OXA-48 and OXA-48-like. OXA-51 is an
intrinsic carbapenemase to A. baumannii and usually exhibit carbapenemase activities
when the gene is overexpressed. The host species and other properties of OXA
carbapenemases are summarised in Table 1.3 (Queenan and Bush, 2007; Evans and
Amyes, 2014; Codjoe and Donkor, 2017; Bonomo et al., 2018).

36
Table 1.3 Key properties of OXA carbapenemases.
Enzyme
group
Year of first
isolation
Country of
isolation
Enzymes Host species Location
OXA-23-like 1985 UK OXA-23, OXA-27, OXA-49, OXA-
73, OXA-102, OXA-103, OXA-105,
OXA-133, OXA-134, OXA-146,
OXA-165–OXA-171, OXA-225,
OXA-239
A. baumannii, Acinetobacter junii,
Acinetobacter radioresistens, Acinetobacter
pittii, P. mirabilis, Acinetobacter phenon 5,
A. phenon 6/ct 13TU, A. nosocomialis,
Acinetobacter genomic species 10/11, A.
lwoffii, Acinetobacter baylyi, K. pneumoniae
Cr, Pl
OXA-40/24-
like
1997 Spain OXA-40, OXA-25, OXA-26, OXA-
72, OXA-139, OXA-160, OXA-207
A. baumannii, Acinetobacter haemolyticus,
A. pittii, A. baylyi, P. aeruginosa,
Acinetobacter calcoaceticus, K. pneumoniae
Cr, Pl
OXA-51-like 1996 Argentina OXA-51, OXA-64–OXA-71, OXA-
75–OXA-80, OXA-82–OXA-84,
OXA-86–OXA-95, OXA-98–OXA-
100, OXA-104, OXA-106–OXA-
113, OXA-115–OXA-117, OXA-
120–OXA-128, OXA-130–OXA-
132, OXA-138, OXA-144, OXA-
148–OXA-150, OXA-172–OXA-
180, OXA-194–OXA-197, OXA-
200–OXA-203, OXA-206, OXA-
208, OXA-216, OXA-217, OXA-
219, OXA-223, OXA-241, OXA-
242, OXA-248–OXA-250, OXA-254
A. baumannii, A. nosocomialis, E. cloacae,
E. coli, K. pneumoniae
Cr, Pl
OXA-58-like 2003 France OXA-58, OXA-96, OXA-97, OXA-
164
A. baumannii, A. pittii, A. nosocomialis, A.
phenon 6/ct 13TU, A. junii, Acinetobacter
genomic species 9, Acinetobacter
bereziniae, A. calcoaceticus, A.
radioresistens, E. cloacae, Comamonas
testosteroni, E. coli, K. pneumoniae, Delftia
acidovorans
Cr, Pl

37
OXA-134a-
like
2010 France OXA-134a, OXA-186–OXA-191 A. lwoffii Cr
OXA-143-like 2004 Brazil OXA-143, OXA-182, OXA-231,
OXA-253, OXA-255
A. baumannii, A. pittii Pl
OXA-213-like 2012 France OXA-213 A. calcoaceticus Cr
OXA-214-like 2012 France OXA-214, OXA-215 A. haemolyticus Cr
OXA-211-like 2012 France OXA-211, OXA-212, OXA-309 Acinetobacter johnsonii Cr
OXA-229-like 2012 France OXA-228–OXA-230, OXA-257 A. bereziniae Cr
OXA-235-like 2007 USA &
Mexico
OXA-235–OXA-237, OXA-278 Acinetobacter schindleri Pl
OXA-48-like 2001 Turkey OXA-48, OXA-162, OXA-163,
OXA-181, OXA-199, OXA-204,
OXA-232, OXA-244, OXA-245,
OXA-247, OXA-894
Enterobacterales*, Shewanella xiamenensis,
A. baumannii
Cr, Pl
Cr, chromosome; Pl, plasmid. *The distribution of OXA-48-like among the species of Enterobacterales are stated in Table 1.4.

38
1.8.6.1 OXA-48 β-lactamase
The class D carbapenemases distributed widely among the members of
Enterobacterales are OXA-48 and its variants. The group of enzymes are relatively
weak carbapenem hydrolyser, having greater activity against imipenem than
meropenem. OXA-48 sharing 46%, 36%, 32% and 21% AA identity with OXA-10,
OXA-23, OXA-40 and OXA-1, respectively. OXA-48 differs from OXA-10 at the β5–
β6 loop where a conformational change is occurred by the interaction of Arg-214 with
the Ω loop Asp-159 residue, extending the loop into the active site of the enzyme.
Therefore, β5-β6 loop provides a hydrophilic environment for binding water molecules
that are required for hydrolysis. The enzyme has minor differences in the active-site
cavity with OXA-10/-13. His-109 at the active site interacts with Thr-104 and Thr-113
which modify the hydrogen bonding network. Taken together, the antibiotic can be
brought into proximity with a water molecule for deacylation of the antibiotic
(Docquier et al., 2009; Poirel et al., 2012; Evans and Amyes, 2014).
1.8.6.2 Discovery and origin of OXA-48 β-lactamase
OXA-48 was identified in a K. pneumoniae isolate in 2001 from a patient in
Istanbul, Turkey. It has been speculated that the gene was originated from aquatic
organism, Shewanella oneidensis which have an intrinsic blaOXA-54, sharing 92%
amino acid identity with blaOXA-48. Overall, OXA-48-like are composed of 798
nucleotides, encoding 261 to 265 AAs. Till date, several chromosomally encoded
OXA carbapenemases’ variants, blaOXA-48, blaOXA-199, blaOXA-204, blaOXA-416, blaOXA-
538, blaOXA-252, blaOXA-514, blaOXA-515, blaOXA-546, blaOXA-547 and blaOXA-894 have been
reported from environmental source of S. xiamenensis which are often linked to
IS1999. The genetic environment of blaOXA-48-like in Enterobacterales revealed the
association of complete or truncated similar insertion elements, IS1999 (Table 1.4).
This mobile element perhaps led to the acquisition of blaOXA-48 in Enterobacterales
from Shewanella species (Poirel et al., 2012; Antonelli et al., 2015; Ceccarelli et al.,
2017; Tacão et al., 2018; Tafoukt et al., 2018; Zou et al., 2019).

39
1.8.6.3 Epidemiology and spread of blaOXA-48
The rapid spread and increasing trend of Enterobacterales producing OXA-48-
like enzymes in different niches such as in the health facilities, community, and
animals (e.g., livestock, companion animals, and wildlife) has become a serious issue
recently (Mairi et al., 2018). The genetic context around blaOXA-48 demonstrated the
connection of IS1999 at the upstream, involving the mobilisation of this carbapenem
resistance gene. The transferable element was often found in plasmid harbouring
blaOXA-48 as composite transposons (Tn1999, Tn1999.2 or Tn1999.3). Tn1999.2 or
Tn1999.3 have been formed by the disruption of IS1999 with IS1R introduction (Evans
and Amyes, 2014; Pitout et al., 2019). IS10A-like was also found to be inserted at the
upstream of composite transposon (Gijón et al., 2020). Several other insertion
elements have also been described in association with blaOXA-48-like in a variety of
plasmid backgrounds in a wide range of bacterial species (Table 1.4). Plasmids
contribute a vital role in worldwide dissemination blaOXA-48-like (Kasap et al., 2013;
Evans and Amyes, 2014; Potron et al., 2016; Shankar et al., 2019). The global
epidemiology of blaOXA-48-like is summarized in Figure 1.9, Figure 1.10, and Table 1.4
according to previous literature reviews (Cuzon et al., 2011; Glupczynski et al., 2012;
Poirel et al., 2012; Zong et al., 2012; Adler et al., 2013; Balm et al., 2013b; Gomez et
al., 2013; Teo et al., 2013; Voulgari et al., 2013; Majewski et al., 2014; Sampaio et
al., 2014; Wrenn et al., 2014; Pereira et al., 2015; Zhang et al., 2015; Both et al., 2016;
Guo et al., 2016; Jayol et al., 2016; Lahlaoui et al., 2017; Magagnin et al., 2017;
Mansour et al., 2017; van Duin et al., 2017; Yin et al., 2017; Al-Baloushi et al., 2018;
Guducuoglu et al., 2018; Lu et al., 2018; Mairi et al., 2018; Mancini et al., 2018; Pulss
et al., 2018; Solgi et al., 2018; Srijan et al., 2018; Tafoukt et al., 2018; Ahn et al.,
2019; Carrasco-Anabalón et al., 2019; Aires-de-Sousa et al., 2019; Haller et al., 2019;
Iovleva et al., 2019; Lowe et al., 2019; Nigg et al., 2019; Obeng-Nkrumah et al., 2019;
Pitout et al., 2019; Benulič et al., 2020; El-Kholy et al., 2020; Lu et al., 2020;
Mukherjee et al., 2020; Sherchan et al., 2020; Villacís et al., 2020; ECDC, 2020).

40
Figure 1.9 Global distribution of OXA-48 producers. *Map has been generated based on published reports and relevant metadata available in
NCBI until 31 July 2020.

41
Figure 1.10 Global distribution of OXA-181 and OXA-232 producers. *Map has been generated based on published reports and relevant metadata
available in NCBI until 31 July 2020.

42
Table 1.4 Key properties of blaOXA-48-like.
Enzymes AA
substitutions*
Country &
Year of
isolation
Host species STs associated with clonal
dissemination
Location
of gene
Plasmid Inc
group
Associated
mobile element
K. pneumoniae Others
OXA-48 - Turkey, 2001 C. freundii, E. cloacae,
C. sakazakii, E. coli, K.
pneumoniae, Klebsiella
oxytoca, Kluyvera spp.,
P. mirabilis, P. rettgeri,
P. aeruginosa,
Salmonella spp.,
Serratia marcescens
ST11***,
ST101, ST13,
ST131, ST147,
ST15, ST1853,
ST221, ST39,
ST307, ST383,
ST392, ST395,
ST437, ST893
E. cloacae,
ST89, E. coli
ST38***
Pl IncL/M, IncA/C2,
IncFII, IncFIA,
IncFIB, IncHI1B,
IncHI2, IncHI1,
ColKP3, IncX3,
IncN
IS1999, Tn1999,
Tn1999.2,
Tn1999.3,
IS10A-like
OXA-181 Thr104Ala
Asn110Asp
Glu168Gln
Ser171Ala
India, 2006 C. freundii, E. cloacae,
E. coli, K. pneumoniae,
K. variicola, P. rettgeri
ST101, ST307 E. coli
ST410***
Pl ColKP3, IncX3,
ColE2, IncT
ISEcp1 (forms a
transposon
named Tn2013),
IS26
OXA-232 Thr104Ala
Asn110Asp
Glu168Gln
Ser171Ala
Arg214Ser
France, 2011 E. coli, K. pneumoniae
Raoultella
ornithinolytica
ST231, ST15,
ST23, ST14
- Pl ColE, ColKP3 ISEcp1,
ISKpn26,
ISKpn25,
ISKpn1, IS1,
TnAs3, Tn3, Tn2
OXA-162 Thr213Ala Turkey, 2008 K. pneumoniae, E. coli,
C. freundii, R.
ornithinolytica
ST11 - Pl IncL/M Tn1999.2
OXA-163* Ser212Asp
Deletion:
Arg214,
Ile215, Glu216,
Pro217
Argentina,
2008
E. cloacae, K.
pneumoniae
- - Pl NC ISEcl4
OXA-199 His37Tyr
Val44Ala
Asp153Gly
China, 2012 S. xiamenensis - - Cr - ISShes2
OXA-204 Gln98His
Thr99Arg
Tunisia, 2012 C. freundii, E. coli, K.
pneumoniae, P.
ST147 E. coli ST90 Cr, Pl IncA/C ISEcp1

43
mirabilis, S. marcescens,
S. xiamenensis
OXA-244* Arg222Gly Spain, 2011 E. aerogenes, E. coli, K.
pneumoniae, P.
mirabilis
- - Pl IncL/M IS1999
OXA-245 Glu125Tyr Spain, 2011 K. pneumoniae - - IncL/M IS1999
OXA-247 Tyr219Ser
Asp220Asn
Argentina,
2010
K. pneumoniae - - IS4321, IS4-like
OXA-370* Ser220Glu Brazil, 2013 E. aerogenes, E. coli, E.
cloacae, E. hormaeche,
K. pneumoniae,
Morganella morganii,
C. freundii P. mirabilis,
P. stuartii, Serratia spp.
ST16 - Pl IncF tnpA
OXA-436 Val3Ala
Phe10Leu
Leu11Met
Ala13Thr
Ser14Thr
Ile15Met
Thr36Ser
Ser40Thr
Lys51Thr
Asn58Asp
Thr104Ala
Asn110Asp
Val153Leu
Glu168Gln
Ser171Ala
Gly201Ala
Thr213Val
Val226Ile
Met237Thr
Ser244Ala
Asp245Glu
Ala252Thr
Glu256Ala
Denmark,
2017
Enterobacter asburiae,
C. freundii, K.
pneumoniae
- - Pl IncHI2 -

44
OXA-484 Thr104Ala
Asn110Asp
Glu168Gln
Ser171Ala
Arg214Gly
UK, 2017 K. pneumoniae - - Pl - -
OXA-519 Val120Leu Belgium,
2018
K. pneumoniae - - Pl IncL IS1999
*AA substitutions compared to blaOXA-48. **Weak carbapenemase activity. ***International high-risk clone

45
1.9 Mobile colistin resistance
1.9.1 Introduction of colistin as an antibacterial agent
Colistin was first extracted in Japan by Koyama and co-workers from the
spore-forming soil bacterium Bacillus polymyxa subsp. colistinus in 1947. During the
1950s colistin was used in clinical practice in Japan and Europe. Colistin was approved
by the USA FDA and has been available in the USA since 1959 for the treatment of
infections caused by Gram negative bacteria, however the antibiotic has been reserved
for severe bacterial infections and used topically for eye and ear infections during the
succeeding decades. High incidence of colistin nephrotoxicity led to replace new
antimicrobials such as gentamicin and carbenicillin in clinical practice. Since the mid-
1990s, therapeutic interest towards colistin has been renewed as last resort antibiotic
in prevalent MDR Gram negative bacterial infections (Falagas and Kasiakou, 2005;
Bialvaei and Samadi, 2015).
1.9.2 Antibacterial spectrum and mode of action of colistin
There are five different chemical compounds of polymyxins (polymyxins A,
B, C, D, and E). Mainly colistin A (polymyxin E1) and colistin B (polymyxin E2),
which differ only in their fatty acid tails, have been used in clinical practice. Colistin
is polycationic at physiological Ph, consisting of a cyclic heptapeptide with a tripeptide
side chain acylated at the N terminus by a fatty acid tail (Bialvaei and Samadi, 2015).
Colistin confers bactericidal effects against Gram negative bacilli, however, Proteus,
Neisseria, Serratia, Providencia, Burkholderia pseudomallei, M. morganii,
Edwardsiella tarda and anaerobic bacteria are intrinsically resistant to colistin
(Falagas and Kasiakou, 2005; Bialvaei and Samadi, 2015). The mechanism of action
of colistin is shown in Figure 1.11.

46
Figure 1.11 Mechanism of action of colistin. i. Polycationic colistin binds with lipid
A of lipopolysaccharide (LPS) molecule in the outer membrane of Gram-negative
bacteria which is negatively charged. ii. Displacement of magnesium (Mg2+) and
calcium (Ca2+). iii. Disruption of outer membrane and subsequent cell death.
Colistin also ensues anti-endotoxin activity due to its binding with endotoxin (lipid
A) of Gram-negative bacteria.

47
1.9.3 Mechanism of colistin resistance
Polymyxin resistance mechanisms are mediated by various lipopolysaccharide
(LPS) modifications. These includes: 1. alteration of drug binding site, lipid A (most
common), 2. increased drug efflux, 3. overproduction of capsuler polysaccharide. The
resistance mechanism of colistin is described in Figure 1.12 (Olaitan et al., 2014;
Bialvaei and Samadi, 2015; Mlynarcik and Kolar, 2018).

48
Figure 1.12 Mechanism of colistin resistance. Each mode of resistance is separated by
shading.
i. Activation of two component system (TCS): a) External stimuli or mutations in PhoP/PhoQ or
mutational or insertional inactivation of mgrB activate PhoP/PhoQ which in turn activate
PmrA/PmrB via PmrD. The PmrA/PmrB TCS is also activated due to mutations in PmrA/PmrB or
CcrA/CcrB (in K. pneumoniae). ColR/ColS, and CprR/CprS in P. aeruginosa and RppA/RppB in
P. mirabilis, and M. morganii have been reported in relation to developing high level of colistin
resistance. Phosphorylated PmrA activates arnBCADTEF, and pmrE which catalyse the addition
of 4-amino-4deoxy-L-arabinose (L-Ara4N) to lipid A. Phosphorylated PmrA also activates
pmrCAB (eptA), and cptA which catalyse the addition of phosphoethanolamine (PEtN) to lipid A.
Phosphorylated PmrA downregulates lpxT (via activation of pmrR), and lpxR. b) Activated
PhoP/PhoQ activates pagL, which deacylates lipid A in Salmonella. c) Activated PhoP/PhoQ
represses eptB via the activation of MgrR. This repression prevents the modification of the outer
Kdo (3-deoxy-D-manno-octulosonic acid) residues of LPSs with PEtN. ii. Mutations of genes
responsible LPS biosynthesis: Mutations in sap operon (encode a transport protein), ATPase
gene, and putative O-acetyltransferase (AT) (most likely are involved either in the biosynthesis or
transfer of aminoarabinose) affect LPS biosynthesis in P. mirabilis. Mutation of genes, galU, lptC,
wapR, and ssg, identified in P. aeruginosa which impedes LPS biosynthesis. Mutation of lpxA,
lpxC, and lpxD in A. baumannii leads to complete loss of LPS. iii. Activation of ugd: This plays
a dual role. a) Increases capsular polysaccharides (CPSs) synthesis and mediates colistin resistance
due to electrostatic interactions between cationic polymyxin and anionic CPSs b) Adds L-Ara4N
to lipid A. iv. Activation of efflux pumps: KpnEF in K. pneumoniae, AcrAB in E. coli, and K.
pneumoniae, Emr in A. baumannii, MexAB-OprM in P. aeruginosa have been identified in relation

49
to colistin resistance. Expression of this pump's proteins is dependent on the PhoPQ TCS. v.
Acquired: Mobile colistin resistance (MCR) is the member of PEtN transferase, causing colistin
resistance due to horizontal transfer among bacteria.

50
1.9.4 Discovery of mcr
A transferable colistin resistance gene, mcr-1 was first reported in E. coli from
China in 2015, located on an IncI2 conjugative plasmid. The first report suggested the
dissemination of mcr-1 in human and food animal (Liu et al., 2016). However,
surprisingly, mcr was identified in isolates dating back to 1970s from China when
colistin was first used Chinese livestock and there were sporadic occurrence and
outbreak of mcr over two decades in China which had not been picked up at the time.
It has been speculated that increased usage of colistin during 2009 to 2014 in China
has contributed the spread of mcr (Shen et al., 2016).
1.9.5 Epidemiology and spread of mcr
There is strong association between usage of colistin and emergence of mcr in
a geographical region. Data from several epidemiological surveys indicates that there
has been increased prevalence of mcr in China since 2009 which coincides with the
fact that colistin was used as a growth promoter in higher frequency in the Chinese
agriculture sector from 2000 to 2015. Perhaps high prevalence of mcr in Vietnam has
been related to colistin usage in farming as well. mcr-like resistance mechanisms have
now been disseminated worldwide, recovered from a wide range of sources such as
livestock, pet animal, meat, water, human infections, and carriage. The gene, mcr is
typically embedded in plasmid and very rarely resides on the chromosome. The global
dissemination of mcr have been mostly observed along with horizontal gene transfer
among intra- and inter-species and genus. Literature review suggested that plasmids of varied
sizes and diverse replicon types have been identified in relation to the spread of mcr-like
resistance (Table 1.6). The global distribution of mcr variants is described in Figure 1.13
(Perrin-Guyomard et al., 2016; Lei et al., 2017; Matamoros et al., 2017; Ovejero et al.,
2017; Wang et al., 2017a; Wang et al., 2017b, Fukuda et al., 2018; Wang et al., 2018a;
Wang et al., 2018b;Wise et al., 2018; Sun et al., 2018; Aeksiri et al., 2019; Kneis et al.,
2019; Long et al., 2019; Bich et al., 2019; Gelbíčová et al., 2019; Liu et al., 2019b; Dos
Santos et al., 2020; Furlan et al., 2020; Hoa et al., 2020; Luo et al., 2020).

51
Figure 1.13 Global distribution of mcr-like mechanism. *Map has been generated based on published reports and relevant metadata available in
NCBI until 31 July 2020.

52
1.9.6 Variants of mcr
Data suggest that mcr-1 has existed for more than three decades, however, the
other known variants have evolved during the last decades (Figure 1.14). At the time
of writing, ten variants of mcr (mcr-1 to mcr-10) have been identified. The AAs
identity among the different variants are stated in Table 1.5. A greater number of minor
variants for mcr-1 (18 variants), mcr-2 (two variants), mcr-3 (28 variants), mcr-4 (five
variants), mcr-5 (two variants), and mcr-8 (three variants) have so far been identified.
The geographical distribution of mcr-1 and its variants is depicted in Figure 1.15 and
the other epidemiological properties are described in Table 1.6 (Tian et al., 2017; Yi
et al., 2017; Chavda et al., 2018; Fukuda et al., 2018; Mendes et al., 2018; Bich et al.,
2019; Aeksiri et al., 2019; Kneis et al., 2019; Wang et al., 2019; Dos Santos et al.,
2020; Filioussis et al., 2020; Furlan et al., 2020; Hoa et al., 2020; Lei et al., 2020; Luo
et al., 2020; Wang et al., 2020; Yang et al., 2020).

53
Figure 1.14 Chronological discovery of mcr variants from animal and human.
Reproduced from (Luo et al., 2020) with permission. Discovery of mcr-10 has not
been included in the Figure. MCR-10 was first identified in 2020 from both human
and animal source in China.
Table 1.5 Nucleotide identity among the mcr variants.
Variants Nucleotide Identity (%)
mcr-1 mcr-2 mcr-3 mcr-4 mcr-5 mcr-6 mcr-7 mcr-8 mcr-9
mcr-2 76.7 - - - - - - -
mcr-3 45.0 47.0 - - - - - -
mcr-4 34.0 35.0 49.0 - - - - -
mcr-5 36.1 35.3 34.7 33.7 - - - -
mcr-6 98.7 87.9 34.5 33.0 37.3 - - -
mcr-7 35.0 34.0 70.0 45.0 36.0 33.0 - -
mcr-8 31.1 30.3 39.9 37.8 33.5 30.4 37.5 -
mcr-9 36.3 33.9 64.7 43.4 33.2 33.7 63.4 44.8
mcr-10 36.2 34.5 62.1 44.7 36.2 34.2 59.9 43.4 82.9

54
Figure 1.15 Geographical distribution of different mcr variants. *Map has been generated based on published reports and relevant metadata
available in NCBI until 31 July 2020. Data on mcr-10 (n=2) were not included in this map. MCR-10 (n=2) was isolated from China.

55
Table 1.6 Key properties of mcr variants.
mcr
variants
Host species STs associated with possible
clonal spread
Location
of mcr
Associated plasmid
replicon types
Associated
mobile
elements E. coli Others
mcr-1 A lwoffii, Citrobacter amalonaticus, Citrobacter
braakii, C. freundii, C. sakazakii, E. aerogenes,
Enterobacter agglomerans, E. cloacae, E. coli,
Escherichia fergusonii, K. oxytoca, K.
pneumoniae, K. quasipneumoniae, K. variicola,
Kluyvera ascorbathare, P. mirabilis, Providencia
alcalifaciens, P. aeruginosa, Pseudomonas putida,
R. ornithinolytica, Raoultella planticola,
Salmonella spp., Shigella sonnei, Vibrio
parahaemolyticus
ST10, ST131,
ST93
S. typhimurium
ST34, K.
pneumoniae
ST11, K.
pneumoniae
ST45
Cr, Pl IncFII, IncFIA,
IncFIB, IncFIC,
IncH, IncI1, IncI2*,
IncK, IncL/M, IncN,
IncP, IncX4*, IncY,
p0111
ISApl1
mcr-2 E. coli, K. pneumoniae, Moraxella pluranimalium,
P. aeruginosa, Salmonella spp.
- - Cr, Pl IncX4 IS1595, ISEc69
mcr-3 Aeromonas hydrophila, Aeromonas veronii, E.
coli, K. pneumoniae, Salmonella spp.
- S. typhimurium
ST34
Cr, Pl IncF, IncFIA, IncH,
IncI2, IncK, IncN,
IncP
IS26, IS4321,
ISKpn40,
ΔTnAs2
mcr-4 A. baumannii, E. cloacae, E. coli, Salmonella spp.,
Shewanella spp.
ST10 - Pl Col8282, ColE10 IS5, IS15DIV,
ISAba19,
Tn5044
mcr-5 A. hydrophila, E. coli, P. aeruginosa, Salmonella
spp.
- - Cr, Pl ColE, IncFIB, IncH,
IncI1, IncX1
tnpA
mcr-6 M. pluranimalium - - Cr - ISApl1
mcr-7 K. pneumoniae - - IncI2 -
mcr-8 K. pneumoniae, R. ornithinolytica - K. pneumoniae
ST15
Pl IncFII, IncFIB(pQil),
IncP
IS903B
mcr-9 C. freundii, E. cloacae, E. hormaechei, E. coli, K.
oxytoca, Salmonella spp.
- - IncHI2, IncR IS1, IS5, IS6,
IS903B
mcr-10 E. cloacae, Enterobacter roggenkampii - - Pl IncFIA IS903
Cr, chromosome; Pl, plasmid. *Most common plasmid types associated with mcr.

56
1.10 Rationale for the study design in this PhD
The WHO SEA region (SEAR) includes 11 countries: Bangladesh, Bhutan,
Democratic People’s Republic of Korea, India, Indonesia, Maldives, Myanmar, Nepal,
Sri Lanka, Thailand, and Timor-Leste (WHO, 2020c); however, topographically,
Afghanistan, Bangladesh, Bhutan, India, Maldives, Nepal, Pakistan, and Sri Lanka are
the constituent countries of SA (Wikipedia, 2020d). Global Antimicrobial Resistance
Surveillance System (GLASS) early implementation reports were reviewed to
understand the status of AMR surveillance in each country of SA. The overview of
AMR surveillance status for each country of SA by 2020 are described in Table 1.7.
The GLASS reports infer the following: 1. National surveillance in this region has
been commenced only since 2017 or onwards in seven countries and has not been
operational yet in Bhutan, 2. Countrywide surveys are yet to be established, 3. A very
limited number of samples have been included in the surveillance, 4. Lack of data to
estimate prevalence and clinical burden of AMR, and 5. Reports to GLASS did not
cover all WHO priority pathogens. The list for WHO priority pathogens is mentioned
in Table 1.8. Urgent development of new antibiotics is required against these
pathogens (WHO, 2020a).

57
Table 1.7 The recent update of AMR surveillance in the countries of SA according to GLASS Early Implementation Report 2020.
Country NAP NCC Surveillance
site
Data on
infection
origin
Data on
number of
tested
patients
Carbapenem
resistance
[NR*/NT]
Colistin
resistance
[NR/NT]
Current surveillance status
Afghanistan NP Established One Reported No data
reported
0/10 (IPM) NA The country is working to enhance diagnostic
capacity and to expand the number of participating
surveillance sites and laboratories in coming years.
Bangladesh P Established Eight No data
reported
No data
reported
88/469 (IPM) NA IEDCR is conducting AMR surveillance
implemented as case-based surveillance of clinical
syndromes.
Bhutan P Established Three - - NA NA No AMR data reported to GLASS.
India P Established 130 <70%
reported
Reported 5780/13751
(IPM);
6280/13892
(MEM)
0/107 There are 3 AMR surveillance networks
participating in the National AMR Surveillance in
the country. 1. National AMR Surveillance
network, NCDC. 2. Antimicrobial Surveillance and
Research network, ICMR; 3. Gonococcal
Antimicrobial Resistance surveillance network,
Safdarjung Hospital.
Maldives P Established Four Reported Reported All national surveillance sites reported to GLASS
Nepal P Established 21 <70%
reported
Reported 236/899
(IPM);
269/1675
(MEM)
NA AMR surveillance started in Nepal since 1999 with
six participating laboratories/hospitals. The
network has extended and includes 21 hospitals.
Pakistan P Established 10 <70%
reported
No data
reported
629/8406
(IPM);
511/4037
(MEM)
NA All national surveillance sites reported to GLASS
Sri Lanka P Established 17 No data
reported
Reported NA NA National AMR Surveillance System for public as
well as the private sectors has been established in
2017. Each sector will develop their own
surveillance system under One Health approach.
NA, no data available; NAP, National Action Plan; NCC, National Coordinating Centre; NP, not in place; NR, number of resistant strains; NT,
number of tested strains by antimicrobial susceptibility testing (AST); IEDCR, Institute of Epidemiology Disease Control and Research; IPM,

58
imipenem susceptibility; MEM, meropenem susceptibility; P, place. *Data includes strains which were intermediate resistant or resistant to
carbapenem.

59
Table 1.8 WHO listed priority pathogens.
Priority 1: CRITICAL Priority 2: HIGH Priority 3: MEDIUM
• A. baumannii
(carbapenem-resistant)
• P. aeruginosa
(carbapenem-resistant)
• Enterobacterales
(carbapenem-resistant,
ESBL-producing)
• Enterococcus faecium
(vancomycin-resistant)
• S. aureus (methicillin-
resistant, vancomycin-
intermediate, and
resistant)
• Helicobacter pylori
(clarithromycin-resistant)
• Campylobacter spp.
(fluoroquinolone-resistant)
• Salmonellae
(fluoroquinolone-resistant)
• Neisseria gonorrhoeae
(cephalosporin-resistant,
fluoroquinolone-resistant)
• Streptococcus pneumoniae
(penicillin-non-
susceptible)
• Haemophilus influenzae
(ampicillin-resistant)
• Shigella spp.
(fluoroquinolone-resistant)
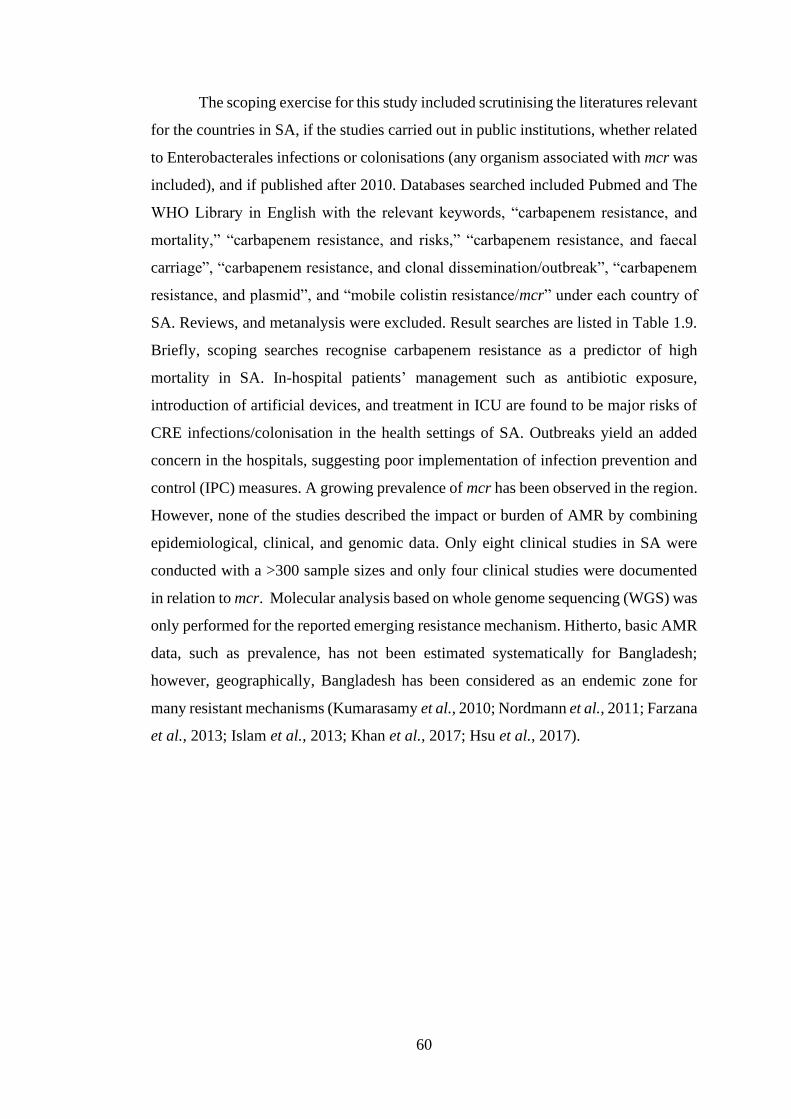
60
The scoping exercise for this study included scrutinising the literatures relevant
for the countries in SA, if the studies carried out in public institutions, whether related
to Enterobacterales infections or colonisations (any organism associated with mcr was
included), and if published after 2010. Databases searched included Pubmed and The
WHO Library in English with the relevant keywords, “carbapenem resistance, and
mortality,” “carbapenem resistance, and risks,” “carbapenem resistance, and faecal
carriage”, “carbapenem resistance, and clonal dissemination/outbreak”, “carbapenem
resistance, and plasmid”, and “mobile colistin resistance/mcr” under each country of
SA. Reviews, and metanalysis were excluded. Result searches are listed in Table 1.9.
Briefly, scoping searches recognise carbapenem resistance as a predictor of high
mortality in SA. In-hospital patients’ management such as antibiotic exposure,
introduction of artificial devices, and treatment in ICU are found to be major risks of
CRE infections/colonisation in the health settings of SA. Outbreaks yield an added
concern in the hospitals, suggesting poor implementation of infection prevention and
control (IPC) measures. A growing prevalence of mcr has been observed in the region.
However, none of the studies described the impact or burden of AMR by combining
epidemiological, clinical, and genomic data. Only eight clinical studies in SA were
conducted with a >300 sample sizes and only four clinical studies were documented
in relation to mcr. Molecular analysis based on whole genome sequencing (WGS) was
only performed for the reported emerging resistance mechanism. Hitherto, basic AMR
data, such as prevalence, has not been estimated systematically for Bangladesh;
however, geographically, Bangladesh has been considered as an endemic zone for
many resistant mechanisms (Kumarasamy et al., 2010; Nordmann et al., 2011; Farzana
et al., 2013; Islam et al., 2013; Khan et al., 2017; Hsu et al., 2017).

61
Table 1.9 Scoping findings relevant to this study from previous literature searches.
Article attributes Country Sample
size
Species Keynotes for relevant
findings
Relevant findings
Stewardson et al. Lancet Infect Dis.
2019;19(6):601-610.
Multinational
(LMICs)
297 Enterobacterales Mortality assessment Carbapenem resistant bloodstream
infections (BSIs) were significantly
associated with increased mortality and
increased length of hospital stay.
Investigation of clonal relatedness based
on Multilocus sequence type (MLST).
Snyder et al. Epidemiol Infect.
2019;147:e137.
India 213 K. pneumoniae Risks assessment CVC placement, prior carbapenem use
and ICU admission were the risk for the
development of BSI with NDM-1
producing and other MDR strains.
Choudhuri et al. Saudi J Anaesth.
2018;12(3):389-394.
India 106 MDR bacteria Mortality and risks
assessment
Significant higher mortality was found in
MDR group. The independent predictors
of MDR bacterial infection were Child-
Pugh score >10, prior carbapenem use,
antibiotic use for more than 10 days,
total parenteral nutrition, and concurrent
antifungal administration.
Shankar et al. J Assoc Physicians
India. 2018;66(12):13-16.
India 86 K. pneumoniae Mortality assessment Significant higher mortality was
observed in carbapenem resistant K.
pneumoniae. There were also
associations between hypermucoviscous
K. pneumoniae and mortality.
Naim et al. J Glob Infect Dis.
2018;10(3):133-139.
India 116 Gram-negative
Bacilli
Risks assessment Major risk factors in patients infected
with MBLs were in-dwelling devices,
prolonged hospital stay, and prior
antibiotic treatment, but the risks were
not assessed with any comparator.
Kaur et al. Am J Infect Control.
2017;45(11):1289-1291.
India 75 K. pneumoniae Prevalence of mortality
in CRE
5-year survey of dual colistin- and
carbapenem-resistant BSIs showed high
mortality (69.3%).

62
Mariappan et al. Int J Appl Basic Med
Res. 2017;7(1):32-39.
India 111 Enterobacterales Mortality and risks
assessment
Carbapenem resistance had significant
association with mortality among the
patients with mechanical ventilation and
indwelling invasive device.
Kumar et al. J Clin Diagn Res.
2015;9(11):DC08-DC13.
India 186 E. coli and
Klebsiella Spp.
Risks assessment Co-morbidity, ICU admission, and
administration of artificial device were
shown to risks for infections by NDM-1
producers.
Kalam et al. J Pak Med Assoc.
2014;64(5):530-536.
Pakistan 243 Gram-negative
bacteria
Mortality and risks
assessment
MDR bacteraemia is a significant risk for
mortality. Risk factors for carbapenem
resistant bacteraemia were age > 50
years, septic shock on presentation, ICU
stay of > 72 hours, and receiving
immunosuppressant medications.
Ramanathan et al. Indian J Med
Microbiol. 2018;36(4):572-576.
India 102 Enterobacterales Risks assessment Data showed that the development of
infections following CRE colonisation in
critical care unit. Patients exposed to
high end antibiotic and past history of
surgery had significant association with
CRE colonization
Singh et al. Am J Infect Control.
2018;46(6):e31-e35.
India 300 Enterobacterales Risks assessment Statistically significant risk factors of
CRE colonisation of neonates in neonatal
intensive care unit (NICU) were found to
be nasogastric (NG) tube, breastfeeding,
NG feeding, top feeding, expressed
breastmilk, ventilation, antibiotic
administration, and duration of
hospitalization
Bharadwaj et al. BMC Infect Dis.
2018;18(1):504.
India 897 Enterobacterales Risks assessment CRE colonisation was significantly
associated with recent healthcare and
ICU admission.
Mohan et al. Indian J Med Microbiol.
2017;35(4):555-562.
India 232 Enterobacterales Risks assessment ICU admission, administration of
indwelling device, and nasogastric tube
were the independent risks for CRE
colonisation.

63
Mittal et al. BMC Microbiol.
2016;16(1):138.
India 100 Enterobacterales Risks assessment The risk factors associated with CRE
carriage were duration of ICU stay, use
of ventilator and aminoglycosides
Datta et al. Indian J Med Microbiol.
2015;33(4):612-613.
India 75 Enterobacterales Risks assessment Patients with CRE colonisation in ICU
were more likely to be associated with
co-morbidity, prior surgery, intrahospital
transfer, and prior exposure to
carbapenem, cephalosporin,
fluoroquinolones, and metronidazole.
Naha et al. Int J Antimicrob Agents.
2020;55(3):105903.
India 4 K. pneumoniae Molecular
characterization by
WGS
Characterization of KPC producers by
WGS.
Shankar et al. BMC Microbiol.
2019;19(1):137.
India 49 K. pneumoniae Molecular
characterization by
WGS
Clonal relatedness of isolates harbouring
blaOXA-48-like and genetic background of
OXA-48-like using WGS. Genetic
distance based on SNP was not revealed.
Shankar et al. J Infect Public Health.
2019;12(5):741-743.
India One K. pneumoniae Molecular
characterization by
WGS
Characterization of an isolate of NDM
producer by WGS.
Zhu et al. Front Microbiol.
2018;9:2044
Sri Lanka 379 K. pneumoniae Molecular
characterization by
WGS
Transmission dynamics of OXA-181
producers by WGS.
Lomonaco et al. PLoS One.
2018;13(6):e0198526.
Pakistan 10 K. pneumoniae Molecular
characterization by
WGS
Transmission dynamics of 10
carbapenemase producers by WGS.
Shankar et al. J Med Microbiol.
2018;67(7):927-930.
India One K. pneumoniae Molecular
characterization by
WGS
Characterization of KPC producers by
WGS.
Shrestha et al. Antimicrob Agents
Chemother. 2017;61(12):e01425-17.
Nepal 250 E. coli Molecular
characterization by
WGS
Clonal relatedness of isolates harbouring
variants of blaNDM, revealed by WGS.
Genetic distance based on SNP was not
revealed.
Subramanian et al. J Glob Antimicrob
Resist. 2017;8:121-122.
India One E. coli Molecular
characterization by
WGS
Characterization of an isolate of NDM
producer by WGS.

64
Nahid et al. PLoS One.
2017;12(12):e0189438.
Pakistan One K. pneumoniae Molecular
characterization by
WGS
Characterization of an isolate of OXA-
181 producer by WGS.
Ranjan et al. Antimicrob Agents
Chemother. 2016;60(11):6795-6805.
India 510 E. coli Molecular
characterization by
WGS
Distribution of blaNDM in diverse STs of
E. coli. Typing was done ERIC-PCR
along with WGS of 5 isolates.
Wailan et al. Antimicrob Agents
Chemother. 2015;59(12):7405-7410.
Pakistan Four Gram-negative
bacteria
Molecular
characterization by
WGS
Characterization of 11 NDM-1 producers
isolated from stool of four patients. WGS
was deployed to characterize the isolates.
Stoesser et al. Antimicrob Agents
Chemother. 2014;58(12):7347-7357.
Nepal 94 K. pneumoniae Molecular
characterization by
WGS
Clonal relatedness and transmission
dynamic of K. pneumoniae by WGS
following an outbreak in a neonatal unit.
Genetic distance based on SNP was
revealed.
McGann et al. Antimicrob Agents
Chemother. 2012;56(4):1673-1679.
Afghanistan One Providencia
stuartii
Molecular
characterization by
WGS
Characterization of an isolate of NDM
producer by WGS.
Wangkheimayum et al. BMC Infect
Dis. 2020;20(1):544.
India 329 E. coli Characterization by
molecular approaches
other than WGS
Characterization of NDM and OXA-48
producers by MLST and PBRT.
Gondal et al. Infect Drug Resist.
2020;13:2105-2115.
Pakistan 227 K. pneumoniae Characterization by
molecular approaches
other than WGS
Evidence of clonal and non-clonal
dissemination of NDM, and OXA-48
producers, demonstrated by MSLT.
Khalid et al. Microb Drug Resist.
2020;26(3):284-289.
India 18 Gram-negative
bacteria
Characterization by
molecular approaches
other than WGS
Prevalence of NDM producers in a
neonatal unit along with probable spread
of carbapenem resistance by plasmid.
Mukherjee et al. Infect Genet Evol.
2019;69:166-175.
India 200 K. pneumoniae Characterization by
molecular approaches
other than WGS
Associations of blaNDM in diverse STs of
K. pneumoniae from neonatal
septicaemia, revealed by REP-PCR,
PFGE, and MLST.
Ahmad et al. Int J Antimicrob Agents.
2019;53(4):525-529.
India 14 K. pneumoniae Characterization by
molecular approaches
other than WGS
MLST based clonal relatedness with
characterization of genetic context and
plasmid of NDM producers from a
neonatal unit.

65
Qamar et al. Future Microbiol.
2019;14:691-704.
Pakistan 117 E. coli, and K.
pneumoniae
Characterization by
molecular approaches
other than WGS
Transmission dynamics of
carbapenemase producers by PFGE and
DNA hybridization.
Remya et al. J Lab Physicians.
2019;11(4):312-316.
India 370 K. pneumoniae Characterization by
molecular approaches
other than WGS
Clonal relatedness of NDM and KPC
producers by PFGE.
Choudhury et al. J Infect Public
Health. 2018;11(1):111-114.
India One E. coli Characterization by
molecular approaches
other than WGS
Clonal relatedness of NDM-4 producers,
revealed by MLST and PFGE along with
plasmid characterization.
Rahman et al. J Glob Antimicrob
Resist. 2018;14:154-157.
India 33 E. coli Characterization by
molecular approaches
other than WGS
Clonal relatedness of NDM producers.
Ahmad et al. Microb Drug Resist.
2018;24(2):161-165.
India 402 Enterobacterales Characterization by
molecular approaches
other than WGS
Characterize genetic context of NDM
producers and plasmid typing by PBRT.
Gajamer et al. J Glob Antimicrob
Resist. 2018;14:228-232.
India 973 E. coli Characterization by
molecular approaches
other than WGS
Characterization of plasmids harbouring
blaNDM, isolated from urine specimens.
Ahmad et al. Front Microbiol.
2018;9:407.
India 44 Enterobacterales Characterization by
molecular approaches
other than WGS
Characterization of plasmids harbouring
blaNDM.
Paul et al. Microb Drug Resist.
2017;23(7):815-821.
India 900 Carbapenem
resistant
bacteria
Characterization by
molecular approches
other than WGS
Evaluated the horizontal transmission of
NDM producers.
Paul et al. J Infect Chemother.
2017;23(4):206-210.
India Six E. coli Characterization by
molecular approches
other than WGS
Characterization of plasmids harbouring
blaNDM-7.
Khan et al. J Pak Med Assoc.
2016;66(8):999-1004.
Pakistan 114 Enterobacterales Characterization by
molecular approaches
other than WGS
Clonal relatedness of NDM-1 producers
by tandem repeat analysis.
Subramanian et al. Indian J Med
Microbiol. 2016;34(3):286-292.
India Three K. pneumoniae Characterization by
molecular approaches
other than WGS
Characterization of plasmids harbouring
blaNDM.

66
Krishnaraju et al. Indian J Med
Microbiol. 2015;33(1):30-38.
India 76 Enterobacterales Characterization by
molecular approaches
other than WGS
Characterization of NDM producers.
Pesesky et al. Emerg Infect Dis.
2015;21(6):1034-1037.
Pakistan 78 Enterobacterales Characterization by
molecular approaches
other than WGS
Characterization of plasmid harbouring
blaNDM-1 and blaKPC from Pakistan and
USA by sequencing of plasmid.
Hall et al. J Med Microbiol. 2014;63(Pt
8):1087-1092.
Sri Lanka 22 K. pneumoniae Characterization by
molecular approaches
other than WGS
Clonal relatedness of carbapenemase
producers by PFGE.
Sartor et al. Antimicrob Agents
Chemother. 2014;58(9):5589-5593.
Pakistan 66 Enterobacterales Characterization by
molecular approaches
other than WGS
Clonal spread of NDM producers,
revealed by rep-PCR.
Khajuria et al. Indian J Pathol
Microbiol. 2014;57(1):65-68.
India Six K. pneumoniae Characterization by
molecular approaches
other than WGS
Outbreak caused by NDM producers in a
neonatal unit.
Rahman et al. Int J Antimicrob Agents.
2014;44(1):30-37.
India 464 Enterobacterales Characterization by
molecular approaches
other than WGS
Characterization of plasmid harbouring
blaNDM.
Khajuria et al. Chemother Res Pract.
2014;2014:972646.
India 130 Enterobacter
Species
Characterization by
molecular approaches
other than WGS
Clonal relatedness and plasmid
characterization of NDM producers.
Khajuria et al. J Clin Diagn Res.
2014;8(6):DC01-DC4.
India 300 E. coli Characterization by
molecular approaches
other than WGS
Characterization of co-producing NDM-
1 and OXA-48 carbapenemases by
ERIC-PCR and PBRT.
Castanheira et al. Diagn Microbiol
Infect Dis. 2013;75(2):210-213.
India 13 Enterobacterales Characterization by
molecular approaches
other than WGS
Characterization of plasmids harbouring
blaNDM.
Islam et al. Eur J Clin Microbiol Infect
Dis. 2012;31(10):2593-2600.
Bangladesh 1,816 Gram-negative
bacteria
Characterization by
molecular approaches
other than WGS
Characterization of NDM producers by
PFGE.
Castanheira et al. Antimicrob Agents
Chemother. 2011;55(3):1274-1278.
India 39 Enterobacterales Characterization by
molecular approaches
other than WGS
Clonal dissemination of carbapenemase
producing bacteria, revealed by PFGE.

67
Roy et al. J Antimicrob Chemother.
2011;66(12):2773-2780.
India 99 E. coli Characterization by
molecular approaches
other than WGS
Clonal relatedness NDM producers by
PFGE, phenotyping (A, B1, B2 and D),
and based on virulence factors (hly,
papC, sfa, iroNE. coli, cnf1, iucC and
ibeA).
Akter et al. Vet World. 2020
Feb;13(2):266-274.
Bangladesh 140 E. coli Report of mcr in SA Report of mcr-3 from houseflies.
Azad et al. Pathogens. 2019;8(3):118. Bangladesh 400 E. coli Report of colistin
resistance in SA
Report of colistin resistant E. coli from
broiler chickens.
Sobur et al. J Adv Vet Anim Res.
2019;6(1):50-53.
Bangladesh 150 E. coli Report of mcr in SA Report of mcr-3 positive E. coli from
poultry, house flies, and pond water.
Johura et al. Gut Pathog. 2020;12:5. Bangladesh 65 E. coli Report of mcr in SA Report of mcr-1 positive E. coli from
food, water, hand rinse, and healthy
human gut.
Islam et al. Gut Pathog. 2017;9:77. Bangladesh 48 E. coli Report of mcr in SA Report of mcr-1 positive E. coli from
urban sludge samples.
Sobur et al. Future Microbiol.
2019;14:847-858.
Bangladesh 300 E. coli Report of mcr in SA Report of mcr-3 positive E. coli from
house flies.
Sarker et al. J Adv Vet Anim Res.
2019;6(3):272-277.
Bangladesh 60 E. coli Report of colistin
resistance in SA
Report of colistin resistant E. coli from
broilers sold.
Amin et al. J Glob Antimicrob Resist.
2020;22:546-552.
Bangladesh 104 E. coli Report of mcr in SA Report of mcr-1 positive E. coli from
poultry environments.
Gogry et al. Environ Sci Pollut Res Int.
2019;26(32):33715-33717.
India 253 Aeromonas spp. Report of mcr in SA Report of mcr-1 from urban sewage
water.
Ghafur et al. J Glob Antimicrob Resist.
2019;16:48-52.
India 110 E. coli Report of mcr in SA Report of mcr-1 positive E. coli from
food.
Singh et al. Antimicrob Agents
Chemother. 2018;62(2):e01885-17.
India 200 K. pneumoniae Report of mcr in SA Report of mcr-1 in chromosome.
Marathe et al. Water Res.
2017;124:388-397.
India 10* NR Report of mcr in SA Report of mcr-1 from waste.
Roy et al. Infect Control Hosp
Epidemiol. 2020;41(3):378-380.
India Two E. coli Report of mcr in SA Report of mcr-1 from clinical sample.
Palani et al. Diagn Microbiol Infect
Dis. 2020;97(1):114998.
India 65 E. coli Report of mcr in SA Report of mcr-1 from human gut flora.

68
Hameed et al. Rev Soc Bras Med Trop.
2019;52:e20190237.
Pakistan 146 A. baumannii,
and P.
aeruginosa
Report of mcr in SA Report of mcr-1 from clinical samples.
Azam et al. J Glob Antimicrob Resist.
2017;11:152-153.
Pakistan NR E. coli Report of mcr in SA Report of mcr-1 in avian pathogenic E.
coli.
Mohsin et al. Pathog Dis.
2019;77(7):ftz064.
Pakistan One E. coli Report of mcr in SA Report of mcr-1 positive E. coli from
broiler chicken.
Lv et al. Virulence. 2018;9(1):994-999. Pakistan 100 E. coli Report of mcr in SA Report of mcr-1 positive E. coli from
broiler chicken.
Mohsin et al. Antimicrob Agents
Chemother. 2016;61(1):e01945-16.
India 29 E. coli Report of mcr in SA First report of mcr-1 in Indian
subcontinent from clinical isolate.
Rafique et al. Front Microbiol.
2020;10:3052.
Pakistan 92 E. coli Report of mcr in SA Report of mcr-1 from domestic chicken.
Joshi et al. FEMS Microbiol Lett.
2019;366(20):fnz237.
Nepal 180 E. coli Report of mcr in SA Report of mcr-1 from chicken meats.
Joshi et al. Microb Drug Resist.
2019;25(6):846-854.
Nepal 324 E. coli Report of mcr in SA First report of mcr-1 in Nepal from
chicken.
NR, not reported. *Sediment samples.

69
My study has focused on two major aspects of AMR in Bangladesh. I
incorporated WHO listed priority pathogens, CRE and mcr-producers in my PhD to
assess the molecular epidemiology of AMR in the Bangladeshi settings. To the best of
my knowledge, this is the first prospective systematic AMR survey in Bangladesh,
conducted in the largest public health facilities, Dhaka Medical College Hospital
(DMCH) of Bangladesh. WGS was deployed and genomic data was merged with
pertinent patient’s demographic and clinical data, to investigate the clinical burden,
associations, potential outbreaks, and investigate the drivers of AMR. A follow-up
carriage AMR survey was conducted one year after the clinical study to explore factors
associated with faecal colonisation and to investigate clonal relatedness between
clinical and faecal isolates. The specific objectives of this PhD were followings:
1. To identify the Enterobacterales species and to undertake a comprehensive
phenotypic antibiogram on Enterobacterales from Bangladeshi hospitals with an
aim to relate antibiotic resistance profile with patients’ therapy and outcome –
please see point 4.
2. Deep sequencing to provide the following information: A) Identify key bacterial
clones dominant in causing infections. B) Enable the tracking of outbreaks and
transmission routes for infections. C) Facilitate in determining genomic AMR
gene clusters to identify recent evolution of strains expressing MDR phenotypes
i.e. is the MDR mechanism mobile and spreading from one bacterial strain/species
to another? Data from point 1 was supposed to inform as to which bacterial genes
would be scrutinize – for example, for colistin resistance I would initially focus
on those genes associated with colistin resistance e.g. mcr-1.
3. Understand the molecular epidemiology of AMR in the hospital settings of
Bangladesh hospitals and plasmid tracking to investigate the dynamics of MDR
gene spread. To identify and characterize the population genetic structure and
clonal relationships of MDR pathogens.
4. Identify patient risk factors for infections with MDR Enterobacteriaceae clones
by merging genomic sequencing with patient clinical and demographic data. To
establish a detailed patient profile for investigating key risk factors of
Enterobacterale infections associated with prevalent resistance mechanism in
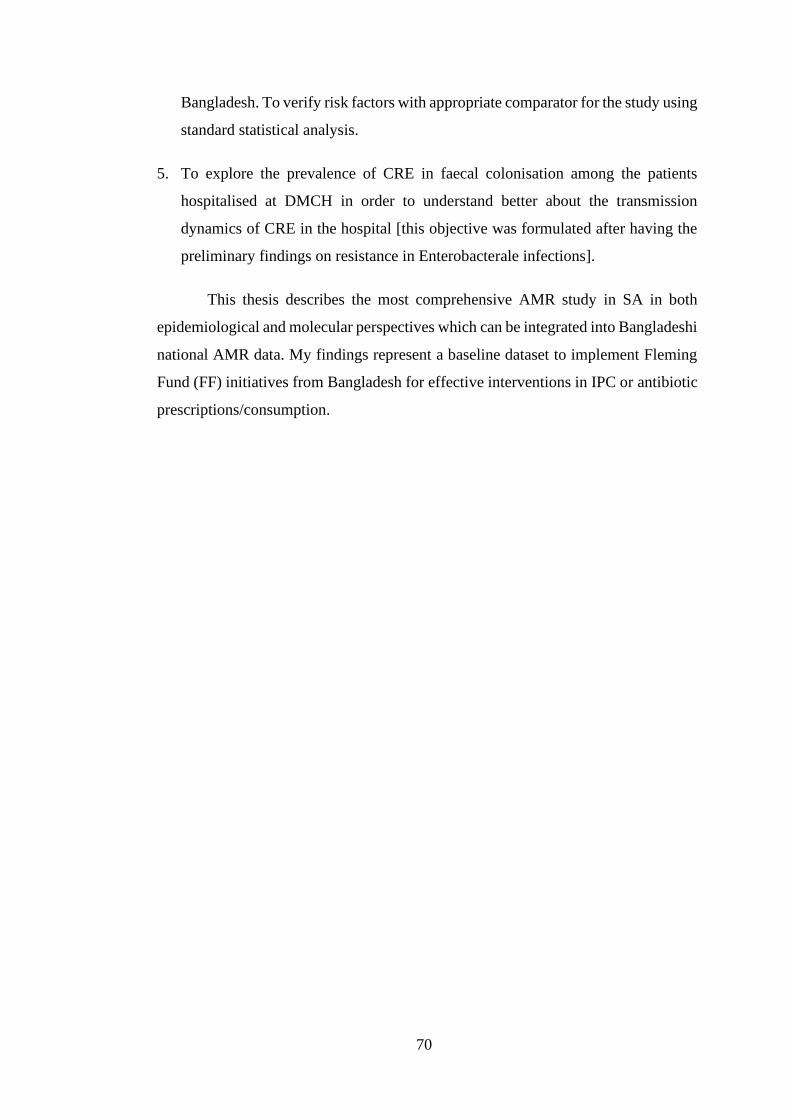
70
Bangladesh. To verify risk factors with appropriate comparator for the study using
standard statistical analysis.
5. To explore the prevalence of CRE in faecal colonisation among the patients
hospitalised at DMCH in order to understand better about the transmission
dynamics of CRE in the hospital [this objective was formulated after having the
preliminary findings on resistance in Enterobacterale infections].
This thesis describes the most comprehensive AMR study in SA in both
epidemiological and molecular perspectives which can be integrated into Bangladeshi
national AMR data. My findings represent a baseline dataset to implement Fleming
Fund (FF) initiatives from Bangladesh for effective interventions in IPC or antibiotic
prescriptions/consumption.

71
Section Two
Materials and Methods

72
2.1 Collection of samples
2.1.1 Hospital setting
We performed this study at DMCH which is the largest public tertiary care
hospital in Bangladesh containing 2600 allocated beds. The hospital setting is
generally oversubscribed, regularly provides healthcare to the public 4-5 times than its
capacity. To elucidate the extent of the hospital services, data on utilization of services
at DMCH based on ‘Health Bulletin’ by Ministry of Health and Family Welfare
(MOHFW), Bangladesh are shown in Table 2.1 (MOHFW, 2016).
Table 2.1 Utilization of services in DMCH (nominal, 2019) (MOHFW, 2016)*.
Indicators Unit
Admissions (n) 149122
Emergency visits (n) 346580
Out-patient department (OPD) visits (n) 799896
In Patient deaths (n) 13865
Bed Occupancy Rates (%) 131.4
Average Length of Hospital Stay (LoS) (No of days per
patient)
8.4
Hospital Death Rate (%) 9.3
*Data for 2019 have been updated in the health bulletin by MOHFW. n, number

73
2.1.2 Ethical considerations
This study was ethically approved by the Ethical Review Committee (ERC) of
DMCH in accordance with the Helsinki Declaration [Memo no: MEU-
DMC/ECC/2017/122]. Ethical permission is enclosed in appendix D. Required written
consent was taken from all the participants for this study. The consent form is also
attached in appendix D. Patient data anonymized with spreadsheets was protected by
encryption and passwords to protect patients in accordance with the Helsinki
Declaration (General Assembly of the World Medical Association, 2014).
2.1.3 Study design
During Oct 2016 to Sep 2017, a prospective cross-sectional survey on the
prevalence of CRE in clinical infections of hospitalised patients was undertaken. We
did a prospective case-control study for risk and outcome analysis of CRE infections.
Secondly, a prospective cross-sectional carriage study was undertaken from May 2018
to June 2018 to understand the prevalence of CRE in faecal carriage. We estimated
risk of CRE carriage through a case-control approach.
2.1.4 Collection of clinical specimens
Clinical specimens (n=1830) referred to the microbiology laboratory of DMCH
from inpatients hospitalised for two or more days during October 2016 to September
2017 were included in this study. The clinical cases included in this study were
suspected as infections by the physicians of DMCH, and specimens were referred for
microbiology according to their decision. This study did not involve with the diagnosis
of clinical infections, decision for undertaking microbiology testing, or clinical
reporting. The specimens were plated initially at the local laboratory of DMCH and
were broadly divided into two groups: 1) positive culture, and 2) no growth. Positive
cultures obtained at the local laboratory of DMCH were transferred to Cardiff
University (CU) for further analysis. Specimens sent to private laboratory during the
study period were not included.

74
2.1.5 Collection of rectal swabs
During May 2018 to June 2018, 700 non-duplicated rectal swabs (RSs) from
both inpatients (n=383) and outpatients (n=317) of DMCH. We estimated risk of CRE
carriage through a case-control approach.
2.1.6 Collection of patients’ demographic and clinical data
Data collected in the clinical study were patients’ name, age, sex, locality,
family member, family income, clinical symptoms or reason for hospitalization,
admitting wards, type of clinical specimens, outcome [discharge, discharge against
medical advice (DAMA), or death], date of admission, date of sample collection, date
of outcome, and ongoing antibiotics used during hospitalisation, and the data were
taken from the patients with positive cultures only.
Carriage study recorded data from 700 participants enrolled, and the data
included patients’ demography (as clinical study), admitting wards, date of admission,
date of sample collection, and antibiotics used up to sampling.
2.1.6.1 Assessment of socio-economic status
Per capita monthly income (total monthly income of the family/total members
of family) was used as parameter to determine the socio-economic condition of the
patient in this study (Agarwal, 2008). To calculate the original income scale range of
each socio-economic class in Bangladesh in 2017 and 2018, the income range (INR)
according to modified proposed classification of the month of December 2004 was
converted to Bangladeshi Taka (BDT) (1 INR is equivalent to about 1.25 BDT in 2017,
and 2018) and then multiplied by conversion factor (CF) (Ghosh and Ghosh, 2009).
CF between 2004 and the current year was determined by the following formula:
In Bangladesh, the average CPIs were 235, and 245 in 2017, and 2018,
respectively. In 2004, CPI was around 90 (Trading Economics, 2020). So, the
conversion factor was 2·61 and 2·72 for 2017, and 2018, accordingly. The
modification is illustrated in Table 2.2. Fractions in income were ignored.

75
Table 2.2 Assessment of socio-economic status.
Social classes Per capita monthly family income limit
BG Prasad’s
Classification of
1961 (INR)
Modified proposed
classification of the month
of December 2004 (INR)
Modified for 2017
Bangladesh (on
(BDT)
Modified for 2018 in
Bangladesh (on
(BDT)
I. Upper-high (UH) 100 and above 10000 and above 32,625, and above 34,000, and above
II. High 50-99 5000-9999 16,312-32,624 17,000-33,996
III. Upper-middle (UM) 30-49 3000-4999 9,787-16,311 10,200-16,996
IV. Lower-middle (LM) 15-29 1500-2999 4,893-9,786 5,100-10,196
V. Poor Below 15 500-1499 1,631-4,892 1,700-5,096
VI. Below poverty level (BPL) Below 500 Below 1,630 Below 1,700

76
2.2 Transfer of biological specimens
Clinical isolates and RSs were collected in amines transport swabs with
charcoal (Deltalab, Barcelona, Spain) and were transferred from Bangladesh to the UK
in UN3373 containers (UN3373, Lelystad, the Netherlands) with proper
documentation.
2.3 Cultivation of bacteria
Positive cultures from clinical specimens obtained at the local laboratory of
DMCH were transferred to Cardiff University (CU) for further analysis. Blood
specimens included in this study were cultured using BacT/ALERT 3D (bioMerieux,
North Carolina, USA) at DMCH. Clinical isolates were sub-cultured onto
chromogenic UTI agar (E&O Laboratories Ltd, Scotland, UK) without any antibiotic
selection and faecal samples onto chromogenic UTI agar with vancomycin (10 mg/L)
and ertapenem (2 mg/L) (Liofilchem, Roseto, Italy). Unless otherwise stated, the
growth conditions used for all strains was overnight incubation aerobically at 37o C.
Bacteria were initially isolated by colony colour and morphology on chromogenic
UTI. The species were identified by Matrix-Assisted Laser Desorption/Ionization-
Time of Flight mass spectrometry (MALDI-TOF MS) (Bruker Daltonics, Bremen,
Germany).
2.4 Immortalization
All the bacterial isolates involved in this work were frozen down for future use
with cryopreservation Storage Beads (Technical Service Consultants Ltd, Lancashire,
UK) at -80o C.

77
2.5 Determination of phenotypic resistance patterns
Minimum inhibitory concentration (MIC) was undertaken according to the
latest guidelines outlined by European Committee on Antimicrobial Susceptibility
Testing (EUCAST) (v10.0) (EUCAST, 2020). Where appropriate, latest
recommendations by Clinical Laboratory Standard Institute (CLSI) were implemented
(CLSI, 2020). Agar dilution method was implemented to determine the MIC of
clinically relevant antimicrobials (Andrews, 2001). Fifteen antimicrobials
(amoxicillin-clavulanic acid, piperacillin-tazobactam, ceftriaxone, ceftazidime,
cefotaxime, cefepime, imipenem, meropenem, ciprofloxacin, levofloxacin, amikacin,
gentamicin, sulfamethoxazole-trimethoprim, fosfomycin, and colistin) underwent
MIC testing in this study (Table 2.3). Although EUCAST does not recommend agar
dilution for the determination of colistin MIC, we deployed the procedure for colistin
contemplating it as more sensitive and reproducible than microbroth dilution (Turlej-
Rogacka et al., 2018).
Mueller Hinton agar plate containing antibiotic of interest ranging from 0.06
µg/ml to 256 µg/ml were prepared and 104 cfu/spot of each strain of up to 80 bacterial
colonies per plate were applied by multi-point inoculator. The plates were then
incubated overnight at 37º C. The lowest concentration of plate showing no growth
was considered as the MIC of the strain. Antimicrobial susceptibility patterns were
interpreted according to EUCAST clinical breakpoints or epidemiological cut-off
(ECOFF) value, where appropriate (v10.0) (EUCAST, 2020). All antibiotics were
prepared to a concentration of 2560 mg/L (stock A), with serial dilution to reach the
desired concentration (calculation shown in Table 2.4).

78
Table 2.3 Details of antimicrobials used in this study for susceptibility testing.
Antibiotics Manufacturer Solvent Diluent
Amikacin Sigma-Aldrich, Missouri, USA Water Water
Amoxicillin:cl
avulanate (4:1)
Sigma-Aldrich, Missouri, USA Saturated
NaHCO3
Saturated
NaHCO3
Cefepime Sigma-Aldrich, Missouri, USA Water Water
Cefotaxime Sigma-Aldrich, Missouri, USA Water Water
Ceftazidime Sigma-Aldrich, Missouri, USA Saturated
NaHCO3
Water
Ceftriaxone Bowmed Ibisqus Ltd, Clwyd,
UK
Water Water
Ciprofloxacin Sigma-Aldrich Missouri, USA Water Water
Colistin Sigma-Aldrich, Missouri, USA Water Water
Fosfomycin* Mercury Pharmaceuticals Ltd,
London, UK
Water Water
Gentamicin** Sigma-Aldrich, Missouri, USA - Water
Imipenem Sigma-Aldrich, Missouri, USA Phosphate
buffer
Phosphate
buffer
Levofloxacin Sigma-Aldrich, Missouri, USA Water Water
Meropenem Ranbaxy (UK) Ltd, Hayes, UK Water Water
Piperacillin Sigma-Aldrich, Missouri, USA Water Water
Sulphamethox
azole
Sigma-Aldrich, Missouri, USA DMSO Water
Tazobactam Sigma-Aldrich, Missouri, USA Saturated
NaHCO3
Water
Trimethoprim Sigma-Aldrich, Missouri, USA DMSO Water
*Granular form; **In solution.

79
Table 2.4 Serial dilution of antimicrobials to reach desired concentration.
Stock
solution
Serial dilution Desired
concentration
Stock A
(2560 mg/L)
3.5 ml of stock A + 31.5 ml of media 256 µg/ml
1.75 ml of stock A + add up to 35 ml of media 128 µg/ml
900 µl of stock A + add up to 35 ml of media 64 µg/ml
450 µl of stock A + add up to 35 ml of media 32 µg/ml
225 µl of stock A + add up to 35 ml of media 16 µg/ml
112.5 µl of stock A + add up to 35 ml of media 8 µg/ml
Stock B (80
mg/L: 500 µl
of stock A+
15.5 ml
solvent)
1.75 ml of stock B + add up to 35 ml of media 4 µg/ml
900 µl of stock B + add up to 35 ml of media 2 µg/ml
450 µl of stock B + add up to 35 ml of media 1 µg/ml
225 µl of stock B + add up to 35 ml of media 0.5 µg/ml
112.5 µl of stock B + add up to 35 ml of media 0.25 µg/ml
Stock C (2.5
mg/L: 500 µl
of 80 mg/L +
15.5 ml
solvent)
1.75 ml of stock B + add up to 35 ml of media 0.125 µg/ml
900 µl of stock B + add up to 35 ml of media 0.06µg/ml

80
2.6 Operational definition of carbapenem-resistant Enterobacterales
Whether an isolate was resistant or increased exposure to imipenem or
meropenem or both was defined as CRE. However, Proteus, Providencia and
Morganella were not considered as carbapenem resistant, if they were sensitive to
meropenem, but resistant to imipenem, because reduced susceptibility to imipenem is
considered intrinsic for those species (van Duin, 2017). If the isolate was sensitive to
both imipenem and meropenem was considered as carbapenem-sensitive
Enterobacterales (CSE). The participant, positive for at least one positive culture of
CRE isolated from clinical and faecal specimens, was considered as a CRE clinical
case and carriage, respectively. Whether any patient had positive culture with
Enterobacterales from clinical and faecal specimens, but the respective
Enterobacterales was sensitive to carbapenem, was regarded as CSE clinical case and
carriage, accordingly.

81
2.7 Polymerase chain reaction
Polymerase chain reaction (PCR) was deployed, where appropriate. Overnight
growth of bacterial colonies was suspended in 200 µl of water. For each reaction,
master mix containing 18 µl of Clinical Laboratory Reagent Water (CLRW), 1 µl of
bacterial suspension, and 1 µl of loading dye was added to puReTaq Ready-To-Go
PCR Beads (Merck Life Science, New Jersey, USA). PCR reaction was performed
using Bioer GeneTouch™ Thermal Cycler (Alpha Laboratories Ltd, Eastleigh, UK).
The parameters applied in PCR reaction were: initial denaturation at 94o C for five
minutes followed by 35 cycles of denaturation at 94o C for 45 seconds, annealing of
primer (temperatures varied according to primer sequences, Table 2.5) for 45 seconds,
extension at 72o C for one minute, and a final extension at 72o C for five minutes. The
PCR amplicons were loaded into a set 1.5% agarose gel (Lonza Pharma & Biotech,
Basel, Switzerland), and run in electrophoresis tank (Thermo Fisher Scientific,
Waltham, USA) with 1% Tris-Borate-EDTA (TBE) buffer (appendix E) using 260
Volts for 30 minutes. Primers sequences used in this study with specific targets and
conditions are illustrated in Table 2.5.
Table 2.5 Primers used in this study.
Targets Primers Sequences Anneali
ng Tm
Amplicon
size
Reference
blaCTX-M-15 CTXM15- F ATGCGCAAACGGCGGACGTA 55o C 600 bp Hasan,
2017 CTXM15- R CCCGTTGGCTGTCGCCCAAT
blaNDM NDM-M-F AGCTGAGCACCGCATT 60o C 648 bp Hasan,
2017 mcr-1 NDM-M-R CTCAGTGTCGGCATCAC
MCR-1-F GCTACTGATCACCACGCTGT 55o C 953 bp Yang et
al., 2017 MCR-1-R TGGCAGCGACAAAGTCATCT
mcr-8 MCR-8-F TATTCGCGGGTAACCAACCC 57o C 643 bp This study
MCR-8-R ATATTCCGCTTTCCCCCAGC
Tm, temperature

82
2.8 Whole genome sequencing
2.8.1 DNA extraction
A pure isolated bacterial colony was sub-cultured into an eppendorf containing
2 ml of fresh Luria-Bertani (LB) broth and incubated overnight at 37o C in a shaking
incubator. Overnight culture was centrifuged at 14,000 rpm for 10 minutes and
supernatant was discarded. An automated extraction of DNA was undertaken using
QIAcube (Qiagen, Hilden, Germany) according to manufacturer's protocol. The
extracted DNA was preserved at -20o C until use.
2.8.2 DNA quantitation
For each standard and DNA sample, 200 µl of working solution was prepared
by diluting the Qubit reagent 1:200 in Qubit buffer. Assay tubes for standards were
prepared by mixing 10 µl standard and 190 µl of working solution. From each DNA,
2 µl of DNA was added into 198 µl working solution to measure the DNA
concentration. Following 2 minutes incubation at room temperature, assay tubes were
inserted in the Invitrogen Qubit Fluorometer (Thermo Fisher Scientific, Waltham,
USA) to take the readings.
2.8.3 Illumina MiSeq sequencing
2.8.3.1 Preparation of genomic libraries
Whole genome sequencing (WGS) of all isolates of interest was performed at
illumina MiSeq platform (Illumina Inc., San Diego, USA). Nextera XT library
preparation was performed according to manufacturer's instructions. The first step is
the tagmentation of genomic DNA (gDNA) which was done by adding reagents
[Tagment DNA Buffer (TD), Amplicon Tagment Mix (ATM), Neutralize Tagment
Buffer (NT)] with 1 ng of input DNA followed by a limited cycle PCR with the mixture
of tagment DNA, Nextera PCR Master Mix (NPM) and index adapters (initial 72o C
for 3 minutes, and 95o C for 30 seconds, and then 12 cycles of 95o C for 10 seconds,
55o C for 30 seconds, and 72o C for 30 seconds, and a final extension of 72o C for 5
minutes). Libraries were cleaned up using Agencourt AMPure XP beads (AMPure XP
beads) and freshly prepared 80% ethanol (EtOH) and the gDNA were eluded with
Resuspension Buffer (RSB). To ensure more equal library representation in the pooled
library, each library was mixed with Library Normalization Additives 1 (LNA1) and
Library Normalization Beads 1 (LNB1) by shaking at 1800 rpm for 30 minutes

83
followed by a wash with Library Normalization Wash 1 (LNW1), and elution by 0.1
N NaOH. Then Library Normalization Storage Buffer 1 (LNS1) was added to each
library. All the libraries were pooled in a tube and then diluted with Hybridization
Buffer (HT1). PhiX was added as sequencing control into diluted pooled libraries.
Paired end sequencing (2x301 cycles) was performed in Illumina MiSeq system.
2.8.3.2 Bioinformatic analysis of raw reads (fastq) from Illumina MiSeq system
Quality control of raw reads included fastqc (v0.11.2) (Wingett and Andrews,
2018) and adaptor trimming was performed using Trimgalore (v0.4.3) (Babraham
Bioinformatics, 2019). Reads were assembled into contigs using the de novo assembler
SPAdes (v3.9.0) (.fasta) (Bankevich et al., 2012) and were aligned to the original fastq
reads using Burrows-Wheeler aligner (BWA) (v0.7.15) (Li and Durbin, 2009). Any
error was corrected using Pilon (v1.2) (Walker et al., 2014). Assembly metrics were
evaluated using Quast (v2.1) (Gurevich et al., 2013). The de novo assembly produced
multiple contigs (145-330), was then annotated with Prokka (v1.12) (Seemann, 2014).

84
2.8.4 MinION sequencing
2.8.4.1 Preparation of genomic libraries
To obtain long reads sequence data, minION sequencing was undertaken
(Oxford Nanopore technologies, Oxford, UK). AMPure XP (Beckman Coulter,
California, USA) was used to process gDNA to obtain a concentration 53.3 ng/µl.
DNA library was prepared by pooling of all barcoded samples. 1 µl of RAD was added
to pooled DNA. A final mixture of 75 µl (34 µl sequencing buffer, 25.5 μl loading
beads, 4.5 µl water and 11 µl DNA library) was loaded to flow cell. MinION device
was connected to MinKNOW GUI to obtain the reads.
2.8.4.2 Bioinformatic analysis of raw Nanopore reads
Demultiplexing of reads was performed using Porechop (0.2.3). Unicycler
(0.4.4) was used to yield hybrid assembly using both Illumina short reads and minION
long reads.

85
2.8.5 Phylogenetic analysis
Annotated assemblies generated by Prokka were used for core-genome
alignment using Roary (v3.12.0) with default setting (a gene was considered as core if
it was present in 99% of isolates and clustering of isolates based on presence of genes
showing minimum blastp percentage identity of 95%), where all the genomes were
from the same species (Page et al., 2015). Single nucleotide polymorphism (SNP)
calling and core-genome SNP-based alignment were performed using Snippy (v4.4.5)
(Seemann, 2015). We constructed maximum likelihood (ML) tree with core alignment
using RAxML-ng (v0.9.0.git-mpi) with a general time reversible (GTR) evolutionary
model and gamma correction with iterations until bootstrapping converged with cut-
off value of 3% (by default) (Kozlov et al., 2019). Visualisation of phylogenetic trees
and incorporation of metadata with the trees were performed using iTOL (v5) (Letunic
and Bork, 2019). Recombination removal was performed using Gubbins (v2.3.4)
(Croucher et al., 2015) followed by calculation of pairwise SNP distance matrices
using pairsnp (v0.0.7) (GitHub, 2018). SNPs-based network graphs were deployed to
plot putative transmission and epidemiological links using Cytoscape (v3.8.0) with the
clades having the following criteria: 1) contained isolates differed by ≤20 SNPs, 2)
contained clinical isolates, 3) consisted of at least five isolates, and 4) contained
carbapenem-resistant isolates (Shannon et al., 2003). Connections between isolates
were drawn whether the isolates were differed by ≤20 SNPs.

86
2.8.6 Phylogeographic analysis
Clonal phylogenetic signal can be obliterated due to recombination (Didelot
and Falush, 2007). Hence time-scale molecular evolution was estimated using
Bayesian Evolutionary Analysis by Sampling Trees (BEAST) package (v1.10.4) with
known sequence sampling time after removal of recombination following whole
genome alignment using Snippy (v4.4.5) (Drummond and Rambaut, 2007; Croucher
et al., 2015; Seemann, 2015). The following parameters were applied for Markov
Chain Monte Carlo (MCMC) runs: 1) HKY substitution model, Gamma plus invariant
sites heterogeneity model with estimated base frequency of 4 relative rates of
mutations across sites 2) four different models (strict clock and constant population
size, strict clock and exponential growth, relaxed clock and constant population size,
and relaxed clock and exponential growth) was deployed in each alignment 3) MCMC
chains were carried out at least 108 generations with sampling at every 1000 steps. The
numbers of invariant sites were extracted from the recombination masked whole
genome alignment and the numbers of constant sites were added to the document
(.xml), generated by BEAUti. Each MCMC run was performed in triplicates. Best fit
model was selected by calculation of Bayes factors (BFs). The BF is a ratio of two
marginal likelihoods obtained for the two models, was used to compare the models
from each other (Baele et al., 2012; Baele et al., 2013). Convergence of MCMC runs
were assessed using Tracer (v.1.7.1). MCMC runs were only accepted whether there
were estimations of >200 effective sample size (ESS). The maximum clade credibility
(MCC) tree was obtained from the trees’ posterior distributions, after a 10% burn-in,
with the Tree-Annotator (v1.10.4) in BEAST package. The trees were visualized using
FigTree (v1.4.4) (Rambaut, 2010).

87
2.8.7 Genomes retrieved from National Center for Biotechnology Information
Genomes from National Center for Biotechnology Information (NCBI) were
included in this study for three purposes: 1) used in constructing phylogenetic trees in
order to assess clonal lineages of the isolates in the respective trees, 2) used as
reference genome for core-genome SNP-based tree, 3) identification and removal of
recombinations from a set of closely related isolates, and 4) phylogeographic analysis.
The details on NCBI genomes used in this study have been mentioned along with the
relevant findings.
2.8.8 Analysis using publicly available database
Isolates were assigned as a species according to best match species in Kmer
database embedded in Center for Genomic Epidemiology (CGE). MLST was
delineated based on seven loci MLST databases in CGE, where appropriate
(https://cge.cbs.dtu.dk/services/). Antimicrobial resistance genes (ARGs) were
retrieved using Comprehensive Antibiotic Resistance Database (CARD) with a cut off
≥99.8% coverage and ≥99.8% identity, and virulence factors (VFs) and plasmid
replicon types using Virulence Factor Database (VFDB) and PlasmidFinder,
respectively with a cut off ≥99% coverage and ≥99% identity embedded in ABRicate
(Liu et al., 2019c; Alcock et al., 2020).

88
2.9 Pulsed-field gel electrophoresis
Pulsed field gel electrophoresis (PFGE) was performed to investigate the
clonal relationship of outbreak isolates of K. variicola and to determine the size of
plasmids having gene of interest in this study, as described previously (Toleman,
2018).
2.9.1 Making of plugs
A half loop full bacterial colony was mixed with 2 ml of Cell Suspension
Buffer (appendix E) and adjusted the concentration of cell suspensions by Jeneway
7315 spectrophotometer (Geneflow limited, Staffordshire, UK) [610 nm wavelength,
absorbance (Optical Density) of 1.00 (range of 0.8-1.0)]. A mixture consisted of 400
μl of cell suspension buffer, 20 μl of Proteinase K (20 mg/ml) and 400 μl melted 1%
SeaKem Gold agarose (Lonza Pharma & Biotech, Basel, Switzerland) was made by
gently pipetting mixture up and down a few times. The mixture was dispensed
immediately into the appropriate wells of reusable plug mold. The plugs were kept at
room temperature for 10-15 minutes to solidify.
2.9.2 Lysis of Cells and washing in Agarose Plugs
Agarose plugs (3-4) of each strain of interest were dispensed into a mixture of
5 ml cell lysis buffer (appendix E) and 20 μl of proteinase K (20 mg/ml) (Roche, Basel,
Switzerland) for incubation in a shaking incubator at 54-55° C for 2 hours. Therefore,
series of washing by pre-heated CLRW (2 times) and preheated Tris-EDTA (TE) (10
mM Tris:1 mM EDTA) buffer (appendix E) (4 times) were undertaken.
2.9.3 Digestion of DNA in agarose plugs
2.9.3.1 Digestion by restriction enzyme
A master mix of 180 μl CLRW with 20 μl of FastDigest restriction buffer (10X)
(Thermo Fisher Scientific, Waltham, US) was prepared to accomplish pre-restriction
incubation of 2.0 to 2.5 mm wide slice of a plug at room temperature for 10-15 minutes.
A master mix was prepared which contained 177 μl of CLRW, 22 Tango buffer (10X)
premixed with Bovine Serum Albumin (BSA) (Thermo Fisher Scientific, Waltham,
USA), and 1 μl of SpeI (10 U/µL) (Thermo Fisher Scientific, Waltham, USA). The
plugs were digested with the mixture at 37˚ C for 2 hours.

89
2.9.3.2 Digestion by S1 enzyme
Each individual plug was washed at room temperature for 20 minutes in 1 ml
of TE buffer (10 mM Tris:1 mM EDTA) followed by a second wash at room
temperature for 20 minutes in 1 ml of 1X S1 buffer (appendix E). Master mix
containing 0.5 ul of S1 (100U/ul) into 6 ml of 1X S1 buffer was prepared. 200ul of the
enzyme solution was then used to digest each plug. The digest was incubated at 4o C
overnight. Once digested the plug is removed from the digest solution and cut in half
for loading into agarose gel.
2.9.4 Electrophoresis
The digested plugs were loaded into a set 1% Pulsed-field gel electrophoresis
(PFGE) agarose gel (Sigma-Aldrich, Missouri, USA). A Lamda Ladder DNA Marker
(Bio-Labs, Massachusetts, USA) was used as a control to determine the size.
Electrophoresis was performed in a PFGE tank (CHEF-DRIII System, Bio-Rad
Laboratories, Hemel Hempstead, Hertforshire, UK) by means of conditions of 5
minutes of initial switch time, 45 minutes of final switch time, 21 hours run time, 6V
volts, 120o included angle and 4o cooling module. After completion, gel was visualised
by UVP Gel-Doc ItTM Imaging System (Thermo Fisher Scientific, Waltham, USA)
and the images were saved for further analysis.
2.10 In-gel hybridization of gene of interest
2.10.1 Pre-hybridization processing of gel
Gels were dried in a drying cabinet at 50o C overnight between 2 sheets of
blotting paper and stored for hybridization. Before hybridization, gels were re-
hydrated by 200 ml of deionized DNase free water for 5 minutes to pull away from the
blotting paper. Then the gels were treated with 200 ml of denaturing solution (appendix
E) at room temperature for 45 minutes followed by 200 ml of neutralising solution
(appendix E) for 45 minutes at room temperature. The gels were placed in a
hybridisation tube with 20 ml of pre-hybridisation solution (appendix E) and incubated
for at least 24 hours at 65o C.
2.10.2 Preparation of radioactive probe
The probe was prepared by the random priming labelling method. The purified
PCR product (200ng in 15ul water) was mixed with 8 ul of DNAase free water and 10

90
ul of random primer in a sterile top eppendorf and boiled for 5 minutes. 32P radioactive
probe (2.5 ul), dCTP buffer (10 ul) and Klenow (1 ul) were added and the eppendorf
was incubated within a lead jar at 37o C for 15 minutes. A Random Primer Labelling
Kit (Strategene, California, USA) was used. The labelled probe was run through a
silica gel NickTM Column (VWR International Ltd, Leicestershire, UK) with following
an initial washing by 320 ul of 0.1M Tris (pH 7.5) and a subsequent wash with 430 ul
of 0.1M Tris (pH 7.5). The flow through from second wash was collected as the eluded
radiolabelled target gene. The labelled probe was then boiled for 6 minutes in a screw
cap eppendorf tube.
2.10.3 In gel hybridization step
The labelled probe was added into the pre-hybridized gel and left to hybridize
overnight at 65o C. The liquid from hybridization tube was removed and the hybridized
gel was washed with 100 ml solution of 2X SSC (appendix E), and 0.1% SDS (Thermo
Fisher Scientific, Waltham, USA) for 1 hour at 65o C, and subsequently, with 100 ml
solution of 0.1X SSC (appendix E), and 0.1% SDS for 1 hour at 65o C. The gel was
wrapped in a single layer of flat, compressed cling film, and then was fixed against a
sheet of film in a film cassette overnight at -80o C. The film was treated using standard
film development until all bands were visible followed by fixation.

91
2.11 Investigating the stability of plasmid
Serial passaging of mcr-8.1positive K. pneumoniae (MCRPKP) was
performed in a colistin-free medium up to 12 days to investigate whether the mcr-8
was stable. Overnight cultures of MCRPKP were diluted 1:1,000 in fresh LB medium
without colistin and incubated with vigorous shaking (220 rpm) at 37°C for 24 h. Total
gDNA was extracted on day 0, day 3, day 6, day 9 and day 12 using the QIAcube
(Qiagen, Hilden, Germany) from the overnight culture with optical density (OD)
ranged from 0.08 to 0.1 at 600 nm. OD value was measured using Jeneway 7315
spectrophotometer (Geneflow limited, Staffordshire, UK). The prepared DNA was
analysed to quantify mcr-8.1 (plasmid-borne) and RcsA, a housekeeping gene (HKG)
in triplicate by real-time quantitative PCR (qPCR). Primers and probes were designed
manually using the Geneious prime primer design tool (11.0.2; Biomatters Ltd.) and
synthesised by Eurofins (Ebersberg, Germany). The primers and probes used in this
study are shown the Table 2.6. The real-time qPCR mixture of 20 µl was prepared
using 10 µl SSO advanced master mix (Bio-Rad, USA), 0.4 µl primer mix (mixture of
10 µL of each primer [100 pmol] and 60 µl of molecular grade water), 0.4 µl probe
mix (mixture of 10 µL of each probe [100 pmol] and 80 µl of molecular grade water),
4.2 µl of molecular grade water and 5 µl template DNA. qPCR was performed using
the CFX96 real-time system (Bio-Rad, USA) with cycling parameters of 1 x (95°C x
5 minutes), 44 x (95°C x 15 seconds, 60°C x 10 second). CT value was measured by
maestro interpretative software installed in the qPCR system. Relative abundance of
mcr-8.1, compared to HKG were calculating by delta-delta CT method (2–∆∆Ct). Gene
expression on day 0 was used a control.

92
Table 2.6 Sequences of primers and probes for qPCR designed in this study.
Name Target Tm GC% Sequence Product
length
Product
(Tm)
MCR 8_F mcr-8 58.2 52.0 CTCGCTTGCAGATTCCCTTACAACC - -
MCR 8_R mcr-8 58.2 52.2 TCCGTGCCGCATCAGAAGAAAAC - -
MCR 8_ Probe mcr-8 61.7 46.7 ACCATTGTTATTGTTGCGCCATAGCACCTC 108 bp 73
RcsA_F K. pneumoniae 58.4 59.1 TCCCAACCGGGTATAGCTGCAC - -
RcsA_R K. pneumoniae 59.3 59.1 TATCGCCCGCAAGGACTGCTTC - -
RcsA_Probe K. pneumoniae 63.1 41.0 ACATGACCCATCCTCAATCAACACGTAACGATATACACT 117 bp 74.5
Tm, temperature

93
2.12 Conjugation experiment
Conjugation experiment was performed using isolates carrying the mcr-1 and
mcr-8 as donors and Klebsiella variicola (BD_DM_07) and E. coli J53 as recipients,
respectively. Donor and recipient strains were grown in luria broth (Sigma-Aldrich,
Missouri, USA) until they reached the exponential growth phase (OD at 620 nm
[OD620] of 0.6). Conjugation experiments were performed on chromogenic UTI agar
(Sigma-Aldrich, Missouri, USA) plates, using a 1:1 donor-recipient mix, and plates
were incubated at 37°C for 6 hours. The conjugation mixture was suspended in 1 ml
of phosphate-buffered saline, and dilutions were plated on selective media. Selective
media was prepared using colistin (4 μg/ml) only to obtain transconjugants harbouring
mcr-1 and colistin (4 μg/ml) with sodium azide (100 μg/ml) to obtain transconjugants
harbouring mcr-8 and transconjugants were picked based on colony colour.
Transferability of mcr in transconjugants was confirmed by PCR. Transfer frequencies
were calculated by colony forming unit (cfu) count of transconjugants against the cfu
count of donor (Saavedra et al., 2017).

94
2.13 In vitro time-growth studies
Bacterial suspension of OD ranged from 0.08 to 0.1 at 600 nm was prepared
from overnight culture and diluted 1:100 in fresh LB medium. In vitro growth rate of
E. coli J53 and transconjugants (TDM_697b, TDM_782 and TDM_914b) was
determined by OD in 30 minutes interval for 24 hours with shaking at 100 rpm using
FLUOstar Omega microplate reader (BMG LABTECH Ltd., Aylesbury, UK). The
experiment was performed in five replicates. The growth curve of each strain was
generated with mean OD at each time point and was fitted to the modified Gompertz
model developed by Zwietering et al. (1990) using GraphPad Prism (v7.04). The
growth rate and lag time were calculated. The growth rate of each transconjugant was
compared to that of E. coli J53 by unpaired two-tailed t test using GraphPad Prism
(v7.04).

95
2.14 In vivo pathogenicity testing in Galleria mellonella
In vivo pathogenicity of K. variicola was compared to hypervirulent K.
pneumoniae A58300 in a Galleria mellonella infection model (larval stage) (Live
Foods UK Ltd., Somerset, UK). K. pneumoniae A58300 was provided for this study
by Prof. Ana C Gales (Coutinho et al., 2014). Inoculum to be injected into larvae were
prepared by washing of bacterial pellets and dilution until standardised at OD600nm=
0.7 followed by serial dilution. Using a Hamilton syringe, 10 µl aliquots of each
serially diluted bacterial suspension (103 to 107 cfu/ml) was injected into a group of 10
larvae (this was repeated three times). Larvae were incubated at 37 °C, and the survival
of larvae was monitored daily for 3 days. Death was denoted when larvae no longer
responded to touch. Three groups of larvae (first group with 10 µl saline injection,
second with mock injection and third without injection) were used as controls.

96
2.15 Statistical analysis
Statistical analyses were done using IBM SPSS (v26). Chi-square text (x2) was
carried out to analyse the risks with categorical variables and independent-samples t-
test was performed if the dependent variable with continuous data and statistical
significance (p<0.05) values were adjusted by Benjamini-Hochberg correction. We did
univariate statistics to assess the key risk factors. Cox proportional hazards model was
applied for analysing heath burden of carbapenem resistance (described in detail with
the respective chapters). Kaplan–Meier method was deployed for survival analysis
with respect to both carbapenem resistance and in-vivo pathogenicity testing in G.
mellonella (described in detail with the respective chapters). Pearson correlation
coefficient (r) was calculated to evaluate correlation between variables.

97
Section Three
Estimating Prevalence, Risks, and Burden of Carbapenem-
Resistant Enterobacterales in Clinical Infections of a
Bangladeshi Health Setting

98
3.1 Introduction
Enterobacterales are a large family of Gram-negative bacteria that includes
Escherichia, Klebsiella, Enterobacter, Citrobacter, Salmonella, Shigella, Proteus,
Serratia and other species. The members of Enterobacterales are present as normal
flora in the human intestinal tract. These pathogens are commonly associated with
urinary tract infections (UTIs), intra-abdominal infections (IAIs), nosocomial
pneumonia, and BSIs. Carbapenems are drugs used to treat serious MDR infections in
the hospital settings worldwide (Wikipedia, 2020e; Martirosov and Lodise, 2016; van
Duin and Doi, 2017). The global spread of CRE is regarded as a public health threat
resulting in enormous health and economic burdens, particularly in LMICs (O’Neill J,
2016; Walsh, 2010; Martirosov and Lodise, 2016; Pokharel et al., 2019; Stewardson
et al., 2019). E. coli, K. pneumoniae and Enterobacter spp. have been recognised as
the most frequent reservoir of carbapenemase determinants, causing life threatening
infections (Hsu et al., 2017; Jaggi et at., 2019; Wu et al., 2019; Walia et al., 2019).
Estimating the risks and outcome of any disease condition is a vital indicator to
investigate the intensity of the ailment which facilitates developing effective
interventions, and therefore, to evaluate the costs and benefit of the interventions.
Tackling AMR in a country mandates periodic high-quality data on both
epidemiological, and clinical components (Midega, 2020).
Previous AMR data from Bangladesh directs an overall high frequency of
MDR pathogens in the country (Ahmed et al., 2019; Hoque et al., 2020; Mahmud et
al., 2020; Parvin et al., 2020; WHO, 2020a). This chapter has achieved following aims
of this project [objectives #1, and #4]: 1) the prevalence of CRE in Bangladeshi health
settings and a detailed resistance profile of clinical Enterobacterales identified in this
study, 2) predisposing factors for developing carbapenem resistance in the largest
tertiary care hospital of Bangladesh, 3) the impact of CRE infections on human health.

99
3.2 Results
3.2.1 Prevalence of Enterobacterales infections in a clinical setting of
Bangladesh
Study population includes patients admitted at DMCH during 21st October
2016 to 23rd September 2017 whose clinical specimens were referred to clinical
microbiology laboratory of DMC. The total number of clinical cases enrolled in this
pilot surveillance was 1831, of which 534 (29.2%) patients had Enterobacterales
infections. The clinical infections enrolled in this study were confirmed by the
physicians at DMCH. Study outline is illustrated in Figure 3.1.
A total of 1893 clinical specimens were included in this study. The frequency
of culture-positive clinical samples was 58% (1098/1893) (Table 3.1), and a total of
1583 organisms were isolated (Table 3.2). The prevalence of Enterobacterales among
the clinical isolates was 40.6% (643/1583) (Figure 3.1; Table 3.2). The most
predominant members of Enterobacterales were E. coli (228/1583, 14.4%), and K.
pneumoniae (228/1583, 14.4%) followed by P. mirabilis (64/1583, 4%), E. cloacae
(37/1583, 2.3%), P. stuartii (19/1583, 1.2%), K. variicola (14/1583, 0.9%), S.
marcescens (13/1583, 0.8%) and others (40/1583, 2.5%) (Table 3.2).

100
Figure 3.1 Flowchart diagram of clinical sample collection at DMCH.
CRE, carbapenem-resistant Enterobacterales; CSE, carbapenem-sensitive
Enterobacterales. *During 4th July to 23rd Sep 2017, specimens were collected only
from NICU. Multiple clinical specimens were collected from 61 patients (blood &
wound swab, n=51; blood & urine, n=3; blood & tracheal aspirate, n=2; wound swab
& urine, n=2; blood & catheter tip, n=1; urine & tracheal aspirates, n=1; blood, urine
& catheter tip, n=1).**Patients with multiple culture positive clinical samples was 35
(blood & wound swab, n=26; blood & urine, n=2; blood & tracheal aspirate, n=2;
wound swab & urine, n=2; blood & catheter tip, n=1; urine & tracheal aspirates, n=1;
blood, urine & catheter tip, n=1).

101
Table 3.1 Total number of culture-positive clinical specimens from different wards of DMCH in this study (n=1893*).
Ward Blood (n=527) CT (n=6) CV tip (n=7) TA (n=99) Urine (n=442) WS (n=809) Total
S M NG S M NG S M NG S M NG S M NG S M NG
Burn 90 45 121 - 3 - 1 - - - - - 4 3 6 122 110 172 677
Casualty unit - - 1 - - - - - - - - - - - 1 6 4 9 21
CCU - - - - - - - - - - - - - - 1 - - - 1
Dialysis Unit - - - - - - - 1 - - - - - - - - - - 1
Fistula unit - - - - - - - - - - - - 31 11 7 - 1 - 50
Gynaecology 5 - 2 - - - - - - - - - 5 5 4 33 11 18 83
Haematology 6 1 9 - - 1 - - - - - - 5 4 3 1 - 3 33
HDU 1 1 2 - - - - - 1 3 1 2 1 - 5 2 1 7 27
ICU 8 6 11 - 1 - 2 - - 32 47 14 6 10 16 1 1 1 156
Medicine 6 - 5 - - - - - - - - - 7 - 20 4 1 10 54
Nephrology 1 - - - - - - - - - - - 8 5 14 - - - 28
Neurology 1 - - - - - - - - - - - - - - - - - 1
Neurosurgery - - 6 - - - - - - - - - 1 - - 1 2 - 10
NICU 43 12 118 - - - - - - - - - - - - - - - 173
OCC - - - - - - - - - - - - - - - 1 - - 1
Oncology - - - - - - - - - - - - 1 - - - - 1 2
Orthopaedics 1 - 2 - - - - - - - - - 2 2 1 27 12 7 54
PS 3 1 2 - - 1 - - - - - - 12 6 13 5 2 4 49
Paediatrics 2 1 9 - - - - - - - - - - - 11 1 1 8 33
Postnatal - - - - - - - - - - - - - - - - - 1 1
Surgery 3 - 3 - - - - 1 1 - - - 8 1 8 99 45 70 239
Urology - - - - - - - - - - - - 70 62 62 2 2 - 198
Total 170 67 291 - 4 2 3 2 2 35 48 16 161 109 172 305 193 311 1,891
CT, catheter tip; CV, central venous; TA, tracheal aspirate; WS, wound swab; S, single growth; M, mixed growth; NG, no growth; CCU, coronary
care unit; HDU, high dependency unit; ICU, intensive care unit; NICU, neonatal intensive care unit; OCC, one-stop crisis centres; PS, paediatric
surgery. *One bile and one urethral discharge were collected which were culture negative and positive, respectively.

102
Table 3.2 Total number of clinical isolates identified in this study (n=1583).
Organisms Blood CT CV tip TA UD Urine WS Total
A. baumannii 36 1 1 32 0 15 84 169
Acinetobacter spp. (other
than A. baumannii)*
8 0 0 4 0 15 5 32
Burkholderia spp.* 19 0 0 1a 0 1 0 21
Candida spp.* 6 0 0 0 0 7 2 15
Citrobacter farmeri 0 0 0 0 0 1 0 1
C. freundii 0 0 0 0 0 1 2 3
Citrobacter koseri 2 0 0 0 0 1 0 3
Citrobacter rodentium 0 0 0 0 0 0 2 2
Citrobacter sedlakii 0 0 0 0 0 0 2 2
Corynebacterium striatum 2 0 0 0 0 1 8 11
Entercoccus spp.* 23 1 2 11 0 59 74 170
E. aerogenes 0 0 0 0 0 0 2 2
E. asburiae 0 0 0 0 0 0 1 1
E. cloacae 8 0 0 1 0 8 20 37
E. coli 15 2 0 10 0 118 83 228
Escherichia hermannii 1 0 0 0 0 0 0 1
K. oxytoca 0 0 0 0 0 3 1 4
K. pneumoniae 44 3 1 30 1 54 95 228
K. quasipneumoniae 0 0 0 0 0 0 1 1
K. variicola 14 0 0 0 0 0 0 14
Leclercia adecarboxylata 0 0 0 0 0 1 0 1
M. morganii 0 0 0 0 0 5 1 6
Pantoea agglomerans 0 0 0 1 0 0 0 1
Proteus hauseri 0 0 0 0 0 2 0 2
P. mirabilis 10 0 0 8 0 7 39 64
Proteus vulgaris 1 0 0 0 0 0 0 1
P. rettgeri 0 0 0 0 0 2 2 4
P. stuartii 6 0 0 1 0 0 12 19
P. aeruginosa 65 1 1 24 1 60 203 355
Pseudomonas spp. (other
than P. aeruginosa)*
5 1 0 0 0 6 14 26
Salmonella spp.** 5 0 0 0 0 0 0 5
S. marcescens 6 0 0 3 0 3 1 13
S. aureus 3 0 1 0 0 2 39 45
Staphylococcus spp. (other
than S. aureus)*
22 0 0 0 0 7 10 38
S. maltophilia 1 0 0 10 0 5 2 18
Others*** 8 0 1 4 0 16 10 40
Total 310 9 7 140 2 400 715 1583
CT, catheter tip; CV, central venous; TA, tracheal aspirate; UD, urethral discharge;
WS, wound swab. *The organisms at the species level identified were: A. bereziniae
(n=9), A. junii (n=6), A. pittii (n=5), A. schindleri (n=3), Acinetobacter ursingii (n=3),
Acinetobacter baylyi (n=2), A. radioresistens (n=2), Acinetobacter towneri (n=2),
Burkholderia cepacia (n=16), Burkholderia cenocepacia (n=4), Burkholderia gladioli
(n=1), Candida tropicalis (n=9), Candida albicans (n=4), Candida auris (n=2),
Enterococcus faecalis (n=116), Enterococcus faecium (n=39), Enterococcus
gallinarum (n=6), Enterococcus hirae (n=3), Enterococcus avium (n=2),

103
Enterococcus casseliflavus (n=2), Enterococcus raffinosus (n=1), Enterococcus
thailandicus (n=1), Pseudomonas mendocina (n=11), P. putida (n=6), Pseudomonas
mosselii (n=2), Pseudomonas oleovorans (n=2), Pseudomonas brassicacearum (n=1),
Pseudomonas composti (n=1), Pseudomonas guariconensis (n=1), Pseudomonas
pseudalcaligenes (n=1), Pseudomonas stutzeri (n=1), Staphylococcus haemolyticus
(n=19), Staphylococcus sciuri (n=6), Staphylococcus epidermidis (n=5),
Staphylococcus hominis (n=3), Staphylococcus arlettae (n=2), Staphylococcus cohnii
(n=2), Staphylococcus capitis (n=1), Staphylococcus saprophyticus (n=1).
**Organism could not be identified at the species level by MALDI. ***Any non-
Enterobacterales was considered as ‘others’, if the frequency of respective species
isolation was less than 10.aB. cepacia from TA.

104
3.2.2 Characterization of clinical Enterobacterales for carbapenem resistance
and susceptibility patterns of other relevant antimicrobials
CRE isolation from the clinical specimens was 11.1% (210/1893), and clinical
cases of CRE was 10.6% (194/1831) (Figure 3.1). Carbapenem resistance at the
species level were: K. pneumoniae, 52.6% (120/228); E. coli, 23.7% (54/228); E.
cloacae, 27% (10/37); P. mirabilis, 11% (7/64); P. stuartii, 36.8% (7/19); K. variicola,
35.7% (5/14); and others 13.2% (7/53) (Table 3.3). Range of MIC values of all
antimicrobials against each species of Enterobacterales are listed in Table 3.3. The
phenotypic resistance patterns of other antimicrobials of each species are also shown
in Table 3.4. Minor species, Salmonella spp. (n=5), P. agglomerans (n=1), E.
hermannii (n=1), and L. adecarboxylata (n=1) were not assessed for MIC50 and MIC90.
Salmonella spp. and P. agglomerans were sensitive to all antibiotics. Susceptibility
patterns of minor species are described in Figure 3.2. K. pneumoniae was significantly
more resistant to carbapenems than other species (p<0.05) (Table 3.5).

105
Table 3.3 MIC ranges of clinical Enterobacterales.
E.
coli
(n
=2
28
)
Antibiotics MIC50
(mg/l)
MIC90
(mg/l)
Range of MIC
(mg/l)
n (%) Resistance
AMC 128 256 2 to 256 219 (96.1)
TZP 32 >256 0.125 to >256 130 (57)
CRO >256 >256 0.125 to >256 194 (85.1)
CAZ 64 256 ≤0.06 to >256 194 (85.1)
CTX 256 >256 ≤0.06 to >256 194 (85.1)
FEP 128 >256 ≤0.06 to >256 188 (82.5)
IPM 0.25 8 ≤0.06 to 256 38 (16.7)
MEM ≤0.06 16 ≤0.06 to >256 53 (23.2)
CIP 128 >256 ≤0.06 to >256 204 (89.5)
LVX 32 64 ≤0.06 to 256 204 (89.5)
AMK 4 >256 1 to >256 65 (28.5)
GEN 1 >256 ≤0.06 to >256 115 (50.4)
SXT 256 >256 0.5 to >256 160 (70.2)
FOF 0.5 1 0.25 to 8 0 (0)
CST 0.125 0.25 ≤0.06 to 2 0 (0)
K.
pn
eum
on
iae
(n=
22
8)
AMC 256 256 4 to >256 225 (98.7)
TZP 256 >256 1 to >256 153 (67.1)
CRO 256 >256 ≤0.06 to >256 211 (92.5)
CAZ 64 256 ≤0.06 to >256 214 (93.9)
CTX 128 >256 ≤0.06 to >256 212 (93)
FEP 32 128 ≤0.06 to >256 206 (90.4)
IPM 2 16 ≤0.06 to >256 94 (41.2)
MEM 4 32 ≤0.06 to >256 119 (52.2)
CIP 16 256 ≤0.06 to >256 216 (94.7)
LVX 8 64 ≤0.06 to >256 180 (78.9)
AMK >256 >256 0.5 to >256 152 (66.7)
GEN 256 >256 0.125 to >256 174 (76.3)
SXT >256 >256 1 to >256 225 (98.7)
FOF 8 32 1 to >256 16 (7)
CST 0.5 0.5 ≤0.06 to 64 4 (1.8)
Kle
bsi
ella
oth
er t
ha
n K
. p
neu
mo
nia
e
(n=
19
)
AMC 128 256 16 to 256 19 (100)
TZP 8 >256 2 to >256 9 (47.4)
CRO 128 >256 ≤0.06 to >256 15 (78.9)
CAZ 32 256 ≤0.06 to >256 15 (78.9)
CTX 64 256 ≤0.06 to 256 15 (78.9)
FEP 8 64 ≤0.06 to 64 15 (78.9)
IPM 0.5 8 0.5 to 8 4 (21.1)
MEM ≤0.06 8 ≤0.06 to 8 5 (26.3)
CIP 2 4 ≤0.06 to 8 16 (84.2)
LVX 0.5 2 ≤0.06 to 2 9 (47.4)
AMK 2 16 1 to 16 5 (26.3)
GEN 0.25 1 0.25 to 32 1 (5.3)
SXT >256 >256 4 to >256 17 (89.5)
FOF 4 16 2 to 16 0 (0)
CST 0.25 0.05 ≤0.06 to 0.5 0 (0)
Pro
teu
s sp
p.
(n=
67
) AMC >256 >256 0.5 to >256 61 (91)
TZP 0.5 16 ≤0.06 to 64 8 (11.9)
CRO 4 16 ≤0.06 to >256 44 (65.7)
CAZ 64 >256 ≤0.06 to >256 50 (74.6)
CTX 16 64 ≤0.06 to >256 49 (73.1)
FEP 8 32 ≤0.06 to 128 48 (71.6)
IPM 4 8 ≤0.06 to 64 66 (98.5)
MEM ≤0.06 0.5 ≤0.06 to 16 3 (4.5)

106
CIP 32 256 ≤0.06 to >256 60 (89.6)
LVX 32 64 ≤0.06 to >256 60 (89.6)
AMK >256 >256 1 to >256 46 (68.7)
GEN >256 >256 0.5 to >256 60 (89.5)
SXT 256 >256 1 to >256 65 (97)
FOF 8 32 0.25 to >256 6 (8.9)
CST >256 >256 >256 67 (100)
En
tero
ba
cter
sp
p.
(n=
40
)
AMC 256 256 64 to >256 40 (100)
TZP 8 >256 1 to >256 17 (42.5)
CRO 128 >256 0.25 to >256 32 (80)
CAZ 16 256 ≤0.06 to >256 34 (85)
CTX 128 >256 0.25 to >256 33 (82.5)
FEP 8 256 ≤0.06 to >256 29 (72.5)
IPM 1 64 0.125 to 128 10 (25)
MEM ≤0.06 64 ≤0.06 to 64 11 (27.5)
CIP 2 64 ≤0.06 to >256 26 (65)
LVX 1 16 ≤0.06 to 128 21 (52.5)
AMK 4 >256 1 to >256 8 (20)
GEN 32 >256 0.125 to >256 24 (60)
SXT 256 >256 1 to >256 32 (80)
FOF 8 64 0.5 to 128 6 (15)
CST 0.25 0.5 ≤0.06 to 64 1 (2.5)
Cit
rob
act
er s
pp
. (n
=1
1)
AMC >256 >256 32 to >256 11 (100)
TZP 8 >256 2 to >256 4 (36.4)
CRO 32 >256 ≤0.06 to >256 7 (63.6)
CAZ 16 >256 ≤0.06 to >256 7 (63.6)
CTX 32 >256 ≤0.06 to >256 7 (63.6)
FEP 8 64 ≤0.06 to 64 7 (63.6)
IPM 0.5 8 0.25 to 16 4 (36.4)
MEM ≤0.06 16 ≤0.06 to 16 3 (27.3)
CIP 2 8 ≤0.06 to 16 7 (63.6)
LVX 1 8 ≤0.06 to 32 6 (54.5)
AMK 4 >256 1 to >256 4 (36.4)
GEN 32 >256 0.125 to >256 6 (54.5)
SXT 8 256 1 to 256 8 (72.7)
FOF 0.5 4 0.25 to 64 1 (9.1)
CST 0.25 0.5 0.125 to 0.5 0 (0)
Pro
vid
enci
a s
pp
. (n
=2
3)
AMC >256 >256 2 to >256 22 (95.7)
TZP 32 >256 2 to >256 17 (73.9)
CRO 64 >256 ≤0.06 to >256 20 (87)
CAZ 256 >256 0.125 to >256 22 (95.7)
CTX 64 128 ≤0.06 to >256 21 (91.3)
FEP 16 64 ≤0.06 to 64 17 (73.9)
IPM 2 16 0.125 to 32 23 (100)
MEM ≤0.06 16 ≤0.06 to 16 7 (30.4)
CIP 32 256 0.25 to >256 22 (95.7)
LVX 32 128 0.5 to 256 22 (95.7)
AMK >256 >256 0.5 to >256 19 (82.6)
GEN >256 >256 ≤0.06 to >256 19 (82.6)
SXT >256 >256 4 to >256 23 (100)
FOF 16 32 1 to 128 2 (8.7)
CST >256 >256 >256 23 (100)
S.
ma
rcesc
en
s
(n=
13
)
AMC 32 256 8 to >256 12 (92.3)
TZP 2 256 1 to >256 3 (23.1)
CRO 0.125 >256 ≤0.06 to >256 3 (23.1)
CAZ 0.5 256 0.25 to >256 2 (15.4)
CTX 0.125 128 0.125 to >256 3 (23.1)
FEP 0.06 64 ≤0.06 to 256 2 (15.4)

107
IPM 0.5 16 0.5 to 128 2 (15.4)
MEM ≤0.06 8 ≤0.06 to 32 2 (15.4)
CIP ≤0.06 0.25 ≤0.06 to 4 1 (7.7)
LVX 0.125 1 ≤0.06 to 8 2 (15.4)
AMK 2 4 1 to 64 1 (7.7)
GEN 0.5 4 0.25 to 256 2 (15.4)
SXT 8 16 2 to >256 12 (92.3)
FOF 8 16 2 to 16 0 (0)
CST >256 >256 256 to >256 13 (100)
M. m
org
an
ii (
n=
6)
AMC 64 >256 64 to >256 6 (100)
TZP 2 32 0.5 to 32 1 (16.7)
CRO ≤0.06 128 ≤0.06 to 128 3 (50)
CAZ 0.25 64 0.25 to 64 3 (50)
CTX ≤0.06 128 ≤0.06 to 128 3 (50)
FEP ≤0.06 8 ≤0.06 to 8 3 (50)
IPM 2 4 1 to 4 6 (100)
MEM ≤0.06 0.5 ≤0.06 to 0.5 0 (0)
CIP 256 >256 1 to >256 6 (100)
LVX 16 64 2 to 64 6 (100)
AMK 16 >256 0.5 to >256 4 (66.7)
GEN 8 >256 0.125 to >256 4 (66.7)
SXT 256 >256 4 to >256 6 (100)
FOF 64 >256 64 to >256 6 (100)
CST >256 >256 >256 6 (100)
n, number of resistant isolates to respective antibiotic; AMC, amoxicillin-clavulanic
acid; TZP, piperacillin-tazobactam; CRO, ceftriaxone; CAZ, ceftazidime; CTX,
cefotaxime; FEP, cefepime; IPM, imipenem; MEM, meropenem; CIP, ciprofloxacin;
LVX, levofloxacin; AMK, amikacin; GEN, gentamicin; SXT, sulfamethoxazole-
trimethoprim; FOF, fosfomycin; CST, colistin.

108
Table 3.4 Antimicrobial susceptibility patterns of clinical Enterobacterales.
Species
Resistance to respective antibiotics, n (%)
AMC TZP CRO CAZ CTX FEP IPM MEM CIP LVX AMK GEN SXT FOF CST
E. coli
(n=228)
219
(96.1)
130
(57)
194
(85.1)
194
(85.1)
194
(85.1)
188
(82.5)
38
(16.7)
53
(23.2)
204
(89.5)
204
(89.5)
65
(28.5)
115
(50.4)
160
(70.2)
0
(0)
0
(0)
K. pneumoniae
(n=228)
225
(98.7)
153
(67.1)
211
(92.5)
214
(93.9)
212
(93)
206
(90.4)
94
(41.2)
119
(52.2)
216
(94.7)
180
(78.9)
152
(66.7)
174
(76.3)
225
(98.7) 16 (7)
4
(1.8)
Other Klebsiella
spp. (n=19)* 19 (100)
9
(47.4)
15
(78.9)
15
(78.9)
15
(78.9)
15
(78.9)
4
(21.1)
5
(26.3)
16
(84.2)
9
(47.4) 5 (26.3) 1 (5.3)
17
(89.5)
0
(0)
0
(0)
Proteus spp.
(n=67) 61 (91)
8
(11.9)
44
(65.7)
50
(74.6)
49
(73.1)
48
(71.6)
67
(100) 3 (4.5)
60
(89.6)
60
(89.6)
46
(68.7)
60
(89.5)
65
(97) 6 (8.9) 67 (100)
Enterobacter spp.
(n=40) 40 (100)
17
(42.5)
32
(80)
34
(85)
33
(82.5)
29
(72.5)
10
(25)
11
(27.5)
26
(65)
21
(52.5) 8 (20)
24
(60)
32
(80) 6 (15)
1
(2.5)
Citrobacter spp.
(n=11) 11 (100)
4
(36.4)
7
(63.6)
7
(63.6)
7
(63.6)
7
(63.6)
4
(36.4)
3
(27.3)
7
(63.6)
6
(54.5) 4 (36.4)
6
(54.5)
8
(72.7) 1 (9.1)
0
(0)
Providencia spp.
(n=23)
22
(95.7)
17
(73.9)
20
(87)
22
(95.7)
21
(91.3)
17
(73.9)
23
(100)
7
(30.4)
22
(95.7)
22
(95.7)
19
(82.6)
19
(82.6)
23
(100) 2 (8.7) 23 (100)
S. marcescens
(n=13)
12
(92.3)
3
(23.1)
3
(23.1)
2
(15.4)
3
(23.1)
2
(15.4)
2
(15.4)
2
(15.4)
1
(7.7)
2
(15.4) 1 (7.7)
2
(15.4)
12
(92.3) 0 (0) 13 (100)
M. morganii
(n=6) 6 (100)
1
(16.7)
3
(50)
3
(50)
3
(50)
3
(50)
6
(100)
0
(0) 6 (100) 6 (100) 4 (66.7)
4
(66.7)
6
(100)
6
(100) 6 (100)
Values in parentheses indicate row percentage. AMC, amoxicillin-clavulanic acid; TZP, piperacillin-tazobactam; CRO, ceftriaxone; CAZ,
ceftazidime; CTX, cefotaxime; FEP, cefepime; IPM, imipenem; MEM, meropenem; CIP, ciprofloxacin; LVX, levofloxacin; AMK, amikacin;
GEN, gentamicin; SXT, sulfamethoxazole-trimethoprim; FOF, fosfomycin; CST, colistin. Data on Salmonella spp. (n=5), P. agglomerans (n=1)
and E. hermannii (n=1) are not included in this table. *Klebsiella species other than K. pneumoniae. Cells are highlighted according to the
proportion of resistance of the species of Enterobacterales against respective antibiotics: ≥90% are represented by red (●); 60% to 89% by amber
(●); 30% to 59% by yellow (●); <30% by green (●); intrinsic resistance by grey (●).

109
Figure 3.2 Susceptibility patterns of Salmonella spp. (n=5), P. agglomerans (n=1), E.
hermannii (n=1), and L. adecarboxylata (n=1). Green indicates susceptible and red
indicates resistance to respective antibiotics. AMC, amoxicillin-clavulanic acid; TZP,
piperacillin-tazobactam; CRO, ceftriaxone; CAZ, ceftazidime; CTX, cefotaxime; FEP,
cefepime; IPM, imipenem; MEM, meropenem; CIP, ciprofloxacin; LVX,
levofloxacin; AMK, amikacin; GEN, gentamicin; SXT, sulfamethoxazole-
trimethoprim; FOF, fosfomycin; CST, colistin.

110
Table 3.5 Comparative analysis for the distribution of carbapenem resistance among
the species of Enterobacterales (n=643).
Attributes CRE (n=210) CSE (n=433) p value
Carbapenem resistance
in K. pneumoniae
K. pneumoniae 120 (57.1%) 108 (24.9%) <0.0001
Other Enterobacterales 90 (42.9%) 325 (75.1%)
Carbapenem resistance
in E. coli
E. coli 54 (25.7%) 174 (40.2%) <0.0001
Other Enterobacterales 156 (74.3%) 259 (59.8%)
Carbapenem resistance
in Proteus spp.
Proteus spp. 7 (3.3%) 373 (86.1%) <0.0001
Other Enterobacterales 203 (96.7%) 60 (13.9%)
Carbapenem resistance
in Enterobacter spp.
Enterobacter spp. 11 (5.2%) 29 (6.7%) 0.472
Other Enterobacterales 199 (94.8%) 404 (93.3%)
Bivariate analysis was performed to measure the associations. Cells are highlighted
whether any variable was significantly higher with CRE.

111
3.2.3 The prevalence of carbapenemases alleles in clinical Enterobacterales
Carbapenemase alleles were characterized according to WGS data. The most
prevalent carbapenemase gene among the clinical Enterobacterales was blaNDM-5
(97/643, 15.1%) followed by blaNDM-1 (62/643, 9.6%), blaOXA-232 (26/643, 4%), blaOXA-
181 (24/643, 3.7%), blaNDM-7 (8/643, 1.2%), blaKPC-1 (5/643, 0.8%), blaNDM-4 (4/643,
0.6%), and novel NDM variants (9/643, 1.4%) (Table 3.6). The combinations of
carbapenemase alleles recovered were: blaKPC-1+blaOXA-181 (5/643, 0.8%), blaNDM-
1+blaOXA-232 (3/643, 0.5%), blaNDM-5+blaOXA-181 (3/643, 0.5%), blaNDM-5+blaOXA-232
(3/643, 0.5%), and blaNDM-7+blaOXA-181 (1/643, 0.2%). The most prevalent
carbapenemase in E. coli was blaNDM-5 (41/228, 17.1%), and K. pneumoniae were
blaNDM-5 (50/228, 21.9%), and blaNDM-1 (38/228, 16.7%). There were associations
between the prevalence of specific carbapenemase gene, and certain species of clinical
Enterobacterales [blaNDM-1 in K. pneumoniae (38/228, 16.7%) than others (24/415,
5.8%) (p<0.05), blaOXA-181 in K. pneumoniae (17/228, 7.5%) than others (7/415, 1.7%)
(p<0.05), and blaNDM-5 in K. pneumoniae (50/228 21.9%) than others (47/415, 11.3%)
(p<0.05)]. Among the clinical Enterobacterales, blaNDM-4 was only found in E. coli and
blaOXA-232 and blaKPC-1 were only in K. pneumoniae (Figure 3.3).
All the clinical Enterobacterales phenotypically resistant to carbapenem, had
at least one carbapenemase, but we found the presence of blaOXA-232 (n=9) and blaOXA-
181 (n=1) in phenotypically carbapenem-susceptible isolates (low clinical breakpoint
according to EUCAST). Table 3.7 describes the range of MIC of OXA-232-, and
OXA-181-producing Enterobacterales.
We considered the alleles as novel NDM variants whether there were base
substitutions in the variants compared to known blaNDM variants (data not shown).
Elucidating functional and molecular properties of the novel NDM variants was
beyond the scope of this study. Further work has been planned to characterise the novel
variants.

112
Table 3.6 The distribution of carbapenemases alleles among the species of clinical
Enterobacterales (n=643).
Carbapenemase
alleles
Host species (n) n (%)
NDM-5 CRo (1), CSe (1), EC (41), EnC (4), KP (50) 97 (15.1)
NDM-1 EC (1), EnC (4), KP (38), KV (5), PM (6), PS
(7), SM (1)
62 (9.6)
OXA-232 KP (26) 26 (4)
OXA-181 EC (5), KP (17), PM (1), MM (1) 24 (3.7)
Novel NDM
variants
CRo (1), EC (4), EnC (1), KP (3) 9 (1.4)
NDM-7 CFa (1), EC (3), EnA (1), EnC (1), KP (1), SM
(1)
8 (1.2)
KPC-1 KP (5) 5 (0.8)
NDM-4 EC (4) 4 (0.6)
n, number of isolates; CFa, Citrobacter farmeri; CRo, C. rodentium; CSe, C. sedlakii;
EC, E. coli; EnA, Enterobacter aerogenes; EnC, E. cloacae; KP, K. pneumoniae; KV,
K. variicola; MM, M. morganii; PM, P. mirabilis; PS, P. stuartii; SM, S. marcescens.

113
Figure 3.3 Comparative distribution of carbapenemase alleles among different species
of clinical Enterobacterales. CFa, Citrobacter farmeri; CRo, C. rodentium; CSe, C.
sedlakii; EC, E. coli; EnA, Enterobacter aerogenes; EnC, E. cloacae; KP, K.
pneumoniae; KV, K. variicola; MM, M. morganii; PM, P. mirabilis; PS, P. stuartii;
SM, S. marcescens. Significant associations were observed in K. pneumoniae for
blaNDM-1 (38/228, 16.7%) than others (24/414, 5.8%) (p<0.0001), for blaOXA-181
(17/228, 7.5%) than others (7/414, 1.7%) (p=0.0002), and for blaNDM-5 (50/228 21.9%)
than others (47/414, 11.4%) (p=0.0003).

114
Table 3.7 Range of carbapenems’ MIC of OXA-232 and OXA-181 producers.
Carbapenemase variants Carbapenems Range of MIC (mg/l)
blaNDM-1+blaOXA-232 (n=3) IPM 8 to 16
MEM 16 to 32
blaNDM-5+blaOXA-232 (n=3) IPM 16 to 32
MEM 64 to 128
blaOXA-232 (n=11) IPM 1 to 8
MEM 16
blaOXA-232 (phenotypically
characterized as CSE) (n=9)
IPM 0∙5 to 2
MEM 0∙5 to 2
blaKPC-1+blaOXA-181 (n=5) IPM 16 to 32
MEM 32 to 64
blaNDM-5+blaOXA-181 (n=3) IPM 2 to 8
MEM 8 to 32
blaNDM-7+blaOXA-181 (n=1) IPM 256
MEM ≥256
blaOXA-181 (n=14) IPM 4 to 32
MEM 0∙06 to 64
blaOXA-181 (phenotypically
characterized as CSE) (n=1)
IPM 0∙125
MEM 0∙06
IPM, imipenem; MEM, meropenem.

115
3.2.4 Investigating the associations of non-β-lactam resistance in clinical CRE
The overall phenotypic resistance of the clinical Enterobacterales is depicted
in Figure 3.4. Fosfomycin, and colistin were shown to be the most active
antimicrobials. CRE exhibited significantly greater resistance rates to ciprofloxacin,
levofloxacin, amikacin, gentamicin, sulfamethoxazole-trimethoprim, and fosfomycin
than CSE (p<0.05) (Table 3.8). The associations between non-β-lactam resistance and
carbapenem resistance in E. coli and K. pneumoniae were evaluated individually
which revealed significant associations as to overall analysis (p<0.05), however, the
relation with fosfomycin resistance was varied. All E. coli were sensitive to
fosfomycin, but carbapenem-resistant K. pneumoniae had a significant association
with the fofomycin resistance (p<0.05) (Table 3.9; Table 3.10).
The associations of prevalent ARGs with the certain prevalent carbapenemase
allele (blaNDM-1, blaNDM-5, blaOXA-181) were examined. ARGs significantly present in
association with specific carbapenemase alleles are illustrated in Table 3.11-Table
3.13. We assessed the linkage of any ARGs with CRE whether the frequency of ARG
was above 10. Known ARGs were retrieved using CARD with a cut off ≥99.8%
coverage, and ≥99.8% identity. The number of efflux pumps was not included in this
analysis. Salmonella spp. (n=5), L. adecarboxylata (n=1), and one strain of Proteus
spp. (due to low quality sequence data) were not included in the analysis.

116
Figure 3.4 Susceptibility patterns of clinical Enterobacterales against the antibiotics
tested. All Proteus spp., Providencia spp., S. marcescens and M. morganii isolated in
this study were resistant to colistin. AMC, amoxicillin-clavulanic acid; TZP,
piperacillin-tazobactam; CRO, ceftriaxone; CAZ, ceftazidime; CTX, cefotaxime; FEP,
cefepime; IPM, imipenem; MEM, meropenem; CIP, ciprofloxacin; LVX, levofloxacin;
AMK, amikacin; GEN, gentamicin; SXT, sulfamethoxazole-trimethoprim; FOF,
fosfomycin; CST, colistin.

117
Table 3.8 Comparative resistance profile to non-β-lactam antibiotics between CRE
and CSE.
Antibiotics Resistant to respective antibiotics, n (%)
p value CRE (n=210) CSE (n=433)
CIP 206 (98.1) 353 (81.5) <0.0001
LVX 191 (91.0) 320 (73.9) <0.0001
AMK 190 (90.5) 115 (26.6) <0.0001
GEN 197 (93.8) 210 (48.5) <0.0001
SXT 200 (95.2) 350 (80.8) <0.0001
FOF* 18/210 (8.6) 13/426 (3.1) 0.002
CST** 1/194 (0.5) 4/340 (1.2) 0.446
Values in parentheses indicate column percentage. CIP, ciprofloxacin; LVX,
levofloxacin; AMK, amikacin; GEN, gentamicin; SXT, sulfamethoxazole-
trimethoprim; FOF, fosfomycin; CST, colistin. *M. morganii (n=6), and L.
adecarboxylata (n=1) were excluded from the analysis as the species are intrinsically
resistant to fosfomycin. **Proteus spp. (n=67), Providencia spp. (n=23), S.
marcescens (n=13) and M. morganii (n=6) were excluded from the analysis as the
species are intrinsically resistant to colistin. Cells are highlighted whether any variable
was significantly higher with CRE.

118
Table 3.9 Comparative resistance profile to non-β-lactam antibiotics between
carbapenem-resistant E. coli and carbapenem-sensitive E. coli.
Antibiotics Resistant to respective antibiotics, n (%)
p value Carbapenem-resistant
E. coli (n=54)
Carbapenem-sensitive E.
coli (n=174)
CIP 54 (100) 150 (86.2) 0.004
LVX 54 (100) 150 (86.2) 0.004
AMK 41 (75.9) 24 (13.8) <0.0001
GEN 51 (94.4) 64 (36.8) <0.0001
SXT 45 (83.3) 115 (66.1) 0.016
Values in parentheses indicate column percentage. CIP, ciprofloxacin; LVX,
levofloxacin; AMK, amikacin; GEN, gentamicin; SXT, sulfamethoxazole-
trimethoprim. All E. coli were sensitive to fosfomycin and colistin. Cells are
highlighted whether any variable was significantly higher with CRE.

119
Table 3.10 Comparative resistance profile to non-β-lactam antibiotics between
carbapenem-resistant K. pneumoniae and carbapenem-sensitive K. pneumoniae.
Antibiotics Resistant to respective antibiotics, n (%)
p value Carbapenem-resistant
K. pneumoniae (n=120)
Carbapenem-sensitive K.
pneumoniae (n=108)
CIP 119 (99.2) 97 (89.8) 0.002
LVX 105 (87.5) 75 (69.4) 0.001
AMK 120 (100) 32 (29.6) <0.0001
GEN 118 (98.3) 56 (51.9) <0.0001
SXT 120 (100) 105 (97.2) 0.066
FOF 15 (12.5) 1 (0.9) 0.001
CST 1 (0.8) 3 (2.8) 0.264
Values in parentheses indicate column percentage. CIP, ciprofloxacin; LVX,
levofloxacin; AMK, amikacin; GEN, gentamicin; SXT, sulfamethoxazole-
trimethoprim; FOF, fosfomycin; CST, colistin. Cells are highlighted whether any
variable was significantly higher with CRE.

120
Table 3.11 The associations of prevalent ARGs with blaNDM-1-positive clinical isolates
compared to blaNDM-1-negative clinical isolates.
ARGs Presence of ARG, n (%)
p value blaNDM-1-positive
isolates (n=62)
blaNDM-1-negative
isolates (n=574)
aadA2 25 (40.3) 157 (27.4) 0.032
APH(3'')-Ib 4 (6.5) 9 (1.6) 0.012
APH(3')-VI 16 (25.8) 1 (0.2) <0.0001
armA 24 (38.7) 87 (15.2) <0.0001
rmtF 14 (22.6) 26 (4.5) <0.0001
SAT-1 9 (14.5) 46 (8) 0.078
blaOXA-1 39 (62.9) 205 (35.7) <0.0001
blaOXA-9 10 (16.1) 19 (3.3) <0.0001
blaSHV-1 7 (11.3) 13 (2.3) 0.0001
blaSHV-106 13 (21) 27 (4.7) <0.0001
blaSHV-182 8 (12.9) 19 (3.3) 0.0005
blaSHV-187 4 (6.5) 10 (1.7) 0.018
arr2 20 (32.3) 52 (9.1) <0.0001
arr-3 6 (9.7) 17 (3) 0.009
catB3 6 (9.7) 17 (3) 0.008
mphE 29 (46.8) 127 (21.1) <0.0001
qnrA1 6 (9.7) 16 (2.8) 0.007
qrrD1 7 (11.3) 28 (4.9) 0.035
sul1 47 (75.8) 273 (47.6) <0.0001
Values in parentheses indicate column percentage. The associations between blaNDM-
1, and other ARGs were only mentioned if p values were <0.05.

121
Table 3.12 The associations of prevalent ARGs with blaNDM-5-positive clinical isolates
compared to blaNDM-5-negative clinical isolates.
ARGs Presence of ARG, n (%)
p value blaNDM-5-positive
isolates (n=97)
blaNDM-5-negative
isolates (n=539)
aadA2 75 (77.3) 107 (19.9) <0.0001
APH(6)-Id 44 (45.4) 142 (26.3) 0.0001
armA 26 (26.8) 85 (15.8) 0.008
rmtB 72 (74.2) 19 (3.5) <0.0001
blaampC1 10 (10.3) 18 (3.3) 0.002
blaampH 11 (11.3) 20 (3.7) 0.001
blaCMY-59 28 (28.9) 49 (9.1) <0.0001
blaCTX-M-15 81(83.5) 329 (61) <0.0001
blaOXA-1 57 (58.8) 187 (34.7) <0.0001
blaSHV-1 7 (7.2) 13 (2.4) 0.013
blaSHV-182 8 (8.2) 19 (3.5) 0.034
blaTEM-1 85 (87.6) 220 (40.8) <0.0001
blaVEB-5 20 (20.6) 11 (2) <0.0001
catI 26 (26.8) 44 (8.2) <0.0001
mphE 31 (32) 125 (23.2) 0.056
qnrS1 38 (39.2) 107 (19.9) <0.0001
sul1 87 (89.7) 233 (43.2) <0.0001
sul2 48 (49.5) 144 (26.7) <0.0001
dfrA1 10 (10.3) 21 (3.9) 0.008
dfrA12 77 (79.4) 98 (18.2) <0.0001
Values in parentheses indicate column percentage. The associations between blaNDM-
5, and other ARGs were only mentioned if p values were <0.05.

122
Table 3.13 The associations of prevalent ARGs with blaOXA-181-positive clinical
isolates compared to blaOXA-181-negative clinical isolates.
ARGs Presence of ARG, n (%)
p value blaOXA-181-positive isolates
(n=24)
blaOXA-181-negative isolates
(n=612)
aadA2 12 (50) 170 (27.8) 0.018
rmtF 10 (41.7) 30 (4.9) <0.0001
blaCMY-59 9 (37.5) 68 (11.1) 0.0003
blaCTX-M-15 22 (91.7) 388 (63.4) 0.005
blaSHV-182 4 (16.7) 23 (3.8) 0.003
arr2 13 (54.2) 59 (9.6) <0.0001
arr3 3 (12.5) 20 (3.3) 0.019
mphA 11 (45.8) 119 (19.4) 0.003
dfrA1 5 (20.8) 26 (4.2) 0.0005
dfrA12 13 (54.2) 162 (26.5) 0.004
Values in parentheses indicate column percentage. The associations between blaOXA-
181, and other ARGs were only mentioned if p values were <0.05.

123
3.2.5 Baseline data of patients with Enterobacterales infections
Of the 534 patients, 343 (64.2%) were male and 191 (35.8%) were female and
the mean (±SD) age was 32.3 (±21.6). The distribution of age and sex are depicted in
Figure 3.5. Although the majority (n=308, 58%) of the participants in this study were
from Dhaka division, patients from all over the country attended to DMCH for medical
care (Figure 3.6). Most of the participants belonged to low socio-economic group
[BPL, 45.9% (245/534); poor, 39% (208/534)] (Figure 3.7). Patients with
Enterobacterales infections were distributed in different wards of DMCH (Figure 3.8).
There were no associations between admission to a certain ward and particular age
group except NICU with 0-5 years (Figure 3.8). Ceftriaxone was the commonly
prescribed antimicrobial (61.4%) among the participants followed by metronidazole
(29.8%), ciprofloxacin (23%) and amikacin (19.3%). Carbapenem usage was 13.1%
(meropenem) and 1.5% (imipenem). The usage of colistin was 3.2%. Ceftriaxone is
the most frequently prescribed antibiotics in burn (82.5%, 118/143), surgery (69%,
60/87), and urology (31%, 27/87). The frequency of ceftriaxone, and meropenem
usage was the same in ICU (58.3%, 35/60). Meropenem usage was the highest in ICU
(50%, 35/70) (Figure 3.9). Our data indicates that 94.2% (503/534) of the patients with
Enterobacterales infections were treated with empirical antibiotics on admission at
DMCH. Table 3.14 demonstrates the data on the frequency patients with at least one
effective antimicrobial, however, susceptibility patterns of azithromycin, cefixime,
cefuroxime, clindamycin, doxycycline, flucloxacillin, linezolid, metronidazole,
moxifloxacin, Penicillin G, streptomycin, and vancomycin were not tested in this
study. Based on data available, only 27% (144/534) of the patients were found to be
prescribed with at least one antibiotic to which the respective Enterobacterales
infections were susceptible (Table 3.14). The mortality among the patients with
Enterobacterales infections was 17.6% (n=94) and in-hospital 30-days mortality was
17.2% (n=92). 74.9% (n=400) of the participants were discharged alive and 7.5%
(n=40) were DAMA (Figure 3.10). This study recorded name of antibiotics prescribed
to the patients; however, data lacked the course of antibiotics therapy (dosage, date of
start, and duration) or whether the antibiotics were changed according to clinical
reports. Statistically, there was increased probability of overall mortality among the
patients with at least one effective antimicrobials, however the result was not
significant (p=0.315) (Table 3.15).

124
Figure 3.5 Distribution of age and sex among the patients with Enterobacterales
infections.

125
Figure 3.6 Locality of the participants enrolled in this study. Districts of Bangladesh
are separated by lines in the map. Black dots in the map denotes distribution of
participants’ locality. Pie chart represents the proportion of participants from each
division of Bangladesh. Each division is represented by identical colour in the map
and pie chart.

126
Figure 3.7 Overview of socio-economic status of the patients admitted at DMCH. UH,
upper high; UM, upper middle; LM, lower middle; BPL, below the poverty level.

127
Figure 3.8 The distribution of Enterobacterales isolation from the patients admitted in
different wards of DMCH according to age groups. The bubble size is proportional to
the number of participants.

128
Figure 3.9 Antibiotics usage in different wards of DMCH. AMC, amoxicillin-clavulanic acid; AMK, Amikacin; AZM, azithromycin; CAZ,
ceftazidime; CFX, cefixime; CIP, ciprofloxacin; CLI, clindamycin; CLT, clarithromycin; CRO, ceftriaxone; CST, colistin; CTX, cefotaxime; DXC,
doxycycline; FLU, flucloxacillin; FOF, fosfomycin; GEN, gentamicin; IPM, imipenem; LVX, levofloxacin; LZD, linezolid; MEM, meropenem;
MTZ, metronidazole; MXF, moxifloxacin; PEN G, Penicillin G; STP, streptomycin; TET, tetracycline; TZP, piperacillin-tazobactam; VAN,
vancomycin.

129
Table 3.14 The frequency of patients with at least one effective antimicrobial stratified
based on patients’ outcome.
Clustering of patients based on usage of
antimicrobials*
Number of patients with at least one effective
antimicrobial tested in this study
DAMA Died Discharge
AMC (n=1) - - 0
AMC+CAZ (n=1) 1 - -
AMC+MTZ (n=1) - - 0
AMK (n=1) - - 0
AMK+AZM+MTZ (n=2) 1 1 -
AMK+CAZ (n=6) 1 1 1
AMK+CAZ+CLT+LVX (n=1) - - 0
AMK+CAZ+CRO+MTZ (n=1) - - 1
AMK+CAZ+FLU+MEM+VAN (n=1) - - 1
AMK+CAZ+MEM (n=1) - - 0
AMK+CFX+CRO+LVX (n=1) - - 0
AMK+CIP (n=2) - - 0
AMK+CIP+FLU+LVX+LZD+MTZ (n=1) - - 0
AMK+CIP+IPM (n=1) - 0 -
AMK+CIP+MEM (n=1) - - 1
AMK+CIP+MTZ (n=2) - - 2
AMK+CLI+LVX+MEM (n=1) - - 1
AMK+CLT+LVX (n=1) - - 0
AMK+CRO (n=25) 2 1 6
AMK+CRO+CIP+MTZ (n=6) - 0 0
AMK+CRO+FLU (n=6) - 1 4
AMK+CRO+FLU+CLI (n=1) - - 0
AMK+CRO+LVX (n=15) - 2 6
AMK+CRO+MEM (n=4) - 0 0
AMK+CRO+MEM+MTZ (n=2) 0 1 -
AMK+CRO+MTZ (n=9) 1 1 4
AMK+CRO+MXF (n=1) - 0 -
AMK+CST (n=2) - 1 1
AMK+CST+CRO (n=2) - - 1
AMK+MEM (n=4) - 1 3
AMK+MEM+MTZ (n=3) - 1 -
AZM+CAZ+FLU (n=1) - - 0
AZM+CLI+PEN G (n=1) - 0 -
AZM+CRO (n=1) - - 0
AZM+CRO+MEM (n=1) - 0 -
AZM+IPM+LVX (n=1) 1 - -
AZM+LVX (n=1) - - 0
CAZ+CLI (n=2) - - 0
CAZ+CRO (n=1) - - 0
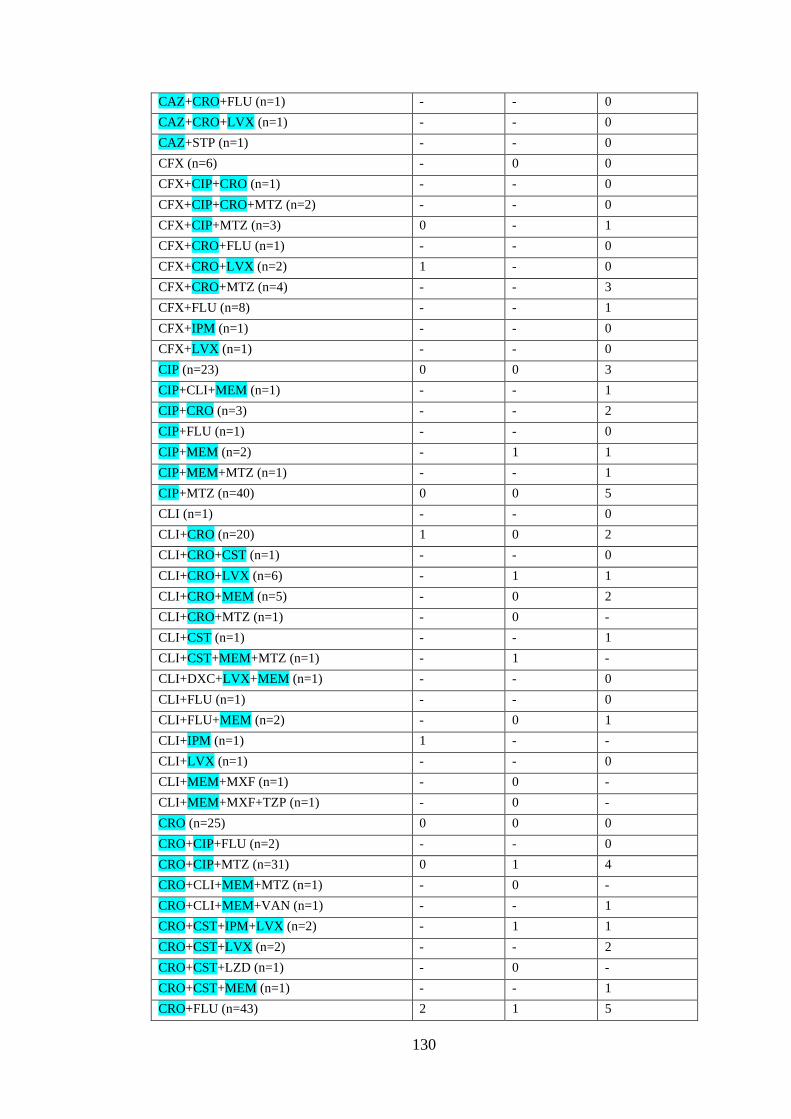
130
CAZ+CRO+FLU (n=1) - - 0
CAZ+CRO+LVX (n=1) - - 0
CAZ+STP (n=1) - - 0
CFX (n=6) - 0 0
CFX+CIP+CRO (n=1) - - 0
CFX+CIP+CRO+MTZ (n=2) - - 0
CFX+CIP+MTZ (n=3) 0 - 1
CFX+CRO+FLU (n=1) - - 0
CFX+CRO+LVX (n=2) 1 - 0
CFX+CRO+MTZ (n=4) - - 3
CFX+FLU (n=8) - - 1
CFX+IPM (n=1) - - 0
CFX+LVX (n=1) - - 0
CIP (n=23) 0 0 3
CIP+CLI+MEM (n=1) - - 1
CIP+CRO (n=3) - - 2
CIP+FLU (n=1) - - 0
CIP+MEM (n=2) - 1 1
CIP+MEM+MTZ (n=1) - - 1
CIP+MTZ (n=40) 0 0 5
CLI (n=1) - - 0
CLI+CRO (n=20) 1 0 2
CLI+CRO+CST (n=1) - - 0
CLI+CRO+LVX (n=6) - 1 1
CLI+CRO+MEM (n=5) - 0 2
CLI+CRO+MTZ (n=1) - 0 -
CLI+CST (n=1) - - 1
CLI+CST+MEM+MTZ (n=1) - 1 -
CLI+DXC+LVX+MEM (n=1) - - 0
CLI+FLU (n=1) - - 0
CLI+FLU+MEM (n=2) - 0 1
CLI+IPM (n=1) 1 - -
CLI+LVX (n=1) - - 0
CLI+MEM+MXF (n=1) - 0 -
CLI+MEM+MXF+TZP (n=1) - 0 -
CRO (n=25) 0 0 0
CRO+CIP+FLU (n=2) - - 0
CRO+CIP+MTZ (n=31) 0 1 4
CRO+CLI+MEM+MTZ (n=1) - 0 -
CRO+CLI+MEM+VAN (n=1) - - 1
CRO+CST+IPM+LVX (n=2) - 1 1
CRO+CST+LVX (n=2) - - 2
CRO+CST+LZD (n=1) - 0 -
CRO+CST+MEM (n=1) - - 1
CRO+FLU (n=43) 2 1 5

131
CRO+FLU+LVX (n=2) - 0 0
CRO+FLU+MEM (n=4) - 2 1
CRO+FLU+MEM+MTZ (n=2) 0 0 -
CRO+FLU+MTZ (n=10) 0 - 1
CRO+GEN (n=7) 1 1 3
CRO+GEN+MTZ (n=1) 1 - -
CRO+IPM (n=1) 0 - -
CRO+LVX (n=34) - 3 3
CRO+LVX+MEM (n=1) - 0 -
CRO+MEM+MTZ (n=2) - 1 0
CRO+MEM+MTZ+VAN (n=1) - 0 -
CRO+MTZ (n=17) 0 - 4
CRO+MTZ+LVX (n=1) - 0 -
CRO+VAN (n=12) - 0 2
CST+FLU (n=1) - - 1
CST+LVX+MEM (n=1) - 1 -
CST+MEM (n=1) - - 1
CST+MEM+MTZ (n=1) - - 1
CXM (n=2) 1 - 1
FLU (n=1) - 0 -
FLU+IPM (n=1) - - 1
FLU+LVX (n=1) - - 0
FLU+MEM (n=3) - 1 2
FLU+MEM+MTZ+VAN (n=1) - - 1
FLU+MTZ (n=2) - - 0
LVX+MTZ (n=1) - - 0
MEM (n=5) 1 1 2
MEM+MTZ (n=5) - 0 2
MEM+MTZ+LVX (n=1) - 1 -
MEM+MTZ+VAN (n=1) - - 0
MEM+MXF (n=1) - 0 -
MEM+VAN (n=4) 1 - 2
MTZ (n=3) 0 - 0
TET (n=1) - - 0
No antibiotic (n=31) 0 - 0
Total (n=534) 17 28 99
n, number of patients. AMC, amoxicillin-clavulanic acid; AMK, Amikacin; AZM,
azithromycin; CAZ, ceftazidime; CFX, cefixime; CXM, cefuroxime; CIP,
ciprofloxacin; CLI, clindamycin; CLT, clarithromycin; CRO, ceftriaxone; CST,
colistin; CTX, cefotaxime; DXC, doxycycline; FEP, cefepime; FLU, flucloxacillin;
FOF, fosfomycin; GEN, gentamicin; IPM, imipenem; LVX, levofloxacin; LZD,
linezolid; MEM, meropenem; MTZ, metronidazole; MXF, moxifloxacin; PEN G,

132
Penicillin G; STP, streptomycin; SXT, sulfamethoxazole-trimethoprim; TET,
tetracycline; TZP, piperacillin-tazobactam; VAN, vancomycin. *Total number of
patients received respective antimicrobials. Antibiotics in the first column are
highlighted whether the susceptibility patterns were tested in this study.

133
Table 3.15 Comparative analysis to assess the associations of patients’ overall
mortality with at least one effective antimicrobial therapy.
At least one
effective
antimicrobials
Died
(n=94)
Discharge
(n=400)
p
value
Odd
ratio
95% CI
Yes (n=127) 28 (29.8) 99 (24.8) 0.315 1.290 0.785-2.120
No (n=367) 66 (70.2) 301 (75.3)
Values in parentheses indicate column percentage. Patients with DAMA (n=40) were
excluded from the outcome analysis.

134
Figure 3.10 The overall outcome of the participants with Enterobacterale infections.
DAMA, discharge against medical advice.

135
3.2.6 Risk assessment of baseline variables
The exposure of interest of the risk measurement was carbapenem resistance.
A patient, positive for at least one CRE positive culture was considered as CRE
infection and/or colonisation. Whether a patient had positive culture with
Enterobacterales, but the respective Enterobacterales was sensitive to carbapenem,
was regarded as CSE infection and/or colonisation. Out of 534 cases, 194 (36.3%)
were identified as CRE cases, and 340 (63.7%) were as CSE cases (Figure 3.1).
Compared to CSE cases, CRE were significantly associated with age group of
6 to 25 years, in female, patients admitted to burn unit and ICU, and among the patients
with history of levofloxacin, amikacin, clindamycin, and meropenem administration
during hospital stay (p<0.05); however, usage of multiple antibiotics did not
significantly alter the acquisition of CRE infections (Table 3.16). Given that burn itself
is an immunocompromised condition, and long-term hospital care is usual for burn
patients (Gallaher et al., 2018; Stanojcic et al., 2018). Showing a large proportion of
clinical specimens in this study from burn patients (26.8%, 143/534), patients’
attributes for CRE acquisition were reassessed statistically with the dataset with burn
cases only and the dataset excluding burn cases (Table 3.17; Table 3.18). The findings
of entire dataset (Table 3.16), and that of the dataset excluding burn cases (Table 3.18)
on statistical perspectives were nearly consistent. Dataset excluding burn cases showed
significant association of carbapenem resistance with LM socio-economic group
(p<0.05) and no statistical significance between female and carbapenem resistance.
Including burn cases only, no risk was found with carbapenem resistance (Table 3.17).

136
Table 3.16 Descriptive statistics for risk assessment of CRE clinical cases compared
to CSE cases.
Attributes CRE (n=194) CSE (n=340) p value
Age (years) 0 to 5 27 (13.9) 49 (14.4) 0.875
6 to 25 67 (34.5) 88 (25.9) 0.034
26 to 50 66 (34) 130 (38.2) 0.331
>50 34 (17.5) 73 (21.5) 0.273
Sex Female 81 (41.8) 110 (32.4) 0.029
Male 113 (58.2) 230 (67.6)
Socioeconomic
group
BPL 84 (43.3) 161 (47.4) 0.366
Poor 74 (38.1) 134 (39.4) 0.773
LM 34 (17.5) 40 (11.8) 0.064
UM 2 (1) 4 (1.2) 0.878
UH 0 (0) 1 (0.3) -
Admitting
wards
Burn 74 (38.1) 69 (20.3) <0.0001
Surgery 14 (7.2) 73 (21.5) <0.0001
Urology 23 (11.9) 64 (18.8) 0.036
ICU 33 (17) 27 (7.9) 0.001
Other wards 50 (25.8) 107 (31.5) 0.165
Comorbidity DM 15 (7.7) 58 (17.1) 0.003
Malignancy 7 (3.6) 15 (4.4) 0.653
Antibiotics
exposure during
hospital stay
before
sampling*
Ceftriaxone 128 (66) 200 (58.8) 0.102
Metronidazole 49 (25.3) 110 (32.4) 0.085
Ciprofloxacin 27 (13.9) 96 (28.2) 0.0001
Amikacin 49 (25.3) 54 (15.9%) 0.008
Meropenem 33 (17) 37 (10.9 0.044
Flucloxacillin 27 (13.9) 70 (20.6) 0.054
Levofloxacin 45 (23.2) 35 (10.3) <0.0001
Clindamycin 28 (14.4) 25 (7.4) 0.008
Number of
antibiotics
prescribed**
Monotherapy 19 (10.3) 50 (15.7) 0.093
More than one
drug
165 (89.7) 269 (84.3)
Hospital stay
before sampling
≤7 days 68 (35.1) 136 (40) 0.258
>7 days 126 (64.9) 204 (60)
Values in parentheses indicate column percentage. BPL, below the poverty level; P,
poor; LM, lower middle; UM, upper middle; UH, upper high; ICU, intensive care unit;
DM, diabetes mellitus. Cells are highlighted whether any variable was significantly
associated with CRE. Bivariate analysis was performed to identify the risks for CRE.
*Eight common antibiotics prescribed at DMCH are included in this descriptive
analysis. **Patients without any antibiotic (n=31) were excluded from the analysis.

137
Table 3.17 Descriptive statistics for risk assessment of CRE clinical cases compared
to CSE cases with burn infections.
Attributes CRE (n=74) CSE (n=69) p value
Age (years) 0 to 5 12 (16.2) 6 (8.7) 0.175
6 to 25 30 (40.5 33 (47.8) 0.381
26 to 50 24 (32.4) 20 (29) 0.655
>50 8 (10.8) 10 (14.5) 0.507
Sex Female 35 (47.3) 23 (33.3) 0.089
Male 39 (52.7) 46 (66.7%)
Socioeconomic
group
BPL 30 (40.5) 33 (47.8) 0.381
Poor 32 (43.2) 27 (39.1) 0.618
LM 11 (14.9) 9 (13) 0.754
UM 1 (1.4) 0 (0) 0.333
Comorbidity DM 3 (4.1) 5 (7.2) 0.407
Malignancy 0 (0) 2 (2) 0.140
Antibiotics
exposure during
hospital stay
before sampling*
Ceftriaxone 59 (79.7) 59 (85.5) 0.363
Metronidazole 4 (5.4) 0 (0) 0.050
Ciprofloxacin 2 (2.7) 3 (4.3) 0.593
Amikacin 22 (29.7) 13 (18.8) 0.130
Meropenem 8 (10.8) 5 (7.2) 0.459
Flucloxacillin 4 (5.4) 20 (29) <0.0001
Levofloxacin 42 (56.8) 31 (44.9) 0.157
Clindamycin 15 (20.3) 13 (18.8) 0.830
Number of
antibiotics
prescribed
Monotherapy 5 (6.8) 2 (2.9) 0.285
More than one
drug
69 (93.2) 67 (97.1)
Hospital stay
before sampling
≤7 days 21 (28.4) 18 (26.1) 0.759
>7 days 53 (71.6) 51 (73.9)
Values in parentheses indicate column percentage. BPL, below the poverty level; P,
poor; LM, lower middle; UM, upper middle; UH, upper high; ICU, intensive care unit;
DM, diabetes mellitus. Bivariate analysis was performed to identify the risks for CRE.
*Eight common antibiotics prescribed at DMCH are included in this descriptive
analysis.

138
Table 3.18 Descriptive statistics for risk assessment of CRE clinical cases compared
to CSE cases excluding burn cases.
Attributes CRE (n=120) CSE (n=271) p value
Age (years) 0 to 5 15 (12.5) 43 (15.9) 0.388
6 to 25 37 (30.8) 55 (20.3) 0.023
26 to 50 42 (35) 110 (40.6) 0.296
>50 26 (21.7) 63 (23.2) 0.731
Sex Female 46 (38.3) 87 (32.1) 0.230
Male 74 (61.7) 184 (67.9)
Socioeconomic
group
BPL 54 (45) 128 (47.2) 0.683
Poor 42 (35) 107 (39.5) 0.400
LM 23 (19.2) 31 (11.4) 0.041
UM 1 (0.8) 4 (1.5) 0.602
UH 0 (0) 1 (0.3) -
Admitting wards Surgery 14 (11.7) 73 (26.9) 0.001
Urology 23 (19.2) 64 (23.6) 0.329
ICU 33 (27.5) 27 (10) <0.0001
Comorbidity DM 12 (10) 53 (19.6) 0.019
Malignancy 7 (5.8) 13 (4.8) 0.668
Antibiotics
exposure during
hospital stay
before sampling*
Ceftriaxone 69 (57.5) 141 (52) 0.317
Metronidazole 45 (37.5) 110 (40.6) 0.564
Ciprofloxacin 25 (20.8) 93 (34.3) 0.007
Amikacin 27 (22.5) 41 (15.1) 0.076
Meropenem 25 (20.8) 32 (11.8) 0.020
Flucloxacillin 23 (19.2) 50 (18.5) 0.867
Levofloxacin 3 (2.5) 4 (1.5) 0.481
Clindamycin 13 (10.8) 12 (4.4) 0.017
Number of
antibiotics
prescribed**
Monotherapy 14 (12.7) 48 (19.2) 0.134
More than one
drug
96 (87.3) 202 (80.8)
Hospital stay
before sampling
≤7 days 47 (39.2) 118 (43.5) 0.419
>7 days 73 (60.8) 153 (56.5)
Values in parentheses indicate column percentage. BPL, below the poverty level; P,
poor; LM, lower middle; UM, upper middle; UH, upper high; ICU, intensive care unit;
DM, diabetes mellitus. Cells are highlighted whether any variable was significantly
associated with CRE. Bivariate analysis was performed to identify the risks for CRE.
*Eight common antibiotics prescribed at DMCH are included in this descriptive
analysis. **Patients without any antibiotic (n=31) were excluded from the analysis.

139
3.2.7 Outcome analysis of CRE cases compared to CSE
To investigate the impact of carbapenem resistance on patients’ outcome, CRE
cases were assessed for in-hospital 30-days mortality and length of hospital stay (LoS)
in comparison to CSE group. Two time points were considered for the analysis: ‘time
from admission’ (time zero is admission) and ‘time from infection’ with
Enterobacterales (time zero is infection). Cox proportional hazards model was fitted
with ‘time from infection’ to outcome as ‘time-to-event’ and ‘time from admission’ to
infection as ‘covariate’. Confounders such as age, gender, comorbidity, admission to
ICU and burn unit, and association of E. coli and K. pneumoniae infections were
adjusted in the model and compared to the unadjusted model. Patients discharged alive
or in-hospital mortality after 30 days was used as competing variable for outcome
analysis. Patients with DAMA (n=40) and outlier cases (n=2) (hospital stay >100 days
from ‘time from infection’ to outcome) were excluded from the outcome analysis.
All-cause in-hospital 30-days mortality occurred in 50 (27.8%) of 180 patients
with CRE cases and in 42 (13.5%) of 312 patients with CSE cases. CRE cases had
significant impact on in-hospital 30-days mortality (p=0.001) (Figure 3.11). Adjusted
subdistribution hazard ratio (SHR) inferred that confounders did not affect the
statistical significance of in-hospital 30-days mortality due to carbapenem resistance
except model 4 (adjusted with ICU admissions), but covariates reduced the strength of
associations. The covariates, E. coli infections (model 5), wound infections (model 8),
and UTIs (model 9) were inversely related to CRE with 30-days mortality. SHR
estimated the increase probability of excess LoS in relation to CSE cases than CRE
(Table 3.18).
We compared resistance and virulence profile of E. coli and K. pneumoniae
against patients’ mortality using patients discharged alive or in-hospital mortality after
30 days as competing outcome which showed the significant association only between
VF scores of E. coli and patients’ mortality (p=0.008) (Table 3.20). The cumulative
number of ARGs of E. coli and K. pneumoniae had positive correlation with the total
number of VF of the respective species (r=0.138) (Figure 3.12).

140
Figure 3.11 Kaplan–Meier plot representing the cumulative proportion of all-cause in-
hospital 30-days mortality of CRE patients compared to CSE patients with a timescale
‘time from infection’ to outcome. Differences in mortality were calculated by log-rank
(Mantel-Cox). CRE infections were significantly associated with in-hospital 30-days
mortality than CSE patients (p=0·001). Patients with DAMA (n=40) and outlier cases
(n=2) (hospital stay >100 days from ‘time from infection’ to outcome) were excluded
from the outcome analysis.

141
Table 3.19 Cox proportional hazards models to analyse for the impact carbapenem resistance on patients’ outcome.
Description Inference p value SHR 95% CI
Increased probability Associations* Inverse relation*
All-cause
in-hospital
30-days
mortality
Model 1: Adjusted by time from admission to
infection
CRE 0.001 0.491 0.325-0.741
Model 2: Model 1 plus age, gender,
comorbidity (DM & malignancy)
CRE Increased age,
female, malignancy
DM 0.002 0.519 0.342-0.789
Model 3: Model 2 plus admission to burn CRE Admission to burn 0.009 0.569 0.372-0.871
Model 4: Model 2 plus admission to ICU CRE Admission to ICU 0.072 0.677 0.442-1.131
Model 5: Model 2 plus association of E. coli
infections
CRE E. coli infections 0.004 0.539 0.355-0.819
Model 6: Model 2 plus association of K.
pneumoniae infections
CRE K. pneumoniae
infections
0.014 0.568 0.362-0.891
Model 7: Model 2 plus BSIs CRE BSIs 0.013 0584 0.382-0.893
Model 8: Model 2 plus wound infections CRE Wound infections 0.002 0.519 0.342-0.788
Model 9: Model 2 plus UTIs CRE UTIs 0.024 0.617 0.406-0.938
LoS Model 1: Adjusted by time from admission to
infection
CSE 0.056 1.199 0.995-1.444
Model 2: Model 1 plus age, gender,
comorbidity (DM & malignancy)
CSE Increased age,
female, DM
Malignancy 0.072 1.191 0.985-1.440
Model 3: Model 2 plus admission to burn CSE Admission to burn 0.235 1.122 0.928-1.358
Model 4: Model 2 plus admission to ICU CSE Admission to ICU 0.051 1.211 0.999-1.467
Model 5: Model 2 plus association of E. coli
infections
CSE E. coli infections 0.071 1.191 0.985-1.441
Model 6: Model 2 plus association of K.
pneumoniae infections
CSE K. pneumoniae
infections
0.365 1.100 0.895-1.351
Model 7: Model 2 plus BSIs CSE BSIs 0.075 1.188 0.983-1.437
Model 8: Model 2 plus wound infections CSE Wound infections 0.071 1.191 0.985-1.440
Model 9: Model 2 plus UTIs CSE UTIs 0.101 1.174 0.969-1.422
*Towards increased probability. Patients with DAMA (n=40) and outlier cases (n=2) (hospital stay >100 days from ‘time from infection’ to
outcome) were excluded from the outcome analysis.

142
Table 3.20 Comparative analysis to assess the associations of all-cause 30-days
mortality with genomic profiles (ARG and VF scores) of Enterobacterales isolated
from respective patients.
30-days
mortality
Competing
outcome
p value
E. coli ARG score
[mean(±SD)]
8 (±5) 5.6 (±3.62) 0.080
VF scores
[mean(±SD)]
14.8 (±19.7) 13.8 (±14.3) 0.008
K.
pneumoniae
ARG score
[mean(±SD)]
9.4 (±4.4) 8.5 (±4.3) 0.608
VF scores
[mean(±SD)]
55.4 (±20.6) 51.4 (±22.9) 0.846
Patients discharged alive or in-hospital mortality after 30 days was used as competing
variable. ARG and VF scores in this study denotes the number of known ARGs, and
virulence genes in a strain, respectively. Known ARGs, and VFs were retrieved using
‘CARD’ and ‘VFDB’ database, accordingly. Number of efflux pumps are not included
in ARG scoring.

143
Figure 3.12 Scattered plot representing the distribution of patients’ outcome data by merging with genomic profile (the relation between the
cumulative number of ARGs and that of VF of respective isolate) of E. coli and K. pneumoniae isolated from the respective patient. Known ARGs
and VFs were retrieved using ‘CARD’ and ‘VFDB’ database, accordingly. Number of efflux pumps are not included in the analysis.

144
3.3 Discussion
Addressing the extent of any health-related issue in a country requires detailed
background information which can be considered as real time evidence to develop
effective interventions in the future. The enormity of the situation of AMR in
Bangladesh is still a notion based on narrow scale sporadic reports (Farzana et al.,
2013; Islam et al., 2013; Rakhi et al., 2019; Hoque et al., 2020). To date, this is the
only comprehensive study in Bangladesh describing clinical associations and
outcomes in relation to a high-end resistance mechanism.
The prevalence Enterobacterales infections in the study was 29.2% (534/1830).
Traditionally, majorities of infections are treated empirically at DMCH. The choice of
antibiotics mostly depends on the availabilities of the drug in hospital supply. Clinical
specimens are usually referred for microbiology if the infections are suspected
clinically or when the empirical therapy is failed. In Bangladeshi health settings,
physicians are only responsible for taking decision of treatment, laboratory testing, or
any sort of medical interventions. Nurses or ward-attendants are only allowed for
caregiving according to doctors’ instructions (Rahman, personal communication).
This study did not involve with any issue related to patients’ management, but the
project activities were aligned with the DMCH’s usual practice of infection
management. Provided the facts and our consultations with the local physicians on
several occasions, positive cultures from clinical specimens included in this study were
more likely the indicative of true infections. In Bangladesh, there is no facility in the
public system to capture or record patients’ data electronically. Two third of the
admitted patients do not have any allocated bed rather stay in ward floor, hospital
corridors, or even in the stairwells who are assigned as ‘extra’ by the hospital. Each
ward maintains logbook to record patients’ turnover data with some basic information
only, and patients’ clinical documents are transferred to store when the patient either
died or is discharged (Scoping findings by T. R. Walsh explained in general
discussion). This study recorded clinical data from the patients with positive cultures
only which was realistic, achievable within time limit, and aided to avoid lots of
missing data in the dataset.
In general, this study provided some contextual information about DMCH: 1.
The age distribution was wide, and no ward was dominated by a certain age group

145
except NICU and distribution of sex was almost equivalent (Figure 3.5; Figure 3.8). 2.
DMCH served the patients from all over the country, particularly a low socio-
economic group (Figure 3.7). Therefore, the burden of AMR in the hospital would
have huge impact in the country. 3. Antibiotics usage in the hospital was generally
high and the choice of antibiotics did not differ much from one unit to other (Figure
3.9) which reflects a lack of disease-specific antimicrobial guidelines in the hospital.
4. The mortality of patients with Enterobacterales infections was 17.6% (Figure 3.10).
The overall mortality among the study population was not recorded. 5. Forty patients
(7.5%) with Enterobacterales infections left the hospital against the doctor’s advice
(Figure 3.10). DAMA from the hospital is a usual event in SA which happened most
often due to financial constrains (Bhoomadevi et al., 2019). There is no health
insurance system in Bangladesh which can be afforded by low socio-economic group
(Fahim et al., 2019). As public health facilities do not allow always standard care for
general freely (only 3% of GDP expenditure to public health by Bangladesh
Government) (WHO, 2015), paying for medicine, or other necessities during patients’
hospitalisation is a huge burden for a family belonged to low-economic status. The
detailed on the topic has been described in ‘Chapter 10’ (General discussion).
The prevalence of carbapenem resistance among the species of
Enterobacterales was 32.6% (210/643) (Figure 3.1). The rate of carbapenem resistance
varies among species based on the site of infections (Nordmann and Poirel, 2019).
Report of national surveillance in Bangladesh from 2017 to 2019 revealed that 10% of
E. coli and 25% of K. pneumoniae were carbapenem resistant (WHO, 2020a). In this
study, the rate of carbapenem resistance was significantly higher for K. pneumoniae
than other species (p<0.05) (Table 3.5). The genomic profile also indicated that
blaNDM-1, blaNDM-5, and blaOXA-181 were significantly more associated with K.
pneumoniae than other species (p<0.05) (Figure 3.3). Provided the previous reports
and findings of this study, it can be implied that CRE in nosocomial infections is highly
prevalent in the region of SA, whereas nosocomial carbapenem resistance in the USA
and Europe is mostly associated with non-fermenters (Nordmann and Poirel, 2019;
Walia et al., 2019). It has been also speculated that Indian subcontinent is the source
of blaNDM and blaOXA-181, and data revealed the wide dissemination of the genes in this
region. blaOXA-48-like such blaOXA-232 is also found to be prevalent in K. pneumoniae in
the region (Yong et al., 2009; Kumarasamy et al., 2010; Farzana et al., 2013, Islam et

146
al., 2013; Mohanty et al., 2017; Garg et al., 2019; Jaggi et al., 2019; Shankar et al.,
2019; Suay-García and Pérez-Gracia, 2019). Present findings were not an exception;
blaNDM (180/643, 28%) was the most common carbapenemase in clinical
Enterobacterales followed by blaOXA-232 (26/643, 4%), and blaOXA-181 (24/643, 3.7%)
(Table 3.5). K. pneumoniae and E. coli were the most common reservoir of the
carbapenemase genes (Figure 3.3). The magnitude of the problem is extremely
worrisome due to inevitable gut replacement MDR bacteria which has been discussed
in the later chapters (Carlet, 2012; van Schaik, 2015; Gupta et al., 2019).
The risks of CRE infections documented by earlier studies are recent history
of hospitalisation or travel in the region of SA, recent antibiotics exposure,
introduction of artificial devices, and longer hospital stay (Chiotos et al., 2017; van
Loon et al., 2017; Asai et al., 2018; Nicolas-Chanoine et al., 2019; Richter et al.,
2019). A report on risk assessment of AMR in SA estimated that poor IPC, low
antimicrobial stewardship, and selective antibiotic pressure are highly related to
human-to-human transmission of AMR in the region (Chereau et al., 2017).
Widespread empirical antibiotic prescription in the hospital setting of SA is prominent,
much of which is likely to be inappropriate, and is a key driver of resistant bacteria in
the hospital environment (Hsu et al., 2017). In this study, patients admitted in burn
unit, and ICU were considered as high risk for acquiring CRE during their hospital
stay (p<0.05) (Table 3.16). The finding is not unexpected as several factors such as
impaired immunity, comorbidities, prolonged hospital stay and close contact with
hospital staffs, receipt of artificial devices, antibiotics exposures are commonplace in
burn, and ICU patients which facilitate the colonisation, and/or infections by resistant
bacteria (Lachiewicz et al., 2017; Tamma et al., 2019). Our study recorded inpatient
empirical antibiotic exposure on admission which was 94.2%. There were significant
associations between receipt of amikacin, meropenem, levofloxacin and clindamycin,
and CRE cases (p<0.05) (Table 3.16). Age group of 6 to 25 years, and female were
also significantly more associated with CRE infections (Table 3.16). These factors
were independently considered as risk for CRE in bivariate analysis. The
subpopulation of cases (excluding burn cases) had the statistically consistent findings
except sex ‘female’ as a risk (Table 3.18). Nevertheless, lower middle economic group
were significantly more linked to CRE infections rather than poor or BPL in
subpopulation analysis (excluding burn cases) (Table 3.18). It has been anticipated that

147
the poor or BPL have less access to antibiotics due to lack of affordability which might
explain the relation between antibiotics usage and acquisition of resistance
(Vanderhaeghen and Dewulf, 2017). Generally, majority of the participants in this
study (98.7%) belonged to very low to lower-middle socio-economic status (Figure
3.7). A study by World Bank suggested that there is strong correlation of sanitation
facilities and personal hygiene with socio-economic status in Bangladesh (Mahmud
and Mbuya, 2016). Poor individual hygiene status along with lack of access to hand
washing materials, hospital infrastructure, inadequate sanitation, improper disposal of
medical waste, and hospital infrastructure at DMCH have constant impact in the
transmission of infectious diseases (Shahida et al., 2016).
Overall global report suggested that CRE are associated with 3-fold greater
mortality than the susceptible counterpart. Cassini et al. (2019) reported about 13%
death due to carbapenem-resistant K. pneumoniae and 5% due to carbapenem-resistant
E. coli in Europe. Studies in SA estimated CRE-attributable mortality of 56.7% to
84.2%. The analysis on the CRE-associated health burden has been mostly performed
with specific cohort of BSIs, K. pneumoniae infections, and comorbid or critically ill
patients (Kaur et al., 2017; Kohler et al., 2017; Mariappan et al., 2017; Righi et al.,
2017; Martin et al., 2018; Shankar et al., 2018; Stewardson et al., 2019 Liu et al.,
2020). The all-cause in-hospital 30-days mortality due to CRE infections (27.8%) was
lower than the rate reported in SA. The lower mortality in this study may be driven by
the inclusion of CRE of any species of Enterobacterales from all types of clinical
specimens. Even so, the death rate among CRE cases was substantially higher (27.8%)
compared to the CSE cases (13.5%) (p<0.05) (Figure 3.11; Table 3.19). Comorbidities
can influence the likelihood of poor outcome. Clinical information collected in this
study were devoid of data on indicators to evaluate the comorbid status of a patient
such as Charlson comorbidity score, Pitt bacteraemia score, and APACHE II score
(van Duin et al., 2013; Stewardson et al., 2019). All-cause 30-days mortality was
adjusted with time from admission, and other available covariates which showed
diminished associations. The regression analysis also demonstrated the negative
relation of CRE-attributable 30-days mortality with E. coli infections, would
infections, and UTIs which supports the relatively lower death rate with CRE in this
study than the other studies (Table 3.19). The worse patients’ outcome with CRE are
invariably associated with the limited therapeutic options (van Duin et al., 2013;

148
Stewardson et al., 2019). The data on antibiotics usage clearly demonstrated that
overall, 73% of the patients did not receive at least one appropriate clinically important
antibiotic (Table 3.14). However, no statistical significance was observed between
overall mortality and devoid of access to essential antimicrobials rather there was
decease probability of mortality with the patients without any effective antimicrobials
(Table 3.15). Given the lack of data on course of antibiotic therapy to the patients, this
study unable to assess the effect of treatment strategies. Moreover, this study also did
not test susceptibilities of some antimicrobials pertinent to the patients’ usage,
although the usage of those antimicrobials was less frequent except metronidazole
(29.8%) (Table 3.14). Infections by MDR bacteria typically lengthen patients’ hospital
days (Naylor et al., 2019; Stewardson et al., 2019). This study conversely estimated
increase probability of LoS with the CSE group than CRE (Table 3.19). Perhaps strong
association between 30-days mortality and CRE reduced the probabilities of excess
hospital stay in CRE group.
Apart from that, a positive correlation between resistance, and virulence
(r=0.138) was found among clinical Enterobacterales (Figure 3.12). Acquisition of
resistance leads to fitness costs for bacteria (Yang et al., 2017; Wyres et al., 2020).
However, convergence of virulence, and resistance might occur due to horizontal
acquisition of both resistance, and virulence determinants, or adaptive mutations by
the host (Giraud et al., 2017).
Significant resistance to non-β-lactams (ciprofloxacin, levofloxacin, amikacin,
gentamicin, and sulfamethoxazole-trimethoprim) was observed in CRE irrespective of
species (p<0.05) (Table 3.8; Table 3.9; Table 3.10). Genomic data on the associations
of multiple ARGs with CRE were consistent the phenotypic resistance (Table 3.11-
3.13). The associations between carbapenem resistance and other antimicrobial
resistance have been illustrated in Chapter 4 by merging the data of clinical and faecal
isolates. The overall most effective antibiotics against clinical CRE in this study were
colistin, and fosfomycin (Table 3.4). Taken together, the findings of this study infer a
high CRE prevalence in Bangladeshi health setting with poor clinical outcome, and
selective antibiotic pressure is a potential driver for the spread of AMR.

149
Section Four
Molecular Epidemiology and Risk Analysis of Carbapenem-
Resistant Enterobacterales in Faecal Carriage

150
4.1 Introduction
An estimated 1014 symbionts, commensals and opportunistic pathogens are the
inhabitants of human body. The human gut microbiota comprises diverse range of
species which are remarkably stable in healthy adults. Generally, the human gut is
exposed to a substantial number of bacteria through hands, pharyngeal and nasal
secretions, water, food, and beverages. The gut microbiota acts as barrier for intestinal
colonisation of pathogens. While the composition of gut microbiota depends on dietary
habit or environmental insult, antibiotic exposure holistically alters taxonomic
diversity of microbiota, increasing the vulnerability to infection by pathogens. The
major concerns owing to the alteration are the persistence of taxonomic changes for
protracted periods and inter-strain horizontal gene transfer. Conjugation and
transduction contribute a major role to the spread of AMR genes in the gut microbiota,
and human gut provides the optimal conditions for the transfer. Intestinal flora can be
reservoir of MDR gene pool in otherwise healthy individual called ‘gut resistome’
(Carlet, 2012; van Schaik, 2015; Gupta et al., 2019).
The major human gut commensals are the members of two phyla, the
Bacteroidetes and Firmicutes. Enterobacteriaceae families are also present as normal
flora in the intestinal tract which are of particular interest in terms of resulting
nosocomial infections, and ability to take part in horizontal gene transfer. Selective
pressure driven disruption of gut flora exacerbates the number of resistant bacteria in
the gut ecosystem. The emergence of CRE in health care setting is a major public
health challenge, has been associated with limited therapeutic options and increased
mortality and morbidity (van Duin et al., 2013; Stewardson et al., 2019). Gut
colonisation with CRE can be the source of transmission of CRE in hospital settings,
and the community (Huddleston, 2014; Gupta et al., 2019; Jeong et al., 2019; Tamma
et al., 2019).
Scrutinizing faecal specimens for AMR periodically can predict the trend of
any resistance mechanism in a community. Provided the fact of limited data on AMR,
and anticipated endemicity of some resistance mechanisms in the region of SA, wide
scale systematic national AMR survey can be the option to understand about the
existent scenario (Zaidah et al., 2017; Gupta et al., 2019; Kłudkowska et al., 2019).
This chapter investigates the prevalence of faecal carriage of CRE in Bangladesh and

151
the risks for CRE colonisation in hospital settings, has accomplish ‘objectives #5’ of
this project.

152
4.2 Results
4.2.1 Study outline and prevalence of CRE carriage in a clinical setting of
Bangladesh
A total of 700 RSs from 13th May 2018 to the17th June 2018 from patients
attending DMCH were included. The study outline is depicted in Figure 4.1. The
frequency of Enterobacterales isolation from the media containing vancomycin (10
mg/L), and ertapenem (2 mg/l) was 47.7% (334/700). The most common
Enterobacterales were E. coli (41.8%, 293/700) followed by K. pneumoniae (11.6%,
81/700), Citrobacter spp. (2.7%, 19/700), Enterobacter spp. (2.1%, 15/700), and
others (2.4%, 17/700) (Figure 4.2).
The frequency of carbapenem resistance in each species identified was: K.
pneumoniae, 88.9% (72/81); E. coli, 72% (211/293); and others, 68.6% (35/51) (Table
4.1; Table 4.2). S. marcescens (n=1) was not assessed for MIC50 and MIC90, but
resistant to amoxicillin-clavulanic acid, piperacillin-tazobactam, ceftazidime,
cefotaxime, sulfamethoxazole-trimethoprim, and colistin and sensitive to ceftriaxone,
cefepime, imipenem, meropenem, ciprofloxacin, levofloxacin, amikacin, gentamicin,
and fosfomycin.
The prevalence of CRE in faecal carriage was 34.8% (244/700). The
prevalence was significantly higher among inpatients (206/383, 53.8%) than the
outpatients (38/317, 12%) (p<0.05) (Figure 4.3).

153
Figure 4.1 Flowchart diagram of colonisation study at DMCH. *The Enterobacterales
from RSs were screened in vancomycin (10 mg/l), and ertapenem (2 mg/l) containing
media. **CSE identified in this study were used as comparators to compare phenotypic
and genomic profile between CRE and CSE.

154
Figure 4.2 The frequency of isolation of different species of Enterobacterales from
RSs at DMCH (n=700). The Enterobacterales from RSs were screened in vancomycin
(10 mg/l), and ertapenem (2 mg/l) containing media.

155
Table 4.1 Antimicrobial susceptibility pattern of faecal Enterobacterales.
E.
coli
(n
=2
93
)
Antibiotics MIC50
(mg/l)
MIC90 (mg/l) Range of MIC
(mg/l)
n (%)
Resistance
AMC >256 >256 8 to >256 287 (98)
TZP >256 >256 0·125 to >256 252 (86)
CRO >256 >256 ≤0·06 to >256 283 (96·6)
CAZ >256 >256 0·125 to >256 283 (96·6)
CTX >256 >256 ≤0·06 to >256 281 (95·9)
FEP >256 >256 ≤0·06 to >256 273 (93·2)
IPM 8 32 ≤0·06 to 128 200 (68·3)
MEM 16 64 ≤0·06 to 128 211 (72)
CIP 128 >256 ≤0·06 to >256 268 (91·5)
LVX 32 64 ≤0·06 to 256 258 (88·1)
AMK 16 >256 0·5 to >256 147 (50·2)
GEN 256 >256 0·25 to >256 172 (58·7)
SXT 256 256 1 to >256 240 (81·9)
FOF 0·25 1 ≤0·06 to >256 5 (1·7)
CST 0·25 0·25 0·125 to 8 1 (0·3)
K.
pn
eum
on
iae
(n=
81
)
AMC >256 >256 256 to >256 81 (100)
TZP >256 >256 1 to >256 72 (88·9)
CRO >256 >256 1 to >256 78 (96·3)
CAZ >256 >256 0·125 to >256 80 (98·8)
CTX >256 >256 0·5 to >256 80 (98·8)
FEP 64 >256 ≤0·06 to >256 78 (96·3)
IPM 4 32 ≤0·06 to >256 51 (63)
MEM 8 64 ≤0·06 to >256 69 (85·2)
CIP 64 >256 0·125 to >256 78 (96·3)
LVX 8 256 0·125 to >256 73 (90·1)
AMK >256 >256 0·125 to >256 72 (88·9)
GEN >256 >256 0·125 to >256 70 (86·4)
SXT 256 >256 0·125 to >256 78 (96·3)
FOF 16 64 0·125 to 256 16 (19·7)
CST 0·5 1 0·125 to 128 6 (7·4)
Kle
bsi
ella
oth
er t
han
K.
pn
eum
on
iae
(n=
10
)
AMC >256 >256 >256 10 (100)
TZP >256 >256 4 to >256 8 (80)
CRO 256 >256 1 to >256 9 (90)
CAZ >256 >256 1 to >256 9 (90)
CTX >256 >256 4 to >256 10 (100)
FEP 32 >256 ≤0·06 to >256 8 (80)
IPM 8 64 0·125 to 64 6 (60)
MEM 16 32 ≤0·06 to 32 8 (80)
CIP 4 >256 0·125 to >256 8 (80)
LVX 1 128 0·125 to 128 8 (80)
AMK >256 >256 1 to >256 7 (70)
GEN >256 >256 0·5 to >256 7 (70)
SXT >256 >256 4 to >256 10 (100)
FOF 16 64 4 to 64 1 (10)
CST 0·5 1 0·125 to 1 0 (0)
En
tero
ba
cter
sp
p.
(n=
45
)
AMC >256 >256 >256 15 (100)
TZP 256 >256 4 to >256 12 (80)
CRO >256 >256 1 to >256 15 (100)
CAZ >256 >256 8 to >256 15 (100)
CTX 64 256 128 to >256 15 (100)
FEP 64 64 8 to 128 15 (100)
IPM 8 64 0·5 to 64 13 (86·7)

156
MEM 16 64 ≤0·06 to 64 14 (93·3)
CIP 4 32 0·25 to 64 13 (86·7)
LVX 1 64 0·125 to 64 12 (80)
AMK 16 >256 4 to >256 10 (66·7)
GEN 4 >256 1 to >256 9 (60)
SXT >256 >256 2 to >256 14 (93·3)
FOF 32 64 0·5 to 256 7 (46·7)
CST 0·25 1 0·25 to 16 1 (6·7)
Cit
rob
act
er s
pp
. (n
=1
9)
AMC >256 >256 16 to >256 19 (100)
TZP 4 >256 1 to >256 9 (47·4)
CRO 16 >256 0·25 to >256 13 (68·4)
CAZ 64 >256 0·125 to >256 12 (63·2)
CTX 64 >256 0·125 to >256 13 (68·4)
FEP 16 128 ≤0·06 to 256 12 (63·2)
IPM 0·5 16 0·125 to 16 8 (42·1)
MEM ≤0·06 16 ≤0·06 to 16 7 (36·8)
CIP 1 64 ≤0·06 to 64 11 (57·9)
LVX 1 16 ≤0·06 to 64 10 (52·6)
AMK 2 >256 2 to >256 6 (31·6)
GEN 0·5 >256 0·25 to >256 6 (31·6)
SXT 2 256 1 to 256 8 (42·1)
FOF 0·5 2 0·5 to 2 0 (0)
CST 0·25 0·25 ≤0·06 to 0·5 0 (0)
M.
mo
rga
nii
(n
=6)
AMC 128 >256 16 to >256 6 (100)
TZP 128 256 2 to 256 5 (83·3)
CRO >256 >256 16 to >256 6 (100)
CAZ 256 >256 8 to >256 6 (100)
CTX 16 >256 4 to >256 6 (100)
FEP 4 64 4 to 64 6 (100)
IPM 2 16 1 to 16 6 (100)
MEM 4 >256 0·25 to >256 5 (83·3)
CIP 128 >256 128 to >256 6 (100)
LVX 64 >256 32 to >256 6 (100)
AMK >256 >256 4 to >256 5 (83·3)
GEN 256 >256 2 to >256 5 (83·3)
SXT 256 256 256 6 (100)
FOF 256 >256 64 to >256 6 (100)
CST >256 >256 >256 6 (100)
n, number of resistant isolates to respective antibiotic; AMC, amoxicillin-clavulanic
acid; TZP, piperacillin-tazobactam; CRO, ceftriaxone; CAZ, ceftazidime; CTX,
cefotaxime; FEP, cefepime; IPM, imipenem; MEM, meropenem; CIP, ciprofloxacin;
LVX, levofloxacin; AMK, amikacin; GEN, gentamicin; SXT, sulfamethoxazole-
trimethoprim; FOF, fosfomycin; CST, colistin. Data on S. marcescens (n=1) was not
included in the table. The Enterobacterales from RSs were screened in vancomycin
(10mg/L), and ertapenem (2 mg/l) containing media.

157
Table 4.2 Antimicrobial susceptibility patterns of faecal Enterobacterales.
Species
Resistance to respective antibiotics, n (%)
AMC TZP CRO CAZ CTX FEP IPM MEM CIP LVX AMK GEN SXT FOF CST
E. coli
(n=293)
287
(98)
252
(86)
283
(96·6)
283
(96·6)
281
(95·9)
273
(93·2)
200
(68·3)
211
(72)
268
(91·5)
258
(88·1)
147
(50·2)
172
(58·7)
240
(81·9)
5
(1·7)
1
(0·3)
K. pneumoniae
(n=81)
81
(100)
72
(88·9)
78
(96·3)
80
(98·8)
80
(98·8)
78
(96·3)
51
(63)
69
(85·2)
78
(96·3)
73
(90·1)
72
(88·9)
70
(86·4)
78
(96·3)
16
(19·7)
6
(7·4)
Other Klebsiella
spp. (n=10)*
10
(100)
8
(80)
9
(90) 9 (90)
10
(100) 8 (80) 6 (60) 8 (80) 8 (80)
8
(80) 7 (70)
7
(70)
10
(100)
1
(10)
0
(0)
Enterobacter spp.
(n=45)
15
(100)
12
(80)
15
(100)
15
(100)
15
(100)
15
(100)
13
(86·7)
14
(93·3)
13
(86·7)
12
(80)
10
(66·7)
9
(60)
14
(93·3)
7
(46·7)
1
(6·7)
Citrobacter spp.
(n=19)
19
(100)
9
(47·4)
13
(68·4)
12
(63·2)
13
(68·4)
12
(63·2)
8
(42·1)
7
(36·8)
11
(57·9)
10
(52·6)
6
(31·6)
6
(31·6)
8
(42·1) 0 (0) 0 (0)
M. morganii
(n=6)
6
(100)
5
(83·3)
6
(100) 6 (100)
6
(100)
6
(100)
6
(100 )
5
(83·3)
6
(100)
6
(100)
5
(83·3)
5
(83·3)
6
(100)
6
(100)
6
(100)
Values in parentheses indicate row percentage. AMC, amoxicillin-clavulanic acid; TZP, piperacillin-tazobactam; CRO, ceftriaxone; CAZ,
ceftazidime; CTX, cefotaxime; FEP, cefepime; IPM, imipenem; MEM, meropenem; CIP, ciprofloxacin; LVX, levofloxacin; AMK, amikacin;
GEN, gentamicin; SXT, sulfamethoxazole-trimethoprim; FOF, fosfomycin; CST, colistin. Data on Salmonella spp. (n=5), P. agglomerans (n=1)
and E. hermannii (n=1) are not included in this table. *Klebsiella species other than K. pneumoniae. Cells are highlighted according to the
proportion of resistance of the species of Enterobacterales against respective antibiotics: ≥90% are represented by red (●); 60% to 89% by amber
(●); 30% to 59% by yellow (●); <30% by green (●); intrinsic resistance by grey (●). The Enterobacterales from RSs were screened in vancomycin
(10mg/L), and ertapenem (2 mg/l) containing media.

158
Figure 4.3 The prevalence CRE carriage among inpatients versus the prevalence
among outpatients. The prevalence of CRE was significantly higher among inpatients
(206/383, 53.8%) than outpatients (38/317, 12%) (p<0.0001).

159
4.2.2 The prevalence of carbapenemases alleles in faecal Enterobacterales
The distribution of carbapenemase alleles among the Enterobacterales was
blaNDM-5 (228/425, 53·6%) followed by blaNDM-1 (56/425, 13·2%), blaOXA-181 (41/425,
9·6%), blaNDM-7 (14/425, 3·3%), blaOXA-232 (5/425, 1·2%), blaNDM-4 (4/425, 0·9%), and
novel NDM variants (10/425, 2·3%) (Table 4.3). The combinations of carbapenemase
alleles recovered were: blaNDM-5+blaOXA-181 (3/425, 0.7%), blaNDM-1+blaOXA-181 (1/425,
0.2%), and blaNDM-1+blaOXA-232 (1/425, 0.2%). Among the faecal Enterobacterales,
blaNDM-5 was significantly more likely to be found in E. coli (171/293, 58·4%) than
others (57/132, 43·2%) (p<0.05), and blaNDM-7 was only identified from E. coli.
Significant prevalence of carbapenemase alleles in faecal K. pneumoniae was: blaOXA-
232 in K. pneumoniae (4/81, 4·9%) than others (1/344, 0·3%) (p<0.05). The prevalence
of blaNDM-1 in faecal E. coli (n=17) and K. pneumoniae (n=17) was the same (Figure
4.4).
Four of faecal E. coli phenotypically resistant to both imipenem (MIC range:
4 mg/l to 32 mg/l), and meropenem (MIC range: 16 mg/l to 64 mg/l) but were not
positive any known carbapenemase. We found the presence of carbapenemase in
phenotypically carbapenem-susceptible faecal isolates (low clinical breakpoint
according to EUCAST) (n=8) (Table 4.4).
We considered the alleles as novel NDM variants when anonymous base
substitutions were found in 813 bp NDM-encoded ORF, compared to known blaNDM
variants (data not shown). Elucidating functional and molecular properties of the novel
NDM variants was beyond the scope of this study. Further study has been planned to
further analyse these novel variants.

160
Table 4.3 The distributions of carbapenemases alleles among the species of faecal
Enterobacterales (n=425).
Carbapenemase
alleles
Host species (n) n (%)
NDM-5 CRo (1), CWe (1), EC (171), EnC (1), EnH (5), KP (46), KQ
(1), MM (2)
228 (53·6)
NDM-1 CAm (3), CFr (3), CRo (2), EC (17), EnC (7), KA (1), KP
(17), KQ (4), KV (1), MM (1)
56 (13·2)
OXA-181 CFr (2), EC (29), KA (1), KP (9) 41 (9·6)
NDM-7 EC (14) 14 (3·3)
Novel NDM variants EC (4), EnC (1), KP (3), KQ (1), MM (1) 10 (2·3)
OXA-232 EC (1), KP (4) 5 (1·2)
NDM-4 EC (3), MM (1) 4 (0·9)
n, number of isolates; CAm, C. amalonaticus; CFr, C. freundii; CRo, C. rodentium;
CWe, C. werkmanii; EC, E. coli; EnA, E. aerogenes; EnC, E. cloacae; KA, K.
aerogenes; KP, K. pneumoniae; KQ, K. quasipneumoniae; KV, K. variicola; MM, M.
morganii.

161
Figure 4.4 Comparative distribution of carbapenemase alleles among different species
of faecal Enterobacterales. CAm, C. amalonaticus; CFr, C. freundii; CRo, C.
rodentium; CWe, C. werkmanii; EC, E. coli; EnA, E. aerogenes; EnC, E. cloacae;
KA, K. aerogenes; KP, K. pneumoniae; KQ, K. quasipneumoniae; KV, K. variicola;
MM, M. morganii. Significant associations were observed in E. coli for blaNDM-5
(171/293, 58·4%) than others (57/132, 43·2%) (p=0.004), and in K. pneumoniae for
blaOXA-232 (4/81, 4·9%) than others (1/344, 0·3%) (p=0·0004).

162
Table 4.4 Range of carbapenems’ MIC of carbapenemase producing Enterobacterales
having lower clinical breakpoints.
Carbapenemase variants Carbapenems Range of MIC (mg/l)
blaOXA-181 (n=3) IPM 0.25 to 1
MEM 0.125 to 1
blaNDM-5 (n=3) IPM 0.125 to 2
MEM 0.25
blaOXA-232 (n=1) IPM 0.5
MEM 0.5
blaNDM-1 (n=1) IPM 0.125
MEM 0.06
IPM, imipenem; MEM, meropenem.

163
4.2.3 Investigating the associations of non-β-lactam resistance in faecal CRE
The overall phenotypic resistance of the faecal Enterobacterales is depicted in
Figure 4.5. The most sensitive antimicrobial against CRE were colistin (3.8%)
followed by fosfomycin (9.7%). For colistin, this resistance rate reflected inclusion of
a small number of isolates for which the species is intrinsically resistant. CRE
exhibited significantly greater resistance rates to ciprofloxacin, levofloxacin,
amikacin, gentamicin, and sulfamethoxazole-trimethoprim than CSE (p<0.05) (Table
4.5).
The associations of prevalent ARGs with the certain prevalent carbapenemase
allele (blaNDM-1, blaNDM-5, blaOXA-181) were examined as to clinical study (Chapter 3).
Significant associations of carbapenemase alleles in faecal Enterobacterales with other
ARGs encoding antibiotic degrading enzymes are mentioned in Table 4.6-Table 4.8.
The ARGs were only considered for the analysis if the frequency of any gene was
more than 10. Known ARGs were retrieved using CARD with a cut off ≥99.8%
coverage, and ≥99.8% identity.
NDM-5 was shown to be the most common carbapenem resistance mechanism
in both clinical, and carriage study followed by NDM-1 (Table 3.6; Table 4.3).
Heatmaps were generated with the isolates harbouring blaNDM-5, and blaNDM-1,
respectively based on presence ARGs showed significant associations with the
respective carbapenemase alleles in both clinical, and carriage studies to identify any
putative cluster of isolates having common mode of transmission of carbapenem
resistance (Figure 4.6).
CRE harbouring blaNDM-5 were significantly associated with blaampC1, blaampH,
blaCMY-59, blaTEM-1, aadA2, rmtB, sul1, sul2, and dfrA12 (Table 3.12; Table 4.7), of
which blaampC1, and blaampH were found only in E. coli, blaCMY-59 was restricted to E.
coli, and K. pneumoniae. The genes, blaTEM-1, aadA2, rmtB, sul1, sul2, and dfrA12
were distributed in different species of Enterobacterales (Figure 4.6). We attempted to
screen a cluster with isolates shared blaNDM-5, blaTEM-1, aadA2, rmtB, sul1, and dfrA12.
Seeing the comparative low prevalence of sul2 (31.4%, 102/325) among the NDM-5-
positive isolates, we did not consider sul2 to investigate the putative cluster. A cluster
consisted of 167 isolates was identified shared the six resistance genes (Figure 4.6).

164
CRE harbouring blaNDM-1 were significantly associated with APH(3')-VI,
armA, rmtF, blaOXA-1, blaOXA-9, arr2, and mphE (Table 3.11; Table 4.6). We found the
combination of blaOXA-1, blaOXA-9, and APH(3')-VI among K. variicola. A group of
isolates (n=6) shared blaOXA-1, APH(3')-VI, armA, and mphE, of which four were P.
stuartii. The combination of blaNDM-1, blaOXA-1, armA, and mphE was observed in wide
range of species, which was considered as a cluster, comprised of 31 isolates (Figure
4.7).
The putative clusters identified in association with blaNDM-5 (designated as
HT5), and blaNDM-1 (designated as HT1) were evaluated further whether any specific
MDR plasmid facilitate the dissemination of carbapenem resistance which have been
illustrated in Chapter 6.

165
Figure 4.5 Susceptibility patterns of faecal Enterobacterales against the antibiotics
tested. *All M. morganii, and S. marcescens isolated in this study were resistant to
colistin. AMC, amoxicillin-clavulanic acid; TZP, piperacillin-tazobactam; CRO,
ceftriaxone; CAZ, ceftazidime; CTX, cefotaxime; FEP, cefepime; IPM, imipenem;
MEM, meropenem; CIP, ciprofloxacin; LVX, levofloxacin; AMK, amikacin; GEN,
gentamicin; SXT, sulfamethoxazole-trimethoprim; FOF, fosfomycin; CST, colistin.
The Enterobacterales from RSs were screened in vancomycin (10 mg/l), and
ertapenem (2 mg/l) containing media.

166
Table 4.5 Comparative resistance profile to non-β-lactam antibiotics between CRE
and CSE.
Antibiotics CRE (n=318) CSE (n=107) p value
CIP 311 (97·8) 73 (68·2) <0·0001
LVX 303 (95·3) 64 (59·8) <0·0001
AMK 243 (76·4) 4 (3·7) <0·0001
GEN 251 (78·9) 18 (16·8) <0·0001
SXT 299 (94·0) 58 (54·2) <0·0001
FOF* 26/313 (8.3) 3/106 (2.8) 0.05
CST** 7/313 (2.2) 1/105 (1) 0·406
Values in parentheses indicate column percentage. CIP, ciprofloxacin; LVX,
levofloxacin; AMK, amikacin; GEN, gentamicin; SXT, sulfamethoxazole-
trimethoprim; FOF, fosfomycin; CST, colistin. *M. morganii (n=6) were excluded
from the analysis as the species are intrinsically resistant to fosfomycin. **M. morganii
(n=6), and S. marcescens (n=1) were excluded from the analysis as the species are
intrinsically resistant to colistin. Cells are highlighted whether any variable was
significantly higher with CRE.

167
Table 4.6 The associations of prevalent ARGs with blaNDM-1-positive faecal isolates
compared to blaNDM-1-negative faecal isolates.
ARGs Presence of ARG, n (%)
p value blaNDM-1-positive isolates
(n=56)
blaNDM-1-negative isolates
(n=369)
AAC(3)-IId 10 (17.9) 22 (6) 0.002
AAC(6')-Ib-cr 25 (44.6) 111 (30.1) 0.030
APH(3')-VI 10 (17.9) 1 (0.3) <0.0001
APH(6)-Id 16 (28.6) 63 (17.1) 0.039
armA 16 (28.6) 12 (3.3) <0.0001
rmtF 5 (8.9) 1 (0.3) <0.0001
blaCTX-M-15 52 (92.9) 239 (64.8) <0.0001
blaOXA-1 27 (48.2) 112 (30.4) 0.01
blaOXA-9 12 (21.4) 11 (3) <0.0001
arr2 11 (19.6) 10 (2.7) <0.0001
mphE 22 (39.3) 34 (9.2) <0.0001
qnrS1 26 (46.4) 110 (29.8) 0.015
Values in parentheses indicate column percentage. The associations between blaNDM-
1, and other ARGs were only mentioned if p values were <0.05.

168
Table 4.7 The associations of prevalent ARGs with blaNDM-5-positive faecal isolates
compared to blaNDM-5-negative faecal isolates.
ARGs Presence of ARG, n (%)
p value blaNDM-5-positive isolates
(n=228)
blaNDM-5-negative isolates
(n=197)
aadA2 184 (80.7) 47 (23.9) <0.0001
aadA5 38 (16.7) 19 (9.6) 0.037
rmtB 169 (74.1) 13 (6.6) <0.0001
blaCMY-59 42 (18.4) 22 (11.2) 0.037
blaampC1 52 (22.8) 16 (8.1) <0.0001
blaampH 58 (25.4) 15 (7.6) <0.0001
blaTEM-1 176 (77.2) 68 (34.5) <0.0001
sul1 199 (87.3) 91 (46.2) <0.0001
sul2 54 (23.7) 29 (14.7) 0.020
sul3 14 (6.1) 2 (1) 0.007
dfrA12 196 (86) 53 (26.9) <0.0001
dfrA17 26 (11.4) 8 (4.1) 0.008
Values in parentheses indicate column percentage. The associations between blaNDM-
5, and other ARGs were only mentioned if p values were <0.05.

169
Table 4.8 The associations of prevalent ARGs with blaOXA-181-positive faecal isolates
compared to blaNOXA-181-negative faecal isolates.
ARGs
Presence of ARG, n (%)
p value blaOXA-181-positive
isolates (n=41)
blaOXA-181-negative
isolates (n=384)
AAC(6')-Ib-cr 19 (46.3) 117 (30.5) 0.046
aadA5 14 (34.1) 43 (11.2) 0.0002
blaCMY-59 14 (34.1) 50 (13) 0.001
blaOXA-9 5 (12.2) 18 (4.7) 0.047
blaSHV-1 5 (12.2) 8 (2.1) 0.001
arr3 3 (7.3) 3 (0.8) 0.001
catB3 4 (9.8) 7 (1.8) 0.004
cat1 8 (19.5) 31 (8.1) 0.021
qnrS1 32 (78) 104 (27.1) <0.0001
sul1 35 (85.4) 255 (66.4) 0.019
dfrA1 3 (7.3) 8 (2.1) 0.045
dfrA17 9 (22) 25 (6.5) 0.001
Values in parentheses indicate column percentage. The associations between blaOXA-
181, and other ARGs were only mentioned if p values were <0.05.

170
Figure 4.6 A. Phylogenetic tree generated with blaNDM-5-positive isolates (n=325) from binary presence and absence of accessory genes using roary
(v3.12.0) (core genes, n= 317, soft core genes, n=101, shell genes, n=9270, cloud genes, n=42837). Heatmap showing the presence and absence of
respective ARGs. Purple indicates presence of genes, and white indicates absence of genes. B. Distribution of isolates (n=167) in the cluster shared
blaNDM-5, blaTEM-1, aadA2, rmtB, sul1, and dfrA12 among different species isolated from different source. Size of bubble is proportional to the
number of isolates.

171
Figure 4.7 A. Phylogenetic tree generated with blaNDM-1-positive isolates (n=118) from binary presence and absence of accessory genes using roary
(v3.12.0) (core genes, n= 34, soft core genes, n=0, shell genes, n= 8577, cloud genes, n=59496). Heatmap showing the presence and absence of
respective ARGs. Purple indicates presence of genes, and white indicates absence of genes. B. Distribution of isolates (n=31) in the cluster shared
blaNDM-1, blaOXA-1, armA, and mph among different species isolated from different source. Size of bubble is proportional to the number of isolates.

172
4.2.4 Baseline data of the participants enrolled in carriage study
Of the 383 inpatients, 268 (70%) were male and 115 (30%) were female and
the mean (±SD) age was 26.6 (±20.9). Among the outpatients, 204 were female
(64.6%), and 112 (35.4%) were male and the mean age was 30.2 (±14.9). The
majorities of both inpatients (n=219, 57.2%) and outpatients (n=263, 83.2%) in this
study were from Dhaka division followed by other divisions (Figure 4.8). Overall,
67.4% patients belonged to lower-middle group, 20.8% poor, 6.4% BPL, and others
(Table 4.9). Several hygiene indicators to determine the hygiene status of the
participants were recorded. Participants were stratified based on hygiene indicators
and socioeconomic conditions. The highest frequency (45%, 315/700) was observed
among the participants of lower-middle group with improved sanitation facilities
(access to household water supply, access to septic toilet, access to soap and water in
toilet), however, taken together, 43.9% (307/700) of the participants were devoid of
household water supply, and 32.1% (225/700) did not have access to water and soap
in toilet (Table 4.9). 88.8% (340/383) of the inpatients were with antimicrobial
treatment at the time of sampling, and only one outpatient was prescribed with
antimicrobial on the day of sampling. The frequency of antimicrobial usage among the
participants admitted at different wards of DMCH are summarised in Figure 4.9.

173
Figure 4.8 Locality of participants enrolled in this study.

174
Table 4.9 Overall hygiene status of the participants according to socioeconomic condition (n=700).
Access to household water supply (n=393) No access to household water supply (n=307) Total
Septic
toilet
Pit
toilet
Septic
toilet
Septic
toilet
Pit
toilet
Septic
toilet
Pit
toilet
Open
toilet
BPL 8 0 6 7 1 15 8 0 45
Poor 25 1 3 22 7 57 27 4 146
LM 315 2 14 54 9 62 14 2 472
UM 17 0 0 4 1 8 2 2 34
UH 2 0 0 0 0 1 0 0 3
BPL, below the poverty level; LM, lower middle; UM, upper middle; UH, upper high. Green cells denote access to soap and water in toilet, and
red cells indicate no access to soap and water in toilet.

175
Figure 4.9 Antibiotics usage in different wards of DMCH among the participants enrolled for the colonisation study. AMP, ampicillin AMK,
Amikacin; AZM, azithromycin; CAZ, ceftazidime; CFX, cefixime; CXM, cefuroxime; CIP, ciprofloxacin; CLI, clindamycin; CRO, ceftriaxone;
CST, colistin; FLU, flucloxacillin; GEN, gentamicin; IPM, imipenem; LVX, levofloxacin; LZD, linezolid; MEM, meropenem; MTZ,
metronidazole; TZP, piperacillin-tazobactam; VAN, vancomycin.

176
4.2.5 Risk assessment of baseline variables
The exposure of interest for the risk factor measurement was carbapenem
resistance. Participants with at least one CRE positive RSs were considered as CRE
carriage. Participants without CRE carriage were used as comparators for the risk
assessment. Out of 700 Enterobacterales carriage patients, 244 (34.8%) were identified
as CRE carriage and 456 (65.1%) as non-CRE carriage (Figure 4.1). Risk assessments
were performed separately for inpatients and outpatients (Table 4.10)
Admission to the burns unit and hospital stay more than 7 days were
significantly associated with CRE carriage (p<0.05) among the inpatients. Overall
antibiotics usage among the inpatients was significantly higher in CRE carriage than
the CSE carriage (p<0.05). Clindamycin, cefixime, colistin, and levofloxacin exposure
had a significant association with CRE carriage (p<0.05) (Table 4.10).

177
Table 4.10 Descriptive statistics for risk assessment of faecal carriage of CRE compared to participants without CRE.
Attributes Inpatients (n=383) Outpatients (n=317)
CRE
(n=206)
Non-CRE
(n=177)
p value CRE
(n=38)
Non-CRE
(n=279)
p value
Age 0 to 5 38 (18.4) 20 (11.3) 0.052 7 (18.4) 17 (6.1) 0.007
6 to 25 86 (41.7) 63 (35.6) 0.218 14 (36.8) 67 (24) 0.089
26 to 50 63 (30.6) 59 (33.3) 0.565 16 (42.1) 173 (62) 0.019
>50 19 (9.2) 35 (19.8) 0.003 1 (2.6) 22 (7.9) 0.241
Sex Female 67 (32.5) 48 (27.1) 0.250 22 (57.9) 182 (65.2) 0.376
Male 139 (67.5) 129 (72.9) 16 (42.1) 97 (34.8)
Socioeconomic group BPL 21 (10.2) 12 (6.8) 0.235 4 (10.5) 8 (2.9) 0.020
Poor 47 (22.8) 51 (28.8) 0.180 6 (15.8) 42 (15.1) 0.906
LM 132 (64.1) 98 (55.4) 0.083 28 (73.7) 214 (76.7) 0.681
UM 5 (2.4) 15 (8.5) 0.008 0 (0) 14 (5) 0.158
UH 1 (0.5) 1 (0.5) 0.914 0 (0) 1 (0.4) 0.712
Access to supply water at
home
Yes 84 (40.8) 69 (39) 0.721 21 (55.3) 219 (78.5) 0.002
No 122 (59.2) 108 (61) 17 (44.7) 60 (21.5)
Type of toilet Septic toilet 172 (83.5) 148 (83.6) 0.975 34 (89.5) 266 (95.3) 0.132
Pit toilet 28 (13.6) 27 (15.3) 0.644 4 (10.5) 13 (4.7) 0.132
Open toilet 6 (2.9) 2 (1.1%) 0.224 - - -
Access to water & soap
in toilet (at home)
Yes 116 (56.3) 100 (56.5) 0.971 28 (73.7) 231 (82.8) 0.173
No 90 (43.7) 77 (43.5) 10 (26.3) 48 (17.2)
Admitting wards
(hospitalised patients)a
Burn 132 (64.1) 50 (28.2) <0.0001 - - -
Surgery 20 (9.7) 35 (19.8) 0.005 - - -
PSU 19 (9.2) 28 (15.8) 0.050 - - -
Neurosurgery 8 (3.9) 29 (16.4) <0.0001 - - -
ICU 19 (9.2) 16 (9) 0.950 - - -

178
Hospital stay before
samplinga
≤7 days 65 (31.6) 103 (58.2) <0.0001 - - -
>7 days 141 (68.4) 74 (41.8) - - -
Antibiotics usage during
hospital stay (before
sampling)a
With antibiotics 192 (93.2) 148 (83.6) 0.003 - - -
Without antibiotics 14 (6.8) 29 (16.4) - - -
Antibiotics exposure
during hospital stay
(before sampling)a
Ceftriaxone 78 (37.9) 84 (47.5) 0.058 - - -
Meropenem 32 (15.5) 17 (9.6) 0.083 - - -
Clindamycin 30 (14.6) 13 (7.3) 0.026 - - -
Ceftazidime 19 (9.2) 15 (8.5) 0.797 - - -
Metronidazole 12 (5.8) 21 (11.9) 0.036 - - -
Cefixime 26 (12.6) 6 (3.4) 0.001 - - -
Colistin 22 (10.7) 6 (3.4) 0.006 - - -
Flucloxacillin 18 (8.7) 8 (4.5) 0.102 - - -
Amikacin 12 (5.8) 9 (5.1) 0.751 - - -
Cefuroxime 7 (3.4) 14 (7.9) 0.053 - - -
Levofloxacin 17 (8.3) 4 (2.3) 0.010 - - -
Number of antibiotics
prescribed (n=340)*a
Monotherapy 87 (45.3) 80 (50) 0.110 - - -
More than one drug 105 (54.7) 68 (45.9) - - -
Values in parentheses indicate column percentage. BPL, below the poverty level; LM, lower middle; UM, upper middle; UH, upper high; PSU,
paediatric surgery. *Inpatients without any antibiotic among inpatients were excluded from the analysis. aAnalysis performed for inpatients only.
Antibiotics usage among outpatients were not evaluated for CRE colonisation. Cells are highlighted whether any variable was significantly
associated with CRE. Bivariate analysis was performed to identify the risks for CRE.

179
4.3 Discussion
Following the high prevalence [10.6% (194/1831)] of CRE in clinical
infections (Chapter 3), we aimed to conduct the carriage study to investigate
connection between clinical infections and faecal colonisation at DMCH. RSs were
screened for CRE on media containing vancomycin (10mg/L), and ertapenem (2 mg/l)
to preclude Gram-positive and carbapenem sensitive bacteria. A total of 425
Enterobacterales was screened on media containing vancomycin (10 mg/L), and
ertapenem (2 mg/l), however, 107 isolates were considered as CSE due to lower
clinical breakpoints of both imipenem (≤2 mg/l) and meropenem imipenem (≤2 mg/l)
(Figure 4.1), of which three was positive for blaOXA-181, three for blaNDM-5, one for
blaOXA-232, and one for blaNDM-1 (Table 4.4). The remaining 92.5% (99/107) of the
isolates were negative for any known carbapenemase. In accordance with the finding,
9 of the clinical isolates carried blaOXA-232, and one blaOXA-181, were phenotypically
susceptible to both imipenem and meropenem (Table 3.7). Nevertheless, this study
considered any species of Enterobacterales as CSE if these were phenotypically
carbapenem susceptible (imipenem and meropenem) irrespective of presence of
carbapenemase considering very low of such frequency. Carbapenems resistance is
mostly mediated by the bacterial production of carbapenemase (Codjoe and Donkor,
2017; Ye et al., 2018). The carbapenemase, blaOXA-48-like can hydrolyse carbapenem at
a low level. Hydrolysing capacity of OXA-48-like producers has been often enhanced
by the combined effects of other carbapenemases or due to porin loss (Poirel et al.,
2012; Fattouh et al., 2015; Lutgring et al., 2018). Although the isolates containing
blaNDM unlikely to be susceptible to carbapenem, four faecal NDM-producers showed
had low imipenem/meropenem MIC breakpoints (≤2 mg/l) as to previous report by
Singh-Moodley and Perovic (2016). Carbapenems’ effectivities are also destroyed by
the expression of AmpC (chromosomal or acquired) along with the presence of ESBLs
or porin mutations. The manifestation of non-carbapenemase mediated resistance
mostly reduce the effectivity of ertapenem without compromising the susceptibilities
to imipenem or meropenem, elucidating the growth of CSE in ertapenem containing
media (Codjoe and Donkor, 2017; Ye et al., 2018).
The overall findings on the patients’ demographic data and in-hospital
antibiotics usage between clinical and carriage study were consistent (Figure 3.5-
Figure 3.7, Figure 3.9; Figure 4.8; Figure 4.9, Table 4.9). This study deployed random

180
sampling for the carriage study, however, the distribution of participants in different
wards was not unform because of patients’ refusal to involve. As a considerable
number of clinical isolates were recovered from burn unit (Table 3.1), this study
approached to include at least one third of inpatients’ RSs from burn unit of DMCH.
Consequently, a total of 183 RSs from burn patients were collected (Table 4.10).
Additionally, participants’ hygiene measures were included in the dataset of carriage
study which showed that the general hygiene status was poor; 43.9% of the participants
did not have access to household supply water, and 32.1% of the participants did not
have access to water and soap in toilet (Table 4.9).
The prevalence of CRE in the community setting of Bangladesh is largely
unknown (Ahmed et al., 2019; Hasan and Rabbani, 2019). The frequency of faecal
CRE carriage among the outpatients in this study reflected the prevalence in the
community, was extremely high (12%). Showing that inpatients were more susceptible
to acquiring CRE (53.8%) than outpatients (12%) (p<0.05) (Figure 4.3). Literature
reviews suggested a varied prevalence of CRE colonisation among hospitalized
patients (ranged from 1.6% to 73%) in SA, but it is notable that the higher prevalence
is associated with the vulnerable group such as ICU-admitted or cancer patients, and
risks for faecal colonisation are similar to that of acquisition of infections such as
prolonged hospital stay, introduction of artificial medical devices, and antibiotic
exposure (Datta et al., 2015; Saseedharan et al., 2016; Mohan et al., 2017; Bharadwaj
et al., 2018; Kumar et al., 2018; Singh et al., 2018). Hospital stay more than 7 days,
and antibiotic usage were considered as a significant risk in this study (p<0.05) (Table
4.10). Like clinical study (‘Chapter 3’), a very high frequency (88.8%) of antibiotic
usage at DMCH was observed in the colonisation study from 13th May 2018 to 17th
June 2018. Interestingly, significantly associations were found between clindamycin,
cefixime, colistin, and levofloxacin usage and CRE colonisation (p<0.05) (Table 4.10).
Minimal diagnostic capacity might influence empirical antibiotic prescription in
Bangladesh wide verities, leading to colonisation of bacteria with multiple resistance
mechanisms (Shahida et al., 2016; Hasan and Rabbani, 2019). Even a very brief
successful antibiotic treatment raises the profusion of AMR genes several folds in the
gut ecosystem which perhaps persists in asymptomatic host for years or acts as an
opportunistic pathogen for severely ill or immunocompromised patients (Jakobsson et
al., 2010; Carlet, 2012). A metanalysis documented that the rate of infection

181
carbapenemase producing bacteria following colonisation varied from 0% to 89%
(Tischendorf et al., 2016; Cattaneo et al., 2018). As described before, this PhD project
conducted the clinical and carriage study at different time point (Figure 3.1; Figure
4.1). The limitation of this study is inability to estimate the direct impact of
colonisation following infections, and vice versa. Nevertheless, data demonstrated that
admission in a hospital setting like DMCH may act as an amplifier of resistance by a
combination of acquisition and increased resistant subpopulations in the gut
microbiome due to selection pressure of antibiotics (Carlet, 2012; van Schaik, 2015;
Gupta et al., 2019).
Taking account of highest frequency of blaNDM as mode of carbapenem
resistance in this study, the possibilities for the transmission of multiple antibiotic
resistance through a common means was evaluated which suggested the combination
of blaNDM-5, blaTEM-1, aadA2, rmtB, sul1, and dfrA12 among 167 isolates, and the
combination of blaNDM-1, blaOXA-1, armA, and mphE in 31 isolates (Figure 4.6; Figure
4.7). Supporting the genomic findings, significant more resistance to non-β-lactams
against faecal CRE (p<0.05) (Table 4.3) also signifies the associations of multiple
ARGs (Nikaido, 2009; Li et al., 2015). The gene, blaNDM has been frequently described
in plasmids harbouring the determinants of multi-drug resistance, such as aadA, dfrA,
mphA, APH, AAC(6')-Ib-cr, blaOXA, blaTEM (Poirel et al., 2011; Walsh et al., 2011; Khan
et al., 2017; Yoon et al., 2018). The significant linkage of blaNDM with the ARGs
encoding aminoglycosides, trimethoprim, and/or other β-lactamase among the
different species of Enterobacterales corresponded to the earlier reports, and strongly
hypothesized the spread of blaNDM due to some dominant plasmids circulating in
Bangladesh.
Faecal carriage of MDR bacteria is a potential reservoir for faeco-oral spread
of AMR in the countries with underdeveloped sanitation, poor hygiene practice,
inappropriate sewage management, and weak IPC measures in general hospitals. Poor
IPC in health settings of the countries of SA is obvious, aggravating the cross
transmission of AMR from inter-patients, and/or hospitals environments to patients
(Chereau et al., 2017). This chapter demonstrates the prevalence of CRE along with
MDR determinants at an alarming level. Health education on hygiene and sanitation,
implication of antibiotic stewardship programme, and access of essential antibiotics

182
can reduce the AMR endemicity in the health setting of the country (O’Neill, 2016;
Lee et al., 2013; Cheng et al., 2018). Periodic screening of faecal colonisation of
endemic resistance would facilitate to predict the burden of the resistance and to take
subsequent action (Ramanathan et al., 2018).

183
Section Five
Investigating Clonal Dissemination of Carbapenem-Resistant
Enterobacterales

184
5.1 Introduction
A successful MDR bacterial clone is a powerful disseminator of AMR genes.
The clone can be propagated by means of strain’s survival, expansion and spread.
Moreover, the clone possesses an array of genetic elements such as genes, integrons,
transposons, and plasmids which can be mobilised horizontally to other clones, species
or genera (Moradigaravand et al., 2017; Davin-Regli et al., 2019; Marano et al., 2019).
Hospital outbreaks resulting from successful MDR clones are often inevitable when
appropriate infection control measures are not in place (Mirande et al., 2018).
Additionally, irrational and overuse of antimicrobials facilitate the maintenance of
MDR clones in the community as well as the hospital (Barchitta et al., 2019; Tonoyan
et al., 2019).
Due to economic globalisation, there has been a considerable increase in global
mobility in last two decades including international trade. Travellers may be exposed
by a broad range of bacteria including dominant MDR clones which subsequently can
be globally disseminated. Colonisation by resistant bacteria of Enterobacterales family
in human gut is well documented. Due to genetic plasticity of the species of
Enterobacterales, they can readily acquire mobile elements from environmental
bacteria and/or transfer to medically important pathogens (Gyles et al., 2014; Hassing
et al., 2015; Hawkey, 2015; Davies and Walsh, 2018).
This chapter describes the clonality of Enterobacterales and their role in the
dissemination of carbapenem resistance at DMCH. We deployed WGS to investigate
clonal relatedness, and spatiotemporal analysis of high-risk clones for carbapenem
resistance in the hospital setting. Clones associated with clinical infections were the
main focus of interest in this study; however, clinical isolates were matched with faecal
isolates to evaluate the persistence of common transmission events. Therefore, this
chapter has achieved ‘objective #2’, ‘objective #3’, and ‘objective #5’ of this project.

185
5.2 Results
5.2.1 Screening of high-risk clones for carbapenem resistance
A comprehensive insight into the clonal relatedness among the isolates was
performed by combining the following approaches: 1. Core-genome alignment
following clustering according to the presence and absence of genes, 2. Genome-wide
SNPs analysis, and 3. MLST profiling, where appropriate.
5.2.1.1 Population structure of E. coli
In this study, we found some clusters consisted of isolates with different MLST
profiles but differed by ≤100 SNPs. The clusters below (A to G) were identified which
consisted of isolates from diverse STs, differed by ≤100 SNPs: A. ST648 (n=40),
ST2011 (n=2), ST6870 (n=1), ST8881 (n=1) and ST9666 (n=1); B. ST405 (n=14), and
ST5954 (n=3); C. ST617 (n=3), and ST4981 (n=2); D1. ST167 (n=7), ST10 (n=1);
D2. ST167 (n=53), ST1702 (n=13), and ST9668 (n=1); E. ST410 (n=11), and ST2851
(n=3); F. ST448 (n=10), and ST2083 (n=7); and G. ST224 (n=12), and ST10821 (n=1)
(Figure 5.1); however, there was no single pair of isolates from different STs differing
by ≤40 SNPs.
The most prevalent STs among clinical E. coli was ST131 (10.1%, 23/228)
followed by ST405 (9.2%, 21/228), ST648 (9.2%, 21/228), ST410 (9.2%, 21/228),
ST167 (7.9%, 18/228), ST101 (5.3%, 12/228), ST38 (3.9%, 9/228), ST448 (2.6%,
6/228), and others (41.4%, 97/228) (Figure 5.1; Figure 5.2). E. coli ST167, ST448,
ST8346, ST405, and ST648 were significantly associated with carbapenem resistance
in the clinical study (p<0.05) (Table 5.1).
Faecal E. coli were mostly carbapenem resistant as RSs were screened on
media containing vancomycin (10 mg/L), and ertapenem (2 mg/l) (Figure 4.1). Faecal
E. coli predominantly belonged to ST167 (16.4%, 48/293), ST8346 (8.9%, 26/293),
ST405 (8.2%, 24/293), ST648 (6.5%, 19/293), ST448 (6.1%, 18/293), ST410 (5.1%,
15/293), ST38 (4.8%, 14/293), ST1702 (4.4%, 13/293), ST2659 (3.4%, 10/293), and
others (36.2%, 110/293) (Figure 5.1; Figure 5.3). Likewise, faecal E. coli isolated from
outpatients (representing the community prevalence) belonged to wide range of STs.
The most frequent were the ST167 (9%), ST405 (9%), and ST648 (9%) followed by
ST226 (7.3%), ST8346 (7.3%), and others (Figure 5.3).

186
There were positive corelations between the prevalence of different E. coli
clonal types and the frequency of carbapenemase producing E. coli to pertinent clones
(r=0.662) (Figure 5.4). Faecal E. coli were excluded from the correlation analysis
because of RSs screening with ertapenem (2 mg/l) selection (Figure 4.1). The
carbapenemase alleles were distributed among several STs of E. coli; specifically,
ST167 with blaNDM-5; ST167 with blaOXA-181; ST405 with blaNDM-5; ST648 with
blaNDM-4; ST8346 with blaOXA-181; ST448 with blaNDM-5; ST448 with blaNDM-7; ST448
with blaOXA-181; ST2659 with blaNDM-4; ST101 blaNDM-7; ST1702 with blaNDM-5; and ST617
with blaOXA-181 (p<0·05) (Figure 5.5; Table 5.2).

187
Figure 5.1 ML tree generated from core-genome analysis of E. coli isolated in this study. Core-genome alignment was performed using roary
(v3.12.0). The ML tree from the core genome was built with RAxML-ng (v0.9.0.git-mpi) using a GTR evolutionary model and gamma correction
with bootstrapping. SNPs calling was performed using Snippy (v4.4.5) followed by recombination removal using Gubbins (v2.3.4) and pair-wise
SNPs calculation using pairsnp (v0.0.7). Isolates retrieved from NCBI for the phylogenetic analysis in this Figure are stated in appendix F.

188
Figure 5.2 The distribution of clinical E. coli among different clonal types. Arrow directs from high to low frequency.

189
Table 5.1 Distribution of clinical carbapenem-resistant E. coli among major clonal
types compared to carbapenem-sensitive E. coli.
CRE (n=54) CSE (n=174) p value
ST131 2 (3.7) 21 (12.1) 0.075
ST405 9 (16.7) 12 (6.9) 0.030
ST410 3 (5.6) 18 (10.3) 0.288
ST648 9 (16.7) 12 (6.9) 0.030
ST167 11 (20.4) 7 (4.0) 0.0001
ST101 4 (7.4) 8 (4.6) 0.419
ST38 2 (3.7) 7 (4.0) 0.916
ST448 5 (9.3) 1 (0.6) 0.0004
ST2659 2 (3.7) 3 (1.7) 0.386
ST617 1 (1.9) 4 (2.3) 0.845
ST224 0 (0) 4 (2.3) 0.261
ST226 0 (0) 4 (2.3) 0.261
ST8346 3 (5.6) 0 (0) 0.002
Values in parentheses indicate column percentage. Cells are highlighted whether any ST
shows significant association with CRE.

190
Figure 5.3 A. The distribution of faecal E. coli among different clonal types. Arrow directs from high to low frequency. B. The distribution of
faecal E. coli among different clonal types isolated from patients attended to OPD (heatmap is generated based on frequency of isolation). The E.
coli from RSs were screened in vancomycin (10 mg/l), and ertapenem (2 mg/l) containing media.

191
Figure 5.4 Bubble plot representing the relation between the prevalence of different E. coli clonal types and the frequency of carbapenemase
producers to pertinent clonal types. Pearson correlation coefficient (r) between two variables is 0.662. Only clinical E. coli were included in this
analysis, but isolates belonged to unknown ST (n=5) were excluded. Size of bubble is proportional to the number of carbapenemase producers.

192
Figure 5.5 The distribution of major carbapenemase alleles among different clonal types of E. coli. Isolates were grouped into other STs whether
any ST contained ≤5 carbapenemase-positive isolates. Size of bubble is proportional to the number of isolates. Both clinical and faecal E. coli were
included in this analysis.

193
Table 5.2 Comparative analysis of distribution of carbapenemase alleles among
different STs of E. coli (n=521).
NDM-1
(n=18)
NDM-4
(n=7)
NDM-5
(n=212)
NDM-7
(n=15)
OXA-181
(n=34)
ST167
(n=66)
0 (0) 0 (0) 48 (72.7) 0 (0) 8 (12.1)
p=0.100 p=0.310 p<0·0001 P=0·134 p=0.049
ST405
(n=45)
0 (0) 0 (0) 28 (62.2) 0 (0) 0 (0)
p=0.184 P=0·413 p=0.002 p=0.227 p=0.064
ST648
(n=40)
1 (2.5) 4 (10) 14 (35) 1 (2.5) 1 (2.5)
p=0.731 p<0·0001 P=0·446 P=0·881 P=0·283
ST410
(n=36)
1 (2.8) 0 (0) 12 (33.3) 0 (0) 3 (8.3)
p=0.818 p=0.468 p=0.352 p=0.284 p=0.649
ST8346
(n=29)
12 (41.4) 0 (0) 15 (51.7) 0 (0) 7 (24.1)
p<0·0001 p=0.518 p=0.213 p=0.340 p<0·0001
ST131
(n=28)
0 (0) 0 (0) 6 (21.4) 0 (0) 0 (0)
p=0.303 p=0.526 p=0.033 p=0.349 p=0.151
ST448
(n=24)
0 (0) 0 (0) 14 (58.3) 8 (33.3) 6 (25)
p=0.343 p=0.558 p=0.072 p<0·0001 p<0·0001
ST2659
(n=15)
0 (0) 2 (13.3) 7 (46.7) 0 (0) 1 (6.7)
p=0.457 p<0·0001 p=0.633 p=0.499 p=0.982
ST101
(n=14)
1 (7.1) 0 (0) 3 (21.4) 2 (14.3) 1 (7.1)
p=0.444 p=0.658 p=0.137 p=0.010 p=0.925
ST1702
(n=13)
0 (0) 0 (0) 13 (100) 0 (0) 0 (0)
p=0.490 p=0.670 p<0·0001 p=0.530 p=0.335
ST617
(n=12)
0 (0) 0 (0) 7 (58.3) 0 (0) 3 (25)
p=0.507 p=0.683 p=0.208 p=0.546 p=0.009
Values in parentheses indicate row percentage. Cells are highlighted whether any
carbapenemase allele shows statistical significance relation to respective ST.

194
5.2.1.2 Population structure of K. pneumoniae
Similar to the E. coli population, clusters (H to J) were recovered which
comprised of isolates from different STs of K. pneumoniae, differed by ≤100 SNPs.
These clonal complexes were: H. ST29 (n=7), and ST711 (n=1); I. ST16 (n=19), ST17
(n=3), and ST20 (n=2); and J. ST147 (n=21), ST1586 (n=1), and ST273 (n=1) (Figure
5.6); however, there was no pair of the isolates from different STs differed by ≤ 40
SNPs.
Clinical K. pneumoniae mostly distributed among ST23 (15·4%, 35/228),
ST15 (12·7%, 29/228), ST231 (7·9%, 18/228), ST11 (7·5%, 17/228), ST152 (5·3%,
12/228), ST147 (4·8%, 11/228), ST395 (3·9%, 9/228), ST14 (3·9%, 9/228), ST16
(3·5%, 8/228), ST307 (3·1%, 7/228), ST515 (2·6%, 6/228), and others (28·2%,
67/228) (Figure 5.7); however, significant associations of carbapenem resistance were
observed with ST16, ST231, ST11, ST515, and ST23 (p<0·05) (Table 5.3).
The clonal distribution of faecal K. pneumoniae more likely represented the
frequency among the carbapenem resistant isolates as RSs were screened on media
containing vancomycin (10 mg/L), and ertapenem (2 mg/l) (Figure 4.1). The majority
of K. pneumoniae clones from faeces were ST15 (14·8%, 12/81) followed by ST16
(13·6%, 11/81), ST147 (12·3%, 10/81), ST48 (12·3%, 10/81), ST14 (7·4%, 6/81),
ST29 (7·4%, 6/81), and others (31·6%, 26/81) (Figure 5.8). The faecal K. pneumoniae
isolated from outpatients (representing the community prevalence), associated with
carbapenem resistance distributed in a wide range of STs (Figure 5.8).
There were positive corelations between the prevalence of different K.
pneumoniae clonal types and the frequency of carbapenemase producing K.
pneumoniae to pertinent clones (r=0.963) (Figure 5.9). Faecal K. pneumoniae were
excluded from the correlation analysis because of RSs screening with ertapenem (2
mg/l) selection (Figure 4.1). Carbapenemase alleles were distributed among the
different STs of K. pneumoniae identified in this study. Significant associations were
observed between ST15 and blaNDM-1; ST15 and blaOXA-232; ST23 and blaNDM-5; ST231
and blaOXA-181; ST231 and blaOXA-232; ST231 and blaKPC-2; ST147 and blaNDM-5; ST16
and blaNDM-1; ST16 and blaOXA-181; ST11 and blaOXA-181; ST14 and blaOXA-181; ST14
and blaOXA-232; ST48 and blaNDM-5; ST395 and blaNDM-1; ST29 and blaNDM-5; ST515
and blaNDM-5 (Figure 5.10, Table 5.4).

195
Figure 5.6 ML tree generated from core-genome analysis of K. pneumoniae isolated in this study. Core-genome alignment was performed using
roary (v3.12.0). The ML tree from the core genome was built with RAxML-ng (v0.9.0.git-mpi) using a GTR evolutionary model and gamma
correction with bootstrapping. SNPs calling was performed using Snippy (v4.4.5) followed by recombination removal using Gubbins (v2.3.4) and
pair-wise SNPs calculation using pairsnp (v0.0.7). Isolates retrieved from NCBI for the phylogenetic analysis in this Figure are stated in appendix
F.

196
Figure 5.7 The distribution of clinical K. pneumoniae among different clonal types. Arrow directs from high to low frequency.

197
Table 5.3 Distribution of clinical carbapenem resistant K. pneumoniae among major
clonal types compared to CSE.
CRE (n=120) CSE (n=108) p value
ST23 24 (20) 11 (10·2) 0·04
ST15 12 (10) 17 (15·7) 0·194
ST231 15 (12·5) 3 (2·8) 0·007
ST11 14 (11·7) 3 (2·8) 0·011
ST152 6 (5) 6 (5·6) 0·851
ST147 7 (5·8) 4 (3·7) 0·454
ST14 6 (5) 3 (2·8) 0·39
ST395 6 (5) 3 (2·8) 0·39
ST16 8 (6·7) 0 (0) 0·006
ST307 2 (1·7) 5 (4·6) 0·195
ST515 6 (5) 0 (0) 0∙019
ST101 0 (0) 6 (5·6) 0·009
ST43 4 (3∙3) 0 (0) 0∙056
ST48 3 (2·5) 1 (0·9) 0·366
Values in parentheses indicate column percentage. Cells are highlighted whether any ST
shows significant association with CRE.

198
Figure 5.8 A. The distribution of faecal K. pneumoniae among different clonal types. Arrow directs from high to low frequency. B. The distribution
of faecal K. pneumoniae among different clonal types isolated from patients attended in OPD (heatmap is generated based on frequency of
isolation). The K. pneumoniae from RSs were screened in vancomycin (10 mg/l), and ertapenem (2 mg/l) containing media.

199
Figure 5.9 Bubble plot representing the relation between the prevalence of different K. pneumoniae clonal types of and the frequency of
carbapenemase producers to pertinent clonal types. Pearson correlation coefficient (r) between two variables is 0.963. Only clinical K. pneumoniae
were included in this analysis, but isolates belonged to unknown ST (n=4) were excluded. Size of bubble is proportional to the number of
carbapenemase producers.

200
Figure 5.10 The distribution of major carbapenemase alleles among different clonal types of K. pneumoniae. Isolates were grouped into other STs
whether any ST contained ≤5 carbapenemase-positive isolates. Size of bubble is proportional to the number of isolates. Both clinical and faecal K.
pneumoniae were included in this analysis.

201
Table 5.4 Comparative analysis of distribution of carbapenemase alleles among
different STs of K. pneumoniae (n=309).
NDM-1
(n=55)
NDM-5
(n=96)
OXA-181
(n=26)
OXA-232
(n=30)
KPC-2
(n=5)
ST15
(n=41)
14 (34.1) 9 (9.4) 0 (0) 12 (29.3) 0 (0)
p=0.003 p=0.176 p=0.037 p<0·0001 p=0.378
ST23
(n=35)
0 (0) 23 (65.7) 0 (0) 2 (5.7) 0 (0)
p=0.003 p<0·0001 p=0.050 p=0.397 p=0.420
ST231
(n=21)
1 (4.8) 5 (23.8) 8 (38.1) 8 (38.1) 5 (23.8)
p=0.106 p=0.457 p<0·0001 p<0·0001 p<0·0001
ST147
(n=21)
5 (23.8) 10 (47.6) 2 (9.5) 0 (0) 0 (0)
p=0.456 p=0.090 p=0.850 p=0.120 p=0.543
ST16
(n=19)
7 (36.8) 8 (42.1) 5 (26.3) 0 (0) 0 (0)
p=0.025 p=0.283 p=0.004 p=0.140 p=0.564
ST11
(n=19)
3 (15.8) 9 (47.4) 4 (21.1) 0 (0) 0 (0)
p=0.813 p=0.113 p=0.041 p=0.140 p=0.564
ST14
(n=15)
1 (6.7) 4 (26.7) 3 (20) 7 (46.7) 0 (0)
p=0.248 p=0.706 p=0.097 p<0·0001 p=0.611
ST48
(n=14)
0 (0) 11 (78.6) 0 (0) 0 (0) 0 (0)
p=0.075 p<0·0001 p=0.246 p=0.209 p=0.623
ST152
(n=12)
4 (33.3) 0 (0) 0 (0) 0 (0) 0 (0)
p=0.151 p=0.018 p=0.284 p=0.247 p=0.650
ST395
(n=9)
5 (55.6) 0 (0) 0 (0) 0 (0) 0 (0)
p=0.003 p=0.041 p=0.356 p=0.318 p=0.696
ST29
(n=7)
1 (14.3) 6 (85.7) 0 (0) 0 (0) 0 (0)
p=0.806 p=0.002 p=0.417 p=0.380 p=0.731
ST515
(n=6)
0 (0) 6 (100) 0 (0) 0 (0) 0 (0)
p=0.250 p<0·0001 p=0.453 p=0.417 p=0.751
Values in parentheses indicate row percentage. Cells are highlighted whether any
carbapenemase allele shows statistical significance relation to respective ST.

202
5.2.1.3 Population structure of other species of Enterobacterales
Core-genome analysis of Proteus spp. (n=66) divided the isolates into 15
clades, designated as A-J, and 5 more clades consisted of single isolate. One strain of
Proteus sp. (due to low quality sequence data) was not included in the analysis. Clade
D entailed with the isolates of P. mirabilis which was significantly associated with
carbapenem resistance (71.4%, 5/7) compared to having CSE (3.4%, 2/59) (p<0.05).
No Proteus spp. were identified from faeces (Figure 5.11)
Enterobacter spp. (n=55) isolated in this study were distributed into 26 known
STs and 12 isolates of unknown STs according to E. cloacae MLST scheme. The most
frequent ST was ST113 (n=11), consisted of both clinical (n=6), and faecal (n=5).
There was significant association between ST113 and CRE (40%, 10/25) than CSE
(3.3%, 1/30) (p<0.05). We did not find any other STs which comprised of more than
three isolates (Figure 5.12).
Core-genome analysis of Citrobacter spp. (n=30) split up six clades (A-F), of
which clade E consisted of more CRE (66.7%, 8/12) than CSE (27.8%, 5/18) (p<0.05).
Seven clinical isolates and six faecal isolates belonged to clade E (Figure 5.13).
Core-genome analysis of Providencia spp. (n=23) split up five clades (A-E),
of which clade C contained significantly more CRE (71.4%, 5/7) than CSE (6.3%,
1/16) (p<0.05). No Providencia spp. was identified from faeces (Figure 5.14).
S. marcescens (n=14), and M. morganii (n=12) isolated in this study were also
evaluated. Only two of S. marcescens were carbapenem resistant and isolates differed
by 35,070 SNPs. No clinical M. morganii was found to be resistant to carbapenem. An
outbreak of K. variicola at NICU of DMCH was identified which has been described
in Chapter 7.
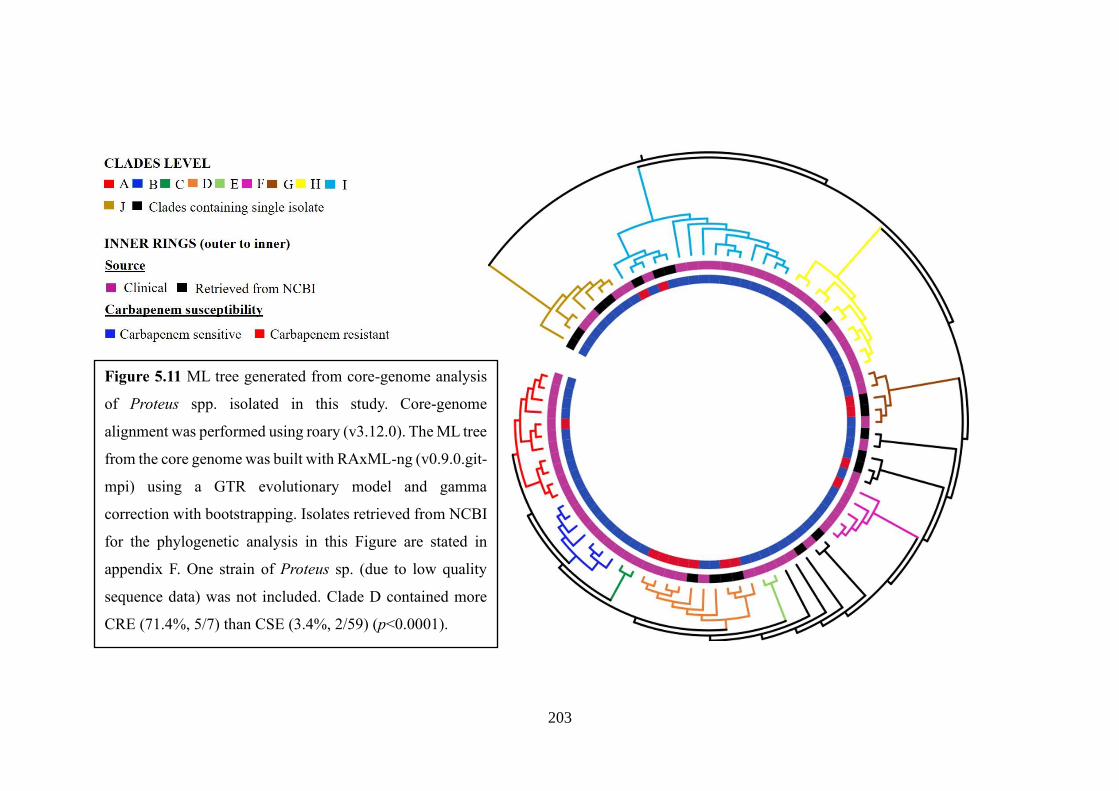
203
Figure 5.11 ML tree generated from core-genome analysis
of Proteus spp. isolated in this study. Core-genome
alignment was performed using roary (v3.12.0). The ML tree
from the core genome was built with RAxML-ng (v0.9.0.git-
mpi) using a GTR evolutionary model and gamma
correction with bootstrapping. Isolates retrieved from NCBI
for the phylogenetic analysis in this Figure are stated in
appendix F. One strain of Proteus sp. (due to low quality
sequence data) was not included. Clade D contained more
CRE (71.4%, 5/7) than CSE (3.4%, 2/59) (p<0.0001).

204
Figure 5.12 ML tree generated from core-genome analysis of
Enterobacter spp. isolated in this study. Core-genome
alignment was performed using roary (v3.12.0). The ML tree
from the core genome was built with RAxML-ng (v0.9.0.git-
mpi) using a GTR evolutionary model and gamma correction
with bootstrapping. Isolates retrieved from NCBI for the
phylogenetic analysis in this Figure are stated in appendix F.
ST113 significantly contained more CRE (40%, 10/25) than
CSE (3.3%, 1/30) (p=0.001). *Others denote either if any
isolate belonged to novel STs or any ST contained only one
isolate. Putative outbreak cluster (Eco1) is highlighted by
yellow (●).

205
Figure 5.13 ML tree generated from core-genome analysis of
Citrobacter spp. isolated in this study. Core-genome alignment
was performed using roary (v3.12.0). The ML tree from the core
genome was built with RAxML-ng (v0.9.0.git-mpi) using a GTR
evolutionary model and gamma correction with bootstrapping.
Isolates retrieved from NCBI for the phylogenetic analysis in
this Figure are stated in appendix F. Clade E significantly
contained more CRE (66.7%, 8/12) than CSE (27.8%, 5/18)
(p=0.035). Putative outbreak cluster (C1) is highlighted by
yellow (●).
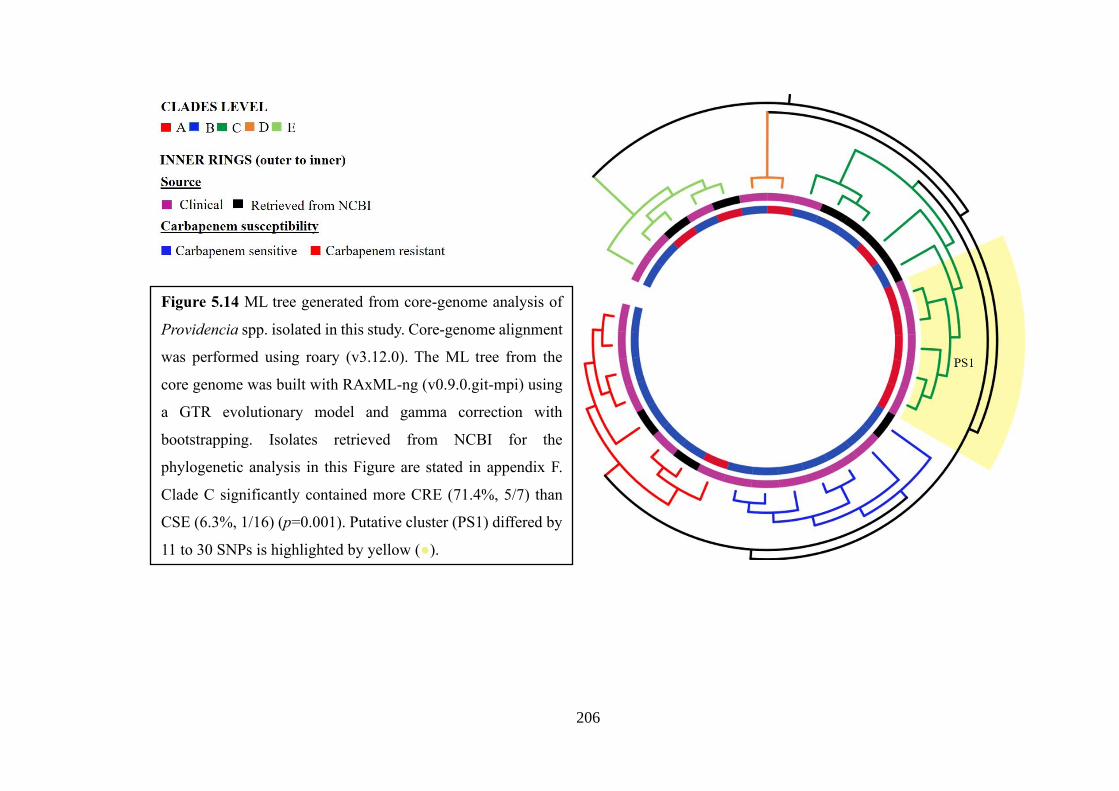
206
Figure 5.14 ML tree generated from core-genome analysis of
Providencia spp. isolated in this study. Core-genome alignment
was performed using roary (v3.12.0). The ML tree from the
core genome was built with RAxML-ng (v0.9.0.git-mpi) using
a GTR evolutionary model and gamma correction with
bootstrapping. Isolates retrieved from NCBI for the
phylogenetic analysis in this Figure are stated in appendix F.
Clade C significantly contained more CRE (71.4%, 5/7) than
CSE (6.3%, 1/16) (p=0.001). Putative cluster (PS1) differed by
11 to 30 SNPs is highlighted by yellow (●).

207
5.2.2 Investigating possible transmissibility in putative outbreak clusters
associated with carbapenem resistance
We used combination of genomic approach and epidemiological data to
identify putative transmission clusters. Cut-offs zero to 20 SNPs were set out to screen
possible transmission (Snitkin et al., 2012; De Maio et al., 2016; Moradigaravand et
al., 2016; Moradigaravand et al., 2017; Marsh et al., 2019). In this study, the clusters
of interest were the clusters comprised of at least one clinical isolate, and at least one
CRE.
We found 10 putative outbreak clusters of E. coli, of which two clusters (EC1:
2 to 10 SNPs differences, and EC2: one SNP difference) belonged to ST167, one
cluster to ST448 (EC3: 1 to 2 SNPs differences), one cluster (EC4: 1 to 18 SNPs
differences [clinical and faecal isolates by 20 SNPs]) to ST8346, two clusters (EC5: 3
to 9 SNPs differences, and EC6: 4 to 8 SNPs differences [clinical and faecal isolates
differed by 8]) to ST405, one in ST5954 (EC7: 3 to 12 SNPs differences [clinical and
faecal isolates differed by 12]), and three clusters (EC8: 18 SNPs differences, EC9: 0
to 10 SNPs differences, and EC10: 6 SNPs differences) to ST648. Four of the clusters
of E. coli contained closely related isolates from both clinical and faecal specimens
(Figure 5.15). The largest cluster of E. coli was EC9, consisting of seven clinical
isolates (between 18th Feb 2017 to 8th May 2017). Epidemiological assessment showed
overlapping of patients’ hospital stay correlating with clustering of related isolates and
that the possible transmission was not confined to a single ward (Figure 5.16).
Similarities of carbapenemases were among the isolates in EC1, EC2, EC3, EC4, EC6,
EC7, EC9 and EC10. However, EC8 and EC9 consisted of isolates with varied
carbapenem resistance patterns. E4, EC5, and EC9 contained some isolates without
any carbapenemase gene (Figure 5.17-Figure 5.21).
Fourteen putative outbreak clusters were identified in K. pneumoniae, of which
three clusters were found in ST15 (KP1: 1 to 7 SNPs differences [faecal and clinical
isolates differed by 3 SNPs], KP2: 1 to 2 SNPs differences, and, KP3: 8 SNPs
difference), one in ST14 (KP4: 3 SNPs differences), one in ST23 (KP5: 0 to 18 SNPs
differences), two in ST231 (KP6: 14 SNPs, and KP7: 16 to 20 SNPs differences), two
in ST16 (KP8: 10 to 20 SNPs differences [clinical and faecal isolates differed by 10],
and KP9: 1 to 4 SNPs differences), one in ST515 (KP10: 4 to 13 SNPs differences),

208
one in ST11 (KP11: 9 to 14 SNPs differences), one in ST395 (KP12: 2 to 18 SNPs
differences), one in ST147 (KP13: 16 SNPs differences), and one in ST152 (KP14: 2
to 13 SNPs differences) (Figure 5.22). The largest cluster in this study (KP5) was
found in ST23 which was composed of 30 clinical isolates (between 31st Oct 2016 to
17th Aug 2017) (Figure 5.22; Figure 5.23). We recovered two more sizable clusters of
17 (KP1) and 8 (KP8) isolates in K. pneumoniae ST15 (between 16th Dec 2016 to
2018) and ST16 (between 18th Mar 2017 to 2018), comprising both clinical and faecal
isolates (Figure 5.24; Figure 5.25). None of the large cluster in K. pneumoniae was
ward specific; however, there were linkages between the patients’ hospital stay and
recovery of the isolates. Communalities of carbapenem resistance variants were found
in the clusters of K. pneumoniae; however, KP8, KP9, KP12, and KP14 also contained
isolates with diverse NDM variants, and KP1, KP5, and KP14 possessed isolates
without any carbapenemase genes (Figure 5.26). Interestingly, isolates belonged to
KP1 (ST15) harboured carbapenemases three variations (only blaNDM-1, only blaOXA-
181, and combination of blaNDM-1 and blaOXA-181) (Figure 5.24).
A cluster consisted of nine isolates from both clinical infections and faeces
were retrieved in E. cloacae, belonged to ST113 (Eco1: 1 to 7 SNPs differences
[clinical and faecal isolates differed by 6]) (between 16th Nov 2016 to 15th July 2017).
Interestingly, two of isolates in this cluster were identified from faeces of patients
attending the outpatient department (OPD) along with the remaining seven strains
from different wards at DMCH (Figure 5.12; Figure 5.25). Eight of the isolates in the
clusters harboured blaNDM-5, and one carried a novel NDM variant. Two small clusters
consisted of two and three clinical isolates of C. rodentium and (C1: 5 SNPs
differences) and P. stuartii (PS1: 11 to 12 SNPs differences), respectively were also
found (Figure 5.13; Figure 5.14).

209
Figure 5.15 Core-genome SNP tree of isolates belonged to major
clones of E. coli associated with carbapenem resistance and
screening of outbreaks in E. coli. SNPs calling followed by
alignment of core SNPs was performed using Snippy (v4.4.5).
The ML tree was built with RAxML-ng (v0.9.0.git-mpi) using a
GTR evolutionary model, and gamma correction with
bootstrapping. Recombination removal using Gubbins (v2.3.4),
and pair-wise SNPs calculation using pairsnp (v0.0.7). Outbreaks
were suspected if the isolates in a cluster differed by ≤20 SNPs.
Putative outbreak clusters are highlighted by alternative purple
(●) and yellow ( ) and designated as EC1 to EC10. STs of
respective isolates have been labelled at clade level. Branch
symbols, outer ring in the phylogenetic tree denote source of
isolation, and carbapenem susceptibility of respective isolates,
respectively. Pink (■) indicates clinical isolates, and green (■)
indicates faecal isolates. Blue (■) denotes carbapenem sensitive,
and red (■) denotes carbapenem resistant. Clusters consisted of
both clinical, and faecal isolates are marked by red symbol (֍).
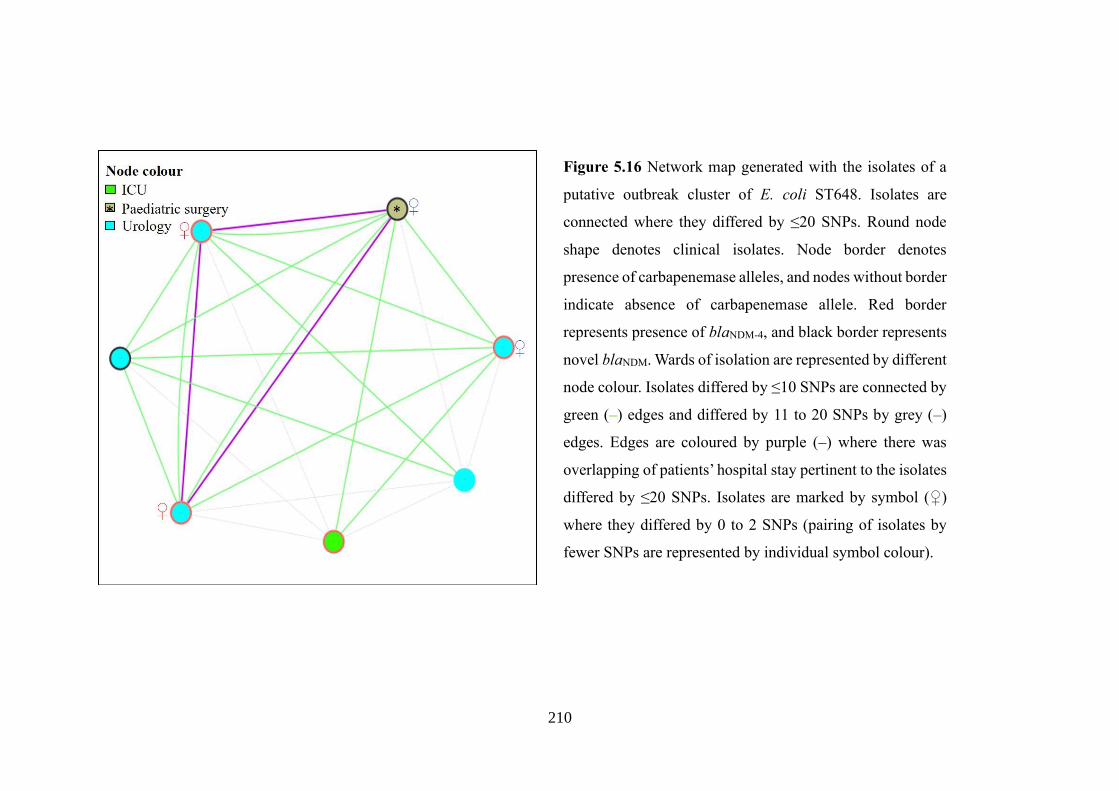
210
Figure 5.16 Network map generated with the isolates of a
putative outbreak cluster of E. coli ST648. Isolates are
connected where they differed by ≤20 SNPs. Round node
shape denotes clinical isolates. Node border denotes
presence of carbapenemase alleles, and nodes without border
indicate absence of carbapenemase allele. Red border
represents presence of blaNDM-4, and black border represents
novel blaNDM. Wards of isolation are represented by different
node colour. Isolates differed by ≤10 SNPs are connected by
green (–) edges and differed by 11 to 20 SNPs by grey (–)
edges. Edges are coloured by purple (–) where there was
overlapping of patients’ hospital stay pertinent to the isolates
differed by ≤20 SNPs. Isolates are marked by symbol (♀)
where they differed by 0 to 2 SNPs (pairing of isolates by
fewer SNPs are represented by individual symbol colour).

211
Figure 5.17 Time calibrated phylogenetic tree generated from of E. coli genomes belonged to ST167 along with closely related isolates from other
STs (ST10, ST1702, and novel allele) (n=97). PSU, paediatric surgery. Isolates retrieved from NCBI for the phylogenetic analysis in this Figure
are stated in appendix F.

212
Figure 5.18 Time calibrated phylogenetic tree generated from of E. coli genomes belonged to ST448 along with closely related isolates from other
STs (ST2083, ST1702, and novel allele) (n=45). PSU, paediatric surgery. Isolates retrieved from NCBI for the phylogenetic analysis in this Figure
are stated in appendix F.

213
Figure 5.19 Time calibrated phylogenetic tree generated from of E. coli genomes belonged to ST8346 (n=32). E. coli ST8346 was recognised as
an emerging clone in Bangladesh. A putative outbreak cluster (EC4) consisted of clinical, and faecal isolates is marked by red, and a cluster
consisted of faecal isolates (differed by ≤10) only is marked by blue. PSU, paediatric surgery. Isolates retrieved from NCBI for the phylogenetic
analysis in this Figure are stated in appendix F.

214
Figure 5.20 Time calibrated phylogenetic tree generated from of E. coli genomes belonged to ST405 along with closely related isolates from
ST5954 (n=77). PSU, paediatric surgery. Isolates retrieved from NCBI for the phylogenetic analysis in this Figure are stated in appendix F.

215
Figure 5.21 Time calibrated phylogenetic tree generated from of E. coli genomes belonged to ST648 along with closely related isolates from other
STs (ST2011, ST6870, and ST9666) (n=57). PSU, paediatric surgery. Isolates retrieved from NCBI for the phylogenetic analysis in this Figure are
stated in appendix F.

216
Figure 5.22 Core-genome SNP tree of isolates of major clones of
K. pneumoniae associated with carbapenem resistance, and
screening of outbreaks in K. pneumoniae. SNPs calling followed
by alignment of core SNPs was performed using Snippy (v4.4.5).
The ML tree was built with RAxML-ng (v0.9.0.git-mpi) using a
GTR evolutionary model, and gamma correction with
bootstrapping. Recombination removal using Gubbins (v2.3.4),
and pair-wise SNPs calculation using pairsnp (v0.0.7). Outbreaks
were suspected if the isolates in a cluster differed by ≤20 SNPs.
Putative outbreak clusters are highlighted by alternative purple
(●) and yellow (●) and designated as KP1 to KP14. STs of
respective isolates have been labelled at clade level. Branch
symbols, outer ring in the phylogenetic tree denote source of
isolation, and carbapenem susceptibility of respective isolates,
respectively. Pink (■) indicates clinical isolates, and green (■)
indicates faecal isolates. Blue (■) denotes carbapenem sensitive,
and red (■) denotes carbapenem resistant. Clusters consisted of
both clinical, and faecal isolates are marked by red symbol (֍).

217
Figure 5.23 Network map generated with the isolates of an
outbreak cluster of K. pneumoniae ST23. Isolates are
connected where they differed by ≤20 SNPs. Round node
shape denotes clinical isolates. Node border denotes
presence of carbapenemase alleles, and nodes without
border indicate absence of carbapenemase allele. Green
border represents presence of blaNDM-5. Wards of isolation
are represented by different node colour. Isolates differed
by ≤10 SNPs are connected by green (–) edges and differed
by 11 to 20 SNPs by grey (–) edges. Edges are coloured by
purple (–) where there was overlapping of patients’
hospital stay pertinent to the isolates differed by ≤20 SNPs.
Isolates are marked by symbol (♀) where they differed by
0 to 2 SNPs (pairing of isolates by fewer SNPs are
represented by individual symbol colour).

218
Figure 5.24 Network map generated with the isolates of a putative
outbreak cluster of K. pneumoniae ST15. Isolates are connected
where they differed by ≤20 SNPs. Round node shape denotes
clinical isolates, and diamond shape indicates faecal isolates.
Node border denotes presence of carbapenemase alleles, and
nodes without border indicate absence of carbapenemase allele.
Red border represents presence of blaNDM-1, blue border denotes
blaOXA-181, and red border with increased width represents the
presence of both blaNDM-1 and blaOXA-181. Wards of isolation are
represented by different node colour. Isolates differed by ≤10
SNPs are connected by green (–) edges and differed by 11 to 20
SNPs by grey (–) edges. Edges are coloured by purple (–) where
there was overlapping of patients’ hospital stay pertinent to the
isolates differed by ≤20 SNPs. Isolates are marked by symbol (♀)
where they differed by 0 to 2 SNPs (pairing of isolates by fewer
SNPs are represented by individual symbol colour).

219
Figure 5.25 Network map generated with the isolates of putative outbreak cluster of K. pneumoniae ST16 [A], and E. cloacae ST113 [B]. Isolates
are connected where they differed by ≤20 SNPs. Round node shape denotes clinical isolates, and diamond shape indicates faecal isolates. Node
border denotes presence of carbapenemase alleles, and nodes without border indicate absence of carbapenemase allele. Red border represents
presence of blaNDM-1, green border denotes blaNDM-5, and black border represents novel blaNDM. Wards of isolation are represented by different node
colour. Isolates differed by ≤10 SNPs are connected by green (–) edges and differed by 11 to 20 SNPs by grey (–) edges. Edges are coloured by
purple (–) where there was overlapping of patients’ hospital stay pertinent to the isolates differed by ≤20 SNPs. Isolates are marked by symbol (♀)
where they differed by 0 to 2 SNPs (pairing of isolates by fewer SNPs are represented by individual symbol colour).

220
Figure 5.26 ML tree generated from core-genome SNP alignment of K. pneumoniae isolates found in putative outbreak clusters. SNPs calling
followed by alignment of core SNPs was performed using Snippy (v4.4.5). The ML tree was built with RAxML-ng (v0.9.0.git-mpi) using a GTR
evolutionary model, and gamma correction with bootstrapping. Putative outbreak clusters are highlighted by alternative purple (●) and yellow (●).

221
5.2.3 Time-calibrated evolutionary analysis of high-risk clones emerged with
carbapenem resistance
Time-scale phylogenetic analysis was performed using BEAST with the major
clones of E. coli (ST167, ST448, ST8346, ST405, and ST648), and K. pneumoniae
(ST15, ST23, and ST16) associated with carbapenem resistance to predict the temporal
trajectory of the clone in the hospital and to estimate the date of the most recent
common ancestor (TMRCA). The analysis performed with K. pneumoniae ST23 was
not included due to incoherent BEAST output.
Bayesian phylogenetic analysis suggested that the populations of E. coli
ST167, ST448, ST8346, ST405, and ST648 had TMRCAs around 1978, 1923, 2007,
1920, and 1998, respectively (including isolates from NCBI). Dates of TMCRAs for
DMCH-only subclades ranged from 2004 to 2017 (ST167), 2009 to 2017 (ST448),
2013 to 2014 (ST8346), 1990 to 2017 (ST405), and 2006 to 2013 (ST648). It was
predicted that E. coli ST167 was evolved from ST10 and diverged into two clades
from the TMRCA on 1898 (Figure 5.17). The major putative outbreak clusters
associated with carbapenem resistance in E. coli, EC9 (ST648), and EC4 (ST8346)
were predicted to have emerged in the hospital between 2014 and 2015 (Figure 5.17-
Figure 5.21). The mean clock rates per site per year were 6 x 10⁻⁷ for ST167 (along
with ST10, ST1702, and novel allele), 6.9 x 10⁻⁷ for ST448 STs (along with S2083,
ST1702, and novel allele), 9.3 x 10⁻⁷ for ST8346, 2.5 x 10⁻⁷ for ST405 (along with
ST5954), and 7.2 x 10⁻⁷ for ST648 (along with ST2011, ST6870, and ST9666).
E. coli ST8346 was shown to be an emerging high-risk clone for the
dissemination of carbapenem resistance at DMCH. The dated phylogenetic tree
revealed that ST8346 population diverged into clades around 2007 (Figure 5.19). One
clade evolved with the acquisition of blaNDM-5 and blaOXA-181, and this clade included
two clinical isolates differed by 18 SNPs. The other clade progressed with the
acquisition of blaNDM-1, blaNDM-5, and blaOXA-181. A faecal cluster of six blaNDM-1-
positive isolates possess ≤10 SNPs (Figure 5.19).
TMRCAs for K. pneumoniae ST15, and ST16 corresponded to 1980, and 1932,
accordingly (including isolates from NCBI). Dates of TMCRAs for DMCH-only
subclades ranged from 1998 to 2016 (ST15), and 2009 to 2007 (ST16). ST15, and
ST16 included substantial outbreak clusters, KP1, and KP8 were predicted to have

222
been introduced into the DMCH around 2014 (Figure 5.27; Figure 5.28). The mean
clock rates per site per year were 2.8 x 10⁻⁷ for ST15, and 6.3 x 10⁻⁷ for ST16.

223
Figure 5.27 Time calibrated phylogenetic tree generated from of K. pneumoniae genomes belonged to ST15 along with a closely related isolate of
novel allele (n=54). Isolates retrieved from NCBI for the phylogenetic analysis in this Figure are stated in appendix F.

224
Figure 5.28 Time calibrated phylogenetic tree generated from of K. pneumoniae genomes belonged to ST16 (n=37). Isolates retrieved from NCBI
for the phylogenetic analysis in this Figure are stated in appendix F.

225
5.2.4 Impact of high-risk clone on patients’ outcome
The impact of high-risk clones was assessed for in-hospital 30-days mortality.
Statistical significance was observed for E. coli ST8346 (p<0.05) (Table 5.5), but the
frequency of ST8346 among clinical E. coli was very low (n=3). No significant
associations were found between other STs of E. coli or any ST of K. pneumoniae and
in-hospital 30-days mortality (Table 5.5; Table 5.6).

226
Table 5.5 Comparative analysis to assess the associations of in-hospital 30-days
mortality among major clonal types of clinical E. coli.
30-days mortality
(n=23)
Competing outcome
(n=192)
p value
ST131 5 (21∙7) 18 (9∙4) 0∙070
ST405 0 (0) 19 (9∙9) 0∙114
ST410 2 (8∙7) 16 (8∙3) 0∙953
ST648 1 (4∙3) 20 (10∙4) 0∙354
ST167 1 (4∙3) 17 (8∙9) 0∙461
ST101 1 (4∙3) 11 (5∙7) 0∙785
ST38 2 (8∙7) 7 (3∙6) 0∙253
ST448 2 (8∙7) 4 (2∙1) 0∙069
ST2659 1 (4∙3) 3 (1∙6) 0∙350
ST617 0 (0) 5 (2∙6) 0∙434
ST224 0 (0) 4 (2∙1) 0∙485
ST226 0 (0) 4 (2∙1) 0∙485
ST8346 2 (8∙7) 1 (0∙5) 0∙002
Patients discharged alive or in-hospital mortality after 30 days was used as competing
outcome variable. Patients with DAMA (n=13) were excluded from the outcome
analysis. Values in parentheses indicate column percentage. Cells are highlighted if
statistical significance was observed in relation to respective ST.
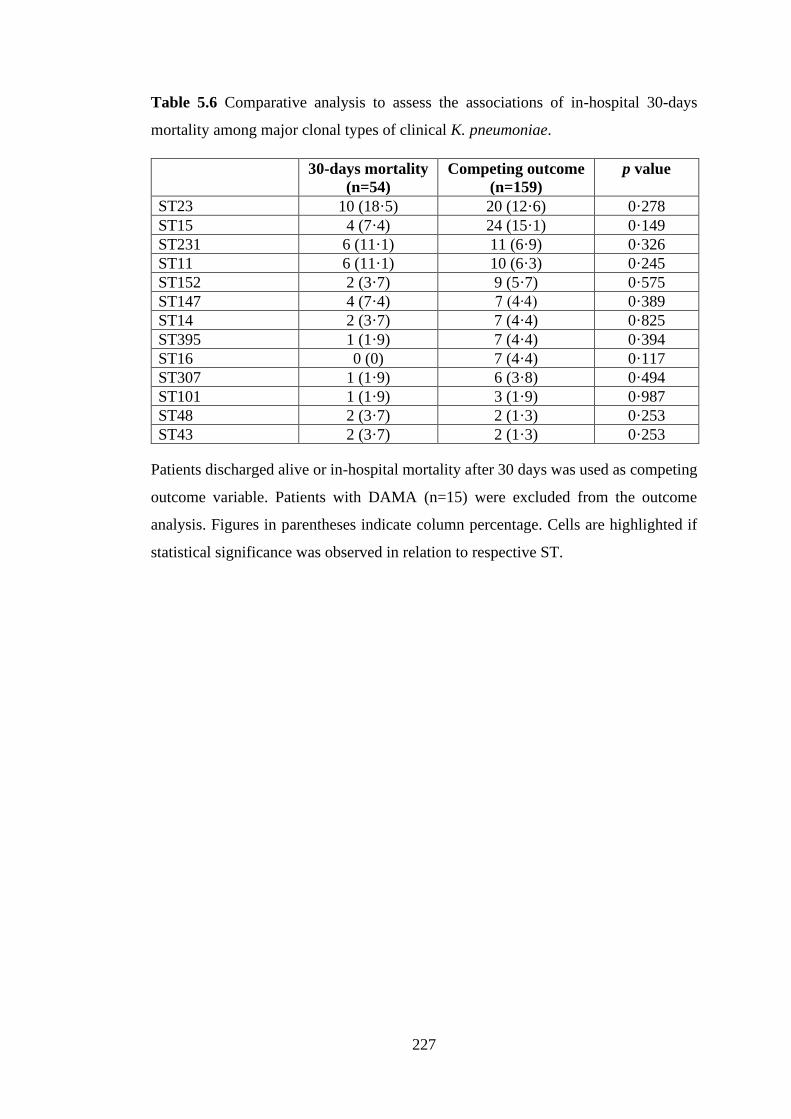
227
Table 5.6 Comparative analysis to assess the associations of in-hospital 30-days
mortality among major clonal types of clinical K. pneumoniae.
30-days mortality
(n=54)
Competing outcome
(n=159)
p value
ST23 10 (18·5) 20 (12·6) 0·278
ST15 4 (7·4) 24 (15·1) 0·149
ST231 6 (11·1) 11 (6·9) 0·326
ST11 6 (11·1) 10 (6·3) 0·245
ST152 2 (3·7) 9 (5·7) 0·575
ST147 4 (7·4) 7 (4∙4) 0·389
ST14 2 (3·7) 7 (4·4) 0·825
ST395 1 (1·9) 7 (4·4) 0·394
ST16 0 (0) 7 (4·4) 0·117
ST307 1 (1·9) 6 (3·8) 0·494
ST101 1 (1·9) 3 (1·9) 0·987
ST48 2 (3·7) 2 (1·3) 0·253
ST43 2 (3·7) 2 (1·3) 0·253
Patients discharged alive or in-hospital mortality after 30 days was used as competing
outcome variable. Patients with DAMA (n=15) were excluded from the outcome
analysis. Figures in parentheses indicate column percentage. Cells are highlighted if
statistical significance was observed in relation to respective ST.

228
5.3 Discussion
The global dissemination of CRE has been propagated either by transfer of
mobile element carrying carbapenemase genes among a wide array of species or clonal
spread of bacteria harbouring the resistance determinants (Hassing et al., 2015;
Hawkey, 2015; Moradigaravand et al., 2017; Davin-Regli et al., 2019; Marano et al.,
2019). In this study, certain clones of E. coli (ST167, ST448, ST8346, ST405, and
ST648) and K. pneumoniae (ST16, ST231, ST11, ST515, and ST23) had significant
associations with carbapenem resistance (p<0·05) (Table 5.1; Table 5.2; Table 5.4;
Table 5.5). Chapter 3 and 4 have describe the molecular epidemiology of carbapenem
resistance in Bangladesh. The most prevalent carbapenem resistance mechanism in
this study was the variants of blaNDM followed by blaOXA-181 (Table 3.5; Table 4.3).
Previous data suggested a strong association of particular resistance patterns with the
clonal backgrounds. ST167 of E. coli, and ST11, ST14, ST15, ST23, ST147 of K.
pneumoniae have been reported episodically as the frequent host of blaNDM (Huang et
al., 2016; Wu et al., 2019). Our data suggested that the frequency of carbapenem
resistance in a certain STs depend on the overall burden of said clone in clinical
infections (Figure 5.4; Figure 5.9). Nevertheless, clinical E. coli ST131 was inversely
related to carbapenem resistance (p<0·05) (Table 5.1; Table 5.2). E. coli ST131 is an
epidemic high-risk clone for the dissemination of many resistance gene, particularly
for blaCTX-M-15, however, the incidence of blaNDM in the population of E. coli ST131
happened less likely (Peirano et al., 2014; Chen et al., 2019). Only few data from
Bangladesh are available to predict about the prevalent E. coli clonal types in
community acquired infections (CAI) or healthy human gut and in the environment
and no data available for the K. pneumoniae. The previous studies mostly described
the associations of E. coli clonal types with several resistance mechanisms such as
blaCTX-M or blaNDM, and the clonal diversity was found to be very high (Hasan et al.,
2012; Haque et al., 2014; Rashid et al, 2015; Toleman et al., 2015; Montealegre et al.,
2020). This project found the associations of blaNDM with E. coli ST167, ST405,
ST648, and ST8346 among the outpatients’ faecal colonisation which were consistent
with the data from the hospitalised patients (Figure 5.2; Figure 5.3; Figure 5.17; Figure
5.19; Figure 5.20; Figure 5.21). Toleman et al. (2015) also reported the high level of
environmental contamination of blaNDM in Bangladesh which invariably recovered
from E. coli ST405, ST648, and ST101. A possible link of spread of blaNDM through

229
clonal lineage between hospital and community is obvious in Bangladesh. Time-
phylogenetic analysis of some high-risk clones for carbapenem resistance (including
isolates from this study and NCBI isolates) indicated that the clones did not form
locally, however, established gradually, and expanded. E. coli ST405 and K.
pneumoniae ST15 were found to be old clones at DMCH, subclades containing local
isolates emerged on 1990 and 1998, respectively, and E. coli, ST8346 was predicted
to be a newly formed high-risk clone for carbapenem resistance (local clades were
formed between 2013 and 2014) (Figure 5.17-Figure 5.21; Figure 5.27; Figure 5.28).
The mean mutation rates of these clones (2.5 x 10⁻⁷ to 9.3 x 10⁻⁷ site/year) were
consistent with previous reports (Duchêne et al., 2016; Gibson et al., 2018). Plasmid
transfer/mutations can result in resistance from antibiotic pressure but may possess a
fitness costs; however, secondary compensatory mutation can occur which can
alleviate the fitness cost without compromising resistance (Melnyk et al., 2015;
Hernando-Amado et al., 2017). Therefore, it is possible, that the aforementioned
clones have been established in these clinical and community settings through
compensatory mutations.
There is no predefined cut-off of SNP difference for isolates to be considered
as the same outbreak. Isolates with fewer SNPs differences can explain putative
transmission events of an outbreak by integrating epidemiological information
(Snitkin et al., 2012; Moradigaravand et al., 2016; Moradigaravand et al., 2017; Marsh
et al., 2019). The most possible transmission events were tracked in this study with
SNPs cut-offs of ≤20 followed by merging of epidemiological and genomic data.
Clonal transmissions were found to be higher with K. pneumoniae (KP1 to KP14) than
E. coli (EC1 to EC9) (Figure 5.15; Figure 5.22). Moreover, the largest cluster in this
study was KP5 followed by KP1, belonged to K. pneumoniae ST23, and ST15,
respectively (Figure 5.22; Figure 5.23; Figure 5.24). K. pneumoniae was reported
previously as an extremely transmissible organism and more prone to cause outbreak
than other species (Gurieva et al., 2018; Ludden et al., 2020). The remaining
considerable larger clusters belonged to K. pneumoniae ST16, E. coli ST648, ST8346,
and E. cloacae ST113 (Figure 5.15; Figure 5.22; Figure 5.25). The combined
epidemiological and genomic insights inferred the following probable transmission
events: 1. Clusters in common ward, overlapping of patients’ hospital stay, and isolates
with the SNPs difference of ≤20 was the suggestive of sequential patient-to-patient

230
transmission 2. Isolates differed by very few SNPs difference (0 to 2) along with the
criteria in #1 suggested the sequential transmission or concurrent acquisition of
identical clone from a common source. The major clusters, KP5 (Figure 5.23), KP1
(Figure 5.24), EC9 (Figure 5.16), and Eco1 (Figure 5.25) might had such kind of
transmission event. 3. Clusters distributed in different wards indicated the probable
transmission through health care workers or usage of common device by the patients
of different wards. 4. This study did not investigate the role of carrier state during
clinical outbreak. The carrier might be the patients infected with outbreak isolates,
other patients, patients’ care givers or the health care workers (Hawkey, 2015;
Cimmino et al., 2016; Shahida et al., 2016; Sood and Perl, 2016). The clinical and
colonisation studies were undertaken about a year interval; however, the analysis
revealed the isolates both of clinical and faecal origin with ≤20 SNP gap (EC4, EC6,
EC7, KP1, and Eco1 (figure 5.15; Figure 5.22; Figure 5.25), suggested the
continuation of putative outbreak for a protracted period of time. Perhaps the
involvement of pre-existing exogenous source along with sequential patient-to-patient
transmission can be responsible for the occurrences (Roisin et al., 2016). 5. The
limitation of the study is that the linkage of the putative outbreak with hospital
environment was not explored. Nevertheless, major clusters presumed to be existed at
DMCH for a long time. Time-calibrated phylogeny predicted that TMRCAs for the
outbreak cluster, EC9 (ST648), and EC4 (ST8346) corresponded to around 2015
(Figure 5.17-Figure 5.21), and KP1 (ST15), and KP8 (ST16) to between 2014 and
2015 (Figure 5.27; Figure 5.28). The intervals between the first and last case enrolled
in this study with the major outbreak clusters were: 17 months for KP1, 14 months for
KP8, 11 months for KP5, 8 months for Eco1, and 6 months for EC9. 6. We found
variation of carbapenemase alleles in putative outbreak clusters (Figure 5.17-Figure
5.26) which signifies possible horizontal acquisition of new resistance gene during the
event of outbreak. However, certain carbapenemase alleles in this study were clustered
significantly in some specific STs (Table 5.3; Table 5.6; Figure 5.5; Figure 5.10) which
is suggestive of their likely spread of carbapenem resistance by clonal expansion.
Hospital outbreaks enhance the transmissibility of pathogens among patients,
patients to health workers, and/or within the hospital environment. Hospital outbreaks
can increase the clinical burden of successful MDR clones which readily can spread
between/within hospitals, community via faecal carriage, and between countries

231
(Koornhof et al., 2001; Zahar et al., 2014; Hassing et al., 2015; Hawkey, 2015;
Cimmino et al., 2016; Sood and Perl, 2016). This study estimated significant
association of 30-days mortality with E. coli ST8346 (Table 5.5). Therefore, E. coli
ST8346 emerged as high-risk clone for high mortality and carbapenem resistance at
DMCH (Table 5.1). Although this study did not find any significant association of
mortality with any other ST (Table 5.5; Table 5.6), radical outbreak management and
improved IPC measures can significantly reduce the over burden of AMR in clinical
settings (Woodford et al., 2011; Zahar et al., 2014; O’Neill, 2016; Sood and Perl, 2016;
Babu et al., 2017).

232
Section Six
Investigating the Spread of New-Delhi metallo-β-lactamase due
to Horizontal Gene Transfer

233
6.1 Introduction
Plasmids are circular extrachromosomal DNA, found in wide range of
microorganisms, with the ability to exchange genetic information between bacteria.
Some plasmids are ‘non-conjugative’; however, many plasmids are transmissible by
conjugation, and therefore, influence bacterial evolution (Branger et al., 2019;
Shintani et al., 2019). The unique characteristics of plasmids are that plasmids
replicate by autonomous self-controlled mechanisms, constituting a substantial
amount of the total genetic content of an organism. Plasmid can import and deliver
genes as well by means of transposition though IS or transposons, and integrons
(Partridge et al., 2018). Acquisition of plasmids can benefit the host bacteria, but
plasmid replication and gene expression impose a general metabolic burden in the host,
leading to ascendancy of the susceptible bacteria over resistant ones in the absence of
selection. However, the fitness costs in the host are alleviated over time through the
compensatory mutations in the presence of selection. Therefore, plasmids are
generally persisted in the bacterial population regardless of selective pressure. Post-
segregational killing of plasmid-free cells during the cell division by the plasmid-
encoded addiction system promote the maintenance of plasmid from generation to
generation (Melnyk et al., 2015; Hernando-Amado et al., 2017; Tsang, 2017).
Transposons (Tns) or ‘jumping gene’ are DNA elements which can move from
the DNA molecule to other places on the same DNA or other DNA molecules. The
transposition events can be manifested by either cut-and-paste, rolling circle, or self-
synthesizing mechanism. Transposons can be broadly classified into class I (RTns)
and class II (DNA Tns). The role of RTns in the development of AMR is yet to be
investigated. DNA Tns have been reported widely in the association of AMR. Four
categories of DNA Tns such as ‘IS’, ‘composite Tns’, ‘non-composite Tns’ (Tn3
family), and ‘transposable phage Mu’ have been described. ISs are the smallest genetic
elements with the length of less than 2500 bp. The components of IS element include
an enzyme, transposase, and inverted repeats (IRs). The presence of IS elements in
plasmids, composite Tns, and bacteriophage facilitates the spread of AMR. Composite
Tns are composed of more than one ISs and an array of genes in between two ISs.
Non-composite Tns do not terminate with IS elements rather the gene containing
region is flanked by IRs only, capable of mobilising more genes than the composite
transposons. Transposable phage Mu differs from other Tns in term of transmission

234
mechanism, which involve bacterial acquisition of resistance genes by means of
lysogenic cycle (Babakhani and Oloomi, 2018; Partridge et al., 2018).
Integrons are bacterial genetic elements, which can promote the acquisition and
expression of genes embedded in gene cassettes by site-specific recombination. The
components of integrons composed of IntI (encode integrase causes integration and
excision of genes in gene cassettes), attI site (attachment/recombination site where the
gene cassettes insert), and promotor region (expression of genes in gene cassettes).
Gene cassettes are small, discreate, non-repetitive, mobile genetic element, consist of
specific recombination site, called attC (also known as 59 base element) and
promotorless ORF which might encode resistance or virulence determinants. Gene
cassettes can exist as free circular molecule and can mobilise from genetic site to other
(Partridge et al., 2018).
The mode of HGT contributes a pivotal role in the spread of AMR in clinical
setting (San Millan, 2018; Conlan et al., 2019). Understanding the genetic traits of
plasmids has been regarded as powerful tool for epidemiological surveillance of AMR.
The well accepted epidemiological categorisation of plasmid includes incompatibility
(Inc) typing which was developed based on variation of replication controls.
Incompatibility is defined as the inability of two related plasmids to be propagated
stably in the same cell line. Therefore, only compatible plasmid existed in
transconjugants (Rozwandowicz et al., 2018). Long read sequencing such as PacBio
or Oxford Nanopore are the confirmatory approach for full-blown plasmid
characterization, providing an insight of epidemic plasmids and dominant
transposition spreading high-end resistance. The genomic details would widen future
research prospects to combat AMR (Crofts et al., 2017; Berbers et al., 2020).
Given the high prevalence of blaNDM (180/643, 28%) as a mechanism of
carbapenem resistance in Enterobacterales infections in Bangladeshi health setting,
and followed by the recovery of 44.5% (312/700) NDM-positive Enterobacterales
from faecal carriage, a set of NDM-positive Enterobacterales (n=134) was
characterized by minION sequencing (Oxford Nanopore technologies, Oxford, UK) in
this study. Two isolates of K. pneumoniae contained blaNDM-5 on the chromosome.
Three isolates of P. mirabilis, and one of P. stuartii carried blaNDM-1 on the
chromosome. Two copies of blaNDM-5 in different genome locations were found in four

235
isolates, and three copies in one isolate. A total of 133 plasmids harbouring blaNDM
was closed successfully by hybrid assembly of Illumina short reads and minION long
reads. This chapter briefly describes the evaluation of the horizontal mode of
transmission of carbapenem resistance in a Bangladeshi setting, based on WGS.
Further analysis has been planned beyond the PhD to investigate the comprehensive
functional and genomic properties of plasmids harbouring carbapenem resistance.

236
6.2 Results
6.2.1 Molecular epidemiology of plasmids harbouring blaNDM at DMCH
Phylogenetic analysis of plasmids carrying blaNDM (n=133) were performed
based on presence and absence genes which broadly revealed that plasmids associated
with blaNDM were highly diverse (Figure 6.1).
Plasmids were divided into 8 groups (A to H) based on phylogenetic ancestry,
and each group was assessed individually if any particular plasmid facilitated the
dissemination of NDM. Group A belonged to IncFII (n=45), and IncR (n=1); Group B
to IncFIA (n=13), IncFIB (n=2), and IncFII (n=1); group C to IncA/C2 (n=10), IncC
(n=1), IncHI2 (n=1), IncFIB & IncA/C2 (n=1), IncFII & IncC (n=1), and unknown
(n=1); group D to IncH (n=8), IncR (n=2), and IncFIB (n=1); group E to IncX3 (n=17);
group F to IncFIB(pQil) (n=10), IncFIB & IncFII (n=2), and IncFIB(pQil) & IncFII
(n=1); group G to IncR (n=3), IncFIA (n=2), IncFIB (n=2), and IncFII (n=1), and H to
IncFII (n=1), and unknown (n=6)] (Figure 6.1).
Study design to evaluate the horizontal spread of plasmids harbouring blaNDM
is described in Figure 6.2.

237
Figure 6.1 Phylogenetic tree was built with the complete, circular sequences of plasmids harbouring blaNDM (n=133) based on presence and absence
of genes using roary (v3.12.0). To obtain long reads sequence data, minION sequencing was undertaken (Oxford Nanopore technologies, Oxford,
UK). Unicycler (0.4.4) was used to yield hybrid assembly using both Illumina short reads and minION long reads, and consequently, plasmid
sequences were closed.

238
Figure 6.2 Investigating the horizontal transfer plasmids at DMCH.

239
6.2.2 Analysing the associations of blaNDM with other ARGs
All the plasmids belonged to A to D, and F to H carried the determinants of
multidrug resistance (Figure 6.3). Closed, circular sequences belonged to H were
retrieved from long read sequencing which were ~8 and ~10 kb in size and did not
contain any replication or conjugal protein. All plasmids belonged to E were IncX3;
blaNDM-5 and blaNDM-7 on IncX3 were not associated with any other ARG, but blaNDM-
1 on IncX3 was associated with armA, msrE, and sul.
Taken together, the most frequent associations of blaNDM with the genes against
other antimicrobial classes were aminoglycosides (81.2%, 108/133), sulphonamide
(75.9%, 101/133), antiseptics (69.9%, 93/133), β-lactams (64.7%, 86/133), and
trimethoprim (63.9%, 85/133) followed by macrolides (56.4%, 75/133), efflux pumps
(48.1%, 64/133), extended-spectrum β-lactams (15.8%, 21), rifampicin (13.5%, 18),
quinolones (9%, 12/133), chloramphenicol (7.5%, 10/133), carbapenems (0.8%,
1/133), and colistin (0.8%, 1/133) (Figure 6.4). The resistance genes found in relation
to aforementioned antimicrobials were: AAC(3), aadA, APH, armA, rmt for
aminoglycosides; sul for sulphonamide; qacE antiseptics; blaTEM-1, blaCMY-59 , blaOXA-
1, blaOXA-9, blaSHV, and blaDHA-1 for β-lactams; dfrA for trimethoprim; mph for
macrolides; tet, erm, cmlA, qepA, msrE for efflux pumps; blaCTX-M-15 for extended-
spectrum β-lactams; arr-2 for rifampin; qnrB, qnrS for quinolones; cat for
chloramphenicol; blaOXA-232 for carbapenems, and mcr-9 for colistin (Figure 6.3). The
colistin resistance determinant, mcr-9 in association with blaNDM harbouring plasmid
was recovered from IncH12 plasmid of group C3 from a colistin-susceptible clinical
E. coli isolate (Figure 6.3). The 5’ end of the gene was flanked by IS1, and 3’ by IS5
(Figure 6.5).

240

241
Figure 6.3 Clustering of plasmids in different plasmids’ groups based on identical
resistance pattern. Plasmids were grouped according to presence or absence of genes,
mentioned in Figure 6.1. Complete, circular sequences of plasmids harbouring blaNDM
(n=133) were screened for the presence of resistance genes. Known ARGs were
retrieved using CARD with a cut off ≥99.8% coverage, and ≥99.8% identity. Cells
coded by colours indicate the presence of genes, and white cells indicate the absence
of respective genes. Plasmids in each group are represented as clusters by individual
colour based on identical resistance patterns.

242
Figure 6.4 The prevalence of resistance to different antimicrobials among the plasmids harbouring blaNDM. *Resistance to carbapenem indicates
the presence of gene other than blaNDM. Plasmids within others were IncFIB & IncFII, (n=2), IncFIB(pQil) & IncFII (n=1), IncFIB & IncA/C2
(n=1), IncFII & IncC (n=1), IncC (n=1), and unknown (n=7).

243
Figure 6.5 Genetic context of mcr-9 in plasmid belonged to C3 (IncHI2).

244
6.2.3 Investigating transmission of blaNDM due to horizontal transfer of plasmid
Sixteen sub-groups of plasmids were screened based on common Inc type,
identical resistance patterns and similar molecular weight which contained more than
one plasmid. The sub-groups were: A1-b (n=25), A2-b (n=3), A2-c (n=4), A4 (n=2),
B1 (n=4), B11 (n=2), C1 (n=4), C2 (n=5), D1-a (n=2), D2 (n=3), E1 (n=10), E2 (n=6),
F1 (n=2), F2 (n=2), F3 (n=2), and G1 (n=2) (Table 6.1).
Horizontal transfer of blaNDM harbouring plasmids were predicted in A1-b
[IncFII (n=25)], A2-b [IncFII (n=3)], E1 [IncX3 (n=10)], E2 [IncX3 (n=6)], and F3
[IncFIB(pQil) (n=2)] considering the distribution of plasmids among different species
of Enterobacterale or different clones of species pertinent to each sub-group. Plasmids
belonged to A2-c, A4, B1, B11, C1, C2, D1-a, D2, F1, F2, F3, and G1 were specific
for a particular clone of Enterobacterales. However, plasmids in group A1-b
distributed in E. coli [ST10820 (n=1), ST167 (n=1), ST2659 (n=1), ST405 (n=1),
ST448 (n=1), ST9665 (n=1)], K. pneumoniae [ST23 (n=10), ST515 (n=3), ST147
(n=1), ST16 (n=1), ST490 (n=1)], E. cloacae (n=1), a single clone of C. rodentium
(n=2), A2-b in E. coli [ST101 (n=2), ST617 (n=1)], E1 in E. coli [ST448 (n=3), ST167
(n=3)], K. pneumoniae ST16 (n=1), E. cloacae ST113 (n=3), E2 in E. coli [ST101
(n=1), ST448 (n=1) ST101 (n=1)], E. cloacae ST45 (n=1), E. cloacae ST696 (n=1),
C. farmeri (n=1), and F3 in K. pneumoniae ST14 (n=1), K. variicola (n=1) (Table 6.1).
Genomic comparisons of plasmid sequences were performed which showed >99%
identity, and >99% coverage at the nucleotide level among the plasmids in A1-b
(Figure 6.6), A2-b (Figure 6.7), E1 (Figure 6.8), E2 (Figure 6.9), and F3 (Figure 6.10).
Plasmids belonged to G4, and G5 were carried by K. pneumoniae ST152, and
K. pneumoniae ST16, respectively which were identical in size, but differed by one
resistance gene, qnrB17 according to ‘CARD’ database with cut off ≥99.8% coverage,
and ≥99.8% identity (Figure 6.3; Table 6.1), however, qnrB17 with 57% coverage and
100% identity was found in G5 plasmid. Genomic comparison complete, circular
sequences of whole plasmids of G4 and G5 plasmids exhibited >99.74% identity, and
97% coverage at the nucleotide level.

245
Table 6.1 Stratification of plasmids based on resistance patterns, Inc types, and plasmid size (n=133).
Group Plasmid Inc type Size of plasmid Subgroup
designation (n)
Distribution of plasmids
A IncFII ~80 kb A1-a (1) E. coli ST2083
~92 kb to ~99 kb A1-b (25) E. coli [ST10820 (1), ST167 (1), ST2659 (1), ST405
(1), ST448 (1), ST9665 (1)], K. pneumoniae [ST23 (10),
ST515 (3), ST147 (1), ST16 (1), ST490 (1)], E. cloacae
(1), C. rodentium [(2); corresponding isolates differed
by 5 SNPs]
~101 kb A1-c (2) K. pneumoniae ST48
~101 kb A1-d (1) E. coli ST167
~70 kb A2-a (1) E. coli ST410
~80 to ~82 kb A2-b (3) E. coli [ST101 (2), ST617 (1)]
~91 kb to ~93 kb A2-c (4) E. coli ST8346
~86 kb A3 (1) E. coli ST4542
~95 kb to ~97 kb A4 (2) E. coli ST5954, K. pneumoniae ST23
~87 kb A5-a (1) E. coli ST405
~92 kb A5-b (1) K. pneumoniae ST11
~80 kb A6 (2) E. coli ST405, K. pneumoniae ST11
~93 kb A7 (1) K. pneumoniae ST147
IncR ~112 kb A2-d (1) E. coli ST410
B IncFIA ~129 kb to ~130kb B1 (4) E. coli ST167
~107 kb B2 (1) E. coli ST648
~124 kb B3 (1) E. coli ST1588

246
~161 kb B4 (1) E. coli ST167
~155 kb B5 (1) E. coli ST405
~120 kb B7 (1) E. coli ST167
~133 kb B10 (1) E. coli ST131
~79 kb B11 (2) E. coli ST648
~79 kb B12 (1) E. coli ST648
IncFII ~127 kb B6 (1) E. coli ST648
IncFIB ~128 kb B8 (1) E. coli ST405
~123 kb B9 (1) E. coli ST405
C IncA/C2 ~287 kb to ~296 kb C1 (4) P. stuartii [isolates harbouring plasmids were differed by
11 to 28 SNPs]
~154 kb to ~173 kb C2 (5) K. pneumoniae ST395
~72 kb C6 (1) K. pneumoniae ST11
IncHI2 ~276 kb C3 (1) E. coli ST38
Unknown ~111 kb C4 (1) P. stuartii
IncFIB & IncA/C2 ~304 kb C5 (1) K. pneumoniae ST15
IncC ~196 kb C7 (1) K. pneumoniae ST515
IncFII & IncC ~275 kb C8 (1) K. pneumoniae ST515
D IncHI1B ~251 kb to ~279 kb D1-a (2) K. pneumoniae ST15
~345 kb D2 (3) K. pneumoniae ST15
~301 kb D4 (1) K. pneumoniae ST1998
~242 kb D6 (1) E. cloacae
IncR ~70 kb D1-b (1) K. pneumoniae ST572
~152 kb D3 (1) K. pneumoniae ST17
IncFIB ~215 kb D5 (1) K. pneumoniae ST147

247
IncHI1A ~182 kb D7 (1) E. cloacae
E IncX3 ~46 kb to ~49 kb E1 (10) E. coli [ST448 (3), ST167 (3)], K. pneumoniae ST16 (1),
E. cloacae ST113 (3)
~45 kb to ~46 kb E2 (6) E. coli [ST101 (1), ST448 (1) ST101 (1)], E. cloacae
ST45 (1), E. cloacae ST696 (1), C. farmeri (1)
~58 kb E3 (1) E. cloacae
F IncFIB(pQil) ~135 to ~137 kb F1 (2) K. pneumoniae ST15
~168 kb F2 (2) K. pneumoniae ST16
~119 kb F3 (2) K. pneumoniae ST14, K. variicola
~133 kb F4 (1) K. pneumoniae ST231
~134 kb F5 (1) K. pneumoniae ST231
~133 kb F8 (1) K. pneumoniae ST231
~163 kb F9 (1) K. pneumoniae ST16
IncFIB & IncFII ~190 kb F6 (2) K. pneumoniae ST11
IncFIB(pQil) & IncFII ~203 kb F7 (1) K. pneumoniae ST11
G IncR ~143 kb G1 (2) K. pneumoniae ST23
~143 kb G3 (1) K. pneumoniae ST23
IncFII ~238 kb G2 (1) K. pneumoniae ST23
IncFIA ~141 kb G4 (1) K. pneumoniae ST152
~141 kb G5 (1) K. pneumoniae ST16
IncFIB ~150 kb G6 (1) K. pneumoniae ST16
~206 kb G7 (1) K. pneumoniae ST16
H IncFII ~158 kb H1 (1) E. cloacae
Unknown ~100 kb H2 (1) S. marcescens
No plasmid background ~10 kb H3 (3) E. coli ST167, E. coli ST38

248
No plasmid background ~8 kb H4 (3) K. pneumoniae ST15, K. pneumoniae ST152, K.
pneumoniae ST16
Values in parenthesis represents the numbers of plasmids in the respective sub-groups. Sub-groups with possible horizontal transfer of plasmid are
highlighted.

249
Figure 6.6 A. Schematic layout of IncFII plasmid of subgroup A1-b carrying blaNDM-5 identified in this study. Arrows represent the position and
transcriptional direction of the open reading frames. Resistance genes are represented by red, genes for mobile elements by green, genes associated
with conjugation in blue, replication-associated genes in pink, regulatory/accessory/hypothetical proteins in yellow. B. Colinear alignment of IncFII
plasmids harbouring blaNDM-5 of sub-group A1-b (n=13). One plasmid from each clonal type was selected for the alignment. Alignment was
performed by Mauve using DNASTAR (v17.1).

250
Figure 6.7 A. Schematic layout of IncFII plasmid of subgroup A2-b carrying blaNDM-5 identified in this study. Arrows represent the position and
transcriptional direction of the open reading frames. Resistance genes are represented by red, genes for mobile elements by green, genes associated
with conjugation in blue, replication-associated genes in pink, regulatory/accessory/hypothetical proteins in yellow. B. Colinear alignment of IncFII
plasmids harbouring blaNDM of sub-group A2-b (n=3). One plasmid from each clonal type was selected for the alignment. Alignment was performed
by Mauve using DNASTAR (v17.1).

251
Figure 6.8 A. Schematic layout of IncX3 plasmid of
subgroup E1 carrying blaNDM identified in this study. Arrows
represent the position and transcriptional direction of the
open reading frames. Resistance genes are represented by
red, genes for mobile elements by green, genes associated
with conjugation in blue, replication-associated genes in
pink, regulatory/accessory/hypothetical proteins in yellow.
B. Colinear alignment of IncFII plasmids harbouring blaNDM
of sub-group E1 (n=4). One plasmid from each clonal type
was selected for the alignment. Alignment was performed by
Mauve using DNASTAR (v17.1).

252
Figure 6.9 A. Schematic layout of IncX3 plasmid of
subgroup E2 carrying blaNDM identified in this study. Arrows
represent the position and transcriptional direction of the
open reading frames. Resistance genes are represented by
red, genes for mobile elements by green, genes associated
with conjugation in blue, replication-associated genes in
pink, regulatory/accessory/hypothetical proteins in yellow.
B. Colinear alignment of IncFII plasmids harbouring blaNDM
of sub-group E2 (n=5). One plasmid from each clonal type
was selected for the alignment. Alignment was performed by
Mauve using DNASTAR (v17.1).

253
Figure 6.10 A. Schematic layout of IncFIB(pQil) plasmid of subgroup F3 carrying blaNDM identified in this study. Arrows represent the position
and transcriptional direction of the open reading frames. Resistance genes are represented by red, genes for mobile elements by green, genes
associated with conjugation in blue, replication-associated genes in pink, regulatory/accessory/hypothetical proteins in yellow. B. Colinear
alignment of IncFIB(pQil) plasmids harbouring blaNDM of sub-group F3 (n=2). One plasmid from each clonal type was selected for the alignment.
Alignment was performed by Mauve using DNASTAR (v17.1).

254
6.2.4 Investigating possible role of mobile genetic elements in the spread of
blaNDM
The genetic context of each variant of blaNDM [blaNDM-5 (n=84), blaNDM-1
(n=40), blaNDM-7 (n=6) and blaNDM-4 (n=3)] was evaluated separately.
6.2.4.1 Evaluating the genetic context of blaNDM-5
A conserved region consisted of incomplete ISAba125, blaNDM-5, bleMBL, trpF,
dsbD was common across all plasmids harbouring NDM-5 (Figure 6.11).
The conserved region of blaNDM-5 in association with complex class 1 integron
(IS91-hypothetical protein (HP)-sul1-qacE-aadA-HP-dfrA- intI), flanked by intact
IS26 at both 3’ and 5’ end in same orientation was found in group A1 to A6 [IncFII
(n=44), IncR (n=1)], B1 [IncFIA (n=4)], B3, B7, B10 [IncFIA (n=3)], F6 [IncFIB &
IncFII (n=2)], G1 [IncR (n=2)], G2 [IncFII (n=1)] (Figure 6.11A). Group B5 [IncFIA
(n=1)] and B9 [IncFIB (n=1)] plasmids had similar genetic structure around blaNDM-5,
however terminal flanking regions of IS26 were in opposite direction (Figure 6.11B).
IS26-flanked (same direction at each end) conserved region with a little
variation of complex class 1 integron (IS91-HP-sul1-qacE-trA-aadA-dfrA-intI) were
found in plasmids belonged to F4 [IncFIB(pQil) (n=1)], F5 [IncFIB(pQil) (n=1)], and
F7 [IncFIB(pQil) & IncFII (n=1)] (Figure 6.11C).
IS26-flanked (same direction at each end) conserved segment with truncated
complex class 1 integron were found in plasmid of A7 [IncFII (n=1)] (Figure 6.11D).
Plasmid of group G3 [IncR (n=1)] also had IS26-flanked truncated complex class 1
integron, where the IS26 at both ends were in opposite directions (Figure 6.11E).
An upstream integration of Tn3-derived qnrB was present with the conserved
segment composed of ISAba125-blaNDM-5-bleMBL-trpF-dsbD-cutA-gorES in F9
plasmid [IncFIB(pQil) (n=1)]. The intervening region was flanked by IS26 in opposite
direction (Figure 6.11F).
IS26-flanked conserved region of blaNDM-5 with variable downstream was
present in B8 [IncFIB (n=1)] (Figure 6.11G), F8 [IncFIB(pQil) (n=1)] (Figure 6.11H),
B2 [IncFIA (n=1)], B4 [IncFIA (n=1)], B6 [IncFII (n=1)] (Figure 6.11I), C7 [IncC
(n=1)] and C8 [IncFII & IncC (n=1)] (Figure 6.11J).

255
The conserved region of group E1 [IncX3 (n=10)] also was flanked by IS5 at
the upstream and an intact IS26 at the downstream. An intact ISAba125 was flanked
upstream of IS5 (Figure 6.11K).

256
Figure 6.11 Genetic context around blaNDM-5 in different plasmid backgrounds.

257
6.2.4.2 Evaluating the genetic context of blaNDM-1
The genetic structure, Tn125 [blaNDM-1-bleMBL-trpF-dsbD-cutA-groES-groEL-
IS91, bordered by intact ISAba125 at upstream and downstream] with IS3-flanked
aph(3')-VI at the upstream of Tn125 was observed in plasmid of C1 (IncA2/C) (n=4)
(Figure 6.12A). Similar genetic composition except the flanking region of ISAba125
at the downstream was existed among the plasmids of varied Inc types C2 [IncA/C2
(n=5)] (Figure 6.12B), C4 [unknown (n=1)] (Figure 6.12C), C5 [IncFIB & IncA/C2
(n=1)] (Figure 6.12D), and H1 [IncFII (n=1)] (Figure 6.12E), while the region was
truncated in F3 [IncFIB(pQil) (n=2)] and H2 [unknown (n=1)] (Figure 6.12F). The
intervening blaNDM-1-containing region including IS3-flanked aph(3')-VI were shown
to be flanked by IS26 at each end in same direction in group C1 (IncA/C2) (Figure
6.12A) and C4 (unknown background) (Figure 6.12C).
ISAba125 at the upstream of conserved segment (blaNDM-1-bleMBL-trpF-dsbD-
cutA-groES-groEL-IS91) was incomplete in C5 (IncFIB & IncA/C2) (Figure 6.12D),
D6 [IncH (n=1)] and D7 [IncH (n=1)] (Figure 6.12G) and original structure of blaNDM
conserved region was lost in D2 (IncH) by Tn3, IS630, and IS3, and in F3
[IncFIB(pQil)], and H2 (unknown background) by IS630 and IS26 (Figure 6.12H).
The conserved region of blaNDM-1 (incomplete ISAba125blaNDM-1-bleMBL-trpF-
dsbD-cutA-groES-groEL) was located in between two Tn3 of same direction in
IncFIB(pQil), IncFIA, and IncFIB [plasmids belonged to FI (n=2), F2 (n=2), G4 (n=1),
G5 (n=1), G6 (n=1), and G7 (n=1), of which upstream was flanked by complete Tn3
of 3235 bp, while the Tn3 at downstream was truncated (Figure 6.12I). Two ends of
entire region were flanked by IRs of 49 bp.
The genetic structure composed of incomplete ISAba125, blaNDM-1, bleMBL,
trpF, lysR, qacE, sul, hypothetical protein, and IS91 was shared by the plasmids
belonged to C3 [IncHI2 (n=1), C6 [IncA/C2 (n=1), D1-a [IncH1B (n=2)], D1-b [IncR
(n=1)], D3 [IncR (n=1), D4 [IncHI1B (n=1), D5 [IncFIB (n=1), and E3 [IncX3 (n=1)]
(Figure 6.12J). Upstream and downstream of this conserved segment were variable
among the plasmids.

258
Figure 6.12 Genetic context around blaNDM-1 in different plasmid backgrounds. *qacE
was present in the plasmid at 70% coverage.

259
6.2.4.3 Evaluating the genetic context of blaNDM-4 and blaNDM-7
All plasmid harbouring blaNDM-7 (n=6) belonged to group E2 (IncX3) (Table
6.1). The region consisted of blaNDM-1-bleMBL-trpF-dsbD was flanked by IS26 at the
upstream. An intact ISAba125 was flanked at the upstream of IS5 (Figure 6.13A).
Plasmid harbouring blaNDM-4 belonged to IncFIA (n=3) under the group of B11
and B12 (Table 6.1). The partner components of blaNDM (ISAba125blaNDM-1-bleMBL-
trpF-dsbD-IS91) were flanked by IS26 at the upstream and downstream in same
direction (Figure 6.13B).

260
Figure 6.13 Genetic context around blaNDM-7 and blaNDM-4 in different plasmid
backgrounds.

261
6.3 Discussion
The gene encoding blaNDM is mostly located on conjugative plasmids with wide
replicon types which are often associated with the determinants of multiple antibiotic
resistance. The most frequent plasmid Inc types among the species of
Enterobacteriaceae in relation to blaNDM were IncX3, IncFII and IncC. The
distributions of blaNDM among the different Inc types reported are likely to be biased
as substantial proportion of blaNDM harbouring plasmids were characterized from the
Chinese isolates followed by isolates from North America. The plasmids’ background
related to blaNDM from Indian subcontinent and Middle East are largely unknown
where the particular resistance was found to be endemic (Khan et al., 2017; Dadashi
et al., 2019; Pecora et al., 2019; Wu et al., 2019). In this study, blaNDM was most
frequently found in IncFII (n=48), IncX3 (n=17), IncFIA (n=15), IncA/C2 (n=10),
IncFIB(pQil) (n=10), IncH (n=9) among the plasmids characterized (Figure 6.1; Table
6.1).
Regardless of Inc types, all the NDM-positive plasmids carried the
determinants of multidrug resistance except IncX3 (Figure 6.2; Figure 6.3). Referring
to ‘Chapter 4’, a cluster of 167 isolates (designated as ‘HT5’) was identified which
shared the six resistance genes (blaNDM-5, blaTEM-1, aadA2, rmtB, sul1, and dfrA12)
(Figure 4.6). This chapter documented plasmid-mediated spread of blaNDM-5 in
association with IncFII [A1-b (n=25); A2-b (n=3)] by long read sequencing and further
scrutinization (Figure 6.2; Figure 6.3; Figure 6.7; Figure 6.8; Table 6.1). IncFII
plasmids belonged to A1 and A2 coharboured blaNDM-5, blaTEM-1, aadA2, rmtB, sul1,
and dfrA12 (Figure 6.3), strongly suggesting IncFII as dominant vector of
disseminating carbapenem resistance in Bangladeshi hospital. The gene, blaNDM-5 was
present in IncFII plasmids (belonged to A1 and A2) as incomplete ISAba125-blaNDM-
5-bleMBL-trpF-dsbD-S91-HP-sul1-qacE-aadA-HP-dfrA-intI which was flanked by
IS26 at both end (Figure 6.11A). IS26-flanked regions at both end in same orientation
could be circularised and excised the intervening region from donor plasmid by IS26
and therefore, inserted into plasmids of varied replicon types through IS91-mediated
homologous recombination (Pecora et al., 2019).
In this study, horizontal transfers of IncX3 (group E1 and E2) were also shown
to be responsible for the spread of blaNDM-5 and blaNDM-7, respectively in wide host

262
range (Table 6.2; Figure 6.8; Figure 6.9). IncX3 is highly conjugative plasmid, has
been considered as epidemic plasmid for the worldwide dissemination of blaNDM (Paul
et al., 2017; Li et al., 2018a; Wang et al., 2018c; Liu et al., 2019d). In this study, the
plasmids belonged to E1 and E2 were low molecular weight (ranged from ~46 kb to
~49 kb) and carried only blaNDM as resistance gene. The conserved region of blaNDM
(blaNDM-1-bleMBL-trpF-dsbD) in IncX3 belonged to E1 and E2 was flanked by IS5 at
the upstream. An intact ISAba125 was found upstream of IS5 (Figure 6.11K; Figure
6.13A). Plasmids of group E1 and E2 were highly similar to the plasmids in NCBI
archives (accession no: MK317995.1, CP036179.1 MN064714.1, CP040446.1,
CP032889.1, CP021692.1). However, IncX3 plasmid harbouring blaNDM-1 belonged to
E3 was exceptional which was associated with resistance determinants, armA, sul,
msrE and qacE at a low coverage (Figure 6.12J), however, horizontal transfer of IncX3
carrying blaNDM-1 was not found. Plasmid-mediated dissemination of blaNDM-1 occurred
at DMCH with IncFIB(pQil) (group F3) and IncFIA (group G3 and G4) (Table 6.1;
Figure 6.10).
The most worrying aspect in the clinical setting was that horizontal transfer of
MDR plasmids or transposition of MDR determinants among the plasmids limited
therapeutic options drastically (Figure 6.3; Figure 6.4). This study also found the
presence of both blaNDM-1 and mcr-9 in a plasmid of IncH12 (designated as group C3
in this study) recovered from a clinical E. coli isolate (Figure 6.3), however, the isolate
was shown to be colistin susceptible. MCR-9 is a newly emerging mechanism in
Enterobacteriaceae, has been reported previously in colistin susceptible Salmonella
spp. and Enterobacter spp. (Carroll et al., 2019; Chavda et al., 2019). MCR-9
expression is mediated by the TCS (qseC and qseB), downstream of the gene in
colistin-induced cells (Kieffer et al., 2019). In this study, mcr-9 is located in between
IS1 and IS5, and lacked downstream regulatory genes (Figure 6.5). Regardless of
colistin susceptibility, the finding warned the impending dissemination of colistin
resistance among the carbapenem resistant isolates (Yuan et al., 2019).
It has been postulated that blaNDM is the chimera of aminoglycoside resistance
gene, aphA6 and pre-existing blaMBL, originated in A. baumannii and was disseminated
to the species of Enterobacterales in the form of composite transposon, Tn125. Tn125
was formed by the fusion of ISAba125 at the upstream of blaNDM, and a series of genes
at the downstream consists of bleMBL (responsible for bleomycin

263
resistance), trpF (encoding a phosphoribosylanthranilate isomerase), dsbD (encoding
a twin-arginine translocation pathway signal sequence domain
protein), cutA1 (encoding a periplasmic divalent cation tolerance protein), groES-
groEL (encoding chaperonin), ISCR27 and finally a second ISAba125. An intact or
remnants of ISAba125 has been found invariably at the upstream of blaNDM, which acts
as promotor for the expression of the gene (Wu et al., 2019). Consistent to the previous
reports, similar genetic context immediate to blaNDM was observed in this study (Figure
6.11; Figure 6.12; Figure 6.13). The classical partner components of blaNDM-1, Tn125
was found in group C1 plasmid (IncA2/C), indicating ISAba125-mediated insertion of
the gene into the plasmid background (Figure A). It can be speculated that ISAba125
was lost at the downstream in other plasmids due to subsequent recombination.
Simultaneously, incomplete ISAba125 at the upstream was more frequent among the
plasmids characterized in this study (Figure 6.11; Figure 6.12; Figure 6.13), predicting
their primitive integration of blaNDM-1 into plasmid as Tn125 followed by decaying of
adjacent elements and subsequent involvement of other IS in the mobilisation of
blaNDM (Figure 6.11; Figure 6.12) (Khan et al., 2017; Weber et al., 2019; Wu et al.,
2019). Group D2 plasmid (IncH) characterised in this study can be the ideal example
of enormous destruction of original blaNDM conserved region due to integration of
several transposons such as Tn3, IS630, and IS3 (Figure 6.12H). The conserved
segment consisted of incomplete ISAba12, blaNDM-1, bleMBL, trpF, lysR, qacE, sul,
hypothetical protein and IS91 was differed from typical blaNDM adjacent region, but in
this study the region was common in wide range plasmid Inc types (IncHI2, IncA/C2,
IncH, IncR, IncHI1B, IncFIB and IncX3) (Figure 6.12J), indicating common mode of
transposition of blaNDM among the plasmids of varied replicon types. This conserved
region was identical to previously described plasmids isolated from K. pneumoniae in
USA (accession no: CP021709.1) and E. coli in Australia (accession no: KC999035.4).
Apart from IncFII, plasmids of wide replicon types [IncR, IncA/C2,
IncFIB(pQil), IncC, IncFIA, IncFIB, IncFIB & IncFII, IncFIB(pQil) & IncFII, IncFII
& IncC] had conserved segment of blaNDM flanked by IS91 followed by class 1
integron or other partner components and the entire region was flanked by IS26 at the
upstream and downstream in same orientation (Figure 6.11; Figure 6.12; Figure 6.13).
It was possible to transposition of IS26-flanked intervening segment by two
recombination steps by both IS26 and IS91 where IS26 aided to release segment from

264
donor plasmid and IS91 facilitated to insert it inro recipient plasmid by rolling circle
replication (Pecora et al., 2019). The transposons, ‘IS91’ family differs from typical
IS in structure and function, causes transposition though ‘rolling circle replication’.
IS91 does not have IRs, the ‘transposase’ (tnpA) contains motif which resembles
replication initiator protein repA, and IS91 termini, called ori91 (where transposition
stars), and ter91 (where transposition stops). However, IS91 are capable to mobilise
genetic elements by one end transposition involving ori91 only (Garcillán-Barcia et
al., 2002; Wawrzyniak et al., 2017). Moreover, IS26 is the most frequently described
transposons, found in association of resistance plasmid in Enterobacterales family
which can transposes resistance gene by replicative mechanism in the form of
composite transposon (He et al., 2015; Harmer et al., 2016; Takeuchi et al., 2018).
IncFIB(pQil), IncFIA, and IncFIB plasmids belonged to group FI, F2, G4, G5,
G6, and G7 contained blaNDM partner components in association with an intact Tn3 at
5’ and incomplete Tn3 at 3’ end (Figure 6.12I), and the region was bracketed by Tn3
IRs of 49 bp. Transposons of Tn3 family is widely distributed in all bacterial phyla,
contributes a major role in spread of resistance gene by replicative transposition. It
was possible to mobilise blaNDM conserved segment by two terminal unidirectional
copies of Tn3 from donor plasmid and therefore, replicative integration into the
recipients (Nicolas et al., 2015).
The findings of this study provided the evidence of multiple mechanisms of
HGT for the spread of blaNDM at DMCH consistently. However, the possible major
trajectories involved in HGT were plasmids of IncFII and IncX3, IS26, IS91 and Tn3.

265
Section Seven
Outbreak of Hypervirulent Multi-Drug Resistant Klebsiella
variicola Causing High Mortality in Neonates in Bangladesh

266
7.1 Introduction
Globally, 2.4 million neonatal death were recorded in 2019 which was approx.
6,700 deaths per day. Neonatal mortality caused by sepsis varies between countries,
and according to UNICEF, sepsis accounts for neonatal mortality ranges from 0.4 to
27.4% (UNICEF, 2020a). The global burden of neonatal sepsis is the highest in SA
and sub-Saharan Africa. The incidence of confirmed sepsis (culture-positive) in SA is
15.8 per 1,000 live birth although this is thought to be a gross underestimation due to
supporting microbiology facilities (Ombelet et al., 2018; Chaurasia et al., 2019). The
relentless increase in AMR is complicating the management of neonatal sepsis,
particularly in developing societies, which have been compounded by additional
factors such as: 1. Poverty and lack of education 2. Insufficient antenatal care (ANC)
3. Poor washing practices and sanitation 4. Underdeveloped health care systems and
limited resources (%GDP spent on public health); 5. Substandard IPC strategies 6.
Poor antimicrobial stewardship programs (Shane et al., 2017; Bandyopadhyay et al.,
2018; Chaurasia et al., 2019). Neonatal sepsis can be categorized broadly into ‘early-
onset neonatal sepsis’ (EOS) whether the sepsis happens in the first 3 days of life by a
vertically transmitted pathogens and ‘late-onset neonatal sepsis’ (LOS) whether the
sepsis develops after 3 days or later by vertically or horizontally acquired pathogens.
EOS usually develops either from transplacental microbial transmission or ascending
entry of bacteria to uterus as a consequence of chorioamnionitis following prolonged
rupture of the chorioamniotic membrane (PROM); however, on overcrowded LMIC
NICUs or via caesarean sections, EOS can also occur nosocomially. LOS can result
from microbial exposure from the surrounding environments such as family members,
hospital personnel, nutritional sources, contaminated surfaces, or medical devices.
Preterm low birthweight (LBW) neonates have a 3–10 times higher risk of developing
sepsis than full-term normal birthweight infants (Shane et al., 2017). Maternal risk
factors causing neonatal sepsis includes preterm pregnancy, PROM, chorioamnionitis,
and UTI (Simonsen et al., 2014; Shane et al., 2017). Relevant meta-data on
Bangladesh are stated in Table 7.1. A report by ‘DhakaTribune’ in 2019 stated that
pre-term birth is the main cause of neonatal mortality in Bangladesh. Additionally,
poor nutritional status of pregnant mothers, and early pregnancies result the birth of
LBW infants (DhakaTribune, 2019; UNICEF-WHO, 2019; UNICEF, 2020a;
UNICEF, 2020b).

267
Table 7.1 Relevant meta-data for analysing the situation of neonatal sepsis in
Bangladesh.
Indicators Estimates
Birth rate (crude) 18 per 1,000 people (nominal, 2018)
Neonatal mortality rate 17% (nominal, 2019)
Neonatal mortality due to sepsis 19.8% (nominal, 2017)
Percentage of receiving ANC1 at least once 75.2% (nominal, 2019)
Percentage of receiving ANC4 four times 36.9% (nominal, 2019)
Percentage of women who give birth before
age 18
24.2% (nominal, 2019)
Percentage of deliveries in a health facility 53.4% (nominal, 2019)
Percentage of deliveries by Caesarean
section
36% (nominal, 2019)
Percentage of newborns who have a
postnatal contact with a health provider
within 2 days of delivery
66.7% (nominal, 2019)
Pre-term birth 20% (nominal, 2019)
Neonates born with LBW 27.8% (nominal, 2015)
Stillbirth 230 per day

268
Members of the “K. pneumoniae complex” can be classified into three
phylogenetic groups, termed as KpI, KpII, and KpIII. KpI includes K. pneumoniae, K.
rhinoscleromatis and K. ozaenae. KpII comprises K. quasipneumoniae and KpIII
comprises K. variicola (Brisse et al., 2014). Because of sharing common biochemical
and phenotypic properties, K. variicola was misdiagnosed as K pneumoniae several
years ago. K. variicola was first described as a novel species in 2004, considered as an
endophyte in plant and as pathogen in human. The species, K. variicola is distributed
in wide range of STs, isolated from a diverse host types such as plants, animals, insects,
environments, and human. A total of 166 STs of K. variicola has been identified so far
from deposited global genomes. K. variicola has been now considered as an emerging
hypervirulent pathogen for humans, reported worldwide from a variety of infections
e.g. BSIs, respiratory tract infections, and UTIs. The added concern is that plasmid
borne AMR genes (blaTEM, blaSHV, blaCTX-15, blaKPC-2, blaNDM-1, blaOXA-181) have been
found in K. variicola-associated infections (Barrios-Camacho et al., 2019; Rodríguez-
Medina et al., 2019).
This chapter describes a MDR K. variicola outbreak on a NICU illustrated by
an ideogram detailing the course of infection, phenotypic and genomic
characterization, and clinical outcome, and fulfil ‘objectives #2, # 3, and #4’ of the
project.

269
7.2 Results
7.2.1 Tracking the outbreak by K. variicola
Blood cultures were taken from neonates (<30 days old) from Oct 2016 to
March 2017 presenting with clinical sepsis were included in this cohort. Study outline
is represented in Figure 7.1. Additional clinical history related to prenatal risk such as
LBW, pre-term, and PROM were collected from culture-positive confirmed cases of
neonatal sepsis. The prevalence of confirmed cases of sepsis in this cohort was 24.32%
(36/148) (Figure 7.1). The species isolated from the sepsis cases are shown in Figure
7.2. During this period, a sepsis outbreak of K. variicola in the NICU was suspected
during October 2016 to January 2017 retrospectively. A total of 14 outbreak cases
(case 1 to case 14) of K. variicola was identified. All K. variicola isolates were clonal
by PFGE (Figure 7.3). According to 7 loci MLST scheme of K. pneumoniae, the
isolates belonged to ST771, and belonged to ST60 based on MLST scheme for K.
variicola, described by Barrios-Camacho et al. (2019). Polymorphism variants (SNPs
from WGS data on K. variicola isolated from case 2 to 14) ranged from 3 to 27
compared to K. variicola from case 1 (Table 7.2).

270
Figure 7.1 Study flowchart.

271
Figure 7.2 The species isolated from blood specimens from neonates during October
2016 to March 2017.

272
Figure 7.3 Antimicrobial resistance phenotypes and genetic profile of outbreak strains. AMP, ampicillin; AMC, amoxicillin-clavulanic acid; TZP,
piperacillin-tazobactam; CRO, ceftriaxone; CAZ, ceftazidime; CTX, cefotaxime; FEP, cefepime; IPM, imipenem; MEM, meropenem; CIP,

273
ciprofloxacin; LVX, levofloxacin; AMK, amikacin; GEN, gentamicin; SXT, sulfamethoxazole-trimethoprim; FOF, fosfomycin; CST, colistin.
Antimicrobial sensitivity and absence of genes are indicated by white cells. Blue and red shades indicate phenotypic resistance and presence of
genes by the isolates. Seven capsular genes were identified (galF, rmlA, gnd, ugd were identical to KL34 and cpsACP matches to KL153, rmlB to
KL36 and wzi to KL114); 12 expected genes did not match to known capsular (KL) type. Capsular operon indicates a novel K locus in this clone.
Entire capsular loci are depicted in Figure 7.4. Siderophores (yersiniabactin, aerobactin, salmochelin and colibactin) were absent in this clone.

274
Table 7.2 SNPs of WGS reads to 13 clonal K. variicola ST771 compared to first
isolated K. variicola ST771 in this study.
DOSC, date of sample collection; VT, variants total; SNP, single nucleotide
polymorphism; MNP, multiple nucleotide polymorphism; INS, insertion; DEL,
deletion; Complex, combination of SNP/MNP.
Case Strain ID DOSC VT SNP MNP INS DEL Complex
2 dm-32 27.10.16 20 16 - - - 4
3 dm-33 27.10.16 3 3 - - -
4 dm-97 04.12.16 8 7 - - - 1
5 dm-115 07.11.16 27 20 2 - - 5
6 dm-165 12.11.16 13 9 1 - - 3
7 dm-166 13.11.16 22 18 1 - 1 2
8 dm-167 13.11.16 12 12 - - -
9 dm-169 14.11.16 18 15 1 - 1 1
10 dm-322 19.12.16 7 5 1 - - 1
11 dm-323 19.12.16 11 11 - - -
12 dm-395 19.01.17 12 10 1 - - 1
13 dm-405 24.01.17 26 22 - - 1 3
14 dm-414 24.11.16 20 16 - - - 4

275
7.2.2 Overview of the outbreak by K. variicola
K. variicola outbreak strain ST771 was first recovered from a premature (31
weeks), LBW baby admitted to DMCH on 21st of October 2016 and was DAMA
(Table 7.3; Figure 7.3). This first isolate was negative for blaCTX-M-15 and blaNDM-1.
Subsequently two K. variicola from twins were identified on 27th October and had
acquired a blaCTX-M-15 plasmid. One twin died and the other was DAMA (case 2 & 3;
Table 7.3). Five K. variicola (from cases four to eight; Table 7.3) isolated from 7th
November to 4th December had an increased antibiotic resistance profiles, with the
acquisition of an additional plasmid carrying blaCTX-M-15 and blaNDM-1. Interestingly,
this plasmid was also shown to be positive for the resistance genes, aph(3')-VIa,
aadA1, qnrS1, blaOXA-9 , aac(6')-Ib and aac(6')-Ib-cr when transferred to Escherichia
coli J53, and WGS confirmed the presence of these genes in transconjugants (Figure
7.3). One death was recorded among these five cases; three recovered and one DAMA
(mortality is 25%, excluding DAMA). During this period (14th to 24th of November),
the same clone but with a different resistance genotype (blaCTX-M-15 positive, blaNDM-1
negative) was isolated for cases 9 to 14. The outbreak cases admitted after 7th
December (cases 10 to13; Table 7.3) were infected with blaNDM-1-negative K. variicola.
The mortality for neonates infected with blaCTX-M positive, blaNDM-1 negative K.
variicola was 71.42% (5/7) (not including patients who were DAMA.
All neonates received multiple antibiotics during NICU admission, either in
combination or consecutively, with overall antibiotic usage being: 62% ceftriaxone,
53% amikacin, 31% vancomycin, 16% gentamicin, 15% carbapenem, 9%
azithromycin, 6% colistin, 6% metronidazole and 3% ciprofloxacin.

276
Table 7.3 Characteristics of outbreak cases.
Case Age
(days)
Sex SEC POS DOA DOSC Outcome TS
Perinatal risk
factors
Abc AMR genes pertinent to antibiotics used
for sepsis
PT PROM LBW blaCTX-M-
15
blaNDM-1 aph(3')-
VIa
aadA1
1 3 M LM EOS 21.10.16 23.10.16 DAMA 4 PTb - LBW AMK,
CAZ
- - - -
2a 6 M LM LOS 20.10.16 27.10.16 DAMA 8 PTb PROM LBW AZTd,
AMK,
MTd
+ - - -
3a 6 M LM LOS 20.10.16 27.10.16 Died 8 PTb PROM LBW AZd,
AMK,
MTd
+ - - -
4 5 M Poor LOS 30.11.16 04.12.16 D/S 5 - - - GEN,
CRO
+ + + +
5 3 F BPL EOS 31.10.16 07.11.16 Died 8 - - - AMK,
CRO
+ + + +
6 5 F BPL LOS 07.11.16 12.11.16 DAMA 6 - - LBW GEN,
CRO
+ + + +
7 5 F LM LOS 06.11.16 13.11.16 D/S 10 PT - LBW AMK,
CL
+ + + +
8 3 M BPL EOS 09.11.16 13.11.16 D/S 7 - - LBW AMK,
CRO
+ + + +
9 3 M Poor EOS 10.11.16 14.11.16 Died 16 PT - LBW AMK,
CRO
+ - - -
10 7 M Poor LOS 07.12.16 19.12.16 Died 40 - - LBW AMK,
CRO
+ - - -
11 10 M LM LOS 06.12.16 19.12.16 D/S 35 - - LBW AMK,
CL
+ - - -

277
12 2 M Poor EOS 15.01.17 19.01.17 D/S 21 - - - GEN,
CRO
+ - - -
13 1 M BPL EOS 20.01.17 24.01.17 Died 25 PT - LBW MEM,
VANd
+ - - -
14 7 M Poor LOS 19.11.16 24.11.16 Died 12 - - LBW MEM,
VANd
+ - - -
Abbreviations: M, male, F, female; SEC, socio-economic condition (per capital family income was used to assess socio-economic level); LM,
lower middle; BPL, below poverty level; POS, pattern of sepsis; EOS, early onset neonatal sepsis; LOS, late onset neonatal sepsis; DOA, date of
admission; DOSC, date of sample collection; DAMA, discharge against medical advice; TS, total stay in hospital; PT, pre-term; PORM, prolonged
rupture of membrane; LBW, low birth weight; Ab, antibiotics; AMK, amikacin; CAZ, ceftazidime; AZ, azithromycin; MT, metronidazole; GEN,
gentamycin; CRO, ceftriaxone; CL, colistin; MEM, meropenem; VAN, vancomycin. aCase 2 and 3 were twins; b31 weeks; cantibiotics usage during
hospital stay (green colour indicates sensitive to respective antibiotics by the isolates recovered and red indicates the resistant); dsusceptibility were
not tested.

278
7.2.3 Resistance and virulence profiling of K. variicola
A total of 21 ARGs was identified, demonstrating concurrence between
antimicrobial MICs and presence of known resistance genes (fosA did not result in
MICs above the resistance break point but this is expected in Klebsiella species)
(Figure 7.3) (Ito et al., 2017). WGS identified identical putative virulence factors
(adhesins, siderophores, invasins etc.) (Li et al., 2014) and a unique capsule locus in
K. variicola ST771 (Figure 7.3, Figure 7.4).
S1 PFGE analysis revealed that blaCTX-M-15 was carried on ~134 kb and ~158
kb plasmids (Figure 7.5), and blaNDM-1 on an ~134 kb plasmid (Figure 7.6).
Conjugation experiments were undertaken with a NDM-positive K. variicola donor
and E. coli J53 recipient. The transconjugants were found to be positive for blaNDM-1
located on a plasmid of ~134 kb (Figure 7.6). The resistance profiles of transconjugants
are shown in Figure 7.3.

279
Figure 7.4 Capsular loci (K) to Klebsiella variicola ST771. Violet shading indicates identity matches with KL34 (galF, 99.33%; rmlA, 98.62%;
gnd, 99.79%; ugd, 100%); red shading indicates identity matches with other K loci [cpsACP matches to KL153 (92.86%), wzi to KL114 (80.80%)
and rmlB to KL36 (82.34%)]. Genes expressed by white arrows did not match to known capsular type. Capsular operon indicates a novel K locus
in this clone.

280
Figure 7.5 Pulsed-field gel of S1 nuclease digested gDNA carrying blaCTX-M and in-gel hybridization with blaCTX-M probe. Each lane is represented
by specific strain ID. Isolation sources to the strains were: dm.32 from case 2; dm.33 from case 3; dm.97 from case 4; dm.115 from case 5; dm.165
from case 6; dm.166 from case 7; dm.167 from case 8; dm.169 from case 9; dm.322 from case 10; dm.323 from case 11; dm.395 from case 12;
dm.405 from case 13; dm.414 from case 14; A. S1 PFGE of K. variicola isolated from outbreak cases. B. In-gel hybridization of outbreak strains
with blaCTX-M probe.

281
Figure 7.6 Pulsed-field gel of S1 nuclease digested gDNA carrying blaNDM and in-gel hybridization with blaNDM probe. Each lane is represented
by specific strain ID. Isolation sources to the strains were: dm.97 from case 4; dm.115 from case 5; dm.165 from case 6; dm.166 from case 7;
dm.167 from case 8; A. S1 PFGE of K. variicola isolated from outbreak cases. B. In-gel hybridization of outbreak strains with blaNDM probe C. S1
PFGE of blaNDM transconjugant D. In-gel hybridization of blaNDM transconjugant.
282
7.2.4 Risk assessment of the outbreak by K. variicola
Of the 36 neonates [outbreak (n=14) and non-outbreak (n=22)], 83.3% were
male; the mean (SD) age was 5.4 days (±3.6) and 10 (27.8%) were lost to follow up.
Babies with LBW was significantly associated with the outbreak (p<0.05) (Table 7.4).
The overall mortality for K. variicola sepsis was 54.5% compared to 33.3% for non-
outbreak sepsis cases excluding DAMA [p>0.01 (non-significant); OR=2.40; CI=
0.48-11.89] (Table 7.4).

283
Table 7.4 Risk association of outbreak strains compared to non-outbreak strains (during the outbreak time).
Variables Outbreak strains
(n=14) n (%)
Non-outbreak strains
(n=22) n (%)
p value
OR 95% CI
Sex Male (n=30) 11 (78.57) 19 (86.36) 0.54 1.72 0.30-10.08
Female (n=6) 3 (21.43) 3 (13.64)
POS EOS (n=14) 6 (42.86) 8 (36.36) 0.70 1.31 0.33-5.16
LOS (n=22) 8 (57.14) 14 (63.64)
HS [days (mean±SD)] 9.29±8 6.59±3.11 0.16 - -
Pre-term Yes (n=13) 6 (42.86) 7 (31.82) 0.50 0.62 0.15-2.50
No (n=23) 8 (57.14) 15 (68.18)
PROM Yes (n=6) 2 (14.29) 4 (18.18) 0.76 1.33 0.21-8.46
No (n=30) 12 (85.71) 18 (81.82)
LBW Yes (n=20) 11 (78.57) 9 (40.91) 0.03 5.30 1.14-24.55
No (n=16) 3 (21.43) 13 (59.10)
Mortalitya Died (n=11) 6 (54.54) 5 (33.33) 0.28 2.40 0.48-11.89
Discharge (n=15) 5 (45.46) 10 (66.67)
POS, pattern of sepsis; HS, hospital stay; chi-square test was used to calculate p value of categorical variables and independent t test to quantitative
variables. ap value for mortality was determined by excluding the neonates with DAMA; 3 cases from outbreak group and 7 cases from non-
outbreak group lost to follow up. Follow up after discharge was not undertaken in this study.

284
7.2.5 In vivo pathogenicity testing of K. variicola in G. mellonella
Data from the G. mellonella model shows that K. variicola ST771 was
significantly more virulent than the K. pneumoniae comparator at 105 and 106 cfu/ml
(p<0.0001).
Similar to the clinical outcome, NDM-1-positive were significantly less
pathogenic than NDM-1-negative K. variicola isolates (p<0.000001) (Figure 7.7).

285
Figure 7.7 In vivo pathogenicity testing in Galleria mellonella model to compare the virulence of K. Variicola Vs K. Pneumoniae. Kaplan–Meier
plots representing the cumulative proportion of G. mellonella larvae survival over 72 hours post infection with K. variicola and K. pneumoniae
A58300 [previously described hypervirulent pathogen (Coutinho et al., 2014)]. Differences in survival were calculated by log-rank (Mantel-Cox).

286
7.3 Discussion
This is the first reported outbreak of neonatal sepsis by MDR K. variicola at
DMCH, Bangladesh, or for that matter in SA. The findings of this chapter were
submitted for publication when the outbreak was identified at CU retrospectively and
was accepted by Clinical Infectious Diseases (CID) (Farzana et al., 2019a). The
laboratory work, and analysis related to the work have been completely performed by
me as a part of this PhD. Only the sequencing services (Illumina MiSeq) were provided
by Prof. Walsh's genomic laboratory at CU.
Genomic profile considered all K. variicola isolated in this study as clonal,
belonged to ST771 based on K. pneumoniae MLST scheme, and ST60 by the recently
described K. variicola scheme (Barrios-Camacho et al., 2019). The outbreak was
associated with higher mortality than non-outbreak sepsis cases. Despite the small
sample, the confidence interval for the OR was 0.48-11.89, suggesting a likely
difference (Table 7.4). K. variicola in human was first described in an episode of
paediatric outbreak in Mexico. Other reports on K. variicola bacteraemia have been
consistently associated with higher mortality than K. pneumoniae. However, no
additional known virulence properties were retrieved from analysis of global genomes
of K. variicola (Barrios-Camacho et al., 2019; Rodríguez-Medina et al., 2019). The
outbreak clone in this study was associated with iron-acquisition (ent, kfu), adhesins
(fim, mrk) and complement resistance (traT), described previously as bacterial
virulence determinants (Coutinho et al., 2014; Li et al., 2014; Araújo et al., 2018), and
the ST771 K. variicola capsular operon suggests a novel K locus (Figure 7.3; Figure
7.4), but lacked hypermucoid phenotype and rmpA and magA, indicators for the
hypervirulent K1 capsular phenotypes of K. pneumoniae (Coutinho et al., 2014). It is
likely that there are others, as yet unidentified, determinants of virulence responsible
for the ST771 K. variicola. However, the high mortality attributable to the K. variicola
outbreak strain was supported by G. mellonella models, demonstrating high larval
death rates compared to the hypervirulent ST23 K1 K. pneumoniae strain, A58300
(Figure 7.7).
The isolates of K. variicola outbreak exhibited variable resistance patterns. K.
variicola ST771 acquired antimicrobial resistance genes including blaNDM-1
horizontally during the course of outbreak (Figure 7.3). Exposure to ceftriaxone and/or

287
ceftazidime and amikacin in the NICU may have favoured the blaCTX-M-15 and aph(3’)-
VIa/blaNDM-1 acquisition (Figure 7.3, Table 7.3). Acquiring a resistance plasmid is
often associated with bacterial fitness costs (Yang et al., 2017). This could explain the
lower mortality observed clinically and in the in-vivo virulence model for blaNDM-1
positive vs blaNDM-1 negative K. variicola (Figure 7.7).
Healthcare resources in Bangladesh allow only limited surveillance of
healthcare associated infections (WHO, 2020d). The neonatal NICU in DMCH
consists of 36 beds, having 3,500 neonatal admissions annually. To overcome the load,
the beds are often shared by two or three neonates. There is only two washing stations
and the unit is not properly structured according to recommended standards (White,
2013). Blood cultures are not routinely taken at DMCH NICU and neonates are only
followed up when empirical antibiotics fail with minimal antibiotic stewardship
management or infection control as to other units in the hospital (Rahman, personal
communication). The hospital environment including patients and healthcare
providers could be the potential reservoirs of MDR infections, and outbreaks are
inevitable in these settings (Dramowski et al., 2017). The outbreak by MDR virulent
strains, in under-resourced hospitals, where antibiotics usage is empirical and IPC is
suboptimal, would pose significant challenges, and as witnessed by this study, result
in numerous deaths.

288
Section Eight
Emergence of Mobile Colistin Resistance in a Clinical Setting
in Bangladesh

289
8.1 Introduction
Colistin is the member of cationic polypeptide, is the last line option for the
treatment of MDR infections. The spectrum of colistin is narrow, only active against
Gram-negative bacteria. Furthermore, Proteus spp., Neisseria spp., Serratia spp.,
Providencia spp., Burkholderia pseudomallei, M. morganii, and E. tarda, and certain
anaerobic bacteria are constitutionally resistant to colistin (Falagas and Kasiakou,
2005; Bialvaei and Samadi, 2015). Widespread colistin usage in agriculture;
particularly, for prophylaxis and as a growth feed additive in animal production could
have exacerbated the growing prevalence of plasmid-mediated colistin resistance,
‘mcr’ throughout China and globally (Shen et al., 2016; Wang et al., 2018; Luo et al.,
2020). Although recent reports suggest the emergence of mcr in the food-chain,
environment, and human in Pakistan, India, and Bangladesh (Azam et al., 2017; Gogry
et al., 2019; Palani et al., 2020; Parvin et al., 2020), the epidemiology of mcr-like
mechanisms in SA is still largely unknown. This chapter summarizes the epidemiology
of mcr-positive Enterobacterales associated with human infections/colonisation in a
Bangladeshi health setting in Dhaka.

290
8.2 Results
8.2.1 Prevalence of human-associated mcr in a Bangladeshi health setting
The prevalence of mcr among the patients with Enterobacterales infections was
1.1% (6/534). Three patients with K. pneumoniae infections were positive for mcr-8.1,
two patients with E. coli infections were positive for mcr-9.1, and one patient with E.
cloacae was positive for mcr-9.1. K. pneumoniae and E. cloacae positive for mcr-8.1
and mcr-9.1, respectively were phenotypically resistant to colistin, however E. coli
carrying mcr-9.1 was phenotypically sensitive to colistin.
As it has been stated previously, the faecal carriage study was undertaken
within a year of the clinical study with an aim to investigate the prevalence and
transmission dynamics of CRE faecal colonisation in Bangladesh. Therefore, faecal
specimens were cultured onto media containing vancomycin (10mg/L), and ertapenem
(2mg/L). As this carriage study was not designed to estimate the prevalence of mcr,
subsequent analysis is likely to be underestimated. Out of 700 non-duplicate faecal
specimens, one E. coli isolated was positive for mcr-1.1 which also exhibited colistin
resistance phenotypically.
This PhD describes the entire genomic details of mcr-1.1-positive E. coli
(MCRPEC), and mcr-8.1-positive K. pneumoniae (MCRPKP) by merging clinical
profile of pertinent patient. However, the genomic, and functional properties of mcr-
9.1 were not elucidated in this PhD.

291
8.2.2 Description of the case colonised by MCRPEC
The MCRPEC (RS571; accession no: CP034389- CP034392) was isolated
from the rectal swab culture of a 17-year boy who was admitted to the burn’s ICU,
DMCH with 53% flame burn involving much of the trunk and face. He suffered smoke
inhalation injury and became severely hypoxic. The patient worked as a labourer in a
garment factory in Munshiganj district and the injury was sustained due to a gas pipe
leak.
RS571 was identified 2 days after admission so the patient could have acquired
the MCRPEC in the community or the hospital. Clindamycin and ceftriaxone treatment
were commenced early in the hospital stay. The patient died on day 5 of admission,
with the cause of death given as septicaemia. No clinical specimens were referred for
culture during his hospital stay so it is not known whether the patient was colonising
flora or whether the organism played a pathogenic role, although RS571 was resistant
to all antibiotics the patient received during admission. MCRPEC (RS571) isolated in
this study belonged to E. coli ST648.

292
8.2.3 Resistance profile of MCRPEC
E. coli RS571 was resistant to amoxicillin-clavulanate, piperacillin-
tazobactam, ceftazidime, cefotaxime, cefepime, ciprofloxacin, gentamicin,
trimethoprim-sulfamethoxazole, and colistin. The isolate was susceptible to imipenem,
meropenem, amikacin, fosfomycin, and tigecycline (Table 8.1). WGS revealed a 1626
bp ORF encoding putative phosphoethanolamine transferase, consisting of 541 amino
acid which exhibited 100% nucleotide sequence identity to mcr-1.1. In addition to mcr-
1, other resistance genes such as blaTEM-1B, aac(3)-IId, aph(3'')-Ib, aph(6)-Id, aph(3')-
Ia, aadA1, aadA2, sul3, dfrA14, mph(A), tet(A), catB3, cml and floR (plasmid
mediated) and aac(6')-Ib-cr, aac(3)-IIa, blaTEM-1B, blaOXA-1 and blaCTXM-15
(chromosomal) were present in the isolate.
The mcr-1.1 in E. coli can be transferred to the recipient K. variicola and with
a transfer frequency of 8.3 X 10⁻⁵. Transconjugants were more resistant to colistin than
donor (MIC 32 µg/ml) and conferred resistance to gentamicin and trimethoprim-
sulfamethoxazole as well (Table 8.1).

293
Table 8.1 MIC of antimicrobials against transconjugants obtained in this study along
with donor (RS571, accession no: CP034389- CP034392) and recipient (BD_DM_07,
accession no: PJQN00000000).
Antibiotics Donor
(RS571)1
Recipient
(BD_DM_07)1
Transconjugant1
Piperacillin-
tazobactam
8 4 8
Ceftazidime 32 0.125 0.25
Cefotaxime >256 0.125 0.25
Cefepime 32 0.125 0.125
Imipenem 0.25 0.125 0.25
Meropenem 0.25 ≤0.06 ≤0.06
Ciprofloxacin 256 4 4
Levofloxacin 32 0.5 1
Amikacin 8 4 4
Gentamicin 256 4 128
Trimethoprim-
sulfamethoxazole
256 64 256
Fosfomycin 1 8 8
Minocycline 1 16 16
Tigecycline 2 2 4
Colistin 16 0.5 32
1MIC values for the antibiotics are in µg/ml.

294
8.2.4 Genetic context of plasmids carrying mcr-1.1 in this study
The draft genome sequence of E. coli strain RS571 was assembled into 4
contigs with an N50 length of 5,085,958 bp. A 257,243 bp long plasmid which carried
mcr-1.1 was named pRS571-MCR-1.1 (accession no: CP034390) and belongs to the
IncHI2-ST3 replicon type. One copy of mcr-1 (nucleotide 214,483 to 216,108) was
found in pRS571-MCR-1.1, flanked by ISApaI1 (nucleotide 213,314 to 214,287) at
the 5ʹ end (Figure 8.1). Other resistance genes such as tet(A), floR, aph(6)-Id, aph(3''),
Ib- aph(3'), Ia- aadA1, sul3, aad2, blaTEM-1B, mph(A), dfrA14 were in the nucleotide
position 123,150 to 159,667 which were associated with several transposable
elements, IS26, ISCR2, IS1133, IS903B, IS406 and class 1 integron, In191. From
nucleotide position 93,220 to 96,205, aph(3')-Ia, aph(6), Id aph(3'')-Ib were found
which were flanked by IS26 (Figure 8.1). The variable region of pRS571-MCR-1.1
shared the most identity with pSA186_MCR1 (CP022735.1) and pSA26-MCR-1
(KU743384.1) (88% coverage and 99% nucleotide identity for both), isolated from the
Arabian Peninsula (Figure 8.2).

295
Figure 8.1 Structural organization of plasmid, pRS571-MCR-1.1 (accession no: CP034390). Schematic representation of genetic context of
resistance loci are represented in further detail. Arrows represent the position and transcriptional direction of the open reading frames. Resistance
genes are represented by red, transposase elements in green, genes associated with conjugation in blue, replication-associated genes in purple,
regulatory/accessory genes in grey, hypothetical proteins in yellow and IRs in pink.

296
Figure 8.2 Linear comparison of plasmid sequence pRS571-MCR-1.1 (accession no: CP034390), pSA186_MCR1 (accession no: CP022735.1)
and pSA26-MCR-1 (accession no: KU743384.1). Forward matches are indicated by red and reverse matches by blue. Region of sequence with

297
homology to the other genomes are separated by black lines. Genes associated with pRS571-MCR-1.1 are represented by colour. Resistance genes
are represented by red, transposase elements in green, genes associated with conjugation in blue, replication-associated genes in purple,
regulatory/accessory genes in grey and hypothetical proteins in yellow. Genomic comparison was performed by artemis comparison tool (ACT)
(v.18.0.1).

298
8.2.5 Description of cases with infections by MCRPKP
MCRPKP were recovered from the urine of two patients admitted under
urology, and the blood of a third patient in the DMCH NICU. Case 1 (BD_DM_697)
was a 55-year-old male with benign enlargement of the prostate with diabetes mellitus,
and history of catheterisation for 13 days. Case 2 (BD_DM_782) was a 63-year-old
male patient with a left renal tumour, a history of catheterisation for 15 days and
haematuria. These patients were discharged on day 20 and 35 of hospitalization,
respectively. Case 3 (BD_DM_914) was a 5-day pre-term LBW neonate with late
onset of sepsis who died within 18 days after hospital admission. We did not observe
any overlapping of hospital stay among the MCRPKP cases (Table 8.2).

299
Table 8.2 Characteristics of the patients with MCRPKP.
Sample ID Age Sex SEC Ward DOA Diagnosis Probable
risk
Sample DOSC Antibiotics
prescribed
Outcome DOO
BD_DM_697 55
years
M BPL Urology 3.4.17 BEP DM,
catheterized
Urine 16.4.17 CIP Discharge 22.4.17
BD_DM_782 63
years
M BPL Urology 23.4.17 Left renal
tumour
Haematuria,
catheterized
Urine 8.5.17 CFX Discharge 27.5.17
BD_DM_914 5 days M Poor NICU 26.6.17 LONS PT, LBW Blood 2.7.17 CRO, VAN Died 13.7.17
SEC, socio-economic condition; DOA, date of admission; DOSC, date of sample collection; DOO, date of outcome; M, male; DM, diabetes
mellitus; CIP, ciprofloxacin; CFX, cefixime; NICU, neonatal intensive care unit; LONS, late onset neonatal sepsis; PT, pre-term; LBW, low birth
weight CRO, ceftriaxone; VAN, vancomycin.

300
8.2.6 Investigation of clonal relatedness of MCRPKP
All MCRPKP isolated in this study belonged to K. pneumoniae ST15. The
isolates differed by 0 to 1 SNP after recombination removal. Phylogenetic analysis of
all K. pneumoniae ST15 isolated in this study revealed that all MCRPKP clustered into
one clade (Figure 8.3). All MCRPKP were associated with the blaCTX-M-15. It is noted
that 96% (18/29) of K. pneumoniae ST15 identified from clinical and faecal specimens
in this study carried blaCTX-M-15 (Figure 8.3).

301
Figure 8.3 Phylogenetic tree of K. pneumoniae ST15 identified in this study (n=29). ML phylogenetic tree constructed using core-genome
alignment Roary (v3.12.0). Visualisation of phylogenetic trees and incorporation of metadata with the trees were performed using phandango
(Hadfield et al., 2018). Epidemiologically important resistance genes are indicated by orange cells, accessory genes by blue cells and absence of
genes by white cells.

302
8.2.7 Resistance profile of MCRPKP
MCRPKP were resistant to amoxicillin-clavulanate, piperacillin-tazobactam,
cephalosporins (ceftazidime, cefotaxime), ciprofloxacin, levofloxacin, gentamicin,
trimethoprim-sulfamethoxazole and colistin and susceptible to carbapenems,
amikacin, fosfomycin and tigecycline (Table 8.3). All the isolates shared common
resistance genes. In silico genome-wide analysis of MCRPKP detected 1698 bp open
reading frame (ORF), encoding a phosphoethanolamine transferase, showing 100%
nucleotide identity to mcr-8.1. Other ARGs found in the isolates were: blaSHV-106,
blaTEM-1B, blaOXA-1, blaCTX-M-15, aac(6')-Ib-cr aac(3)-IIa, aph(6)-Id, aph(3')-Ia,
aph(3'’)-Ib, aadA2, qnrB1, sul2, sul3, dfrA14, fosA6, cmlA1, mdf(A), mef(B), oqxA,
oqxB, and tet(A).
The conjugation assay confirmed the transferability of the plasmid containing
mcr-8.1 to E. coli J53 with a frequency range of 3.1 x 10⁻² to 8 x 10⁻². Phenotypically,
the transconjugants were resistant to ampicillin, amoxicillin-clavulanate, 3rd
generation cephalosporins, trimethoprim-sulfamethoxazole and colistin (Table 8.3).

303
Table 8.3 Range of MIC values of transconjugants obtained in this study along with
donors and recipient.
Antibiotics Donors1 Recipient (E. coli
J53)1
Transconjugants1
Ampicillin 128-≥256 2 64-256
Amoxicillin-
clavulanate
256 2 64-256
Piperacillin-
tazobactam
16 2 2
Ceftazidime 32 ≤0.06 32
Cefotaxime 128 ≤0.06 128
Cefepime 16-32 ≤0.06 0.25
Imipenem 0.25 ≤0.06 ≤0.06
Meropenem ≤0.06 ≤0.06 ≤0.06
Ciprofloxacin 256 ≤0.06 ≤0.06
Levofloxacin 64 ≤0.06 ≤0.06
Amikacin 2-4 2 2
Gentamicin 32 0.5 0.5
Trimethoprim-
sulfamethoxazole
128 2 32-128
Colistin 8 ≤0.06 8
1MIC values for the antibiotics are in µg/ml.

304
8.2.8 Genetic context of plasmids carrying mcr-8.1 in this study
Complete plasmid sequences were determined for pKP782 (accession no:
CP046384) and pKP914 (accession no: CP046952) by hybrid assembly, while pKP697
(accession no: CP046942) was not successfully closed. Genome-wide analysis
demonstrated that the plasmids recovered from the MCRPKP were almost identical to
each other (Figure 8.4). The draft genome sequences and S1 PFGE indicate that mcr-
8.1 in K. pneumoniae were located on identical IncFIB(pQil) plasmids of ~113 kb
(accession no: CP046384, CP046952 & CP046942) (Figure 8.5, Figure 8.6). Genetic
environment analysis of plasmids with mcr-8.1 showed that three genes, upstream of
mcr-8.1 (cobD-ΔNAT-Δgtf-mcr-8.1) was flanked by IS903B and the downstream
(mcr-8.1-copR-baeS-dgkA-Δgtf-ΔHP-ΔHP-blaampC-MipA-sbmC-ΔHP-blaampC),
flanked by ISKpn21. Additional resistance profiles were found: sul2, APH(6)-1d, and
APH(3’’)-Ib, flanked by IS91 at the downstream and blaCTX-M-15 and blaTEM-1b with
composite transposons, flanked by insertion sequences. All resistance components in
IncFIB(pQil) plasmids in this study were bracketed by IS903B from nucleotide
position 20,590 bp to 64,656 bp (Figure 8.7).
MCRPKP and shared 99.72% nucleotide identity at 70% coverage with
previously described plasmids (accession no: CP023922.1 and CP024040.1) which
were absent for mcr-like genes (Figure 8.7). The genetic environment around mcr-8.1
in IncFIB(pQil)-MCR-8.1 (pKP697, pKP782 & pKP914) shared identity with a
previously described mcr-8.1 containing plasmid isolated from pigs in China
(accession no: MG736312.1), although the plasmids harbouring mcr-8.1 in this study
were truncated at the 5’ end and IS903B at the 3’ end was replaced by ISKpn21 (Figure
8.8).

305
Figure 8.4 Linear comparison of plasmid sequence pKP914 (accession no: CP046952) and pKP782 (accession no: CP046384), recovered in this
study. Forward matches are indicated by red and reverse matches by blue. Regions of sequence with homology to the other genomes are separated
by black lines. Genomic comparison was performed by ACT (v.18.0.1).

306
Figure 8.5 Genetic organization of plasmid harbouring of mcr-8.1. Circular view of
pKP914 (accession no: CP046952).

307
Figure 8.6 Pulsed-field gel of S1 nuclease digested gDNA carrying mcr-8.1 and in-
gel hybridization with mcr-8.1 probe.

308
Figure 8.7 Schematic layout of sequence comparison of pKP914 (accession no: CP046952) against FDAARGOS_440 plasmid unnamed2
(accession no: CP023922.1) and pMR0617ctx (accession no: CP024040.1). Arrows represent the position and transcriptional direction of the open

309
reading frames. Genomic comparison was performed by ACT (v.18.0.1). APH, aminoglycoside phosphotransferase; baeS, histidine-protein kinase;
bla, beta-lactamase; Cob, cobalamin biosynthesis; Cop, copper homeostasis transcription factor; dgkA, diacylglycerol kinase; DJ-1/PfpI, cysteine
peptidase; gtf, glucosyltransferase; Hha, Hemolysin expression-modulating protein; IRL, inverted repeat left; IRR, inverted repeat right; IS,
insertion sequence; mcr-8.1, mobilized colistin resistance; NAT, N-Acetyltransferase; sul2, dihydropteroate synthase.

310
Figure 8.8 Comparison of genetic environments of mcr-8.1. APH, aminoglycoside phosphotransferase; baeS, histidine-protein kinase; bla, beta-
lactamase; Cob, cobalamin biosynthesis; Cop, copper homeostasis transcription factor; dgkA, diacylglycerol kinase; DJ-1/PfpI, cysteine peptidase;
gtf, glucosyltransferase; Hha, Hemolysin expression-modulating protein; IRL, inverted repeat left; IRR, inverted repeat right; IS, insertion
sequence; mcr-8.1, mobilized colistin resistance; NAT, N-Acetyltransferase; sul2, dihydropteroate synthase.

311
8.2.9 Determining the stability of plasmid carrying mcr-8.1
The plasmids harbouring, mcr-8.1 was stable on serial dilution without any
antibiotic challenge. Compared to day 0, the abundance of mcr-8.1 versus HKG was
static up to day 12. Interestingly increased abundance of mcr-8.1 was observed on day
3 for all three strains (Figure 8.9). We did not find any mutations in AA sequences of
PmrA, PmrB, PhoP, PhoQ or mgrB of MCRPKP compared to colistin sensitive K.
pneumoniae isolates from this study.

312
Figure 8.9 Stability of plasmid mediated colistin resistance in K. pneumoniae. Colistin resistance mechanism, mcr-8.1 was highly stable after 12
days of passaging in colistin free medium.

313
8.2.10 Determining fitness cost of MCRPKP
This study observed significant lower growth over time in transconjugants
(TDM697b and TDM914b) than E. coli J53 (p<0.0001) (Figure 8.10). However,
considerable variabilities on growth were also found among the transconjugants
formed due to acquisition of plasmids pKP697, pKP782 & pKP914. Compared to E.
coli J53 lower growth rate was also observed in TDM782b; however, the fitness cost
was not statistically significant (Figure 8.10).

314
Figure 8.10 Analysis of bacterial fitness cost. A. Growth curve of trnasconjugants
compared to E. coli J53. B. Growth rate of trnasconjugants compared to E. coli J53,
fitted with the Gompertz model.

315
8.3 Discussion
There is gap in our understanding on the usage of colistin in SA (Lundborg and
Tamhankar, 2017). A report by Davies and Walsh (2018) substantiates the export of
thousand tonnes of colistin from China to India, Vietnam, and South Korea in 2016.
The usage of colistin is apparent as growth promoter in food chain in SA countries
(Davies and Walsh, 2018). The main source of active pharmaceutical ingredient (API)
for antibiotics manufacture in Bangladesh are India followed by China (OEC, 2020).
Before the announcement for banning of colistin in Indian poultry sector by the Indian
Government in 2019 (Kannan, 2019), the import of colistin API to Bangladesh was
frequent. As the Bangladesh Governmental legislation (2007) directs not to usage of
antibiotics in animal feed (Hoque et al., 2020), local farmers often use colistin in
drinking water for food animals (Saha, personal communication). The reports of mcr
in the food chain, environment, and human flora in Bangladesh also signify its usage
(Islam et al., 2017; Sobur et al., 2019a; Sobur et al., 2019b; Akter et al., 2020; Amin
et al., 2020; Johura et al., 2020). This study demonstrated human-associated mcr
variants for the first time in SA and the mechanism has been characterized
comprehensively. The findings of this chapter have been published upon identification
of this high-end resistance mechanism from Bangladeshi specimens (Farzana et al.,
2019b; Farzana et al., 2020a). The laboratory work, and analysis related to the work
have been completely performed by me as a part of this PhD. Only the sequencing
services (Illumina MiSeq) were provided by Prof. Walsh's genomic laboratory at CU.
The population of mcr-1 carrying E. coli is highly diverse (Wise et al., 2018;
Long et al., 2019; Hoa et al., 2020; Luo et al., 2020). mcr-1 described in our study was
linked to E. coli ST648 on a conjugative IncHI2 plasmid. The clone of E. coli, ST648
with IncHI2 has been documented as inter-human mcr-1 transmission (Hadjadj et al.,
2017). In this study, 9.2% of E. coli (21/228) recovered from clinical infections 6.5%
(19/293) from faecal samples, belonged to ST648. The clone, E. coli ST648 was
considered as high risk for blaNDM-4 (p<0·0001) (Chapter 5). The acquisition of mcr-
1.1 in the clone can be an added concern. The global dissemination of mcr-1.1 has
been described in associations with the plasmid background of IncX4, IncI2 and
IncHI2 (Wang et al., 2018a; Luo et al., 2020). It is speculated that 70% of IncHI2
carrying mcr-1 derived from Europe (Matamoros et al., 2017). The variable region of

316
pRS571-MCR-1.1 (isolated in this study) shared most identity with pSA186_MCR1
(CP022735.1) and pSA26-MCR-1 (KU743384.1) (88% coverage and 99% nucleotide
identity for both), isolated from the Arabian Peninsula (Sonnevend et al., 2016). It is
likely that mcr-1 was initially captured and mobilized by the composite transposon
Tn6330 (ISApl1-mcr-1-pap2-ISApl1), followed by the loss of ISApl1 over time,
leading to the stabilisation of mcr-1 in diverse plasmid backgrounds and therefore
dissemination via horizontal transfer (Wang et al., 2018a). In this study, mcr-1.1 from
nucleotide 213,314 to 214,287, flanked by ISApaI1 at the 5ʹ end and other resistance
determinants were located separately on the plasmid (Figure 8.1), suggesting
independent mobilisation of mcr-1 into a MDR IncHI2-ST3 plasmid by ISApaI1 and
inferring further possible dissemination of mcr-1.1 via insertional transposition or
transfer of a highly resistant plasmid in the hospital setting.
The emergence of mcr-8.1 in both animal, and human from China has been
described by several reports (Wang et al. 2018b, Wang et al., 2019). The variants of
mcr-8 were further reported from China, Laos, and Algeria (Hadjadj et al., 2019; Nabti
et al., 2020; Yang et al., 2020). None of the previous reports found the association of
mcr-8 with a particular clone. Genomic analysis revealed that mcr-8.1 was circulated
at DMCH through the clone of K. pneumoniae ST15 (Figure 8.3). The isolates were
shown to be differed by 0 to 1 SNP after recombination removal and were not confined
to a single ward (Table 8.2). ST15 has been regarded as successful clone in
disseminating blaCTX-M-15 globally (Baraniak et al., 2013; Ewers et al., 2014; Harada
et al., 2016). It was worrying that K. pneumoniae ST15, associated with the highly
prevalent resistance gene in the region of SA, is blaCTX-15 positive and has acquired
colistin resistance (Bevan et al., 2017). The colistin resistance, mcr-8.1 in this study
was carried by an identical IncFIB(pQil) conjugative plasmid (Table 8.3; Figure 8.6).
Earlier studies described the presence of mcr-8 with IncFII, and IncP (Wang et al.
2018b, Hadjadj et al., 2019; Wang et al., 2019; Nabti et al., 2020; Yang et al., 2020).
The plasmid background of IncFIB(pQil)-MCR-8.1 was very similar to the previously
described plasmids without any mcr-like mechanism (Figure 8.7); IncFII plasmids
isolated from pigs in China (accession no: MG736312.1). However, IS903B at the 3’
end have been replaced by ISKpn21 (Figure 8.8). It is possible that mcr-8.1 was
originally transposed to the IncFIB(pQil) plasmid by IS903B composite transposon
(Figure 8.7; Figure 8.8). Incidentally, all resistance components in IncFIB(pQil)

317
plasmids in this study were bracketed by IS903B from nucleotide position 20,590 bp
to 64,656 bp, suggesting the potential for transposition of the entire intervening DNA
segment (Figure 8.7; Figure 8.8). Our findings demonstrate that the IncFIB(pQil)
plasmid harbouring mcr-8.1 was remarkably stable (Figure 8.9), suggesting adaptive
plasmid-host evolution (Stalder et al., 2017). Yang et al., (2017) reported that colistin
susceptibility could be attenuated after serial passaging of mcr-1 positive strains in
antibiotic-free medium. K. pneumoniae ST15 can be a vector capable of spreading
mcr-mediated colistin resistance, particularly in a setting with sub-optimal IPC
practices (Hawkey, 2015; Cimmino et al., 2016; Sood and Perl, 2016; Cheng et al.,
2018). Acquisition of a resistance plasmid may impose a fitness cost, depending on
the host and plasmid backbones (Humphrey et al., 2012; Yang et al., 2017). Growth
rates over time of transconjugants (TDM697b and TDM914b) were significantly lower
than that of E. coli J53 (p<0.0001) (Figure 8.10), implying significant fitness cost
owing to the acquisition of plasmid harbouring mcr-8.1.
This is the first comprehensive report of human-associated mcr in humans from
SA. These data indicate the need for a “one health” surveillance system in Bangladesh
to prevent the spread of mcr in human medicine (Walsh, 2018).

318
Section Nine
Molecular and Epidemiological Analysis of a Burkholderia
cepacia sepsis outbreak from a Tertiary Care Hospital in
Bangladesh

319
9.1 Introduction
9.1.1 Bloodstream infections and Burkholderia cepacia complex
BSI is the presence of viable microorganisms (bacteria or fungi) in blood,
eliciting the alteration of clinical, laboratory and hemodynamic parameters as a result
of inflammatory response and essentially established by a positive blood culture.
Generally, BSI can be categorized based on target groups: i. an immunologically
normal host, ii. physiologically immunocompromised patients, e.g. extreme age
(newborns, elderly), iii. patients predisposing to infections due to pathological
conditions or medications. However, BSI in third category group can vary according
to hosts’ immune status, underlying disease conditions and environmental factors
(Viscoli, 2016).
Burkholderia cepacia complex (Bcc) is considered as opportunistic human
pathogen, pose a significant health risk particularly to cystic fibrosis (CF) patients,
resulting life threatening lung infection, bacteraemia and death (Dentini et al., 2017;
Sfeir, 2018). B. cepacia bacteraemia also has been reported in association with
nosocomial outbreaks and patients admitted in ICU; however, Bcc is also associated
with host and/or environmental risk factors such as immunosuppression, co-
morbidities, exposure to medical devices or surgical interventions, use of central
venous catheter and prolonged hospital (Baul et al., 2018; Becker et al., 2018; Gupta
et al., 2018; Rastogi et al., 2019).
9.1.2 Risk factors for burn infections briefly
Burn sepsis is one of the major complications of burn injury, accounts for 50-
60% of death followed by burn, leads to multiple organ dysfunction
syndrome (MODS) which is a key indicator for sepsis (Hogan et al., 2012; Manning,
2018).
A variety of factors increase the risk of developing invasive burn wound
followed by sepsis includes individual with burn of >20% of total body surface area
(TBSA), inhalation injury, delayed in burn wound excision, extreme age (very old,
very young) and impaired immunity (Hidalgo et al., 2016; Rech et al., 2019). Increase
length of hospital stay, use of artificial medical and ICU admission predispose to sepsis
(Dolp et al., 2018; O'Brien et al., 2019).

320
9.1.3 The genus Burkholderia
The genus Burkholderia is a member of Proteobacteria, includes species
associated with plant, animal and human pathogenesis and symbioses which was
identified in 1940 by Walter H. Burkholder as a cause of sour skin of onion (Kenna et
al., 2017). Burkholderia are Gram negative, catalase-producing, lactose-
nonfermenting, obligately aerobic bacilli. Burkholderia encompasses species of Bcc,
Burkholderia mallei, B. pseudomallei and B. gladioli. All the members of
Burkholderia are motile except B. mallei (Kenna et al., 2017; Wikipedia, 2020f). Three
monophyletic clusters have been demonstrated with the genera, consists of Bcc, B.
pseudomallei and closely related species, and of most of the phytogenic species within
the genus, including Burkholderia glumae and Burkholderia gladioli (Figure 9.1)
(Sawana et al., 2014). Bcc and B. pseudomallei are human pathogens, causing lung
infection, particularly in CF patients and melioidosis, respectively, whereas B. mallei
is responsible for disease in horses or related animal, causing glanders (Kenna et al.,
2017; Wikipedia, 2020f).

321
Figure 9.1 A maximum likelihood phylogenetic tree of members of the genus
Burkholderia based conserved proteins. Reproduced from (Sawana et al., 2014).

322
9.1.4 Burkholderia cepacia complex
Bcc is composed of at least 20 different species (Figure 9.1), including B.
cepacia, B. multivorans, B. cenocepacia, B. vietnamiensis, B. stabilis, B. ambifaria, B.
dolosa, B. anthina, B. pyrrocinia, and B. ubonensis. (Kenna et al., 2017; Wikipedia,
2020f). In the mid-1980s, Bcc was described in CF patients as a cause of sepsis called
“Cepacia Syndrome”, characterized by lung function deterioration, bacteraemia and
death (Isles et al., 1984). The members of Bcc are typically found in soil, water, plant,
rhizosphere, and in animals and can survive for prolonged periods in moist
environments, even in presence of disinfectants, therefore serves as a potential
reservoir for nosocomial infections (Donlan and Costerton, 2002; Tsang, 2004). The
Bcc large genome (7-9 Mb) consisting of several chromosomes and plasmids support
their metabolic versatility and facilitate to adapt in adversarial environment (Holden
et al., 2009; Agnoli et al., 2012). Many members of Bcc are inherently virulent and
resistant to many antimicrobials (Rhodes and Schweizer, 2016; Bochkareva et al.,
2018).
9.1.4.1 Pathogenesis of Bcc
Although the virulence factors associated with Bcc are not well documented,
the lung pathogenesis by Bcc has been elicited due to the following factors. Bcc
associated with high mortality among the CF patients with lung transplantation
(Dentini et al., 2017). The clinical impact of lung infections by different species of
Burkholderia in CF patients after lung transplantation is variable; B. cenocepacia and
B. multivorans have been shown to be more virulent than other species (Olland et al.,
2011; Loutet et al., 2020).

323
9.1.4.1.1 AMR in Bcc
The genomes of Bcc species contain various β-lactamase genes, includes
ampC, having hydrolytic activity for expanded-spectrum cephalosporins, and ampD,
encode cell wall-recycling enzyme (N-acetyl-anhydromuramyl-L-alanine amidase)
(Holden et al., 2009). Mutation of ampD leads to accumulation of 1,6-anhydro-
MurNAc-peptides in the cytoplasm resulting in penR (AmpR) mediated transcription
of penB and ampC target; therefore, mediates resistance to β-lactams (Figure 9.2)
(Harris, 2015; Rhodes and Schweizer, 2016). Efflux pumps in relation to AMR have
been studied intricately in B. cenocepacia. Several efflux pumps of the resistance
nodulation cell division (RND) family have been described in B. cenocepacia which
have been associated with efflux of antimicrobials (Table 9.1) (Podnecky et al., 2015;
Rhodes and Schweizer, 2016). The number of porins in Bcc is like P. aeruginosa
exhibiting similar permeability of antimicrobials, but 10-fold less than E. coli. Hence
Bcc is comparatively more resistant to any antimicrobials. Additionally, Bcc has an
amino arabinose biosynthesis operon which synthesize 4-amino-4-deoxy-L-arabinose
(Ara4N) responsible for modifications of lipid A, resulting in intrinsic resistant to
polymyxin. Target modification has also been observed among the species which are
associated with the resistance to fluoroquinolones and trimethoprim (Rhodes and
Schweizer, 2016).

324
Figure 9.2 β-lactam resistance mediated by ampC overexpression. Reproduced from
(Harris, 2015). Bcc show reduced susceptibilities to β-lactams due to ampD mutation.

325
Table 9.1 Efflux pumps of RND family in B. cenocepacia causing antimicrobial
resistance (Podnecky et al., 2015).
Efflux
pumps
Gene name Efflux of antimicrobials
RND-1 NA1 Non-detectable
RND-3 NA1 Nalidixic acid, ciprofloxacin, tobramycin,
chlorhexidine
RND-4 NA1 Aztreonam, chloramphenicol, fluoroquinolones,
tobramycin
RND-8 NA1 Tobramycin
RND-9 NA1 Tobramycin, chlorhexidine
RND-10 ceoAB-
opcM
Chloramphenicol, fluoroquinolones, trimethoprim
1NA, not applicable

326
9.1.4.1.2 Colonisation factors
Bcc colonizes the respiratory tract in CF by means of their motility, adhesion,
tissue damage and biofilm formation. B. cenocepacia with flagella-gene mutants are
capable to invade respiratory epithelial cells and survive in murine models of infection.
Pilli are the determinants for adhesion and different lipases and proteases produced by
the bacteria causing tissue damage. Once colonization has been established at the site
of infection, bacteria invariably form biofilms. While more abundant biofilms are
formed by B. cenocepacia and B. multivorans, all the members of Bcc can produce
biofilms, enhancing both pathogenesis and antimicrobial resistance
(Mahenthiralingam and Vandamme, 2005; Shommu et al., 2015; Sfeir, 2018).
9.1.4.1.3 Cell surface properties
LPS of Bcc mediates intrinsic resistance to cationic antibiotics such as
polymixin (discussed above) and antimicrobial peptides such as human defensins and
five times more endotoxic than other CF pathogens. Moreover, Bcc LPS by possessing
an O-antigen sugar side chains mediating rough phenotypes, are more resistant to
killing by human serum than Bcc with smooth phenotypes lacking sugar linkage
(Mahenthiralingam and Vandamme, 2005; Shommu et al., 2015; Sfeir, 2018).
9.1.4.1.4 Cellular invasion
Bcc is capable to invade and survive in eukaryotic cells and yield bacteraemia
in CF. B. cenocepacia gathers on the apical surface of cell and invade into the cell via
a biofilm-dependent pathway. Flagella and proteins homologous to type III secretion
system help in invasion (Mahenthiralingam and Vandamme, 2005; Shommu et al.,
2015; Sfeir, 2018).
This chapter describes an outbreak of B. cep acia bacteraemia in a burn’s
critical care unit at DMCH supported by WGS. The population structure and genetic
relationship of B. cepacia isolated in this study were compared with 91 global B.
cepacia deposited previously in the ‘Burkholderia Genome Database’ (Burkholderia
Genome DB, 2020). Although the objectives of this PhD focused on Enterobacterales
infections, this study attempted to explore this outbreak to inform the importance of
standard IPC policies in Bangladesh.

327
9.2 Result
9.2.1 Study population and overview of B. cepacia cases
Among 528 blood specimens, 45% (237/528) were culture positive and 3%
(15/528) were B. cepacia BSI. The study outline is shown in Figure 9.3. Of the 15 B.
cepacia infected patients, 7 (46.7%) were male and 8 (53.3%) were female; the mean
(±SD) age was 14 years (±12.57). All patients in this cohort belonged to a low socio-
economic group (lower middle to below the national poverty level). The mean (±SD)
hospital stay of B. cepacia cases was 43.9 days (±27.1). Antibiotic usage among the
cases with B. cepacia septicaemia was: ceftriaxone, 80.0%; amikacin, 53.3%;
levofloxacin, 33.3%; ceftazidime, 20%; meropenem, 13.3%, colistin, 13.3%;
flucloxacillin, 6.7%; azithromycin, 6.7%; gentamicin, 6.7%; clindamycin, 6.7%;
cefuroxime, 6.7% (Table 9.2). Two of the B. cepacia cases took discharge against
medical advice (DAMA). Not including DAMA, the mortality rate was 31% (4/13)
(Table 9.2; Figure 9.4). Patient characteristics are illustrated in Table 9.2. The first
case was admitted to paediatrics department of DMCH on the 23rd of October 2016.
According to hospital records, the patient was a suspected case of sepsis, and blood
was sent for culture and sensitivity on the 2nd of November 2016 which was positive
for B. cepacia. The rest of the cases were confined to the burn HDU or the burn
paediatric HDU or the burn ICU (Table 9.2; Figure 9.4). Excluding DAMA (5/135),
in the burn unit, the mortality rate for patients with other bacterial sepsis was higher
(60.17%, 71/118) compared to B. cepacia sepsis (33.33%, 4/12) (p=0.073).

328
Figure 9.3 Study flowchart.

329
Table 9.2 Clinical characteristics of patients infected with B. cepacia.
M, male; F, female; SEC, socio-economic condition; BPL, below poverty level, LM, lower middle; DOA, date of admission; DOSC, date of sample
collection; DOD, date of discharge/DAMA/death; THS, total hospital stay; Pae, paediatrics; FB, flame burn, EB, electric burn; II, inhalation injury;
MB, mixed burn; SC, scald burn; DAMA, discharge against medical advice. AMK, amikacin; AZM, azithromycin; CAZ, ceftazidime; CXM,
cefuroxime; CST, colistin; CLI, clindamycin; CRO, ceftriaxone; FLU, flucloxacillin; GEN, gentamicin; LVX, levofloxacin; MEM, meropenem.
Strain
ID
Cases Ward Sample Agea Sex SEC DOA DOSC DOD THS Underlying
disease
Antibiotic history Outcome
dm93 Case 1 Pae Blood 2.5 M BPL 23.10.16 02.11.16 7.11.16 16 Unknownb CRO, GEN Discharge
b19 Case 2 Burn HDU Blood 30 F BPL 25.10.16 22.11.16 21.1.17 58 35% FB CRO DAMA
b06 Case 3 Burn HDU Blood 22 M Poor 10.11.16 22.11.16 30.11.16 21 35% FB CXM, CLI Discharge
b13 Case 4 Burn HDU Blood 45 F BPL 13.11.16 22.11.16 26.11.16 14 25% FB AMK, CAZ Died
b64 Case 5 Burn Pae. HDU Blood 3.5 F Poor 14.12.16 02.01.17 2.2.17 51 15% FB AZM, CST, CRO Discharge
b84 Case 6 Burn HDU Blood 15 M BPL 14.01.17 26.01.17 23.3.17 69 40% EB AMK, CAZ, MEM Discharge
b98 Case 7 Burn ICU Blood 5 F BPL 04.02.17 09.02.17 10.2.17 7 45% FB with II AMK, CRO, FLU Died
b99 Case 8 Burn ICU Blood 10 F LM 03.02.17 09.02.17 09.02.17 7 30% MBc CRO, LVX DAMA
b100 Case 9 Burn Pae. HDU Blood 2.5 F LM 28.01.17 09.02.17 8.4.17 71 22% SB AMK, CRO, LVX Discharge
b101 Case 10 Burn Pae. HDU Blood 7 M BPL 03.02.17 09.02.17 17.2.17 15 43% FB AMK, CRO Died
b111 Case 11 Burn HDU Blood 19 M Poor 16.01.17 23.02.17 7.4.17 82 30% FB AMK, CRO, MEM Discharge
b124 Case 12 Burn Pae. HDU Blood 3.5 F BPL 25.02.17 05.03.17 23.4.17 58 30% FB CAZ, CST, CRO Died
b163 Case 13 Burn ICU Blood 1.5 M Poor 10.4.17 17.4.17 26.5.17 46 40% SB CRO, LVX Discharge
b212 Case 14 Burn HDU Blood 23 F Poor 20.5.17 31.5.17 22.6.17 34 35% FB AMK, CRO, LVX Discharge
b219 Case 15 Burn HDU Blood 20 M Poor 15.6.17 19.6.17 30.8.17 76 35% EB with II AMK, CRO, LVX Discharge

330
aAge are given in years; bUnderlying disease was not available in hospital record; however, this case was clinically suspected as sepsis and therefore,
blood was referred for culture; cCombination of chemical and flame burn.

331
Figure 9.4 Length of hospital stay of the patients with B. cepacia bacteraemia.

332
9.2.2 Investigating possible outbreak by B. cepacia
Data extracted from patients’ clinical history and WGS data of the outbreak
strains were evaluated to investigate possible outbreaks. Likely epidemiological links
on transmission (patient to patient connectivity) was predicted if there is overlapping
of hospital stay among the outbreak cases (Figure 9.4). The outbreak by B. cepacia
was identified retrospectively.
We documented this outbreak between October 2016 and August 2017 at
DMCH (Figure 9.4). All outbreak cases had clinical signs of sepsis at the time of
sample collection and patients in burn critical units were undergoing artificial
ventilation and had central venous catheter lines and urinary catheters at the time of
diagnosis. There was a continuous overlapping of patients at DMCH during the
outbreak period (Table 9.2; Figure 9.4). Core genome SNPs-based phylogeny showed
that the outbreak strains were confined as a single clade (Figure 9.5), corresponded to
a common novel clone (ST1578) (Figure 9.6).

333
Figure 9.5 A maximum likelihood tree of B. cepacia by core genome SNPs with epidemiological data and ARGs. Country of origin is represented
by specific colour of node. Node level are highlighted according to source of sample. Global strains are stated with specific codes. Genomes’
(retrieved from ‘Burkholderia Genome Database’) attributes with corresponding codes are compiled in appendix F.

334
Figure 9.6 Minimum spanning tree of B. cepacia by MLST type. Each node within the tree represents a single ST. The size of the nodes is
proportional to the number of isolates represented by corresponding node. Selected nodes are labelled with corresponding STs, and number of
isolates represented. All global strains including Bangladeshi outbreak strains mentioned in this diagram were assigned as corresponding STs in
this study except ST10, ST44, ST807 and ST810. Genomes’ (retrieved from ‘Burkholderia Genome Database’) attributes with corresponding codes
are compiled in appendix F.

335
9.2.3 Clonal relationship of Bangladeshi outbreak strains of B. cepacia with the
global B. cepacia
Global B. cepacia (n=91) genomes were downloaded from ‘Burkholderia
Genome Database’ of which 82 strains could not be matched with previously described
STs which were also submitted to pubMLST for ST assignment (Burkholderia
Genome DB, 2020; PubMLST, 2020). All strains (n=106) were grouped into 9 clusters
(Figure 9.6). The Bangladeshi strains shared ST clusters with strains from Australia,
USA, South Korea, Thailand, UK and Malaysia. Interestingly, STs differed according
to geographical area (Figure 9.6). Core genome alignment also suggested that the
Bangladeshi B. cepacia are genetically closer to environmental strains of Australian
origin rather than human strains isolated from cystic fibrosis patients in the UK
(LMG16656.fsa nt), Thailand (LO6.fasta), and other Asian strains (Figure 9.5).

336
9.2.4 Background on resistance
B. cepacia isolated in this study were analysed for antibiotic resistance profiles
which were performed in triplicate and all repetitions showed consistent findings,
however, few repeats had MIC of one-dilution difference. There are no MIC
breakpoints for B. cepacia recommended by EUCAST (EUCAST, 2020). According
to CLSI breakpoints, 20% of B. cepacia (in this study) were resistant to ceftazidime
and 93.33% intermediate resistant to levofloxacin. All the outbreak strains had high
MIC value for amoxicillin-clavulanate, amikacin, gentamicin, fosfomycin,
trimethoprim-sulfamethoxazole and colistin. All were sensitive to meropenem (Table
9.3) (CLSI, 2020). According to their MIC profiles, antibiotics deployed as empirical
therapy to treat outbreak cases were invariably deemed to be inappropriate (Table 9.2).
The antimicrobial resistance genes identified in the outbreak strains were identical
(Figure 9.5). Likewise, ampD for all strains was homogenous; however, compared to
ampD (BCAL3430) of B. cenocepacia strain J2315, we found 10 substitutions of
amino acid in ampD (Figure 9.7). The resistance genes present in the outbreak strains
of B. cepacia were ant(2'')-Ia, aph(6)-Id, aph(3'')-Ib, aadA2, amrA, ARR-2, sul1,
qacH, cmlA1, tet(C), ceoA, and adeF. The outbreak strains were shown to possess
more resistant genes than other global strains (Figure 9.5).

337
Table 9.3 MIC values of B. cepacia in this study against relevant antibiotics (n=15).
aMIC values are indicated by mg/l; MIC values were determined in triplicate. AMC, amoxicillin-clavulanic acid; TZP, piperacillin-tazobactam;
CRO, ceftriaxone; CAZ, ceftazidime; CTX, cefotaxime; FEP, cefepime; IPM, imipenem; MEM, meropenem; CIP, ciprofloxacin; LVX,
levofloxacin; AMK, amikacin; GEN, gentamicin; SXT, sulfamethoxazole-trimethoprim; FOF, fosfomycin; TGC, tigecycline; CST, colistin.
Strain ID AMCa TZPa CROa CAZa CTXa aFEP IPMa MEMa CIPa LVXa AMKa GENa FOFa SXTa TGCa CSTa
dm93 >256 4 8 4 16 8 8 4 2 4 64 >256 >256 32 16 >256
b19 >256 8 16 8 32 16 8 4 1 4 256 >256 >256 64 4 >256
b06 >256 8 16 8 32 16 8 4 1 4 256 >256 >256 32 16 >256
b13 >256 8 16 8 32 16 8 4 2 4 256 >256 >256 32 16 >256
b64 >256 2 4 2 8 8 8 2 2 4 64 >256 >256 64 8 >256
b84 >256 8 16 4 16 16 8 4 2 4 256 >256 >256 64 16 >256
b98 >256 2 4 2 8 8 8 2 2 4 64 >256 >256 64 8 >256
b99 >256 16 32 8 32 32 8 4 2 4 256 >256 >256 32 4 >256
b100 >256 8 16 4 32 16 8 4 2 4 256 >256 >256 64 8 >256
b101 >256 2 4 2 8 8 8 2 2 4 64 >256 >256 32 8 >256
b111 >256 2 4 2 8 8 8 2 1 2 256 >256 >256 64 4 >256
b124 >256 2 16 8 16 16 8 4 2 4 256 >256 >256 64 16 >256
b163 >256 16 32 16 32 8 8 4 2 4 128 >256 >256 32 16 >256
b212 >256 8 16 16 16 16 8 4 2 4 128 >256 >256 64 16 >256
b219 >256 16 32 32 32 32 8 4 2 4 64 >256 >256 64 16 >256

338
Figure 9.7 Substitutions of amino acid in ampD compared to ampD (BCAL3430) of B. cenocepacia strain J2315. Substitutions are underlined by
red.

339
9.2.5 Analysis of Bcc virulence
The Bangladeshi outbreak strains shared some common virulence genes with
the global strains (bimA, boaAB, pilABCDNOQRSTV, gmhA, manC,
wcbABCDEFGHIJKLMNOPQRST, wzm/wzt2, cheABDRWYZ,
flgABCDEFGHIJKLMN, fliACDEFGHIJKLMNOPQRS, motAB, tsr, bspI2/bspI3,
bspR2/bspR3/bspR4/bspR5, pmlI/bspI1, pmlR/bspR1, bapABC, basJ, bicAP, bipBCD,
bopACE, bprABCDPQ, bsaKLMNOPQRSTUVXYZ, orgAB, spaP, gene for T6SS),
although two of the global strains (MSMB1338WGS.fsa_nt and DWS16B-4.fsa_nt)
were negative for all genes from VFDB (Figure 9.8). There was variation in the
presence of virulence genes between our clinical outbreak strains and previous clinical
B. cepacia (LMG16656.fsa nt and LO6.fasta) isolated from CF patients (Figure 9.8).

340
Figure 9.8 Heatmap showing the presence of virulence genes in B. cepacia. Original strain IDs with corresponding codes are compiled with
appendix F. Common VFs shared by the strains were not included in heatmap. Violet indicates the presence and grey indicates the absence of VF
in the respective strain. The increase in intensity is proportional to number of genes.

341
9.3 Discussion
Although B. cepacia is considered almost exclusively a pathogen for CF
patients (Kenna et al., 2017), our study reported B. cepacia bacteraemia
predominantly from burns patients. The findings of this chapter have been published
(Farzana et al., 2020b). The laboratory works, and analysis related to the work have
been completely performed by me as a part of this PhD. Only the sequencing services
(Illumina MiSeq) were provided by Prof. Walsh's genomic laboratory at CU.
B. cepacia are considered opportunistic human pathogens and can be
transmitted to patients via environmental contamination or person-to-person contact
(Wiener-Well et al., 2014; Ko et al., 2015; Exner et al., 2017; Becker et al., 2018).
Burns patients are generally more susceptible to infection due to impaired immune
function. Risk factors for sepsis in burns include >20% of TBSA, inhalation injury,
delayed burn wound excision, increased length of hospital stay, use of artificial
medical devices and ICU admission (Dolp et al., 2018; Yan et al., 2018). Patients in
burn ICUs are more vulnerable to septicaemia than general ICU patients (Snell et al.,
2013). Our findings demonstrate an outbreak of bacteraemia in DMCH caused by a
single clone of B. cepacia ST1578, mostly confined to patients admitted in burn
critical care units (Figure 9.4). The outbreak cases had a mean hospital stay of 43.9
days and straddled each other implying transmission via direct patient contact and/or
patient to hospital environment and vice versa. Clinically, this outbreak was associated
with a mortality rate of 31% (Table 9.2; Figure 9.4).
Previous studies show that burn sepsis accounts for 50-60% of deaths in burn
patients (Manning, 2018). In this study, mortality due to burn sepsis with bacteria other
than B. cepacia (60.17%) was higher than B. cepacia sepsis (33.33%) (p=0.073). A
limitation of the current study was the lacked sufficient clinical information to access
and to investigate why the mortality rate was significantly lower for B. cepacia cases.
At the time of enrolment many of these patients were on “inadequate” antibiotics based
on our susceptibility data. However, there are limitations to the interpretation of
susceptibility results for B. cepacia and we lack data on whether antibiotics were
changed later during hospital stay. It is possible there were other factors favouring
survival in the group infected with B. cepacia, including possibly relatively lower
pathogenicity of B. cepacia as a cause of bacteraemia. B. cepacia has been described

342
as a cause of pseudo-outbreaks (Ko et al., 2015). Although this possibility should be
considered here the timing of infections suggest this was not the case, and a persistent
environmental source of cross contamination on the burn unit was a more likely cause.
Unsurprisingly, radical infection control programs can mitigate the spread of
infections and improve patient outcomes in burn units (Coban, 2012). No IPC
intervention was undertaken here because the outbreak was identified retrospectively.
MDR Gram-negative bacteria infections have become a serious challenge in
health care settings as a result of both intrinsic and acquired resistance mechanisms,
limiting therapeutic options (Exner, 2017). B. cepacia is of concern due to their
intrinsic resistance to clinically relevant antibiotics such as aminoglycosides and
polymyxins (Rhodes and Schweizer, 2016). In this study, all B. cepacia showed very
high MIC levels to amikacin and gentamicin mediated by resistance genes ant, aph
and aadA2 and/or overexpression of efflux pump such as ArmA, CoeA (Figure 9.5;
Table 9.3) (Sfeir, 2018). Burkholderia spp. are typically resistance to colistin due to a
unique intrinsic amino arabinose biosynthesis operon (Rhodes and Schweizer, 2016).
Genome sequencing also identified resistance genes such as adeF, tetC, sul1, and
qacH (Figure 9.5) which contribute to phenotypic resistance of B. cepacia tetracycline,
fluoroquinolones, sulphonamides, and antiseptics (Alcock et al., 2020) (Table 9.3).
Mutations in ampD are associated with the upregulation of β-lactam degrading
enzymes, PenB and AmpC. This mechanism has been found to be one of the causes
of β-lactam resistance in B. cepacia (Hwang et al., 2015; Rhodes and Schweizer,
2016). Mutations in ampD were identical in all B. cepacia analysed in our study
(Figure 9.7) and all the isolates had high MIC value for amoxicillin-clavulanate;
however, MICs for piperacillin-tazobactam and cephalosporins were variable (Table
9.3). Perhaps enzymatic degradation was mainly responsible for putative ß-lactam
resistance in this study, however, we did not evaluate the expression of ß-lactamase
such as PenB, AmpC or PenA in relation to AmpD mutations (Rhodes and Schweizer,
2016). Although the empirical antibiotics were shown to be ineffective (Table 9.3),
the relationship between patients’ morbidity/mortality and antibiotics prescription
cannot be fully explored as datasets are incomplete.
Virulence of B. cepacia is typically related to adhesins, invasins, intracellular
pathogenicity, antiphagocytic factors, secretory and signalling systems (Liu et al.,

343
2019c). A set of virulence genes in relation to all steps in pathogenesis were identified
in Bangladeshi outbreak strains B. cepacia (Figure 9.8). However, whether other
virulence determinants are associated with the ability to cause bacteraemia, and the
role of patient factors, could not be determined by this current study.
B. cepacia identified in this study belonged to a novel clonal type ST1578
(Figure 9.6). The genetic background of the outbreak strains was very similar;
however, a few variations were found regarding the presence of virulence genes
(Figure 9.5; Figure 9.8). Compared to global strains from the database, resistance
genes for aminoglycosides (ant(2'')-Ia, aph(6)-Id, aph(3'')-Ib, aadA2),
fluoroquinolones (qacH), tetracycline (tet(C)) and sulphonamide (sul1) were found
only among the strains isolated in this study (Figure 9.5). Virulence gene, aai was
absent in our outbreak strain, which was common in both human strains,
LMG16656.fsa nt and LO6.fasta, (from Burkholderia Genome Database), but the
overall virulence pattern of the outbreak strains was similar to LMG16656.fsa nt
(human strain isolated from the UK) than LO6.fasta (human strain isolated from
Thailand). Compared to B. cepacia LO6.fasta, flagellar protein (lfg, lfh, lfi), secretory
system (clpV1, vsc, iagB, spaR), and regulatory protein (prrA) were absent in the
Bangladeshi strains (Figure 9.8). Thus, it can be inferred that the Bangladeshi outbreak
strains identified in this study are genetically distinct from global strains retrieved
from the database.
Although we did not evaluate the epidemiological link between patients and
the environment, epidemiological and molecular data suggest that the outbreak clone
was circulating within DMCH over a protracted period (Figure 9.4). It is disconcerting
that antibiotic pressure might have enhanced the elevation in AMR during the outbreak
(Hughes and Andersson, 2017). Identification of environmental sources of the
outbreak followed by patient management can reduce the risk of infections in
vulnerable populations (Coban, 2012; Wiener-Well et al., 2014; Fernando et al.,
2017).

344
Section Ten
General Discussion

345
10.1 A general overview on Bangladeshi health system and AMR
Bangladesh has a population of about 165 million (Bangladesh Population
[LIVE], 2020); ranked #35th (nominal, 2020) by gross domestic product (GDP) and
29th by purchasing power parity (PPP) (nominal, 2020). Bangladesh was the world's
seventh fastest growing economy with a rate of 7.3% real GDP annual growth
(nominal, 2019). (Wikipedia, 2020g). The fifth Bangladesh National Health Accounts
(BNHA) 1997-2015 data accounts that Bangladesh Government spends 3% of GDP
to public health (WHO, 2015). A report on the proportion of total health expenditure
in different sectors in Bangladesh between 1997 to 2012 is described in Figure 10.1.
A sizeable proportion of this commitment is implementing and maintaining health
services across the public Medical College Hospitals (MCHs) which are free to the
general public. MCHs are grossly oversubscribed (typically 4-5 times the
#inpatient/bed). World Bank Development Indicator (2008-2015) implies an
inadequate health facility in public health sectors of Bangladesh (1 physician per 2,500
population, 1 nurse per 5,000 population, and 1 bed per 1,670 individuals) (CDDEP,
2018). Antibiotics are usually free in the public hospitals but delivered empirically
with limited variety. Antibiotics are prescribed usually based on availability in hospital
supply and certainly do not address serious MDR or extensively drug-resistant (XDR)
infections (Chowdhury et al., 2009; The Fleming Fund, 2019; Essential Drugs
Company Limited, 2020). IEDCR has commenced an AMR surveillance in 2017 in
the major MCHs in Bangladesh (WHO, 2020a). On 22nd April 2019, the Government
of Bangladesh formally banned the sales of antibiotics without prescription
(bdnews24.com, 25 April 2019). However, the impact of AMR is grossly under
reported, and infection control is suboptimal in the public hospitals of Bangladesh
(Shahida et al., 2016; Hsu et al., 2017; Hoque et al., 2020). During the time-period of
the PhD, I was involved to undertake scoping exercise in Bangladesh with T. R. Walsh
to bid for the FF Country Grant (CG) application (The Fleming Fund, 2019). The brief
description of microbiology capacity of the major MCHs is mentioned in Table 10.1.
Our survey also noted the lack of functional IPC committee in the tertiary heath care
settings of Bangladesh.
National Strategy for AMR Containment in Bangladesh, 2017-2021 has been
established with an aim to develop multisectoral approach for Antimicrobial
stewardship. The strategies include coordination down to the subdistrict level, and

346
involvement of both the Ministry of Health and Family Welfare, and the Ministry of
Fisheries and Livestock, however, there is little evidence of working jointly, and an
operational systematic AMR surveillance. Table 10.2 illustrates the updates on
national AMR programmes (BLRI, 2019; Department of Livestock Service, n. d.;
Rahman et al., 2017; WHO, 2018; The Fleming Fund, 2019; WHO, 2020d).

347
Figure 10.1 Bangladesh National Account 1997 to 2012. Reproduced from: MOHFW,
2002.

348
Table 10.1 Brief description of microbiology capacity of the major MCHs of
Bangladesh.
CMCH DMCH KMCH MMCH RMCH RpMCH SOMCH
# Core staff 7 2 2 2 2 2 5
# Rotating staff 14 14 5 15 15 11 14
# Beds 1326 2600 500 1000 1200 1000 500
# Inpatients 3000 7000 980 3000 3000 2100 2300
# Out-patients 5500 5000 3500 5000 2500 4000 4500
Automated
blood culture
- * - - -
Sputum culture - - -
Wound swab
culture
- -
Urine culture - -
AST – disc
AST – other - - - - - -
Digital
reporting
- - - - - - -
CMCH, Chittagong Medical College Hospital; DMCH, Dhaka Medical College
Hospital; KMCH, Khulna Medical College Hospital; MMCH, Mymensingh Medical
College Hospital; RpMCH, Rangpur Medical College Hospital; RMCH, Rajshahi
Medical College Hospital; SOMCH, Sylhet M.A.G. Osmani Medical College
Hospital.
*Dysfunctional. Number of ticks reflects the degree of understanding and correct
methodology.

349
Table 10.2 AMR programmes at the national level in Bangladesh.
Surveillance sector Time-period Organisation
involved
Key information
Human 2016-2020 IEDCR • Involved 10 sites
• Culture and sensitivity on WHO recommended priority pathogens
• All sites do not do blood culture
• Number and types of specimens collected varies among the sites
• No data on number of tested patients
• No data on patients ‘clinical progress, antibiotic prescription for the certain patients, and outcome
• Number of reports submitted to GLASS: [E. coli from blood (n=21); E. coli from urine (n=317); K.
pneumoniae from blood (n=10); K. pneumoniae from urine (n=95); Salmonella spp. from blood
(n=74); Shigella spp. from stool (n=11)]
Poultry 2018-present CDIL • 164 chicken caecal samples have been collected 24 live bird markets so far
• Surveillance focused on isolated E. coli
Human and animal 2016-2020 FAO, OIE, WHO • Aims of the project were to develop new guideline for use of antimicrobials for human and animal, to
support farmers for the use of appropriate antibiotics
• FAO are working with the BARA to develop a mobile app to be used by vets in the field to improve
prescription practices for poultry
Animal 2016-2017 BLRI, IEDCR AMR surveillance on 399 faecal samples from Rhesus macaque
Animal 2018-present BLRI Phenotypic and genotypic profiling of AMR in enteric bacterial communities in finisher livestock poultry
in Bangladesh
Human 2018-2019 DGDA Aims to estimate the consumption of antimicrobials based on production, import, export, distribution, and
destruction of antimicrobials
Human 2018-2019 DGDA Point prevalence study on the of the use of antimicrobials in selective hospital and community clusters
(pharmacy based)
BARA, Bangladesh AMR Response Alliance; BLRI, Bangladesh Livestock Research Institute; CDIL, Central Disease Investigation Laboratory;
DGDA, Directorate General of Drug Administration; FAO, Food and Agriculture Organization; IEDCR, Institute of Epidemiology, Disease
Control and Research; OIE, World Organisation for Animal Health; WHO, World Health Organization.

350
Though this PhD project, I attempted to document the precise scenario of AMR
prevalence, burden, drivers, and transmission in a Bangladeshi public heath setting.
Nevertheless, this data represents one hospital only, the overall prevalence of all
clinically relevant antimicrobials including the detailed epidemiology of one of WHO
classified ‘Watch’ group of antibiotics (carbapenem), and one of the ‘Reserve’
antibiotics (colistin) were recoded (Chapter 3; Chapter 5; Chapter 6; Chapter 8)
(WHO, 2019). The prevalence of CRE from the clinical specimens at DMCH was
alarmingly high (11.1%, 210/1893). This study found the connections between CRE
infections and usage of certain antimicrobials such as levofloxacin, amikacin,
clindamycin, and meropenem (p<0.05) (Chapter 3). The findings in ‘Chapter 6’
evinced the associations of MDR determinants (resistance to aminoglycosides,
sulphonamide, trimethoprim, macrolides, rifampin, quinolones, chloramphenicol, and
also colistin) with blaNDM which signifies the dissemination of resistance genes against
multiple antibiotics due to selective pressure of antibiotics pertinent to resistance
plasmids which might include either carbapenems or non-carbapenems (Chereau et
al., 2017). It was certainly worrying that CRE infections ensue a significant high
mortality (27.8%) than CSE (p<0.05). The relation between mortality and effective
antimicrobial therapy was evaluated based on data available which showed decease
probability of mortality with the patients without any effective antimicrobials
(Chapter 3). However, this study did not record antibiotics’ dosage and duration of
treatment among the participants. Whether the ineffective antibiotics therapy either
resulted high death rate or not among the patients with CRE infections was impossible
to conclude. Nevertheless, these data highlights intransient practice of empirical
therapy (Chapter 3) and thus necessitates an urgent need to improve the current
clinical microbiology facilities at DMCH and to establish an appropriate standard
antibiotic stewardship program in the hospital (Table 10.1) (Hoque et al., 2020).

351
10.2 The reasons behind the indiscriminate antimicrobial usage in Bangladesh
Clinical microbiology services at the MCHs are not free, however, it has been
operated at low cost for the hospitalised patients (The Fleming Fund, 2019). Patients
attending at the public hospitals are usually from low socio-economic group (Chapter
3; Chapter 4), most often are unable to afford the minimal cost (Joarder et al., 2019).
There is discrepancy of working hours between hospital services and clinical
laboratory services. Government hospitals in Bangladesh are dedicated to providing
24 hours/7 days services to public; however, working hours for the laboratory staff are
six and half hours only (0800hrs-1430hrs). Hitherto, there is no legislation by the
Government to increase laboratory capacity for 24 hours services. Moreover,
clinicians are not always convinced with the quality of report provided by the
laboratories of public medical colleges. Therefore, a limited number of infection cases
are managed according to sensitivity reports (The Fleming Fund, 2019). The patients
are often advised to have microbiology testing performed at private laboratories.
Given that microbiology costs are considerably higher in private laboratories than the
public hospitals, most patients attending public hospitals will barely be able to afford
the private costs (Rahman, personal communication).
All the factors lead the physicians to prescribe antimicrobials without any
microbiological testing (The Fleming Fund, 2019). Moreover, when the AST is in
place, essential antimicrobials are often not available in the hospital supply. Therefore,
patients have to pay for the drug from outside pharmacy themselves as there is no
health insurance policy available in the country which can support low socio-
economic group. Unable to complete the full courses of antimicrobials due to
unaffordability is common among the patients attending in the public hospitals
(Thomson [manuscript in press]).
The overall usage of empirical antimicrobials among the inpatients enrolled in
this study was >85% (Chapter 3; Chapter 4). AMU in each hospital needs to be
monitored on a regular basis under proper legislation. Till now no data is available on
AMU at the national level (WHO, 2018). Rational use of antimicrobials can be an
effective option to reduce the trends of AMR in Bangladesh (Chandra et al., 2020).

352
10.3 Hygiene baselines in Bangladesh and spread of AMR
The proportion of population served by the different types of sanitation system
in different parts of the globe is depicted in Figure 10.2. WHO and UNICEF jointly
reported the data on pre-COVID-19 hygiene baselines of each WHO region in 2020.
Data showed that only 57% of household, and 53% of schools have access to basic
hygiene in SA. No data is available on basic hygiene facilities in the healthcare in SA.
In Bangladesh, only 35% of households and 50% of schools have hand-washing
facilities. Basic washing facilities in households of the country are comparatively
lower in rural areas (26%) than urban (51%) (nominal, 2017). Washing practices
following patients’ care in the hospital are very poor in the country (Figure 10.3)
(WHO-UNICEF JMP, 2020). One survey report on hand washing facilities in 875
Bangladeshi health care facilities in 2013 showed that there was large discrepancy of
availabilities of washing agents between hospital staffs and patients/caregivers.
Although more than 85% of hospitals had available washing agents for
doctors/nurses/other staffs, caregivers or patents had access to washing agents just
23% of hospital. However, patients’ daily care in the public hospitals is mostly
performed by the family members/caregivers rather than the hospital staffs (GOV.UK,
2015). The caregivers presumably have less education and less likely to follow
appropriate hygiene practices (Khan et al., 2008). More research on washing habits
and sanitation in Bangladesh are required to understand the level of hygiene practices.
Improving hand hygiene, and sanitation are basic steps to fight against infectious
diseases and subsequent AMR (Lee et al., 2013; O’Neill, 2016; Cheng et al., 2018).

353
Figure 10.2 Percentage of population served by different type of sanitation system across the world (Nominal, 2014). Reproduced from: Wikimedia
Commons, 2020.

354
Figure 10.3 Hand hygiene practices in the hospitals of Bangladesh. Reproduced from:
WHO-UNICEF JMP, 2020.

355
10.4 The magnitude of hospital outbreak in Bangladesh
A hospital outbreak is defined as an increase in the frequency of any disease
event above the baseline level for a geographical area during a given period of time.
The hospital outbreaks are the consequences of IPC failure (Sood and Perl, 2016). A
fundamental part of effective IPC policy in a hospital involves the proper management
of hospital waste (Khan et al., 2019; WHO, 2020e). Previous reports calculated that
healthcare associated waste from several districts in Bangladesh ranged from 0.19 kg
to 1.99 kg per bed per day. PRISM, Bangladesh, a non-governmental organisation
deals with the medical waste from the whole of Dhaka city. A quantitative assessment
of waste in Dhaka city by PRISM in 2013 showed that 24% of the total waste were
classified as ‘hazardous’ according to WHO guidelines. PRISM’s survey also showed
that a significant proportion of medical hazardous waste were disposed to open bin
without any treatment. Contemplating the situation in Bangladesh, the waste is most
likely to be collected by scavengers for recycling, and often simple washing is only
applied before recycling (PRISM, 2013). There is no specific Governmental
policy/guideline available in Bangladesh for the medical waste disposal. All the
regulatory documents such as ‘Environmental Conservation Act 1995’, ‘the Medical
Waste Management and Administration Act 2010’, and ‘the Medical Waste
Management Rules 2010’ on medical waste management formulated by the
Government so far only outlined the key components without any detailed
instructions, and devoid of monitoring activities (CDDEP, 2018). In the hospital
setting, inadequately managed hazardous waste is the reservoir of infectious agents
which can be spread to the hospital environment through the staffs dealing with the
waste, by vectors such as flies or insects, or in the air. Patients with underlying disease,
neonates, and the elderly are prone to develop infection due to hospital contamination.
Taken together, overcrowding in Bangladeshi public health setting,
insufficient hygiene baselines, poorly managed hospital waste and inadequate
decontamination of hospital environment might lead to develop outbreaks in
Bangladeshi healthcare facilities (GOV.UK, 2015; Shahida et al., 2016; WHO-
UNICEF JMP, 2020). Given the numbers of putative clinical outbreaks among the
limited microbiological sampling population at DMCH in this study are worrying
indicators of the impact of very poor IPC and antimicrobial stewardship practices
(Chapter 5; Chapter 7; Chapter 9). Bangladesh is the endemic zone for certain AMR

356
determinants such blaCTX-15, and blaNDM (Molton et al., 2013; Lai et al., 2014; Bevan
et al., 2017; Chen et al., 2019; Nordmann and Poirel, 2019). This PhD is the first study
in Bangladesh to undertake a detailed epidemiological and molecular assessment on
an outbreak associated with AMR (Chapter 5). An institutional body of Bangladesh,
the One Health Secretariat, was created in 2017 with an aim to establish One Health
outbreak management team. The body incorporated the issues of AMR into their
strategic plans (The Fleming Fund, 2019). Till now, no report by the management
team has been found implying that they have not delt with any AMR related hospital
outbreak.
Outbreaks might act as aggravators to expand the endemicity of AMR in a
setting when there are no facilities for source identification, outbreak cases isolation,
and radical decontamination. Outbreaks are also accountable for epidemic expansion
of pathogens and/ or AMR determinants. Therefore, outbreaks in this setting might
have serious global impact if the events would not be managed radically, and when
AMR is a matter of concern (Koornhof et al., 2001; Zahar et al., 2014; Hassing et al.,
2015; Hawkey, 2015; Cimmino et al., 2016; Sood and Perl, 2016).

357
10.5 Significance of faecal AMR screening in Bangladesh
Chapter 4 describes the prevalence of CRE in faecal flora among the
hospitalised patients in Bangladesh and represents the prevalence in the community to
lesser extent. The overall prevalence of CRE in faecal carriage was 34.8% (244/700)
while a higher prevalence was found among inpatients (206/383, 53.8%) than the
outpatients (38/317, 12%) (p<0.05). Perhaps the findings resulted from multifactorial
combined involvement such as increase burden of AMR in the gut due to selective
antibiotic pressure, very high rate of cross-transmission between patients to patients,
and/or hospital staff to patients, inappropriate management/decontamination of
hospital waste, and spread of MDR pathogens through fomites, flies or insects (Carlet,
2012; van Schaik, 2015; Gupta et al., 2019). The possible transmission cycle of faecal
carriage of MDR pathogens is illustrated in Figure 10.4.
Faecal AMR screening in the health setting is particularly important as high
concentration of bacteria (108 per gram of faeces or more) is present in faeces which
can be transmitted via faecal-oral route (Carlet, 2012). Bangladesh has a very poor
sanitation, about 107 million population in the country do not have basic facilities of
handwashing at home (Figure 10.2; Figure 10.3) (WHO-UNICEF JMP, 2020). Our
scoping findings from the meetings with national stakeholders and visit at different
MCHs suggest health facilities are embryonic in terms of advocating AMR screening
program for human gut flora. Studies in the neighbouring country, India reported 1.6%
to 81% prevalence of CRE in the RSs of hospitalised patients, and 30% in the
community (Rai et al., 2014; Datta et al., 2015; Mohan et al., 2017; Antony et al.,
2018; Bharadwaj et al., 2018; Kumar et al., 2018; Ramanathan et al., 2018; Singh et
al., 2018; Smith et al., 2020). Data from India and our findings indicate the
significance of establishing periodic systematic screening of AMR in Bangladesh
among healthy volunteers in both hospitals, and community settings, in hospitalised
patients, and during the outbreak events.

358
Figure 10.4 Factors facilitate the dissemination of AMR.

359
10.6 Emergence of colistin resistance in Bangladesh: situation analysis
Antibiotics have been used widely in farming therapeutically,
metaphylactically, or for fostering growth (animal feed) for human consumption.
AMU in agriculture has even exceed the usage in the clinical practice in recent years
(Kirchhelle, 2018). Non-human antibiotic usage of colistin engendered a serious
global effect in the recent widespread development of mcr in agriculture, and the
emergence of mcr in human infections limit the treatment options for MDR pathogens
(Liu et al., 2016; Shen et al., 2016; Davies and Walsh, 2018). A growing incidence of
mcr has been observed in Bangladesh, although data mostly derived from small-scale
study only. Consecutive reports of mcr from Bangladesh including the data from this
PhD are demonstrated in Figure 10.5 which clearly demonstrate an increasing trend of
mcr in 2018 than 2017 (Islam et al., 2017; Sobur et al., 2019a; Sobur et al., 2019b;
Akter et al., 2020; Amin et al., 2020; Johura et al., 2020).
Literature reviews suggested that the agricultural use of antibiotics to prevent
disease in Bangladesh is similar to the other parts of the world in spite of National
Livestock Development Policy (2007) which documented the strict law for antibiotics
sales without prescription (Chowdhury et al., 2009; Islam et al., 2016; Hoque et al.,
2020). A report on AMU in poultry farms by Bangladesh Department of Livestock
Services (DLS) showed that 68% of the farms utilised Watch antibiotics, and 24%
used Reserve antibiotic ‘colistin’. Tetracyclines and fluoroquinolones are the common
antibiotics used in farming (Department of Livestock Service, n.d.). Data on
Bangladeshi shrimp hatcheries indicates the use of up to 80 kg antibiotics per
production cycle in a single hatchery (Thornber et al., 2020). An assessment of 73
Bangladeshi poultry farms by Islam et al., (2016) recorded that AMU for treatment
purposes is 43.8%, 31.5% for prophylaxis, 47.9% for dual purposes (treatment and
prevention), and 8.2% as a growth promotor. Colistin is being used widely in
Bangladeshi poultry farms. Higher concentration of colistin was reported in meat from
the middle and late growth stage of chicken, indicating that meat to be sold in the
market are rich with colistin. Farmers have significant lack of knowledge about aseptic
management of poultry and poultry products, leading to usage of antimicrobials to
control disease and to enhance production (Bristy et al., 2019; Ferdous et al., 2019).
Small-scale farmers are often financially dependent on poultry dealers to run their
business. Farmers are mostly influenced by the poultry dealers to use antibiotics

360
(Masud et al., 2020). ‘Animal feed Act 2010’ banned the usage of antibiotics, growth
hormones etc. in poultry feed (Hoque et al., 2020). Therefore, traditionally farmers in
the setting are adding colistin in the poultry’s drinking water (Saha, personal
communication). Colistin is available in liquid form for the point-of and online sales
in the Bangladeshi market of colistin specifically for veterinary usage (myHealthbox,
n.d.). This study recorded 3.2% usage of colistin in clinical practice (Chapter 3) and
found the emergence of colistin resistance (mcr-1.1 and mcr-8.1) in clinical
infection/colonisation (Chapter 8). Non-human colistin usage was assumed to be
responsible for the mcr emergence in Bangladesh. Colistin usage in the country should
be monitored and regulated under strict laws, banned from animal use and treated
singularly for human MDR infections.

361
Figure 10.5 Report of mcr from Bangladesh from different sources. The size of symbol is proportional to prevalence of mcr from the respective
sources. Arrows indicate the data from this PhD.

362
10.7 Limitation of the study
• This study only included clinical specimens referred to clinical microbiology of
DMCH. As I have already discussed, a limited number of specimens at DMCH is
selected for microbiology testing and a proportion of samples also referred to private
laboratory. Despite the fact, this study enrolled 1892 clinical specimens. The main
focus of the study was to assess the burden of carbapenem resistance in Bangladesh
by compiling epidemiological, clinical and molecular data. As I have already
discussed, no electronic data capturing system has been developed in Bangladeshi
public hospital. Patients’ information is documented in paper which lacked detail
comorbid state of the patients. Only the basic information about the patients such as
malignant condition or history of DM could be retrieved in this study. In this study
the relation between mortality and carbapenem resistance was statistically adjusted
with the patients’ demographic and clinical data; however, the study was unable to
interpret how the comorbid state can affect patients’ mortality in association with
carbapenem resistance (Chapter 3).
• Whether the ineffective antimicrobial therapy either resulted patients’ death due to
carbapenem resistance or not in this study was unrevealed in this study as data on
antibiotics’ course and duration was not recorded. The challenges behind the
limitations on patients’ data collection has been discussed with the respective chapter
(Chapter 3).
• The presumptive outbreaks during the study period were identified retrospectively,
this study did not have direct role the eradication of the outbreak during the sampling
period. There was lack of data to identify index patients in the outbreak. As sampling
from hospital environment, or hospital staffs beyond the scope of the study, source of
outbreak, or sequential transmission event was not evaluated (Chapter 5; Chapter 7;
Chapter 9).
• Given the high prevalence of CRE in clinical infections, a carriage study was
undertaken after a year of clinical study to investigate the extent of any putative
outbreak. The data would be more reproducible if clinical and faecal specimens were
taken simultaneously from the same study population (Chapter 4).

363
10.8 Research prospects accomplished following this PhD and concluding remark
A few successfully funded research projects on Bangladeshi AMR were designed
based on the findings of my PhD. I designed a project on burn sepsis through a network
involving Cardiff University (CU), National Institute of Burn and Plastic Surgery,
Bangladesh with an aim to investigate the health and economic burden of AMR in burn
patients including the role of environment in the acquisition of MDR infections where our
attempts were to record a complete profile of patients’ treatment during their hospital stay
including the outcome data. This project was funded by Global Challenges Research Fund
(GCRF).
GCRF also funded us for the facilitation activities in Bangladesh for a project titled
‘Establishing a network to monitor the emergence and impact of Klebsiella variicola, a
hypervirulent and extensively drug-resistant pathogen, in South-Asia’. Our research data
K. variicola (Farzana et al., 2019a; Chapter 7) and subsequent GCRF project, provided a
comprehensive framework to understand the pathogenicity factors contributing K.
variicola virulence. A large multi-centre study on the topic was built and submitted to the
Biotechnology and Biological Sciences Research Council (BBSRC).
Finally, Prof. Walsh has been awarded by Welcome Trust for a large grant on the
impact of COVID-19 bacterial sepsis, antibiotic consumption and stewardship, and
resistance involving twelve countries. It has been proposed to include this PhD data to
compare the effect of pre-COVID and ongoing COVID state on AMR crisis in
Bangladesh. I will continue my research career on the grant after completion of my PhD.
Bangladesh is a high-risk zone for the emergence, and dissemination of AMR
based on geography, population density, climates, heath practices, and infrastructure.
Exploring the epidemiological aspects of AMR at the tertiary level along with district,
and sub-district level is required for AMR control in the country, further, to reduce the
global burden.

364
Section Eleven
Appendices

365
Appendix A
Antimicrobial classes according to mechanism of action and their spectrum of
activity (Duplessis et al., 2011; Bialvaei and Samadi, 2015; Falagas et al., 2016;
Grossman, 2016; Kapoor et al., 2017; Percival, 2017; Thamban and Garneau-Tsodikova,
2018; McCarthy, 2019; Wikipedia, 2020c).
Cell wall synthesis inhibitors (β-lactams)
Class
Drugs
Indications (**Drug
of Choice)
Effect on bacteria
Penicillins • Penicillin G
• Aqueous penicillin G
• Procaine penicillin G
• Benzathine penicillin G
• Penicillin V
Strep. pyogenes**
Step. agalactiae**
C. perfringens **
Bactericidal
• Ampicillin
• Amoxicillin
Above +
Increase activity
against Gram-negative:
E. faecalis**
E. Coli**
Bactericidal
• Methicillin
• Nafcillin
• Oxacillin
• Cloxacillin
• Dicloxacillin
Above +
penicillinase-
producing Staph.
aureus
Bactericidal
• Carbenicillin
• Ticarcillin
• Piperacillin
Above +
Pseudomonas
aeruginosa**
Bactericidal
Cephalosporins 1st generation
• Cefazolin
• Cephalexin
Staph. aureus**
Staph. epidermidis**
Some Gram-negatives:
E. Coli
Klebsiella
Bactericidal
2nd generation
• Cefoxitin
• Cefaclor
• Cefuroxime
Above +
increase activity
against Gram-negative
Bactericidal
3rd generation
• Ceftriaxone
• Cefotaxime
• Ceftazidime
Above +
increase activity
against Gram-negative
Pseudomonas
Bactericidal
4th generation
• Cefepime
Above +
increase activity
against Gram-negative
Pseudomonas
Bactericidal
5th generation
• Ceftaroline
MRSA
Vancomycin
intermediate Staph.
aureus (VISA)
Vancomycin resistant
Staph. aureus (VRSA)
Bactericidal

366
Streptococcus
pneumoniae
Haemophilus
influenzae
Moraxella catarrhalis
β-lactamase
Inhibitors • Clavulanic Acid
• Sulbactam
• Tazobactam
S aureus**
S epidermis**
E.Coli**
Klebsiella**
Bactericidal
Carbapenems • Imipenem
• Meropenem
• Doripenem
• Ertapenem
Broadest activity
[except methicillin-
resistant
Staphylococcus aureus
(MRSA),
Mycoplasma]
Bactericidal
Monobactams Aztreonam Gram-negative rods
Aerobes
Bactericidal
Cell wall synthesis inhibitors (non-beta-lactams)
Vancomycin Vancomycin MRSA**
Penicillin or
cephalosporin allergies
S. aureus
S. epidermidis
Bactericidal
Bacitracin Bacitracin Gram-positive
infections
Bactericidal
Fosfomycin Fosfomycin Clinically significant
Gram-positives and
Gram-negatives form
biofilm
Bactericidal
Teixobactin Teixobactin MRSA
Enterococcus
Streptococcus
Clostridium difficile
Bacillus anthracis
Bactericidal
Protein synthesis inhibitors (Anti-30S ribosomal subunit)
Aminoglycosides • Gentamicin
• Neomycin
• Amikacin
• Tobramycin
• Streptomycin
• Neamine
• Neomycin B
• Paromomycin
• Paromamine
• Ribostamycin
• Arbekacin
• Amikacin
• Dibekacin
• Gentamicin
• Geneticin
• Isepamicin
• Kanamycin A and B
• Nebramine
• Netilmicin
Aerobic Gram-
negatives
Enterobacteriaceae
Pseudomonas
Bactericidal

367
• Plazomicin
• Sisomicin
• Tobramycin
• Apramycin
Tetracyclines
• Tetracycline
• Doxycycline
• Minocycline
• Demeclocycline
• Methacycline,
• Rolitetracycline
• Lymecycline
• Tigecycline
Rickettsia
Mycoplasma
Spirochetes (Lyme's
disease)
Bacteriostatic
Protein synthesis inhibitors (Anti-50S ribosomal subunit)
Macrolides • Erythromycin
• Azithromycin
• Clarithromycin
Streptococcus
H. influenzae
Mycoplasma
pneumonia
Bacteriostatic
Chloramphenicol Chloramphenicol H influenzae
Bacterial Meningitis
Brain abscess
Bacteriostatic
Lincosamide Clindamycin Bacteroides fragilis
S aureus
Coagulase-negative
Staph. & Strep.
Excellent Bone
Penetration
Bacteriostatic
Oxazolidinone Linezolid Resistant Gram-
positives
Variable
Streptogramins • Quinupristin
• Dalfopristin
Vancomycin resistant
Enterococcus (VRE)
Group A Streptococcus
(GAS)
S. aureus skin
infections
Bactericidal
DNA synthesis inhibitors
Fluoroquinolones 1st generation
• Nalidixic acid
Streptococcus
Mycoplasma
Aerobic Gram
positives
Bactericidal
2nd generation
• Ciprofloxacin
• Norfloxacin
• Enoxacin
• Ofloxacin
• Levofloxacin
Above
+Pseudomonas
Bactericidal
3rd generation
• Gatifloxacin
Above
+ Gram-positives
Bactericidal
4th generation
• Moxifloxacin
• Gemifloxacin
Above
+ Gram-positives
+ Anaerobes
Bactericidal
Other DNA inhibitors
Metronidazole Metronidazole Anaerobes Bactericidal
RNA synthesis inhibitors

368
Rifampin Rifampin Staphylococcus
Mycobacterium
Bactericidal
Mycolic acid synthesis inhibitor
Isoniazid Isoniazid Mycobacterium Bactericidal
Folic acid synthesis inhibitors
Trimethoprim/
Sulfonamides
Trimethoprim/
Sulfamethoxazole
Urinary tract infections
(UTI)
Proteus
Enterobacter
Bacteriostatic
Alteration of cell membrane
Polymyxins Colistin Gram-negative
bacteria
Bactericidal
Daptomycin Daptomycin Gram-positive bacteria Bactericidal

369
Appendix B
Classification of β-lactamase (Bush and Jacoby, 2010; Bush, 2018).
Bush-Jacoby-
Medeiros group
(Functional
classification)
Molecular
classification
Preferred substrates Inhibition by β-
lactamase inhibitors
Enzymes
AV CA EDTA
1 C Cephalosporins + - - AmpC, CMY, ACT-1, FOX-1, MIR-1
1e C Extended-spectrum cephalosporins + - - GC1, CMY-37
2a A Penicillins + + - PC1
2b A Penicillins, early cephalosporins + + - TEM-1, TEM-2, SHV-1
2br A Penicillins + - - TEM-30, SHV-10
2be A Extended-spectrum cephalosporins,
monobactams
+ + - TEM-3, SHV-2, CTX-M ESBLs, PER-
1, VEB-1
2ber A Extended-spectrum cephalosporins,
monobactams
- - - TEM-50
2c A Carbenicillins + + - PSE-1, CARB-3
2ce A Carbenicillins, cefepime + + - RTG-4
2d D Cloxacillins + ± - OXA-1, OXA-10
2de D Extended-spectrum cephalosporins + ± - OXA-11, OXA-15
2df D Carbapenems + - - OXA-23, OXA-48
2e A Extended-spectrum cephalosporins + + - CepA
2f A Carbapenems + ± - KPC, IMI, SME
3a B Carbapenems - - + IMP, VIM, NDM
3b B Carbapenems - - + CphA, Sfh-1
AV, avibactam; CA, clavulanic acid.

370
Classification of metallo-β-lactamase (Bebrone, 2007; Sawa et al., 2020).
Subclass Enzyme Discovery Structure
B1 (chromosomal) BcII 1966 Mono-zinc, Di-zinc, Apo-form
CcrA 1990 Di-zinc
BlaB 1998 Di-zinc
IND-1 1999
EBR-1 2002
SFB-1 2005
SLB-1 2005
B1 (acquired) IMP-1 1994 Di-zinc
VIM-1 1999
VIM-2 2000 Mono-zinc, Di-zinc
IMP-2 2000
SPM-1 2002 Mono-zinc
VIM-4 2003
GIM-1 2004
SIM-1 2005
NDM-1 2009 Di-zinc
B2 CphA 1991 Mono-zinc
ImiS 1996
Sfh-1 2003
CAU-1 Di-zinc
FEZ-1 Di-zinc
GOB-1 Di-zinc
B3 L1 1991 Di-zinc, Mono-zinc, Apo-form
GOB-1 2000
FEZ-1 2000 Di-zinc
THIN-B 2001
Mbl1b 2001
CAU-1 2002
BJP-1 2006 Di-zinc

371
Appendix C
Genome attributes of blaNDM-positive E. coli and K. pneumoniae retrieved from
NCBI
BioSample Species
SAMD00112930 E. coli
SAMN03273577 E. coli
SAMN02726231 E. coli
SAMN03217331 E. coli
SAMN03220397 E. coli
SAMN04011432 E. coli
SAMN04157978 E. coli
SAMN04157977 E. coli
SAMN04157979 E. coli
SAMN04157980 E. coli
SAMN04157981 E. coli
SAMN04157982 E. coli
SAMN04158281 E. coli
SAMN04158303 E. coli
SAMN04158305 E. coli
SAMN04158307 E. coli
SAMN04158313 E. coli
SAMN04158324 E. coli
SAMN04384259 E. coli
SAMN04500792 E. coli
SAMN04884976 E. coli
SAMN04901707 E. coli
SAMN04910063 E. coli
SAMN04910092 E. coli
SAMN04917426 E. coli
SAMN04917438 E. coli
SAMN05294116 E. coli
SAMN05425592 E. coli
SAMN05928845 E. coli
SAMN05928846 E. coli
SAMN05928847 E. coli
SAMN05928848 E. coli
SAMN05928849 E. coli
SAMN05928850 E. coli
SAMN05928851 E. coli
SAMN05928852 E. coli
SAMN05928853 E. coli
SAMN05928854 E. coli
SAMN05928855 E. coli
SAMN05928856 E. coli
SAMN05928857 E. coli
SAMN05928858 E. coli
SAMN05928859 E. coli

372
SAMN05928860 E. coli
SAMN05928861 E. coli
SAMN05928862 E. coli
SAMN05928863 E. coli
SAMN05928864 E. coli
SAMN05928865 E. coli
SAMN05928866 E. coli
SAMN05928867 E. coli
SAMN05928868 E. coli
SAMN05928869 E. coli
SAMN05928870 E. coli
SAMN05928871 E. coli
SAMN05928872 E. coli
SAMN05928873 E. coli
SAMN05928874 E. coli
SAMN05928875 E. coli
SAMN05928876 E. coli
SAMN05928877 E. coli
SAMN05928878 E. coli
SAMN05928879 E. coli
SAMN05928880 E. coli
SAMN05928881 E. coli
SAMN05928882 E. coli
SAMN05928883 E. coli
SAMN05928884 E. coli
SAMN05928885 E. coli
SAMN05928886 E. coli
SAMN05928887 E. coli
SAMN05928888 E. coli
SAMN05928889 E. coli
SAMN05928890 E. coli
SAMN05928891 E. coli
SAMN05928892 E. coli
SAMN05928893 E. coli
SAMN05928894 E. coli
SAMN05928895 E. coli
SAMN05928896 E. coli
SAMN05928897 E. coli
SAMN05928898 E. coli
SAMN05928899 E. coli
SAMN05928901 E. coli
SAMN05928902 E. coli
SAMN05928903 E. coli
SAMN05928904 E. coli
SAMN05928905 E. coli
SAMN05928906 E. coli
SAMN05928908 E. coli
SAMN05928907 E. coli

373
SAMN05928909 E. coli
SAMN05928910 E. coli
SAMN05928911 E. coli
SAMN05928912 E. coli
SAMN05928913 E. coli
SAMN05928914 E. coli
SAMN05928915 E. coli
SAMN05928916 E. coli
SAMN05928917 E. coli
SAMN05928918 E. coli
SAMN05928919 E. coli
SAMN05928900 E. coli
SAMN05928920 E. coli
SAMN05928921 E. coli
SAMN05928922 E. coli
SAMN05928923 E. coli
SAMN05928924 E. coli
SAMN05928925 E. coli
SAMN05928926 E. coli
SAMN05928927 E. coli
SAMN05928928 E. coli
SAMN05928929 E. coli
SAMN05928930 E. coli
SAMN05928931 E. coli
SAMN05928932 E. coli
SAMN05928933 E. coli
SAMN05928934 E. coli
SAMN05928935 E. coli
SAMN05928936 E. coli
SAMN05928937 E. coli
SAMN05928938 E. coli
SAMN05928939 E. coli
SAMN05928940 E. coli
SAMN05928941 E. coli
SAMN05928942 E. coli
SAMN05928943 E. coli
SAMN05928944 E. coli
SAMN05928945 E. coli
SAMN05928946 E. coli
SAMN05928947 E. coli
SAMN05928948 E. coli
SAMN05928949 E. coli
SAMN05928950 E. coli
SAMN05928951 E. coli
SAMN05928952 E. coli
SAMN05928953 E. coli
SAMN05928954 E. coli
SAMN05928955 E. coli

374
SAMN05928956 E. coli
SAMN05928957 E. coli
SAMN05928958 E. coli
SAMN05928959 E. coli
SAMN05928960 E. coli
SAMN05928961 E. coli
SAMN05928962 E. coli
SAMN05928963 E. coli
SAMN05928964 E. coli
SAMN05928965 E. coli
SAMN05928966 E. coli
SAMN05928967 E. coli
SAMN05928968 E. coli
SAMN05928969 E. coli
SAMN05928970 E. coli
SAMN05928971 E. coli
SAMN05928973 E. coli
SAMN05928972 E. coli
SAMN05928974 E. coli
SAMN05928975 E. coli
SAMN05928976 E. coli
SAMN05928977 E. coli
SAMN05928978 E. coli
SAMN05928979 E. coli
SAMN05928980 E. coli
SAMN05928981 E. coli
SAMN05928983 E. coli
SAMN05928982 E. coli
SAMN05928984 E. coli
SAMN05928985 E. coli
SAMN05928986 E. coli
SAMN05928987 E. coli
SAMN05928988 E. coli
SAMN05928989 E. coli
SAMN05928990 E. coli
SAMN05928991 E. coli
SAMN05928992 E. coli
SAMN05928993 E. coli
SAMN05928994 E. coli
SAMN05928995 E. coli
SAMN05928996 E. coli
SAMN05928997 E. coli
SAMN05928998 E. coli
SAMN05928999 E. coli
SAMN05929000 E. coli
SAMN05929001 E. coli
SAMN05929002 E. coli
SAMN05929003 E. coli

375
SAMN05929004 E. coli
SAMN05929005 E. coli
SAMN05929019 E. coli
SAMN04014889 E. coli
SAMN06711152 E. coli
SAMN06703218 E. coli
SAMN04521875 E. coli
SAMN04521918 E. coli
SAMN04521928 E. coli
SAMN04521936 E. coli
SAMN06973353 E. coli
SAMN07368479 E. coli
SAMN07344985 E. coli
SAMN07344984 E. coli
SAMN07344983 E. coli
SAMN07344982 E. coli
SAMN07344981 E. coli
SAMN07556529 E. coli
SAMN07556509 E. coli
SAMN07459800 E. coli
SAMN03263950 E. coli
SAMN04299569 E. coli
SAMN04939501 E. coli
SAMN06198938 E. coli
SAMN06198937 E. coli
SAMN04014959 E. coli
SAMN04014910 E. coli
SAMN06828737 E. coli
SAMN06924979 E. coli
SAMN06925129 E. coli
SAMN04014990 E. coli
SAMN04014960 E. coli
SAMN04015003 E. coli
SAMN04014992 E. coli
SAMN04014969 E. coli
SAMN04014991 E. coli
SAMN04014978 E. coli
SAMN04014896 E. coli
SAMN07312477 E. coli
SAMN07312492 E. coli
SAMN07983336 E. coli
SAMN07944243 E. coli
SAMN07944241 E. coli
SAMN07944240 E. coli
SAMN07944239 E. coli
SAMN05341196 E. coli
SAMN08369073 E. coli
SAMN08212052 E. coli

376
SAMN07291528 E. coli
SAMN08765149 E. coli
SAMN09381942 E. coli
SAMN07291545 E. coli
SAMN08663441 E. coli
SAMN09710898 E. coli
SAMN07312485 E. coli
SAMN07312471 E. coli
SAMN07312481 E. coli
SAMN07983281 E. coli
SAMN08116101 E. coli
SAMN08116691 E. coli
SAMN08473892 E. coli
SAMN08560511 E. coli
SAMN08560510 E. coli
SAMN08560509 E. coli
SAMN08560508 E. coli
SAMN08560507 E. coli
SAMN08560506 E. coli
SAMN08560505 E. coli
SAMN08637787 E. coli
SAMN08637786 E. coli
SAMN08637785 E. coli
SAMN08637784 E. coli
SAMN08637783 E. coli
SAMN08637782 E. coli
SAMN08637781 E. coli
SAMN08637780 E. coli
SAMN08637779 E. coli
SAMN08637777 E. coli
SAMN08637776 E. coli
SAMN08637774 E. coli
SAMN08637773 E. coli
SAMN08637772 E. coli
SAMN08637770 E. coli
SAMN08637768 E. coli
SAMN08637766 E. coli
SAMN08637765 E. coli
SAMN08637764 E. coli
SAMN08637763 E. coli
SAMN08637760 E. coli
SAMN08637759 E. coli
SAMN08637758 E. coli
SAMN08625048 E. coli
SAMN08625047 E. coli
SAMN08625046 E. coli
SAMN08897788 E. coli
SAMN09269490 E. coli

377
SAMN09435562 E. coli
SAMN03083281 E. coli
SAMN06909183 E. coli
SAMN06909182 E. coli
SAMN06909181 E. coli
SAMN06909179 E. coli
SAMN06909176 E. coli
SAMN06909174 E. coli
SAMN06909173 E. coli
SAMN07340853 E. coli
SAMN07602137 E. coli
SAMN07602136 E. coli
SAMN06909153 E. coli
SAMN08281024 E. coli
SAMN07768275 E. coli
SAMN06209723 E. coli
SAMN07510673 E. coli
SAMN06209728 E. coli
SAMN06909152 E. coli
SAMN06909172 E. coli
SAMN06231252 E. coli
SAMN06909177 E. coli
SAMN08932733 E. coli
SAMN06909178 E. coli
SAMN06909180 E. coli
SAMN06209720 E. coli
SAMN06209725 E. coli
SAMN06209727 E. coli
SAMN08364576 E. coli
SAMN08932731 E. coli
SAMN08932734 E. coli
SAMN08932735 E. coli
SAMN08932736 E. coli
SAMN08932737 E. coli
SAMN08932739 E. coli
SAMN08932740 E. coli
SAMN08932741 E. coli
SAMN08932742 E. coli
SAMN08932745 E. coli
SAMN08932746 E. coli
SAMN08932752 E. coli
SAMN08932753 E. coli
SAMN08932756 E. coli
SAMN08932757 E. coli
SAMN09202773 E. coli
SAMN09202774 E. coli
SAMN09842376 E. coli
SAMN09842377 E. coli

378
SAMN09842378 E. coli
SAMN09842379 E. coli
SAMN09842380 E. coli
SAMN09842381 E. coli
SAMN09842382 E. coli
SAMN09842383 E. coli
SAMN06209721 E. coli
SAMN06209722 E. coli
SAMN06209724 E. coli
SAMN06209726 E. coli
SAMN06209729 E. coli
SAMN03083281 E. coli
SAMN04361562 E. coli
SAMN03785491 E. coli
SAMN06909179 E. coli
SAMN06909175 E. coli
SAMN06909181 E. coli
SAMN07340853 E. coli
SAMN08637775 E. coli
SAMN08637788 E. coli
SAMN08932765 E. coli
SAMN08932767 E. coli
SAMN08932766 E. coli
SAMN08932762 E. coli
SAMN08932761 E. coli
SAMN08932764 E. coli
SAMN08932763 E. coli
SAMN09273490 E. coli
SAMN09858233 E. coli
SAMN09985625 E. coli
SAMN09985624 E. coli
SAMN09985623 E. coli
SAMN09985620 E. coli
SAMN09985627 E. coli
SAMN09985626 E. coli
SAMN09985622 E. coli
SAMN09985621 E. coli
SAMN09985619 E. coli
SAMN10160269 E. coli
SAMN10160267 E. coli
SAMN10160262 E. coli
SAMN09767201 E. coli
SAMN10249197 E. coli
SAMN10527283 E. coli
SAMN10527282 E. coli
SAMN08242084 E. coli
SAMN10644704 E. coli
SAMN10583475 E. coli

379
SAMN09289760 E. coli
SAMN09289738 E. coli
SAMN10219258 E. coli
SAMN10219262 E. coli
SAMN10219261 E. coli
SAMN10219263 E. coli
SAMN10219260 E. coli
SAMN10219259 E. coli
SAMN10219257 E. coli
SAMN10219256 E. coli
SAMN10219255 E. coli
SAMN10219254 E. coli
SAMN10219253 E. coli
SAMN10219251 E. coli
SAMN10219249 E. coli
SAMN10219248 E. coli
SAMN10219247 E. coli
SAMN10219246 E. coli
SAMN10219245 E. coli
SAMN10219243 E. coli
SAMN10219242 E. coli
SAMN10219244 E. coli
SAMN10812906 E. coli
SAMN10977714 E. coli
SAMN10977713 E. coli
SAMN11366426 E. coli
SAMN11388474 E. coli
SAMN10105241 E. coli
SAMN10105866 E. coli
SAMN11399363 E. coli
SAMN11399743 E. coli
SAMN11399361 E. coli
SAMN11399414 E. coli
SAMN11665607 E. coli
SAMN11649487 E. coli
SAMN11602614 E. coli
SAMD00164387 E. coli
SAMN11773853 E. coli
SAMN12437586 E. coli
SAMN12440947 E. coli
SAMN11601932 E. coli
SAMN12736389 E. coli
SAMN10516605 E. coli
SAMN10516609 E. coli
SAMN10516610 E. coli
SAMN10516607 E. coli
SAMN10516602 E. coli
SAMN10516606 E. coli

380
SAMN10516604 E. coli
SAMN10516599 E. coli
SAMN10516601 E. coli
SAMN10516600 E. coli
SAMN10516597 E. coli
SAMN10516595 E. coli
SAMN10516596 E. coli
SAMN10516594 E. coli
SAMN10516593 E. coli
SAMN10516592 E. coli
SAMN10516591 E. coli
SAMN10516589 E. coli
SAMN10516608 E. coli
SAMN10516588 E. coli
SAMN10516587 E. coli
SAMN10516586 E. coli
SAMN10516585 E. coli
SAMN10516582 E. coli
SAMN10516584 E. coli
SAMN10516581 E. coli
SAMN10516578 E. coli
SAMN10516576 E. coli
SAMN10516577 E. coli
SAMN10516573 E. coli
SAMN10516575 E. coli
SAMN10516574 E. coli
SAMN10516571 E. coli
SAMN10516570 E. coli
SAMN10516569 E. coli
SAMN10516568 E. coli
SAMN10516567 E. coli
SAMN10516565 E. coli
SAMN10516563 E. coli
SAMN10516559 E. coli
SAMN10516562 E. coli
SAMN10516561 E. coli
SAMN10516558 E. coli
SAMN10516554 E. coli
SAMN10516549 E. coli
SAMN10516547 E. coli
SAMN10516548 E. coli
SAMN10516546 E. coli
SAMN10516545 E. coli
SAMN10516543 E. coli
SAMN10516542 E. coli
SAMN10516544 E. coli
SAMN10516541 E. coli
SAMN10516540 E. coli

381
SAMN10516539 E. coli
SAMN10516538 E. coli
SAMN10516536 E. coli
SAMN10516534 E. coli
SAMN10516533 E. coli
SAMN10516535 E. coli
SAMN10516532 E. coli
SAMN10516531 E. coli
SAMN10516529 E. coli
SAMN10516528 E. coli
SAMN10516527 E. coli
SAMN10516526 E. coli
SAMN10516523 E. coli
SAMN10516524 E. coli
SAMN10516525 E. coli
SAMN10516603 E. coli
SAMN10516590 E. coli
SAMN10516580 E. coli
SAMN10516579 E. coli
SAMN10516566 E. coli
SAMN10516564 E. coli
SAMN10516557 E. coli
SAMN10516556 E. coli
SAMN10516560 E. coli
SAMN10516555 E. coli
SAMN10516553 E. coli
SAMN10516552 E. coli
SAMN10516550 E. coli
SAMN10516551 E. coli
SAMN10516572 E. coli
SAMN11246202 E. coli
SAMN11246201 E. coli
SAMN11246197 E. coli
SAMN11246196 E. coli
SAMN11246195 E. coli
SAMN11246193 E. coli
SAMN11246194 E. coli
SAMN10715997 E. coli
SAMN12335442 E. coli
SAMN11928059 E. coli
SAMN12261840 E. coli
SAMN12261843 E. coli
SAMN13951916 E. coli
SAMN13951917 E. coli
SAMN13951915 E. coli
SAMN13616206 E. coli
SAMN14120144 E. coli
SAMN14120143 E. coli

382
SAMN14120138 E. coli
SAMN14120127 E. coli
SAMN14120193 E. coli
SAMN14120188 E. coli
SAMN14134967 E. coli
SAMN14134965 E. coli
SAMN14134964 E. coli
SAMN14134963 E. coli
SAMN14134962 E. coli
SAMN14134961 E. coli
SAMN14134966 E. coli
SAMN14134959 E. coli
SAMN14134956 E. coli
SAMN14134954 E. coli
SAMN14134953 E. coli
SAMN14134949 E. coli
SAMN14134948 E. coli
SAMN14134943 E. coli
SAMN14134944 E. coli
SAMN14134938 E. coli
SAMN14134939 E. coli
SAMN14134940 E. coli
SAMN13668970 E. coli
SAMN14380028 E. coli
SAMN14421542 E. coli
SAMN14480721 E. coli
SAMEA4706909 E. coli
SAMEA4727892 E. coli
SAMEA4727937 E. coli
SAMEA4830819 E. coli
SAMEA4916040 E. coli
SAMEA4916063 E. coli
SAMEA4916089 E. coli
SAMEA4916095 E. coli
SAMEA4916096 E. coli
SAMEA4916090 E. coli
SAMN04011432 E. coli
SAMN08663441 E. coli
SAMN09693981 E. coli
SAMN09729056 E. coli
SAMN09829654 E. coli
SAMN09717320 E. coli
SAMN10623914 E. coli
SAMN10531472 E. coli
SAMN10531954 E. coli
SAMN10219252 E. coli
SAMN11174938 E. coli
SAMN11283108 E. coli

383
SAMN04158281 E. coli
SAMN11230749 E. coli
SAMN12619458 E. coli
SAMN12619458 E. coli
SAMN10246265 E. coli
SAMN02471909 K. pneumoniae
SAMN02470628 K. pneumoniae
SAMD00109349 K. pneumoniae
SAMD00112932 K. pneumoniae
SAMD00112933 K. pneumoniae
SAMD00112934 K. pneumoniae
SAMD00112935 K. pneumoniae
SAMD00112936 K. pneumoniae
SAMD00112938 K. pneumoniae
SAMD00112940 K. pneumoniae
SAMD00112941 K. pneumoniae
SAMD00112942 K. pneumoniae
SAMD00112943 K. pneumoniae
SAMEA3140027 K. pneumoniae
SAMEA2072940 K. pneumoniae
SAMEA2609374 K. pneumoniae
SAMEA2609377 K. pneumoniae
SAMEA2609369 K. pneumoniae
SAMEA2609413 K. pneumoniae
SAMEA2609405 K. pneumoniae
SAMEA2609412 K. pneumoniae
SAMEA2609427 K. pneumoniae
SAMEA2609424 K. pneumoniae
SAMEA2609444 K. pneumoniae
SAMEA2609436 K. pneumoniae
SAMEA2609500 K. pneumoniae
SAMEA2609503 K. pneumoniae
SAMEA2609505 K. pneumoniae
SAMEA2609510 K. pneumoniae
SAMEA2609514 K. pneumoniae
SAMN03273576 K. pneumoniae
SAMN02581242 K. pneumoniae
SAMN02996352 K. pneumoniae
SAMN02996353 K. pneumoniae
SAMN03144673 K. pneumoniae
SAMN02996355 K. pneumoniae
SAMN02996354 K. pneumoniae
SAMN03451033 K. pneumoniae
SAMN03280392 K. pneumoniae
SAMN03280316 K. pneumoniae
SAMN04011419 K. pneumoniae
SAMN04011420 K. pneumoniae
SAMN04011425 K. pneumoniae

384
SAMN04011434 K. pneumoniae
SAMN04011433 K. pneumoniae
SAMN04011440 K. pneumoniae
SAMN04011441 K. pneumoniae
SAMN04011443 K. pneumoniae
SAMN04011455 K. pneumoniae
SAMN04046648 K. pneumoniae
SAMN03740593 K. pneumoniae
SAMN04168650 K. pneumoniae
SAMN04168651 K. pneumoniae
SAMN04168652 K. pneumoniae
SAMN04168653 K. pneumoniae
SAMN04168655 K. pneumoniae
SAMN04168660 K. pneumoniae
SAMN04168661 K. pneumoniae
SAMN04168662 K. pneumoniae
SAMN04168689 K. pneumoniae
SAMN04158291 K. pneumoniae
SAMN04158293 K. pneumoniae
SAMN04158298 K. pneumoniae
SAMN04158306 K. pneumoniae
SAMN04158309 K. pneumoniae
SAMN04158315 K. pneumoniae
SAMN04158320 K. pneumoniae
SAMN04158325 K. pneumoniae
SAMN04456062 K. pneumoniae
SAMN04498375 K. pneumoniae
SAMN05213499 K. pneumoniae
SAMN05213500 K. pneumoniae
SAMN05213498 K. pneumoniae
SAMN05213494 K. pneumoniae
SAMN05213495 K. pneumoniae
SAMN05213496 K. pneumoniae
SAMN05252770 K. pneumoniae
SAMN05505089 K. pneumoniae
SAMN05892170 K. pneumoniae
SAMN04014882 K. pneumoniae
SAMN05956151 K. pneumoniae
SAMN06187679 K. pneumoniae
SAMN06208877 K. pneumoniae
SAMN06392936 K. pneumoniae
SAMN06670983 K. pneumoniae
SAMN06670984 K. pneumoniae
SAMN06670985 K. pneumoniae
SAMN06670986 K. pneumoniae
SAMN06670987 K. pneumoniae
SAMN06670989 K. pneumoniae
SAMN06670990 K. pneumoniae

385
SAMN04521906 K. pneumoniae
SAMN07173925 K. pneumoniae
SAMN07175066 K. pneumoniae
SAMN07175068 K. pneumoniae
SAMN07175654 K. pneumoniae
SAMN07178579 K. pneumoniae
SAMN07203007 K. pneumoniae
SAMN07203032 K. pneumoniae
SAMN06704522 K. pneumoniae
SAMN06704523 K. pneumoniae
SAMN07259825 K. pneumoniae
SAMN07345013 K. pneumoniae
SAMN07179230 K. pneumoniae
SAMN07179229 K. pneumoniae
SAMN07450620 K. pneumoniae
SAMN07450619 K. pneumoniae
SAMN07450567 K. pneumoniae
SAMN07450566 K. pneumoniae
SAMN07450565 K. pneumoniae
SAMN07450563 K. pneumoniae
SAMN07450562 K. pneumoniae
SAMN07450561 K. pneumoniae
SAMN07450557 K. pneumoniae
SAMN07450556 K. pneumoniae
SAMN07450555 K. pneumoniae
SAMN07450577 K. pneumoniae
SAMN07450622 K. pneumoniae
SAMN07450551 K. pneumoniae
SAMN07450589 K. pneumoniae
SAMN07450583 K. pneumoniae
SAMN07450576 K. pneumoniae
SAMN07690433 K. pneumoniae
SAMN02152539 K. pneumoniae
SAMN03081487 K. pneumoniae
SAMN02885365 K. pneumoniae
SAMN02777842 K. pneumoniae
SAMN03770912 K. pneumoniae
SAMN04044480 K. pneumoniae
SAMN04168649 K. pneumoniae
SAMN04421276 K. pneumoniae
SAMN04457965 K. pneumoniae
SAMN03455970 K. pneumoniae
SAMN04448229 K. pneumoniae
SAMN05412811 K. pneumoniae
SAMN04014890 K. pneumoniae
SAMN04014909 K. pneumoniae
SAMN06437491 K. pneumoniae
SAMN04158282 K. pneumoniae

386
SAMN04014987 K. pneumoniae
SAMN04014999 K. pneumoniae
SAMN04014984 K. pneumoniae
SAMN04014979 K. pneumoniae
SAMN04014986 K. pneumoniae
SAMN04014993 K. pneumoniae
SAMN04014989 K. pneumoniae
SAMN04014980 K. pneumoniae
SAMN07265011 K. pneumoniae
SAMN07373332 K. pneumoniae
SAMN04011426 K. pneumoniae
SAMN07312483 K. pneumoniae
SAMN07312490 K. pneumoniae
SAMN07792096 K. pneumoniae
SAMN07944238 K. pneumoniae
SAMN07944237 K. pneumoniae
SAMN08022168 K. pneumoniae
SAMN08455837 K. pneumoniae
SAMN08663449 K. pneumoniae
SAMN08848079 K. pneumoniae
SAMN04014994 K. pneumoniae
SAMN07312479 K. pneumoniae
SAMN07452567 K. pneumoniae
SAMN07816529 K. pneumoniae
SAMN08176475 K. pneumoniae
SAMN08238507 K. pneumoniae
SAMN08733388 K. pneumoniae
SAMN08897786 K. pneumoniae
SAMEA4364577 K. pneumoniae
SAMEA4364596 K. pneumoniae
SAMEA4364613 K. pneumoniae
SAMEA4364631 K. pneumoniae
SAMEA4364651 K. pneumoniae
SAMEA4364660 K. pneumoniae
SAMEA4364618 K. pneumoniae
SAMEA4364633 K. pneumoniae
SAMEA4364617 K. pneumoniae
SAMN09688120 K. pneumoniae
SAMN09688153 K. pneumoniae
SAMN09688136 K. pneumoniae
SAMN09688152 K. pneumoniae
SAMN09688172 K. pneumoniae
SAMN09688175 K. pneumoniae
SAMN09842415 K. pneumoniae
SAMN09842421 K. pneumoniae
SAMN09842420 K. pneumoniae
SAMN09842422 K. pneumoniae
SAMN02996355 K. pneumoniae

387
SAMN02996354 K. pneumoniae
SAMN02996353 K. pneumoniae
SAMN02996352 K. pneumoniae
SAMN04158282 K. pneumoniae
SAMN05710263 K. pneumoniae
SAMN05447361 K. pneumoniae
SAMN05792418 K. pneumoniae
SAMN05792433 K. pneumoniae
SAMN05732393 K. pneumoniae
SAMN06909165 K. pneumoniae
SAMN06909164 K. pneumoniae
SAMN07371089 K. pneumoniae
SAMN06671968 K. pneumoniae
SAMN06671969 K. pneumoniae
SAMN06671958 K. pneumoniae
SAMN06671976 K. pneumoniae
SAMN06671959 K. pneumoniae
SAMN06671955 K. pneumoniae
SAMN07516032 K. pneumoniae
SAMN07510676 K. pneumoniae
SAMN07510675 K. pneumoniae
SAMN07510674 K. pneumoniae
SAMN09835334 K. pneumoniae
SAMN11603436 K. pneumoniae
SAMN11793565 K. pneumoniae
SAMN11835544 K. pneumoniae
SAMN12082929 K. pneumoniae
SAMN09104544 K. pneumoniae
SAMN12264830 K. pneumoniae
SAMN11056345 K. pneumoniae
SAMN13829960 K. pneumoniae
SAMN13829959 K. pneumoniae
SAMN11479260 K. pneumoniae
SAMN14120131 K. pneumoniae
SAMN14120140 K. pneumoniae
SAMN14120141 K. pneumoniae
SAMN14120136 K. pneumoniae
SAMN14120122 K. pneumoniae
SAMN14120118 K. pneumoniae
SAMN14120115 K. pneumoniae
SAMN14120113 K. pneumoniae
SAMN14120194 K. pneumoniae
SAMN14112009 K. pneumoniae
SAMN14112000 K. pneumoniae
SAMN14112006 K. pneumoniae
SAMN14111994 K. pneumoniae
SAMN14111995 K. pneumoniae
SAMN14112011 K. pneumoniae

388
SAMN14112007 K. pneumoniae
SAMN14112010 K. pneumoniae
SAMN14112008 K. pneumoniae
SAMN14112004 K. pneumoniae
SAMN14112005 K. pneumoniae
SAMN14112001 K. pneumoniae
SAMN14112002 K. pneumoniae
SAMN14112003 K. pneumoniae
SAMN14111998 K. pneumoniae
SAMN14111999 K. pneumoniae
SAMN14111996 K. pneumoniae
SAMN14111997 K. pneumoniae
SAMN12559024 K. pneumoniae
SAMN14134958 K. pneumoniae
SAMN14134947 K. pneumoniae
SAMN14134946 K. pneumoniae
SAMN14134945 K. pneumoniae
SAMN14134941 K. pneumoniae
SAMN14150128 K. pneumoniae
SAMN14150127 K. pneumoniae
SAMN14402361 K. pneumoniae
SAMN14402322 K. pneumoniae
SAMN14402324 K. pneumoniae
SAMN14402326 K. pneumoniae
SAMN14402321 K. pneumoniae
SAMN14402323 K. pneumoniae
SAMN14402350 K. pneumoniae
SAMN14402335 K. pneumoniae
SAMN14402338 K. pneumoniae
SAMN14402333 K. pneumoniae
SAMN14402356 K. pneumoniae
SAMN14402343 K. pneumoniae
SAMN14402345 K. pneumoniae
SAMN14402330 K. pneumoniae
SAMN14402329 K. pneumoniae
SAMN14402360 K. pneumoniae
SAMN14402328 K. pneumoniae
SAMN14421540 K. pneumoniae
SAMN14421541 K. pneumoniae
SAMEA3721223 K. pneumoniae
SAMEA3720962 K. pneumoniae
SAMEA3729770 K. pneumoniae
SAMEA3721140 K. pneumoniae
SAMEA3649819 K. pneumoniae
SAMEA3499939 K. pneumoniae
SAMEA3721201 K. pneumoniae
SAMEA3727558 K. pneumoniae
SAMEA3512046 K. pneumoniae

389
SAMEA3499895 K. pneumoniae
SAMEA3721184 K. pneumoniae
SAMEA3538532 K. pneumoniae
SAMEA3649802 K. pneumoniae
SAMEA3649713 K. pneumoniae
SAMEA3499003 K. pneumoniae
SAMEA5763087 K. pneumoniae
SAMEA5763085 K. pneumoniae
SAMEA5763088 K. pneumoniae
SAMEA5763090 K. pneumoniae
SAMEA6099416 K. pneumoniae
SAMEA104414852 K. pneumoniae
SAMN03255440 K. pneumoniae
SAMN04011439 K. pneumoniae
SAMN06019523 K. pneumoniae
SAMN04014980 K. pneumoniae
SAMN07520304 K. pneumoniae
SAMN07312484 K. pneumoniae
SAMN07312480 K. pneumoniae
SAMN07452567 K. pneumoniae
SAMN07235708 K. pneumoniae
SAMN07602138 K. pneumoniae
SAMN08176456 K. pneumoniae
SAMN08212048 K. pneumoniae
SAMN07609086 K. pneumoniae
SAMN07609146 K. pneumoniae
SAMN07609114 K. pneumoniae
SAMN07609113 K. pneumoniae
SAMN07609093 K. pneumoniae
SAMN07609094 K. pneumoniae
SAMN07609092 K. pneumoniae
SAMN07609090 K. pneumoniae
SAMN07609089 K. pneumoniae
SAMN07609088 K. pneumoniae
SAMN07609084 K. pneumoniae
SAMN07609087 K. pneumoniae
SAMN07609085 K. pneumoniae
SAMN08389140 K. pneumoniae
SAMN08605586 K. pneumoniae
SAMN08604946 K. pneumoniae
SAMN08612378 K. pneumoniae
SAMN08612379 K. pneumoniae
SAMN08624700 K. pneumoniae
SAMN08624675 K. pneumoniae
SAMN08295362 K. pneumoniae
SAMN08624691 K. pneumoniae
SAMN08027262 K. pneumoniae
SAMN08624703 K. pneumoniae

390
SAMN08624702 K. pneumoniae
SAMN08624698 K. pneumoniae
SAMN08624627 K. pneumoniae
SAMN08802956 K. pneumoniae
SAMN08932883 K. pneumoniae
SAMN09604002 K. pneumoniae
SAMN09604068 K. pneumoniae
SAMN08623803 K. pneumoniae
SAMN08623794 K. pneumoniae
SAMN08963294 K. pneumoniae
SAMN09809140 K. pneumoniae
SAMN09845872 K. pneumoniae
SAMN09469783 K. pneumoniae
SAMN09469776 K. pneumoniae
SAMN09469778 K. pneumoniae
SAMN09469780 K. pneumoniae
SAMN09469782 K. pneumoniae
SAMN09469777 K. pneumoniae
SAMN09469781 K. pneumoniae
SAMN09469779 K. pneumoniae
SAMN09469775 K. pneumoniae
SAMN09469774 K. pneumoniae
SAMD00110861 K. pneumoniae
SAMD00059741 K. pneumoniae
SAMD00059744 K. pneumoniae
SAMN10252241 K. pneumoniae
SAMN10252254 K. pneumoniae
SAMN10252232 K. pneumoniae
SAMN10252245 K. pneumoniae
SAMN10267049 K. pneumoniae
SAMN10267038 K. pneumoniae
SAMN10409888 K. pneumoniae
SAMN10241287 K. pneumoniae
SAMN10248982 K. pneumoniae
SAMN10249080 K. pneumoniae
SAMN10249108 K. pneumoniae
SAMN10248967 K. pneumoniae
SAMN10249119 K. pneumoniae
SAMN10249009 K. pneumoniae
SAMN10248999 K. pneumoniae
SAMN10248966 K. pneumoniae
SAMN10249056 K. pneumoniae
SAMN10249038 K. pneumoniae
SAMN10249090 K. pneumoniae
SAMN10522947 K. pneumoniae
SAMN10249165 K. pneumoniae
SAMN10527295 K. pneumoniae
SAMN10527287 K. pneumoniae

391
SAMN10527286 K. pneumoniae
SAMN10583476 K. pneumoniae
SAMN09289742 K. pneumoniae
SAMN08998650 K. pneumoniae
SAMN08998659 K. pneumoniae
SAMN08998636 K. pneumoniae
SAMN08998660 K. pneumoniae
SAMN08998656 K. pneumoniae
SAMN08998655 K. pneumoniae
SAMN08998658 K. pneumoniae
SAMN08998654 K. pneumoniae
SAMN08998649 K. pneumoniae
SAMN08998642 K. pneumoniae
SAMN08998647 K. pneumoniae
SAMN08998645 K. pneumoniae
SAMN08998640 K. pneumoniae
SAMN08998639 K. pneumoniae
SAMN08998657 K. pneumoniae
SAMN08998652 K. pneumoniae
SAMN08998651 K. pneumoniae
SAMN08998646 K. pneumoniae
SAMN08998643 K. pneumoniae
SAMN08998641 K. pneumoniae
SAMN08998637 K. pneumoniae
SAMN08998638 K. pneumoniae
SAMN10531975 K. pneumoniae
SAMN09692822 K. pneumoniae
SAMN10849983 K. pneumoniae
SAMN10907304 K. pneumoniae
SAMN10956215 K. pneumoniae
SAMN10956211 K. pneumoniae
SAMN10956210 K. pneumoniae
SAMN10956214 K. pneumoniae
SAMN10956212 K. pneumoniae
SAMN10956209 K. pneumoniae
SAMN10736447 K. pneumoniae
SAMN10736445 K. pneumoniae
SAMN10736449 K. pneumoniae
SAMN10736433 K. pneumoniae
SAMN10736416 K. pneumoniae
SAMN10736405 K. pneumoniae
SAMN10736408 K. pneumoniae
SAMN11098709 K. pneumoniae
SAMN11098710 K. pneumoniae
SAMN11366425 K. pneumoniae
SAMN11366423 K. pneumoniae
SAMN11388457 K. pneumoniae
SAMN11388485 K. pneumoniae

392
SAMN11388459 K. pneumoniae
SAMN11388461 K. pneumoniae
SAMN11388458 K. pneumoniae
SAMN11388463 K. pneumoniae
SAMN11388470 K. pneumoniae
SAMN11388462 K. pneumoniae
SAMN11388484 K. pneumoniae
SAMN11388460 K. pneumoniae
SAMN11388471 K. pneumoniae
SAMN11388468 K. pneumoniae
SAMN11388472 K. pneumoniae
SAMN11388469 K. pneumoniae
SAMN11399368 K. pneumoniae
SAMN11399371 K. pneumoniae
SAMN11399334 K. pneumoniae
SAMN11399420 K. pneumoniae
SAMN11399337 K. pneumoniae
SAMN11399325 K. pneumoniae
SAMN11399372 K. pneumoniae
SAMN11399359 K. pneumoniae
SAMN11399416 K. pneumoniae
SAMN11399411 K. pneumoniae
SAMN11419421 K. pneumoniae
SAMN11399413 K. pneumoniae
SAMN11419357 K. pneumoniae
SAMN11399422 K. pneumoniae
SAMN11399409 K. pneumoniae
SAMN11399330 K. pneumoniae
SAMN11399336 K. pneumoniae
SAMN11399367 K. pneumoniae
SAMN11399335 K. pneumoniae
SAMN11399329 K. pneumoniae
SAMN11399401 K. pneumoniae
SAMN11399377 K. pneumoniae
SAMN11399328 K. pneumoniae
SAMN11399356 K. pneumoniae
SAMN11399326 K. pneumoniae
SAMN11399327 K. pneumoniae
SAMN11399324 K. pneumoniae
SAMN11399360 K. pneumoniae
SAMN11399355 K. pneumoniae
SAMN11399424 K. pneumoniae
SAMN11399357 K. pneumoniae
SAMN11399407 K. pneumoniae
SAMN11399350 K. pneumoniae
SAMN11399379 K. pneumoniae
SAMN11399423 K. pneumoniae
SAMN11399378 K. pneumoniae
393
SAMN11399351 K. pneumoniae
SAMN11399426 K. pneumoniae
SAMN11399418 K. pneumoniae
SAMN11399408 K. pneumoniae
SAMN11399425 K. pneumoniae
SAMN11399461 K. pneumoniae
SAMN11399460 K. pneumoniae
SAMN11399459 K. pneumoniae
SAMN11399385 K. pneumoniae
SAMN11399398 K. pneumoniae
SAMN11399412 K. pneumoniae
SAMN11399419 K. pneumoniae
SAMN11399421 K. pneumoniae
SAMN11399406 K. pneumoniae
SAMN11399393 K. pneumoniae
SAMN11399392 K. pneumoniae
SAMN11399410 K. pneumoniae
SAMN11399432 K. pneumoniae
SAMN11419420 K. pneumoniae
SAMN11419418 K. pneumoniae
SAMN11399380 K. pneumoniae
SAMN11399405 K. pneumoniae
SAMN11399417 K. pneumoniae
SAMN11399397 K. pneumoniae
SAMN11399394 K. pneumoniae
SAMN11399400 K. pneumoniae
SAMN11399389 K. pneumoniae
SAMN11399429 K. pneumoniae
SAMN11399431 K. pneumoniae
SAMN11399396 K. pneumoniae
SAMN11399433 K. pneumoniae
SAMN11399395 K. pneumoniae
SAMN11399386 K. pneumoniae
SAMN11399399 K. pneumoniae
SAMN11399390 K. pneumoniae
SAMN11399391 K. pneumoniae
SAMN11399430 K. pneumoniae
SAMN11399462 K. pneumoniae
SAMN11399467 K. pneumoniae
SAMN11399744 K. pneumoniae
SAMN11399745 K. pneumoniae
SAMN11399453 K. pneumoniae
SAMN11399438 K. pneumoniae
SAMN11399470 K. pneumoniae
SAMN11399474 K. pneumoniae
SAMN11399473 K. pneumoniae
SAMN11399480 K. pneumoniae
SAMN11399478 K. pneumoniae

394
SAMN11399485 K. pneumoniae
SAMN11399483 K. pneumoniae
SAMN11399723 K. pneumoniae
SAMN11399484 K. pneumoniae
SAMN11399469 K. pneumoniae
SAMN11399477 K. pneumoniae
SAMN11399728 K. pneumoniae
SAMN11399440 K. pneumoniae
SAMN11399439 K. pneumoniae
SAMN11399504 K. pneumoniae
SAMN11399488 K. pneumoniae
SAMN11399486 K. pneumoniae
SAMN11399492 K. pneumoniae
SAMN11399428 K. pneumoniae
SAMN11399427 K. pneumoniae
SAMN11399715 K. pneumoniae
SAMN11399482 K. pneumoniae
SAMN11399472 K. pneumoniae
SAMN11399468 K. pneumoniae
SAMN11399442 K. pneumoniae
SAMN11399452 K. pneumoniae
SAMN11399498 K. pneumoniae
SAMN11399434 K. pneumoniae
SAMN11399463 K. pneumoniae
SAMN11399501 K. pneumoniae
SAMN11399495 K. pneumoniae
SAMN11399475 K. pneumoniae
SAMN11399451 K. pneumoniae
SAMN11399479 K. pneumoniae
SAMN11399435 K. pneumoniae
SAMN11399731 K. pneumoniae
SAMN11399732 K. pneumoniae
SAMN11399729 K. pneumoniae
SAMN11399740 K. pneumoniae
SAMN11419359 K. pneumoniae
SAMN11399443 K. pneumoniae
SAMN11399721 K. pneumoniae
SAMN11399481 K. pneumoniae
SAMN11399713 K. pneumoniae
SAMN11399502 K. pneumoniae
SAMN11399496 K. pneumoniae
SAMN11399497 K. pneumoniae
SAMN11399733 K. pneumoniae
SAMN11399499 K. pneumoniae
SAMN11399741 K. pneumoniae
SAMN11399493 K. pneumoniae
SAMN11399323 K. pneumoniae
SAMN11399415 K. pneumoniae

395
SAMN11399364 K. pneumoniae
SAMN11399354 K. pneumoniae
SAMN11399450 K. pneumoniae
SAMN11360905 K. pneumoniae
SAMN10516706 K. pneumoniae
SAMN10516702 K. pneumoniae
SAMN10516701 K. pneumoniae
SAMN10516700 K. pneumoniae
SAMN10516699 K. pneumoniae
SAMN10516694 K. pneumoniae
SAMN10516693 K. pneumoniae
SAMN10516689 K. pneumoniae
SAMN10516698 K. pneumoniae
SAMN10516697 K. pneumoniae
SAMN10516688 K. pneumoniae
SAMN10516703 K. pneumoniae
SAMN11793480 K. pneumoniae
SAMN10600576 K. pneumoniae
SAMN11961995 K. pneumoniae
SAMN11974893 K. pneumoniae
SAMN12098371 K. pneumoniae
SAMN12285710 K. pneumoniae
SAMN12285738 K. pneumoniae
SAMN12285730 K. pneumoniae
SAMN12431272 K. pneumoniae
SAMN12431303 K. pneumoniae
SAMN12627831 K. pneumoniae
SAMN12676103 K. pneumoniae
SAMN12714270 K. pneumoniae
SAMN12714271 K. pneumoniae
SAMN12714267 K. pneumoniae
SAMN12714266 K. pneumoniae
SAMN12714261 K. pneumoniae
SAMN12714264 K. pneumoniae
SAMN12714262 K. pneumoniae
SAMN12714257 K. pneumoniae
SAMN12714265 K. pneumoniae
SAMN12714256 K. pneumoniae
SAMN12714268 K. pneumoniae
SAMN12714263 K. pneumoniae
SAMN12738928 K. pneumoniae
SAMN12738926 K. pneumoniae
SAMN12738924 K. pneumoniae
SAMN12868504 K. pneumoniae
SAMN13091586 K. pneumoniae
SAMN13091613 K. pneumoniae
SAMN13151936 K. pneumoniae
SAMN13153751 K. pneumoniae

396
SAMN13153742 K. pneumoniae
SAMN13262230 K. pneumoniae
SAMN13315560 K. pneumoniae
SAMN13229306 K. pneumoniae
SAMN13229293 K. pneumoniae
SAMN13229286 K. pneumoniae
SAMN13229283 K. pneumoniae
SAMN13229282 K. pneumoniae
SAMN12572245 K. pneumoniae
SAMN12572246 K. pneumoniae
SAMN13679093 K. pneumoniae
SAMN13675337 K. pneumoniae
SAMN13675338 K. pneumoniae
SAMN13639765 K. pneumoniae
SAMN13735565 K. pneumoniae
SAMN13623932 K. pneumoniae
SAMN13623933 K. pneumoniae
SAMN13623931 K. pneumoniae
SAMN12126279 K. pneumoniae
SAMN12126189 K. pneumoniae
SAMN10371624 K. pneumoniae
SAMN11479264 K. pneumoniae
SAMN11479262 K. pneumoniae
SAMN11479261 K. pneumoniae
SAMN12250576 K. pneumoniae
SAMN11811878 K. pneumoniae
SAMN11811877 K. pneumoniae
SAMN11811876 K. pneumoniae
SAMEA2742597 K. pneumoniae
SAMEA104168729 K. pneumoniae
SAMEA104168728 K. pneumoniae
SAMEA104168727 K. pneumoniae
SAMEA3649640 K. pneumoniae
SAMEA3649637 K. pneumoniae
SAMEA3649616 K. pneumoniae
SAMEA3649693 K. pneumoniae
SAMEA3649587 K. pneumoniae
SAMEA3649754 K. pneumoniae
SAMEA3649601 K. pneumoniae
SAMEA3649604 K. pneumoniae
SAMEA3649819 K. pneumoniae
SAMEA3649740 K. pneumoniae
SAMEA3649752 K. pneumoniae
SAMEA3649753 K. pneumoniae
SAMEA3649802 K. pneumoniae
SAMEA3649809 K. pneumoniae
SAMEA3649816 K. pneumoniae
SAMEA3649713 K. pneumoniae

397
SAMEA3673019 K. pneumoniae
SAMEA3673042 K. pneumoniae
SAMEA3720946 K. pneumoniae
SAMEA3720962 K. pneumoniae
SAMEA3721167 K. pneumoniae
SAMEA3721166 K. pneumoniae
SAMEA3721175 K. pneumoniae
SAMEA3721192 K. pneumoniae
SAMEA3721201 K. pneumoniae
SAMEA3721220 K. pneumoniae
SAMEA3720956 K. pneumoniae
SAMEA3720964 K. pneumoniae
SAMEA3720963 K. pneumoniae
SAMEA3720925 K. pneumoniae
SAMEA3721138 K. pneumoniae
SAMEA3721144 K. pneumoniae
SAMEA3721140 K. pneumoniae
SAMEA3721153 K. pneumoniae
SAMEA3721149 K. pneumoniae
SAMEA3721161 K. pneumoniae
SAMEA3721170 K. pneumoniae
SAMEA3721173 K. pneumoniae
SAMEA3721174 K. pneumoniae
SAMEA3721178 K. pneumoniae
SAMEA3721184 K. pneumoniae
SAMEA3721197 K. pneumoniae
SAMEA3721194 K. pneumoniae
SAMEA3721218 K. pneumoniae
SAMEA3721221 K. pneumoniae
SAMEA3721223 K. pneumoniae
SAMEA3727569 K. pneumoniae
SAMEA3727558 K. pneumoniae
SAMEA3727640 K. pneumoniae
SAMEA3729827 K. pneumoniae
SAMEA3729837 K. pneumoniae
SAMEA3729654 K. pneumoniae
SAMEA3729743 K. pneumoniae
SAMEA3729770 K. pneumoniae
SAMEA3729774 K. pneumoniae
SAMEA3729777 K. pneumoniae
SAMEA3729781 K. pneumoniae
SAMEA3729748 K. pneumoniae
SAMEA3729872 K. pneumoniae
SAMEA3499895 K. pneumoniae
SAMEA3499939 K. pneumoniae
SAMEA3499003 K. pneumoniae
SAMEA3499901 K. pneumoniae
SAMEA3499943 K. pneumoniae

398
SAMEA3512046 K. pneumoniae
SAMEA3512122 K. pneumoniae
SAMEA3515090 K. pneumoniae
SAMEA3538532 K. pneumoniae
SAMEA3538546 K. pneumoniae
SAMEA3538547 K. pneumoniae
SAMEA3538550 K. pneumoniae
SAMEA3538553 K. pneumoniae
SAMEA3538552 K. pneumoniae
SAMEA3538558 K. pneumoniae
SAMEA3538555 K. pneumoniae
SAMEA3538562 K. pneumoniae
SAMEA3538965 K. pneumoniae
SAMEA3538743 K. pneumoniae
SAMEA4916044 K. pneumoniae
SAMEA4916106 K. pneumoniae
SAMEA4916116 K. pneumoniae
SAMEA4916118 K. pneumoniae
SAMEA4916119 K. pneumoniae
SAME4916132 K. pneumoniae

399
Appendix D

400
Consent form (English)
I am Mr. / Mrs. ……………………………………………… hereby giving well
informed consent for my participation in the study conducted by Dr. Refath Farzana.
I fully understand that my participation in the study will bring fruitful medical
information to be useful for me and for the others in the future. I am convinced that
during participation in the study I shall not be exposed to any physical, social,
psychological, and legal risk. My privacy and confidentiality will be safeguarded, and
my anonymity will be protected. I will preserve the right to withdraw myself from the
study whenever I want.
I would not like to be compensated because of my loss of work time.
Signature/Thumb impression of the patient/ patient’s attendant
Date:
Signature of the investigator:
Date:

401
Appendix E
Recipes for reagents prepared locally
Ethidium bromide
Stock solution of ethidium bromide (Sigma-Aldrich, Missouri, USA) (10 mg/ml) was
prepared. The stock was transferred to a dark bottle and was stored at room
temperature. Working concentration was achieved by 1:20 dilution of the stock.
TBE buffer (10X)
108 g of tris (Thermo Fisher Scientific, Waltham, USA), 54 g of boric acid (Sigma-
Aldrich, Missouri, USA), 7.44 g of NaEDTA (Thermo Fisher Scientific, Waltham,
USA) were added in 1 L distilled water.
Cell Suspension Buffer
100 ml of 1 M Tris (pH 8.0), 200 ml of 0.5 M EDTA (pH 8.0) were diluted in 1 L of
CLRW.
Cell Lysis Buffer
50 ml of 1 M Tris (pH 8.0), 100 ml of 0.5 M EDTA (pH 8.0), 100 ml of 10 % Sarcosyl
(N-Lauroylsarcosine, Sodium salt) (Sigma-Aldrich, Missouri, USA) were diluted in 1
L of CLRW.
Tris-EDTA (TE)
10 ml of 1 M Tris (pH 8.0) and 2 ml of 0.5 M EDTA (pH 8.0) were diluted in 1 L of
CLRW.
S1 buffer (10X)
S1 buffer was prepared by adding 12.3 g of Sodium acetate (30 mM, pH 4.6) (Thermo
Fisher Scientific, Waltham, USA) and 0.92 g Zinc acetate (1 mM) (Thermo Fisher
Scientific, Waltham, USA) to 200 ml of water. Then 250 ml of glycerol (5%) (Sigma-
Aldrich, Missouri, USA) was added and pH was adjusted to 4.6. Finally, 500 ml water
was added, and the mixture was stored at -20o C.

402
Denaturing solution
20 g NaOH (0.5 M) (Sigma-Aldrich, Missouri, USA) and 87.66 g NaCl (1.5 M) were
added to 1 L water.
Neutralising solution
60.5 g Tris base (0.5 M, pH 7.5) and 87.6 g NaCl (1.5 M) were dissolved in 800 ml of
water and pH was adjusted to 7.5 with concentrated HCl (Sigma-Aldrich, Missouri,
USA).
Saline-sodium citrate (SSC) buffer (20X)
175.3 g NaCl and 77.4 g sodium citrate (Thermo Fisher Scientific, Waltham, USA)
were added to 1 L of water and pH was adjusted to 7.
Pre-hybridisation solution
The solution consists of 5% Polyvinylpyrrolidone (0.4 ml) (Sigma-Aldrich, Missouri,
USA), 5% ficoll (0.4 ml) (Thermo Fisher Scientific, Waltham, USA), 10 mg/ml
herring testes DNA (0.3 ml) (Sigma-Aldrich, Missouri, USA), 10% SDS (1 ml)
(Thermo Fisher Scientific, Waltham, USA), 20X SSC (6 ml) and full cream UHT milk
(1 ml). All the components were mixed and finally water was added up to 2 L.

403
Appendix F
Genome attributes of the isolates (retrieved from NCBI) used in the phylogenetic
analysis of Figure 5.1.
BioSample Species ST
SAMN03263950 E. coli ST10
SAMN03294311 E. coli ST10
SAMN03252431 E. coli ST101
SAMN02673556 E. coli ST1011
SAMN00016779 E. coli ST1079
SAMN08993917 E. coli ST117
SAMN09462202 E. coli ST1193
SAMN08382661 E. coli ST131
SAMN04481707 E. coli ST131
SAMN03287565 E. coli ST131
SAMN08161275 E. coli ST1312
SAMN03963241 E. coli ST155
SAMN06198938 E. coli ST156
SAMD00061087 E. coli ST156
SAMN12214763 E. coli ST162
SAMN06198937 E. coli ST167
SAMN11283108 E. coli ST167
SAMD00059754 E. coli ST167
SAMN10956393 E. coli ST167
SAMN04625459 E. coli ST182
SAMN08579566 E. coli ST205
SAMN10250173 E. coli ST206
SAMN10219252 E. coli ST2161
SAMN03252425 E. coli ST224
SAMN07759721 E. coli ST2705
SAMN03252413 E. coli ST295
SAMN07618121 E. coli ST349
SAMN02604066 E. coli ST354
SAMN10691120 E. coli ST354
SAMN03252409 E. coli ST38
SAMN05194390 E. coli ST405
SAMN04158294 E. coli ST405
SAMN06909153 E. coli ST405
SAMN12569951 E. coli ST410
SAMN06909178 E. coli ST410
SAMEA2272277 E. coli ST414
SAMN05511168 E. coli ST44
SAMN03252454 E. coli ST442

404
SAMN07503734 E. coli ST443
SAMN07594018 E. coli ST446
SAMN08663441 E. coli ST448
SAMN10531954 E. coli ST448
SAMN06219550 E. coli ST4542
SAMD00056131 E. coli ST457
SAMD00179457 E. coli ST4577
SAMN03252430 E. coli ST46
SAMN02604037 E. coli ST46
SAMN03252453 E. coli ST48
SAMN08668598 E. coli ST5030
SAMN03252442 E. coli ST5082
SAMN11087649 E. coli ST515
SAMN03252457 E. coli ST517
SAMN08579578 E. coli ST5350
SAMN03996288 E. coli ST538
SAMN07618127 E. coli ST539
SAMN02647163 E. coli ST540
SAMD00168435 E. coli ST542
SAMN03963234 E. coli ST56
SAMEA3529258 E. coli ST57
SAMN03252423 E. coli ST58
SAMN11266496 E. coli ST583
SAMN06219548 E. coli ST602
SAMN03960341 E. coli ST607
SAMN03081526 E. coli ST6130
SAMN02666696 E. coli ST6131
SAMN04448503 E. coli ST6140
SAMN06029894 E. coli ST617
SAMN06029895 E. coli ST617
SAMN06029893 E. coli ST617
SAMEA3138234 E. coli ST62
SAMN07260764 E. coli ST635
SAMN10163231 E. coli ST636
SAMN13242665 E. coli ST641
SAMN03252419 E. coli ST642
SAMN00017915 E. coli ST643
SAMN08579587 E. coli ST646
SAMN05511150 E. coli ST648
SAMN07765387 E. coli ST648
SAMEA5128442 E. coli ST648
SAMN02800875 E. coli ST648
SAMN08579558 E. coli ST655
SAMN13951922 E. coli ST656
SAMN06928086 E. coli ST69

405
SAMN09704974 E. coli ST73
SAMN12233489 E. coli ST761
SAMN08040561 E. coli ST764
SAMN08663435 E. coli ST7786
SAMN07792806 E. coli ST793
SAMN05210898 E. coli ST795
SAMN09710898 E. coli ST80
SAMEA104093909 E. coli ST8217
SAMEA4916090 E. coli ST8346
SAMN02949644 E. coli ST847
SAMEA3368339 E. coli ST8740
SAMN07807402 E. coli ST88
SAMN03252421 E. coli ST90
SAMN07618120 E. coli ST929
SAMN08450093 E. coli ST93
SAMN08165042 E. coli ST937
SAMN08161312 E. coli ST94
SAMN07974445 E. coli ST964
SAMN08579581 E. coli ST967
SAMN03612246 E. coli ST99

406
Genome attributes of the isolates (retrieved from NCBI) used in the phylogenetic
analysis of Figure 5.6.
BioSample Species ST
SAMN05774083 K. pneumoniae ST983
SAMN05231873 K. pneumoniae ST37
SAMN08391417 K. pneumoniae ST307
SAMN07638733 K. pneumoniae ST54
SAMN02603641 K. pneumoniae ST23
SAMN03097203 K. pneumoniae ST65
SAMN10343201 K. pneumoniae ST1685
SAMN08366843 K. pneumoniae ST1265
SAMN08366844 K. pneumoniae ST23
SAMN09476115 K. pneumoniae ST29
SAMN07187263 K. pneumoniae ST15
SAMN03076168 K. pneumoniae ST48
SAMN03076171 K. pneumoniae ST395
SAMN08212048 K. pneumoniae ST147
SAMN08222595 K. pneumoniae ST101
SAMN03196972 K. pneumoniae ST846
SAMN03076172 K. pneumoniae ST11
SAMN03197141 K. pneumoniae ST327
SAMN03197209 K. pneumoniae ST70
SAMN04868736 K. pneumoniae ST11
SAMN12264830 K. pneumoniae ST16
SAMN10678732 K. pneumoniae ST86
SAMN04868740 K. pneumoniae ST258
SAMN03197492 K. pneumoniae ST34
SAMN08222601 K. pneumoniae ST111
SAMN03197549 K. pneumoniae ST60
SAMN07760932 K. pneumoniae ST147
SAMN03197962 K. pneumoniae ST234
SAMN03197968 K. pneumoniae ST528
SAMN03455989 K. pneumoniae ST45
SAMN10790857 K. pneumoniae ST23
SAMN04014907 K. pneumoniae ST14
SAMN04014916 K. pneumoniae ST16
SAMN04014981 K. pneumoniae ST34
SAMN07291519 K. pneumoniae ST15
SAMN10432823 K. pneumoniae ST231
SAMEA3141919 K. pneumoniae ST91
SAMN10910564 K. pneumoniae ST15
SAMN02138655 K. pneumoniae ST186
SAMN02138664 K. pneumoniae ST15
SAMN02138667 K. pneumoniae ST661
SAMN02356586 K. pneumoniae ST540
SAMN02581290 K. pneumoniae ST17
SAMN03280412 K. pneumoniae ST23

407
SAMN03280413 K. pneumoniae ST23
SAMN02138593 K. pneumoniae ST133
SAMN02581256 K. pneumoniae ST592
SAMN02581302 K. pneumoniae ST17
SAMN03280382 K. pneumoniae ST16
SAMN12289282 K. pneumoniae ST12
SAMN10537194 K. pneumoniae ST11
SAMN03733725 K. pneumoniae ST941
SAMN02581304 K. pneumoniae ST1199
SAMN03280255 K. pneumoniae ST15
SAMN03280300 K. pneumoniae ST158
SAMN03280347 K. pneumoniae ST2121
SAMN02581368 K. pneumoniae ST14
SAMN09811763 K. pneumoniae ST726
SAMN02603941 K. pneumoniae ST38
SAMD00171892 K. pneumoniae ST668

408
Genome attributes of the isolates (retrieved from NCBI) used in the phylogenetic
analysis of Figure 5.11.
BioSample Species
SAMN08222607 P. hauseri
SAMN03197609 P. mirabilis
SAMN12217607 P. mirabilis
SAMN04014870 P. mirabilis
SAMN04014900 P. mirabilis
SAMN04014996 P. mirabilis
SAMN03418023 P. mirabilis
SAMN06674010 P. vulgaris
SAMN13082492 P. mirabilis
SAMN12258067 P. mirabilis
SAMN12636071 P. mirabilis
SAMN04395118 P. mirabilis
SAMEA1705945 P. mirabilis
SAMN03140307 P. mirabilis
SAMN10458171 P. mirabilis
SAMN09976767 P. mirabilis
SAMN10614391 P. vulgaris
SAMN05715220 P. mirabilis
SAMN08020255 P. vulgaris

409
Genome attributes of the isolates (retrieved from NCBI) used in the phylogenetic
analysis of Figure 5.12.
BioSample Species ST
SAMN04014891 E. cloacae ST78
SAMN04014977 E. cloacae ST171
SAMN02603901 E. cloacae ST1
SAMEA2273209 E. cloacae ST133
SAMEA2273351 E. cloacae ST544
SAMEA2273372 E. cloacae ST795
SAMEA2273398 E. cloacae ST797
SAMEA2273399 E. cloacae ST346
SAMN10359476 E. cloacae ST813
SAMN02713682 E. cloacae ST93
SAMEA4785257 E. cloacae ST89
SAMN12258091 E. hormaechei ST116
SAMN03996283 E. aerogenes -
SAMN07312407 E. aerogenes -
SAMN11031503 E. cloacae ST261
SAMN10856232 E. hormaechei ST418

410
Genome attributes of the isolates (retrieved from NCBI) used in the phylogenetic
analysis of Figure 5.13.
BioSample Species
SAMN03197842 C. braakii
SAMN07452765 C. farmeri
SAMN11055879 C. freundii
SAMN03455986 C. freundii
SAMN04287052 C. freundii
SAMN03996309 C. amalonaticus
SAMN06173303 C. braakii
SAMN07312408 C. werkmanii
SAMN10163242 C. freundii
SAMN10163243 C. freundii
SAMN11056361 C. koseri
SAMN09428653 C. koseri
SAMN07729552 C. freundii
SAMEA2272524 C. rodentium
SAMN07206908 C. youngae
SAMD00019865 C. sedlakii
SAMN05570461 C. freundii
SAMEA4830818 C. freundii

411
Genome attributes of the isolates (retrieved from NCBI) used in the phylogenetic
analysis of Figure 5.14.
BioSample Species
SAMN10252231 P. stuartii
SAMN04014867 P. stuartii
SAMN05629093 P. stuartii
SAMN14048635 P. stuartii
SAMEA2665135 P. stuartii
SAMN11523820 P. rettgeri
SAMN11982199 P. rettgeri
SAMN06159664 P. stuartii
SAMN07974484 P. stuartii

412
Genome attributes of the isolates (retrieved from NCBI) used in the phylogenetic
analysis of Figure 5.17.
BioSample Species ST
SAMN06218054 E. coli ST167
SAMN06284178 E. coli ST167
SAMN04361562 E. coli Unknown ST
SAMN04157977 E. coli ST167
SAMN04157978 E. coli ST167
SAMN04157979 E. coli ST167
SAMN04157980 E. coli ST167
SAMN07344983 E. coli ST167
SAMN04157981 E. coli ST167
SAMN07344982 E. coli ST167
SAMN09985619 E. coli ST167
SAMD00059754 E. coli ST167
SAMN08281024 E. coli ST167
SAMN03220397 E. coli ST167
SAMN06909181 E. coli ST167

413
Genome attributes of the isolates (retrieved from NCBI) used in the phylogenetic
analysis of Figure 5.18.
BioSample Species ST
SAMN05977366 E. coli ST448
SAMN06311279 E. coli ST448
SAMN06311280 E. coli ST448
SAMN08637775 E. coli Unknown ST
SAMN10531472 E. coli ST448
SAMEA4672938 E. coli ST2083
SAMEA4916063 E. coli ST448
SAMEA4916089 E. coli ST448
SAMN06973353 E. coli ST448
SAMN04992597 E. coli ST448
SAMN10105866 E. coli ST448
SAMN12822948 E. coli ST205
SAMN10531954 E. coli ST448
SAMN06909173 E. coli ST448
SAMN10620088 E. coli ST448

414
Genome attributes of the isolates (retrieved from NCBI) used in the phylogenetic
analysis of Figure 5.19.
BioSample Species ST
SAMN08637787 E. coli ST8346
SAMEA4916096 E. coli ST8346
SAMEA4916090 E. coli ST8346

415
Genome attributes of the isolates (retrieved from NCBI) used in the phylogenetic
analysis of Figure 5.20.
BioSample Species ST
SAMN13829989 E. coli ST405
SAMN06311269 E. coli ST405
SAMN06311274 E. coli ST405
SAMN06311283 E. coli ST405
SAMN08637779 E. coli ST405
SAMN08637780 E. coli ST405
SAMN08637778 E. coli ST405
SAMN02801869 E. coli ST405
SAMN02801870 E. coli ST405
SAMN08637781 E. coli ST405
SAMN10249152 E. coli ST405
SAMN10248954 E. coli ST405
SAMN04046665 E. coli ST405
SAMD00076990 E. coli ST405
SAMN06973348 E. coli ST405
SAMN07312492 E. coli ST405
SAMEA4643524 E. coli ST405
SAMN11232786 E. coli ST405
SAMN05604797 E. coli ST405
SAMN03145051 E. coli ST405
SAMN05786429 E. coli ST405
SAMN07760941 E. coli ST405
SAMN11233046 E. coli ST405
SAMN11233061 E. coli ST405
SAMN11233063 E. coli ST405
SAMN11233068 E. coli ST405
SAMN11233092 E. coli ST405
SAMN11233094 E. coli ST405
SAMN06924979 E. coli ST405

416
Genome attributes of the isolates (retrieved from NCBI) used in the phylogenetic
analysis of Figure 5.21.
BioSample Species ST
SAMN06311264 E. coli ST648
SAMN06806389 E. coli ST648
SAMN02709589 E. coli ST648
SAMN08103372 E. coli ST648
SAMN08103377 E. coli ST648
SAMN08519241 E. coli ST648
SAMN08519242 E. coli ST648
SAMN08519249 E. coli ST648
SAMN03922986 E. coli ST648
SAMD00052661 E. coli ST648
SAMN05440277 E. coli ST648
SAMN05440276 E. coli ST648
SAMN11232909 E. coli ST648
SAMN05511150 E. coli ST648
SAMN11233027 E. coli ST648

417
Genome attributes of the isolates (retrieved from NCBI) used in the phylogenetic
analysis of Figure 5.27.
BioSample Species ST
SAMEA4364586 K. pneumoniae ST15
SAMEA4364670 K. pneumoniae ST15
SAMN02138664 K. pneumoniae ST15
SAMN10963497 K. pneumoniae ST15
SAMEA3721057 K. pneumoniae ST15
SAMEA3512047 K. pneumoniae ST15
SAMEA3649536 K. pneumoniae ST15
SAMEA3721053 K. pneumoniae ST15
SAMEA3721059 K. pneumoniae ST15
SAMEA3515136 K. pneumoniae ST15
SAMEA3538544 K. pneumoniae ST15
SAMEA3729663 K. pneumoniae ST15
SAMN10600498 K. pneumoniae ST15
SAMEA2273810 K. pneumoniae ST15
SAMN03281077 K. pneumoniae ST15

418
Genome attributes of the isolates (retrieved from NCBI) used in the phylogenetic
analysis of Figure 5.28.
BioSample Species ST
SAMEA4364585 K. pneumoniae ST16
SAMEA4394736 K. pneumoniae ST16
SAMEA23996668 K. pneumoniae ST16
SAMEA23998168 K. pneumoniae ST16
SAMN07173931 K. pneumoniae ST16
SAMN07173932 K. pneumoniae ST16
SAMEA104569902 K. pneumoniae ST16
SAMEA3499992 K. pneumoniae ST16
SAMN10592664 K. pneumoniae ST16
SAMEA2273664 K. pneumoniae ST16
SAMEA2273689 K. pneumoniae ST16
SAMEA2273709 K. pneumoniae ST16
SAMEA2273723 K. pneumoniae ST16
SAMEA2273726 K. pneumoniae ST16
SAMN07450698 K. pneumoniae ST16
SAMEA3345126 K. pneumoniae ST16
SAMEA3531804 K. pneumoniae ST16
SAMEA3531868 K. pneumoniae ST16
SAMN04008891 K. pneumoniae ST16

419
Genome attributes of the isolates (retrieved from NCBI) used in the phylogenetic
analysis of Figure 9.5, 9.6, and 9.8.
Codes for global
strains
BioSample ST type
BC1 SAMN03449377 ST1590
BC2 SAMN03449230 ST1592
BC3 SAMN03449286 ST1584
BC4 SAMN03449156 ST1597
BC5 SAMN03449157 ST1597
BC6 SAMN03449379 ST1619
BC7 SAMN03449246 ST1583
BC8 SAMN03449420 ST1587
BC9 SAMN03449517 ST1586
BC10 SAMN03449534 ST1604
BC11 SAMN03449675 ST1603
BC12 SAMN03449532 ST1605
BC13 SAMN03449474 ST1582
BC14 SAMN03449608 ST1585
BC15 SAMN03449614 ST1599
BC16 SAMN03449400 ST1594
BC17 SAMN03449633 ST1596
BC18 SAMN03449130 ST1589
BC19 SAMN03449179 ST1600
BC20 SAMN03449505 ST795
BC21 SAMN03449378 ST795
BC22 SAMN03449298 ST795
BC23 SAMN03449466 ST1602
BC24 SAMN03449469 ST1602
BC25 SAMN03449473 ST1602
BC26 SAMN03449467 ST1602
BC27 SAMN03449468 ST1602
BC28 SAMN03449480 ST1602
BC29 SAMN03449470 ST1602
BC30 SAMN03449472 ST1602
BC31 SAMN03449471 ST1602
BC32 SAMN03449479 ST1602
BC33 SAMN03449460 ST1588
BC34 SAMN03449557 ST1580
BC35 SAMN03449128 ST1607
BC36 SAMN03449159 ST1606
BC37 SAMN03449182 ST1606
BC38 SAMN03449174 ST1613
BC39 SAMN03449169 ST1613

420
BC40 SAMN03449172 ST1613
BC41 SAMN03449173 ST1613
BC42 SAMN03449175 ST1613
BC43 SAMN03449176 ST1613
BC44 SAMN03449161 ST1613
BC45 SAMN03449160 ST1613
BC46 SAMN03449165 ST1613
BC47 SAMN03449162 ST1613
BC48 SAMN03449166 ST1613
BC49 SAMN03449170 ST1613
BC50 SAMN03449163 ST1613
BC51 SAMN03449180 ST1613
BC52 SAMN03449164 ST1613
BC53 SAMN03449177 ST1613
BC54 SAMN03449167 ST1613
BC55 SAMN03449171 ST1613
BC56 SAMN03449168 ST1613
BC57 SAMN03449178 ST1613
BC58 SAMN03449418 ST1601
BC59 SAMN03449419 ST1601
BC60 SAMN03449607 ST1581
BC61 SAMN03449415 ST1591
BC62 SAMN03449288 ST1593
BC63 SAMN03449447 ST1615
BC64 SAMN03449282 ST1614
BC65 SAMN03449304 ST1598
BC66 SAMN03449294 ST1620
BC67 SAMN03449290 ST1616
BC68 SAMN02892978 ST1618
BC69 SAMN03751789 ST1617
BC70 SAMN03486590 ST472
BC71 SAMN02680268 ST1331
BC72 SAMN02597170 ST44
BC73 SAMN02796019 ST810
BC74 SAMN03144973 ST28
BC75 SAMN02797514 ST807
BC76 SAMN02796046 ST807
BC77 SAMD00018762 ST10
BC78 SAMN06173358 ST10
BC79 SAMN02440719 ST10
BC80 SAMN07312432 ST10
BC81 SAMN03449485 ST1609
BC82 SAMN03449496 ST1609
BC83 SAMN03449237 ST962

421
BC84 SAMN03449558 ST1608
BC85 SAMN03449618 ST1612
BC86 SAMN03449578 ST1595
BC87 SAMN03449556 ST1611
BC88 SAMN03449494 ST698
BC89 SAMN03449570 ST698
BC90 SAMN03449571 ST698
BC91 SAMN03449452 ST1610

422
Section Twelve
Bibliography

423
Abd El Ghany M, Sharaf H, Al-Agamy MH, et al. (2018). Genomic characterization
of NDM-1 and 5, and OXA-181 carbapenemases in uropathogenic Escherichia coli
isolates from Riyadh, Saudi Arabia. PLoS One. 13(8):e0201613.
Adler A, Solter E, Masarwa S, et al. (2013). Epidemiological and microbiological
characteristics of an outbreak caused by OXA-48-producing Enterobacteriaceae in a
neonatal intensive care unit in Jerusalem, Israel. J Clin Microbiol. 51(9):2926-2930.
Aeksiri N, Toanan W, Sawikan S, et al. (2019). First Detection and Genomic Insight
into mcr-1 Encoding Plasmid-Mediated Colistin-Resistance Gene in Escherichia coli
ST101 Isolated from the Migratory Bird Species Hirundo rustica in Thailand. Microb
Drug Resist. 25(10):1437-1442.
Agarwal A. (2008). Social classification: the need to update in the present scenario.
Indian J Community Med. 33(1):50-51.
Agnoli K, Schwager S, Uehlinger S, et al. (2012). Exposing the third chromosome of
Burkholderia cepacia complex strains as a virulence plasmid. Mol Microbiol.
83(2):362-378.
Ahmad N, Ali SM, Khan AU. (2018). Detection of New Delhi Metallo-β-Lactamase
Variants NDM-4, NDM-5, and NDM-7 in Enterobacter aerogenes Isolated from a
Neonatal Intensive Care Unit of a North India Hospital: A First Report. Microb Drug
Resist. 24(2):161-165.
Ahmed I, Rabbi MB, Sultana S (2019). Antibiotic resistance in Bangladesh: A
systematic review. Int J Infect Dis.80:54-61.
Ahn K, Hwang GY, Kim YK, et al. (2019). Nosocomial Outbreak Caused by NDM-5
and OXA-181 Carbapenemase Co-producing Escherichia coli. Infect Chemother.
51(2):177-182.
Aires-de-Sousa M, Ortiz de la Rosa JM, Gonçalves ML, et al. (2019). Epidemiology
of Carbapenemase-Producing Klebsiella pneumoniae in a Hospital, Portugal. Emerg
Infect Dis. 25(9):1632-1638.

424
Akter S, Sabuj AAM, Haque ZF, et al. (2020). Detection of antibiotic-resistant bacteria
and their resistance genes from houseflies. Vet World. 13(2):266-274.
Al-Baloushi AE, Pál T, Ghazawi A, et al. (2018). Genetic support of carbapenemases
in double carbapenemase producer Klebsiella pneumoniae isolated in the Arabian
Peninsula. Acta Microbiol Immunol Hung. 65(2):135-150.
Alcock BP, Raphenya AR, Lau TTY, et al. (2020). CARD 2020: antibiotic resistome
surveillance with the comprehensive antibiotic resistance database. Nucleic Acids Res.
48(D1):D517-D525.
Almakki A, Maure A, Pantel A, et al. (2017). NDM-5-producing Escherichia coli in
an urban river in Montpellier, France. Int J Antimicrob Agents. 50(1):123-124.
Amin MB, Sraboni AS, Hossain MI, et al. (2020). Occurrence and genetic
characteristics of mcr-1-positive colistin-resistant E. coli from poultry environments
in Bangladesh. J Glob Antimicrob Resist. 22:546-552.
Aminov RI, Mackie RI. (2007). Evolution and ecology of antibiotic resistance genes.
FEMS Microbiol Lett. 271(2):147-161.
Aminov RI. (2010). A brief history of the antibiotic era: lessons learned and challenges
for the future. Front Microbiol. 1:134.
Andrews JM. (2001). Determination of minimum inhibitory concentrations. J
Antimicrob Chemother. 48 Suppl 1:5-16.
Antonelli A, Di Palo DM, Galano A, et al. (2015). Intestinal carriage of Shewanella
xiamenensis simulating carriage of OXA-48-producing Enterobacteriaceae. Diagn
Microbiol Infect Dis. 82(1):1-3.
Antony S, Ravichandran K, Kanungo R. (2018). Multidrug-resistant
Enterobacteriaceae colonising the gut of adult rural population in South India. Indian
J Med Microbiol. 36(4):488-493.
Araújo BF, Ferreira ML, Campos PA, et al. (2018). Hypervirulence and biofilm
production in KPC-2-producing Klebsiella pneumoniae CG258 isolated in Brazil. J
Med Microbiol. 67(4):523-528.

425
Asai N, Sakanashi D, Suematsu H, et al. (2018). The epidemiology and risk factor of
carbapenem-resistant enterobacteriaceae colonization and infections: Case control
study in a single institute in Japan. J Infect Chemother. 24(7):505-509.
Azam M, Ehsan I, Sajjad-Ur-Rahman, et al. (2017). Detection of the colistin resistance
gene mcr-1 in avian pathogenic Escherichia coli in Pakistan. J Glob Antimicrob Resist.
11:152-153.
Babakhani S, Oloomi M. (2018). Transposons: the agents of antibiotic resistance in
bacteria. J Basic Microbiol. 58(11):905-917.
Babraham Bioinformatics. (2019). Trim Galore. Accessed on 01 March 2020.
https://www.bioinformatics.babraham.ac.uk/projects/trim_galore/.
Babu Rajendran N, Gladstone BP, Rodríguez-Baño J, et al. (2017). Epidemiology and
control measures of outbreaks due to Antibiotic-Resistant organisms in Europe
(EMBARGO): a systematic review protocol. BMJ Open. 7(1):e013634.
Baek JY, Cho SY, Kim SH, et al. (2019). Plasmid analysis of Escherichia coli isolates
from South Korea co-producing NDM-5 and OXA-181 carbapenemases. Plasmid.
104:102417.
Baele G, Lemey P, Bedford T, et al. (2012). Improving the accuracy of demographic
and molecular clock model comparison while accommodating phylogenetic
uncertainty. Mol Biol Evol. 29(9):2157-2167.
Baele G, Li WL, Drummond AJ, et al. (2013). Accurate model selection of relaxed
molecular clocks in bayesian phylogenetics. Mol Biol Evol. 30(2):239-243.
Bahramian A, Shariati A, Azimi T, et al. (2019). First report of New Delhi metallo-β-
lactamase-6 (NDM-6) among Klebsiella pneumoniae ST147 strains isolated from
dialysis patients in Iran. Infect Genet Evol. 69:142-145.
Balm MN, La MV, Krishnan P, et al. (2013a). Emergence of Klebsiella pneumoniae
co-producing NDM-type and OXA-181 carbapenemases. Clin Microbiol Infect.
19(9):E421-E423.

426
Balm MN, Ngan G, Jureen R, et al. (2013b). OXA-181-producing Klebsiella
pneumoniae establishing in Singapore. BMC Infect Dis. 13:58.
Bandyopadhyay T, Kumar A, Saili A, et al. (2018). Distribution, antimicrobial
resistance and predictors of mortality in neonatal sepsis. J Neonatal Perinatal Med.
11(2):145-153.
Bangladesh Population (LIVE). (2020). Accessed on 01 December 2020.
https://www.worldometers.info/world-population/bangladesh-population/.
Bankevich A, Nurk S, Antipov D, et al. (2012). SPAdes: a new genome assembly
algorithm and its applications to single-cell sequencing. J Comput Biol. 19(5):455-
477.
Baraniak A, Izdebski R, Fiett J, et al. (2013). Comparative population analysis of
Klebsiella pneumoniae strains with extended-spectrum β-lactamases colonizing
patients in rehabilitation centers in four countries. Antimicrob Agents Chemother.
57(4):1992-1997.
Barchitta M, Quattrocchi A, Maugeri A, et al. (2019). Antibiotic Consumption and
Resistance during a 3-Year Period in Sicily, Southern Italy. Int J Environ Res Public
Health. 16(13):2253.
Barrios-Camacho H, Aguilar-Vera A, Beltran-Rojel M, et al. (2019). Molecular
epidemiology of Klebsiella variicola obtained from different sources. Sci Rep.
9(1):10610.
Baul SN, De R, Mandal PK, et al. (2018). Outbreak of Burkholderia cepacia Infection:
a Systematic Study in a Hematolooncology Unit of a Tertiary Care Hospital from
Eastern India. Mediterr J Hematol Infect Dis. 10(1):e2018051.
bdnews24.com (25 April 2019). HC orders govt to ban antibiotics sale without
prescription. Accessed on 03 March 2020.
https://bdnews24.com/bangladesh/2019/04/25/-hc-orders-govt-to-ban-antibiotics-
sale-without-prescription.

427
Bebrone C. (2007). Metallo-beta-lactamases (classification, activity, genetic
organization, structure, zinc coordination) and their superfamily. Biochem Pharmacol.
74(12):1686-1701.
Becker SL, Berger FK, Feldner SK, et al. (2018). Outbreak of Burkholderia cepacia
complex infections associated with contaminated octenidine mouthwash solution,
Germany, August to September 2018. Euro Surveill. 23(42):1800540.
Benulič K, Pirš M, Couto N, et al. (2020). Whole genome sequencing characterization
of Slovenian carbapenem-resistant Klebsiella pneumoniae, including OXA-48 and
NDM-1 producing outbreak isolates. PLoS One. 15(4):e0231503.
Berbers B, Saltykova A, Garcia-Graells C, et al. (2020). Combining short and long
read sequencing to characterize antimicrobial resistance genes on plasmids applied to
an unauthorized genetically modified Bacillus. Sci Rep. 10(1):4310.
Bevan ER, Jones AM, Hawkey PM. (2017). Global epidemiology of CTX-M β-
lactamases: temporal and geographical shifts in genotype. J Antimicrob Chemother.
72(8):2145-2155.
Bharadwaj R, Robinson ML, Balasubramanian U, et al. (2018). Drug-resistant
Enterobacteriaceae colonization is associated with healthcare utilization and
antimicrobial use among inpatients in Pune, India. BMC Infect Dis. 18(1):504.
Bhoomadevi A, Baby TM, Keshika C. (2019). Factors influencing discharge against
medical advice (DAMA) cases at a multispecialty hospital. J Family Med Prim Care.
8(12):3861-3864.
Bialvaei AZ, Samadi Kafil H. (2015). Colistin, mechanisms and prevalence of
resistance. Curr Med Res Opin. 31(4):707-721.
Bich VTN, Thanh LV, Thai PD, et al. (2019). An exploration of the gut and
environmental resistome in a community in northern Vietnam in relation to antibiotic
use. Antimicrob Resist Infect Control. 8:194.

428
Birnbaum J, Kahan FM, Kropp H, et al. (1985). Carbapenems, a new class of beta-
lactam antibiotics. Discovery and development of imipenem/cilastatin. Am J Med.
78(6A):3-21.
BLRI. (2019). Accessed on 03 March 2020.
http://blri.portal.gov.bd/sites/default/files/files/blri.portal.gov.bd/page/63ca05e0_aab
4_4e72_b86a_e03e19d4b18d/Research%20Project%20proposal%20List%202018-
19.pdf.
Bochkareva OO, Moroz EV, Davydov II, et al. (2018). Genome rearrangements and
selection in multi-chromosome bacteria Burkholderia spp. BMC Genomics. 19(1):965.
Bonomo RA, Burd EM, Conly J, et al. (2018). Carbapenemase-Producing Organisms:
A Global Scourge. Clin Infect Dis. 66(8):1290-1297.
Both A, Huang J, Kaase M, et al. (2016). First report of Escherichia coli co-producing
NDM-1 and OXA-232. Diagn Microbiol Infect Dis. 86(4):437-438.
Bradford PA. (2001). Extended-spectrum beta-lactamases in the 21st century:
characterization, epidemiology, and detection of this important resistance threat. Clin
Microbiol Rev. 14(4):933-951.
Branger C, Ledda A, Billard-Pomares T, et al. (2019). Specialization of small non-
conjugative plasmids in Escherichia coli according to their family types. Microb
Genom. 5(9):e000281.
Brinkac LM, White R, D'Souza R, et al. (2019). Emergence of New Delhi Metallo-β-
Lactamase (NDM-5) in Klebsiella quasipneumoniae from Neonates in a Nigerian
Hospital. mSphere. 4(2):e00685-18.
Brisse S, Passet V, Grimont PAD. (2014). Description of Klebsiella quasipneumoniae
sp. nov., isolated from human infections, with two subspecies, Klebsiella
quasipneumoniae subsp. quasipneumoniae subsp. nov. and Klebsiella
quasipneumoniae subsp. similipneumoniae subsp. nov., and demonstration that
Klebsiella singaporensis is a junior heterotypic synonym of Klebsiella variicola. Int J
Syst Evol Microbiol. 64(Pt 9):3146-3152.

429
Bristy NI, Das S, Noman Z, et al. (2019). Colistin residue in broiler: detection in
different growth stages. Asian Australas. J Food Saf Secur. 3(1):43-47.
Burkholderia Genome DB, 2020. Accessed on 01 March 2020.
https://burkholderia.com/.
Bush K, Bradford PA. (2016). β-Lactams and β-Lactamase Inhibitors: An Overview.
Cold Spring Harb Perspect Med. 6(8):a025247.
Bush K, Jacoby GA. (2010). Updated functional classification of beta-lactamases.
Antimicrob Agents Chemother. 54(3):969-976.
Bush K. (2018). Past and Present Perspectives on β-Lactamases. Antimicrob Agents
Chemother. 62(10):e01076-18.
Cantón R, González-Alba JM, Galán JC. (2012). CTX-M Enzymes: Origin and
Diffusion. Front Microbiol. 3:110.
Carlet J. (2012). The gut is the epicentre of antibiotic resistance. Antimicrob Resist
Infect Control. 1(1):39.
Carrasco-Anabalón S, Conceição Neto CO, D'Alincourt Carvalho-Assef AP, et al.
(2019). Introduction of NDM-1 and OXA-370 from Brazil into Chile in strains of
Klebsiella pneumoniae isolated from a single patient. Int J Infect Dis. 81:28-30.
Carroll LM, Gaballa A, Guldimann C, et al. (2019). Identification of Novel Mobilized
Colistin Resistance Gene mcr-9 in a Multidrug-Resistant, Colistin-Susceptible
Salmonella enterica Serotype Typhimurium Isolate. mBio. 10(3):e00853-19.
Cassini A, Högberg LD, Plachouras D, et al. (2019). Attributable deaths and disability-
adjusted life-years caused by infections with antibiotic-resistant bacteria in the EU and
the European Economic Area in 2015: a population-level modelling analysis. Lancet
Infect Dis. 19(1):56-66.
Castanheira M, Deshpande LM, Mathai D, et al (2011). Early dissemination of NDM-
1- and OXA-181-producing Enterobacteriaceae in Indian hospitals: report from the
SENTRY Antimicrobial Surveillance Program, 2006-2007. Antimicrob Agents
Chemother. 55(3):1274-1278.

430
Cattaneo C, Di Blasi R, Skert C, et al. (2018). Bloodstream infections in
haematological cancer patients colonized by multidrug-resistant bacteria. Ann
Hematol. 97(9):1717-1726.
CDC. (2019). More People in the United States Dying from Antibiotic-Resistant
Infections than Previously Estimated. Accessed on 09 April 2021.
https://www.cdc.gov/media/releases/2019/p1113-antibiotic-resistant.html.
CDDEP. (2018). Antibiotic Use and Resistance in Bangladesh: Situation Analysis and
Recommendations. Accessed on 01 December 2020.
https://cddep.org/publications/bangladesh-situation-analysis-amr/.
Ceccarelli D, van Essen-Zandbergen A, et al. (2017). Chromosome-Based blaOXA-
48-Like Variants in Shewanella Species Isolates from Food-Producing Animals, Fish,
and the Aquatic Environment. Antimicrob Agents Chemother. 61(2):e01013-16.
Chandra S, Prithvi PPR, Srija K, et al. (2020). Antimicrobial resistance: Call for
rational antibiotics practice in India. J Family Med Prim Care. 9(5):2192-2199.
Chaurasia S, Sivanandan S, Agarwal R, et al. (2019). Neonatal sepsis in South Asia:
huge burden and spiralling antimicrobial resistance. BMJ. 364:k5314.
Chavda B, Lv J, Hou M, et al. (2018). Coidentification of mcr-4.3 and blaNDM-1 in a
Clinical Enterobacter cloacae Isolate from China. Antimicrob Agents Chemother.
62(10):e00649-18.
Chavda KD, Westblade LF, Satlin MJ, et al. (2019). First Report of blaVIM-4- and
mcr-9-Coharboring Enterobacter Species Isolated from a Pediatric Patient. mSphere.
4(5):e00629-19.
Chen SL, Ding Y, Apisarnthanarak A, et al. (2019). The higher prevalence of extended
spectrum beta-lactamases among Escherichia coli ST131 in Southeast Asia is driven
by expansion of a single, locally prevalent subclone. Sci Rep. 9(1):13245.
Cheng VCC, Chen H, Wong SC, et al. (2018). Role of Hand Hygiene Ambassador and
Implementation of Directly Observed Hand Hygiene Among Residents in Residential

431
Care Homes for the Elderly in Hong Kong. Infect Control Hosp Epidemiol. 39(5):571-
577.
Chereau F, Opatowski L, Tourdjman M, et al. (2017). Risk assessment for antibiotic
resistance in South East Asia. BMJ. 358:j3393.
Chiotos K, Tamma PD, Flett KB, et al. (2017). Multicenter Study of the Risk Factors
for Colonization or Infection with Carbapenem-Resistant Enterobacteriaceae in
Children. Antimicrob Agents Chemother. 61(12):e01440-17.
Cho SY, Huh HJ, Baek JY, et al. (2015). Klebsiella pneumoniae co-producing NDM-
5 and OXA-181 carbapenemases, South Korea. Emerg Infect Dis. 21(6):1088-1089.
Choudhury NA, Paul D, Chakravarty A, et al. (2018). IncX3 plasmid mediated
occurrence of blaNDM-4 within Escherichia coli ST448 from India. J Infect Public
Health. 11(1):111-114.
Chowdhury R, Haque M, Islam K, et al. (2009). A Review on Antibiotics In An
Animal Feed. BJAS. 38(1-2): 22-32.
Cimmino T, Le Page S, Raoult D, et al. (2016). Contemporary challenges and
opportunities in the diagnosis and outbreak detection of multidrug-resistant infectious
disease. Expert Rev Mol Diagn. 16(11):1163-1175.
CLSI. (2020). M100. Performance Standards for Antimicrobial Susceptibility Testing,
30th Edition. Accessed on March 2, 2020.
https://clsi.org/standards/products/microbiology/documents/m100/.
Coban YK. (2012). Infection control in severely burned patients. World J Crit Care
Med. 1:94-101.
Codjoe FS, Donkor ES. (2017). Carbapenem Resistance: A Review. Med Sci (Basel).
6(1):1.
Cole SD, Peak L, Tyson GH, et al. (2020). New Delhi Metallo-β-Lactamase-5-
Producing Escherichia coli in Companion Animals, United States. Emerg Infect Dis.
26(2):381-383.

432
Conlan S, Lau AF, Deming C, et al. (2019). Plasmid Dissemination and Selection of
a Multidrug-Resistant Klebsiella pneumoniae Strain during Transplant-Associated
Antibiotic Therapy. mBio. 10(5):e00652-19.
Coutinho RL, Visconde MF, Descio FJ, et al. (2014). Community-acquired invasive
liver abscess syndrome caused by a K1 serotype Klebsiella pneumoniae isolate in
Brazil: a case report of hypervirulent ST23. Mem Inst Oswaldo Cruz. 109(7):970-971.
Crofts TS, Gasparrini AJ, Dantas G. (2017). Next-generation approaches to understand
and combat the antibiotic resistome. Nat Rev Microbiol. 15(7):422-434.
Croucher NJ, Page AJ, Connor TR, et al. (2015). Rapid phylogenetic analysis of large
samples of recombinant bacterial whole genome sequences using Gubbins. Nucleic
Acids Res. 43(3):e15.
Cuzon G, Bonnin RA, Nordmann P. (2013). First identification of novel NDM
carbapenemase, NDM-7, in Escherichia coli in France. PLoS One. (4):e61322.
Cuzon G, Ouanich J, Gondret R, et al. (2011). Outbreak of OXA-48-positive
carbapenem-resistant Klebsiella pneumoniae isolates in France. Antimicrob Agents
Chemother. 55(5):2420-2423.
Dadashi M, Yaslianifard S, Hajikhani B, et al. (2019). Frequency distribution,
genotypes and prevalent sequence types of New Delhi metallo-β-lactamase-producing
Escherichia coli among clinical isolates around the world: A review. J Glob
Antimicrob Resist. 19:284-293.
Dadgostar P. (2019). Antimicrobial Resistance: Implications and Costs. Infect Drug
Resist. 12:3903-3910.
Datta P, Gupta V, Singla N, et al. (2015). Asymptomatic colonization with carbapenem
resistant enterobacteriaceae (CRE) in ICU patients and its associated risk factors:
Study from North India. Indian J Med Microbiol. 33(4):612-613.
Davies J, Davies D. (2010). Origins and evolution of antibiotic resistance. Microbiol
Mol Biol Rev. 74(3):417-433.

433
Davies M, Walsh TR. (2018). A colistin crisis in India. Lancet Infect Dis. 18(3):256-
257.
Davin-Regli A, Lavigne JP, Pagès JM. (2019). Enterobacter spp.: Update on
Taxonomy, Clinical Aspects, and Emerging Antimicrobial Resistance. Clin Microbiol
Rev. 32(4):e00002-19.
De Maio N, Wu CH, Wilson DJ. (2016) SCOTTI: Efficient Reconstruction of
Transmission within Outbreaks with the Structured Coalescent. PLoS Comput Biol.
12(9):e1005130.
Dentini P, Marson FAL, Bonadia LC, et al. (2017). Burkholderia cepacia complex in
cystic fibrosis in a Brazilian reference center. Med Microbiol Immunol. 206(6):447-
461.
Department of Livestock Service. (n.d.) One Health in Action DLS initiatives on
AMR/AMU. Accessed on 03 March 2020. https://rr-asia.oie.int/wp-
content/uploads/2020/03/country-report-bangladesh.pdf.
DhakaTribune. (2019). One-fifth of babies born premature in Bangladesh. Accessed
on 01 March 2020. https://www.dhakatribune.com/bangladesh/2019/11/16/one-fifth-
of-babies-born-premature-in-bangladesh.
Di DY, Jang J, Unno T, et al. (2017). Emergence of Klebsiella variicola positive for
NDM-9, a variant of New Delhi metallo-β-lactamase, in an urban river in South Korea.
J Antimicrob Chemother. 72(4):1063-1067.
Didelot X, Falush D. (2007). Inference of bacterial microevolution using multilocus
sequence data. Genetics. 175(3):1251-1266.
Docquier JD, Calderone V, De Luca F, et al. (2009). Crystal structure of the OXA-48
beta-lactamase reveals mechanistic diversity among class D carbapenemases. Chem
Biol. 16(5):540-547.
Dolp R, Rehou S, McCann MR, et al. (2018). Contributors to the length-of-stay
trajectory in burn-injured patients. Burns. 44(8):2011-2017.

434
Donlan RM, Costerton JW. (2002). Biofilms: survival mechanisms of clinically
relevant microorganisms. Clin Microbiol Rev. 15(2):167-193.
Dortet L, Poirel L, Nordmann P. (2014). Worldwide dissemination of the NDM-type
carbapenemases in Gram-negative bacteria. Biomed Res Int. 2014:249856.
Dos Santos LDR, Furlan JPR, Ramos MS, et al. (2020). Co-occurrence of mcr-1, mcr-
3, mcr-7 and clinically relevant antimicrobial resistance genes in environmental and
fecal samples. Arch Microbiol. 202(7):1795-1800.
Dramowski A, Aucamp M, Bekker A, et al. (2017). Infectious disease exposures and
outbreaks at a South African neonatal unit with review of neonatal outbreak
epidemiology in Africa. Int J Infect Dis. 57:79-85.
Drummond AJ, Rambaut A. (2007). BEAST: Bayesian evolutionary analysis by
sampling trees. BMC Evol Biol. 7:214.
Duchêne S, Holt KE, Weill FX, et al. (2016). Genome-scale rates of evolutionary
change in bacteria. Microb Genom. 2(11):e000094.
Duplessis C, Crum-Cianflone NF. (2011). Ceftaroline: A New Cephalosporin with
Activity against Methicillin-Resistant Staphylococcus aureus (MRSA). Clin Med Rev
Ther. 3:a2466.
Durante-Mangoni E, Andini R, Zampino R. (2019). Management of carbapenem-
resistant Enterobacteriaceae infections. Clin Microbiol Infect. 25(8):943-950.
ECDC. (2020). Increase in OXA-244-producing Escherichia coli in the European
Union/European Economic Area and the UK since 2013. Accessed on 01 December
2020. https://www.ecdc.europa.eu/sites/default/files/documents/RRA-E-coli-OXA-
244-producing-E-coli-EU-EEA-UK-since-2013.pdf.
El-Kholy AA, Girgis SA, Shetta MAF, et al. (2020). Molecular characterization of
multidrug-resistant Gram-negative pathogens in three tertiary hospitals in Cairo,
Egypt. Eur J Clin Microbiol Infect Dis. 39(5):987-992.

435
Espinal P, Fugazza G, López Y, et al. (2011). Dissemination of an NDM-2-producing
Acinetobacter baumannii clone in an Israeli rehabilitation center. Antimicrob Agents
Chemother. 55(11):5396-5398.
Espinal P, Poirel L, Carmeli Y, et al. (2013). Spread of NDM-2-producing
Acinetobacter baumannii in the Middle East. J Antimicrob Chemother. 68(8):1928-
1930.
Essential Drugs Company Limited. (2020). Accessed on 01 December 2020.
https://www.edcl.gov.bd/.
EUCAST. (2020). Breakpoint tables for interpretation of MICs and zone diameters.
Version 10.0, valid from 2020-01-01. Accessed on March 2, 2020.
https://www.eucast.org/fileadmin/src/media/PDFs/EUCAST_files/Breakpoint_tables
/v_10.0_Breakpoint_Tables.pdf.
European Commission. (2020). EU Action on Antimicrobial Resistance. Accessed on
01 March 2020. https://ec.europa.eu/health/antimicrobial-resistance/eu-action-on-
antimicrobial-resistance_en.
Evans BA, Amyes SG. (2014). OXA β-lactamases. Clin Microbiol Rev. 27(2):241-
263.
Ewers C, Stamm I, et al. (2014). Clonal spread of highly successful ST15-CTX-M-15
Klebsiella pneumoniae in companion animals and horses. J Antimicrob Chemother.
69(10):2676-2680.
Exner M, Bhattacharya S, Christiansen B, et al. (2017). Antibiotic resistance: What is
so special about multidrug-resistant Gram-negative bacteria? GMS Hyg Infect Control.
12:Doc05.
Fahim SM, Bhuayan TA, Hassan MZ, et al. (2019). Financing health care in
Bangladesh: Policy responses and challenges towards achieving universal health
coverage. Int J Health Plann Manage. 34(1):e11-e20.

436
Falagas ME, Kasiakou SK. (2005). Colistin: the revival of polymyxins for the
management of multidrug-resistant gram-negative bacterial infections. Clin Infect Dis.
40(9):1333-1341.
Falagas ME, Vouloumanou EK, Samonis G, et al. (2016). Fosfomycin. Clin Microbiol
Rev. 29(2):321-347.
Farzana R, Jones LS, Barratt A, et al. (2020a). Emergence of Mobile Colistin
Resistance (mcr-8) in a Highly Successful Klebsiella pneumoniae Sequence Type 15
Clone from Clinical Infections in Bangladesh. mSphere. 5(2):e00023-20.
Farzana R, Jones LS, Rahman MA, et al. (2019a). Outbreak of Hypervirulent
Multidrug-resistant Klebsiella variicola Causing High Mortality in Neonates in
Bangladesh. Clin Infect Dis. 68(7):1225-1227.
Farzana R, Jones LS, Rahman MA, et al. (2019b). Emergence of mcr-1 mediated
colistin resistant Escherichia coli from a hospitalized patient in Bangladesh. J Infect
Dev Ctries. 13(8):773-776.
Farzana R, Jones LS, Rahman MA, et al. (2020a). Molecular and epidemiological
analysis of a Burkholderia cepacia sepsis outbreak from a tertiary care hospital in
Bangladesh. PLoS Negl Trop Dis. 14(4):e0008200.
Farzana R, Shamsuzzaman S, Mamun KZ. (2013). Isolation and molecular
characterization of New Delhi metallo-beta-lactamase-1 producing superbug in
Bangladesh. J Infect Dev Ctries. 7(3):161-168.
Fattouh R, Tijet N, McGeer A, et al. (2015). What Is the Appropriate Meropenem MIC
for Screening of Carbapenemase-Producing Enterobacteriaceae in Low-Prevalence
Settings? Antimicrob Agents Chemother. 60(3):1556-1559.
Ferdous J, Sachi S, Noman ZA, et al. (2019). Assessing farmers' perspective on
antibiotic usage and management practices in small-scale layer farms of Mymensingh
district, Bangladesh. Vet World. 12(9):1441-1447.
Fernando SA, Gray TJ, Gottlieb T. (2017). Healthcare-acquired infections: prevention
strategies. Intern Med J. 47(12):1341-1351.

437
Filioussis G, Kachrimanidou M, Christodoulopoulos G, et al. (2020). Short
communication: Bovine mastitis caused by a multidrug-resistant, mcr-1-positive
(colistin-resistant), extended-spectrum β-lactamase-producing Escherichia coli clone
on a Greek dairy farm. J Dairy Sci. 103(1):852-857.
Flerlage T, Brazelton de Cardenas JN, Garner CD, et al. (2020). Multiple NDM-5-
Expressing Escherichia coli Isolates From an Immunocompromised Pediatric Host.
Open Forum Infect Dis. 7(2):ofaa018.
Fukuda A, Usui M, Okubo T, et al. (2018). Co-harboring of cephalosporin
(bla)/colistin (mcr) resistance genes among Enterobacteriaceae from flies in Thailand.
FEMS Microbiol Lett. 365(16):fny178.
Furlan JPR, Dos Santos LDR, Ramos MS, et al. 2020 (). Occurrence of clinically
relevant antimicrobial resistance genes, including mcr-3 and mcr-7.1, in soil and water
from a recreation club. Int J Environ Health Res. 1-10.
Gallaher JR, Banda W, Lachiewicz AM, et al. (2018). Colonization with Multidrug-
Resistant Enterobacteriaceae is Associated with Increased Mortality Following Burn
Injury in Sub-Saharan Africa. World J Surg. 42(10):3089-3096.
Gamal D, Fernández-Martínez M, El-Defrawy I, et al. (2016). First identification of
NDM-5 associated with OXA-181 in Escherichia coli from Egypt. Emerg Microbes
Infect. 5(4):e30.
Garcillán-Barcia MP, de la Cruz F. (2002). Distribution of IS91 family insertion
sequences in bacterial genomes: evolutionary implications. FEMS Microbiol Ecol.
42(2):303-313.
Garg A, Garg J, Kumar S, et al. (2019). Molecular epidemiology & therapeutic options
of carbapenem-resistant Gram-negative bacteria. Indian J Med Res. 149(2):285-289.
Gelbíčová T, Baráková A, Florianová M, et al. (2019). Dissemination and Comparison
of Genetic Determinants of mcr-Mediated Colistin Resistance in Enterobacteriaceae
via Retailed Raw Meat Products. Front Microbiol. 10:2824.

438
General Assembly of the World Medical Association. (2014). World Medical
Association Declaration of Helsinki: ethical principles for medical research involving
human subjects. J Am Coll Dent. 81(3):14-18.
Ghazawi A, Sonnevend A, Bonnin RA, et al. (2012). NDM-2 carbapenemase-
producing Acinetobacter baumannii in the United Arab Emirates. Clin Microbiol
Infect. 18(2):E34-E36.
Ghosh A, Ghosh T. (2009). Modification of Kuppuswamys socioeconomic status scale
in context to Nepal. Indian Pediatr. 46(12):1104-1105.
Gibson B, Wilson DJ, Feil E, et al. (2018). The distribution of bacterial doubling times
in the wild. Proc Biol Sci. 285(1880):20180789.
Gijón D, Tedim AP, Valverde A, et al. (2020). Early OXA-48-Producing
Enterobacterales Isolates Recovered in a Spanish Hospital Reveal a Complex
Introduction Dominated by Sequence Type 11 (ST11) and ST405
Klebsiella pneumoniae Clones. mSphere. 5(2):e00080-20.
Giraud E, Rychlik I, Cloeckaert A. (2017). Editorial: Antimicrobial Resistance and
Virulence Common Mechanisms. Front Microbiol. 8:310.
GitHub. (2018). pairsnp. Accessed on 03 March 2020.
https://github.com/gtonkinhill/pairsnp.
Glupczynski Y, Huang TD, Bouchahrouf W, et al. (2012). Rapid emergence and
spread of OXA-48-producing carbapenem-resistant Enterobacteriaceae isolates in
Belgian hospitals. Int J Antimicrob Agents. 39(2):168-172.
Gogry FA, Siddiqui MT, Haq QMR. (2019). Emergence of mcr-1 conferred colistin
resistance among bacterial isolates from urban sewage water in India. Environ Sci
Pollut Res Int. 26(32):33715-33717.
Gomez S, Pasteran F, Faccone D, et al. (2013). Intrapatient emergence of OXA-247:
a novel carbapenemase found in a patient previously infected with OXA-163-
producing Klebsiella pneumoniae. Clin Microbiol Infect. 19(5):E233-E235.

439
Gondal AJ, Saleem S, Jahan S, et al. (2020). Novel Carbapenem-Resistant Klebsiella
pneumoniae ST147 Coharboring blaNDM-1, blaOXA-48 and Extended-Spectrum β-
Lactamases from Pakistan. Infect Drug Resist. 13:2105-2115.
Göttig S, Hamprecht AG, Christ S, et al. (2013). Detection of NDM-7 in Germany, a
new variant of the New Delhi metallo-β-lactamase with increased carbapenemase
activity. J Antimicrob Chemother. 68(8):1737-1740.
Gould K. (2016). Antibiotics: from prehistory to the present day. J Antimicrob
Chemother. 71(3):572-575.
GOV.UK. (2015). Bangladesh National Hygiene Baseline Survey. Accessed on 03
October 2020. https://www.gov.uk/research-for-development-outputs/bangladesh-
national-hygiene-baseline-survey.
Grönthal T, Österblad M, Eklund M, et al. (2018). Sharing more than friendship -
transmission of NDM-5 ST167 and CTX-M-9 ST69 Escherichia coli between dogs
and humans in a family, Finland, 2015. Euro Surveill. 23(27):1700497.
Grossman TH. (2016). Tetracycline Antibiotics and Resistance. Cold Spring Harb
Perspect Med. 6(4):a025387.
Guducuoglu H, Gursoy NC, Yakupogullari Y, et al. (2018). Hospital Outbreak of a
Colistin-Resistant, NDM-1- and OXA-48-Producing Klebsiella pneumoniae: High
Mortality from Pandrug Resistance. Microb Drug Resist. 24(7):966-972.
Guo L, An J, Ma Y, et al. (2016). Nosocomial Outbreak of OXA-48-Producing
Klebsiella pneumoniae in a Chinese Hospital: Clonal Transmission of ST147 and
ST383. PLoS One. 11(8):e0160754.
Gupta M, Didwal G, Bansal S, et al. (2019). Antibiotic-resistant Enterobacteriaceae in
healthy gut flora: A report from north Indian semiurban community. Indian J Med Res.
149(2):276-280.
Gupta P, Jain V, Hemrajani M, et al. (2018). Outbreak of Burkholderia cepacia
catheter-related bloodstream infection in cancer patients with long-term central venous
devices at a tertiary cancer centre in India. Indian Anaesth Forum. 19:1-5.

440
Gurevich A, Saveliev V, Vyahhi N, et al. (2013). QUAST: quality assessment tool for
genome assemblies. Bioinformatics. 29(8):1072-1075.
Gurieva T, Dautzenberg MJD, Gniadkowski M, et al. (2018). The Transmissibility of
Antibiotic-Resistant Enterobacteriaceae in Intensive Care Units. Clin Infect Dis.
66(4):489-493.
Gyles C, Boerlin P. (2014). Horizontally transferred genetic elements and their role in
pathogenesis of bacterial disease. Vet Pathol. 51(2):328-340.
Hadfield J, Croucher NJ, Goater RJ, et al. (2018). Phandango: an interactive viewer
for bacterial population genomics. Bioinformatics. 34(2):292-293.
Hadjadj L, Baron SA, Olaitan AO, et al. (2019). Co-occurrence of Variants of mcr-3
and mcr-8 Genes in a Klebsiella pneumoniae Isolate From Laos. Front Microbiol.
10:2720.
Hadjadj L, Riziki T, Zhu Y, et al. (2017). Study of mcr-1 Gene-Mediated Colistin
Resistance in Enterobacteriaceae Isolated from Humans and Animals in Different
Countries. Genes (Basel). 8(12):394.
Haller S, Kramer R, Becker K, et al. (2019). Extensively drug-resistant Klebsiella
pneumoniae ST307 outbreak, north-eastern Germany, June to October 2019. Euro
Surveill. 24(50):1900734.
Hao Y, Shao C, Bai Y, et al. (2018). Genotypic and Phenotypic Characterization of
IncX3 Plasmid Carrying blaNDM-7 in Escherichia coli Sequence Type 167 Isolated
From a Patient With Urinary Tract Infection. Front Microbiol. 9:2468.
Haque A, Yoshizumi A, Saga T, et al. (2014). ESBL-producing Enterobacteriaceae in
environmental water in Dhaka, Bangladesh. J Infect Chemother. 20(11):735-737.
Harada K, Shimizu T, Mukai Y, et al. (2016). Phenotypic and Molecular
Characterization of Antimicrobial Resistance in Klebsiella spp. Isolates from
Companion Animals in Japan: Clonal Dissemination of Multidrug-Resistant
Extended-Spectrum β-Lactamase-Producing Klebsiella pneumoniae. Front Microbiol.
7:1021.

441
Harmer CJ, Hall RM. (2016). IS26-Mediated Formation of Transposons Carrying
Antibiotic Resistance Genes. mSphere. 1(2):e00038-16.
Harris PN. (2015). Clinical management of infections caused by Enterobacteriaceae
that express extended-spectrum β-lactamase and AmpC enzymes. Semin Respir Crit
Care Med. 36(1):56-73.
Hasan B, Sandegren L, Melhus A, et al. (2012). Antimicrobial drug-resistant
Escherichia coli in wild birds and free-range poultry, Bangladesh. Emerg Infect Dis.
18(12):2055-2058.
Hasan B. (2017). Determining risk factors for the spread of XDR bacteria in Pakistan
and examining interventions to prevent their dissemination. Cardiff University, PhD
dissertation.
Hasan MJ, Rabbani R. (2019). The need for adequate research data on carbapenem use
and resistance in Bangladesh. Lancet Infect Dis. 19(8):811.
Hassing RJ, Alsma J, Arcilla MS, et al. (2015). International travel and acquisition of
multidrug-resistant Enterobacteriaceae: a systematic review. Euro Surveill. 20(47).
Hawkey PM. (2015). Multidrug-resistant Gram-negative bacteria: a product of
globalization. J Hosp Infect. 89(4):241-247.
He S, Hickman AB, Varani AM, et al. (2015). Insertion Sequence IS26 Reorganizes
Plasmids in Clinically Isolated Multidrug-Resistant Bacteria by Replicative
Transposition. mBio. 6(3):e00762.
Hernando-Amado S, Sanz-García F, Blanco P, (2017). Fitness costs associated with
the acquisition of antibiotic resistance. Essays Biochem. 61(1):37-48.
Hidalgo F, Mas D, Rubio M, et al. (2016). Infections in critically ill burn patients. Med
Intensiva. 40(3):179-185.
Hoa TTT, Nakayama T, Huyen HM, et al. (2020). Extended-spectrum beta-lactamase-
producing Escherichia coli harbouring sul and mcr-1 genes isolates from fish gut
contents in the Mekong Delta, Vietnam. Lett Appl Microbiol. 71(1):78-85.

442
Hogan BK, Wolf SE, Hospenthal DR, et al. (2012). Correlation of American Burn
Association sepsis criteria with the presence of bacteremia in burned patients admitted
to the intensive care unit. J Burn Care Res. 33(3):371-378.
Holden MT, Seth-Smith HM, Crossman LC, et al. (2009). The genome of
Burkholderia cenocepacia J2315, an epidemic pathogen of cystic fibrosis patients. J
Bacteriol. 191(1):261-277.
Hong JS, Song W, Jeong SH. (2020). Molecular Characteristics of NDM-5-Producing
Escherichia coli from a Cat and a Dog in South Korea. Microb Drug Resist.
26(8):1005-1008.
Hoque R, Ahmed SM, Naher N, et al. (2020). Tackling antimicrobial resistance in
Bangladesh: A scoping review of policy and practice in human, animal and
environment sectors. PLoS One. 15(1):e0227947.
Hornsey M, Phee L, Wareham DW. (2011). A novel variant, NDM-5, of the New Delhi
metallo-β-lactamase in a multidrug-resistant Escherichia coli ST648 isolate recovered
from a patient in the United Kingdom. Antimicrob Agents Chemother. 55(12):5952-
5954.
Hsu LY, Apisarnthanarak A, Khan E, et al. (2017). Carbapenem-Resistant
Acinetobacter baumannii and Enterobacteriaceae in South and Southeast Asia. Clin
Microbiol Rev. 30(1):1-22.
Hu X, Xu X, Wang X, et al. (2017). Diversity of New Delhi metallo-beta-lactamase-
producing bacteria in China. Int J Infect Dis. 55:92-95.
Huang Y, Yu X, Xie M, et al. (2016). Widespread Dissemination of Carbapenem-
Resistant Escherichia coli Sequence Type 167 Strains Harboring blaNDM-5 in
Clinical Settings in China. Antimicrob Agents Chemother. 60(7):4364-4368.
Huddleston JR. (2014). Horizontal gene transfer in the human gastrointestinal tract:
potential spread of antibiotic resistance genes. Infect Drug Resist. 7:167-176.
Hughes D, Andersson DI. (2017). Evolutionary Trajectories to Antibiotic Resistance.
Annu Rev Microbiol. 71:579-596.

443
Humphrey B, Thomson NR, Thomas CM, et al. (2012). Fitness of Escherichia coli
strains carrying expressed and partially silent IncN and IncP1 plasmids. BMC
Microbiol. 12:53.
Hwang AY, Gums JG. (2016). The emergence and evolution of antimicrobial
resistance: Impact on a global scale. Bioorg Med Chem. 24(24):6440-6445.
Hwang J, Kim HS. (2015). Cell Wall Recycling-Linked Coregulation of AmpC and
PenB β-Lactamases through ampD Mutations in Burkholderia cenocepacia.
Antimicrob Agents Chemother. 59:7602-7610.
Iovleva A, Mettus RT, McElheny CL, et al. (2019). High-Level Carbapenem
Resistance in OXA-232-Producing Raoultella ornithinolytica Triggered by Ertapenem
Therapy. Antimicrob Agents Chemother. 64(1):e01335-19.
Iredell J, Brown J, Tagg K. (2016). Antibiotic resistance in Enterobacteriaceae:
mechanisms and clinical implications. BMJ. 352:h6420.
Islam A, Rahman Z, Monira S, et al. (2017). Colistin resistant Escherichia coli
carrying mcr-1 in urban sludge samples: Dhaka, Bangladesh. Gut Pathog. 9:77.
Islam K, Shiraj-Um-Mahmuda S, Hazzaz-Bin-Kabir M. (2016). Antibiotic Usage
Patterns in Selected Broiler Farms of Bangladesh and their Public Health Implications.
JPHDC. 2 (3):276-284.
Islam MA, Huq M, Nabi A, et al. (2013). Occurrence and characterization of
multidrug-resistant New Delhi metallo-β-lactamase-1-producing bacteria isolated
between 2003 and 2010 in Bangladesh. J Med Microbiol. 62(Pt 1):62-68.
Isles A, Maclusky I, Corey M, et al. (1984). Pseudomonas cepacia infection in cystic
fibrosis: an emerging problem. J Pediatr. 104(2):206-210.
Ito R, Mustapha MM, Tomich AD, et al. (2017). Widespread Fosfomycin Resistance
in Gram-Negative Bacteria Attributable to the Chromosomal fosA Gene. mBio.
8(4):e00749-17.

444
Jaggi N, Chatterjee N, Singh V, et al. (2019). Carbapenem resistance in Escherichia
coli and Klebsiella pneumoniae among Indian and international patients in North India.
Acta Microbiol Immunol Hung. 66(3):367-376.
Jakobsson HE, Jernberg C, Andersson AF, et al. (2010). Short-term antibiotic
treatment has differing long-term impacts on the human throat and gut microbiome.
PLoS One. 5(3):e9836.
Jayol A, Poirel L, Dortet L, et al. (2016). National survey of colistin resistance among
carbapenemase-producing Enterobacteriaceae and outbreak caused by colistin-
resistant OXA-48-producing Klebsiella pneumoniae, France, 2014. Euro Surveill.
21(37):30339.
Jeong H, Arif B, Caetano-Anollés G, et al. (2019). Horizontal gene transfer in human-
associated microorganisms inferred by phylogenetic reconstruction and reconciliation.
Sci Rep. 9(1):5953.
Joarder T, Chaudhury TZ, Mannan I. (2019). Universal Health Coverage in
Bangladesh: Activities, Challenges, and Suggestions. Advances in Public Health.
https://doi.org/10.1155/2019/4954095.
Johura FT, Tasnim J, Barman I, et al. (2020). Colistin-resistant Escherichia coli
carrying mcr-1 in food, water, hand rinse, and healthy human gut in Bangladesh. Gut
Pathog. 12:5.
Kaase M, Nordmann P, Wichelhaus TA, et al. (2011). NDM-2 carbapenemase in
Acinetobacter baumannii from Egypt. J Antimicrob Chemother. 66(6):1260-1262.
Kannan R. (2019). Colistin banned in animal food industry. The Hindu. Accessed on
03 March 2020. https://www.thehindu.com/news/national/colistin-banned-in-animal-
food-industry/article28621663.ece.
Kapoor G, Saigal S, Elongavan A. (2017). Action and resistance mechanisms of
antibiotics: A guide for clinicians. J Anaesthesiol Clin Pharmacol. 33(3):300-305.

445
Kasap M, Torol S, Kolayli F, et al. (2013). OXA-162, a novel variant of OXA-48
displays extended hydrolytic activity towards imipenem, meropenem and doripenem.
J Enzyme Inhib Med Chem. 28(5):990-996.
Kaur A, Gandra S, Gupta P, et al. (2017). Clinical outcome of dual colistin- and
carbapenem-resistant Klebsiella pneumoniae bloodstream infections: A single-center
retrospective study of 75 cases in India. Am J Infect Control. 45(11):1289-1291.
Kazmierczak KM, Rabine S, Hackel M, et al. (2015). Multiyear, Multinational Survey
of the Incidence and Global Distribution of Metallo-β-Lactamase-Producing
Enterobacteriaceae and Pseudomonas aeruginosa. Antimicrob Agents Chemother.
60(2):1067-1078.
Kenna DTD, Lilley D, Coward A, et al. (2017). Prevalence of Burkholderia species,
including members of Burkholderia cepacia complex, among UK cystic and non-
cystic fibrosis patients. J Med Microbiol. 66(4):490-501.
Khajuria A, Praharaj AK, Kumar M, et al. (2016). Presence of a novel variant NDM-
10, of the New Delhi metallo-beta-lactamase in a Klebsiella pneumoniae isolate.
Indian J Med Microbiol. 34(1):121-123.
Khalifa HO, Soliman AM, Ahmed AM, et al. (2016). NDM-4- and NDM-5-Producing
Klebsiella pneumoniae Coinfection in a 6-Month-Old Infant. Antimicrob Agents
Chemother. 60(7):4416-4417.
Khan AU, Maryam L, Zarrilli R. (2017). Structure, Genetics and Worldwide Spread
of New Delhi Metallo-β-lactamase (NDM): a threat to public health. BMC Microbiol.
17(1):101.
Khan BA, Cheng L, Khan AA, et al. (2019). Healthcare waste management in Asian
developing countries: A mini review. Waste Manag Res. 37(9):863-875.
Khan MM, Kraemer A. (2008). Socio-economic factors explain differences in public
health-related variables among women in Bangladesh: a cross-sectional study. BMC
Public Health. 8:254.

446
Kieffer N, Royer G, Decousser JW, et al. (2019). mcr-9, an Inducible Gene Encoding
an Acquired Phosphoethanolamine Transferase in Escherichia coli, and Its Origin.
Antimicrob Agents Chemother. 63(9):e00965-19.
Kim JS, Jin YH, Park SH, et al. (2019). Emergence of a multidrug-resistant clinical
isolate of Escherichia coli ST8499 strain producing NDM-13 carbapenemase in the
Republic of Korea. Diagn Microbiol Infect Dis. 94(4):410-412.
Kirchhelle C. (2018). Pharming animals: a global history of antibiotics in food
production (1935–2017). Palgrave Commun. 4(96).
Kłudkowska M, Pielok ŁA, Wrońska M, et al. (2019). Carbapenemase-producing
Enterobacteriaceae in a group of Polish travelers returning from South and South-East
Asia, June 2017 - June 2018. Environment- or healthcare-associated? Ann Agric
Environ Med. 26(3):405-408.
Kneis D, Berendonk TU, Heß S. (2019). High prevalence of colistin resistance genes
in German municipal wastewater. Sci Total Environ. 694:133454.
Ko S, An HS, Bang JH, et al. (2015). An outbreak of Burkholderia cepacia complex
pseudobacteremia associated with intrinsically contaminated commercial 0.5%
chlorhexidine solution. Am J Infect Control. 43(3):266-268.
Kohler PP, Volling C, Green K, et al. (2017). Carbapenem Resistance, Initial
Antibiotic Therapy, and Mortality in Klebsiella pneumoniae Bacteremia: A Systematic
Review and Meta-Analysis. Infect Control Hosp Epidemiol. 38(11):1319-1328.
Kong KF, Schneper L, Mathee K. (2010). Beta-lactam antibiotics: from antibiosis to
resistance and bacteriology. APMIS. 118(1):1-36.
Koornhof HJ, Keddy K, McGee L. (2001). Clonal expansion of bacterial pathogens
across the world. J Travel Med. 8(1):29-40.
Kozlov AM, Darriba D, Flouri T, et al. (2019). RAxML-NG: a fast, scalable and user-
friendly tool for maximum likelihood phylogenetic inference. Bioinformatics.
35(21):4453-4455.

447
Kumar A, Mohapatra S, Bakhshi S, et al. (2018). Rectal Carriage of Carbapenem-
Resistant Enterobacteriaceae: A Menace to Highly Vulnerable Patients. J Glob Infect
Dis. 10(4):218-221.
Kumarasamy KK, Toleman MA, Walsh TR, et al. (2010). Emergence of a new
antibiotic resistance mechanism in India, Pakistan, and the UK: a molecular,
biological, and epidemiological study. Lancet Infect Dis. 10(9):597-602.
Lachiewicz AM, Hauck CG, Weber DJ, et al. (2017). Bacterial Infections After Burn
Injuries: Impact of Multidrug Resistance. Clin Infect Dis. 65(12):2130-2136.
Lahlaoui H, Bonnin RA, Moussa MB, et al. (2017). First report of OXA-232-
producing Klebsiella pneumoniae strains in Tunisia. Diagn Microbiol Infect Dis.
88(2):195-197.
Lai CC, Chuang YC, Chen CC, et al. (2017). Coexistence of MCR-1 and NDM-9 in a
clinical carbapenem-resistant Escherichia coli isolate. Int J Antimicrob Agents.
49(4):517-518.
Lai CC, Lee K, Xiao Y, et al. (2014). High burden of antimicrobial drug resistance in
Asia. J Glob Antimicrob Resist. 2(3):141-147.
Langford BJ, So M, Raybardhan S, et al. (2020). Bacterial co-infection and secondary
infection in patients with COVID-19: a living rapid review and meta-analysis. Clin
Microbiol Infect. 26(12):1622-1629.
Lartigue MF, Poirel L, Nordmann P. (2004). Diversity of genetic environment of
bla(CTX-M) genes. FEMS Microbiol Lett. 234(2):201-207.
Lee CR, Cho IH, Jeong BC, et al. (2013). Strategies to minimize antibiotic resistance.
Int J Environ Res Public Health. 10(9):4274-4305.
Lee CS, Vasoo S, Hu F, et al. (2014). Klebsiella pneumoniae ST147 coproducing
NDM-7 carbapenemase and RmtF 16S rRNA methyltransferase in Minnesota. J Clin
Microbiol. 52(11):4109-4110.

448
Lei CW, Zhang Y, Wang YT, et al. (2020). Detection of mobile colistin resistance
gene mcr-10.1 in a conjugative plasmid from Enterobacter roggenkampii of chicken
origin in China Antimicrob Agents Chemother. 64(10):e01191-20.
Lei L, Wang Y, Schwarz S, et al. (2017). mcr-1 in Enterobacteriaceae from Companion
Animals, Beijing, China, 2012-2016. Emerg Infect Dis. 23(4):710-711.
Letunic I, Bork P. (2019). Interactive Tree Of Life (iTOL) v4: recent updates and new
developments. Nucleic Acids Res. 47(W1):W256-W259.
Li B, Zhao Y, Liu C, et al. (2014). Molecular pathogenesis of Klebsiella pneumoniae.
Future Microbiol. 9(9):1071-1081.
Li H, Durbin R. (2009). Fast and accurate short read alignment with Burrows-Wheeler
transform. Bioinformatics. 25(14):1754-1760.
Li X, Fu Y, Shen M, et al. (2018a). Dissemination of blaNDM-5 gene via an IncX3-
type plasmid among non-clonal Escherichia coli in China. Antimicrob Resist Infect
Control. 7:59.
Li X, Mu X, Zhang P, et al. (2018b). Detection and characterization of a clinical
Escherichia coli ST3204 strain coproducing NDM-16 and MCR-1. Infect Drug Resist.
11:1189-1195.
Li XZ, Plésiat P, Nikaido H. (2015). The challenge of efflux-mediated antibiotic
resistance in Gram-negative bacteria. Clin Microbiol Rev. 28(2):337-418.
Liu B, Zheng D, Jin Q, et al. (2019c). VFDB 2019: a comparative pathogenomic
platform with an interactive web interface. Nucleic Acids Res. 47(D1):D687-D692.
Liu BT, Song FJ, Zou M, et al. (2017a). Emergence of Colistin Resistance Gene mcr-
1 in Cronobacter sakazakii Producing NDM-9 and in Escherichia coli from the Same
Animal. Antimicrob Agents Chemother. 61(2):e01444-16.
Liu J, Zhang L, Pan J, et al. (2020). Risk Factors and Molecular Epidemiology of
Complicated Intra-Abdominal Infections With Carbapenem-Resistant
Enterobacteriaceae: A Multicenter Study in China. J Infect Dis.
221(Supplement_2):S156-S163.

449
Liu L, Feng Y, McNally A, et al. (2018b). blaNDM-21, a new variant of blaNDM in
an Escherichia coli clinical isolate carrying blaCTX-M-55 and rmtB. J Antimicrob
Chemother. 73(9):2336-2339.
Liu X, Geng S, Chan EW, et al. (2019b). Increased prevalence of Escherichia coli
strains from food carrying blaNDM and mcr-1-bearing plasmids that structurally
resemble those of clinical strains, China, 2015 to 2017. Euro Surveill. 24(13):1800113.
Liu Y, Zhang H, Zhang X, et al. (2019a). Characterization of an NDM-19-producing
Klebsiella pneumoniae strain harboring 2 resistance plasmids from China. Diagn
Microbiol Infect Dis. 93(4):355-361.
Liu YY, Wang Y, Walsh TR, et al. (2016). Emergence of plasmid-mediated colistin
resistance mechanism MCR-1 in animals and human beings in China: a
microbiological and molecular biological study. Lancet Infect Dis. 16(2):161-168.
Liu Z, Li J, Wang X, et al. (2018a). Novel Variant of New Delhi Metallo-β-lactamase,
NDM-20, in Escherichia coli. Front Microbiol. 9:248.
Liu Z, Wang Y, Walsh TR, et al. (2017b). Plasmid-Mediated Novel blaNDM-17 Gene
Encoding a Carbapenemase with Enhanced Activity in a Sequence Type 48
Escherichia coli Strain. Antimicrob Agents Chemother. 61(5):e02233-16.
Liu Z, Xiao X, Li Y, et al. (2019d). Emergence of IncX3 Plasmid-Harboring blaNDM-
5 Dominated by Escherichia coli ST48 in a Goose Farm in Jiangsu, China. Front
Microbiol. 10:2002.
Long H, Feng Y, Ma K, et al. (2019). The co-transfer of plasmid-borne colistin-
resistant genes mcr-1 and mcr-3.5, the carbapenemase gene blaNDM-5 and the 16S
methylase gene rmtB from Escherichia coli. Sci Rep. 9(1):696.
Loutet SA, Valvano MA. (2010). A decade of Burkholderia cenocepacia virulence
determinant research. Infect Immun. 78(10):4088-100.
Lowe M, Kock MM, Coetzee J, et al. (2019). Klebsiella pneumoniae ST307 with
blaOXA-181, South Africa, 2014-2016. Emerg Infect Dis. 25(4):739-747.

450
Lu MC, Chen YT, Tang HL, et al. (2020). Transmission and evolution of OXA-48-
producing Klebsiella pneumoniae ST11 in a single hospital in Taiwan. J Antimicrob
Chemother. 75(2):318-326.
Lu MC, Tang HL, Chiou CS, et al. (2018). Clonal dissemination of carbapenemase-
producing Klebsiella pneumoniae: Two distinct sub-lineages of Sequence Type 11
carrying blaKPC-2 and blaOXA-48. Int J Antimicrob Agents. 52(5):658-662.
Ludden C, Moradigaravand D, Jamrozy D, et al. (2020). A One Health Study of the
Genetic Relatedness of Klebsiella pneumoniae and Their Mobile Elements in the East
of England. Clin Infect Dis. 70(2):219-226.
Lundborg CS, Tamhankar AJ. (2017). Antibiotic residues in the environment of South
East Asia. BMJ. 358:j2440.
Luo Q, Wang Y, Xiao Y. (2020). Prevalence and transmission of mobilized colistin
resistance (mcr) gene in bacteria common to animals and humans. Biosafety and
Health. 2(2):71-78.
Lutgring JD, Zhu W, de Man TJB, et al. (2018). Phenotypic and Genotypic
Characterization of Enterobacteriaceae Producing Oxacillinase-48-Like
Carbapenemases, United States. Emerg Infect Dis. 24(4):700-709.
Lv J, Qi X, Zhang D, et al. (2016). First Report of Complete Sequence of a blaNDM-
13-Harboring Plasmid from an Escherichia coli ST5138 Clinical Isolate. Front Cell
Infect Microbiol. 6:130.
Lyon JA. (1985). Imipenem/cilastatin: the first carbapenem antibiotic. Drug Intell Clin
Pharm. 19(12):895-899.
Magagnin CM, Rozales FP, Antochevis L, et al. (2017). Dissemination of blaOXA-
370 gene among several Enterobacteriaceae species in Brazil. Eur J Clin Microbiol
Infect Dis. 36(10):1907-1910.
Mahenthiralingam E, Vandamme P. (2005). Taxonomy and pathogenesis of the
Burkholderia cepacia complex. Chron Respir Dis. 2(4):209-217.

451
Mahmud I, Mbuya N. A (2016). World Bank study. Water, Sanitation, Hygiene, and
Nutrition in Bangladesh. Can Building Toilets Affect Children’s Growth? Accessed
on Accessed on 03 March 2020. https://motherchildnutrition.org/pdf/Water-
sanitation-hygiene-and-nutrition-in-Bangladesh-WB-2015.pdf.
Mahmud ZH, Kabir MH, Ali S, et al. (2020). Extended-Spectrum Beta-Lactamase-
Producing Escherichia coli in Drinking Water Samples From a Forcibly Displaced,
Densely Populated Community Setting in Bangladesh. Front Public Health. 8:228.
Mairi A, Pantel A, Sotto A, et al. (2018). OXA-48-like carbapenemases producing
Enterobacteriaceae in different niches. Eur J Clin Microbiol Infect Dis. 37(4):587-604.
Majewski P, Wieczorek P, Sacha PT, et al. (2014). Emergence of OXA-48
carbapenemase-producing Enterobacter cloacae ST89 infection in Poland. Int J Infect
Dis. 25:107-109.
Mancini S, Keller PM, Greiner M, et al. (2019). Detection of NDM-19, a novel variant
of the New Delhi metallo-β-lactamase with increased carbapenemase activity under
zinc-limited conditions, in Switzerland. Diagn Microbiol Infect Dis. 95(3):114851.
Mancini S, Poirel L, Tritten ML, et al. (2018). Emergence of an MDR Klebsiella
pneumoniae ST231 producing OXA-232 and RmtF in Switzerland. J Antimicrob
Chemother. 73(3):821-823.
Manning J. (2018). Sepsis in the Burn Patient. Crit Care Nurs Clin North Am.
30(3):423-430.
Mansour W, Haenni M, Saras E, et al. (2017). Outbreak of colistin-resistant
carbapenemase-producing Klebsiella pneumoniae in Tunisia. J Glob Antimicrob
Resist. 10:88-94.
Marano RBM, Zolti A, Jurkevitch E, et al. (2019). Antibiotic resistance and class 1
integron gene dynamics along effluent, reclaimed wastewater irrigated soil, crop
continua: elucidating potential risks and ecological constraints. Water Res.
164:114906.

452
Mariappan S, Sekar U, Kamalanathan A. (2017). Carbapenemase-producing
Enterobacteriaceae: Risk factors for infection and impact of resistance on outcomes.
Int J Appl Basic Med Res. 7(1):32-39.
Marquez-Ortiz RA, Haggerty L, Olarte N, et al. (2017). Genomic Epidemiology of
NDM-1-Encoding Plasmids in Latin American Clinical Isolates Reveals Insights into
the Evolution of Multidrug Resistance. Genome Biol Evol. 9(6):1725-1741.
Marsh JW, Mustapha MM, Griffith MP, et al. (2019). Evolution of Outbreak-Causing
Carbapenem-Resistant Klebsiella pneumoniae ST258 at a Tertiary Care Hospital over
8 Years. mBio. 10(5):e01945-19.
Martin A, Fahrbach K, Zhao Q, et al. (2018). Association Between Carbapenem
Resistance and Mortality Among Adult, Hospitalized Patients With Serious Infections
Due to Enterobacteriaceae: Results of a Systematic Literature Review and Meta-
analysis. Open Forum Infect Dis. 5(7):ofy150.
Martirosov DM, Lodise TP. (2016). Emerging trends in epidemiology and
management of infections caused by carbapenem-resistant Enterobacteriaceae. Diagn
Microbiol Infect Dis. 85(2):266-275.
Masud AA, Rousham EK, Islam MA, et al. (2020). Drivers of Antibiotic Use in
Poultry Production in Bangladesh: Dependencies and Dynamics of a Patron-Client
Relationship. Front Vet Sci. 7:78.
Matamoros S, van Hattem JM, Arcilla MS, et al. (2017). Global phylogenetic analysis
of Escherichia coli and plasmids carrying the mcr-1 gene indicates bacterial diversity
but plasmid restriction. Sci Rep. 7(1):15364.
McCarthy MW. (2019). Teixobactin: a novel anti-infective agent. Expert Rev Anti
Infect Ther. 17(1):1-3.
Melnyk AH, Wong A, Kassen R. (2015). The fitness costs of antibiotic resistance
mutations. Evol Appl. 8(3):273-283.

453
Mendes AC, Novais Â, Campos J, et al. (2018). mcr-1 in Carbapenemase-Producing
Klebsiella pneumoniae with Hospitalized Patients, Portugal, 2016-2017. Emerg Infect
Dis. 24(4):762-766.
Midega J. (2020). Estimating the global burden of antimicrobial resistance:
Reflections on current methods and data needs [version 1; peer review: 1 approved, 1
not approved]. Wellcome Open Res. 5:48.
Mirande C, Bizine I, Giannetti A, et al. (2018). Epidemiological aspects of healthcare-
associated infections and microbial genomics. Eur J Clin Microbiol Infect Dis.
37(5):823-831.
Mlynarcik P, Kolar M. (2019). Molecular mechanisms of polymyxin resistance and
detection of mcr genes. Biomed Pap Med Fac Univ Palacky Olomouc Czech Repub.
163(1):28-38.
Mohan B, Prasad A, Kaur H, et al. (2017). Fecal carriage of carbapenem-resistant
Enterobacteriaceae and risk factor analysis in hospitalised patients: A single centre
study from India. Indian J Med Microbiol. 35(4):555-562.
Mohan B, Prasad A, Kaur H, et al. (2017). Fecal carriage of carbapenem-resistant
Enterobacteriaceae and risk factor analysis in hospitalised patients: A single centre
study from India. Indian J Med Microbiol. 35(4):555-562.
Mohanty S, Gajanand M, Gaind R. (2017). Identification of carbapenemase-mediated
resistance among Enterobacteriaceae bloodstream isolates: A molecular study from
India. Indian J Med Microbiol. 35(3):421-425.
MOHFW. (2002). Bangladesh National Health Accounts 1997-2002. Accessed on 03
March 2019. https://www.slideshare.net/policyadda/summary-bangladesh-national-
health-accounts-19972012.
MOHFW. (2016). Health Bulletin 2016 for Dhaka Medical College Hospital.
Accessed on Accessed on 03 March 2020.
https://app.dghs.gov.bd/localhealthBulletin2016/publish/publish.php?org=10000033
&year=2016&lvl=5.

454
Molton JS, Tambyah PA, Ang BS, et al. (2013). The global spread of healthcare-
associated multidrug-resistant bacteria: a perspective from Asia. Clin Infect Dis.
56(9):1310-1318.
Montealegre MC, Talavera Rodríguez A, Roy S, et al. (2020). High Genomic Diversity
and Heterogenous Origins of Pathogenic and Antibiotic-Resistant Escherichia coli in
Household Settings Represent a Challenge to Reducing Transmission in Low-Income
Settings. mSphere. 5(1):e00704-19.
Moradigaravand D, Boinett CJ, Martin V, et al. (2016). Recent independent emergence
of multiple multidrug-resistant Serratia marcescens clones within the United Kingdom
and Ireland. Genome Res. 26(8):1101-1109.
Moradigaravand D, Martin V, Peacock SJ, et al. (2017). Evolution and Epidemiology
of Multidrug-Resistant Klebsiella pneumoniae in the United Kingdom and Ireland.
mBio. 8(1):e01976-16.
Moussounda M, Diene SM, Dos Santos S, et al. (2017). Emergence of blaNDM-7-
Producing Enterobacteriaceae in Gabon, 2016. Emerg Infect Dis. 23(2):356-358.
Mukherjee S, Naha S, Bhadury P, et al. (2020). Emergence of OXA-232-producing
hypervirulent Klebsiella pneumoniae ST23 causing neonatal sepsis. J Antimicrob
Chemother. 75(7):2004-2006.
Munita JM, Arias CA. (2016). Mechanisms of Antibiotic Resistance. Microbiol
Spectr. 4(2):10.
myHealthbox. (n.d.) Colipol Vet Oral Solution. Accessed on 03 October 2020.
https://myhealthbox.eu/en/colipol-vet-oral-solution/5180342.
Naas T, Oueslati S, Bonnin RA, et al. (2017) Beta-lactamase database (BLDB) -
structure and function. J Enzyme Inhib Med Chem. 32(1):917-919.
Nabti LZ, Sahli F, Ngaiganam EP, et al. (2020). Development of real-time PCR assay
allowed describing the first clinical Klebsiella pneumoniae isolate harboring plasmid-
mediated colistin resistance mcr-8 gene in Algeria. J Glob Antimicrob Resist. 20:266-
271.

455
Nakano R, Nakano A, Hikosaka K, et al. (2014). First report of metallo-β-lactamase
NDM-5-producing Escherichia coli in Japan. Antimicrob Agents Chemother.
58(12):7611-7612.
Naylor NR, Pouwels KB, Hope R, et al. (2019). The health and cost burden of
antibiotic resistant and susceptible Escherichia coli bacteraemia in the English hospital
setting: A national retrospective cohort study. PLoS One. 14(9):e0221944.
Nicolas E, Lambin M, Dandoy D, et al. (2015). The Tn3-family of Replicative
Transposons. Microbiol Spectr. 3(4).
Nicolas-Chanoine MH, Vigan M, Laouénan C, et al. (2019). Risk factors for
carbapenem-resistant Enterobacteriaceae infections: a French case-control-control
study. Eur J Clin Microbiol Infect Dis. 38(2):383-393.
Nieuwlaat R, Mbuagbaw L, Mertz D, et al. (2020). COVID-19 and Antimicrobial
Resistance: Parallel and Interacting Health Emergencies. Clin Infect Dis. ciaa773.
Nigg A, Brilhante M, Dazio V, et al. (2019). Shedding of OXA-181 carbapenemase-
producing Escherichia coli from companion animals after hospitalisation in
Switzerland: an outbreak in 2018. Euro Surveill. 24(39):1900071.
Nikaido H. (2009). Multidrug resistance in bacteria. Annu Rev Biochem. 78:119-146.
Nordmann P, Boulanger AE, Poirel L. (2012). NDM-4 metallo-β-lactamase with
increased carbapenemase activity from Escherichia coli. Antimicrob Agents
Chemother. 56(4):2184-2186.
Nordmann P, Poirel L, Walsh TR, et al. (2011). The emerging NDM carbapenemases.
Trends Microbiol. 19(12):588-595.
Nordmann P, Poirel L. (2019). Epidemiology and Diagnostics of Carbapenem
Resistance in Gram-negative Bacteria. Clin Infect Dis. 69(Suppl 7):S521-S528.
Ntshobeni NB, Allam M, Ismail A, et al. (2019). Draft Genome Sequence of
Providencia rettgeri APW139_S1, an NDM-18-Producing Clinical Strain Originating
from Hospital Effluent in South Africa. Microbiol Resour Announc. 8(21):e00259-19.

456
O’Neill J. (2016). Tackling drug-resistant infections globally: final report and
recommendations. Accessed on 03 October 2020. https://amr-review.org.
Obeng-Nkrumah N, Labi AK, Blankson H, et al. (2019). Household cockroaches carry
CTX-M-15-, OXA-48- and NDM-1-producing enterobacteria and share beta-lactam
resistance determinants with humans. BMC Microbiol. 19(1):272.
O'Brien KH, Lushin V. (2019). Examining the Impact of Psychological Factors on
Hospital Length of Stay for Burn Survivors: A Systematic Review. J Burn Care Res.
40(1):12-20.
OEC (2020). Bangladesh. Accessed on 03 March 2020.
https://oec.world/en/profile/country/bgd.
Olaitan AO, Morand S, Rolain JM. (2014). Mechanisms of polymyxin resistance:
acquired and intrinsic resistance in bacteria. Front Microbiol. 5:643.
Olland A, Falcoz PE, Kessler R, et al. (2011). Should cystic fibrosis patients infected
with Burkholderia cepacia complex be listed for lung transplantation? Interact
Cardiovasc Thorac Surg. 13(6):631-634.
Ombelet S, Ronat JB, Walsh T, et al. (2018). Bacteriology in Low Resource Settings
working group. Clinical bacteriology in low-resource settings: today's solutions.
Lancet Infect Dis. 18(8):e248-e258.
Ouchar Mahamat O, Lounnas M, Hide M, et al. (2019). Spread of NDM-5 and OXA-
181 Carbapenemase-Producing Escherichia coli in Chad. Antimicrob Agents
Chemother. 63(11):e00646-19.
Ovejero CM, Delgado-Blas JF, Calero-Caceres W, et al. (2017). Spread of mcr-1-
carrying Enterobacteriaceae in sewage water from Spain. J Antimicrob Chemother.
72(4):1050-1053.
Page AJ, Cummins CA, Hunt M, et al. (2015). Roary: rapid large-scale prokaryote pan
genome analysis. Bioinformatics. 31(22):3691-3693.

457
Pál T, Ghazawi A, Darwish D, et al. (2017). Characterization of NDM-7
Carbapenemase-Producing Escherichia coli Isolates in the Arabian Peninsula. Microb
Drug Resist. 23(7):871-878.
Palani GS, Ghafur A, Krishnan P, et al. (2020). Intestinal carriage of colistin resistant
Enterobacteriaceae in hospitalized patients from an Indian center. Diagn Microbiol
Infect Dis. 97(1):114998.
Palzkill T. (2013). Metallo-β-lactamase structure and function. Ann N Y Acad Sci.
1277:91-104.
Partridge SR, Kwong SM, Firth N, et al. (2018). Mobile Genetic Elements Associated
with Antimicrobial Resistance. Clin Microbiol Rev. 31(4):e00088-17.
Parvin MS, Talukder S, Ali MY, et al. (2020). Antimicrobial Resistance Pattern of
Escherichia coli Isolated from Frozen Chicken Meat in Bangladesh. Pathogens.
9(6):420.
Paul D, Bhattacharjee A, Ingti B, et al. (2017). Occurrence of blaNDM-7 within
IncX3-type plasmid of Escherichia coli from India. J Infect Chemother. 23(4):206-
210.
Pecora N, Zhao X, Nudel K, et al. (2019). Diverse Vectors and Mechanisms Spread
New Delhi Metallo-β-Lactamases among Carbapenem-Resistant Enterobacteriaceae
in the Greater Boston Area. Antimicrob Agents Chemother. 63(2):e02040-18.
Peirano G, Bradford PA, Kazmierczak KM, et al. (2014). Global incidence of
carbapenemase-producing Escherichia coli ST131. Emerg Infect Dis. 20(11):1928-
1931.
Peirano G, Matsumura Y, Adams MD, et al. (2018). Genomic Epidemiology of Global
Carbapenemase-Producing Enterobacter spp., 2008-2014. Emerg Infect Dis.
24(6):1010-1019.
Percival KM. (2017). Antibiotic Classification and Indication Review for the Infusion
Nurse. J Infus Nurs. 40(1):55-63.

458
Pereira PS, Borghi M, de Araújo CF, et al. 2015 (). Clonal Dissemination of OXA-
370-Producing Klebsiella pneumoniae in Rio de Janeiro, Brazil. Antimicrob Agents
Chemother. 59(8):4453-4456.
Perrin-Guyomard A, Bruneau M, Houée P, et al. (2016). Prevalence of mcr-1 in
commensal Escherichia coli from French livestock, 2007 to 2014. Euro Surveill.
21(6).
Pitout JDD, Peirano G, Kock MM, et al. (2019). The Global Ascendency of OXA-48-
Type Carbapenemases. Clin Microbiol Rev. 33(1):e00102-19.
Podnecky NL, Rhodes KA, Schweizer HP. (2015). Efflux pump-mediated drug
resistance in Burkholderia. Front Microbiol. 6:305.
Poirel L, Bonnin RA, Nordmann P. (2011). Analysis of the resistome of a multidrug-
resistant NDM-1-producing Escherichia coli strain by high-throughput genome
sequencing. Antimicrob Agents Chemother. 55(9):4224-4229.
Poirel L, Potron A, Nordmann P. (2012). OXA-48-like carbapenemases: the phantom
menace. J Antimicrob Chemother. 67(7):1597-1606.
Pokharel S, Raut S, Adhikari B. (2019). Tackling antimicrobial resistance in low-
income and middle-income countries. BMJ Glob Health. 4(6):e002104.
Poole K. (2007). Efflux pumps as antimicrobial resistance mechanisms. Ann Med.
39(3):162-176.
Potron A, Poirel L, Dortet L, et al. 2016 (). Characterisation of OXA-244, a
chromosomally-encoded OXA-48-like β-lactamase from Escherichia coli. Int J
Antimicrob Agents. 47(1):102-103.
PRISM. (2013). Survey on Quantitative and qualitative assessment of medical waste
generation and management in Dhaka North City Corporation and Dhaka South City
Corporation. Accessed on 03 March 2020. http://pbf.org.bd/wp-
content/uploads/2014/01/Survey-on-Quantitative-qualitative-assessment-ofmedical-
waste-generation-and-managemant-in-DNCC-DSCC.pdf.

459
Pulss S, Stolle I, Stamm I, et al. (2018). Multispecies and Clonal Dissemination of
OXA-48 Carbapenemase in Enterobacteriaceae From Companion Animals in
Germany, 2009-2016. Front Microbiol. 9:1265.
Qamar MU, Walsh TR, Toleman MA, et al. (2019). Dissemination of genetically
diverse NDM-1, -5, -7 producing-Gram-negative pathogens isolated from pediatric
patients in Pakistan. Future Microbiol. 14:691-704.
Qin S, Zhou M, Zhang Q, et al. (2016). First identification of NDM-4-producing
Escherichia coli ST410 in China. Emerg Microbes Infect. 5(11):e118.
Queenan AM, Bush K. (2007). Carbapenemases: the versatile beta-lactamases. Clin
Microbiol Rev. 20(3):440-458.
Rahman M, Mukhopadhyay C, Rai RP, et al. (2018). Novel variant NDM-11 and other
NDM-1 variants in multidrug-resistant Escherichia coli from South India. J Glob
Antimicrob Resist. 14:154-157.
Rahman M, Shukla SK, Prasad KN, et al. (2014). Prevalence and molecular
characterisation of New Delhi metallo-β-lactamases NDM-1, NDM-5, NDM-6 and
NDM-7 in multidrug-resistant Enterobacteriaceae from India. Int J Antimicrob Agents.
44(1):30-37.
Rahman MK, Islam A, Samad M, et al. (2017). Epidemiology of Antimicrobial
Resistance of Salmonella and Staphylococcus Isolated from Free Range Rhesus
macaque (Macaca mulatta) in Bangladesh. 9TH OHBC, 17–18 September. Dhaka,
Bangladesh.
Rai S, Das D, Niranjan DK, et al. (2014). Carriage prevalence of carbapenem-resistant
Enterobacteriaceae in stool samples: A surveillance study. Australas Med J. 7(2):64-
67.
Rakhi NN, Alam ASMRU, Sultana M, et al. (2019). Diversity of carbapenemases in
clinical isolates: The emergence of blaVIM-5 in Bangladesh. J Infect Chemother.
25(6):444-451.

460
Ramanathan YV, Venkatasubramanian R, Nambi PS, et al. (2018). Carbapenem-
resistant enterobacteriaceae screening: A core infection control measure for critical
care unit in India? Indian J Med Microbiol. 36(4):572-576.
Rambaut, A. (2010) FigTree v1.4.4. Institute of Evolutionary Biology, University of
Edinburgh, Edinburgh. http://tree.bio.ed.ac.uk/software/figtree/.
Rashid M, Rakib MM, Hasan B. (2015). Antimicrobial-resistant and ESBL-producing
Escherichia coli in different ecological niches in Bangladesh. Infect Ecol Epidemiol.
17;5:26712.
Rastogi N, Khurana S, Veeraraghavan B, et al. (2019). Epidemiological investigation
and successful management of a Burkholderia cepacia outbreak in a neurotrauma
intensive care unit. Int J Infect Dis. 79:4-11.
Rech MA, Mosier MJ, McConkey K, et al. (2019). Outcomes in Burn-Injured Patients
Who Develop Sepsis. J Burn Care Res. 40(3):269-273.
Rhodes KA, Schweizer HP. (2016). Antibiotic resistance in Burkholderia species.
Drug Resist Updat. 28:82-90.
Richter SE, Miller L, Needleman J, et al. (2019). Risk Factors for Development of
Carbapenem Resistance Among Gram-Negative Rods. Open Forum Infect Dissou.
6(3):ofz027.
Righi E, Peri AM, Harris PN, et al. (2017). Global prevalence of carbapenem
resistance in neutropenic patients and association with mortality and carbapenem use:
systematic review and meta-analysis. J Antimicrob Chemother. 72(3):668-677.
Rodríguez-Medina N, Barrios-Camacho H, Duran-Bedolla J, et al. (2019). Klebsiella
variicola: an emerging pathogen in humans. Emerg Microbes Infect. 8(1):973-988.
Roisin S, Gaudin C, De Mendonça R, et al. (2016). Pan-genome multilocus sequence
typing and outbreak-specific reference-based single nucleotide polymorphism analysis
to resolve two concurrent Staphylococcus aureus outbreaks in neonatal services. Clin
Microbiol Infect. 22(6):520-526.

461
Rojas LJ, Hujer AM, Rudin SD, et al. (2017). NDM-5 and OXA-181 Beta-Lactamases,
a Significant Threat Continues to Spread in the Americas. Antimicrob Agents
Chemother. 61(7):e00454-17.
Rozwandowicz M, Brouwer MSM, Fischer J, et al. (2018). Plasmids carrying
antimicrobial resistance genes in Enterobacteriaceae. J Antimicrob Chemother.
73(5):1121-1137.
Sampaio JL, Ribeiro VB, Campos JC, et al. (2014). Detection of OXA-370, an OXA-
48-related class D β-lactamase, in Enterobacter hormaechei from Brazil. Antimicrob
Agents Chemother. 58(6):3566-3567.
San Millan A. (2018). Evolution of Plasmid-Mediated Antibiotic Resistance in the
Clinical Context. Trends Microbiol. 26(12):978-985.
Saavedra SY, Diaz L, Wiesner M, et al. (2017) Genomic and Molecular
Characterization of Clinical Isolates of Enterobacteriaceae Harboring mcr-1 in
Colombia, 2002 to 2016. Antimicrob Agents Chemother. 61(12):e00841-17.
Saseedharan S, Sahu M, Pathrose EJ, et al. (2016). Act Fast as Time Is Less: High
Faecal Carriage of Carbapenem-Resistant Enterobacteriaceae in Critical Care Patients.
J Clin Diagn Res. 10(9):DC01-DC05.
Sauvage E, Kerff F, Terrak M, et al. (2008). The penicillin-binding proteins: structure
and role in peptidoglycan biosynthesis. FEMS Microbiol Rev. 32(3):556.
Sawa T, Kooguchi K, Moriyama K. (2020). Molecular diversity of extended-spectrum
β-lactamases and carbapenemases, and antimicrobial resistance. J Intensive Care.
8:13.
Sawana A, Adeolu M, Gupta RS. (2014). Molecular signatures and phylogenomic
analysis of the genus Burkholderia: proposal for division of this genus into the
emended genus Burkholderia containing pathogenic organisms and a new genus
Paraburkholderia gen. nov. harboring environmental species. Front Genet. 5:429.
Seemann T. (2014). Prokka: rapid prokaryotic genome annotation. Bioinformatics.
30(14):2068-2069.

462
Seemann T. (2015). snippy: fast bacterial variant calling from NGS reads. Accessed
on August 4, 2017. https://github.com/tseemann/snippy.
Sekizuka T, Inamine Y, Segawa T, et al. (2019). Characterization of NDM-5- and
CTX-M-55-coproducing Escherichia coli GSH8M-2 isolated from the effluent of a
wastewater treatment plant in Tokyo Bay. Infect Drug Resist. 12:2243-2249.
Sfeir MM. (2018). Burkholderia cepacia complex infections: More complex than the
bacterium name suggest. J Infect. 77(3):166-170.
Shah AA, Hasan F, Ahmed S, et al. (2004). Characteristics, epidemiology and clinical
importance of emerging strains of Gram-negative bacilli producing extended-spectrum
beta-lactamases. Res Microbiol. 155(6):409-421.
Shahida S, Islam A, Dey B, et al. (2016). Hospital Acquired Infections in Low- and
Middle-Income Countries: Root Cause Analysis and the Development of Infection
Control Practices in Bangladesh. Open Journal of Obstetrics and Gynecology. 6:28-
39.
Shaikh S, Fatima J, Shakil S, et al. (2015). Antibiotic resistance and extended spectrum
beta-lactamases: Types, epidemiology and treatment. Saudi J Biol Sci. 22(1):90-101.
Shane AL, Sánchez PJ, Stoll BJ. (2017). Neonatal sepsis. Lancet. 390(10104):1770-
1780.
Shankar C, Mathur P, Venkatesan M, et al. (2019). Rapidly disseminating blaOXA-
232 carrying Klebsiella pneumoniae belonging to ST231 in India: multiple and varied
mobile genetic elements. BMC Microbiol. 19(1):137.
Shankar C, Nabarro LE, Anandan S, et al. (2018). Extremely High Mortality Rates in
Patients with Carbapenem-resistant, Hypermucoviscous Klebsiella pneumoniae Blood
Stream Infections. J Assoc Physicians India. 66(12):13-16.
Shannon P, Markiel A, Ozier O, et al. (2003). Cytoscape: a software environment for
integrated models of biomolecular interaction networks. Genome Research.
13(11):2498–2504.

463
Shen Z, Hu Y, Sun Q, et al. (2018). Emerging Carriage of NDM-5 and MCR-1 in
Escherichia coli From Healthy People in Multiple Regions in China: A Cross Sectional
Observational Study. EClinicalMedicine. 6:11-20.
Shen Z, Wang Y, Shen Y, et al. (2016). Early emergence of mcr-1 in Escherichia coli
from food-producing animals. Lancet Infect Dis.16(3):293.
Sherchan JB, Tada T, Shrestha S, et al. (2020). Emergence of clinical isolates of highly
carbapenem-resistant Klebsiella pneumoniae co-harboring blaNDM-5 and blaOXA-
181 or -232 in Nepal. Int J Infect Dis. 92:247-252.
Shintani M, Ohkuma M, Kimbara K. (2019). High-Resolution Comparison of
Bacterial Conjugation Frequencies. J Vis Exp. (143).
Shommu NS, Vogel HJ, Storey DG. (2015). Potential of metabolomics to reveal
Burkholderia cepacia complex pathogenesis and antibiotic resistance. Front
Microbiol. 6:668.
Shrestha B, Tada T, Miyoshi-Akiyama T, et al. (2015). Identification of a novel NDM
variant, NDM-13, from a multidrug-resistant Escherichia coli clinical isolate in Nepal.
Antimicrob Agents Chemother. 59(9):5847-5850.
Shrestha P, Cooper BS, Coast J, et al. (2018). Enumerating the economic cost of
antimicrobial resistance per antibiotic consumed to inform the evaluation of
interventions affecting their use. Antimicrob Resist Infect Control. 7:98.
Simonsen KA, Anderson-Berry AL, Delair SF, et al. (2014). Early-onset neonatal
sepsis. Clin Microbiol Rev. 27(1):21-47.
Singh NP, Choudhury DD, Gupta K, et al. (2018). Predictors for gut colonization of
carbapenem-resistant Enterobacteriaceae in neonates in a neonatal intensive care unit.
Am J Infect Control. 46(6):e31-e35.
Singh-Moodley A, Perovic O. (2016). Antimicrobial susceptibility testing in
predicting the presence of carbapenemase genes in Enterobacteriaceae in South Africa.
BMC Infect Dis. 16(1):536.

464
Smith A, Anandan S, Veeraraghavan B, et al. (2020). Colonization of the Preterm
Neonatal Gut with Carbapenem-resistant Enterobacteriaceae and Its Association with
Neonatal Sepsis and Maternal Gut Flora. J Glob Infect Dis. 12(2):101-104.
Snell JA, Loh NH, Mahambrey T, et al. (2013). Clinical review: the critical care
management of the burn patient. Crit Care. 17(5):241.
Snitkin ES, Zelazny AM, Thomas PJ, et al. (2012). Tracking a hospital outbreak of
carbapenem-resistant Klebsiella pneumoniae with whole-genome sequencing. Sci
Transl Med. 4(148):148ra116.
Sobur A, Haque ZF, Sabuj AA, et al. (2019b). Molecular detection of multidrug and
colistin-resistant Escherichia coli isolated from house flies in various environmental
settings. Future Microbiol. 14:847-858.
Sobur MA, Ievy S, Haque ZF, et al. (2019a). Emergence of colistin-resistant
Escherichia coli in poultry, house flies, and pond water in Mymensingh, Bangladesh.
J Adv Vet Anim Res. 6(1):50-53.
Solgi H, Badmasti F, Giske CG, et al. (2018). Molecular epidemiology of NDM-1-
and OXA-48-producing Klebsiella pneumoniae in an Iranian hospital: clonal
dissemination of ST11 and ST893. J Antimicrob Chemother. 73(6):1517-1524.
Soliman AM, Khalifa HO, Ahmed AM, et al. (2016). Emergence of an NDM-5-
producing clinical Escherichia coli isolate in Egypt. Int J Infect Dis.48:46-48.
Sonnevend Á, Ghazawi A, Alqahtani M, et al. (2016). Plasmid-mediated colistin
resistance in Escherichia coli from the Arabian Peninsula. Int J Infect Dis. 50:85-90.
Sood G, Perl TM. (2016). Outbreaks in Health Care Settings. Infect Dis Clin North
Am. 30(3):661-687.
Srijan A, Margulieux KR, Ruekit S, et al. (2018). Genomic Characterization of
Nonclonal mcr-1-Positive Multidrug-Resistant Klebsiella pneumoniae from Clinical
Samples in Thailand. Microb Drug Resist. 24(4):403-410.
Stalder T, Rogers LM, Renfrow C, et al. (2017). Emerging patterns of plasmid-host
coevolution that stabilize antibiotic resistance. Sci Rep. 7(1):4853.

465
Stanojcic M, Vinaik R, Jeschke MG. (2018). Status and Challenges of Predicting and
Diagnosing Sepsis in Burn Patients. Surg Infect (Larchmt). 19(2):168-175.
Stewardson AJ, Marimuthu K, Sengupta S, et al. (2019). Effect of carbapenem
resistance on outcomes of bloodstream infection caused by Enterobacteriaceae in low-
income and middle-income countries (PANORAMA): a multinational prospective
cohort study. Lancet Infect Dis. 19(6):601-610.
Suay-García B, Pérez-Gracia MT. (2019). Present and Future of Carbapenem-resistant
Enterobacteriaceae (CRE) Infections. Antibiotics (Basel). 8(3):122.
Sun J, Zhang H, Liu YH, et al. (2018). Towards Understanding MCR-like Colistin
Resistance. Trends Microbiol. 26(9):794-808.
Tacão M, Araújo S, Vendas M, et al. (2018). Shewanella species as the origin of
blaOXA-48 genes: insights into gene diversity, associated phenotypes and possible
transfer mechanisms. Int J Antimicrob Agents. 51(3):340-348.
Tada T, Miyoshi-Akiyama T, Dahal RK, et al. (2013). NDM-8 metallo-β-lactamase in
a multidrug-resistant Escherichia coli strain isolated in Nepal. Antimicrob Agents
Chemother. 57(5):2394-2396.
Tada T, Miyoshi-Akiyama T, Shimada K, et al. (2014a). Biochemical analysis of
metallo-β-lactamase NDM-3 from a multidrug-resistant Escherichia coli strain
isolated in Japan. Antimicrob Agents Chemother. 58(6):3538-3540.
Tada T, Shrestha B, Miyoshi-Akiyama T, et al. (2014b). NDM-12, a novel New Delhi
metallo-β-lactamase variant from a carbapenem-resistant Escherichia coli clinical
isolate in Nepal. Antimicrob Agents Chemother. 58(10):6302-6305.
Tafoukt R, Leangapichart T, Hadjadj L, et al. (2018). Characterisation of blaOXA-
538, a new variant of blaOXA-48, in Shewanella xiamenensis isolated from river water
in Algeria. J Glob Antimicrob Resist. 13:70-73.
Tahlan K, Jensen SE. (2013). Origins of the β-lactam rings in natural products. J
Antibiot (Tokyo). 66(7):401-410.

466
Takeuchi D, Akeda Y, Yoshida H, et al. (2018). Genomic reorganization by IS26 in a
blaNDM-5-bearing FII plasmid of Klebsiella pneumoniae isolated from a patient in
Japan. J Med Microbiol. 67(9):1221-1224.
Tamma PD, Kazmi A, Bergman Y, et al. (2019). The Likelihood of Developing a
Carbapenem-Resistant Enterobacteriaceae Infection during a Hospital Stay.
Antimicrob Agents Chemother. 63(8):e00757-19.
Tang B, Chang J, Cao L, et al. (2019). Characterization of an NDM-5 carbapenemase-
producing Escherichia coli ST156 isolate from a poultry farm in Zhejiang, China.
BMC Microbiol. 19(1):82.
Teo AC, Roper DI. (2015). Core Steps of Membrane-Bound Peptidoglycan
Biosynthesis: Recent Advances, Insight and Opportunities. Antibiotics (Basel).
4(4):495-520.
Teo JW, Kurup A, Lin RT, et al. (2013). Emergence of clinical Klebsiella pneumoniae
producing OXA-232 carbapenemase in Singapore. New Microbes New Infect. 1(1):13-
15.
Thamban Chandrika N, Garneau-Tsodikova S. (2018). Comprehensive review of
chemical strategies for the preparation of new aminoglycosides and their biological
activities. Chem Soc Rev. 47(4):1189-1249.
The Fleming Fund. (2019). Accessed on 03 March 2020.
https://www.flemingfund.org/wp-
content/uploads/1eb5e64133eb067da9f28acb86cd39cd.pdf.
The World Bank. (2016). By 2050, drug-resistant infections could cause global
economic damage on par with 2008 financial crisis. Accessed on 01 March 2020.
https://www.worldbank.org/en/news/press-release/2016/09/18/by-2050-drug-
resistant-infections-could-cause-global-economic-damage-on-par-with-2008-
financial-crisis.
The World Bank. (2020a). The Global Economic Outlook During the COVID-19
Pandemic: A Changed World. Accessed on 01 October 2020.

467
https://www.worldbank.org/en/news/feature/2020/06/08/the-global-economic-
outlook-during-the-covid-19-pandemic-a-changed-world.
The World Bank. (2020b). Mortality rate, neonatal (per 1,000 live births) –
Bangladesh. Accessed on 01 October 2020.
https://data.worldbank.org/indicator/SH.DYN.NMRT?locations=BD
Thomson KM, Dyer C, Liu F, et al. Evaluating the roles of antibiotic resistance, drug
target attainment, bacterial pathogenicity, virulence, and antibiotic access and
affordability in affecting outcomes in neonatal sepsis: an international microbiology
and drug evaluation prospective study. Lancet Infect Dis. [manuscript in press]
Thornber K, Verner-Jeffreys D, Hinchliffe S, (2020). Evaluating antimicrobial
resistance in the global shrimp industry. Rev Aquac. 12(2):966-986.
Tian D, Wang B, Zhang H, et al. (2020). Dissemination of the blaNDM-5 Gene via
IncX3-Type Plasmid among Enterobacteriaceae in Children. mSphere. 5(1):e00699-
19.
Tian GB, Doi Y, Shen J, et al. (2017). MCR-1-producing Klebsiella pneumoniae
outbreak in China. Lancet Infect Dis. 17(6):577.
Tischendorf J, de Avila RA, Safdar N. (2016). Risk of infection following colonization
with carbapenem-resistant Enterobactericeae: A systematic review. Am J Infect
Control. 44(5):539-543.
Toleman MA, Bennett PM, Walsh TR. (2006). ISCR elements: novel gene-capturing
systems of the 21st century? Microbiol Mol Biol Rev. 70(2):296-316.
Toleman MA, Bugert JJ, Nizam SA. (2015). Extensively drug-resistant New Delhi
metallo-β-lactamase-encoding bacteria in the environment, Dhaka, Bangladesh, 2012.
Emerg Infect Dis. 21(6):1027-1030.
Toleman MA. (2018). Direct in Gel Genomic Detection of Antibiotic Resistance
Genes in S1 Pulsed Field Electrophoresis Gels. Methods Mol Biol. 1736:129-136.

468
Tong H, Liu J, Yao X, et al. (2018). High carriage rate of mcr-1 and antimicrobial
resistance profiles of mcr-1-positive Escherichia coli isolates in swine faecal samples
collected from eighteen provinces in China. Vet Microbiol. 225:53-57.
Tonoyan L, Fleming GTA, Friel R, et al. (2019). Continuous culture of Escherichia
coli, under selective pressure by a novel antimicrobial complex, does not result in
development of resistance. Sci Rep. 9(1):2401.
Trading Economics, 2020. Bangladesh Consumer Price Index (CPI). Accessed on
Accessed on August 2, 2020. https://tradingeconomics.com/bangladesh/consumer-
price-index-cpi.
Tsang J. (2017). Bacterial plasmid addiction systems and their implications for
antibiotic drug development. Postdoc J. 5(5):3-9.
Tsang JS. (2004). Molecular biology of the Burkholderia cepacia complex. Adv Appl
Microbiol. 54:71-91.
Turlej-Rogacka A, Xavier BB, Janssens L, et al. (2018). Evaluation of colistin stability
in agar and comparison of four methods for MIC testing of colistin. Eur J Clin
Microbiol Infect Dis. 37(2):345-353.
Uchida H, Tada T, Sugahara Y, et al. (2018). A clinical isolate of Escherichia coli co-
harbouring mcr-1 and blaNDM-5 in Japan. J Med Microbiol. 67(8):1047-1049.
UNICEF. (2020a). Child Mortality Estimates. Regional and global Neonatal deaths.
Accessed on 01 March 2020. http://data.unicef.org.
UNICEF. (2020b). Maternal and Newborn Health Coverage Database. Accessed on
01 March 2020. http://data.unicef.org.
UNICEF-WHO. (2019). Low birthweight estimates. Levels and trends 2000–2015.
Accessed on 01 March 2020. WHO-NMH-NHD-19.21-eng.pdf.
van Duin D, Doi Y. (2017). The global epidemiology of carbapenemase-producing
Enterobacteriaceae. Virulence. 8(4):460-469.

469
van Duin D, Kaye KS, Neuner EA, et al. (2013). Carbapenem-resistant
Enterobacteriaceae: a review of treatment and outcomes. Diagn Microbiol Infect Dis.
75(2):115-120.
van Duin D. (2017). Carbapenem-resistant Enterobacteriaceae: What we know and
what we need to know. Virulence. 8(4):379-382.
van Loon K, Voor In 't Holt AF, Vos MC. (2017). A Systematic Review and Meta-
analyses of the Clinical Epidemiology of Carbapenem-Resistant Enterobacteriaceae.
Antimicrob Agents Chemother. 62(1):e01730-17.
van Schaik W. (2015). The human gut resistome. Philos Trans R Soc Lond B Biol Sci.
370(1670):20140087.
Vanderhaeghen W, Dewulf J. (2017). Antimicrobial use and resistance in animals and
human beings. Lancet Planet Health. 1(8):e307-e308.
Villacís JE, Reyes JA, Castelán-Sánchez HG, et al. (2020). OXA-48 Carbapenemase
in Klebsiella pneumoniae Sequence Type 307 in Ecuador. Microorganisms. 8(3):435.
Viscoli C. (2016). Bloodstream Infections: The peak of the iceberg. Virulence.
7(3):248-251.
Voulgari E, Zarkotou O, Ranellou K, et al. (2013). Outbreak of OXA-48
carbapenemase-producing Klebsiella pneumoniae in Greece involving an ST11 clone.
J Antimicrob Chemother. 68(1):84-88.
Walia K, Madhumathi J, Veeraraghavan B, et al. (2019). Establishing Antimicrobial
Resistance Surveillance & Research Network in India: Journey so far. Indian J Med
Res. 149(2):164-179.
Walker BJ, Abeel T, Shea T, et al. (2014). Pilon: an integrated tool for comprehensive
microbial variant detection and genome assembly improvement. PLoS One.
9(11):e112963.
Walsh TR, Weeks J, Livermore DM, et al. (2011). Dissemination of NDM-1 positive
bacteria in the New Delhi environment and its implications for human health: an
environmental point prevalence study. Lancet Infect Dis. 11(5):355-362.

470
Walsh TR. (2010). Emerging carbapenemases: a global perspective. Int J Antimicrob
Agents. 36 Suppl 3:S8-S14.
Walsh TR. (2018). A one-health approach to antimicrobial resistance. Nat Microbiol.
3(8):854-855.
Wang C, Feng Y, Liu L, et al. (2020). Identification of novel mobile colistin resistance
gene mcr-10. Emerg Microbes Infect. 9(1):508-516.
Wang R, van Dorp L, Shaw LP, et al. (2018a). The global distribution and spread of
the mobilized colistin resistance gene mcr-1. Nat Commun. 9(1):1179.
Wang X, Li H, Zhao C, et al. (2014). Novel NDM-9 metallo-β-lactamase identified
from a ST107 Klebsiella pneumoniae strain isolated in China. Int J Antimicrob Agents.
44(1):90-91.
Wang X, Wang Y, Zhou Y, et al. (2018b). Emergence of a novel mobile colistin
resistance gene, mcr-8, in NDM-producing Klebsiella pneumoniae. Emerg Microbes
Infect. 7(1):122.
Wang X, Wang Y, Zhou Y, et al. (2019). Emergence of Colistin Resistance Gene mcr-
8 and Its Variant in Raoultella ornithinolytica. Front Microbiol. 10:228.
Wang Y, Tian GB, Zhang R, et al. (2017a). Prevalence, risk factors, outcomes, and
molecular epidemiology of mcr-1-positive Enterobacteriaceae in patients and healthy
adults from China: an epidemiological and clinical study. Lancet Infect Dis. 17(4):390-
399.
Wang Y, Tong MK, Chow KH, et al. (2018c). Occurrence of Highly Conjugative
IncX3 Epidemic Plasmid Carrying blaNDM in Enterobacteriaceae Isolates in
Geographically Widespread Areas. Front Microbiol. 9:2272.
Wang Y, Zhang R, Li J, et al. (2017b). Comprehensive resistome analysis reveals the
prevalence of NDM and MCR-1 in Chinese poultry production. Nat Microbiol.
2:16260.
Wawrzyniak P, Płucienniczak G, Bartosik D. (2017). The Different Faces of Rolling-
Circle Replication and Its Multifunctional Initiator Proteins. Front Microbiol. 8:2353.

471
Weber RE, Pietsch M, Frühauf A, et al. (2019). IS26-Mediated Transfer of blaNDM-
1 as the Main Route of Resistance Transmission During a Polyclonal, Multispecies
Outbreak in a German Hospital. Front Microbiol. 10:2817.
White RD. (2013). Recommended NICU design standards and the physical
environment of the NICU. J Perinatol. 33 Suppl 1:S1.
WHO. (2015). Bangladesh National Health Accounts, an overview on the public and
private expenditures in health sector. Accessed on 01 December 2020.
http://www.searo.who.int/bangladesh/bnha/en/.
WHO. (2015). Global action plan on antimicrobial resistance. Accessed on 01 March
2020. https://www.who.int/antimicrobial-resistance/publications/global-action-
plan/en/.
WHO. (2017). WHO publishes list of bacteria for which new antibiotics are urgently
needed. Accessed on 01 March 2020. https://www.who.int/news/item/27-02-2017-
who-publishes-list-of-bacteria-for-which-new-antibiotics-are-urgently-needed.
WHO. (2018). Accessed on 03 March 2020.
https://www.who.int/medicines/areas/rational_use/oms-amr-amc-report-2016-
2018/en/.
WHO. (2019). WHO releases the 2019 AWaRe Classification Antibiotics. Accessed
on 03 March 2020.
https://www.who.int/medicines/news/2019/WHO_releases2019AWaRe_classificatio
n_antibiotics/en/.
WHO. (2020a). Global Antimicrobial Resistance Surveillance System (GLASS).
Accessed on 03 March 2020. https://www.who.int/glass/en/.
WHO. (2020b). WHO Coronavirus Disease (COVID-19) Dashboard. Accessed on 01
December 2020. https://covid19.who.int/table.
WHO. (2020c). Cost effectiveness and strategic planning (WHO-CHOICE). South-
East Asian Region. Accessed on 01 December 2020.
https://www.who.int/choice/demography/seasian_region/en/.

472
WHO. (2020d). Global Health Workforce Alliance. Bangladesh. Accessed on 01
December 2020. https://www.who.int/workforcealliance/countries/bgd/en/.
WHO. (2020e). Infection prevention and control. Accessed on 03 March 2020.
https://www.who.int/teams/integrated-health-services/infection-prevention-control.
WHO-UNICEF JMP. (2020). Hygiene Baselines pre-COVID-19 UNICEF Regional
Office for South Asia. Accessed on 03 October 2020. www.washdata.org.
Wiener-Well Y, Segonds C, Mazuz B, et al. (2014). Successful outbreak investigation
of Burkholderia cepacia complex bacteremia in intensive care patients. Am J Infect
Control. 42:580-581.
Wikimedia Commons. (2020). Percentage of population served by different types of
sanitation systems. Accessed on 03 October 2020.
https://commons.wikimedia.org/wiki/File:Percentage_of_population_served_by_diff
erent_types_of_sanitation_systems.png.
Wikipedia. (2020a). Penicillin. Accessed on 03 October 2020.
https://en.wikipedia.org/wiki/Penicillin.
Wikipedia. (2020b). Sulfonamide (medicine). Accessed on 03 October 2020.
https://en.wikipedia.org/wiki/Sulfonamide_(medicine).
Wikipedia. (2020c). Daptomycin. Accessed on 03 October 2020.
https://en.wikipedia.org/wiki/Daptomycin.
Wikipedia. (2020d). South Asia. Accessed on 03 December 2020.
https://en.wikipedia.org/wiki/South_Asia.
Wikipedia. (2020e). Enterobacteriaceae. Accessed on 03 December 2020.
https://en.wikipedia.org/wiki/Enterobacteriaceae.
Wikipedia. (2020f). Burkholderia. Accessed on 03 December 2020.
https://en.wikipedia.org/wiki/Burkholderia.
Wikipedia. (2020g). Economy of Bangladesh. Accessed on 01 December 2020.
https://en.wikipedia.org/wiki/Economy_of_Bangladesh/.

473
Williamson DA, Sidjabat HE, Freeman JT, et al. (2012). Identification and molecular
characterisation of New Delhi metallo-β-lactamase-1 (NDM-1)- and NDM-6-
producing Enterobacteriaceae from New Zealand hospitals. Int J Antimicrob Agents.
39(6):529-533.
Wingett SW, Andrews S. (2018). FastQ Screen: A tool for multi-genome mapping and
quality control. F1000Res. 7:1338.
Wise MG, Estabrook MA, Sahm DF, et al. (2018). Prevalence of mcr-type genes
among colistin-resistant Enterobacteriaceae collected in 2014-2016 as part of the
INFORM global surveillance program. PLoS One. 13(4):e0195281.
Woodford N, Turton JF, Livermore DM. (2011). Multiresistant Gram-negative
bacteria: the role of high-risk clones in the dissemination of antibiotic resistance.
FEMS Microbiol Rev. 35(5):736-755.
Wrenn C, O'Brien D, Keating D, et al. (2014). Investigation of the first outbreak of
OXA-48-producing Klebsiella pneumoniae in Ireland. J Hosp Infect. 87(1):41-46.
Wu W, Feng Y, Tang G, et al. (2019). NDM Metallo-β-Lactamases and Their Bacterial
Producers in Health Care Settings. Clin Microbiol Rev. 32(2):e00115-18.
Wyres KL, Lam MMC, Holt KE. (2020). Population genomics of Klebsiella
pneumoniae. Nat Rev Microbiol. 18(6):344-359.
Xu J, He F. (2019). Characterization of a NDM-7 carbapenemase-producing
Escherichia coli ST410 clinical strain isolated from a urinary tract infection in China.
Infect Drug Resist. 12:1555-1564.
Yan J, Hill WF, Rehou S, et al. (2018). Sepsis criteria versus clinical diagnosis of
sepsis in burn patients: A validation of current sepsis scores. Surgery. 164:1241-1245.
Yang Q, Li M, Spiller OB, et al. (2017). Balancing mcr-1 expression and bacterial
survival is a delicate equilibrium between essential cellular defence mechanisms. Nat
Commun. 8(1):2054.

474
Yang X, Peng K, Zhang Y, et al. (2020). Characterization of a Novel mcr-8.2-Bearing
Plasmid in ST395 Klebsiella pneumoniae of Chicken Origin. Infect Drug Resist.
13:1781-1784.
Ye Y, Xu L, Han Y, et al. (2018). Mechanism for carbapenem resistance of clinical
Enterobacteriaceae isolates. Exp Ther MedJan. 15(1):1143-1149.
Yi L, Wang J, Gao Y, et al. (2017). mcr-1-Harboring Salmonella enterica Serovar
Typhimurium Sequence Type 34 in Pigs, China. Emerg Infect Dis. 23(2):291-295.
Yin D, Dong D, Li K, et al. (2017). Clonal Dissemination of OXA-232
Carbapenemase-Producing Klebsiella pneumoniae in Neonates. Antimicrob Agents
Chemother. 61(8):e00385-17.
Yong D, Toleman MA, Giske CG, et al. (2009). Characterization of a new metallo-
beta-lactamase gene, bla(NDM-1), and a novel erythromycin esterase gene carried on
a unique genetic structure in Klebsiella pneumoniae sequence type 14 from India.
Antimicrob Agents Chemother. 53(12):5046-5054.
Yoon EJ, Kang DY, Yang JW, et al. (2018). New Delhi Metallo-Beta-Lactamase-
Producing Enterobacteriaceae in South Korea Between 2010 and 2015. Front
Microbiol. 9:571.
Yousfi M, Mairi A, Bakour S, et al. (2015). First report of NDM-5-producing
Escherichia coli ST1284 isolated from dog in Bejaia, Algeria. New Microbes New
Infect. 8:17-18.
Yuan Y, Li Y, Wang G, et al. (2019). Coproduction Of MCR-9 And NDM-1 By
Colistin-Resistant Enterobacter hormaechei Isolated From Bloodstream Infection.
Infect Drug Resist. 12:2979-2985.
Zaffiri L, Gardner J, Toledo-Pereyra LH. (2012). History of antibiotics. From
salvarsan to cephalosporins. J Invest Surg. 25(2):67-77.
Zahar JR, Lucet JC, Timsit JF. (2014). Antimicrobial resistance in intensive care units.
Lancet Infect Dis. 14(1):3-5.

475
Zaidah AR, Mohammad NI, Suraiya S, et al. (2017). High burden of Carbapenem-
resistant Enterobacteriaceae (CRE) fecal carriage at a teaching hospital: cost-
effectiveness of screening in low-resource setting. Antimicrob Resist Infect Control.
6:42.
Zakeri B, Wright GD. (2008). Chemical biology of tetracycline antibiotics. Biochem
Cell Biol. 86(2):124-136.
Zhang F, Xie L, Wang X, et al. (2016). Further Spread of blaNDM-5 in
Enterobacteriaceae via IncX3 Plasmids in Shanghai, China. Front Microbiol. 7:424.
Zhang F, Zhu D, Xie L, et al. (2015). Molecular epidemiology of carbapenemase-
producing Escherichia coli and the prevalence of ST131 subclone H30 in Shanghai,
China. Eur J Clin Microbiol Infect Dis. 34(6):1263-1269.
Zhang X, Feng Y, Zhou W, et al. (2018). Cryptic transmission of ST405 Escherichia
coli carrying blaNDM-4 in hospital. Sci Rep. 8(1):390.
Zhu YQ, Zhao JY, Xu C, et al. (2016). Identification of an NDM-5-producing
Escherichia coli Sequence Type 167 in a Neonatal Patient in China. Sci Rep. 6:29934.
Zong Z. (2012). Discovery of bla(OXA-199), a chromosome-based bla(OXA-48)-like
variant, in Shewanella xiamenensis. PLoS One. 7(10):e48280.
Zou D, Huang Y, Zhao X, et al. (2015). A novel New Delhi metallo-β-lactamase
variant, NDM-14, isolated in a Chinese Hospital possesses increased enzymatic
activity against carbapenems. Antimicrob Agents Chemother. 59(4):2450-2453.
Zou H, Jia X, Liu H, et al. (2020). Emergence of NDM-5-Producing Escherichia coli
in a Teaching Hospital in Chongqing, China: IncF-Type Plasmids May Contribute to
the Prevalence of blaNDM-5. Front Microbiol. 11:334.
Zou H, Zhou Z, Xia H, et al. (2019). Characterization of Chromosome-Mediated
BlaOXA-894 in Shewanella xiamenensis Isolated from Pig Wastewater. Int J Environ
Res Public Health. 16(19):3768.
Zwietering MH, Jongenburger I, Rombouts FM, et al. (1990). Modeling of the
bacterial growth curve. Appl Environ Microbiol. 56(6):1875-1881.