A genomic approach to colon cancer risk stratification yields biologic insights into therapeutic...
8
Retraction and Corrections RETRACTION PROFILE Retraction for ‘‘Profile of Phillip Cohen,’’ by Carrie Arnold, which appeared in issue 12, March 24, 2009, of Proc Natl Acad Sci USA (106:4581–4583; first published March 17, 2009; 10.1073/pnas.0902168106). The editors wish to note that because of several factual and typographical errors we are retracting this article. A corrected version will be published in a subsequent issue. The PNAS editors deeply regret the errors. www.pnas.orgcgidoi10.1073pnas.0903490106 CORRECTIONS EVOLUTION Correction for ‘‘Origin, antiviral function and evidence for positive selection of the gammaretrovirus restriction gene Fv1 in the genus Mus,’’ by Yuhe Yan, Alicia Buckler-White, Kurt Wollenberg, and Christine A. Kozak, which appeared in issue 9, March 3, 2009, of Proc Natl Acad Sci USA (106:3259–3263; first published February 12, 2009; 10.1073pnas.0900181106). The authors note that due to a printer’s error, the database accession numbers in the footnote on page 3259 appeared incorrectly. The footnote ‘‘Data deposition: The sequences reported in this paper have been deposited in the GenBank database (accession nos. X97719, FJ603554, and X97720),’’ should instead have appeared as: ‘‘Data deposition: The se- quences reported in this paper have been deposited in the GenBank database (accession nos. FJ603554 –FJ603574).’’ Ad- ditionally, on page 3259, left column, the first line of the third full paragraph, ‘‘Fv1 was cloned and identified as a coopted ERV sequence that is related to the gag gene of MuERV-L (3, 4), a Class III (spumavirus-related) ERV transposit family that is transpositionally active in mice but has no known infectious virus counterparts,’’ should instead have appeared as ‘‘Fv1 was cloned and identified as a coopted ERV sequence that is related to the gag gene of MuERV-L (3, 4), a Class III (spumavirus-related) ERV family that is transpositionally active in mice but has no known infectious virus counterparts.’’ These errors do not affect the conclusions of the article. www.pnas.orgcgidoi10.1073pnas.0901885106 MEDICAL SCIENCES Correction for ‘‘A genomic approach to colon cancer risk stratification yields biologic insights into therapeutic opportu- nities,’’ by Katherine S. Garman, Chaitanya R. Acharya, Elena Edelman, Marian Grade, Jochen Gaedcke, Shivani Sud, William Barry, Anna Mae Diehl, Dawn Provenzale, Geoffrey S. Gins- burg, B. Michael Ghadimi, Thomas Ried, Joseph R. Nevins, Sayan Mukherjee, David Hsu, and Anil Potti, which appeared in issue 49, December 9, 2008, of Proc Natl Acad Sci USA (105:19432–19437; first published December 2, 2008; 10.1073 pnas.0806674105). The authors note that the term ‘‘prognostic score’’ should be substituted for the term ‘‘Recurrence Score,’’ which is a regis- tered trademark of Genomic Health and is not associated in any way with the authors or the article. The online version of the article has been corrected accordingly as of April 7, 2009. www.pnas.orgcgidoi10.1073pnas.0902004106 6878 PNAS April 21, 2009 vol. 106 no. 16 www.pnas.org
-
Upload
independent -
Category
Documents
-
view
1 -
download
0
Transcript of A genomic approach to colon cancer risk stratification yields biologic insights into therapeutic...
Retraction and Corrections
RETRACTION
PROFILERetraction for ‘‘Profile of Phillip Cohen,’’ by Carrie Arnold,which appeared in issue 12, March 24, 2009, of Proc Natl AcadSci USA (106:4581–4583; first published March 17, 2009;10.1073/pnas.0902168106).
The editors wish to note that because of several factual andtypographical errors we are retracting this article. A correctedversion will be published in a subsequent issue. The PNASeditors deeply regret the errors.
www.pnas.org�cgi�doi�10.1073�pnas.0903490106
CORRECTIONS
EVOLUTIONCorrection for ‘‘Origin, antiviral function and evidence forpositive selection of the gammaretrovirus restriction gene Fv1 inthe genus Mus,’’ by Yuhe Yan, Alicia Buckler-White, KurtWollenberg, and Christine A. Kozak, which appeared in issue 9,March 3, 2009, of Proc Natl Acad Sci USA (106:3259–3263; firstpublished February 12, 2009; 10.1073�pnas.0900181106).
The authors note that due to a printer’s error, the databaseaccession numbers in the footnote on page 3259 appearedincorrectly. The footnote ‘‘Data deposition: The sequencesreported in this paper have been deposited in the GenBankdatabase (accession nos. X97719, FJ603554, and X97720),’’should instead have appeared as: ‘‘Data deposition: The se-quences reported in this paper have been deposited in theGenBank database (accession nos. FJ603554–FJ603574).’’ Ad-ditionally, on page 3259, left column, the first line of the third fullparagraph, ‘‘Fv1 was cloned and identified as a coopted ERVsequence that is related to the gag gene of MuERV-L (3, 4), aClass III (spumavirus-related) ERV transposit family that istranspositionally active in mice but has no known infectious viruscounterparts,’’ should instead have appeared as ‘‘Fv1 was clonedand identified as a coopted ERV sequence that is related to thegag gene of MuERV-L (3, 4), a Class III (spumavirus-related)ERV family that is transpositionally active in mice but has noknown infectious virus counterparts.’’ These errors do not affectthe conclusions of the article.
www.pnas.org�cgi�doi�10.1073�pnas.0901885106
MEDICAL SCIENCESCorrection for ‘‘A genomic approach to colon cancer riskstratification yields biologic insights into therapeutic opportu-nities,’’ by Katherine S. Garman, Chaitanya R. Acharya, ElenaEdelman, Marian Grade, Jochen Gaedcke, Shivani Sud, WilliamBarry, Anna Mae Diehl, Dawn Provenzale, Geoffrey S. Gins-burg, B. Michael Ghadimi, Thomas Ried, Joseph R. Nevins,Sayan Mukherjee, David Hsu, and Anil Potti, which appeared inissue 49, December 9, 2008, of Proc Natl Acad Sci USA(105:19432–19437; first published December 2, 2008; 10.1073�pnas.0806674105).
The authors note that the term ‘‘prognostic score’’ should besubstituted for the term ‘‘Recurrence Score,’’ which is a regis-tered trademark of Genomic Health and is not associated in anyway with the authors or the article. The online version of thearticle has been corrected accordingly as of April 7, 2009.
www.pnas.org�cgi�doi�10.1073�pnas.0902004106
6878 � PNAS � April 21, 2009 � vol. 106 � no. 16 www.pnas.org

Retraction
MEDICAL SCIENCESRetraction for “A genomic approach to colon cancer risk strat-ification yields biologic insights into therapeutic opportunities,”by Katherine S. Garman, Chaitanya R. Acharya, Elena Edelman,Marian Grade, Jochen Gaedcke, Shivani Sud, William Barry,Anna Mae Diehl, Dawn Provenzale, Geoffrey S. Ginsburg, B.Michael Ghadimi, Thomas Ried, Joseph R. Nevins, Sayan Mu-kherjee, David Hsu, and Anil Potti, which appeared in issue 49,December 9, 2008, of Proc Natl Acad Sci USA (105:19432–19437;first published December 2, 2008; 10.1073/pnas.0806674105).The authors wish to note the following: “We wish to retract
this article because we have been unable to reproduce certainkey experiments described in the paper regarding validation anduse of the colon cancer prognostic signature. This includes thevalidation performed with dataset E-MEXP-1224, as reported inFig. 2A, as well as the generation of prognostic scores for coloncancer cell lines, as reported in Fig. 4. Because these results arefundamental to the conclusions of the paper, the authors for-mally retract the paper. We deeply regret the impact of thisaction on the work of other investigators.”
Katherine S. GarmanChaitanya R. AcharyaElena EdelmanMarian GradeJochen GaedckeShivani SudWilliam BarryAnna Mae DiehlDawn ProvenzaleGeoffrey S. GinsburgB. Michael GhadimiThomas RiedJoseph R. NevinsSayan MukherjeeDavid HsuAnil Potti
www.pnas.org/cgi/doi/10.1073/pnas.1115170108
www.pnas.org PNAS | October 18, 2011 | vol. 108 | no. 42 | 17569
CORR
ECTION
A genomic approach to colon cancer riskstratification yields biologic insights intotherapeutic opportunitiesKatherine S. Garmana,b, Chaitanya R. Acharyaa, Elena Edelmana,c, Marian Graded, Jochen Gaedckee, Shivani Suda,William Barrya,c, Anna Mae Diehlb, Dawn Provenzaleb, Geoffrey S. Ginsburga, B. Michael Ghadimie, Thomas Riedd,Joseph R. Nevinsa, Sayan Mukherjeea,c, David Hsua,b, and Anil Pottia,b,1
aInstitute for Genome Sciences and Policy and Departments of bMedicine and cStatistical Science, Duke University, Durham, NC 27708; dNational CancerInstitute, Bethesda, MD 20892; and eDepartment of General and Visceral Surgery, University Medical Center, Georg-August-University, 37073 Gottingen,Germany
Edited by Brigid L. M. Hogan, Duke University Medical Center, Durham, NC, and approved October 14, 2008 (received for review July 16, 2008)
Gene expression profiles provide an opportunity to dissect the het-erogeneity of solid tumors, including colon cancer, to improve prog-nosis and predict response to therapies. Bayesian binary regressionmethods were used to generate a signature of disease recurrence inpatients with resected early stage colon cancer validated in anindependent cohort. A 50-gene signature was developed that effec-tively distinguished early stage colon cancer patients with a low orhigh risk of disease recurrence. RT-PCR analysis of the 50-genesignature validated 9 of the top 10 differentially expressed genes.When applied to two independent validation cohorts of 55 and 73patients, the 50-gene model accurately predicted recurrence. Stan-dard Kaplan–Meier survival analysis confirmed the prognostic accu-racy (P < 0.01, log rank), as did multivariate Cox proportional hazardmodels. We tested potential targeted therapeutic options for patientsat high risk for disease recurrence and found a clinically importantrelationship between sensitivity to celecoxib, LY-294002 (PI3kinaseinhibitor), retinol, and sulindac in colon cancer cell lines expressing thepoor prognostic phenotype (P < 0.01, t test), which performed betterthan standard chemotherapy (5-FU and oxaliplatin). We present agenomic strategy in early stage colon cancer to identify patients athighest risk of recurrence. An ability to move beyond current stagingby refining the estimation of prognosis in early stage colon canceralso has implications for individualized therapy.
biology � personalized medicine � progression
Colorectal cancer is the second leading cause of cancer death inthe United States today. In 2008, in the United States alone, it
is estimated that 148,810 people will be newly diagnosed withcolorectal cancer, making this an important cause of morbidity andmortality. Of newly diagnosed cases, �40% are diagnosed while thecancer is in an early or localized stage (1).
The genetic description of colorectal cancer, as first detailed inthe classic studies of Vogelstein and Fearon, and Vogelstein et al.(2, 3), laid the foundation for the concept of accumulation ofgenetic alterations as tumors progress to a malignant state. Thesestudies emphasized the concept of heterogeneity, an idea more fullydescribed in recent studies that comprehensively monitored thecancer genome for genomic imbalances and associated gene ex-pression changes (4, 5). Genome-wide expression analysis thusoffers the opportunity to characterize and treat tumors in anindividualized fashion.
Since the initial description by Wood (6), the clinical stagingsystem in colon cancer has been the standard for determiningprognosis. Developing improved prognostic tools is important asthe current array of clinical predictors provides only broad catego-rizations of risk and insufficiently characterizes the relative risk forrecurrence in individual patients (7). As an example, patients withearly stage colon cancer (stages I and II) are usually consideredcured after surgical resection, despite the fact that 15–20% of thesepatients develop disease recurrence (8, 9). In breast and lung cancer
(10–12), genomic approaches have been shown to direct the care ofcancer patients. We hypothesize that an improved understanding ofpatterns of gene expression in individual patients could lead tobetter, more directed care of patients with early stage colon cancer.
ResultsGene Expression Signature of Recurrence in Early Stage Colon Cancer.There is a significant unmet need to further characterize and treatearly stage colonic tumors in an individualized fashion. This isparticularly relevant for patients diagnosed with early stage coloncancer (stages I and II) who are usually considered cured aftersurgical resection, despite the fact that up to 20% of these patientslater develop disease recurrence (8, 9). Because the current tumor,node, metastasis (TNM) staging system is relatively imprecise, ouraim was to develop a prognostic model using gene-expression datato predict disease recurrence after curative surgery (a clinicallyrelevant phenotype) in early-stage colon cancer. Toward this end,as detailed in Fig. 1A, we developed a prognostic model using acollection of 52 samples representing clinical stage I and stage IIdisease, for which gene expression data were available. Two inde-pendent datasets of 55 and 73 samples were used for validation ofthe prognostic model. The clinical characteristics of the patients aredetailed in supporting information (SI) Table S1.
Using Bayesian regression methods (12–14), we identified geneexpression profiles, or metagenes, constituted by 50 genes thatpredict the risk of recurrence in an initial ‘training’ cohort of 52patients with early-stage colon cancer (Fig. 1B Top). The predictiveaccuracy of the 50-gene model was assessed by using leave-one-out-cross-validation in which the analysis is performed repeatedlywith one sample removed each time and the probability of recur-rence is predicted for that sample. The 50-gene model predictedrecurrence with an accuracy of 90.3% (Fig. S1) with a significantdifference in the predicted probability of recurrence or ‘prognosticscores’ between the two groups (P � 0.001) (Fig. 1B Middle).Furthermore, a receiver operator characteristic (ROC) analysisrevealed that the area under the curve was 0.94 (P � 0.0001) andestablished the optimal cut-point for the prognostic score at 0.76
Author contributions: K.S.G., E.E., J.R.N., S.M., and A.P. designed research; K.S.G., E.E.,C.R.A., S.S., S.M., and A.P. performed research; M.G., J.G., A.M.D., D.P., G.S.G., B.M.G., T.R.,and D.H. contributed new reagents/analytic tools; K.S.G., E.E., C.R.A., W.B., S.M., and A.P.analyzed data; and K.S.G., E.E., C.R.A., and A.P. wrote the paper.
The authors declare no conflict of interest.
This article is a PNAS Direct Submission.
Freely available online through the PNAS open access option.
1To whom correspondence should be addressed at: Box 3382, 101 Science Drive, DukeInstitute for Genome Sciences and Policy, Duke University, Durham, NC 27708. E-mail:[email protected].
This article contains supporting information online at www.pnas.org/cgi/content/full/0806674105/DCSupplemental.
© 2008 by The National Academy of Sciences of the USA
19432–19437 � PNAS � December 9, 2008 � vol. 105 � no. 49 www.pnas.org�cgi�doi�10.1073�pnas.0806674105
See Retraction Published October 3, 2011
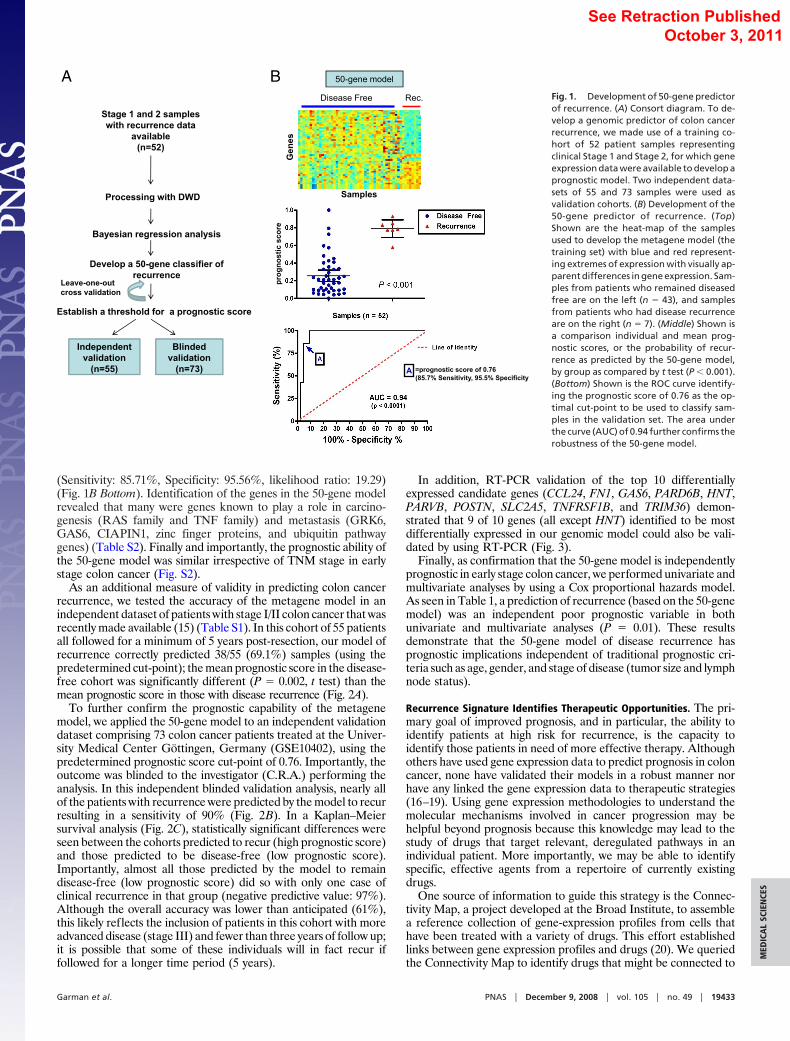
(Sensitivity: 85.71%, Specificity: 95.56%, likelihood ratio: 19.29)(Fig. 1B Bottom). Identification of the genes in the 50-gene modelrevealed that many were genes known to play a role in carcino-genesis (RAS family and TNF family) and metastasis (GRK6,GAS6, CIAPIN1, zinc finger proteins, and ubiquitin pathwaygenes) (Table S2). Finally and importantly, the prognostic ability ofthe 50-gene model was similar irrespective of TNM stage in earlystage colon cancer (Fig. S2).
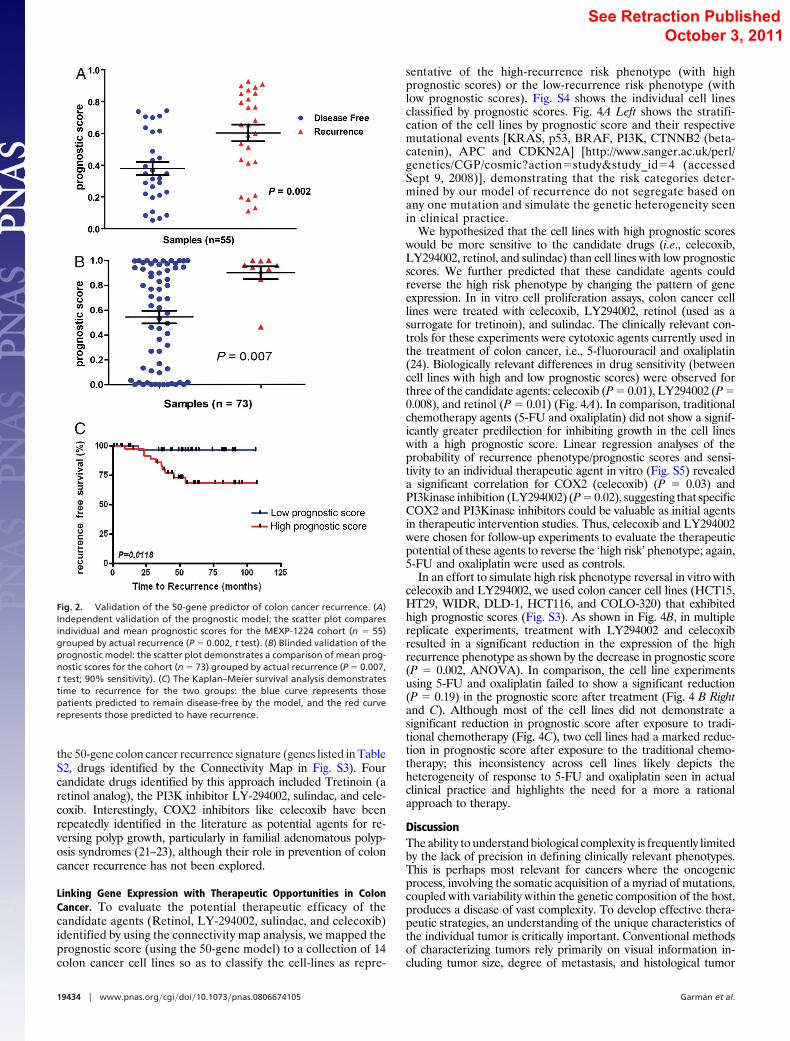
As an additional measure of validity in predicting colon cancerrecurrence, we tested the accuracy of the metagene model in anindependent dataset of patients with stage I/II colon cancer that wasrecently made available (15) (Table S1). In this cohort of 55 patientsall followed for a minimum of 5 years post-resection, our model ofrecurrence correctly predicted 38/55 (69.1%) samples (using thepredetermined cut-point); the mean prognostic score in the disease-free cohort was significantly different (P � 0.002, t test) than themean prognostic score in those with disease recurrence (Fig. 2A).
To further confirm the prognostic capability of the metagenemodel, we applied the 50-gene model to an independent validationdataset comprising 73 colon cancer patients treated at the Univer-sity Medical Center Gottingen, Germany (GSE10402), using thepredetermined prognostic score cut-point of 0.76. Importantly, theoutcome was blinded to the investigator (C.R.A.) performing theanalysis. In this independent blinded validation analysis, nearly allof the patients with recurrence were predicted by the model to recurresulting in a sensitivity of 90% (Fig. 2B). In a Kaplan–Meiersurvival analysis (Fig. 2C), statistically significant differences wereseen between the cohorts predicted to recur (high prognostic score)and those predicted to be disease-free (low prognostic score).Importantly, almost all those predicted by the model to remaindisease-free (low prognostic score) did so with only one case ofclinical recurrence in that group (negative predictive value: 97%).Although the overall accuracy was lower than anticipated (61%),this likely reflects the inclusion of patients in this cohort with moreadvanced disease (stage III) and fewer than three years of follow up;it is possible that some of these individuals will in fact recur iffollowed for a longer time period (5 years).
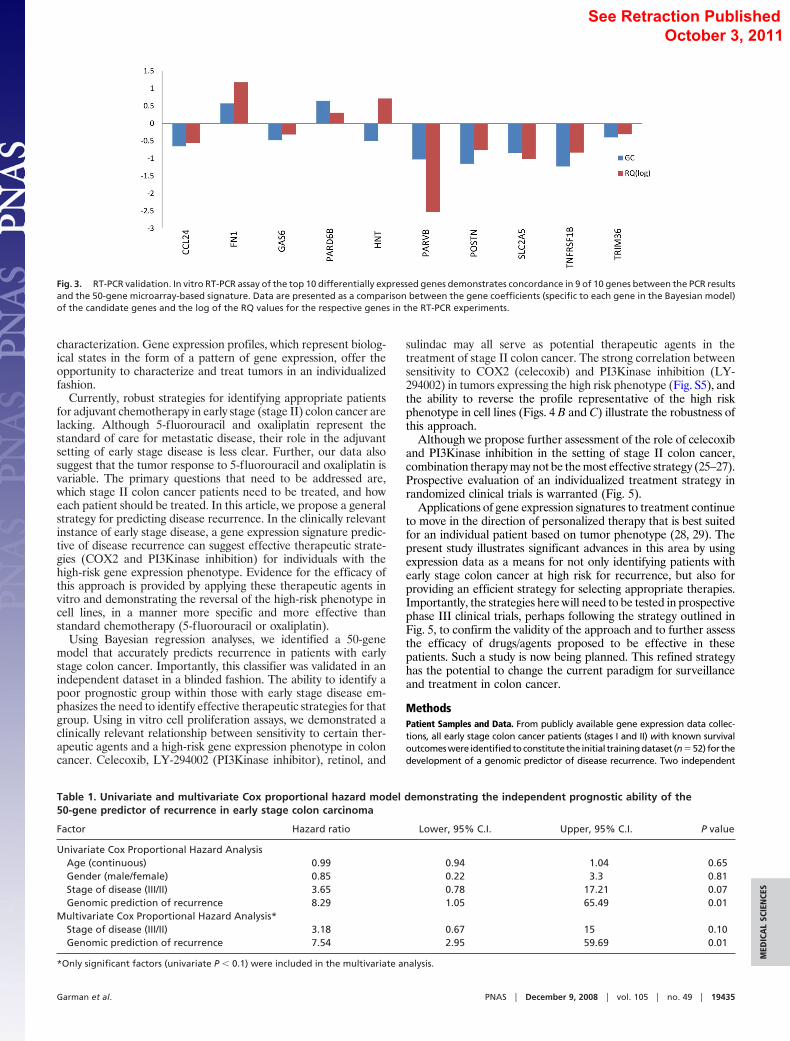
In addition, RT-PCR validation of the top 10 differentiallyexpressed candidate genes (CCL24, FN1, GAS6, PARD6B, HNT,PARVB, POSTN, SLC2A5, TNFRSF1B, and TRIM36) demon-strated that 9 of 10 genes (all except HNT) identified to be mostdifferentially expressed in our genomic model could also be vali-dated by using RT-PCR (Fig. 3).
Finally, as confirmation that the 50-gene model is independentlyprognostic in early stage colon cancer, we performed univariate andmultivariate analyses by using a Cox proportional hazards model.As seen in Table 1, a prediction of recurrence (based on the 50-genemodel) was an independent poor prognostic variable in bothunivariate and multivariate analyses (P � 0.01). These resultsdemonstrate that the 50-gene model of disease recurrence hasprognostic implications independent of traditional prognostic cri-teria such as age, gender, and stage of disease (tumor size and lymphnode status).
Recurrence Signature Identifies Therapeutic Opportunities. The pri-mary goal of improved prognosis, and in particular, the ability toidentify patients at high risk for recurrence, is the capacity toidentify those patients in need of more effective therapy. Althoughothers have used gene expression data to predict prognosis in coloncancer, none have validated their models in a robust manner norhave any linked the gene expression data to therapeutic strategies(16–19). Using gene expression methodologies to understand themolecular mechanisms involved in cancer progression may behelpful beyond prognosis because this knowledge may lead to thestudy of drugs that target relevant, deregulated pathways in anindividual patient. More importantly, we may be able to identifyspecific, effective agents from a repertoire of currently existingdrugs.
One source of information to guide this strategy is the Connec-tivity Map, a project developed at the Broad Institute, to assemblea reference collection of gene-expression profiles from cells thathave been treated with a variety of drugs. This effort establishedlinks between gene expression profiles and drugs (20). We queriedthe Connectivity Map to identify drugs that might be connected to
Processing with DWD
Bayesian regression analysis
Develop a 50-gene classifier of recurrence
Stage 1 and 2 samples with recurrence data
available(n=52)
Blindedvalidation
(n=73)
Leave-one-outcross validation
Establish a threshold for a prognostic score
Samples
Gen
es
Disease Free Rec.
50-gene model
Independentvalidation
(n=55)
A B
prog
nost
ic s
core
A =prognostic score of 0.76(85.7% Sensitivity, 95.5% Specificity
Fig. 1. Development of 50-gene predictorof recurrence. (A) Consort diagram. To de-velop a genomic predictor of colon cancerrecurrence, we made use of a training co-hort of 52 patient samples representingclinical Stage 1 and Stage 2, for which geneexpression data were available to develop aprognostic model. Two independent data-sets of 55 and 73 samples were used asvalidation cohorts. (B) Development of the50-gene predictor of recurrence. (Top)Shown are the heat-map of the samplesused to develop the metagene model (thetraining set) with blue and red represent-ing extremes of expression with visually ap-parent differences in gene expression. Sam-ples from patients who remained diseasedfree are on the left (n � 43), and samplesfrom patients who had disease recurrenceare on the right (n � 7). (Middle) Shown isa comparison individual and mean prog-nostic scores, or the probability of recur-rence as predicted by the 50-gene model,by group as compared by t test (P � 0.001).(Bottom) Shown is the ROC curve identify-ing the prognostic score of 0.76 as the op-timal cut-point to be used to classify sam-ples in the validation set. The area underthe curve (AUC) of 0.94 further confirms therobustness of the 50-gene model.
Garman et al. PNAS � December 9, 2008 � vol. 105 � no. 49 � 19433
MED
ICA
LSC
IEN
CES
See Retraction Published October 3, 2011
the 50-gene colon cancer recurrence signature (genes listed in TableS2, drugs identified by the Connectivity Map in Fig. S3). Fourcandidate drugs identified by this approach included Tretinoin (aretinol analog), the PI3K inhibitor LY-294002, sulindac, and cele-coxib. Interestingly, COX2 inhibitors like celecoxib have beenrepeatedly identified in the literature as potential agents for re-versing polyp growth, particularly in familial adenomatous polyp-osis syndromes (21–23), although their role in prevention of coloncancer recurrence has not been explored.
Linking Gene Expression with Therapeutic Opportunities in ColonCancer. To evaluate the potential therapeutic efficacy of thecandidate agents (Retinol, LY-294002, sulindac, and celecoxib)identified by using the connectivity map analysis, we mapped theprognostic score (using the 50-gene model) to a collection of 14colon cancer cell lines so as to classify the cell-lines as repre-
sentative of the high-recurrence risk phenotype (with highprognostic scores) or the low-recurrence risk phenotype (withlow prognostic scores). Fig. S4 shows the individual cell linesclassified by prognostic scores. Fig. 4A Left shows the stratifi-cation of the cell lines by prognostic score and their respectivemutational events [KRAS, p53, BRAF, PI3K, CTNNB2 (beta-catenin), APC and CDKN2A] [http://www.sanger.ac.uk/perl/genetics/CGP/cosmic?action�study&study_id�4 (accessedSept 9, 2008)], demonstrating that the risk categories deter-mined by our model of recurrence do not segregate based onany one mutation and simulate the genetic heterogeneity seenin clinical practice.
We hypothesized that the cell lines with high prognostic scoreswould be more sensitive to the candidate drugs (i.e., celecoxib,LY294002, retinol, and sulindac) than cell lines with low prognosticscores. We further predicted that these candidate agents couldreverse the high risk phenotype by changing the pattern of geneexpression. In in vitro cell proliferation assays, colon cancer celllines were treated with celecoxib, LY294002, retinol (used as asurrogate for tretinoin), and sulindac. The clinically relevant con-trols for these experiments were cytotoxic agents currently used inthe treatment of colon cancer, i.e., 5-fluorouracil and oxaliplatin(24). Biologically relevant differences in drug sensitivity (betweencell lines with high and low prognostic scores) were observed forthree of the candidate agents: celecoxib (P � 0.01), LY294002 (P �0.008), and retinol (P � 0.01) (Fig. 4A). In comparison, traditionalchemotherapy agents (5-FU and oxaliplatin) did not show a signif-icantly greater predilection for inhibiting growth in the cell lineswith a high prognostic score. Linear regression analyses of theprobability of recurrence phenotype/prognostic scores and sensi-tivity to an individual therapeutic agent in vitro (Fig. S5) revealeda significant correlation for COX2 (celecoxib) (P � 0.03) andPI3kinase inhibition (LY294002) (P � 0.02), suggesting that specificCOX2 and PI3Kinase inhibitors could be valuable as initial agentsin therapeutic intervention studies. Thus, celecoxib and LY294002were chosen for follow-up experiments to evaluate the therapeuticpotential of these agents to reverse the ‘high risk’ phenotype; again,5-FU and oxaliplatin were used as controls.
In an effort to simulate high risk phenotype reversal in vitro withcelecoxib and LY294002, we used colon cancer cell lines (HCT15,HT29, WIDR, DLD-1, HCT116, and COLO-320) that exhibitedhigh prognostic scores (Fig. S3). As shown in Fig. 4B, in multiplereplicate experiments, treatment with LY294002 and celecoxibresulted in a significant reduction in the expression of the highrecurrence phenotype as shown by the decrease in prognostic score(P � 0.002, ANOVA). In comparison, the cell line experimentsusing 5-FU and oxaliplatin failed to show a significant reduction(P � 0.19) in the prognostic score after treatment (Fig. 4 B Rightand C). Although most of the cell lines did not demonstrate asignificant reduction in prognostic score after exposure to tradi-tional chemotherapy (Fig. 4C), two cell lines had a marked reduc-tion in prognostic score after exposure to the traditional chemo-therapy; this inconsistency across cell lines likely depicts theheterogeneity of response to 5-FU and oxaliplatin seen in actualclinical practice and highlights the need for a more a rationalapproach to therapy.
DiscussionThe ability to understand biological complexity is frequently limitedby the lack of precision in defining clinically relevant phenotypes.This is perhaps most relevant for cancers where the oncogenicprocess, involving the somatic acquisition of a myriad of mutations,coupled with variability within the genetic composition of the host,produces a disease of vast complexity. To develop effective thera-peutic strategies, an understanding of the unique characteristics ofthe individual tumor is critically important. Conventional methodsof characterizing tumors rely primarily on visual information in-cluding tumor size, degree of metastasis, and histological tumor
Fig. 2. Validation of the 50-gene predictor of colon cancer recurrence. (A)Independent validation of the prognostic model: the scatter plot comparesindividual and mean prognostic scores for the MEXP-1224 cohort (n � 55)grouped by actual recurrence (P � 0.002, t test). (B) Blinded validation of theprognostic model: the scatter plot demonstrates a comparison of mean prog-nostic scores for the cohort (n � 73) grouped by actual recurrence (P � 0.007,t test; 90% sensitivity). (C) The Kaplan–Meier survival analysis demonstratestime to recurrence for the two groups: the blue curve represents thosepatients predicted to remain disease-free by the model, and the red curverepresents those predicted to have recurrence.
19434 � www.pnas.org�cgi�doi�10.1073�pnas.0806674105 Garman et al.
See Retraction Published October 3, 2011
characterization. Gene expression profiles, which represent biolog-ical states in the form of a pattern of gene expression, offer theopportunity to characterize and treat tumors in an individualizedfashion.
Currently, robust strategies for identifying appropriate patientsfor adjuvant chemotherapy in early stage (stage II) colon cancer arelacking. Although 5-fluorouracil and oxaliplatin represent thestandard of care for metastatic disease, their role in the adjuvantsetting of early stage disease is less clear. Further, our data alsosuggest that the tumor response to 5-fluorouracil and oxaliplatin isvariable. The primary questions that need to be addressed are,which stage II colon cancer patients need to be treated, and howeach patient should be treated. In this article, we propose a generalstrategy for predicting disease recurrence. In the clinically relevantinstance of early stage disease, a gene expression signature predic-tive of disease recurrence can suggest effective therapeutic strate-gies (COX2 and PI3Kinase inhibition) for individuals with thehigh-risk gene expression phenotype. Evidence for the efficacy ofthis approach is provided by applying these therapeutic agents invitro and demonstrating the reversal of the high-risk phenotype incell lines, in a manner more specific and more effective thanstandard chemotherapy (5-fluorouracil or oxaliplatin).
Using Bayesian regression analyses, we identified a 50-genemodel that accurately predicts recurrence in patients with earlystage colon cancer. Importantly, this classifier was validated in anindependent dataset in a blinded fashion. The ability to identify apoor prognostic group within those with early stage disease em-phasizes the need to identify effective therapeutic strategies for thatgroup. Using in vitro cell proliferation assays, we demonstrated aclinically relevant relationship between sensitivity to certain ther-apeutic agents and a high-risk gene expression phenotype in coloncancer. Celecoxib, LY-294002 (PI3Kinase inhibitor), retinol, and
sulindac may all serve as potential therapeutic agents in thetreatment of stage II colon cancer. The strong correlation betweensensitivity to COX2 (celecoxib) and PI3Kinase inhibition (LY-294002) in tumors expressing the high risk phenotype (Fig. S5), andthe ability to reverse the profile representative of the high riskphenotype in cell lines (Figs. 4 B and C) illustrate the robustness ofthis approach.
Although we propose further assessment of the role of celecoxiband PI3Kinase inhibition in the setting of stage II colon cancer,combination therapy may not be the most effective strategy (25–27).Prospective evaluation of an individualized treatment strategy inrandomized clinical trials is warranted (Fig. 5).
Applications of gene expression signatures to treatment continueto move in the direction of personalized therapy that is best suitedfor an individual patient based on tumor phenotype (28, 29). Thepresent study illustrates significant advances in this area by usingexpression data as a means for not only identifying patients withearly stage colon cancer at high risk for recurrence, but also forproviding an efficient strategy for selecting appropriate therapies.Importantly, the strategies here will need to be tested in prospectivephase III clinical trials, perhaps following the strategy outlined inFig. 5, to confirm the validity of the approach and to further assessthe efficacy of drugs/agents proposed to be effective in thesepatients. Such a study is now being planned. This refined strategyhas the potential to change the current paradigm for surveillanceand treatment in colon cancer.
MethodsPatient Samples and Data. From publicly available gene expression data collec-tions, all early stage colon cancer patients (stages I and II) with known survivaloutcomes were identified to constitute the initial training dataset (n � 52) for thedevelopment of a genomic predictor of disease recurrence. Two independent
Fig. 3. RT-PCR validation. In vitro RT-PCR assay of the top 10 differentially expressed genes demonstrates concordance in 9 of 10 genes between the PCR resultsand the 50-gene microarray-based signature. Data are presented as a comparison between the gene coefficients (specific to each gene in the Bayesian model)of the candidate genes and the log of the RQ values for the respective genes in the RT-PCR experiments.
Table 1. Univariate and multivariate Cox proportional hazard model demonstrating the independent prognostic ability of the50-gene predictor of recurrence in early stage colon carcinoma
Factor Hazard ratio Lower, 95% C.I. Upper, 95% C.I. P value
Univariate Cox Proportional Hazard AnalysisAge (continuous) 0.99 0.94 1.04 0.65Gender (male/female) 0.85 0.22 3.3 0.81Stage of disease (III/II) 3.65 0.78 17.21 0.07Genomic prediction of recurrence 8.29 1.05 65.49 0.01
Multivariate Cox Proportional Hazard Analysis*Stage of disease (III/II) 3.18 0.67 15 0.10Genomic prediction of recurrence 7.54 2.95 59.69 0.01
*Only significant factors (univariate P � 0.1) were included in the multivariate analysis.
Garman et al. PNAS � December 9, 2008 � vol. 105 � no. 49 � 19435
MED
ICA
LSC
IEN
CES
See Retraction Published , 2011 October 3

datasets:anAffymetrixdataset (n�55E-MEXP-1224), representingpatientswithprimarily stage II colon cancer and another plasmode blinded dataset (n � 73,GSE10402) representing consecutive patients with early stage colon cancertreated at the University Medical Center Gottingen, Germany, were used toindependently validate the 50-gene predictor. Table S1 describes the demo-graphic features of the training and validation cohorts.
Metagene Predictor of Recurrence. To develop a metagene predictor for coloncancer recurrence in early stage disease, a training dataset was created by usingsamples from stage I and II colon cancer that were linked with clinical outcomes(GSE5206 and GSE2138) (n � 52). These datasets were merged by using theDistance-Weighted Discrimination (DWD) (30) (https://genome.unc.edu/pubsup/dwd/) method to eliminate any systematic biases. The merged dataset wasfiltered,and91geneswithsignificantrecurrenceeffects (P�0.001)wereselected
for further analyses. Using Bayesian binary regression methodologies previouslydescribed (12, 13), a metagene predictor of recurrence was developed. A probitfunction enabled us to generate a probability of recurrence for each sample,referred to as the ‘‘prognostic score.’’ An optimal threshold prognostic scorevalue of 0.76 was chosen based on a receiver operated characteristic (ROC)analysis, and was used as the predefined ‘cut-point’, to dichotomize samples intolow risk (prognostic score �0.76) and high risk (prognostic score � 0.76). Theability of the metagene model was investigated in the two independent datasetsin a blinded fashion. For the dataset (n � 73) with available time to relapse,standard Kaplan–Meier curves and their significance levels (log-rank test) weregenerated by using GraphPad Prism version 4.03 for Windows (GraphPad). Uni-variate and multivariate analyses were performed by using Cox proportionalhazard models, and P values reported are based on likelihood ratio tests, andanalyses are performed by using the statistical package R (31). See SI Methods forcomplete details.
Fig. 4. In vitro validation of candidate drug sensitivity. (A) The left panel shows the mutational events seen in the cohort of colon cancer cell lines, sorted basedon the probability of recurrence based on the 50-gene model (blue: lowest risk score, red: highest risk score). (Right) Shown are the results of experimentsperformed using 14 colon cancer cell lines. Gene expression data from these cancer cell lines was used to classify them according to prognostic scores (blue: lowrisk, red: high risk), using the 50-gene model. The cell lines were then treated with specific drugs identified as candidate agents by using a connectivity mapanalysis of the 50-gene model. For each drug, sensitivity as measured by cell death using cell proliferation assays is shown in the figure and compared betweengroups. The cell lines with high prognostic scores appear to be more sensitive to drug than those with low prognostic scores, demonstrating that treatmentmodalities involving the use of celecoxib, LY294002 (PI3Kinase inhibitor) and retinol may be beneficial in patients with colon cancer who are at high risk fordisease recurrence. (B) (Left) Shown is the change in prognostic score after exposure to PI3Kinase (LY294002) and COX2 inhibition (celecoxib). An ANOVA analysisdemonstrates a significant difference between pretreatment and post treatment (with LY294002, celecoxib) prognostic scores in colon cancer cell lines. (Right)Traditional chemotherapy agents (5-FU and oxaliplatin) do not show a significantly greater predilection for inhibiting growth in the cell lines with a highprognostic score. (C) A histogram shows that all of the cell lines demonstrate a decrease in prognostic score post treatment, indicating a reversal of the high-riskphenotype after exposure to LY294002 or celecoxib, with DLD-1 showing the greatest sensitivity to reversal and COLO-320 showing the least effect. Incomparison, the effect of 5-FU and oxaliplatin is inconsistent across the cell lines.
19436 � www.pnas.org�cgi�doi�10.1073�pnas.0806674105 Garman et al.
See Retraction Published , 2011 October 3

Colon Cancer Cell Lines. To classify cell lines, we measured genome-wide expres-sion in the 14 colon cancer cell lines available through the ATCC, using theAffymetrix U133A Plus 2.0 GeneChip. Complete details of methods involved ingrowth of the colon cancer cell lines and the in vitro drug sensitivity assays are
available in the SI Methods. Total RNA was extracted from the cells with RNeasykits (Qiagen). The RNA quality was assessed with the use of a bioanalyzer (Agilent2100 model). Hybridization targets were prepared from the total RNA accordingto standard Affymetrix protocols. ‘Prognostic scores’ were generated for the celllines and the predefined (from the training set) threshold value was then used todichotomize the cell lines into low and high risk phenotypes. In vitro cell prolif-eration assays were used to demonstrate the mean percentage cell death whenthe highest concentration of drug (celecoxib, retinol, LY294002, sulindac, 5-flu-orouracil, and oxaliplatin) was used in each cell line as the basis for comparisonsof sensitivity, between high and low recurrence risk groups, for each of the drugstested. Finally, in the cell lines with high prognostic scores, after treatment withtargeted drugs, gene expression profiles were reassessed to determine if thehigh-risk phenotype had been reversed.
Real-Time RT-PCR Validation. The top 10 differentially expressed genes fromamong the 50-gene model were chosen for further validation by using real-time PCR. Briefly, the methods involved Taqman (Applied Biosystems) customarrays. Total RNA extracted from each of the seven high risk and seven low riskcell lines are reverse transcribed into cDNA by using random primers. For PCR,Taqman (Applied Biosystems) gene expression assays (including 18s used asthe manufacturing control) were used and run on the 7900HT Fast Real-TimePCR System with the Low Density Array Block (Applied Biosystems). After PCR,gene targets were analyzed by assessing Ct values after normalization toGAPDH to compare quantitative expression values.
Further details on patient selection, RNA extraction, preprocessing of geneexpression data, and statistical analysis are available as SI Methods.
ACKNOWLEDGMENTS. This work was supported in part by the Emilene BrownCancer Research Fund, the intramural research program of the NationalInstitutes of Health, National Cancer Institute, and by the Deutsche For-schungsgemeinschaft KFO 179. A.P. receives funding from National CancerInstitute, American Cancer Society, Department of Defense, Jimmy V. Foun-dation, and American Association for Cancer Research.
1. Jemal A, et al. (2008) Cancer Statistics, 2008. CA Cancer J Clin 58:71–96.2. Fearon ER, Vogelstein B (1990) A genetic model for colorectal tumorigenesis. Cell
61:759–767.3. Vogelstein B, et al. (1988) Genetic alterations during colorectal-tumor development.
N Engl J Med 319:525–532.4. Sjoblom T, et al. (2006) The consensus coding sequences of human breast and colorectal
cancers. Science 314:268–274.5. Wood LD, et al. (2007) The genomic landscapes of human breast and colorectal cancers.
Science 318:1108–1113.6. Wood DA (1971) Clinical staging and end results classification: TNM system of clinical
classification as applicable to carcinoma of the colon and rectum. Cancer 28:109–114.7. Rosell R, et al. (1997) Reduced survival in patients with stage-I non-small-cell lung
cancer associated with DNA-replication errors. Int J Cancer 74:330–334.8. Andre T, et al. (2007) Phase III study comparing a semimonthly with a monthly regimen
of fluorouracil and leucovorin as adjuvant treatment for stage II and III colon cancerpatients: Final results of GERCOR C96.1. J Clin Oncol 25:3732–3738.
9. Ho SB, et al. (2004) Quantification of colorectal cancer micrometastases in lymph nodesby nested and real-time reverse transcriptase-PCR analysis for carcinoembryonic anti-gen. Clin Cancer Res 10:5777–5784.
10. Bild AH, et al. (2006) Oncogenic pathway signatures in human cancers as a guide totargeted therapies. Nature 439:353–357.
11. Huang E, et al. (2003) Gene expression predictors of breast cancer outcomes. Lancet361:1590–1596.
12. Potti A, et al. (2006) A genomic strategy to refine prognosis in early-stage non-small-cell lung cancer. N Engl J Med 355:570–580.
13. Pittman J, et al. (2004) Integrated modeling of clinical and gene expression informa-tion for personalized prediction of disease outcomes. Proc Natl Acad Sci USA 101:8431–8436.
14. Pittman J, Huang E, Nevins J, Wang Q, West M (2004) Bayesian analysis of binaryprediction tree models for retrospectively sampled outcomes. Biostatistics 5:587–601.
15. Lin YH, et al. (2007) Multiple gene expression classifiers from different array platformspredict poor prognosis of colorectal cancer. Clin Cancer Res 13:498–507.
16. Bandres E, et al. (2007) A gene signature of 8 genes could identify the risk of recurrenceand progression in Dukes’ B colon cancer patients. Oncol Rep 17:1089–1094.
17. Barrier A, et al. (2006) Stage II colon cancer prognosis prediction by tumor geneexpression profiling. J Clin Oncol 24:4685–4691.
18. Del Rio M, et al. (2007) Gene expression signature in advanced colorectal cancerpatients select drugs and response for the use of leucovorin, fluorouracil, and irino-tecan. J Clin Oncol 25:773–780.
19. Wang Y, et al. (2004) Gene expression profiles and molecular markers to predictrecurrence of Dukes’ B colon cancer. J Clin Oncol 22:1564–1571.
20. Lamb J, et al. (2006) The Connectivity Map: Using gene-expression signatures toconnect small molecules, genes, and disease. Science 313:1929–1935.
21. Arber N, et al. (2006) Celecoxib for the prevention of colorectal adenomatous polyps.N Engl J Med 355:885–895.
22. Bertagnolli MM, et al. (2006) Celecoxib for the prevention of sporadic colorectaladenomas. N Engl J Med 355:873–884.
23. Rostom A, et al. (2007) Nonsteroidal anti-inflammatory drugs and cyclooxygenase-2inhibitors for primary prevention of colorectal cancer: A systematic review preparedfor the U.S. Preventive Services Task Force. Ann Intern Med 146:376–389.
24. Kuebler JP, et al. (2007) Oxaliplatin combined with weekly bolus fluorouracil andleucovorin as surgical adjuvant chemotherapy for stage II and III colon cancer: Resultsfrom NSABP C-07. J Clin Oncol 25:2198–2204.
25. Kohne CH, et al. (2008) Irinotecan combined with infusional 5-fluorouracil/folinic acidor capecitabine plus celecoxib or placebo in the first-line treatment of patients withmetastatic colorectal cancer. EORTC study 40015. Ann Oncol 19:920–926.
26. El-Rayes BF, et al. (2008) Phase-II study of dose attenuated schedule of irinotecan,capecitabine, and celecoxib in advanced colorectal cancer. Cancer Chemother Phar-macol 61:283–289.
27. Gradilone A, et al. (2008) Celecoxib upregulates multidrug resistance proteins in coloncancer: Lack of synergy with standard chemotherapy. Curr Cancer Drug Targets8:414–420.
28. Perou CM, et al. (2000) Molecular portraits of human breast tumours. Nature 406:747–752.
29. Ramaswamy S (2004) Translating cancer genomics into clinical oncology. N Engl J Med350:1814–1816.
30. Benito M, et al. (2004) Adjustment of systematic microarray data biases. Bioinformatics20:105–114.
31. Ihaka R, Gentleman R (1996) R: A language for data analysis and graphics. J CompuGraph Stat 5:299–314.
32. Johnson WE, Li C, Rabinovic A (2007) Adjusting batch effects in microarray expressiondata by using empirical Bayes methods. Biostatistics 8:118–127.
Stage I/II colon carcinoma
Surgical resectionGene expression analysis
Assessment of recurrence riskbased on 50-gene model
Low Risk High Risk
Adjuvant Therapy+/- Celecoxib+/- PI3Kinase inhibition
Observation
+/ PI3Kinase inhibition
Fig. 5. Clinical application of the 50-gene predictor of early-stage coloncancer recurrence. The schema of a proposed clinical trial that would furthervalidate the prognostic ability of the 50-gene predictor in patients with stageII colon cancer, first identifying low risk patients and then those with highprognostic scores receive adjuvant chemoprevention.
Garman et al. PNAS � December 9, 2008 � vol. 105 � no. 49 � 19437
MED
ICA
LSC
IEN
CES
See Retraction Published , 2011 October 3