Plastic frontal pole cortex structure related to individual ...
Upload
independentCategory
view
0download
0
A Genome-Wide Analysis of Populations from EuropeanRussia Reveals a New Pole of Genetic Diversity inNorthern EuropeAndrey V. Khrunin1*, Denis V. Khokhrin1, Irina N. Filippova1, Tonu Esko2,3,4, Mari Nelis2,4,5,
Natalia A. Bebyakova6, Natalia L. Bolotova7, Janis Klovins8, Liene Nikitina-Zake8, Karola Rehnstrom9,10,
Samuli Ripatti9,10, Stefan Schreiber11, Andre Franke12, Milan Macek13, Veronika Krulisova13,
Jan Lubinski14, Andres Metspalu2,3,4, Svetlana A. Limborska1
1 Department of Molecular Bases of Human Genetics, Institute of Molecular Genetics, Russian Academy of Sciences, Moscow, Russia, 2 Estonian Genome Center, University
of Tartu, Tartu, Estonia, 3 Department of Biotechnology, Institute of Molecular and Cell Biology, University of Tartu, Tartu, Estonia, 4 Estonian Biocentre, Tartu, Estonia,
5 Department of Genetic Medicine and Development, University of Geneva Medical School, Geneva, Switzerland, 6 Deparment of Medical Biology and Genetics, Northern
State Medical University, Archangelsk, Russia, 7 Deparment of Ecology and Zoology, Vologda State Pedagogical University, Vologda, Russia, 8 Latvian Biomedical Research
and Study Centre, Riga, Latvia, 9 Institute for Molecular Medicine Finland, University of Helsinki, Helsinki, Finland, 10 Wellcome Trust Sanger Institiute, Hinxton, United
Kingdom, 11 Department of Internal Medicine I, Popgen Biobank, Christian-Albrechts-University, Kiel, Germany, 12 Institute of Clinical Molecular Biology, Christian-
Albrechts University, Kiel, Germany, 13 Department of Biology and Medical Genetics, University Hospital Motol and Second School of Medicine, Charles University Prague,
Prague, Czech Republic, 14 Pomeranian Medical University, Szczecin, Poland
Abstract
Several studies examined the fine-scale structure of human genetic variation in Europe. However, the European setsanalyzed represent mainly northern, western, central, and southern Europe. Here, we report an analysis of approximately166,000 single nucleotide polymorphisms in populations from eastern (northeastern) Europe: four Russian populations fromEuropean Russia, and three populations from the northernmost Finno-Ugric ethnicities (Veps and two contrast groups ofKomi people). These were compared with several reference European samples, including Finns, Estonians, Latvians, Poles,Czechs, Germans, and Italians. The results obtained demonstrated genetic heterogeneity of populations living in the regionstudied. Russians from the central part of European Russia (Tver, Murom, and Kursk) exhibited similarities with populationsfrom central–eastern Europe, and were distant from Russian sample from the northern Russia (Mezen district, Archangelskregion). Komi samples, especially Izhemski Komi, were significantly different from all other populations studied. These canbe considered as a second pole of genetic diversity in northern Europe (in addition to the pole, occupied by Finns), as theyhad a distinct ancestry component. Russians from Mezen and the Finnic-speaking Veps were positioned between the twopoles, but differed from each other in the proportions of Komi and Finnic ancestries. In general, our data provides a morecomplete genetic map of Europe accounting for the diversity in its most eastern (northeastern) populations.
Citation: Khrunin AV, Khokhrin DV, Filippova IN, Esko T, Nelis M, et al. (2013) A Genome-Wide Analysis of Populations from European Russia Reveals a New Pole ofGenetic Diversity in Northern Europe. PLoS ONE 8(3): e58552. doi:10.1371/journal.pone.0058552
Editor: Taras K. Oleksyk, Univerity of Puerto Rico at Mayaguez, United States of America
Received June 22, 2012; Accepted February 6, 2013; Published March 7, 2013
Copyright: � 2013 Khrunin et al. This is an open-access article distributed under the terms of the Creative Commons Attribution License, which permitsunrestricted use, distribution, and reproduction in any medium, provided the original author and source are credited.
Funding: This study was supported by grants from the Programs ‘Molecular and Cell Biology’ and ‘Fundamental Science for Medicine’ of the Russian Academy ofSciences; the Federal Support of Leading Scientific Schools (grant 4294.2012.4); Russian Basic Research Foundation and The Ministry of education and science ofRussian Federation (project 8805). EGCUT received financing by (ENGAGE, OPENGENE), targeted financing from Estonian Government SF0180142s08, EstonianResearch Roadmap through Estonian Ministry of Education and Research (3.2.0304.11-0312), Center of Excellence in Genomics (EXCEGEN) and Development Fundof University of Tartu (SP1GVARENG). MM was supported by CZ.2.16/3.1.00/24022, Institutional support for UH Motol (0064203) and by NT/13770-4 from theCzech Ministry of Health. The funders had no role in study design, data collection and analysis, decision to publish, or preparation of the manuscript.
Competing Interests: The authors have declared that no competing interests exist.
* E-mail: [email protected]
Introduction
Identifying and understanding patterns of genetic variation
within and between populations has long been the major focus of
studies in human population genetics. Over the last decade, our
ability to investigate population structure has been significantly
enhanced by the advances in high-throughput genotyping
technologies, as these allow simultaneous genotyping of hundreds
of thousands of polymorphic markers. Compared with the
previous methodology used in human population genetics, they
enabled a new level of accuracy and power without the constraint
of having to use only a few loci as a proxy for the entire genome
[1,2].
To date, there is a number of studies in which the fine-scale
structure of human genetic variation have been examined at a
global, continental, geographic region, single country, or even a
subpopulation level [3–11]. European ancestry is the best studied
of these aspects, for which the strongest genetic differentiation has
been found between the north and south of the continent. The
identified European population substructure correlated well with
geography [4–6,12]. Although these studies included many
population samples, they mainly represented northern, western,
central, and southern Europe, while populations from Eastern
PLOS ONE | www.plosone.org 1 March 2013 | Volume 8 | Issue 3 | e58552

Europe, particularly from the European part of Russia, were less
represented. The region is inhabited by ethnic Russians as well as
different indigenous Finno-Ugric groups. In this study, we report
an analysis of 165872 single nucleotide polymorphisms (SNPs) in
four Russian populations from European Russia, as well as in
populations from two of the northernmost Finno-Ugric ethnic
groups: Veps and Komi.
Russians are the largest ethnic group among the European
populations: more than 80 million individuals live in an area that
covers more than a third of continental Europe [13]. A recent
study of genetic diversity in Europe performed by Nelis et al. [5]
resulted in a genetic map of the continent that had a triangular
structure and showed that Russians were forming one of its
vertexes, together with Polish and Baltic samples. However, the
Russian population included in that study originated from a single
region of the European part of Russia (Tver), even though, in the
context of existing genetic data (i.e., Y-chromosome and several
autosomal polymorphisms) [14–16], European Russians could be
subdivided into at least two groups: central–southern and northern
Russians.
In order to study genetic structure of the European Russians in
greater detail, we combined genome-wide SNP data from the Tver
sample mentioned above with the genotypes of three new Russian
samples from southern (Kursk), eastern (Murom), and northern
(Mezen) regions of European Russia (Figure 1). Taking into
account the well-documented impact of Finno-Ugric communities
on the ethnogenesis of Russians [17], the genotypes of Veps and
Komi were also included in our analysis. An additional reason of
involving of Veps and Komi was the scarcity of the data on fine-
scale genetic structure of Finno-Ugrians, which were mainly
presented by Finns, Saami, Estonians and Hungarians [2,5,11].
The Finnic-speaking Veps (also called Vepsians or Ves in ancient
times) are one of the oldest people of northern Europe that are still
found in the northwest Russia (Figure 1). Veps were first
mentioned in historical chronicles in the middle of the 6th century
[18]. It has been proposed that Veps tribes inhabited the territories
between Lakes Onega, Ladoga, and Beloe as early as the first half
of the first millennium [18]. In contrast to the scarce Veps, the
Komi (Komi-Zyryan) people, belonging to the different linguistic
branch of the Finno-Ugric family, the Permian branch, is more
numerous [13,19]. They occupy the northeastern-most location of
Europe and consist of several ethnographic groups, formed during
the 8th–19th centuries [19]. We included samples from two of the
geographically and socioeconomically distant Komi groups: the
Izhemski Komi and Priluzski Komi [20]. Finally, to place genetic
variation into the geographical context of the continental Europe,
we also included genotypic data from several reference populations
(Figure 1). The obtained results demonstrated similarity between
Russian populations from the central part of European Russia as
well as their proximity to the populations from central–eastern
Europe. They were also showed that genetic peculiarity of
Russians from northern Russia was resulted from their admixture
with Finno-Ugric populations among them a special impact should
be attributed to Komi people. It was manifested by a distinct
ancestry component differed Komi from all other European
populations studied.
Materials and Methods
SamplesThe used research protocols and forms of informed consent
have been approved by the Ethic Commission of the Medico-
Genetic Scientific Centre of the Russian Academy of Medical
Sciences (an approval was signed by the Head of the Ethic
Commission, Prof. L.F. Kurilo). Written informed consent for
participation was obtained from all subjects included in the study.
Blood samples were collected in EDTA-coated vacutainers after
recording genealogical information and obtaining informed
consent from each individual. Inclusion in the study required that
all individuals belong to the native ethnic group of the region
studied (i.e., they belonged to at least the third generation living in
a particular geographic region), were healthy and unrelated. DNA
was isolated from peripheral leukocytes according to standard
techniques using proteinase K treatment and phenol–chloroform
extraction [21]. Among the 615 individuals genotyped, 384 were
Russians from Archangelsk (Mezen district, n = 96), Vladimir
(Murom district, n = 96), Kursk (Kursk and Oktyabrsky districts,
n = 96), and Tver (Andreapol district, n = 96) regions; 81 were
Veps from the Babaevo district of Vologodsky region and 150
were Komi from the Izhemski (Izhemski Komi, n = 79) and
Priluzski (Priluzski Komi, n = 71) districts of the Komi Republic.
DNA samples were genotyped using different versions of
Illumina BeadChips: Human370CNV-Duo (Tver and Murom),
Human660W-Quad (Kursk), and HumanOmniExpress (Mezen,
Veps, and Komi), according to the manufacturer’s protocol
(Illumina Inc., USA). All samples were subjected to the same
quality control procedures using SNP and Variation Suite v.7.4.0
software package (Golden Helix, Bozeman, MT, USA). Only
SNPs from the 22 autosomal chromosomes with minor allele
frequency .1%, at Hardy–Weinberg equilibrium P.0.00001,
and with genotyping success rate .95% were accepted. Cryptic
relatedness was tested with the same software and from the
detected relative pairs (PI .0.2), only one was chosen for the
subsequent analyses at random. These steps resulted in the
retention of 165,872 autosomal SNPs in 603 individuals. To
investigate population genetic structure, we also included geno-
types of several populations described by Nelis et al. [5]: Finns
(samples from Helsinki (n = 100) and Kuusamo (n = 84), Estonians
(n = 100), Latvians (n = 95), Poles (n = 48), Czechs (n = 94), and
Germans (n = 100). In addition, we used free genotype data from
the HapMap 3 project (Italians from Tuscany (n = 88) and Han
Chinese from Beijing (n = 78) [22], and as well as from the human
genome diversity panel (HGDP, Russians (n = 25) [23]. After
filtering and removing all non-overlapping SNPs, a subset of
128,844 autosomal SNPs included genotypes available for all
populations (except Chinese). Because background linkage dis-
equilibrium (LD) can induce biases in principal component (PCA)
[24] and structure analyses [25], both marker sets –165,872 and
128,844 SNPs – were further thinned by excluding SNPs with
strong LD (pairwise genotypic correlation r2.0.2) using a window
of 200 SNPs (sliding the window by 25 SNPs at a time), which
yielded 59,318 and 52,808 SNPs, respectively.
Statistical AnalysisIn order to explore the genetic structure of the populations from
European Russia, several forms of analyses were performed. We
started with principal component analysis (PCA), a widely used
method for identifying and visualizing patterns of population
structure [26]. It was carried out using the Genotypic Principal
Components Analysis module of SNP and Variation Suite v.7.4.0.
To obtain non-overestimated eigenvectors [27], we first ran the
software using an outlier removal procedure, in which individuals
with values that were greater than six standard deviations from the
mean along any of the top 10 eigenvectors (principal components)
were identified and removed.
Genetic differentiation among the populations was quantified
by estimating pairwise Wright’s fixation indices (FST) using the
SMARTPCA program in the EIGENSOFT software package
Genetic Structure of European Russia
PLOS ONE | www.plosone.org 2 March 2013 | Volume 8 | Issue 3 | e58552

(v.4.2). Allele frequency differences in pairs of populations were
evaluated using trend tests. The resulting P values were subjected
to Bonferroni correction and the significance threshold was set at
P = 0.05 (Bonferroni-adjusted P was equal 3610–7).
Next, the population structure was examined using the
ADMIXTURE software package (v.1.22), which, in contrast to
PCA, implements a model-based clustering algorithm for estimat-
ing individual ancestry proportions [25]. This approach assumes
that the genome of each subject originates from K unknown
ancestral populations and estimates the proportions of the genome
derived from each of these populations. To identify putative
ancestral clusters within the samples, we ran the software assuming
Figure 1. Geographic locations of the populations analyzed. Key: Komi_Izh – Izhemski Komi, Komi_Pr – Priluzski Komi, Rus_Tv – Russians fromTver, Rus_Ku – Russians from Kursk, Rus_Mu – Russians from Murom, Rus_Me – Russians from Mezen, Finns_He – Finns from Helsinki, Finns_Ku –Finns from Kuusamo, Rus_HGDP – Russians from the Human Genome Diversity Panel.doi:10.1371/journal.pone.0058552.g001
Genetic Structure of European Russia
PLOS ONE | www.plosone.org 3 March 2013 | Volume 8 | Issue 3 | e58552

2–12 subpopulations on separate runs, using default parameters.
Each run was repeated at least three times to assess the stability of
the clustering patterns. To validate the results, a cross-validation
procedure was used [28].
Finally, to assess the potential effect of population demographics
on the population structure, the runs of homozygosity (ROH) and
the extent of pairwise linkage disequilibrium (LD) were examined
in the populations studied. ROH in the individuals were identified
using SNP and Variation Suite v.7.4.0. ROH was defined as a
sequence of at least 25 consecutive homozygous SNPs spanning at
least 1500 kb, with a maximum gap of 100 kb between adjacent
SNPs and a minimum density of 1 SNP per 50 kb [29]. Taking
into account the limited number of SNPs tested, we also used
another definition of ROH, in which the limitations on the
maximum distance between SNPs and the minimum density of
SNPs were excluded [30,31]. For comparative purposes the results
obtained were summarized by the calculation of means for the
number of ROH and the cumulative length of ROH per
individual for each population. The extent of pairwise linkage
disequilibrium (LD) was calculated as the genotype correlation (r2)
between marker pairs located less than 100 kb apart using the
PLINK v. 1.07.29 software [32]. A custom Perl script was applied
to categorize the r2 values according to intermarker distances (0–
5 kb, 5–10 kb, etc.) and a mean r2 was calculated for each
category.
Results
To probe population structure, we first analyzed our data sets
using a model-free ancestry PCA. In Figure 2 we plotted the first
two principal components (PC) that had the highest eigenvalues
(Figure S1). The plot demonstrated the presence of significant
differences between Russian populations from the central part of
the Russian Plain (i.e., populations from the Kursk, Murom, and
Tver regions), which formed a single cluster on the PC plot, and
the Russian population from the northern Archangelsk region
(Mezen Russians). Mezen Russians exhibited closer relationships
with the population of Veps. The samples of Izhemski and
Priluzski Komi were located distantly, not only from Veps and
Russians, but also from each other.
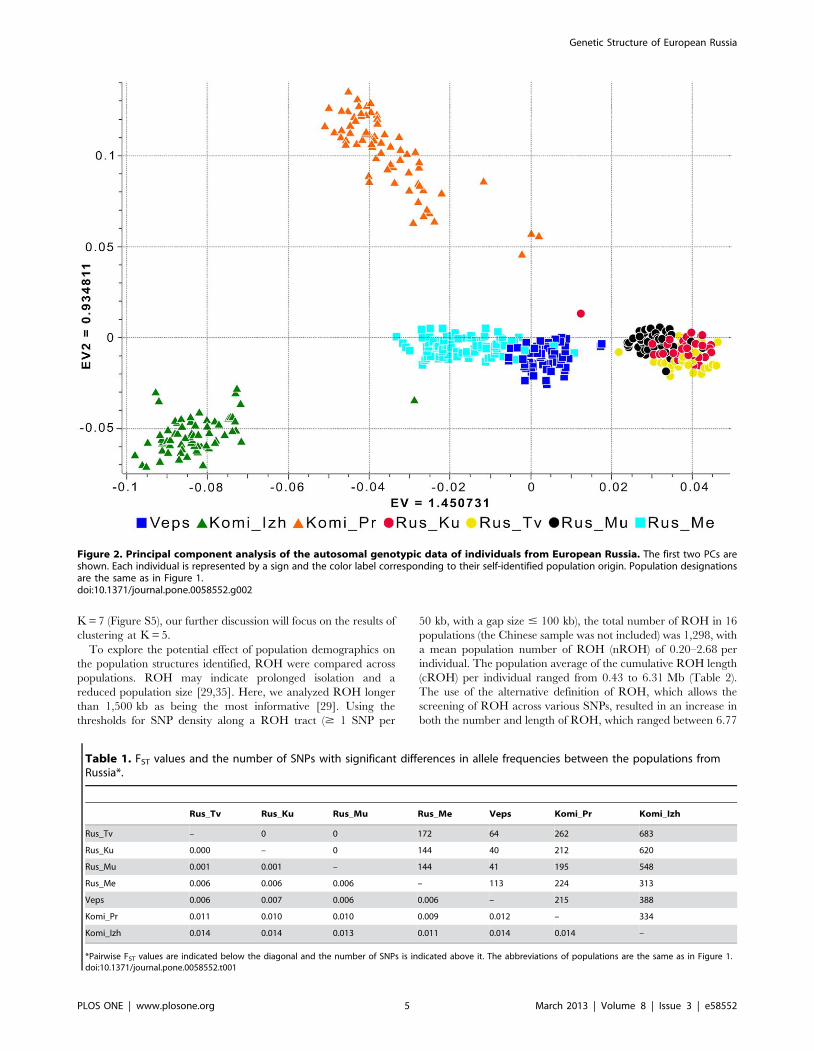
The lack of separation between populations from the Kursk,
Murom, and Tver regions in the PC plot was consistent with the
results of the assessment of population differentiation via the
calculation of pairwise FST statistics, in which FST values were not
greater than 0.001 (Table 1). The pairwise FST value between
these populations and Mezen Russians was 0.006. The same FST
value characterized the genetic relationships between Mezen
Russians and Veps. This finding correlated with the population
substructure observed in a plot of PC3 versus PC4, in which
Mezen Russians and Veps were clearly separated from each other
along PC4 (Figure S2). The highest pairwise FST estimates were
obtained from comparisons that included Komi samples.
None of the SNPs analyzed showed significant (P,3610–7)
differences in allele frequencies between populations from the
Kursk, Murom, and Tver regions, but 144 to 172 SNPs in each of
these populations differed from those of Russians from the Mezen
region. The highest number of SNPs with large differences in allele
frequencies was found between Izhemski Komi and populations
from the Kursk, Murom, and Tver regions (Table 1).
To understand the place of Russians, Komi, and Veps on the
genetic canvas of Europe, we combined their genotypes with the
genotypic data of several European populations (Finns, Estonians,
Latvians, Poles, Czechs and Germans, as well as Italians, who are
the most distant from our populations [5]). The results of PCA
performed on this extended number of samples are shown in
Figure 3, and may be described as having an ‘‘airplane’’-like
structure with the two wings represented by the Finnish (upper
left), and Komi (lower left) samples. A comparison of the resulting
genetic map, with the results presented by Nelis et al. [5], shows
that the populations from one of the vertices of the latter are now
located at the intersection formed by the two genetic ‘‘wings’’.
Russians from Murom, Kursk, and Tver were also placed at this
intersection. However, Russians from Mezen were located outside
this intersection. This population, together with the Finnic-
speaking Veps, was located in the space between the Finnish
and Komi ‘‘wings’’ on the chart. Taking into account the genetic
differences found for Mezen Russians among the other Russian
populations studied here, a Russian-only sample from the HGDP
set was also included in the analysis. The HGDP Russians were
also from the Archangelsk region (Kargopol district), but their
location is geographically closer to samples of populations from
central regions of European Russia (Figure 1). This is reflected in
their intermediate position on the PC plot (Figure 3) and lower
pairwise FST values (0.004 against Mezen and 0.002 against the
Russians from Kursk, Murom, and Tver regions) (Table S1,
Figure S3).
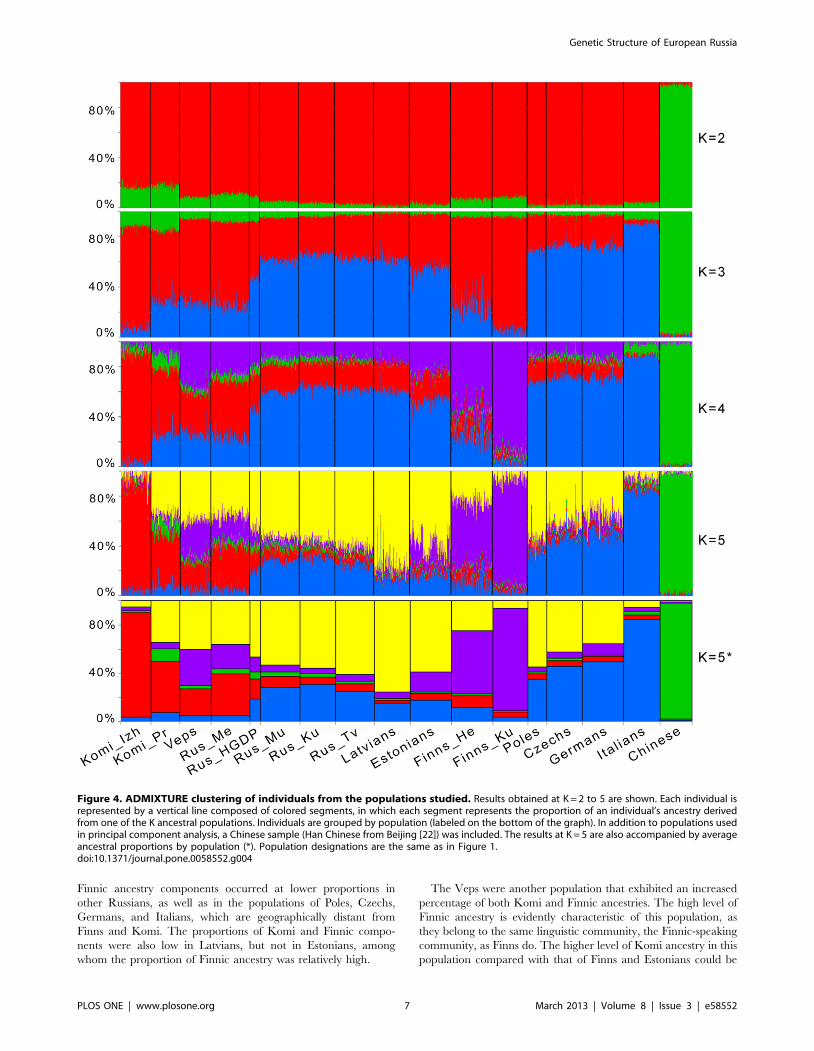
To further explore the population structure, a model-based
structure-like analysis using the ADMIXTURE software was
performed [25]. This analysis considers the genome of each
individual as having originated from several hypothetical ancestral
populations, the number of which (K) could be specified. In
addition to populations already used in PCA, a Chinese sample
was included to check for the potential presence of East Asian
admixture. We ran ADMIXTURE at K = 2 to 12. At K = 2, only
the population groups corresponding to Europe and Asia were
separated (Figure 4). Subtle variations detected in this analysis
were possibly due to the differences in the proportion of East Asian
ancestry, which was present in all European populations included
in this study, but had a higher average contribution in Komi
samples. Subcontinental patterns appeared at K = 3: one ancestry
component was the most abundant in Izhemski Komi and Finns
from Kuusamo (red) and a different component (blue) was at the
maximum in the Italian population (Figure 4). At K = 4, the red
component has diverged into two parts and distinguished Finns
(purple) from Komi (red). These results match closely with the
population structure revealed by the PCA, where they corre-
sponded to the genetic ‘‘wings’’ described in Figure 3. Mezen
Russians and Veps exhibited the highest proportions of both red
and purple ancestry components, differing only in their ratios,
which were the opposite of each other (henceforth, we will refer to
these crucial components as Komi and Finnic). Russians from the
HGDP are found at the intermediate position between Mezen and
other Russians, with lower proportions of Komi and Finnic
components and a higher proportion of the blue component, most
common in Italians, compared with the Mezen Russians. At
K = 5, a new component is found (yellow), with a high proportion
in most of the populations, with the exception of Izhemski Komi,
Finns, and Italians. The proportions of Komi and Finnic ancestries
were significantly reduced for many central and eastern European
populations, but remained high in Veps and Mezen Russians.
K = 5 was the observation threshold for subcontinental patterns of
genetic variation. At higher K values (K = 6 to 8), we observed the
subsequent separations of the populations of Priluzski Komi, Veps,
and Mezen Russians (Figure S4). The situation in which a new
ancestry component introduced for the next K value differentiated
only a single population was considered as being less informative
for the hierarchical comparisons of populations [33,34]. There-
fore, although the lowest cross-validation errors were observed at
Genetic Structure of European Russia
PLOS ONE | www.plosone.org 4 March 2013 | Volume 8 | Issue 3 | e58552
K = 7 (Figure S5), our further discussion will focus on the results of
clustering at K = 5.
To explore the potential effect of population demographics on
the population structures identified, ROH were compared across
populations. ROH may indicate prolonged isolation and a
reduced population size [29,35]. Here, we analyzed ROH longer
than 1,500 kb as being the most informative [29]. Using the
thresholds for SNP density along a ROH tract ($ 1 SNP per
50 kb, with a gap size # 100 kb), the total number of ROH in 16
populations (the Chinese sample was not included) was 1,298, with
a mean population number of ROH (nROH) of 0.20–2.68 per
individual. The population average of the cumulative ROH length
(cROH) per individual ranged from 0.43 to 6.31 Mb (Table 2).
The use of the alternative definition of ROH, which allows the
screening of ROH across various SNPs, resulted in an increase in
both the number and length of ROH, which ranged between 6.77
Figure 2. Principal component analysis of the autosomal genotypic data of individuals from European Russia. The first two PCs areshown. Each individual is represented by a sign and the color label corresponding to their self-identified population origin. Population designationsare the same as in Figure 1.doi:10.1371/journal.pone.0058552.g002
Table 1. FST values and the number of SNPs with significant differences in allele frequencies between the populations fromRussia*.
Rus_Tv Rus_Ku Rus_Mu Rus_Me Veps Komi_Pr Komi_Izh
Rus_Tv – 0 0 172 64 262 683
Rus_Ku 0.000 – 0 144 40 212 620
Rus_Mu 0.001 0.001 – 144 41 195 548
Rus_Me 0.006 0.006 0.006 – 113 224 313
Veps 0.006 0.007 0.006 0.006 – 215 388
Komi_Pr 0.011 0.010 0.010 0.009 0.012 – 334
Komi_Izh 0.014 0.014 0.013 0.011 0.014 0.014 –
*Pairwise FST values are indicated below the diagonal and the number of SNPs is indicated above it. The abbreviations of populations are the same as in Figure 1.doi:10.1371/journal.pone.0058552.t001
Genetic Structure of European Russia
PLOS ONE | www.plosone.org 5 March 2013 | Volume 8 | Issue 3 | e58552

and 17.21 Mb for nROH and 19.62 and 71.83 Mb for cROH.
Regardless of the variations in the analysis, the highest nROH and
cROH values were found in Izhemski Komi and in the Finnish
sample from Kuusamo. Intermediate estimates were observed in
Priluzski Komi, Veps, Finns from Helsinki, and Mezen Russians.
Other populations had lower nROH and cROH values. An
analysis of LD decay across genomes showed that Izhemski Komi
and Finns from Kuusamo also exhibited elevated LD (Figure S6).
Concomitantly, Priluzski Komi, Veps, Mezen Russians, and Finns
from Helsinki exhibited only slightly elevated LD and were more
comparable to the level observed in other European samples,
including the remaining Russian samples.
Discussion
In this study, we used genome-wide SNP data to analyze the
population genetic structure of Russians, Veps, and Komi. The
samples under investigation covered territories in the northeastern
Europe, not been included in previous analyses.
The results obtained revealed no substantial genetic stratifica-
tion within Russians from central–southern regions of European
Russia (i.e., samples from the Kursk, Murom, and Tver regions).
These three populations were clustered in close proximity to other
populations from central–eastern Europe. In contrast, a sample
from the northern Archangelsk region of Russia, Mezen Russians,
was clearly distant from those of Kursk, Murom, and Tver. These
data are in good agreement with earlier data obtained for
polymorphisms of the Y-chromosome [14,15,36,37] and several
autosomal loci [16,38,39]. It has been proposed that the genetic
specificity of northern Russians is because of admixture with
Finno-Ugric populations. The results of our ADMIXTURE
analysis suggest that, although they descended historically from
the Novgorod Russians, Mezen Russians admixed significantly
with both Finnic-speaking and Komi populations (Komi belongs
to the different linguistic branch of the Finno-Ugric family, the
Permian branch). The estimated proportion of Komi ancestry in
Mezen Russians was higher than the Finnic proportion. This
might be explained by either a more extensive or a later admixture
with Komi people. The existing anthropological data favor the
latter explanation, proposing a two-staged inclusion of Finno-
Ugric elements during the ethnogenesis of Northern Russians, in
which Komi elements were included last [40]. Both the Komi and
Figure 3. Principal component analysis of the combined autosomal genotypic data of individuals from Russia and seven Europeancountries (Finnland, Estonia, Latvia, Poland, Czech Republic, Germany [5] and Italia [22]). The first two PCs are shown. The color legendfor the predefined population labels is indicated within the plot. Population designations are the same as in Figure 1.doi:10.1371/journal.pone.0058552.g003
Genetic Structure of European Russia
PLOS ONE | www.plosone.org 6 March 2013 | Volume 8 | Issue 3 | e58552
Finnic ancestry components occurred at lower proportions in
other Russians, as well as in the populations of Poles, Czechs,
Germans, and Italians, which are geographically distant from
Finns and Komi. The proportions of Komi and Finnic compo-
nents were also low in Latvians, but not in Estonians, among
whom the proportion of Finnic ancestry was relatively high.
The Veps were another population that exhibited an increased
percentage of both Komi and Finnic ancestries. The high level of
Finnic ancestry is evidently characteristic of this population, as
they belong to the same linguistic community, the Finnic-speaking
community, as Finns do. The higher level of Komi ancestry in this
population compared with that of Finns and Estonians could be
Figure 4. ADMIXTURE clustering of individuals from the populations studied. Results obtained at K = 2 to 5 are shown. Each individual isrepresented by a vertical line composed of colored segments, in which each segment represents the proportion of an individual’s ancestry derivedfrom one of the K ancestral populations. Individuals are grouped by population (labeled on the bottom of the graph). In addition to populations usedin principal component analysis, a Chinese sample (Han Chinese from Beijing [22]) was included. The results at K = 5 are also accompanied by averageancestral proportions by population (*). Population designations are the same as in Figure 1.doi:10.1371/journal.pone.0058552.g004
Genetic Structure of European Russia
PLOS ONE | www.plosone.org 7 March 2013 | Volume 8 | Issue 3 | e58552

from admixture of Veps (Ves) with Komi (ancient Permians) in the
11th–14th centuries, when Komi lived westward of their current
territory and were the neighbors of Veps [41].
As for the Komi themselves, it has been proposed [42] that their
ethnogenesis was influenced by Finnic (e.g., Veps or ‘‘Chud’’) and
Russian people. The evaluation of the impact of Finnic people in
the context of Finnic ancestry revealed that the corresponding
component was not represented at a high proportion in the Komi
samples studied. The impact of Russians on the ethnogenesis of
Komi seems to be indicated by the yellow component. It was
abundant in Priluzski Komi (Figure 4), which is in good agreement
with the population history of this region – the basin of the Luza
river, where Russian people resided as far back as the 13th–14th
centuries [41]. In contrast to the Priluzski Komi, Komi component
was overrepresented in the ancestry of the Izhemski Komi,
accounting for more than 80% of the total ancestry (86% at
K = 5). Historical records show that the first mention of the
current center of Izhemski Komi, the Izhma village, occurred at
the end of the 16th century and that Izhma was founded mainly by
a group of Vimski Komi. Later, some Russian and Nenets families
joined them [41,43]. Nenets were not studied here. Although the
ADMIXTURE components depend on the samples included, a
minimal influence of the genetics of Nenets on the results of
clustering can be proposed. Here, we can refer to both the existing
data on the absence of (or very limited) genetic relationships
between the Nenets and the populations listed (including Komi)
[15,44,45], and the results of our analyses, which indicate the
genetic isolation of the Izhemski Komi. Evidence of the latter
stemmed both from pairwise FST values, which were the same
between Izhemski Komi and both Priluzski Komi, who shared the
same ethnic territory, and the geographically distant Finns from
Helsinki, and from their higher parameters of ROH estimated.
Both nROH and cROH have been shown to be higher in
northern Europeans compared to their southern counterparts,
which is consistent with the smaller effective population size and
lower population density in northern Europe [35]. In our study, all
northern samples (Mezen Russians, Veps, and both Komi samples)
were also characterized by higher nROH and cROH compared to
Russians from the central part of the Russian Plain and most of the
European populations tested. However, the Izhemski Komi had
the highest nROH and cROH, comparable to the values
calculated in the sample from Kuusamo, the known Finnish
isolate [46]. Similar to the Finns from Kuusamo, the Izhemski
Komi exhibited elevated LD. Taking into account the history of
the Komi people, the recorded genetic distinction of the Izhemski
Komi can be due to the increased stability of their community life
reinforced by the advanced type of traditional economy, including
reindeer breeding [47]. Reindeer breeding was adopted by this
group from the Nenets and currently differentiates the Izhemski
Komi from the other Komi groups.
In summary, we reported results of the first genome-wide
autosomal SNP-based study of the population structure of
European Russia, in which samples of Russians, Veps, and Komi
were analyzed. The data obtained strongly supports the results of
earlier genetic studies, based either on Y-chromosome polymor-
phisms or on a limited number of autosomal markers, and
suggested a genetic distinction of the northern Russian popula-
tions. Here, we were able to show clearly that this distinction was
attributed to admixture with Finno-Ugric populations. The second
important finding of our work was the context of that admixture.
Our data on Komi population structure led us to consider this
group as the second pole of genetic diversity in northern Europe
(in addition to the pole occupied by Finns). Although we
understand that the picture of the genetic structure of populations
from European Russia obtained is still sparse, we propose that
populations (ethnic groups) located between those two poles will
have different proportions of Komi and Finnic ancestries (e.g.,
Veps and Mezen Russians).
Supporting Information
Figure S1 Scree plots for eigenvalues of components 1to 25 from the principal component analysis: (A)individuals from Russia, (B) individuals from Russia and selected
samples from seven European countries.
(TIF)
Figure S2 Principal component analysis of the autoso-mal genotypic data of individuals from EuropeanRussia. PC3 and PC4 are shown. Population designations are
the same as in Figure 1.
(TIF)
Figure S3 Multidimensional scaling analysis (two di-mensions) of pairwise FST among 16 European popula-tions. The FST matrix from Table S1 was used as an input for the
analysis.
(TIF)
Figure S4 Results of ADMIXTURE clustering at K = 6 to8. The number of populations and their order are the same as at
Figure 4.
(TIF)
Figure S5 Cross-validation plot for 16 populations fromthe ADMIXTURE analysis. The plot displays the cross-
validation error versus K. The results of eight runs with different
random seeds are presented.
(TIF)
Figure S6 The decay of LD across the genomes of thepopulations from Russia and the European reference
Table 2. Summary of ROH statistics of 16 Europeanpopulations.
Population nROH cROH nROH* cROH*
Italians 0.19 0.4 6.27 19.64
Germans 0.2 0.43 6.77 19.62
Rus_Ku 0.28 0.65 7.88 24.4
Czechs 0.35 0.64 7.23 19.79
Rus_Mu 0.39 0.98 7.97 27.41
Rus_HGDP 0.44 0.83 8.92 25.15
Rus_Tv 0.49 1.12 9.34 28.05
Poles 0.51 1.11 8.51 27.43
Latvians 0.58 1.08 10.62 29.56
Estonians 0.61 1.45 9.95 33.26
Finns_He 1.13 2.32 12.85 41.47
Rus_Me 1.63 3.81 13.02 51.42
Veps 1.72 3.87 14.77 54.29
Komi_Ob 1.77 3.94 13.13 52.17
Finns_Ku 2.24 4.95 16.58 58.76
Komi_Izh 2.68 6.31 17.21 71.83
*ROH calculated without the thresholds for SNP density and length of the gapsalong a ROH tract. The abbreviations of populations are the same as in Figure 1.doi:10.1371/journal.pone.0058552.t002
Genetic Structure of European Russia
PLOS ONE | www.plosone.org 8 March 2013 | Volume 8 | Issue 3 | e58552

samples. The samples of Poles and Russians from the HGDP
were not included because of their smaller sample size. The Italian
sample was also excluded (its merging with other samples resulted
in a significant decrease in the number of SNPs).
(TIF)
Table S1 FST statistics calculated in pairs of allEuropean populations analyzed.(DOC)
Acknowledgments
We thank the volunteers from Russia who provided their blood samples.
We acknowledge the personnel of the Estonian Genome Center of the
University of Tartu (EGCUT), especially Mr. Viljo Soo. We also
acknowledge the Genome Database of Latvian population, Latvian
Biomedical Research and Study Centre for providing data and DNA
samples. Data analysis was carried out in part in the High Performance
Computing Center of University of Tartu.
Author Contributions
Conceived and designed the experiments: AVK SAL. Performed the
experiments: AVK DVK TE MN. Analyzed the data: AVK DVK INF
TE. Contributed reagents/materials/analysis tools: TE MN NAB NLB JK
LNZ KR SR SS AF MM VK JL AM SAL. Wrote the paper: AVK SAL.
References
1. Seldin MF, Shigeta R, Villoslada P, Selmi C, Tuomilehto J, et al. (2006)Gregersen PK. European population substructure: clustering of northern and
southern populations. PLoS Genet 2: e143.2. Salmela E, Lappalainen T, Fransson I, Andersen PM, Dahlman-Wright K, et al.
(2008) Genome-wide analysis of single nucleotide polymorphisms uncovers
population structure in Northern Europe. PLoS One 3: e3519.3. Li JZ, Absher DM, Tang H, Southwick AM, Casto AM, et al. (2008) Worldwide
Human Relationships Inferred from Genome-Wide Patterns of Variation.Science 319: 1100–4.
4. Novembre J, Johnson T, Bryc K, Kutalik Z, Boyko AR, et al. (2008) Genes
mirror geography within Europe. Nature 456: 98–101.5. Nelis M, Esko T, Magi R, Zimprich F, Zimprich A, et al. (2009) Genetic
Structure of Europeans: A View from the North–East. PLoS One 4: e5472.6. Tian C, Plenge RM, Ransom M, Lee A, Villoslada P, et al. (2008) Analysis and
application of European genetic substructure using 300 K SNP information.PLoS Genet 4: e4.
7. Price AL, Helgason A, Palsson S, Stefansson H, St Clair D, et al. (2009) PLoS
Genet 5: e1000505.8. Humphreys K, Grankvist A, Leu M, Hall P, Liu J, et al. (2011) The Genetic
Structure of the Swedish Population. PLoS One 6: e22547.9. O’Dushlaine CT, Morris D, Moskvina V, Kirov G, Consortium IS, et al. (2010)
Population structure and genome-wide patterns of variation in Ireland and
Britain. Eur J Hum Genet 18: 1248–54.10. Pistis G, Piras I, Pirastu N, Persico I, Sassu A, et al. (2009) High Differentiation
among Eight Villages in a Secluded Area of Sardinia Revealed by Genome-Wide High Density SNPs Analysis. PLoS One 4: e4654.
11. Huyghe JR, Fransen E, Hannula S, Van Laer L, Van Eyken E, et al. (2011) A
genome-wide analysis of population structure in the Finnish Saami withimplications for genetic association studies. Eur J Hum Genet 19: 347–52.
12. Lao O, Lu TT, Nothnagel M, Junge O, Freitag-Wolf S, et al. (2008) Correlationbetween genetic and geographic structure in Europe. Curr Biol 18: 1241–1248.
13. Russian Census. Available: http://www.gks.ru/free_doc/new_site/perepis2010/croc/perepis_itogi1612.htm. Accessed 2012 Dec 21.
14. Khrunin AV, Bebiakova NA, Ivanov VP, Solodilova MA, Limborskaia SA
(2005) Polymorphism of Y-chromosomal microsatellites in Russian populationsfrom the northern and southern Russia as exemplified by the populations of
Kursk and Arkhangel’sk Oblast. Genetika 41: 1125–31.15. Balanovsky O, Rootsi S, Pshenichnov A, Kivisild T, Churnosov M, et al. (2008)
Two sources of the Russian patrilineal heritage in their Eurasian context.
Am J Hum Genet 82: 236–250.16. Flegontova OV, Khrunin AV, Lylova OI, Tarskaia LA, Spitsyn VA, et al. (2009)
Haplotype frequencies at the DRD2 locus in populations of the East EuropeanPlain. BMC Genet 10: 62.
17. Alexeeva TI (Editor) (2002) Eastern Slavs. Anthropology and ethnic history.Moscow: Nauchny mir. 342 p.
18. Pimenov VV (1965) Veps: A study of ethnic history and genesis of culture.
Moscow-Leningrad: Nauka. 264 p.19. Savel’eva EA (Editor) (2001) Atlas of the Komi Republic. Moscow: Dizain.
Moscow: Inter’er Kartographiya. 552 p.20. Khrunin A, Verbenko D, Nikitina K, Limborska S (2007) Regional differences
in the genetic variability of Finno-Ugric speaking Komi populations. Am J Hum
Biol 19: 741–50.21. Milligan BG (1998) Total DNA isolation. In: Hoelzel AR, editor. Molecular
Genetic Analysis of Populations. Oxford: Oxford University Press. pp. 29–60.22. The HapMap 3 genotype data (R2 B356 FWD). Available for users of SNP and
Variation Suite software package (Golden Helix, Bozeman, MT, USA). Accessed2012 April 5.
23. The HGDP-CEPH diversity panel. Available: http://www.cephb.fr/en/hgdp/.
Accessed 2012 April 10.24. Patterson N, Price AL, Reich D (2006) Population Structure and Eigenanalysis.
PLoS Genet 2: e190.25. Alexander DH, Novembre J, Lange K (2009) Fast model-based estimation of
ancestry in unrelated individuals. Genome Res 19: 1655–64.
26. Biswas S, Scheinfeldt LB, Akey JM (2009) Genome-wide insights into the
patterns and determinants of fine-scale population structure in humans.Am J Hum Genet 84: 641–50.
27. Luca D, Ringquist S, Klei L, Lee AB, Gieger C, et al. (2008) On the use of
general control samples for genome-wide association studies: genetic matchinghighlights causal variants. Am J Hum Genet 82: 453–63.
28. Alexander DH, Lange K (2011) Enhancements to the ADMIXTURE algorithmfor individual ancestry estimation. BMC Bioinformatics 12: 246.
29. McQuillan R, Leutenegger AL, Abdel-Rahman R, Franklin CS, Pericic M, et al.
(2008) Runs of homozygosity in European populations. Am J Hum Genet 83359–372.
30. Spain SL, Cazier JB, CORGI Consortium, Houlston R, Carvajal-Carmona L, etal. (2009) Colorectal cancer risk is not associated with increased levels of
homozygosity in a population from the United Kingdom. Cancer Res 69: 7422–9.
31. Howrigan DP, Simonson MA, Keller MC (2011) Detecting autozygosity
through runs of homozygosity: a comparison of three autozygosity detection
algorithms. BMC Genomics 12: 460.
32. Purcell S, Neale B, Todd-Brown K et al. (2007) PLINK: a toolset for whole-genome association and population-based linkage analysis. Am J Human Genet
81: 559–75.
33. Behar DM, Yunusbayev B, Metspalu M, Metspalu E, Rosset S, et al. (2010) The
genome-wide structure of the Jewish people. Nature 466: 238–242.
34. Rasmussen M, Li Y, Lindgreen S, Pedersen JS, Albrechtsen A, et al. (2010)Ancient human genome sequence of an extinct Palaeo-Eskimo. Nature 463:
757–62.
35. Nothnagel M, Lu TT, Kayser M, Krawczak M (2010) Genomic and geographic
distribution of SNP defined runs of homozygosity in Europeans. Hum MolGenet 19: 2927–35.
36. Malyarchuk B, Derenko M, Grzybowski T, Lunkina A, Czarny J, et al. (2004)
Differentiation of Mitochondrial DNA and Y chromosomes in RussianPopulations. Hum Biol 76: 877–900.
37. Mirabal S, Regueiro M, Cadenas AM, Cavalli-Sforza LL, Underhill PA, et al.(2009) Y-chromosome distribution within the geo-linguistic landscape of
northwestern Russia. Eur J Hum Genet 17: 1260–73.
38. Khrunin AV, Khokhrin DV, Limborskaia SA (2008) Glutathione-S-transferasegene polymorphism in Russian populations of European Russia Genetika 47,
1565–8.
39. Verbenko DA, Slominsky PA, Spitsyn VA, Bebyakova NA, Khusnutdinova EK,
et al. (2006) Polymorphisms at locus D1S80 and other hypervariable regions inthe analysis of Eastern European ethnic group relationships. Ann Hum Biol 33:
570–84.
40. Alexeev VP (1969) The origin of nations of Eastern Europe. Moscow: Nauka.
324 p.
41. Zherebtsov LN (1982) Historical and cultural relationships of Komi with theirneighbors. Moscow: Nauka. 224 p.
42. Savel’eva EA (Editor) (1997) Archeology of Komi Republic. Moscow: DIK.
758 p.
43. Zherebtsov IL (1996) The population of Komi territory in the second half of
XVI century to the beginning of XVIII century. Yekaterinburg: UrO RAN.258 p.
44. Cavalli-Sforza L, Menozzi P, Piazza A (1996) The history and geography of
human genes. Princeton: Princeton University Press. 414 p.
45. Karafet TM, Osipova LP, Gubina MA, Posukh OL, Zegura SL, et al. (2002)
High levels of Y-chromosome differentiation among native Siberian populationsand the genetic signature of a boreal hunter-gatherer way of life. Hum Biol 74:
761–89.
46. Varilo T, Laan M, Hovatta I, Wiebe V, Terwilliger JD, et al. (2000) Linkage
disequilibrium in isolated populations: Finland and a young sub-population ofKuusamo. Eur J Hum Genet 8: 604–12.
47. Konakov ND, Kotov OV (1991) Ethnoarealic Komi group: the formation and
current ethnic and cultural status. Moscow: Nauka. 232 p.
Genetic Structure of European Russia
PLOS ONE | www.plosone.org 9 March 2013 | Volume 8 | Issue 3 | e58552
Copyright © 2022 FDOKUMEN