A general power equation for predicting bed load transport ...
22
A general power equation for predicting bed load transport rates in gravel bed rivers Jeffrey J. Barry Department of Civil Engineering, Ecohydraulics Research Group, University of Idaho, Boise, Idaho, USA Boise Cascade Corporation, Timberland Resources, Boise, Idaho, USA John M. Buffington and John G. King Rocky Mountain Research Station, Forest Service, U.S. Department of Agriculture, Boise, Idaho, USA Received 16 March 2004; revised 23 July 2004; accepted 18 August 2004; published 27 October 2004. [1] A variety of formulae has been developed to predict bed load transport in gravel bed rivers, ranging from simple regressions to complex multiparameter formulations. The ability to test these formulae across numerous field sites has, until recently, been hampered by a paucity of bed load transport data for gravel bed rivers. We use 2104 bed load transport observations in 24 gravel bed rivers in Idaho to assess the performance of eight different formulations of four bed load transport equations. Results show substantial differences in performance but no consistent relationship between formula performance and degree of calibration or complexity. However, formulae containing a transport threshold typically exhibit poor performance. Furthermore, we find that the transport data are best described by a simple power function of discharge. From this we propose a new bed load transport equation and identify channel and watershed characteristics that control the exponent and coefficient of the proposed power function. We find that the exponent is principally a factor of supply-related channel armoring (transport capacity in excess of sediment supply), whereas the coefficient is related to drainage area (a surrogate for absolute sediment supply). We evaluate the accuracy of the proposed power function at 17 independent test sites. INDEX TERMS: 1824 Hydrology: Geomorphology (1625); 1815 Hydrology: Erosion and sedimentation; 3210 Mathematical Geophysics: Modeling; KEYWORDS: gravel bed rivers, sediment transport, fluvial geomorphology Citation: Barry, J. J., J. M. Buffington, and J. G. King (2004), A general power equation for predicting bed load transport rates in gravel bed rivers, Water Resour. Res., 40, W10401, doi:10.1029/2004WR003190. 1. Introduction [2] Fang [1998] remarked on the need for a critical evaluation and comparison of the plethora of sediment transport formulae currently available. In response, Yang and Huang [2001] evaluated the performance of 13 sedi- ment transport formulae in terms of their ability to describe the observed sediment transport from 39 data sets (a total of 3391 transport observations). They concluded that sediment transport formulae based on energy dissipation rates or stream power concepts more accurately described the observed transport data and that the degree of formula complexity did not necessarily translate into increased model accuracy. Although the work of Yang and Huang [2001] is helpful in evaluating the applicability and accu- racy of many popular sediment transport equations, it is necessary to extend their analysis to coarse-grained natural rivers. Of the 39 data sets used by Yang and Huang [2001], only 5 included observations from natural channels (166 transport observations) and these were limited to sites with a fairly uniform grain-size distribution (gradation coefficient 2). [3] Prior to the extensive work of Yang and Huang [2001], Gomez and Church [1989] performed a similar analysis of 12 bed load transport formulae using 88 bed load transport observations from 4 natural gravel bed rivers and 45 bed load transport observations from 3 flumes. The authors concluded that none of the selected formulae performed consistently well, but they did find that formula calibration increases prediction accuracy. However, similar to Yang and Huang [2001], Gomez and Church [1989] had limited transport observations from natural gravel bed rivers. [4] Reid et al. [1996] assessed the performance of several popular bed load formulae in the Negev Desert, Israel, and found that the Meyer-Peter and Mu ¨ller [1948] and Parker [1990] equations performed best, but their analysis consid- ered only one gravel bed river. Because of small sample sizes, these prior investigations leave the question unre- solved as to the performance of bed load transport formulae in coarse-grained natural channels. [5] Recent work by Martin [2003], Bravo-Espinosa et al. [2003] and Almedeij and Diplas [2003] has begun to address this deficiency. Martin [2003] took advantage of 10 years of sediment transport and morphologic surveys on the Vedder River, British Columbia, to test the performance of the Meyer-Peter and Mu ¨ller [1948] equation and two Copyright 2004 by the American Geophysical Union. 0043-1397/04/2004WR003190$09.00 W10401 WATER RESOURCES RESEARCH, VOL. 40, W10401, doi:10.1029/2004WR003190, 2004 1 of 22
-
Upload
khangminh22 -
Category
Documents
-
view
0 -
download
0
Transcript of A general power equation for predicting bed load transport ...

A general power equation for predicting bed load
transport rates in gravel bed rivers
Jeffrey J. Barry
Department of Civil Engineering, Ecohydraulics Research Group, University of Idaho, Boise, Idaho, USA
Boise Cascade Corporation, Timberland Resources, Boise, Idaho, USA
John M. Buffington and John G. King
Rocky Mountain Research Station, Forest Service, U.S. Department of Agriculture, Boise, Idaho, USA
Received 16 March 2004; revised 23 July 2004; accepted 18 August 2004; published 27 October 2004.
[1] A variety of formulae has been developed to predict bed load transport in gravel bedrivers, ranging from simple regressions to complex multiparameter formulations. Theability to test these formulae across numerous field sites has, until recently, been hamperedby a paucity of bed load transport data for gravel bed rivers. We use 2104 bed loadtransport observations in 24 gravel bed rivers in Idaho to assess the performance of eightdifferent formulations of four bed load transport equations. Results show substantialdifferences in performance but no consistent relationship between formula performanceand degree of calibration or complexity. However, formulae containing a transportthreshold typically exhibit poor performance. Furthermore, we find that the transport dataare best described by a simple power function of discharge. From this we propose anew bed load transport equation and identify channel and watershed characteristics thatcontrol the exponent and coefficient of the proposed power function. We find that theexponent is principally a factor of supply-related channel armoring (transport capacity inexcess of sediment supply), whereas the coefficient is related to drainage area (a surrogatefor absolute sediment supply). We evaluate the accuracy of the proposed power functionat 17 independent test sites. INDEX TERMS: 1824 Hydrology: Geomorphology (1625); 1815
Hydrology: Erosion and sedimentation; 3210 Mathematical Geophysics: Modeling; KEYWORDS: gravel bed
rivers, sediment transport, fluvial geomorphology
Citation: Barry, J. J., J. M. Buffington, and J. G. King (2004), A general power equation for predicting bed load transport rates in
gravel bed rivers, Water Resour. Res., 40, W10401, doi:10.1029/2004WR003190.
1. Introduction
[2] Fang [1998] remarked on the need for a criticalevaluation and comparison of the plethora of sedimenttransport formulae currently available. In response, Yangand Huang [2001] evaluated the performance of 13 sedi-ment transport formulae in terms of their ability to describethe observed sediment transport from 39 data sets (a total of3391 transport observations). They concluded that sedimenttransport formulae based on energy dissipation rates orstream power concepts more accurately described theobserved transport data and that the degree of formulacomplexity did not necessarily translate into increasedmodel accuracy. Although the work of Yang and Huang[2001] is helpful in evaluating the applicability and accu-racy of many popular sediment transport equations, it isnecessary to extend their analysis to coarse-grained naturalrivers. Of the 39 data sets used by Yang and Huang [2001],only 5 included observations from natural channels(166 transport observations) and these were limited to siteswith a fairly uniform grain-size distribution (gradationcoefficient �2).
[3] Prior to the extensive work of Yang and Huang[2001], Gomez and Church [1989] performed a similaranalysis of 12 bed load transport formulae using 88 bedload transport observations from 4 natural gravel bed riversand 45 bed load transport observations from 3 flumes. Theauthors concluded that none of the selected formulaeperformed consistently well, but they did find that formulacalibration increases prediction accuracy. However, similarto Yang and Huang [2001], Gomez and Church [1989] hadlimited transport observations from natural gravel bedrivers.[4] Reid et al. [1996] assessed the performance of several
popular bed load formulae in the Negev Desert, Israel, andfound that the Meyer-Peter and Muller [1948] and Parker[1990] equations performed best, but their analysis consid-ered only one gravel bed river. Because of small samplesizes, these prior investigations leave the question unre-solved as to the performance of bed load transport formulaein coarse-grained natural channels.[5] Recent work by Martin [2003], Bravo-Espinosa et al.
[2003] and Almedeij and Diplas [2003] has begun toaddress this deficiency. Martin [2003] took advantage of10 years of sediment transport and morphologic surveys onthe Vedder River, British Columbia, to test the performanceof the Meyer-Peter and Muller [1948] equation and two
Copyright 2004 by the American Geophysical Union.0043-1397/04/2004WR003190$09.00
W10401
WATER RESOURCES RESEARCH, VOL. 40, W10401, doi:10.1029/2004WR003190, 2004
1 of 22

variants of the Bagnold [1980] equation. The author con-cluded that the formulae generally underpredict graveltransport rates and suggested that this may be due toloosened bed structure or other disequilibria resulting fromchannel alterations associated with dredge mining withinthe watershed.[6] Bravo-Espinosa et al. [2003] considered the perfor-
mance of seven bed load transport formulae on 22 alluvialstreams (including a subset of the data examined here) inrelation to a site-specific ‘‘transport category’’ (i.e., trans-port limited, partially transport limited and supply limited).The authors found that certain formulae perform betterunder certain categories of transport and that, overall, theSchoklitsch [1950] equation performed well at eight of the22 sites, while the Bagnold [1980] equation performed wellat seven of the 22 sites.[7] Almedeij and Diplas [2003] considered the perfor-
mance of the Meyer-Peter and Muller [1948], H. A.Einstein and C. B. Brown (as discussed by Brown[1950]), Parker [1979], and Parker et al. [1982] bed loadtransport equations on three natural gravel bed streams,using a total of 174 transport observations. The authorsfound that formula performance varied between sites, insome cases overpredicting observed bed load transportrates by one to three orders of magnitude, while at othersunderpredicting by up to two orders of magnitude.[8] Continuing these recent studies of bed load transport
in gravel bed rivers, we examine 2104 bed load transportobservations from 24 study sites in mountain basins ofIdaho to assess the performance of four bed load transportequations. We also assess accuracy in relation to the degreeof formula calibration and complexity.[9] Unlike Gomez and Church [1989] and Yang and
Huang [2001], we find no consistent relationship betweenformula performance and the degree of formula calibrationand complexity. However, like Whiting et al. [1999], wefind that the observed transport data are best fit by a simplepower function of total discharge. We propose this powerfunction as a new bed load transport equation and explorechannel and watershed characteristics that control theexponent and coefficient of the observed bed load powerfunctions. We hypothesize that the exponent is principally afunction of supply-related channel armoring, such thatmobilization of the surface material in a well armoredchannel is followed by a relatively larger increase in bedload transport rate (i.e., steeper rating curve) than that of asimilar channel with less surface armoring [Emmett andWolman, 2001]. We use Dietrich et al.’s [1989] dimension-less bed load transport ratio (q*) to quantify channelarmoring in terms of upstream sediment supply relative totransport capacity, and relate q* values to the exponents ofthe observed bed load transport functions. We hypothesizethat the power function coefficient depends on absolutesediment supply, which we parameterize in terms of drain-age area.[10] The purpose of this paper is fourfold: (1) assess the
performance of four bed load transport formulae in moun-tain gravel bed rivers, (2) use channel and watershedcharacteristics to parameterize the coefficient and exponentof our bed load power function to make it a predictiveequation, (3) test the parameterization equations, and(4) compare the performance of our proposed bed
load transport function to that of the other equationsin item 1.
2. Bed Load Transport Formulae
[11] We compare predicted total bed load transport ratesto observed values at each study site using four commontransport equations, and we examine how differences informula complexity and calibration influence performance.In each equation we use the characteristic grain size asoriginally specified by the author(s) to avoid introducingerror or bias. We also examine several alternative defini-tions to investigate the effects of grain size calibration onformula performance. Variants of other parameters in thebed load equations are not examined, but could alsoinfluence performance.[12] Eight variants of four formulae were considered:
the Meyer-Peter and Muller [1948] equation (calculatedboth by median subsurface grain size, d50ss, and by sizeclass, di), the Ackers and White [1973] equation asmodified by Day [1980] (calculated by di), the Bagnold[1980] equation (calculated by the modal grain size ofeach bed load event, dmqb, and by the mode of thesubsurface material, dmss), and the Parker et al. [1982]equation as revised by Parker [1990] (calculated by d50ssand two variants of di). We use the subsurface-basedversion of the Parker [1990] equation because the sur-face-based one requires site-specific knowledge of howthe surface size distribution evolves with discharge and bedload transport (information that was not available to us andthat we did not feel confident predicting). The formulaeare further described in Appendix A and are written interms of specific bed load transport rate, defined as drymass per unit width and time (qb, kg m�1 s�1).[13] Two variants of the size-specific (di) Parker et al.
[1982] equation are considered, one using a site-specifichiding function following Parker et al.’s [1982] method andthe other using Andrews’ [1983] hiding function. These twovariants allow comparison of site-specific calibration versususe of an ‘‘off-the-shelf’’ hiding function for cases wherebed load transport data are not available. We selected theAndrews [1983] hiding function because it was derivedfrom channel types and physiographic environments similarto those examined in this study. We also use single grainsize (d50ss) and size-specific (di) variants of the Meyer-Peterand Muller [1948] and Parker et al. [1982] equations tofurther examine effects of grain size calibration. In this case,we compare predictions based on a single grain size (d50ss)versus those summed over the full range of size classesavailable for transport (di). We also consider two variants ofthe Bagnold [1980] equation, one where the representativegrain size is defined as the mode of the observed bed loaddata (dmqb, as specified by Bagnold [1980]) and one basedon the mode of the subsurface material (dmss, an approachthat might be used where bed load transport observationsare unavailable). The latter variant of the Bagnold [1980]equation is expected to be less accurate because it uses astatic grain size (the subsurface mode), rather than thedischarge-specific mode of the bed load.[14] The transport equations were solved for flow and
channel conditions present during bed load measurementsand are calibrated to differing degrees to site-specific
2 of 22
W10401 BARRY ET AL.: A GENERAL POWER EQUATION FOR PREDICTING BED LOAD W10401
conditions. For example, theMeyer-Peter and Muller [1948]formula includes a shear stress correction based on the ratioof particle roughness to total roughness, where particleroughness is determined from surface grain size and theStrickler [1923] equation, and total roughness is determinedfrom the Manning [1891] equation for observed values ofhydraulic radius and water-surface slope (Appendix A).[15] Except for the Parker et al. [1982] equation, each of
the formulae used in our analysis are similar in that theycontain a threshold for initiating bed load transport. TheMeyer-Peter and Muller [1948] equation is a power func-tion of the difference between applied and critical shearstresses, the Ackers and White [1973] equation is a powerfunction of the ratio of applied to critical shear stressminus 1, and the Bagnold [1980] equation is a powerfunction of the difference between applied and critical unitstream power (Appendix A). In contrast, the Parker et al.[1982] equation lacks a transport threshold and predictssome degree of transport at all discharges, similar toEinstein’s [1950] equation.
3. Study Sites and Methods
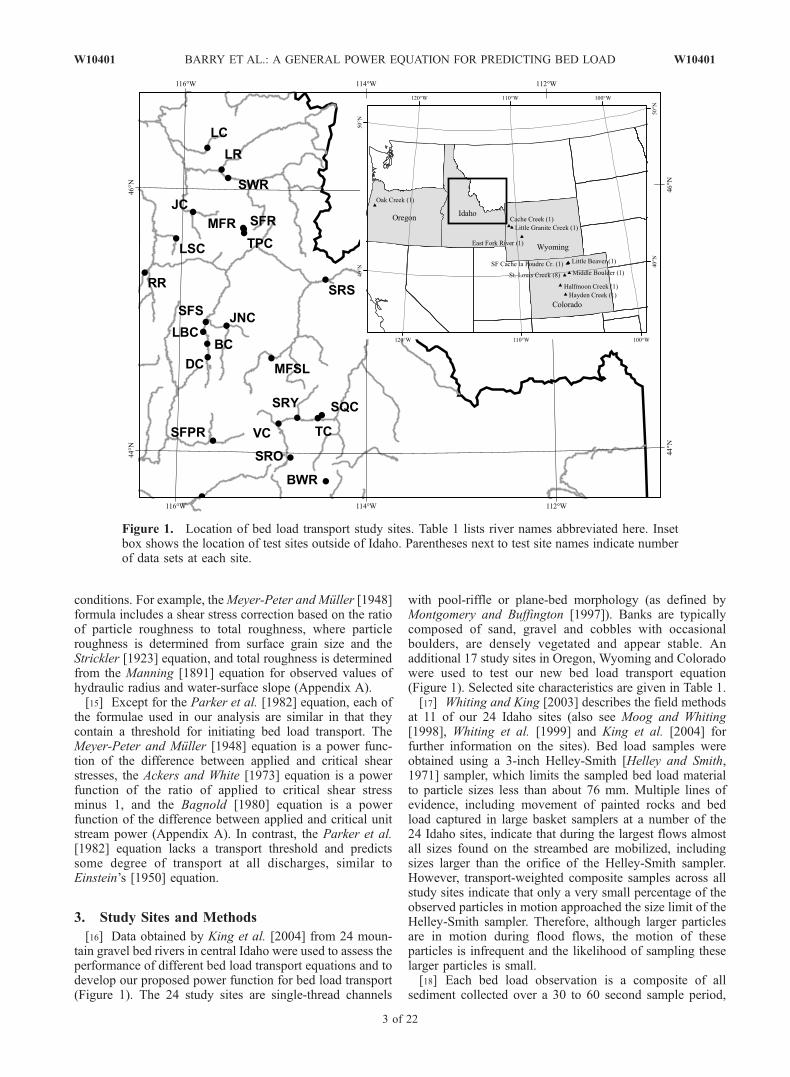
[16] Data obtained by King et al. [2004] from 24 moun-tain gravel bed rivers in central Idaho were used to assess theperformance of different bed load transport equations and todevelop our proposed power function for bed load transport(Figure 1). The 24 study sites are single-thread channels
with pool-riffle or plane-bed morphology (as defined byMontgomery and Buffington [1997]). Banks are typicallycomposed of sand, gravel and cobbles with occasionalboulders, are densely vegetated and appear stable. Anadditional 17 study sites in Oregon, Wyoming and Coloradowere used to test our new bed load transport equation(Figure 1). Selected site characteristics are given in Table 1.[17] Whiting and King [2003] describes the field methods
at 11 of our 24 Idaho sites (also see Moog and Whiting[1998], Whiting et al. [1999] and King et al. [2004] forfurther information on the sites). Bed load samples wereobtained using a 3-inch Helley-Smith [Helley and Smith,1971] sampler, which limits the sampled bed load materialto particle sizes less than about 76 mm. Multiple lines ofevidence, including movement of painted rocks and bedload captured in large basket samplers at a number of the24 Idaho sites, indicate that during the largest flows almostall sizes found on the streambed are mobilized, includingsizes larger than the orifice of the Helley-Smith sampler.However, transport-weighted composite samples across allstudy sites indicate that only a very small percentage of theobserved particles in motion approached the size limit of theHelley-Smith sampler. Therefore, although larger particlesare in motion during flood flows, the motion of theseparticles is infrequent and the likelihood of sampling theselarger particles is small.[18] Each bed load observation is a composite of all
sediment collected over a 30 to 60 second sample period,
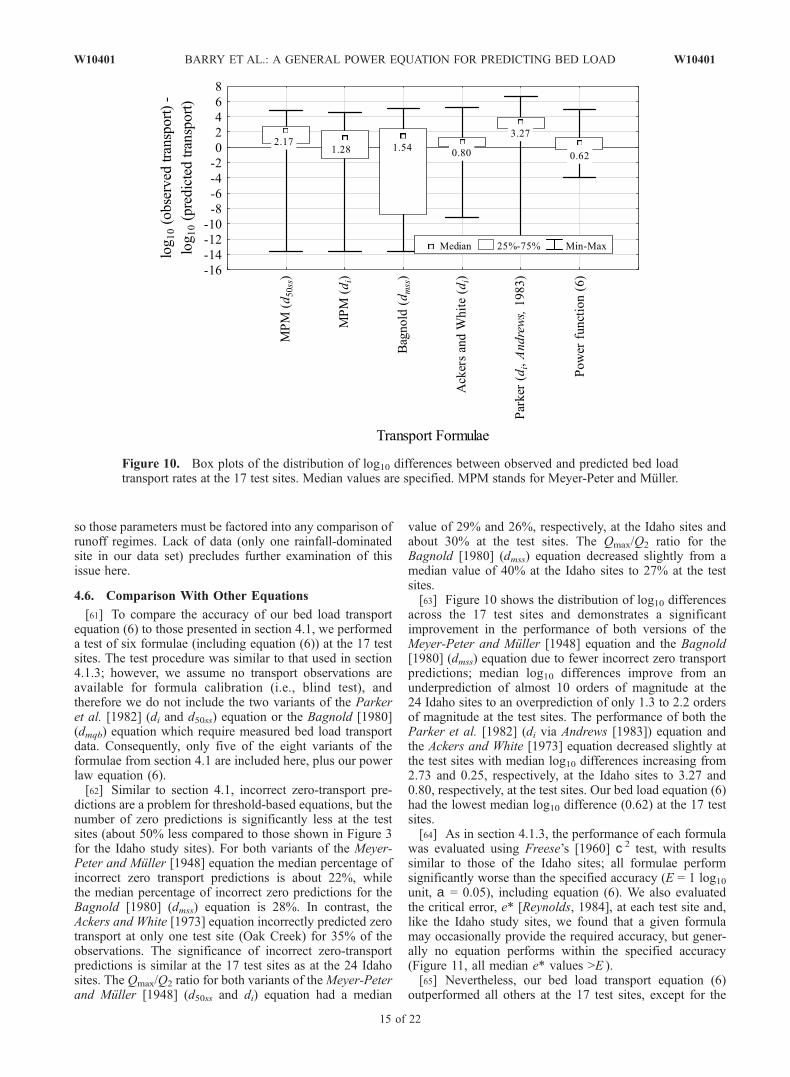
Figure 1. Location of bed load transport study sites. Table 1 lists river names abbreviated here. Insetbox shows the location of test sites outside of Idaho. Parentheses next to test site names indicate numberof data sets at each site.
W10401 BARRY ET AL.: A GENERAL POWER EQUATION FOR PREDICTING BED LOAD
3 of 22
W10401

depending on flow conditions, at typically 20 equallyspaced positions across the width of the wetted channel[Edwards and Glysson, 1999]. Between 43 and 192 nonzerobed load transport measurements were collected over a 1 to7 year period and over a range of discharges from low flowsto those well in excess of the bank-full flood at each of the24 Idaho sites.[19] Channel geometry and water surface profiles were
surveyed following standard field procedures [Williams etal., 1988]. Surveyed reaches were typically 20 channelwidths in length. At eight sites water surface slopes weremeasured over a range of discharges and did not varysignificantly. Hydraulic geometry relations for channelwidth, average depth and flow velocity were determinedfrom repeat measurements over a wide range of discharges.[20] Surface and subsurface particle size distributions
were measured at a minimum of three locations at each ofthe study sites during low flows between 1994 and 2000.Where surface textures were fairly uniform throughout thestudy reach, three locations were systematically selected forsampling surface and subsurface material. If major textural
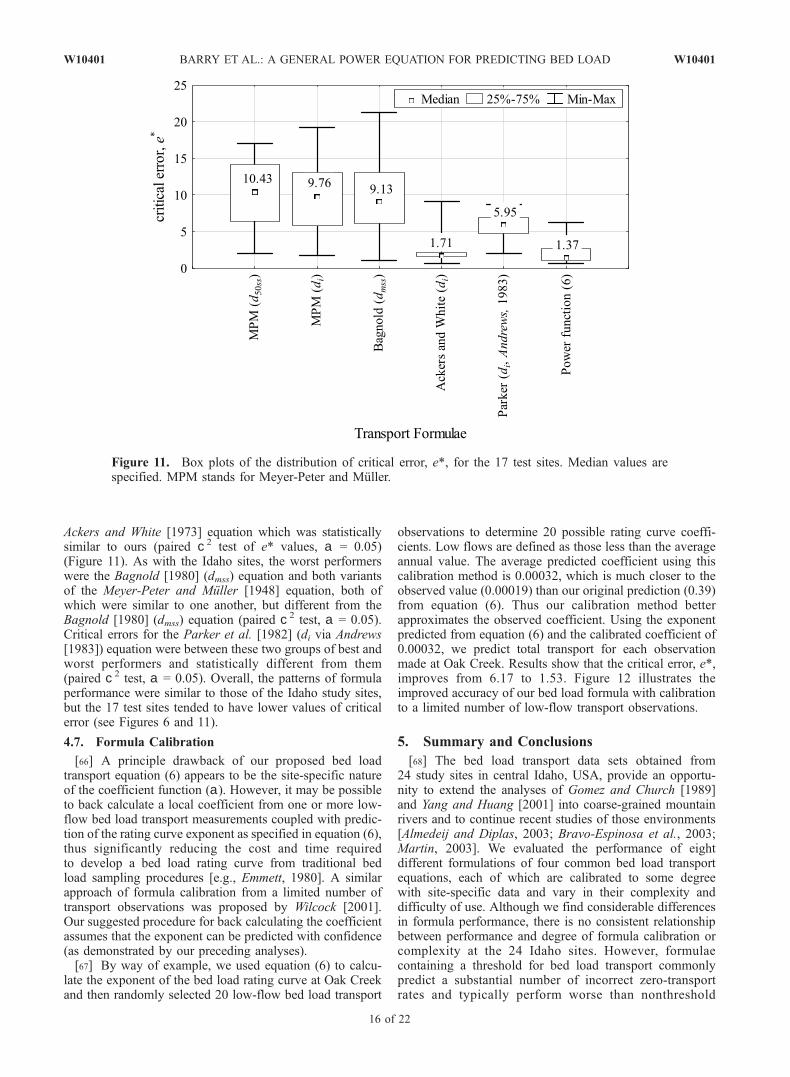
differences were observed, two sample sites were locatedwithin each textural patch, and measurements were weightedby patch area [e.g., Buffington and Montgomery, 1999a].Wolman [1954] pebble counts of 100+ surface grains wereconducted at each sample site. Subsurface samples wereobtained after removing the surface material to a depth equalto the d90 of surface grains and were sieved by weight. TheChurch et al. [1987] sampling criterion was generally met,such that the largest particle in the sample comprised, onaverage, about 5% of the total sample weight. However, atthree sites (Johns Creek, Big Wood River and Middle ForkSalmon River) the largest particle comprised 13%–14% ofthe total sample weight; the Middle Fork Salmon River islater excluded for other reasons.[21] Estimates of flood frequency were calculated using a
log Pearson III analysis [U.S. Water Resources Council,1981] at all study sites that had at least a 10 year record ofinstantaneous stream flow. Only five years of flow datawere available at Dollar and Blackmare creeks, and there-fore estimates of flood frequency were calculated using atwo-station comparison [U.S. Water Resources Council,
Table 1. Study and Test Site Characteristics
Site (Abbreviation)Drainage Area,
km2Average Slope,
m m�1Subsurface d50ss,
mmSurface d50s,
mm2-Year Flood,
m3 s�1
Study SitesLittle Buckhorn Creek (LBC) 16 0.0509 15 74 2.79Trapper Creek (TPC) 21 0.0414 17 75 2.21Dollar Creek (DC) 43 0.0146 22 83 11.8Blackmare Creek (BC) 46 0.0299 25 101 6.95Thompson Creek (TC) 56 0.0153 44 62 3.10SF Red River (SFR) 99 0.0146 25 95 8.7Lolo Creek (LC) 106 0.0097 19 85 16.9MF Red River (MFR) 129 0.0059 18 57 12.8Little Slate Creek (LSC) 162 0.0268 24 134 16.0Squaw Creek (SQC) 185 0.0100 29 46 6.62Salmon River near Obsidian (SRO) 243 0.0066 26 61 14.8Rapid River (RR) 280 0.0108 16 75 20.3Johns Creek (JC) 293 0.0207 36 204 36.8Big Wood River (BWR) 356 0.0091 25 119 26.2Valley Creek (VC) 386 0.0040 21 50 28.3Johnson Creek (JNC) 560 0.0040 14 62 83.3SF Salmon River (SFS) 853 0.0025 14 38 96.3SF Payette River (SFPR) 1164 0.0040 20 95 120Salmon River below Yankee Fork (SRY) 2101 0.0034 25 104 142Boise River (BR) 2154 0.0038 21 60 188MF Salmon River at Lodge (MFSL) 2694 0.0041 36 146 258Lochsa River (LR) 3055 0.0023 27 132 532Selway River (SWR) 4955 0.0021 24 185 731Salmon River at Shoup (SRS) 16154 0.0019 28 96 385
Test SitesFool Creek (St. Louis Creek Test Site) 3 0.0440 15 38 0.320Oak Creek 7 0.0095 20 53 2.98East St. Louis Creek 8 0.0500 13 51 0.945St. Louis Creek Site 5 21 0.0480 14 146 2.52Cache Creek 28 0.0210 20 46 2.2St. Louis Creek Site 4a 34 0.0190 13 72 3.96St. Louis Creek Site 4 34 0.0190 13 91 3.99Little Beaver Creek 34 0.2300 10 47 2.24Hayden Creek 47 0.0250 20 68 2.28St. Louis Creek Site 3 54 0.0160 16 82 5.07St. Louis Creek Site 2 54 0.0170 15 76 5.08Little Granite Creek 55 0.0190 18 55 8.41St. Louis Creek Site 1 56 0.0390 17 129 5.21Halfmoon Creek 61 0.0150 18 62 7.3Middle Boulder Creek 83 0.0128 25 75 12.6SF Cache la Poudre 231 0.0070 12 69 13.8East Fork River 466 0.0007 1 5 36.0
4 of 22
W10401 BARRY ET AL.: A GENERAL POWER EQUATION FOR PREDICTING BED LOAD W10401

1981] based on nearby, long-term USGS stream gages. Aregional relationship between drainage area and floodfrequency was used at Little Buckhorn Creek due to a lackinstantaneous peak flow data.[22] Each sediment transport observation at the 24 Idaho
sites was reviewed for quality. At nine of the sites allobservations were included. Of the remaining 15 sites, atotal of 284 transport observations (out of 2388) wereremoved (between 2 and 51 observations per site). Theprimary reasons for removal were differences in samplingmethod prior to 1994, or because the transport observationswere taken at a different, or unknown, location compared tothe majority of bed load transport samples. Only 41 trans-port observations (out of 284) from nine sites were removeddue to concerns regarding sample quality (i.e., significantamounts of measured transport at extremely low dischargesindicative of ‘‘scooping’’ during field sampling).[23] Methods of data collection varied greatly among the
additional 17 test sites outside of Idaho and are described indetail elsewhere (see Ryan and Emmett [2002] for LittleGranite Creek, Wyoming; Leopold and Emmett [1997] forthe East Fork River, Wyoming; Milhous [1973] for OakCreek, Oregon; Ryan et al. [2002] for the eight sites on theSt. Louis River, Colorado; and Gordon [1995] for bothLittle Beaver and Middle Boulder creeks, Colorado). Datacollection methods at Halfmoon Creek, Hayden Creek andSouth Fork Cache la Poudre Creek, Colorado and CacheCreek, Wyoming were similar to the 8 test sites from St.Louis Creek. Both the East Fork River and Oak Creek sitesused channel-spanning slot traps to catch the entire bedload, while the remaining 15 test sites used a 3-inch Helley-Smith bed load sampler spanning multiple years (typically1 to 5 years, with a maximum of 14 years at Little GraniteCreek). Estimates of flood frequency were determined usingeither standard flood frequency analyses [U.S. WaterResources Council, 1981] or from drainage area–dischargerelationships derived from nearby stream gages.
4. Results and Discussion
4.1. Performance of the Bed Load Transport Formulae
4.1.1. Log-Log Plots[24] Predicted total bed load transport rates for each
formula were compared to observed values, with a log10transformation applied to both. A logarithmic transforma-tion is commonly applied in bed load studies becausetransport rates typically span a large range of values(6+ orders of magnitude on a log10 scale), and the data tendto be skewed toward small transport rates without thistransformation. To provide more rigorous support for thetransformation we used the ARC program [Cook andWeisberg, 1999] to find the optimal Box-Cox transforma-tion [Neter et al., 1974] (i.e., one that produces a near-normal distribution of the data). Results indicate that a log10transformation is appropriate, and conforms with thetraditional approach for analyzing bed load transport data.
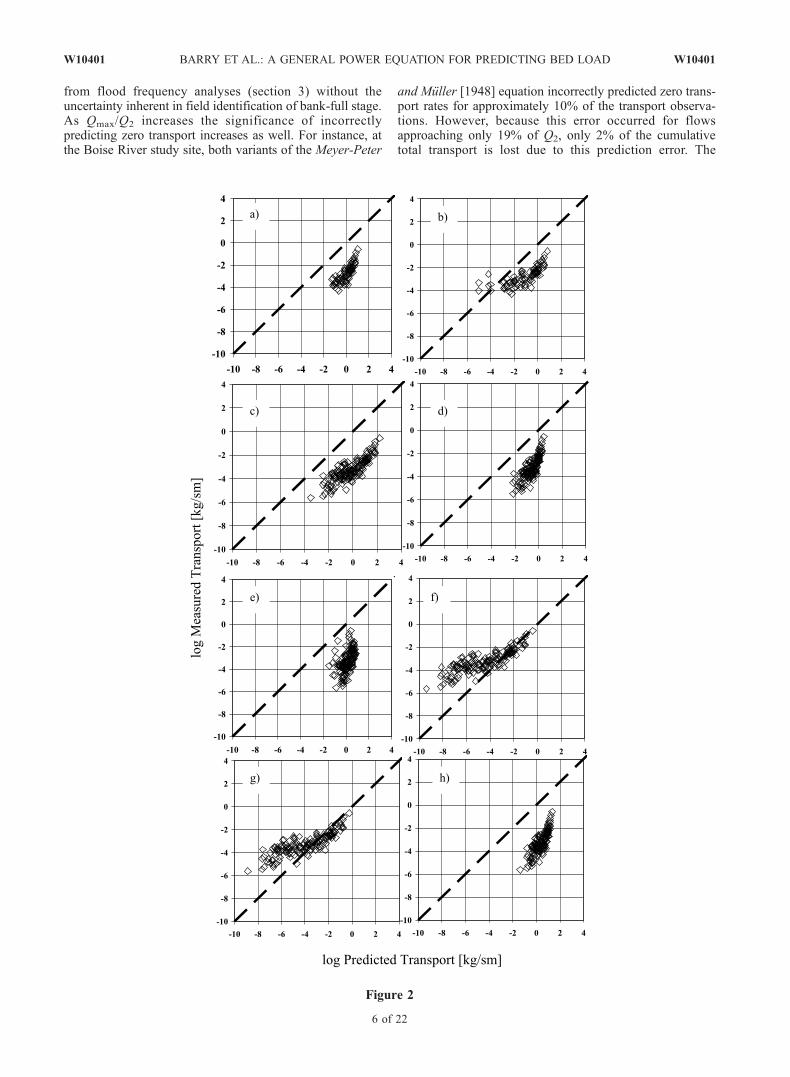
[25] Figure 2 provides an example of observed versuspredicted transport rates from the Rapid River study site andindicates that some formulae produced fairly accurate, butbiased, predictions of total transport. That is, predictedvalues were generally tightly clustered and subparallel tothe 1:1 line of perfect agreement, but were typically largerthan the observed values (e.g., Figure 2c). Other formulaeexhibited either curvilinear bias (e.g., Figures 2b, 2f, and 2g)or rotational bias (constantly trending departure from accu-racy) (e.g., Figures 2a, 2d, 2e, and 2h). On the basis ofvisual inspection of similar plots from all 24 sites, theParker et al. [1982] equations (di and d50ss) best describethe observed transport rates, typically within an order ofmagnitude of the observed values. In contrast, the Parker etal. [1982] (di via Andrews [1983]), Meyer-Peter and Muller[1948] (di and d50ss), and Bagnold [1980] (dmss and dmqb)equations did not perform as well, usually over two ordersof magnitude from the observed values. The Ackers andWhite [1973] equation was typically one to three orders ofmagnitude from the observed values.4.1.2. Transport Thresholds[26] The above assessment of performance can be mis-
leading for those formulae that contain a transport threshold(i.e., the Meyer-Peter and Muller [1948], Ackers and White[1973], and Bagnold [1980] equations). Formulae of thissort often erroneously predict zero transport at low tomoderate flows that are below the predicted threshold fortransport. These incorrect zero-transport predictions cannotbe shown in the log-log plots of observed versus predictedtransport rates (Figure 2). However, frequency distributionsof the erroneous zero-transport predictions reveal substan-tial error for both variants of the Meyer-Peter and Muller[1948] equation and the Bagnold [1980] (dmss) equation(Figure 3). These formulae incorrectly predict zero transportfor about 50% of all observations at our study sites. Incontrast, the Bagnold [1980] (dmqb) and Ackers and White[1973] equations incorrectly predict zero transport for only2% and 4% of the observations, respectively, at only one ofthe 24 study sites. Formulae that lack transport thresholds(i.e., the Parker et al. [1982] equation) do not predict zerotransport rates.[27] The significance of the erroneous zero-transport pre-
dictions depends on the magnitude of the thresholddischarge and the portion of the total bed load that isexcluded by the prediction threshold. To examine thisissue we calculated the maximum discharge at which eachthreshold-based transport formula predicted zero transport(Qmax) normalized by the 2-year flood discharge (Q2). Manyauthors report that significant bed load movement begins atdischarges that are 60% to 100% of bank-full flow [Leopoldet al., 1964; Carling, 1988; Andrews and Nankervis, 1995;Ryan and Emmett, 2002; Ryan et al., 2002]. Bank-fulldischarge at the Idaho sites has a recurrence interval of 1–4.8 years, with an average of 2 years [Whiting et al., 1999];hence Q2 is a bank-full-like flow. We use Q2 rather than thebank-full discharge because it can be determined objectively
Figure 2. Comparison of measured versus computed total bed load transport rates for Rapid River (typical of the Idahostudy sites): (a) Meyer-Peter and Muller [1948] equation by d50ss, (b) Meyer-Peter and Muller equation by di, (c) Ackersand White [1973] equation by di, (d) Bagnold equation by dmss, (e) Bagnold equation by dmqb, (f ) Parker et al. [1982]equation by d50ss, (g) Parker et al. [1982] equation by di (hiding function defined by Parker et al. [1982], and (h) Parker etal. [1982] equation by di (hiding function defined by Andrews [1983]).
W10401 BARRY ET AL.: A GENERAL POWER EQUATION FOR PREDICTING BED LOAD
5 of 22
W10401
from flood frequency analyses (section 3) without theuncertainty inherent in field identification of bank-full stage.As Qmax/Q2 increases the significance of incorrectlypredicting zero transport increases as well. For instance, atthe Boise River study site, both variants of the Meyer-Peter
and Muller [1948] equation incorrectly predicted zero trans-port rates for approximately 10% of the transport observa-tions. However, because this error occurred for flowsapproaching only 19% of Q2, only 2% of the cumulativetotal transport is lost due to this prediction error. The
Figure 2
6 of 22
W10401 BARRY ET AL.: A GENERAL POWER EQUATION FOR PREDICTING BED LOAD W10401

significance of incorrectly predicting zero transport isgreater at Valley Creek where, again, both variants of theMeyer-Peter and Muller [1948] equation incorrectly predictzero transport rates for approximately 90% of the transportobservations and at flows approaching 75% of Q2. Thisprediction error translates into a loss of 48% of the cumu-lative bed load transport.[28] Box plots of Qmax/Q2 values show that incorrect zero
predictions are most significant for the Meyer-Peter andMuller [1948] equations and the Bagnold [1980] (dmss)equation, while the Bagnold [1980] (dmqb) and Ackers andWhite [1973] equations have few incorrect zero predictionsand less significant error (lower Qmax/Q2 ratios) (Figure 4).[29] Because coarse-grained rivers typically transport
most of their bed load at near-bank-full discharges [e.g.,Andrews and Nankervis, 1995], failure of the thresholdequations at low flows may not be significant in terms ofthe annual bed load transport. However, our analysis indi-cates that in some instances the threshold equations fail atmoderate to high discharges (Qmax/Q2 > 0.8), potentiallyexcluding a significant portion of the annual bed loadtransport (e.g., Valley Creek as discussed above). Moreover,the frequency of incorrect zero predictions varies widelyby transport formula (Figure 4). To better understand theperformance of these equations it is useful to examine thenature of their threshold formulations.[30] As discussed in section 2, the Meyer-Peter and
Muller [1948] equation is a power function of the differencebetween applied and critical shear stresses. A shear stresscorrection is used to account for channel roughness and todetermine that portion of the total stress applied to the bed(Appendix A). However, the Meyer-Peter and Muller[1948] stress correction may be too severe, causing the
high number of zero-transport predictions. Bed stressespredicted from the Meyer-Peter and Muller [1948] methodare typically only 60–70% of the total stress at our sites.Moreover, because armored gravel bed rivers tend to exhibita near-bank-full threshold for significant bed load transport[Leopold et al., 1964; Parker, 1978; Carling, 1988; Andrewsand Nankervis, 1995], the range of transporting shearstresses may be narrow, causing transport predictions to beparticularly sensitive to the accuracy of stress corrections.[31] The Bagnold [1980] equation is a power function of
the difference between applied and critical unit streampowers. The modal grain size of the subsurface material(dmss) is typically 32 mm to 64 mm (geometric mean of45 mm) at our study sites, whereas the modal grain size ofthe bed load observations varied widely with discharge andwas typically between 1.5 mm at low flows and 64 mmduring flood flows. Not surprisingly, the Bagnold [1980]equation performs well when critical stream power isbased on the modal grain size of each measured bed loadevent (dmqb), but not when it is defined from the mode ofthe subsurface material (dmss) (Figures 3 and 4). Whencalibrated to the observed bed load data, the critical unitstream power scales with discharge such that at low flowswhen the measured bed load is fine (small dmqb) the criticalstream power is reduced. Conversely, as discharge increaseand the measured bed load data coarsens (larger dmqb) thecritical unit stream power increases. However, the mode ofthe subsurface material (dmss) does not scale with dischargeand consequently the critical unit discharge is held constantfor all flow conditions when based on dmss. Consequently,threshold conditions for transport based on dmss are oftennot exceeded, while those of dmqb were exceeded over 90%of the time.
Figure 3. Box plots of the distribution of incorrect predictions of zero transport for the 24 Idaho sites.Median values are specified. MPM stands for Meyer-Peter and Muller.
W10401 BARRY ET AL.: A GENERAL POWER EQUATION FOR PREDICTING BED LOAD
7 of 22
W10401


a given model (bed load transport equation) [Reynolds,1984].[37] Results show that at best, median errors of less than
2 orders of magnitude would have to be tolerated for
acceptance of the best performing equations (Ackers andWhite’s [1973] and Parker et al.’s [1982] (di) equations),while at worst, median errors of more than 13 orders ofmagnitude would have to be tolerated for acceptance of the
Figure 6. Box plots of the distribution of critical error, e*, for the 24 Idaho sites. Median values arespecified. MPM stands for Meyer-Peter and Muller. Power function is discussed in section 4.3.
Figure 5. Box plots of the distribution of log10 differences between observed and predicted bed loadtransport rates for the 24 Idaho study sites. Median values are specified. MPM stands for Meyer-Peter andMuller. Power function is discussed in section 4.3.
W10401 BARRY ET AL.: A GENERAL POWER EQUATION FOR PREDICTING BED LOAD
9 of 22
W10401


Carling, P. (1988), The concept of dominant discharge applied to twogravel-bed streams in relation to channel stability thresholds, Earth Surf.Processes Landforms, 13, 355–367.
Church, M. A., D. G. McLean, and J. F. Wolcott (1987), River bed gravels:Sampling and analysis, in Sediment Transport in Gravel-Bed Rivers,edited by C. R. Thorne, J. C. Bathurst, and R. D. Hey, pp. 43–88, JohnWiley, Hoboken, N. J.
Cook, R. D., and S. Weisberg (1999), Applied Regression IncludingComputing and Graphics, 590 pp., John Wiley, Hoboken, N. J.
Cui, Y., and G. Parker (2004), Numerical model of sediment pulses andsediment supply disturbances in mountain rivers, J. Hydraul. Eng, inpress.
Day, T. J. (1980), A study of the transport of graded sediments, Rep. IT 190,10 pp., Hydraul. Res. Stn. Wallingford, U. K.
Dietrich, W. E., J. Kirchner, H. Ikeda, and F. Iseya (1989), Sediment supplyand the development of the coarse surface layer in gravel-bedded rivers,Nature, 340, 215–217.
Edwards, T. K., and G. D. Glysson (1999), Field methods for measurementof fluvial sediment,U.S. Geol. Surv. Tech. Water Resour. Book 3, Chap. 2,89 pp.
Einstein, H. A. (1950), The bed-load function for sediment transportation inopen channel flows, Tech. Bull. 1026, 73 pp., Soil Conserv. Serv.,Washington, D. C.
Emmett, W. W. (1980), A field calibration of the sediment-trappingcharacteristics of the Helley-Smith bedload sampler, U.S. Geol. Surv.Prof. Pap., 1139, 44 pp.
Emmett, W. W., and M. G. Wolman (2001), Effective discharge andgravel-bed rivers, Earth Surf. Processes Landforms, 26, 1369–1380.
Fang, D. (1998), Book review of: Sediment Transport Theory and Practiceby C. T. Yang, Int. J. Sed. Res., 13, 74–83.
Ferguson, R. I. (2003), The missing dimension: Effects of lateral variationon 1-D calculations of fluvial bedload transport, Geomorphology, 56, 1–14.
Ferguson, R. I., T. B. Hoey, S. J. Wathen, A. Werritty, R. I. Hardwick, andG. H. Sambrook Smith (1998), Downstream fining of river gravels:Integrated field, laboratory and modeling study, in Gravel-Bed Riversin the Environment, edited by P. C. Klingeman et al., pp. 85–114,Water Resour. Publ., Highlands Ranch, Colo.
Freese, F. (1960), Testing accuracy, For. Sci., 6, 139–145.Gomez, B., and M. Church (1989), An assessment of bedload sedimenttransport formulae for gravel bed rivers, Water Resour. Res., 25, 1161–1186.
Gordon, N. (1995), Summary of technical testimony in the Colorado WaterDivision 1 Trial, U.S. For. Serv. Gen. Tech. Rep. RM, RMRS-GTR-270,140 pp.
Helley, E. J., and W. Smith (1971), Development and calibration of apressure-difference bedload sampler, open file report, 18 pp., U.S. Geo-logical Survey, Reston, Va.
Jackson, W. L., and R. L. Beschta (1982), A model of two-phase bedloadtransport in an Oregon coast range stream, Earth Surf. Processes Land-forms, 7, 517–527.
Kinerson, D. (1990), Bed surface response to sediment supply, M.S. thesis,420 pp., Univ. of Calif., Berkeley.
King, J. G., W. W. Emmett, P. J. Whiting, R. P. Kenworthy, and J. J. Barry(2004), Sediment transport data and related information for selectedgravel-bed streams and rivers in Idaho, U.S. For. Serv. Gen. Tech. Rep.RM, RMRS-GTR-131, 26 pp.
Laronne, J. B., and I. Reid (1993), Very high rates of bedload sedimenttransport by ephemeral desert rivers, Nature, 366, 148–150.
Laronne, J. B., C. Garcia, and I. Reid (2000), Mobility of patch sediment ingravel bed streams: Patch character and its implications for bedload, inGravel-Bed Rivers V, edited by M. P. Mosley, pp. 249–280, N. Z.Hydrol. Soc., Wellington.
Leopold, L. B., and W. W. Emmett (1997), Bedload and river hydraulics—Inferences from the East Fork River, Wyoming, U.S. Geol. Surv. Prof.Pap., 1583, 52 pp.
Leopold, L. B., M. G. Wolman, and J. P. Miller (1964), Fluvial Processes inGeomorphology, 552 pp., W. H. Freeman, New York.
Lisle, T. E., and S. Hilton (1999), Fine bed material in pools of naturalgravel bed channels, Water Resour. Res., 35, 1291–1304.
Lisle, T. E., J. M. Nelson, J. Pitlick, M. A. Madej, and B. L. Barkett (2000),Variability of bed mobility in natural, gravel-bed channels and adjust-ments to sediment load at local and reach scales, Water Resour. Res., 36,3743–3755.
Manning, R. (1891), On the flow of water in open channels and pipes,Trans. Inst. Civ. Eng. Ireland, 20, 161–207.
Martin, Y. (2003), Evaluation of bed load transport formulae using fieldevidence from the Vedder River, British Columbia, Geomorphology, 53,73–95.
Meyer-Peter, E., and R. Muller (1948), Formulas for bed-load transport, inProceedings of the 2nd Meeting of the International Association forHydraulic Structures Research, pp. 39–64, Int. Assoc. Hydraul. Res.,Delft, Netherlands.
Milhous, R. T. (1973), Sediment transport in a gravel-bottomed stream,Ph.D. dissertation, 232 pp., Oreg. State Univ., Corvallis.
Montgomery, D. R., and J. M. Buffington (1997), Channel-reach mor-phology in mountain drainage basins, Geol. Soc. Am. Bull., 109, 596–611.
Moog, D. B., and P. J. Whiting (1998), Annual hysteresis in bed load ratingcurves, Water Resour. Res., 34, 2393–2399.
Neter, J., W. Wasserman, and M. H. Kutner (1974), Applied Linear Statis-tical Models, 1181 pp., R. D. Irwin, Inc., Burr Ridge, Ill.
Paola, C., and R. Seal (1995), Grain size patchiness as a cause of selectivedeposition and downstream fining, Water Resour. Res., 31, 1395–1407.
Parker, G. (1978), Self-formed straight rivers with equilibrium banks andmobile bed. Part 2. The gravel river, J. Fluid Mech., 89, 127–146.
Parker, G. (1979), Hydraulic geometry of active gravel rivers, J. Hydraul.Div. Am. Soc. Civ. Eng., 105, 1185–1201.
Parker, G. (1990), Surface-based bedload transport relation for gravelrivers, J. Hydraul. Res., 28, 417–436.
Parker, G., and Y. Cui (1998), The arrested gravel front: Stable gravel-sandtransitions in rivers, part 1: Simplified analytical solution, J. Hydraul.Res., 36, 75–100.
Parker, G., and P. C. Klingeman (1982), On why gravel bed streams arepaved, Water Resour. Res., 18, 1409–1423.
Parker, G., P. C. Klingeman, and D. G. McLean (1982), Bedload and sizedistribution in paved gravel-bed streams, J. Hydraul. Div. Am. Soc. Civ.Eng., 108, 544–571.
Parker, G., C. M. Toro-Escobar, M. Ramey, and S. Beck (2003), Effect offloodwater extraction on mountain stream morphology, J. Hydraul. Eng.,129, 885–895.
Pitlick, J. (1994), Relation between peak flows, precipitation, and physio-graphy for five mountainous regions in the western USA, J. Hydrol.,158, 214–219.
Reid, I., D. M. Powell, and J. B. Laronne (1996), Prediction of bed-loadtransport by desert flash floods, J. Hydraul. Eng., 122, 170–173.
Reynolds, M. R. (1984), Estimating error in model prediction, For. Sci., 30,454–469.
Ryan, S. E., and W. W. Emmett (2002), The nature of flow and sedimentmovement in Little Granite Creek near Bondurant, Wyoming, U.S. For.Serv. Gen. Tech. Rep. RM, RMRS-GTR-90, 46 pp.
Ryan, S. E., L. S. Porth, and C. A. Troendle (2002), Defining phases ofbedload transport using piecewise regression, Earth Surf. ProcessesLandforms, 27, 971–990.
Sambrook Smith, G. H., and R. I. Ferguson (1995), The gravel-sand transi-tion along river channels, J. Sed. Res., Sect. A, 65, 423–430.
Schoklitsch, A. (1950), Handbuch des wasserbaues, Springer-Verlag, NewYork.
Smith, T. R., and F. P. Bretherton (1972), Stability and the conservation ofmass in drainage basin evolution, Water Resour. Res., 8, 1506–1528.
Strickler, A. (1923), Beitrage zur Frage der Geschwindigheistformel undder Rauhigkeitszahlen fur Strome, Kanale und Geschlossene Leitungen,Mitt. Eidg. Amtes Wasserwirt. 16, Eidg. Amtes Wasserwirt., Bern.
Swanston, D. N. (1991), Natural processes, in Influences of Forest andRangeland Management on Salmonid Fishes and Their Habitat, Spec.Publ. 19, edited by W. R. Meehan, pp. 139–179, Am. Fish. Soc.,Bethesda, Md.
U.S. Water Resources Council (1981), Guidelines for determining floodflow frequency, Bull. 17B, U.S. Geol. Surv., Reston, Va.
Vanoni, V. A. (1975), Sediment discharge formulas, in SedimentationEngineering, edited by V. A. Vanoni, pp. 190–229, Am. Soc. Civ.Eng., Reston, Va.
Whiting, P. J. (2002), Streamflow necessary for environmental mainte-nance, Annu. Rev. Earth Planet. Sci., 30, 181–200.
Whiting, P. J., and J. G. King (2003), Surface particle sizes on armouredgravel streambeds: Effects of supply and hydraulics, Earth Surf.Processes Landforms, 28, 1459–1471.
Whiting, P. J., J. F. Stamm, D. B. Moog, and R. L. Orndorff (1999),Sediment-transporting flows in headwater streams, Geol. Soc. Am. Bull.,111, 450–466.
Wilcock, P. R. (2001), Toward a practical method for estimating sediment-transport rates in gravel-bed rivers, Earth Surf. Processes Landforms, 27,1395–1408.
W10401 BARRY ET AL.: A GENERAL POWER EQUATION FOR PREDICTING BED LOAD
21 of 22
W10401

Williams, G. P., B. Thomas, and R. Daddow (1988), Methods for collectionand analysis of fluvial-sediment data, U.S. For. Serv. Tech. Pap. WS,WSDG-TP-00012, 85 pp.
Wolman, M. G. (1954), Method of sampling coarse river bed material, EosTrans. AGU, 35, 951–956.
Wolman, M. G., and J. P. Miller (1960), Magnitude and frequency of forcesin geomorphic processes, J. Geol., 68, 54–74.
Yang, C. T., and C. Huang (2001), Applicability of sediment transportformulas, Int. J. Sed. Res., 16, 335–353.
Zar, J. H. (1974), Biostatistical Analysis, 718 pp., Prentice-Hall, OldTappan, N. J.
����������������������������J. J. Barry, Boise Cascade Corporation, Timberland Resources, 1111
West Jefferson Street, Boise, ID 83728, USA. ([email protected])
J. M. Buffington and J. G. King, Rocky Mountain Research Station,USDA Forest Service, Boise, ID 83702, USA.
22 of 22
W10401 BARRY ET AL.: A GENERAL POWER EQUATION FOR PREDICTING BED LOAD W10401