A fully automated method for quantifying and localizing white matter hyperintensities on MR images
17
A Fully Automated Method for Quantifying and Localizing White Matter Hyperintensities on MR Images Minjie Wu a , Caterina Rosano b , Meryl Butters c , Ellen Whyte c , Megan Nable c , Ryan Crooks b , Carolyn C. Meltzer d , Charles F. Reynolds III c , and Howard J. Aizenstein3 * a Department of Electrical and Computer Engineering b Department of Epidemiology c Department of Psychiatry d Department of Radiology, University of Pittsburgh, USA Abstract White matter hyperintensities (WMH), commonly found on T2-weighted FLAIR brain MR images in the elderly, are associated with a number of neuropsychiatric disorders, including vascular dementia, Alzheimer’s disease, and late-life depression. Previous MRI studies of WMHs have primarily relied on the subjective and global (i.e., full-brain) ratings of WMH grade. In the current study we implement and validate an automated method for quantifying and localizing WMHs. We adapt a fuzzy connected algorithm to automate the segmentation of WMHs and use a demons-based image registration to automate the anatomic localization of the WMHs using the Johns Hopkins University White Matter Atlas. The method is validated using the brain MR images acquired from eleven elderly subjects with late-onset late-life depression (LLD) and eight elderly controls. This dataset was chosen because LLD subjects are known to have significant WMH burden. The volumes of WMH identified in our automated method are compared with the accepted gold standard (manual ratings). A significant correlation of the automated method and the manual ratings is found (P<0.0001), thus demonstrating similar WMH quantifications of both methods. As has been shown in other studies e.g. (Taylor, et al. 2003)), we found there was a significantly greater WMH burden in the LLD subjects versus the controls for both the manual and automated method. The effect size was greater for the automated method, suggesting that it is a more specific measure. Additionally, we describe the anatomic localization of the WMHs in LLD subjects as well as in the control subjects, and detect the regions of interest (ROIs) specific for the WMH burden of LLD patients. Given the emergence of large neuroimage databases, techniques, such as that described here, will allow for a better understanding of the relationship between WMHs and neuropsychiatric disorders. Keywords White matter hyperintensity; late-onset late-life depression INTRODUCTION A number of previous studies have shown that white matter hyperintensities (WMH), also called leuokoaraiosis, commonly seen on T2-weighted FLAIR MR images, are associated with neuropsychiatric disorders, including vascular dementia (van Gijn 1998), Alzheimer’s disease (Mirsen, et al. 1991), and late-onset late-life depression (Hickie and Scott 1998; Thomas, et * Correspondence should be addressed to: Howard J. Aizenstein, M.D., Ph.D., Western Psychiatric Institute and Clinic, 3811 O’Hara Street, Pittsburgh, PA 15213, USA, Tel: (412) 624-4997, Fax: (412) 624-0223, Email: [email protected]. NIH Public Access Author Manuscript Psychiatry Res. Author manuscript; available in PMC 2007 January 3. Published in final edited form as: Psychiatry Res. 2006 December 1; 148(2-3): 133–142. NIH-PA Author Manuscript NIH-PA Author Manuscript NIH-PA Author Manuscript
-
Upload
structbio-pitt -
Category
Documents
-
view
0 -
download
0
Transcript of A fully automated method for quantifying and localizing white matter hyperintensities on MR images

A Fully Automated Method for Quantifying and Localizing WhiteMatter Hyperintensities on MR Images
Minjie Wua, Caterina Rosanob, Meryl Buttersc, Ellen Whytec, Megan Nablec, Ryan Crooksb,Carolyn C. Meltzerd, Charles F. Reynolds IIIc, and Howard J. Aizenstein3*a Department of Electrical and Computer Engineering
b Department of Epidemiology
c Department of Psychiatry
d Department of Radiology, University of Pittsburgh, USA
AbstractWhite matter hyperintensities (WMH), commonly found on T2-weighted FLAIR brain MR imagesin the elderly, are associated with a number of neuropsychiatric disorders, including vasculardementia, Alzheimer’s disease, and late-life depression. Previous MRI studies of WMHs haveprimarily relied on the subjective and global (i.e., full-brain) ratings of WMH grade. In the currentstudy we implement and validate an automated method for quantifying and localizing WMHs. Weadapt a fuzzy connected algorithm to automate the segmentation of WMHs and use a demons-basedimage registration to automate the anatomic localization of the WMHs using the Johns HopkinsUniversity White Matter Atlas. The method is validated using the brain MR images acquired fromeleven elderly subjects with late-onset late-life depression (LLD) and eight elderly controls. Thisdataset was chosen because LLD subjects are known to have significant WMH burden. The volumesof WMH identified in our automated method are compared with the accepted gold standard (manualratings). A significant correlation of the automated method and the manual ratings is found(P<0.0001), thus demonstrating similar WMH quantifications of both methods. As has been shownin other studies e.g. (Taylor, et al. 2003)), we found there was a significantly greater WMH burdenin the LLD subjects versus the controls for both the manual and automated method. The effect sizewas greater for the automated method, suggesting that it is a more specific measure. Additionally,we describe the anatomic localization of the WMHs in LLD subjects as well as in the control subjects,and detect the regions of interest (ROIs) specific for the WMH burden of LLD patients. Given theemergence of large neuroimage databases, techniques, such as that described here, will allow for abetter understanding of the relationship between WMHs and neuropsychiatric disorders.
KeywordsWhite matter hyperintensity; late-onset late-life depression
INTRODUCTIONA number of previous studies have shown that white matter hyperintensities (WMH), alsocalled leuokoaraiosis, commonly seen on T2-weighted FLAIR MR images, are associated withneuropsychiatric disorders, including vascular dementia (van Gijn 1998), Alzheimer’s disease(Mirsen, et al. 1991), and late-onset late-life depression (Hickie and Scott 1998; Thomas, et
* Correspondence should be addressed to: Howard J. Aizenstein, M.D., Ph.D., Western Psychiatric Institute and Clinic, 3811 O’HaraStreet, Pittsburgh, PA 15213, USA, Tel: (412) 624-4997, Fax: (412) 624-0223, Email: [email protected].
NIH Public AccessAuthor ManuscriptPsychiatry Res. Author manuscript; available in PMC 2007 January 3.
Published in final edited form as:Psychiatry Res. 2006 December 1; 148(2-3): 133–142.
NIH
-PA Author Manuscript
NIH
-PA Author Manuscript
NIH
-PA Author Manuscript

al. 2004). Two analysis strategies have been used to evaluate WMHs on MR brain images: (1)semi-quantitative rating systems and (2) quantitative volumetric analyses. In semi-quantitativesystem, the WMHs are visually graded by trained expert raters. The rater assigns each MRimage a WMH severity score based on its visual similarity to ‘prototype’ MR images. Typicalscales range from low to high severity using 4-point or 10-point scales (Fazekas, et al. 1987;Bryan, et al. 1994; Yue, et al. 1997). This method requires subjective judgment; it describesthe WMHs through 4 or 10 crude grades. It does not allow accurate information about thelocation or volume of the WMHs, and thus may ignore some subtle WMH differences acrossgroups. Also different visual rating scales make it difficult to compare or reproduce the findingson WMHs across centers (Davis, et al. 1992).
For the quantitative analyses on WMHs, several methods have been explored to automaticallyor semi-automatically segment the WMHs. For example, K-Nearest Neighbor (KNN)classification method was used to automatically or semi-automatically label the T2-weightedMR brain images as gray matter, CSF and white matter lesions (Kikinis, et al. 1992; Swartz,et al. 2002; Anbeek, et al. 2004b; Anbeek, et al. 2004a). In this method, the classification ofan image voxel from a new patient relies on the voxel intensities and spatial information of apreviously manually classified training set. Since the MR image of different subjects at thesame center or across centers may have different intensity distribution ranges, and the normalanatomic variations across subjects lead to variability in the spatial features, this method mayencounter difficulties for some subjects. Other machine learning algorithms including artificialneural networks (Pachai, et al. 1998) have also been investigated for WMH segmentation,which may face similar dependencies on a training set. An automated method from Stamatakisis used to delineate large brain lesions on T1-weighted structural images, which involvescomparing the smoothed individual T1-weighted image to a control group using general linearmodel (GLM). The accuracy of this method depends on the performance of the spatialnormalization technique. The normal anatomical variations in brain structure between theindividual subject and the control group may present a problem for the registration accuracyand GLM, so a Gaussian smoothing filter is used to smooth out the anatomical differences,which may also affect the reliability of the volumetric quantification of the lesions (Stamatakisand Tyler 2005).
On T2-weighted FLAIR MR images, the WMHs usually have a higher intensity than normalwhite matter (WM). Some methods automatically or semi-automatically segment the WMHson FLAIR images by defining a cut-off threshold on the images. For example, 3.5 standarddeviations (SD) of the intensity value of the normal WM has been used as the lower intensitythreshold for WMH segmentation (Hirono, et al. 2000). The histogram of the FLAIR imagehas been used in a regression model to decide on a cut-off intensity threshold, with the pixelsabove the threshold classified as WMHs (Jack, et al. 2001). Another method uses the meanand standard deviations of the gray matter, white matter and CSF to estimate the intensitythreshold for WMH, in which a probability map is used to favor the most likely WM regions(Wen and Sachdev 2004). These methods use only a single intensity threshold to segment theWMHs for the whole brain or for each slice of the brain images, which may misclassify somenon-WMHs as WMHs, since some gray matter demonstrates signal intensity above thethreshold (Hirono, et al. 2000), and also the image intensity inhomogeneities may beproblematic. To exclude the misclassified voxels, a manually outlined mask of WMHs withsurrounding WM, GM and CSF has been used as WMH mask in Hirono’s paper, while inWen’s paper a WM probability map (MNI 152 brains) has been used to favor the most likelyWM regions. Manually outlining the WMH mask of a 3D brain volume is time-consuming andlabor-intensive, while using a WM probability map in a MNI template to favor the WM regionsin the WMH segmentation of the subjects will make the segmentation accuracies dependenton an accurate inter-subject registration.
Wu et al. Page 2
Psychiatry Res. Author manuscript; available in PMC 2007 January 3.
NIH
-PA Author Manuscript
NIH
-PA Author Manuscript
NIH
-PA Author Manuscript

Previous research suggests that the location or distribution of WMHs is associated with specificsymptoms (Benson, et al. 2002). Most previous research focused only on WMH visualinspection or volume measurement and did not distinguish anatomically distinct WMHs, whilea few groups have explored semi-automated or automated methods to localize WMHs intolarge compartments or catergories such as periventricular white matter hyperintensities(PVWMHs) and deep white matter hyperintensities (DWMHs). For example, in (Swartz, et al.2002), a 3D classification algorithm was applied to separate DWMHs from PVWMHs. Otherinvestigators have used nonlinear image registration methods to convert the WMHs acrosssubjects into a standard space (Taylor, et al. 2003; DeCarli, et al. 2005).
In the current study, we present an alternative automated method for WMH quantification andlocalization, which uses a fuzzy connected algorithm to segment the WMHs, and theAutomated Labeling Pathway (ALP) to localize the WMHs into the anatomical space (Wu, etal. In Press). Previous research used fuzzy connected algorithm for semi-automated WMHsegmentation (Miki, et al. 1997; Udupa, et al. 1997), which required some user interaction anddid not give spatial information on the WMHs. Our automated method uses the histogram ofthe FLAIR image to automatically generate the WMH seeds, and then the fuzzy connectedalgorithm uses specific parameters to form a WMH cluster (containing the respective seed).The system updates the seeds iteratively and combines the scattered WMH clusters into thefinal WMH segmentation. Since the fuzzy connected algorithm uses different parameters foreach seed, this method enables different threshold for each WMH cluster and avoids a singlecut-off threshold for the whole brain or brain slice. This potentially offers more precise WMHsegmentation. The method automatically identifies WMH seeds and generates WMHsegmentation, which is objective and does not require any manual interaction. A fullydeformable registration (ALP, Wu, In Press), which combines the piecewise linear registrationfor coarse alignment with Demons algorithm for voxel-level refinement, is used for accurateWMH localization on the Johns Hopkins University White Matter Atlas (Wakana, et al.2004).
We report the results of a quantitative assessment WMH of a group of elderly control subjectscompared to a group LLD subjects. This group was chosen because it is known that thesesubjects have a high WMH burden (O’Brien, et al. 1996). We compare the WMH volumesidentified with our approach to the gold standard assessments based on manual expert ratings.Additionally, the anatomical localization of the WMHs found with our approach is described,and the WMH burden of the control group is region-wise statistically compared to that of theLLD patient group.
MATERIALS AND METHODSSubjects
The 19 subjects (eleven patients and eight controls) were recruited through the University ofPittsburgh Intervention Research Center for Late-Life Mood Disorders. Subjects were 63 to81 years of age (mean age 72.3, standard deviation 4.86), whose WMH visual scores rangedfrom 0.5 to 6.5 (mean WMH score 2, standard deviation 1.6). All subjects (controls anddepressed) received a SCID-IV evaluation, which was reviewed in a diagnostic consensusconference. Eleven of the 19 subjects were diagnosed as depressed patients; while theremaining eight subjects were termed control subjects.
The 11 patients had late-onset late-life depression; they met DSM-IV criteria for MajorDepressive Disorder (American Psychiatric Association, 2000) and their depression began atthe age of 60 years or older. The mean Hamilton Depression Rating Scale on patients was 20.3(standard deviation ± 4.9). The subjects did not have significant cognitive impairment; meanMattis Dementia Rating Scale was 136.3 (standard deviation ± 5.9). They were all participants
Wu et al. Page 3
Psychiatry Res. Author manuscript; available in PMC 2007 January 3.
NIH
-PA Author Manuscript
NIH
-PA Author Manuscript
NIH
-PA Author Manuscript

in a research trial of antidepressant medications. Other than Major Depressive Disorder (forsubjects in the depressed group) and anxiety disorders, all other Axis I psychiatric disorderswere used as exclusion criteria. We chose to include subjects with co-morbid anxiety disordersdue to the high prevalence (48%) of anxiety disorders in subjects with late-life depression(Beekman, et al. 2000).
Each subject was assessed by the Mini Mental State Examination (MMSE), Hamilton RatingScale for Depression (Hamilton), and Mattis Dementia Rating Scale (Mattis). Clinicalcharacteristics of the subjects (patients and controls) are summarized in Table 1. The 2 groupswere well balanced with respect to gender and age.
The MR images used in the current analyses were obtained at the time of subject enrollment,before the antidepressant medication was started. This study was approved by the Universityof Pittsburgh Institutional Review Board (IRB). Written informed consent was obtained.
MR Imaging ParametersMagnetic resonance images were acquired on a 1.5 Tesla Signa Scanner (GE Medical Systems,Milwaukee, WI). The 3D structural MR images were acquired at sagittal orientation using 3DSpoiled GRASS (SPGR, TR/TE = 5/25 ms; flip angle = 40º; FOV = 24×18cm, slice thickness= 1.5mm, matrix = 256×192 matrix).
The following axial series were also obtained: T1-weighted (TR/TE = 500/11 ms, Nex = 1);fast fluid-attenuated inversion recovery (fast FLAIR) (TR/TE 9002/56 ms Ef; TI = 2200 ms,NEX = 1). Section thickness was 5 mm with a 1-mm inter-section gap. All axial sequenceswere obtained with a 24 cm field of view and a 192 x 256 pixel matrix. Slice thickness andorientation were chosen so that the acquired images would be compatible with the WMH ratingscales described below.
White Matter Hyperintensity RatingsThe WMH ratings were based on a system developed for the Cardiovascular Health Study(CHS; Bryan, et al. 1994; Yue, et al. 1997). A numerical rating for the WMHs was assignedby the comparison of each subject’s imaging data to predefined CHS visual standards andrepresentative of progressive severity within a 10-point scale (0 through 9). Two ratersindependently evaluated WMH on the FLAIR images. If they differed in their ratings by onepoint, the final rating was the mean of the two values. A greater than one-point differencebetween raters was considered as a disagreement, and was adjudicated by consensus.
Automated WMH Segmentation and LocalizationThe major steps of the automated WMH segmentation procedure involved (1) imagepreprocessing, (2) automated WMH segmentation, and (3) automated WMH localization.Image preprocessing included skull stripping of the SPGR and FLAIR brain images, whichimproved the accuracies of WMH segmentation and localization. For the skull stripping on theFLAIR images, we used the Brain Extraction Tool (BET, Smith 2002) on the T1-weightedimages, which were acquired at the same location and voxel-size as the FLAIR images. Theresulting stripped T1-weighted image was then used as a brain mask to remove the skull andscalp from the FLAIR image.
This automated WMH segmentation method involved four steps: (1) automatically identifyingWMH seeds based on the intensity histogram of the FLAIR image, (2) using a fuzzy connectedalgorithm to segment the WMH clusters, (3) iteratively updating the set of seeds, and (4)combining the WMH clusters into the final WMH segmentation. The histogram of the skull-stripped FLAIR image was used to define a threshold (mean + 3 × SDs) for seed selection;
Wu et al. Page 4
Psychiatry Res. Author manuscript; available in PMC 2007 January 3.
NIH
-PA Author Manuscript
NIH
-PA Author Manuscript
NIH
-PA Author Manuscript

voxels beyond this threshold were classified as WMHs, which were used as seeds in the fuzzyconnected algorithm to segment surrounding WMH voxels. The background of the FLAIRimage was excluded when calculating its intensity histogram, mean intensity and standarddeviation. In the fuzzy connected algorithm, the fuzzy adjacency and affinity, both between 0and 1, are defined for each pair of voxels (a,b): the fuzzy adjacency μα(a,b) defines how closethe two voxels are, while the affinity μk (a,b) (determined based on adjacency degree μα(a,b)and intensity similarity) indicates how strongly the two voxels “hang together” in space andintensity. A fuzzy connected object is a set of voxels O with properties as follows: any twovoxels (a,b) from O have an affinity μk (a,b) > x , 0 ≤ x ≤1, and for any pair a ∈ O,b ∉ O, theaffinity μk (a,b) < x,0 ≤ x ≤ 1, a detailed and precise mathematics definition is given in Udupa,et al. (1996) and Udupa, et al. (1997). For each selected WMH seed the fuzzy connectedalgorithm generates a fuzzy object, within which each pair of voxels has a strong fuzzyconnectedness or affinity (above certain threshold, 0.5 in this study), and the systemautomatically delineates a 3D WMH cluster containing the respective seed. Multiple 3DFLAIR image WMH clusters are generated from the set of automatically selected seeds andthen combined to form an overall WMH segmentation volume.
The flow chart of the WMH segmentation is shown in Fig. 1. The fully automated WMHsegmentation system was implemented in C++ and ITK. The WMH segmenation algorithm isavailable to the readers upon request through our website(http://www.pitt.edu/~aizen/GPN_Home.html).
Automated Labeling Pathway (ALP, see Fig. 2) is an automated method we developed in aseries of functional and structural MRI studies to automatically label specific anatomic regionsof interest (Rosano, et al.; Aizenstein, et al. In Press; Wu, et al. In Press). The pathway combinesa series of publicly available software packages such as AFNI (Cox, 1996), BET (Smith,2002), FLIRT (Jenkinson, 2002) and ITK(Yoo, 2004), as well as some locally developedprograms to implement atlas-based segmentation of MR images. ALP is used to automaticallylabel ROIs on the SPGR image of a subject.
In ALP described in Wu, et al. (In Press), the inter-subject registration (templatecolin27→subject 3D SPGR) is done using a fully deformable registration model similar to thatdescribed by Chen (1999). We have implemented this using the registration library in InsightSegmentation and Registration Toolkit (ITK, Yoo 2004). This method starts with a grid-basedpiecewise linear registration and then uses a demons registration algorithm as a fine-tuningprocedure for a voxel-level spatial deformation. The fully deformable registration allows fora high degree of spatial deformation, which seems to give it a particular advantage over otherstandard registration packages, such as Automated Image Registration (AIR) and StatisticalParametric Mapping (SPM).
An overview of WMH localization procedure is summarized in Fig. 3. The high-resolutionreference image (MNI colin27) is registered to the T1-weighted SPGR high-resolution imageof the subject using ALP, and the Johns Hopkins University White Matter Atlas (defined onthe reference brain MNI colin27 image) is warped into each individual’s anatomic image space.Then the anatomic information in subject SPGR space is transformed further into the subject’sFLAIR image space by rigid-body registration between the subject SPGR image and subjectT1 in-plane image, which was acquired the same slice prescription as the subject’s FLAIRimage. In this way, the anatomical information in the atlas is carried into the subject’s FLAIRspace and the ROIs labeled on the subject’s FLAIR image are used as binary masks to localizethe WMHs. In this procedure, the WMH localization task is viewed as a registration procedure.The Johns Hopkins University White Matter Atlas we used in the current study is based onhigh-resolution diffusion tensor MR imaging and 3d tract reconstruction. The atlas has 17
Wu et al. Page 5
Psychiatry Res. Author manuscript; available in PMC 2007 January 3.
NIH
-PA Author Manuscript
NIH
-PA Author Manuscript
NIH
-PA Author Manuscript

prominent white tracts including anterior thalamic radiation (ATR), cingulum (Cg) and othertracts (Wakana, et al. 2004), as listed in Table 2.
Prior to the ALP registration procedure, the non-brain tissues such as skull and scalp arestripped from the subject’s 3D SPGR image using BET (Smith 2002). A simple morphologicalmethod involving threshold, erosion, dilation and hole-filling is used to improve the skullstripping result (Wu, et al. 2005). Also a rigid alignment of the anterior and posteriorcommissures (AC-PC) and intensity normalization are done on each subject’s 3D SPGR imageas well as on the template colin27, which gives each subject the same orientation and imageintensity distribution as the template, and therefore improves the registration accuracy.
RESULTS AND DISCUSSIONA subject with some discrete lesions (as well as confluent lesions) is chosen to demonstratethe results of this WMH extraction algorithm. Nine pairs of the segmented WMH slices versuscorresponding FLAIR slices from the subject are displayed in Fig. 4, showing this method’seffectiveness in the segmentation of discrete as well as confluent WMHs.
WMH segmentation EvaluationThe WMH segmentation results of 19 subjects using this automated method were statisticallycompared to the WMH visual grades from the manual ratings. The comparison was done witha linear regression model. In this study we chose to use semi-quantitative CHS ratings as thegold standard for comparison. An alternative approach would have been to use manuallysegmented WMH tracings. Since the two measures being compared used different metrics, weare only demonstrating a correlation between the measures rather an absolute agreement.
The WMH volumes of the 19 subjects from the automated segmentation method were foundto be significantly correlated to the visual grades with a R-squared = 0.909 and F(1,18) = 170.7,P < 0.0001. Since the visual grade is a global index to the WMH severity on the subject brainimage, the WMH volume is normalized by the overall WM volume (calculated from SPGRbrain image). The normalized WMH results were also significantly correlated to the visualgrades (R-squared = 0.909, F(1,18) = 170.3, P < 0.0001). This WM normalization method maynot be the best way for whole brain adjustment, since previous studies have showed that WMHare significantly related to atrophy (Capizzano, et al. 2004; Schmidt, et al. 2005). A wholebrain normalization method, which takes brain atrophy into consideration, may be better forWMH assessment.
The high correlation between the normalized WMH quantifications from the automated methodand the visual grades demonstrates that this automated method can successfully segment theWMHs on MR FLAIR images.
Localization of WMHsUsing ALP, the Johns Hopkins University White Matter Atlas was transferred to subject’s 3DSPGR image and further carried into subject FLAIR image space. The atlas regions in thesubjects’ FLAIR image space were then used as ROI masks to localize the WMHs. Fig. 5 showsthe segmented ROIs in MNI template colin27 space, the individual SPGR structural space andFLAIR image spaces; respective MR images are also shown as underlay images.
The localized WMH volumes were quantified by multiplying voxel size by the number ofWMH voxels inside the ROIs including anterior thalamic radiations, corticospinal tracts etc,as listed in Table 2. The WMH volume estimates from WMH localization describe the spatialdistribution of the WMH burden, which can facilitate further research on the role of WMH inpathogenesis of neuropsychiatric disorders. In Table 2, for each region of interest, the WMH
Wu et al. Page 6
Psychiatry Res. Author manuscript; available in PMC 2007 January 3.
NIH
-PA Author Manuscript
NIH
-PA Author Manuscript
NIH
-PA Author Manuscript

volumes of the LLD patient group were statistically compared to the WMH volumes of thecontrol group using two-tailed two-sample unequal variance t-test. We found a significantdifference in whole brain WMH volume between the LLD patient group and the control group;however, the results from the WMH localization method provide more anatomical specificity.As shown in Table 2, there was significant difference in WMH spatial distribution betweenLLD patient group and control group in regions including right anterior thalamic radiation,corpus callusum (CC), inferior fronto occipital (IFO), inferior longitudinal fasciculus (ILF),and right uncinate fasciculus (UNC), while no significant difference was found in cingulum(CgLL, CgLR, CgUL, CgUR) and superior longitudinal fasciculus (SLFBL, SLFBR, SLFTL,SLFTR).
The current study is limited by the low-resolution FLAIR image, as well as the limited numberof subjects (11 patients and 8 control subjects). The analyzed FLAIR images were acquiredwith a slice thickness of 5mm and a 1mm gap, which may be an inadequate resolution foraccurate volumetric quantification of the WMHs, which accordingly may affect the reliabilityof the group comparison results. A higher image resolution, such as a slice thickness of 2mmand with no gap, could improve the WMH quantification, and improve the registrationaccuracy, which would lead to more accurate WMH localization. Also a larger group of well-characterized LLD subjects with a matched elderly non-depressed control group would addconfidence to the WMH localization findings in Table 2 that are specific for LLD.
The WMH segmentation and localization method we described provides more specific andmore accurate information about WMH volume and spatial distribution than visual WMHgrades. Also the fully automated method is objective and it does not require any manualinterventions. Unlike different visual grading systems, it is very easy to compare the WMHfindings from this method across different centers. The method relies on the properties ofsubject’s own FLAIR image such as the intensity distribution of WMHs, the connectivity andthe diffusivity of the WMHs for the WMH segmentation, which does not rely on any trainingdataset as do some of the reviewed methods (Kikinis, et al. 1992; Swartz, et al. 2002; Anbeek,et al. 2004b; Anbeek, et al. 2004a).
CONCLUSIONIn this report we presented and validated a new method for fully automated segmentation andlocalization of WMHs on MR images. The method adapts the fuzzy connected algorithm forWMH segmentation and uses a demons-based fully deformable registration for WMHlocalization. The automated WMH segmentation method was evaluated by comparing theresulting WMH quantifications (non-normalized or normalized by total WM volumes) of the19 elderly subjects subjects (11 late-life depressed subjects and 8 elderly controls) with thestandard visual grading approach for estimating WMH burden. In the comparisons we founda high correlation of the WMH ratings between our new semi-automated approach and themanual ratings. Specifically, the two methods correlate with R-squared = 0.909, P <0.0001.Further localization of WMH follows the expected patterns of LLD, i.e., high WMH burdenin the subcortical, and frontal regions.
Quantification and localization of WMH volumes is critical for research into the risk factorsand pathogenesis of neuropsychiatric disorders. Most previous methods were labor intensive,subjective, and provided little if any anatomic localization. The current method solves manyof the previous limitations: it does not require any manual intervention, provides WMH volumeestimates, and localizes the WMH burden to a number of anatomic ROIs. Methods such asdescribed here are particularly relevant given the emergence of large MRI databases, such asthat provided by the Alzheimer’s Disease Neuroimaging Initiative(http://www.loni.ucla.edu/ADNI/).
Wu et al. Page 7
Psychiatry Res. Author manuscript; available in PMC 2007 January 3.
NIH
-PA Author Manuscript
NIH
-PA Author Manuscript
NIH
-PA Author Manuscript

The development and implementation of an automated method for quantifying and localizingWMH will facilitate further, fine-grained understanding of: 1) short- AND long-term treatmentresponse; 2) evolution of cognitive functioning in late life depression; 3) evolution ofleukoarisosis in LLD; 4) impact of medical and pschiatric treatment on WMHs in LLD; and5) modeling of cognitive impairment in LLD: e.g., is diminution in speed of informationprocessing driven primarily by WMH, beta amyloid deposition, or both?
Acknowledgements
This work is supported in part by NIH grants MH64678, MH37869, MH043832, MH067710, P30MH52247, andP30MH71944.
ReferencesAizenstein HJ, Butters MA, Figurski JL, Stenger VA, Reynolds CFI, Carter CS. Prefrontal and striatal
activation during sequence learning in geriatric depression. Biological Psychiatry. In PressAnbeek P, Vincken KL, van Osch MJ, Bisschops RH, van der Grond J. Automatic segmentation of
different-sized white matter lesions by voxel probability estimation. Medical Image Analysis 2004a;8(3):205–215. [PubMed: 15450216]
Anbeek P, Vincken KL, van Osch MJ, Bisschops RH, van der Grond J. Probabilistic segmentation ofwhite matter lesions in MR imaging. Neuroimage 2004b;21(3):1037–1044. [PubMed: 15006671]
American Psychiatric Association 2000. Diagnostic and Statistical Manual of Mental Disorders DSM-IV-TR. American Psychiatric Association;
Beekman AT, de Beurs E, van Balkom AJ, Deeg DJ, van Dyck R, van Tilburg W. Anxiety and depressionin later life: co-occurrence and communality of risk factors. American Journal of Psychiatry 2000;157(1):89–95. [PubMed: 10618018]
Benson RR, Guttmann CRG, Wei X, Warfield SK, Hall C, Schmidt JA, Kikinis RIWL. Older peoplewith impaired mobility have specific loci of periventricular abnormality on MRI. Neurology2002;58:48–55. [PubMed: 11781405]
Bryan R, Manolio T, Schertz L, Jungreis C, Poirier V, Elster A, Kronmal H. A method for using MR toevaluate the effects of cardiovascular disease on the brain: the Cardiovascular Health Study. AmericanJournal of Neuroradiology 1994;15:1625–1633. [PubMed: 7847205]
Capizzano AA, Ación L, Bekinschtein T, Furman M, Gomila H, Martínez A, Mizrahi R, Starkstein SE.White matter hyperintensities are significantly associated with cortical atrophy in Alzheimer’s disease.Journal of Neurology Neurosurgery and Psychiatry 2004;75:822–827.
Chen, M. 3-D deformable registration using a statistical atlas with applications in medicine. CarnegieMellon University.; 1999.
Davis PC, Gray L, Albert MS, Wilkinson W, Hughes J, Heyman A, Gado M, Kumar AJ, Destian S, LeeC. The consortium to establish a registry for Alzheimer’s disease (CERAD). Part III. reliability ofastandardized MRI evaluation of Alzheimer’s disease. Neurology 1992;42(9):1676–1680. [PubMed:1513454]
DeCarli C, Fletcher E, Ramey V, Harvey D, Jagust WJ. Anatomical mapping of white matterhyperintensities (WMH): exploring the relationships between periventricular WMH, Deep WMH,and total WMH burden. Stroke 2005;36:50–55. [PubMed: 15576652]
Fazekas F, Chawluk J, Alavi A, Hurtig H, Zimmerman R. MR signal abnormalities at 1.5 T in Alzheimer’sdementia and normal aging. American Journal of Roentgenology 1987;149(2):351–6. [PubMed:3496763]
Hickie I, Scott E. Late-onset depressive disorders: a preventable variant of cerebrovascular disease?Psychological Medicine 1998;28(5):1007–1013. [PubMed: 9794008]
Hirono N, Hajime K, Kazui H, Hashimoto M, Mori E. Impact of white matter changes on clinicalmanifestation of Alzheimer’s disease a quantitative study. Stroke 2000;31:2182 – 2188. [PubMed:10978049]
Jack CR Jr, O’Brien PC, Rettman DW, Shiung MM, Xu Y, Muthupillai R, Manduca A, Avula R, EricksonBJ. FLAIR histogram segmentation for measurement of leukoaraiosis volume. Journal of MagneticResonance Imaging 2001;14(6):668–676. [PubMed: 11747022]
Wu et al. Page 8
Psychiatry Res. Author manuscript; available in PMC 2007 January 3.
NIH
-PA Author Manuscript
NIH
-PA Author Manuscript
NIH
-PA Author Manuscript

Kikinis R, Shenton ME, Gerig G, Martin J, Anderson M, Metcalf M, Guttman CR, McCarley RW,Lorenson W, Cline H, et al. Routine quantitative analysis of brain and cerebrospinal fluid spaces withMR imaging. Journal of Magnetic Resonance Imaging 1992;2:619–629. [PubMed: 1446105]
Miki Y, Grossman RI, Udupa JK, Samarasekera S, van Buchem MA, Cooney BS, Pollack SN, KolsonDL, Constantinescu C, Polansky M, et al. Computer-assisted quantitation of enhancing lesions inmultiple sclerosis: correlation with clinical classification. American Journal of Neuroradiology1997;18(4):705–710. [PubMed: 9127034]
Mirsen T, Lee D, Wong C, Diaz J, Fox A, Hachinski V, Merskey H. Clinical correlates of white-matterchanges on magnetic resonance imaging scans of the brain. Archives of Neurology 1991;48:1015–1021. [PubMed: 1929891]
O’Brien J, Ames D, Schwietzer I. White matter changes in depression and Alzheimer’s disease: a reviewof magnetic resonance imaging studies. International Journal of Geriatric Psychiatry 1996;11:681–694.
Pachai C, Zhu YM, Grimaud J, Hermier M, Dromigny-Badin A, Boudraa A, Gimenez G, Confavreux C,Froment JC. A pyramidal approach for automatic segmentation of multiple sclerosis lesions in brainMRI. Computerized Medical Imaging and Graphics 1998;22:399–408. [PubMed: 9890184]
Rosano C, Becker J, Lopez O, Lopez-Garcia P, Carter C, Newman A, Kullere L, Aizenstein H.Morphometric analysis of gray matter volume in demented older adults: exploratory analysis of theCardiovascular Health Study brain MRI database. Neuroepidemiology 2005;24(4):221–229.[PubMed: 15832060]
Schmidt R, Ropele S, Enzinger C, Petrovic K, Smith S, Schmidt H, Matthews PM, Fazekas F. Whitematter lesion progression, brain atrophy, and cognitive decline: the Austrian stroke prevention study.Annals of Neurology 2005;58(4):610–616. [PubMed: 16178017]
Smith SM. Fast robust automated brain extraction. Human Brain Mapping 2002;17(3):143–55. [PubMed:12391568]
Stamatakis EA, Tyler LK. Identifying lesions on structural brain images-Validation of the method andapplication to neuropsychological patients. Brain and Language 2005;94:167–177. [PubMed:15896391]
Swartz RH, Black SE, Feinstein A, Rockel C, Sela G, Gao FQ, Caldwell CB, Bronskill MJ. Utility ofsimultaneous brain, CSF and hyperintensity quantification in dementia. Psychiatry ResearchNeuroimaging 2002;116:83–93.
Taylor WD, MacFall JR, Steffens DC, Payne ME, Provenzale JM, Krishnan KR. Localization of age-associated white matter hyperintensities in late-life depression. Progress in Neuro-Psychopharmacology & Biological Psychiatry 2003;27(3):539–544. [PubMed: 12691791]
Thomas AJ, Kalaria RN, O’Brien JT. Depression and vascular disease: what is the relationship? Journalof Affective Disorders 2004;79(1–3):81–95. [PubMed: 15023483]
Udupa JK, Samarasekera S. Fuzzy connectedness and object definition: theory, algorithms, andapplications in image segmentation. Graphical Models and Image Processing 1996;58(3):246–261.
Udupa JK, Wei L, Samarasekera S, Miki Y, Van Buchem M, Grossman R. Multiple sclerosis lesionquantification using fuzzy-connectedness principles. IEEE Transactions on Medical Imaging1997;16(5):598–609. [PubMed: 9368115]
van Gijn J. Leukoaraiosis and vascular dementia. Neurology 1998;51(3 Suppl 3):S3–8. [PubMed:9744823]
Wakana S, Jiang H, Nagae-Poetscher LM, van Zijl PCM, Mori S. Fiber tract–based atlas of human whitematter anatomy. Radiology 2004;230:77–87. [PubMed: 14645885]
Wen W, Sachdev P. The topography of white matter hyperintensities on brain MRI in healthy 60- to 64-year-old individuals. Neuroimage 2004;22(1):144–154. [PubMed: 15110004]
Wu M, Carmichael O, Carter CS, Figurski JL, Lopez-Garcia P, Aizenstein HJ. Quantitative comparisonof neuroimage registration by AIR, SPM, and a fully deformable model. Human Brain Mapping. InPress
Wu, M.; Rosano, C.; Aizenstein, HJ. A morphological method to improve skull stripping of MR brainimages. Toronto, Canada: 2005.
Yoo, T. Insight into Images: Principles and Practice for Segmentation, Registration, and Image Analysis.Wellesey, MA: AK Peters Ltd; 2004.
Wu et al. Page 9
Psychiatry Res. Author manuscript; available in PMC 2007 January 3.
NIH
-PA Author Manuscript
NIH
-PA Author Manuscript
NIH
-PA Author Manuscript

Yue N, Arnold A, Longstreth W, Elster A, Jungreis C, O’Leary D, Poirier V, Bryan R. Sulcal, ventricular,and white matter changes at MR imaging in the aging brain: data from the Cardiovascular HealthStudy. Radiology 1997;202:33–39. [PubMed: 8988189]
Wu et al. Page 10
Psychiatry Res. Author manuscript; available in PMC 2007 January 3.
NIH
-PA Author Manuscript
NIH
-PA Author Manuscript
NIH
-PA Author Manuscript

Fig. 1.WMH Segmentation Flowchart. The processing steps used to automatically segment theWMHs on FLAIR MR brain images.
Wu et al. Page 11
Psychiatry Res. Author manuscript; available in PMC 2007 January 3.
NIH
-PA Author Manuscript
NIH
-PA Author Manuscript
NIH
-PA Author Manuscript
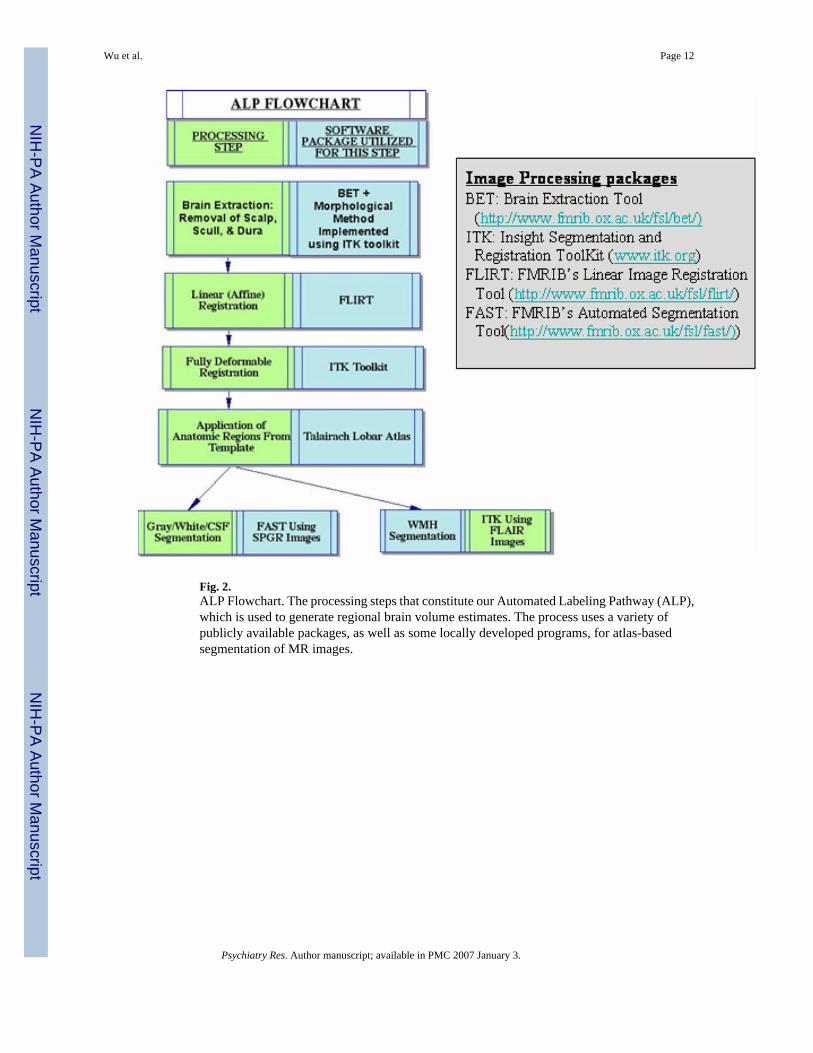
Fig. 2.ALP Flowchart. The processing steps that constitute our Automated Labeling Pathway (ALP),which is used to generate regional brain volume estimates. The process uses a variety ofpublicly available packages, as well as some locally developed programs, for atlas-basedsegmentation of MR images.
Wu et al. Page 12
Psychiatry Res. Author manuscript; available in PMC 2007 January 3.
NIH
-PA Author Manuscript
NIH
-PA Author Manuscript
NIH
-PA Author Manuscript

Fig. 3.An overview of the WMH localization procedure.
Wu et al. Page 13
Psychiatry Res. Author manuscript; available in PMC 2007 January 3.
NIH
-PA Author Manuscript
NIH
-PA Author Manuscript
NIH
-PA Author Manuscript

Fig. 4.Automated WMH segmentation results on the FLAIR MR images of one subject. Nine pairedimage slices on the subject are shown here. In each paired slices, the left slice is the FLAIRslice and the right one is the associated automated WMH segmentation result.
Wu et al. Page 14
Psychiatry Res. Author manuscript; available in PMC 2007 January 3.
NIH
-PA Author Manuscript
NIH
-PA Author Manuscript
NIH
-PA Author Manuscript

Fig. 5.The result of atlas-based segmentation from ALP. Segmentation results are shown at axialorientation in the top row and the coronal orientation in the bottom row. (a) The MNI templatecolin 27, overlapped with the Johns Hopkins University White Matter Atlas (i.e., Anteriorthalamic radiation, corpus callosum, corticospinal tract, inferior fronto occipital, inferiorlongitudinal fasciculus, superior longitudinal fasciculus, right uncinate fasciculus etc. (b) Asingle subject 3d SPGR image, overlapped with the transformed ROIs. (c) The same singlesubject FLAIR image, overlapped with the transformed ROIs.
Wu et al. Page 15
Psychiatry Res. Author manuscript; available in PMC 2007 January 3.
NIH
-PA Author Manuscript
NIH
-PA Author Manuscript
NIH
-PA Author Manuscript

NIH
-PA Author Manuscript
NIH
-PA Author Manuscript
NIH
-PA Author Manuscript
Wu et al. Page 16
Table 1Clinical Characteristics of the subjects.
Group I (Depressed) Group II (Controls) t-test probability
No. of subjects 11 8Age, year (range) 72.2±5.3 (63–80) 72.3±4.8 (67–81) 0.93560809Gender, M/F 5/6 4/4WMH scores ± SD 2.55±1.9 1.25±0.5 0.05412192MMSE ± SD 27.7±3.6 28.8±1.5 0.40560931Hamilton ± SD 20.3±4.9 2±2.07 2.2477E-08MATTIS ± SD 136.3±5.9 139.9±3.4 0.11628563
Statistical comparisons utilized a two-sample, unequal variance, two-tailed Student’s t-test.
Psychiatry Res. Author manuscript; available in PMC 2007 January 3.

NIH
-PA Author Manuscript
NIH
-PA Author Manuscript
NIH
-PA Author Manuscript
Wu et al. Page 17
Table 2Mean Volumes of WMH (mm3) per region for the control group (8 controls) versus the patient group (11 patients)and the t-test results on normalized WMHs.
Region\ Group Mean WMH VolumeControl (mm3)
Mean WMH Volume Patient(mm3)
Two tailed t-test on NormalizedWMH
Whole Brain 2737.3437 8541.030942 0.042665436ATRL 649.7712 2211.418354 0.055444463ATRR 821.34 1764.802473 0.018656432CCF 201.6846 1165.593838 0.016828416CCO 416.1456 1529.608106 0.012737393CSTL 148.2975 309.167762 0.057927493CSTR 158.3361 652.5467107 0.060871669CgLL 35.1351 110.2963835 0.081089283CgLR 8.6697 40.42591736 0.060644356CgUL 11.8638 550.094162 0.136364206CgUR 24.1839 29.50488595 0.818743765IFOL 338.1183 1226.836086 0.034295001IFOR 478.6587 2039.035002 0.039086461ILFL 192.5586 716.5644694 0.018575153ILFR 214.9173 860.4083306 0.038395966
SLFBL 273.3237 929.735762 0.35930778SLFBR 156.9672 1441.153785 0.300544506SLFTL 128.6766 717.4695273 0.405860665SLFTR 46.5426 761.4553388 0.297697885UNCL 104.0364 430.2645025 0.168513136UNCR 139.1715 327.8119537 0.030380464
Keys: ATRL/R-anterior thalamic radiation (left or right), CCF/O-corpus callusum (frontal or occipital), CSTL/R-corticospinal tract (left or right), CgLL/R-cingulate (lower part left or right), CgUL/R-cingulate (upper part left or right), IFOL/R-interior frontooccipital fasciculus (left or right), SLFBL/F-entire superiro longitudinal fasciculus (left or right), SLFTL/F-superiro longitudinal fasciculus (the branch to the temporal lobe, left or right), UNC-uncinate fasiculus(left or right).
Psychiatry Res. Author manuscript; available in PMC 2007 January 3.