
A Framework for Verifying Scalability and Performance of ...
127
UNIVERSITY OF TARTU Faculty of Mathematics and Computer Science Institute of Computer Science Distributed Systems Group Information Technology Mcaorptytai Vbacsdaer A Framework for Verifying Scalability and Performance of Cloud Based Web Applications Master thesis (30 ECTS) Supervisor: Dr. Satish Narayana Srirama Author: ............................................... “.....” May 2012 Supervisor: .......................................... “.....” May 2012 Head of the chair: ............................... “.....” ........... 2012 TARTU 2012
-
Upload
khangminh22 -
Category
Documents
-
view
0 -
download
0
Transcript of A Framework for Verifying Scalability and Performance of ...

U N I V E R S I T Y O F T A R T U
Faculty of Mathematics and Computer Science
Institute of Computer Science
Distributed Systems Group
Information Technology
Mcaorptytai Vbacsdaer
A Framework for VerifyingScalability and Performance ofCloud Based Web Applications
Master thesis (30 ECTS)
Supervisor: Dr. Satish Narayana Srirama
Author: ............................................... “.....” May 2012
Supervisor: .......................................... “.....” May 2012
Head of the chair: ............................... “.....” ........... 2012
TARTU 2012
Abstract
Network usage and bandwidth speeds have increased massively and vast ma-jority of people are using Internet on daily bases. This has increased CPUutilization on servers meaning that sites with large visits are using hundredsof computers to accommodate increasing traffic rates to the services. Makingplans for hardware ordering to upgrade old servers or to add new servers isnot a straightforward process and has to be carefully considered. There isa need to predict traffic rate for future usage. Buying too many servers canmean revenue loss and buying too few servers can result in losing clients.To overcome this problem, it is wise to consider moving services into virtualcloud and make server provisioning as an automatic step. One of the popu-lar cloud service providers, Amazon is giving possibility to use large amountsof computing power for running servers in virtual environment with singleclick. They are providing services to provision as many servers as neededto run, depending how loaded the servers are and whatever we need to do,to add new servers or to remove existing ones. This will eliminate problemsassociated with ordering new hardware. Adding new servers is an automaticprocess and will follow the demand, like adding more servers for peak hoursand removing unnecessary servers at night or when the traffic is low. Cus-tomer pays only for the used resources on the cloud. This thesis focuseson setting up a testbed for the cloud that will run web application, whichwill be scaled horizontally (by replicating already running servers) and willuse the benchmark tool for stressing out the web application, by simulatinghuge number of concurrent requests and proper load-balancing mechanisms.This study gives us a proper picture how servers in the cloud are scaled andwhole process remains transparent for the end user, as it sees the web appli-cation as one server. In conclusion, the framework is helpful in analyzing theperformance of cloud based applications, in several of our research activities.

Acknowledgements
This thesis would not be possible without the encouragement and super-vision of Satish Narayana Srirama. I am grateful for his support. I wouldalso like to thank Marlon Dumas giving opportunity to work with DistributeSystems Group, giving the resource and possibilities to work with privateand public cloud systems. Satish Narayana Srirama helped a lot for gettingstarted with cloud computing and running services in the cloud. It has beengreat experience to work together. My special thanks goes to Michele Maz-zucco for giving ideas about configuring servers in the cloud and assistancefor setting up different provisioning algorithms.
i

Contents
1 Introduction 11.1 Contributions . . . . . . . . . . . . . . . . . . . . . . . . . . . 31.2 Outline . . . . . . . . . . . . . . . . . . . . . . . . . . . . . . . 4
2 The State of Art 52.1 Cloudstone . . . . . . . . . . . . . . . . . . . . . . . . . . . . 52.2 To move or not to move . . . . . . . . . . . . . . . . . . . . . 62.3 Wikibench . . . . . . . . . . . . . . . . . . . . . . . . . . . . . 82.4 Web server farm in the cloud . . . . . . . . . . . . . . . . . . . 92.5 Services that support provisioning and auto scaling properties 9
3 Framework for Verifying Scalability and Performance 113.1 Problem statement . . . . . . . . . . . . . . . . . . . . . . . . 133.2 Cloud Computing . . . . . . . . . . . . . . . . . . . . . . . . . 13
3.2.1 Cloud computing as a Service . . . . . . . . . . . . . . 143.3 SciCloud project . . . . . . . . . . . . . . . . . . . . . . . . . 163.4 Eucalyptus . . . . . . . . . . . . . . . . . . . . . . . . . . . . 17
3.4.1 Eucalyptus architecture . . . . . . . . . . . . . . . . . 173.5 Amazon Cloud . . . . . . . . . . . . . . . . . . . . . . . . . . 21
3.5.1 Amazon EC2 and Auto Scaling . . . . . . . . . . . . . 213.5.2 Amazon pricing . . . . . . . . . . . . . . . . . . . . . . 22
3.6 MediaWiki architecture . . . . . . . . . . . . . . . . . . . . . . 223.6.1 Memcached reducing load on database server . . . . . . 243.6.2 LAMP stack . . . . . . . . . . . . . . . . . . . . . . . . 263.6.3 Operating system configuration . . . . . . . . . . . . . 29
3.7 Study of load balancers . . . . . . . . . . . . . . . . . . . . . . 303.7.1 Pen . . . . . . . . . . . . . . . . . . . . . . . . . . . . . 303.7.2 Nginx as reverse-proxy server . . . . . . . . . . . . . . 313.7.3 Comparison between nginx and pen . . . . . . . . . . . 33
3.8 Configuration of the infrastructure . . . . . . . . . . . . . . . 34
ii

3.8.1 Endpoints for SciCloud and Amazon . . . . . . . . . . 353.8.2 Setting up services and MediaWiki installation . . . . . 353.8.3 Wikipedia article dumps . . . . . . . . . . . . . . . . . 36
3.9 Framework scaling instances in the cloud . . . . . . . . . . . . 373.9.1 Calculating arrival rate . . . . . . . . . . . . . . . . . . 393.9.2 Removing servers from the cloud . . . . . . . . . . . . 39
3.10 Framework layout . . . . . . . . . . . . . . . . . . . . . . . . . 403.10.1 CloudController . . . . . . . . . . . . . . . . . . . . . . 413.10.2 ServerStatus . . . . . . . . . . . . . . . . . . . . . . . . 423.10.3 BenchMark . . . . . . . . . . . . . . . . . . . . . . . . 443.10.4 Additional HTTP server . . . . . . . . . . . . . . . . . 453.10.5 Distinguishing different servers by their role . . . . . . 45
4 Measuring Performance of The Cloud 484.1 Using performance measuring tools under Ubuntu . . . . . . . 48
4.1.1 Apache tool AB . . . . . . . . . . . . . . . . . . . . . . 484.1.2 Ubuntu sysstat package . . . . . . . . . . . . . . . . . 49
4.2 Using third party tools . . . . . . . . . . . . . . . . . . . . . . 504.2.1 RRD database . . . . . . . . . . . . . . . . . . . . . . 524.2.2 Collectd . . . . . . . . . . . . . . . . . . . . . . . . . . 524.2.3 Cacti . . . . . . . . . . . . . . . . . . . . . . . . . . . . 53
4.3 Framework Performance Measuring Tools . . . . . . . . . . . . 56
5 Preliminary Experiments and Evaluation of The Framework 585.1 Importance of experiments and stress testing . . . . . . . . . . 595.2 Identifying most suitable configuration . . . . . . . . . . . . . 59
5.2.1 Experiments with m1.small, m1.large and c1.medium
instances . . . . . . . . . . . . . . . . . . . . . . . . . . 615.2.2 Experiments configuration . . . . . . . . . . . . . . . . 615.2.3 Measuring service time . . . . . . . . . . . . . . . . . . 625.2.4 Measuring maximum throughput . . . . . . . . . . . . 635.2.5 Summary of different instance types performance . . . 645.2.6 CPU cycle waiting behind Xen hypervisor . . . . . . . 675.2.7 Measuring CPU utilization with ramp up . . . . . . . . 685.2.8 Determining concurrent connections . . . . . . . . . . . 69
5.3 Experiment to establish limits of the service for current con-figuration . . . . . . . . . . . . . . . . . . . . . . . . . . . . . 745.3.1 Deadlock triggered by MySQL . . . . . . . . . . . . . . 755.3.2 Fixing deadlock . . . . . . . . . . . . . . . . . . . . . . 755.3.3 Network utilization . . . . . . . . . . . . . . . . . . . . 765.3.4 CPU utilization . . . . . . . . . . . . . . . . . . . . . . 76
iii

5.3.5 Replicating MySQL and memcached instance . . . . . 775.3.6 Finding out network bandwidth upper limit . . . . . . 78
5.4 Validating difference between different availability zones in thesame region . . . . . . . . . . . . . . . . . . . . . . . . . . . . 79
5.5 Conclusion of the configuration optimization . . . . . . . . . . 825.5.1 MediaWiki configuration and tuning . . . . . . . . . . 825.5.2 PHP caching . . . . . . . . . . . . . . . . . . . . . . . 845.5.3 MySQL tuning . . . . . . . . . . . . . . . . . . . . . . 84
6 Policies and Validation of Scalability 866.1 Why is elasticity of the cloud important . . . . . . . . . . . . 866.2 Basic configuration for running the experiments . . . . . . . . 876.3 Traces used to test policies . . . . . . . . . . . . . . . . . . . . 906.4 Utilization policies . . . . . . . . . . . . . . . . . . . . . . . . 90
6.4.1 Auto Scale . . . . . . . . . . . . . . . . . . . . . . . . . 916.4.2 Auto Scale results . . . . . . . . . . . . . . . . . . . . . 93
6.5 Revenue based policies . . . . . . . . . . . . . . . . . . . . . . 956.5.1 Algorithm for provisioning the servers . . . . . . . . . . 956.5.2 Arrival rate for the next hour . . . . . . . . . . . . . . 976.5.3 Optimal heuristics . . . . . . . . . . . . . . . . . . . . 986.5.4 Optimal heuristics results . . . . . . . . . . . . . . . . 101
6.6 Summary and results . . . . . . . . . . . . . . . . . . . . . . . 103
7 Conclusions 105
8 Future Work 1078.1 Benchmark Tool Updates . . . . . . . . . . . . . . . . . . . . . 1078.2 Server Comparison . . . . . . . . . . . . . . . . . . . . . . . . 108
Raamistik pilvel pohinevate veebirakenduste skaleeruvuse ja
joudluse kontrollimiseks 109
Appendix 117
iv

List of Figures
3.1 A cluster-based web server configuration. . . . . . . . . . . . . 123.2 Layout of the Eucalyptus architecture, showing how the ser-
vices are connected with each other. Router enables accessfrom the outside world to connect with the cloud and runninginstances [54]. . . . . . . . . . . . . . . . . . . . . . . . . . . . 17
3.3 Flowchart showing how request and responses between differ-ent servers are being transferred when the requested page isalready cached. Note that MediaWiki still makes request todatabase to see, whatever the page exists and is not changed. . 23
3.4 Flowchart showing how request and responses between dif-ferent servers are being transferred when the requested pageis not cached. There are several queries and calls to mem-cached and MySQL server to compile the page. Once ready,the parsed page is stored in the memcached. . . . . . . . . . . 24
3.5 Cumulative distribution of response times for c1.medium in-stance with different caching policies. . . . . . . . . . . . . . . 26
3.6 Displaying experiment configuration in the cloud environmentand how the requests are going through. All the servers arelocated in the cloud, for reducing network latency, they arelocated in the same availability zone. . . . . . . . . . . . . . . 40
3.7 Showing interactions between cloud interface and virtual ma-chine running on the cloud through CloudController application. 41
3.8 Common life cycle of instance running in the cloud and recon-figured while the service change state [53]. . . . . . . . . . . . 43
4.1 Standard output of iosatat command. . . . . . . . . . . . . . 504.2 Standard output of sar using parameter to show memory usage. 504.3 Standard output of free to get information about physical
memory usage. . . . . . . . . . . . . . . . . . . . . . . . . . . 504.4 Standard output of sar using parameter to show CPU usage. 51
v

4.5 Standard output of ifconfig to gather network interface traf-fic bandwidth. . . . . . . . . . . . . . . . . . . . . . . . . . . . 51
4.6 Standard output of uptime to see information how long thecomputer has been running and also get Linux load for 1, 5and 15 minutes. . . . . . . . . . . . . . . . . . . . . . . . . . . 51
4.7 Standard output of ps with various options to gather howmany processes are working. Because command itself countsas a single process, these results should be subtracted by 1. . . 51
4.8 Showing Linux load gathered with Cacti and drawn by Cactiusing RRDTool. . . . . . . . . . . . . . . . . . . . . . . . . . . 54
4.9 Fraction of the experiment running 10 servers, showing averageCPU usage for Apache server and benchmark response time.For each 5 minutes, there is a spike, because cacti starts tomeasure metrics of the server. . . . . . . . . . . . . . . . . . . 55
4.10 Showing spikes caused by Cacti, when collecting different per-formance metrics from the server. . . . . . . . . . . . . . . . . 55
4.11 Modifying ServerStatus code and using JavaScript, it is possi-ble to draw graph of the CPU usage that can be viewed whenopening browser on port 5555. . . . . . . . . . . . . . . . . . . 57
5.1 Instance m1.small, c1.medium and m1.large service time dis-tribution. Left side shows service time cumulative distribution. 62
5.2 Instance m1.small response time and CPU usage for rampup test. In the case of this instance type server was able for6 requests at maximum and then the service became unre-sponsive. Only 40% of the CPU cycle was enabled for user.Most of the CPU cycle, over 55%, was going to steal, meaningthat virtualization was dividing available CPU usage to otherinstances on the same physical machine. . . . . . . . . . . . . 65
5.3 Instance c1.medium response time and CPU usage for rampup test. Server was able for 28 requests at maximum and atthe peak the average response time increased to 3 seconds andserver started to become oversaturated. . . . . . . . . . . . . . 66
5.4 Instance m1.large response time and CPU usage for rampup test. Server was able for 18 requests at maximum and atthe peak the average response time increased to 5 seconds andserver was heavily overloaded. . . . . . . . . . . . . . . . . . . 66
5.5 Ramp up experiment using c1.medium instances with 5 Apacheservers showing CPU utilization for different servers, whilegenerating load between 1 request per second to 150 requestsper second. . . . . . . . . . . . . . . . . . . . . . . . . . . . . 69
vi

5.6 Ramp up experiment showing difference between two Fair con-figuration (using 6 or 10 concurrent connections per Apacheserver) and without Fair using c1.medium instances with 5Apache servers. Left side graph shows CPU usage for Apacheservers and right side shows 1 minute load. . . . . . . . . . . . 70
5.7 Ramp up experiment showing difference between two Fair con-figurations (using 6 or 10 concurrent connections per Apacheserver) and without Fair using c1.medium instances with 5Apache servers. Left side graph shows average response timesfor requests and right side shows how many jobs are beingprocessed by Apache servers. . . . . . . . . . . . . . . . . . . . 71
5.8 Ramp up experiment showing difference between two Fair con-figurations (using 6 or 10 concurrent connections per Apacheserver) and without Fair using c1.medium instances with 5Apache servers. This shows amount of successful requests go-ing through the system. . . . . . . . . . . . . . . . . . . . . . 72
5.9 Concurrent connections experiment using c1.medium with 10Apache servers showing CPU utilization and servers through-put. Service rate shows, how many requests one Apache serveris capable of serving. . . . . . . . . . . . . . . . . . . . . . . . 73
5.10 Concurrent connections experiment using c1.medium with 10Apache servers showing Apache servers 1 minute load and re-sponse time. . . . . . . . . . . . . . . . . . . . . . . . . . . . . 73
5.11 Ramp up experiment with 20 c1.medium Apache servers andgenerating load up to 550 requests per second, showing CPUusage for different servers. Nginx used Fair module to dis-tribute the traffic (used the least round-robin), therefore therewere large CPU usage difference between various Apache serversat the beginning of the experiment. . . . . . . . . . . . . . . . 77
5.12 How to implement two nginx load balancers to increase re-dundancy and fault tolerance, and in the same time increas-ing maximum throughput of the service. For MySQL, thereshould be master-slave configuration, where updates and savesare done to the master and slave is used for reading operations. 80
5.13 Comparisons when running MediaWiki infrastructure with XCacheenabled and without XCache on c1.medium Amazon instance.These are response times with 30 second resolution. Both con-figurations used memcached with filled cached. . . . . . . . . . 85
vii
6.1 Left graph shows over provisioning, where the policy is runningmore servers than needed. Right graph shows situations ofunder provisioning, running fewer servers than needed. Graphat the top shows how dynamically allocated servers can handletraffic fluctuating in time. . . . . . . . . . . . . . . . . . . . . 88
6.2 Two week ClarkNet traffic trace with 1 minute intervals show-ing arrivals per second. The red line defines section of the traceused to generate the load for the service. This section has beenscaled up to 600 requests per second in the experiment. . . . . 90
6.3 Showing Amazon Auto Scale experiment configuration in thecloud. Servers were kept in the same availability zone to reducethe latency of requests. Autoscaling group has been created,where Auto Scale algorithm can replicate servers when thedemand increases and terminate servers from the group, whilethe demand decreases. . . . . . . . . . . . . . . . . . . . . . . 92
6.4 Running servers compared to arrival rate λ, CPU usage andresponse times over 24 hours using Amazon Auto Scale policy. 94
6.5 Removing servers should be done before full hour, becauseotherwise there is need to pay for the extra instance hour. . . 96
6.6 Adding servers is done at the full hour mark to make sure thatwhile the servers are added and needed to be removed, thereis no need to pay for the extra instance hour. . . . . . . . . . . 96
6.7 Revenue function values, when trying to find the optimal max-imum for 300 requests per second and 600 requests per secondusing erlang units to calculate the throughput. . . . . . . . . . 101
6.8 Running servers compared to arrival rate λ, CPU usage andresponse times over 24 hours using Optimal policy. . . . . . . 102
viii

Chapter 1
Introduction
Applications and services are moved to the cloud to provide elasticity andcustom configuration of the servers in a runtime. Cloud computing gives per-fect platform to deploy scalable applications, that can be provisioned by theincoming traffic rate or server utilization. This helps customers and serviceowners to save money, but in the same time have an immense capacity ofcomputing power in his hands, that can be unleashed with clicks, commandsor make it as an automatic process.
Applications running in the cloud are flexible, scalable and fault tolerant,if they are properly configured. Framework given by the cloud computingservice providers allows us to replicate the same servers already running inthe cloud. We can replace faulty servers by requesting new servers from thecloud. There are two common ways to scale service in the cloud: horizon-tally or vertically. Vertical scaling means that the servers are replaced withmore powerful machines while the demand increases (increasing CPU cores,memory, network bandwidth or hard drive speed) or replaced with slower ma-chines, if the demand decreases. Horizontal scaling means that new serversare added along to the already running servers while the demand increasesor already running servers are terminated, if the demand decreases. Eitherway, there is a need for the reasonable decision why to use one or anotherscaling methods, also have to consider how easy or hard it is to configuresuch changes. When requesting servers from the cloud pool, it takes sometime to become operational. With vertical scaling we have to ensure, thatclosing one server and activating another server is smooth process, where nodelays or rejections occur. It is easier to scale horizontally as there are fewersteps needed to be done when configuring the servers. For example, replac-ing MySQL with faster machine should be transparent, none of the incomingrequests should fail. Using vertical scaling, it means in order to replace ex-
1

isting MySQL server, we have to run a new server, replicate its state anddata into new machine, terminate the old server and made configuration inother servers, which use MySQL database and change the IP address withnew one.
Why is cloud computing becoming essential for running large applica-tions? One key aspect is that virtual machines are easier to install thantheir counterparts - physical servers. With physical servers, we need to makean extra cost and decisions how these servers should be managed. Not tomention extra cost on hardware, making disaster plan and having a solidbackup plan. Using virtual machines, everything is done by the data centerworkers and customer has to only use command line or graphical interface tomanage servers in the cloud, without having to know network topology andother problems related to installing physical servers. There is no need forcapacity planning as you can immediately request from the cloud new serverswithout need to buy or order them thus waiting for the arrival. The speedand capability to use large amount of CPU power is making cloud computingprestigious and many web pages have already deployed in the cloud.
With virtual machines, we have two states, whatever it is running or itdoes not. If something is wrong or the virtual machine has crashed, we caneasily replace it with a new machine just in a couple of minutes. Failurewith a physical machine means, that you have a box wasting the space andnot working. You need to find the cause of the problem and sometimesit can be tricky and time consuming operations. There might be faultymemory module or some of the components does not work any more as thehardware constantly wears off and ageing. This means investments to newhardware and making new configuration plans. If the hardware is not on-site, ordering and waiting for the piece to arrive can take days. With virtualcloud capabilities, this is taken care of other people and the system itself isseen from the web as high fault tolerant system, where single failure cannotcause service becoming unavailable.
Virtual computing allows us to produce virtual images with user’s appli-cations on it, that are easy to be replicated and scale them as the demandover the time for the service changes. This differs for physical machines,where every machine operating system (OS) has to be installed separatelyor use tools to duplicate first machine disk image to the other machines.This procedure involves physical contact with the machine, also users hasto have knowledge about the topology of their network and configuration ofthe system. Virtualization adds another abstraction layer, that one virtualsystem is able to run on any machine, despite of what hardware has beeninstalled. There is no need to worry about driver dependencies and updatesto get everything working.
2

1.1 Contributions
This thesis aims to uses both private and public clouds to configure andset up infrastructure for running web application and monitoring its perfor-mance. For private clouds, SciCloud [1, 2] was used. The SciCloud project isused among students and university workers to have start up projects to rundifferent applications and tools on virtual environment with the capabilitiesto scale the applications. These applications can be later transferred to Ama-zon for doing larger scale experiments and check, how the system will workin a public cloud environment [1, 2]. Thesis mainly explores the possibilitiesto configure and run web applications on the cloud. It studies different waysto automatically configure servers on the cloud based of the current trafficflow, this means how and when to add new servers or remove them. Theparticular software deployed in the cloud was MediaWiki application, whichis used to run Wikipedia project and therefore has good scaling properties.According to 2009 year summary from WikiPedia, their site gets at peak 75000 request per second on their different sub-projects and sub-wiki pages.The system is running on over 500 severs and is managed by 16 workers [28].These numbers are out of the scope of this thesis and are hard to simu-late, as these experiments would cost immense amount of money, setting upsuch system for short time periods is not a feasible and there might occurother problems related to network bandwidth, meaning DNS based trafficdistribution should be used.
Framework provided by the thesis looks different possibilities for automat-ically provisioning servers on the cloud depending on the load. One option isto use service time as an indicator, how many servers are going to be needed,another is to use average CPU usage to determine how loaded the serversare and whatever there is need to add or remove servers. This can be lateron tested with experiments over one day to see, how server provisioning isworking and validating the configuration. The framework will measure per-formance of the servers running in the cloud with 30 second interval to seepossible bottlenecks or errors that can occur while running the experiments.The outcome of this thesis will be the application set, capable for collect-ing arrival rates for the servers, measuring their performance, dynamicallychanging load balancer configuration, adding or removing servers dependingon the demand and easily deploying infrastructure to the cloud with vari-ous predefined scripts. It also includes benchmark tool, that can be used tostress out the load balancer, while the requests are divided between back-endservers, it will stress out overall system including cache and database server.
Various empirical experiments with measured performance metrics help tooptimize services in the cloud. Most of the applications’ and servers’ default
3

configurations are meant for wide audience and does not fit well with highperformance service. Experiments help to identify possible bottlenecks inthe system to see, which service configuration should be changed to improvethe overall throughput. Two well known experiments have been conductedto measure service time and system maximum throughput. First, the mea-surements can be gathered when doing experiment with low load, generatingrequests in a way that only one job is in the system. Latter, the measure-ments can be gathered when doing ramp up experiment meaning that youhave a test when, for each time unit there is a increase of load (arrival rate)to the servers and load is increased, until the maximum throughput is found.
1.2 Outline
This work is suitable for people, who are aware of computer systems,Linux commands and have some knowledge in cloud computing and knowabout script languages. The work is divided into 8 chapters. The 2st chapterfocuses on the state of art, summarizing related topics, showing what the
others have already done and what issues they have seen. The 3nd chapterfocuses on deploying the infrastructure, what tools can be used to achieve it.
The 4rd chapter gives set of tools or ways how to measure performance of
the servers in the cloud system and how the measuring was done. The 5th
chapter focuses on conducting of preliminary experiments to validate theinfrastructure testbed and to fetch important performance parameters foroptimizing the services in the cloud. It will provide a list of things we have
been optimizing to improve the speed of service. The 6th chapter showssome results for running one day experiments with fixed traffic. We arefocusing on Amazon Auto Scale and optimal policy to see the difference inthese algorithms, also this helps us to validate the cloud configuration. The
7th chapter gives conclusion of the work and what has been accomplished.
The 8th chapter will give overview, what has been left out of the frameworkas there has been no time left to improve these characteristics and should beconsider for future work.
4

Chapter 2
The State of Art
There are several studies to provision and scale virtual machines on thecloud horizontally and/or vertically. There are even several frameworks tomake deployment of infrastructure to the cloud easier. The main idea for theframeworks has been to reduce the time it takes to configure cloud instances,that will reduce experiment length and cost. Cloudstone [44] is a framework,that is compatible with Web 2.0 applications and supports application de-ployment in the cloud helping to reduce time it takes to configure the serversand to run the experiments. Wikibench [37] is being taken as a base forbuilding such framework. There has been already conducted large scale ex-periments with MediaWiki installation, but this study did not use the cloudand the dynamical server allocation was not their primary idea. MediaWikiapplication and other related services have been installed on the physicalservers. There have been also studies, that discourages moving applicationsto the cloud giving some key notes why this is not feasible, because in themost of cases it does not help to reduce cost for running of servers [47].
2.1 Cloudstone
Cloudstone is a benchmarking framework built for the clouds [44]. It triesto be compatible with Web 2.0 applications and uses all the benefits thatWeb 2.0 supports. Compared with Web 1.0 applications, where content wasmostly static and generated for the user, it deals with nowadays technologies,where users can share content through blogs, photostreams and tagging. Ituses social application Olio for benchmarking purpose, that meets the Web2.0 application criteria. Web 2.0 applications have higher write/read ratio ascontent can be added by the web service users, that will put higher workloadto the disk and database engine.
5

Cloudstone supports automatic deployment of system to the cloud. Itgives different ways to set up the cloud and is flexible, giving possibilityto configure MySQL database in a master-slave configuration. Scripts pro-vided by Cloudstone work well with Amazon EC2. It is possible to deploy,terminate, restart and configure databases, web servers, application serversand load balancers in a deployment environment. It uses Faban for gener-ating the load. Faban supports collection of the performance metrics duringthe experiments using Linux tools iostat, mpstat, vmstat, netstat, etc. Itsupports configuring memcached into the existing web application, that willallow to store already rendered pages, database query results and user ses-sion data in to the memory for faster processing. Initially Cloudstone wasusing Apache with mod proxy to distribute the load, but later on switchedto nginx as mod proxy was becoming bottleneck under high loads, support-ing only 135 concurrent users. Nginx gives more flexibility in configurationand was capable for much higher throughput, making it ideal tool for theCloudstone.
This paper focuses on two questions, that have been achieved throughexperiments: (i) how many (concurrent) users can be served for a fixed dollarcost per month on Amazon EC2? and (ii) how many can be supported withoutreplicating the MySQL database. Their approach was different comparedto other papers and articles as they were using much bigger Amazon EC2instances. Using m1.xlarge (8 EC2 units, 4 virtual cores x 2 EC2 units each)and c1.xlarge (20 EC2 units, 8 virtual cores x 2.5 EC2 units each), bothcost $0.80 per instance-hour. Some important and interesting findings fromthe paper are:
1. Discovered, that c1.xlarge is capable of serving more MySQL queriesper second, than m1.xlarge, making the MySQL database CPU-bound.
2. Turning of the logging, throughput increased at least 20% for somecases.
3. Capacity limit was hit by gigabit Ethernet with 1,000 concurrent users.
2.2 To move or not to move
Cloud computing is relatively expensive resource to be used. There hasto be well thought-out plan for moving existing infrastructure to the cloud.Dedicated servers with ISP in a longer time span would be more cost efficientthan running service on the cloud.
6

There are different studies that try to compare two different options to runservices in terms of cost and usability [44, 47]. Cloud computing gives goodplatform for developing scalable applications and is cheaper to start thanbuying separate hardware. Setting up hardware is more time consuming andperson must be well aware of the network topology and how to duplicate andreplicate service to different servers, compared to the cloud computing, wherecustomer has to only configure one virtual machine image and can replicatethe same configuration to different servers. It is possible to build image fromyour own local image, installing operating system and necessary software anduploading it to the cloud or there is a possibility to use already existing imagesprovided by Amazon or other vendors and install only necessary software.There are also bundled images with different software already installed, youcan get machine, where MySQL database and Apache server with PHP arerunning, but for security reasons it would be better to build image from ascratch as you might not be aware, what has been installed there by others.
Cloud computing gives almost infinitive resource to your hands. Therehave been many start up projects that have been launched in the AmazonEC2 cloud and have gained popularity through Facebook or other socialmedia. Good advertising will led to massive usage of service and growthof demand. This means that there should be more resources to handle theload. This can be easily achieved on the cloud environment as you can startup instantly new servers. Using your own server park with small amount ofhardware facilitating the service, you are not able to respond to the extensiveuser base growth as buying or ordering new servers are time consuming andthey have to be configured with proper software. If those start up projectshave not been in the cloud and running service in small server park or evenon a single server, they have not had such a huge success, because the servicewould have been overloaded, and users could not access it and, therefore,losing the interest [50].
Cloud computing gives great platform for deploying scalable applications,but it is not suitable for all cases. It depends of the purpose of service andhow widely it should be available for the audience, using the application. Forsmall projects and local web pages, it would not be good solution, as holdingup the infrastructure will cost more money, than using virtual HTTP servers.Cloud computing is a perfect platform for developing new infrastructure andservices as renting the servers for smaller time periods is not that expensivethan using dedicated or virtual servers. Definite plus for cloud computing is,that it gives possibility to rapidly scale your application to see the boundariesof the system. It would be hard to find service providers willing to give largeamount of servers for small time period with low cost.
There is also option for using hybrid configuration of dedicated servers
7

and cloud servers to run the application. For longer time span it is cheaperto have your own servers, but sometimes you might need extra resources forshort time and, therefore, it is a good idea to request extra servers from thecloud. Good example would be the tax collection web site, where most of thetime traffic is low. When the deadline arrives for tax collecting, you mightneed extra servers to accommodate incoming requests and these can be easilyacquired from the cloud.
2.3 Wikibench
The thesis takes novel approach for benchmarking web application usingrealistic traffic with the realistic infrastructure using real data. Wikibenchis benchmarking tool specially built for MediaWiki application, it supportstwo types of queries while benchmarking the system. It supports readingoperations using HTTP GET queries and occasionally makes database updatesthrough web interface using HTTP POST queries. This will simulate users,that are reading different articles and editors, who are updating, editing orcreating new articles. Many of the benchmark tools are using only GET re-quest and do not really deal with updating database. Using POST queries willreally stress out the database as updating entries in the database uses moreCPU and hard disk than generating simple read requests. The performanceof a database depends on the database structure, how complex, how manykeys and entries it consists.
Wikibench consists of a set of tools meant for benchmarking MediaWikiapplication with the real traffic. They have developed load generator, thatcan be started in clusters and uses Wikipedia traces 1 for requesting pages.These traces will show when the request was made and the tools tries togenerate the request with same frequency. Using real traces, means thatthe database has to be filled with real data, because otherwise we might getcontent not found errors. Thesis uses Wikipedia database dumps 2 to haverealistic environment for stressing out the system.
This work will compare other benchmarking tools, that can be used forstressing out the system. Thesis brings out some major missing features andexplains why the new developed benchmarking tool is necessary. The majorproblem is that the most of traffic generators are making artificial trafficthat cannot be compared with the real life situations. The problem is thatgenerated traffic is uniformly distributed and does not fluctuate so much in
1http://www.wikibench.eu/?page id=602http://dumps.wikimedia.org/backup-index.html
8
time and have fixed amount of simultaneous connections. Wikibench includesWikijector tools used to generate the load. It has programmed to have tworoles, it can act as a controller or a worker. Controller’s task is to hold eyeon the workers, collect response times from workers and coordinate workersjobs. Workers are first sitting in an idle state and waiting start commandfrom the controller. Controller will also define, where to get the traces andhow long to run the experiment.
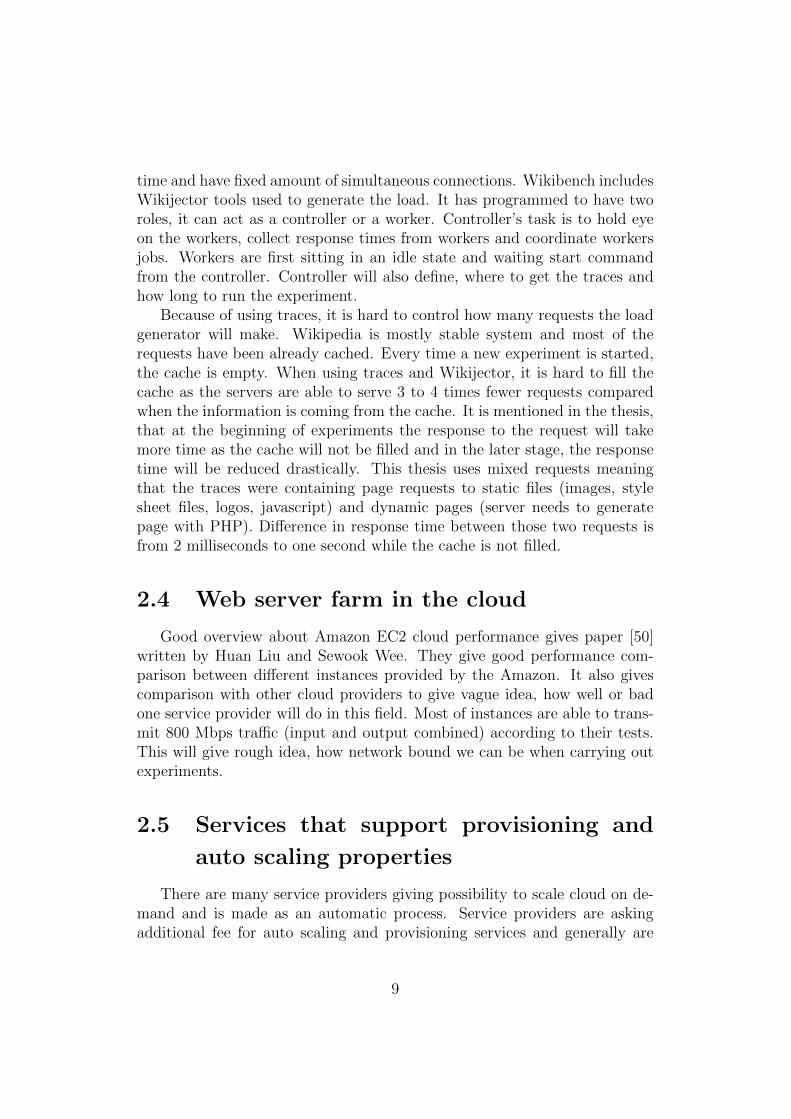
Because of using traces, it is hard to control how many requests the loadgenerator will make. Wikipedia is mostly stable system and most of therequests have been already cached. Every time a new experiment is started,the cache is empty. When using traces and Wikijector, it is hard to fill thecache as the servers are able to serve 3 to 4 times fewer requests comparedwhen the information is coming from the cache. It is mentioned in the thesis,that at the beginning of experiments the response to the request will takemore time as the cache will not be filled and in the later stage, the responsetime will be reduced drastically. This thesis uses mixed requests meaningthat the traces were containing page requests to static files (images, stylesheet files, logos, javascript) and dynamic pages (server needs to generatepage with PHP). Difference in response time between those two requests isfrom 2 milliseconds to one second while the cache is not filled.
2.4 Web server farm in the cloud
Good overview about Amazon EC2 cloud performance gives paper [50]written by Huan Liu and Sewook Wee. They give good performance com-parison between different instances provided by the Amazon. It also givescomparison with other cloud providers to give vague idea, how well or badone service provider will do in this field. Most of instances are able to trans-mit 800 Mbps traffic (input and output combined) according to their tests.This will give rough idea, how network bound we can be when carrying outexperiments.
2.5 Services that support provisioning and
auto scaling properties
There are many service providers giving possibility to scale cloud on de-mand and is made as an automatic process. Service providers are askingadditional fee for auto scaling and provisioning services and generally are
9
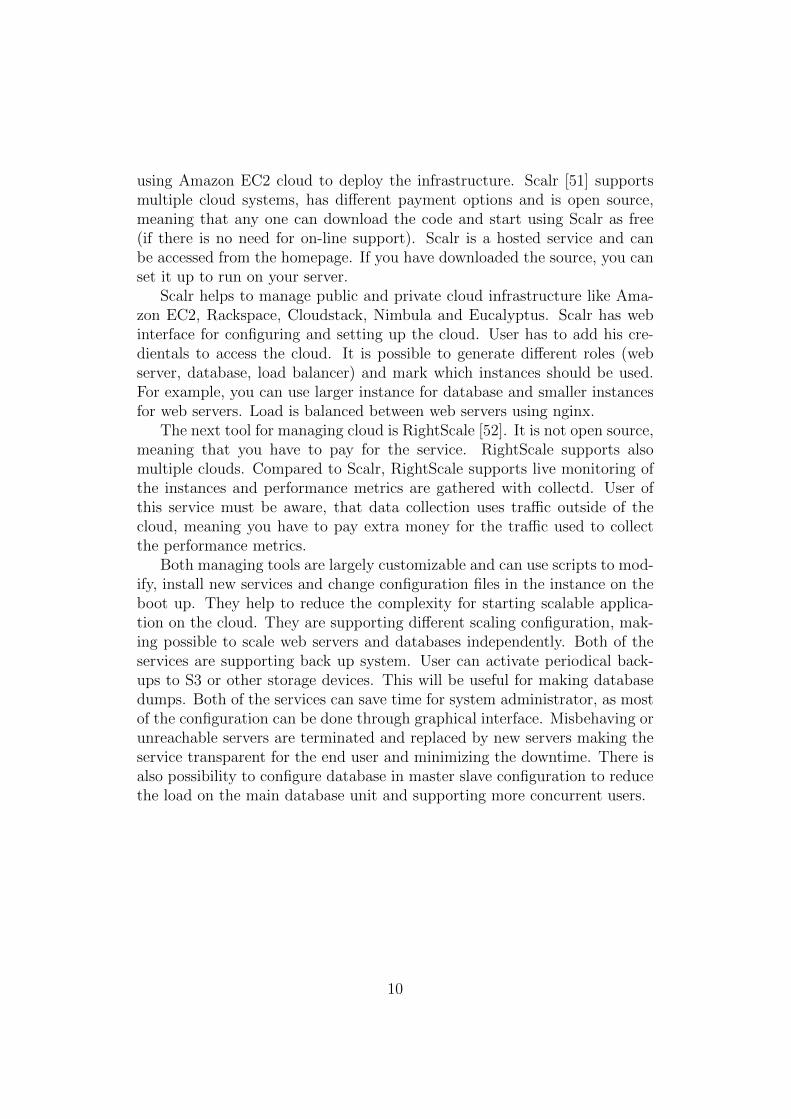
using Amazon EC2 cloud to deploy the infrastructure. Scalr [51] supportsmultiple cloud systems, has different payment options and is open source,meaning that any one can download the code and start using Scalr as free(if there is no need for on-line support). Scalr is a hosted service and canbe accessed from the homepage. If you have downloaded the source, you canset it up to run on your server.
Scalr helps to manage public and private cloud infrastructure like Ama-zon EC2, Rackspace, Cloudstack, Nimbula and Eucalyptus. Scalr has webinterface for configuring and setting up the cloud. User has to add his cre-dientals to access the cloud. It is possible to generate different roles (webserver, database, load balancer) and mark which instances should be used.For example, you can use larger instance for database and smaller instancesfor web servers. Load is balanced between web servers using nginx.
The next tool for managing cloud is RightScale [52]. It is not open source,meaning that you have to pay for the service. RightScale supports alsomultiple clouds. Compared to Scalr, RightScale supports live monitoring ofthe instances and performance metrics are gathered with collectd. User ofthis service must be aware, that data collection uses traffic outside of thecloud, meaning you have to pay extra money for the traffic used to collectthe performance metrics.
Both managing tools are largely customizable and can use scripts to mod-ify, install new services and change configuration files in the instance on theboot up. They help to reduce the complexity for starting scalable applica-tion on the cloud. They are supporting different scaling configuration, mak-ing possible to scale web servers and databases independently. Both of theservices are supporting back up system. User can activate periodical back-ups to S3 or other storage devices. This will be useful for making databasedumps. Both of the services can save time for system administrator, as mostof the configuration can be done through graphical interface. Misbehaving orunreachable servers are terminated and replaced by new servers making theservice transparent for the end user and minimizing the downtime. There isalso possibility to configure database in master slave configuration to reducethe load on the main database unit and supporting more concurrent users.
10

Chapter 3
Framework for Verifying
Scalability and Performance
This chapter will give overview of various tools and technologies used toset up framework for conducting experiments on the cloud using MediaWikiapplication. MediaWiki application is used as it has proven already goodscalability and is capable of handling large amount of requests. SimplifiedMediaWiki service installation was used as file cache and other services wereadding complexity to already large system. With cache load-balancer likeVarnish or Squid (used by Wikipedia) support much larger volume of traffic,meaning network bandwidth limitations might arise with single load balancer.
A cluster-based web server (figure 3.1) consist of a front-end node (usu-ally load balancer) and various number of back-end servers. The front-end(in larger configurations there might be more than one load balancer) willdistribute user requests between back-end servers. Front-end server has thebiggest impact and should have fast computer with large bandwidth capac-ity. Back-end servers can be commodity servers as the failure of these serversdoes not affect overall performance.
Current framework configuration contains one database server (MySQL),one cache server (memcached), several load generators (depending how manyweb servers are running and what load they need to generate), one load bal-ancer (nginx, handling and directing request to the back end servers) andseveral web application servers (Apache2 with PHP5). As mentioned early,some of the components were left out like file caching and proxy systems(Varnish or Squid) to reduce complexity of setting up the infrastructure andreducing servers needed to run the experiments. It will also make replicationof the experiments harder, as for each experiment, there must be knowledge,how the requests have been cached. Despite of the fact, that framework
11

Figure 3.1: A cluster-based web server configuration.
could use Wikijector [37] for generating load, the framework uses the simpli-fied tool for benchmarking purpose that makes only view requests (loadingonly dynamical PHP page requests), that is capable of reading trace curveand making requests based on the URL list provided to the program. Thishelped to use smaller fraction of the Wikipedia dumps, making development,framework deployment and conducting the experiments faster. This thesisis interested in scaling only back-end Apache servers and does not use cloudscaling properties to add or remove database servers. This configuration addsmore complexity, as the database has to be configured in master and slavemode, where master will deal with insertion and updates requests, and slavewill deal with read requests. Reason to dump Wikijector was, that it wasresulting slower response times from requests as the code for making requestsand reading responses to see the status of the requests (was it failure or suc-cess) and length of the response. Therefore, to process this information, itwas taking longer time, resulting in larger response times measured by theprogram.
Step by step instructions how to configure, set up virtual machine instanceon the cloud and run experiments are available on the DVD. This thesis maycontain some of commands that are used to run various tools, but to getfull picture and reassemble experiments done here, reader has to go throughinstructions, that are stored on the DVD.
12

3.1 Problem statement
Conducting large scale experiments is a time consuming task. Each ex-periment in the cloud needs to be done carefully, keeping track of variousparameters and remembering which tasks have been done. Because of manyfactors, starting such experiments are not error-free and mistakes might hap-pen. It would be bad to discover the mistake at the end of the experimentas this will cost extra money and takes more time to complete the task.
Current framework is finding solution how to deploy scientific infrastruc-ture in the cloud, that would be easy to use and can replicate experiments.This thesis tries to find solution, how to deploy services in the cloud andhold configuration in one place. This solution should make it easier to runlarge scale experiments in the cloud; this involves starting necessary servicesin different servers, depending on the role of the server and monitoring theirperformance. This framework will help to reduce time it takes to run theexperiments and in the same time collect performance metrics from otherservers. At the end of the each experiment, results are gathered. Theseresults can be downloaded into the local computer to analyse collected data.
3.2 Cloud Computing
What is cloud computing? There is not a single definition for this termas there is already saturated list of different names given by leading expertsin this field [13]. I. Foster, Y. Zhao, I. Raicu and S. Lu propose definition asfollowing [14]:
A large-scale distributed computing paradigm that is drivenby economies of scale, in which a pool of abstracted, virtualized,dynamically-scalable, managed computing power, storage, plat-forms, and services are delivered on demand to external customersover the Internet.
The article claimed, that there is a rapid increase of interest in cloudcomputing, especially to own one, this has been affected by the followingfactors: i) rapid decrease in hardware cost, but meanwhile increase in com-puting power and storage capacity; ii) the exponentially growing data sizein scientific instrumentation and simulation; and iii) simulation and softwaredevelopment in public clouds costs more money then carrying out in privatecloud [14]. Cloud computing is utility computing model, where customers,using the service, are paying based on the usage and pricing given by theservice provider. Virtual machines are running on physical machines, that
13

consume energy and other resources. Customer needs to pay fees to supportthe cost it takes to run the service, to the employees taking care of machinesand replace broken down hardware. Providers can charge user by the hours,they have been using virtual machines, by the traffic it has passed and bythe storage cost.
There are three groups of services provided by different cloud serviceproviders: i) IaaS - Infrastructure as a Service; ii) Saas - Software as aService; and iii) PaaS - Platform as a Service. Amazon EC2 provides theIaaS service and this thesis focus on building framework for Infrastructure asa Service. It gives cloud computing customer free hands to have their ownoperating system with needed software. This flexibility gives free hands onmodifying the virtual machine and giving infinite possibilities to configurethe machine. One of most important factors in cloud computing is that itcan scale up and down dynamically depending on application resource needs.
3.2.1 Cloud computing as a Service
There are several service providers giving possibility to use cloud com-puting to solve computationally intensive tasks and giving almost infinitiveamount of resources to use. There are several abstraction layers of servicesprovided by these providers: Software as a Service (SaaS), Platform as aService (PaaS) and Infrastructure as a Service (IaaS).
Software as a Service
Software as a service is a software delivery model in which software and itsassociated data are hosted centrally, typically in the cloud and are accessedby users using a thin client. SaaS has become a common delivery model formost business applications. These applications mostly can be used by payingsmall fee. In 2010, SaaS sales reached to 10 billion dollars [41].
SaaS software can be used by large amount of customers with little re-sources making it possible to run it at a low price. These services are gen-erally priced by a subscription fees, most commonly using a monthly fee oran annual fee. Because of large user base, some of the providers can offerapplications with freemium model. This means, that some of the servicesare provided without a charge, but it has limited functionality or scope, andfees are charged for extended functionality or larger scope. Some other SaaSproviders like Google can provide applications as a free for users, because therevenue is being derived from alternate sources such as advertising. Adver-tising is one common way to provide underlying software as a free for the end
14

users. Typical SaaS applications provided by Google are Gmail (an e-mailapplication) and Picasa (a picture application).
Platform as a Service
This category of cloud computing provides a computing platform and asolution stack as a service. In the classic layered model of cloud computing,the PaaS layer lies between the SaaS and the IaaS layer [42]. It offers facilita-tion and environment to deploy applications without the cost and complexityof buying and managing the underlying hardware. There is a great varietyof combinations of services to support the application development life-cycle.Some of the providers give services, where user can select any programminglanguage, any database and any operating system giving free hands on de-velopment.
Popular platforms of PaaS are Google App Engine that allows develop-ing and hosting web applications in Google-managed datacenters. Theseapplications are easily scalable. Google App Engine is free up to a certainlevel of consumed resources. Additional fees are acquired for extra storage,bandwidth or instance hours required by the application.
Infrastructure as a Service
IaaS model cloud provider gives users virtual machines, that can use anyoperating system they like and install infrastructure from scratch with nec-essary software. Popular IaaS provider is Amazon EC2. Our experiments,infrastructure building and validation is done in IaaS cloud computing model.IaaS bills users by the instance hours used for each virtual machine, band-width usage, storage usage and other services, when they are activated. Thereare plenty of other services that can be accompanied with existing infrastruc-ture. User can use Elastic Load Balancing service with Auto Scaling, all thenecessary services are there to support scalability of application on the cloud.Some of the services are provided by free, e.g. gathering CPU, memory andnetwork usage is provided without no additional charge, but these values arecollected with 5 minute intervals. If customers wants to measure the perfor-mance frequently or use custom metrics, he has to pay for the extra service.To advertise the service and attract new customers, Amazon EC2 gives fornew users for one year each month limited amount of free instance hours.
15

3.3 SciCloud project
The main goal of the scientific computing cloud (SciCloud) project [1, 2]is to study the scope of establishing private clouds at universities. Withthese clouds, students and researchers can efficiently use the already existingresources of university computer networks, in solving computationally in-tensive scientific, mathematical, and academic problems [2]. Previously suchproblems were targeted by batch-oriented models of the GRID computing do-main. The current project gives more freedom and interactive approach forcomputing intensive analysis and problems, giving possibilities to use largeclass of applications and work flow. This project also gives better collabora-tion among different study and interest groups of universities and possibilityto test pilot and innovative projects.
The project mainly focus on the development of a framework, establish-ing models and methods; auto scaling, data and state management, andinteroperability of the private clouds. When such clouds have been devel-oped, it is possible to lease them to external use for governmental institutesor firms to invest in divers studies like seismic analysis, drug discovery andlarge scale data analyses for commercial firms to improve their productivityand revenue.
SciCloud is built and deployed on already existing cluster, using Eucalyp-tus software. Eucalyptus is one of the most widely deployed worlds leadingopen-source cloud computing platform for on-premise (private) Infrastruc-ture as a Service (IaaS) clouds [3]. IaaS systems give users the ability to runand control entire virtual machine instances and replicate same configurationthrough out the cloud on different physical machines. SciCloud has custombuilt images from Fedora, Ubuntu and other linux distributions ready to useby others. These can be used as a base images and everyone with accessto the cloud could easily make their own private image with the softwareneeded to run the experiments. While custom images are built, it is simpleto replicate them and conduct experiments.
Eucalyptus is compatible with Amazon EC2 [19] cloud and gives oppor-tunity to develop and make preliminary tests on the private cloud to reducethe cost. Private cloud is a great help for the researchers and academiccommunities as the initial expenses of the experiments can be reduced sig-nificantly. Private cloud experiments and infrastructure deployment can belater on transfer to Amazon EC2 cloud to check, if the application and workflow will work with other cloud environments. SciCloud resources are limitedby the means of physical hosts and available cores, it does not allow to re-quest immense amount of virtual machine, but this is possible with AmazonEC2.
16

3.4 Eucalyptus
Eucalyptus is open-source cloud system able to run on different Linuxdistributions and works with several virtualization technologies. Eucalyptusis framework that uses computational and storage infrastructure availablemostly for academic users and can be used for innovative and experimentalstudies. It is used in private clouds as IaaS (Infrastructure as a Service)system and is compatible with Amazon EC2 cloud. Eucalyptus uses existinginfrastructure to create scalable and secure web services layer that abstractscompute, network and storage from user to offer simple IaaS on the fly. Ittakes full advantage today’s modern infrastructure virtualization softwarethat is capable of scaling up and down services depending on applicationworkloads [3]. Compatibility with Amazon EC2 gives possibility to reducedevelopment costs of the experiments and analyses, conducting them first onthe private cloud.
3.4.1 Eucalyptus architecture
Figure 3.2: Layout of the Eucalyptus architecture, showing how the services
are connected with each other. Router enables access from the outside world
to connect with the cloud and running instances [54].
The architecture of the Eucalyptus is simple and flexible with a hierar-chical design. It uses SOAP (Simple Object Access Protocol) service that isemulation of Amazon EC2 service, where users are allowed to start, controland terminate virtual machines on the cloud. Layout of the architecture isshown on figure 3.2. The architecture consist of four main parts: [38]
17

1. Node Controller controls the execution, inspection and terminationof VM instances on the host where it runs.
2. Cluster Controller gathers information and schedules VM executionon specific node controllers, as well as manages virtual instance net-work.
3. Storage Controller (Walrus) is a put/get storage service that im-plements Amazon’s S3 [35] interface, providing a mechanism for storingand accessing virtual machine images and user data.
4. Cloud Controller is the entry-point into the cloud for users and ad-ministrators. It queries node managers for information about resources,makes high-level scheduling decisions, and implements them by makingrequests to cluster controller.
Node Controller
Node Controller is located on every node that is designated to run VMinstances. It controls execution of virtual machines (running, adding andremoving them) and makes queries to discover the node’s physical resourcesand gather state of the running VM instances. Node Controller is controlledby Cluster Controller. Node Controller executes commands sent by ClusterController, addition to this, it will give feedback of the current health andperformance of the node to notify Cluster Controller of any problems thatmight arise.
Node Controller broadcasts to Cluster Controller characteristic of phys-ical machine - number of cores, total amount of memory and free memory,total amount of disk space and available disk space. Information collectedcan be propagated and collected for Cluster Controller in response to thecommands describeResource and describeInstance. Cluster Controllercan start and stop instances giving runInstance and terminateInstance
commands to the Node Controller. Only authorized person can execute thesecommands, e.g. only the owner of the instance or administrator can triggertermination command. While executing command for running new instance,Cloud Controller has to wait confirmation from Node Controller about re-source availability.
To start the instance, Node Controller makes local copy of the imagefile (containing kernel, root file system and ramdisk image) over networkfrom remote image repository. These images are packed, copying them overnetwork and unpacking them takes time and therefore there are couple ofminute delays while the virtual image starts running and is accessible. It also
18
depends how loaded the network and physical host is and how much powerthe virtual machine has. Hypervisor (e.g. XEN) is instructed to boot theinstance. To stop the instance, the Node Controller instructs hypervisor toterminate VM, close network endpoint (each instance gets unique IP addressfrom the IP pool) and clean up files associated with the image. Amazon EC2provides private IP address and public IP address for each instance withcorresponding DNS host names.
All the Node Controllers should have access to the outside world or atleast have access to inner network to allow users to connect with requestedinstances.
Cluster Controller
Cluster Controller has network connectivity with Node Controller andCloud Controller. Many of the functions are similar to Node Controller, butare meant for running on every Node Controller the Cluster Controller isconnected. For example commands runInstances, terminateInstances,describeResources and describeInstances gives possibility to executethem on several Node Controllers. Cluster Controller has three main func-tions: (i) schedule incoming requests for starting instance (check availabilityof the resources), (ii) control the instance virtual network overlay and (iii)gather information from a set of Node Controllers assigned to the ClusterController.
Cluster Controller takes care of finding most suitable node to run vir-tual machines. When new requests to start instances has been made, Clus-ter Controller checks from set of Node Controllers available resources usingdescribeResource to find out most suitable candidate for running requestedimage.
Storage Controller (Walrus)
Walrus is a data storage service that leverages standard web servicestechnologies (Axis2, Mule) and its interface is compatible with Amazon’sSimple Storage Service (S3) [35]. Walrus implements the REST (via HTTP),sometimes termed the ”Query” interface as well as the SOAP interfaces thatare compatible with S3. Walrus provides two types of functionality [38]:
1. Users that have access to Eucalyptus can use Walrus to stream data into/out of the cloud as well as from instances that they have started onnodes.
19

2. In addition, Walrus acts as a storage service for VM images. Root filesystem as well as kernel and ram disk used to instantiate VMs on nodescan be uploaded to Walrus and accessed from nodes.
VM images are stored and managed by Walrus. VM images are packaged,encrypted and uploaded by standard EC2 tools provided by Amazon. Thesetools compress images, encrypt them using user credentials, and split theminto multiple parts and are accompanied by image description file, called themanifest (in XML format). Node Controller downloads requested imagesfrom Walrus before instantiating it on a node. If authentication betweenNode Controller and Walrus is successful, Walrus will decrypt the image andsend it over the network to Node Controller.
Cloud Controller
Eucalyptus underlying virtualized resources are exposed and managed bythe Cloud Controller. The Cloud Controller is a collection of web-serviceswhich are best grouped by their roles into three categories: [38]
1. Resource Services perform system-wide arbitration of resource al-locations, let users manipulate properties of the virtual machines andnetworks, and monitor both system components and virtual resources.
2. Data Services govern persistent user and system data and providefor a configurable user environment for formulating resource allocationrequest properties.
3. Interface Services present user-visible interfaces, handling authenti-cation and protocol translation, and expose system management toolsproviding.
In addition to the programmatic interfaces (SOAP and REST services),the Interface tier also offers a Web interface for cloud users and administra-tors to ease the use of the cloud system. Using a Web browser, it is possiblefor new users to sign up for cloud access, download the cryptographic cre-dentials needed for the programmatic interface and query the system. Theadministrator can additionally manage user accounts, inspect the availabilityof system components and make modifications to the resources.
It also gives collection of interface web service entry points for user re-quests using a variety of interface specification (e.g. EC2’s SOAP and URLquery, S3’s SOAP and REST). Users can make requests using either the EC2SOAP or EC2 URL query protocols. This has allowed wide variety of toolswhich comply with the EC2 and S3 interfaces to work without modifications.
20

3.5 Amazon Cloud
Amazon is public cloud provider who provides on-demand computationaland storage resources to the clients. It can be used to run scalable applica-tions and cost of running these applications depends on the storage, computeand transfer resources it will consume. Different execution plans on the sameapplications may results in different costs. Framework built by this thesis isusing Amazon EC2 resources to allow automatic scaling of the service, thustrying to minimize the cost for running the service. Using MediaWiki ap-plication, it is possible to implement realistic benchmark with real data andtraffic. Scaling the servers in the cloud should be transparent to the end userand in ideal case, no failure should happen while servers are provisioned.
3.5.1 Amazon EC2 and Auto Scaling
Amazon EC2 (Elastic Compute Cloud) is a web service that providesresizeable compute capacity in the cloud. It is designed to make web-scalecomputing easier for developers [19]. It provides great variety tools to man-age the cloud automatically, manually or Amazon customers can make theirown provisioning tools accompanied with Amazon tools to take control overthe cloud. With Elastic Load Balancing [34] and Auto Scaling [9], givingpossibility to use scaling properties of the cloud to easily distribute requestsusing Elastic Load Balancing service between varying amount of back-endservers, that are allocated by Auto Scaling service to the cloud. With theseservices, it is easy to turn any application in the cloud scalable and thiswill be transparent for the end user, as they are not aware, that servers areremoved or added to the cloud. Elastic Load Balancing gives possibility todistribute load between different regions and availability zones dependingwhere the requests were made to make sure, that the traffic between serversand clients have low latency.
This thesis will look properties of Amazon Auto Scale and how to set upthe service in the cloud. Amazon Auto Scale works using different thresholdsassigned by the user to manage servers in the cloud. This thesis will look,when using CPU based provisioning, how the servers are added and removedthrough provisioning process and what parameters should be used. For usingAuto Scaling, user needs to install additional command line tools [12] todefine Auto Scaling group and policies used to measure the performanceof the instances in the group and take provisioning decision based on that.Amazon Auto Scale is free of charge, user has to pay for the instance hours forthe instances running in the scaling group, that were added by the AmazonAuto Scale.
21

3.5.2 Amazon pricing
With Amazon cloud you have to pay for what you use. Amazon givesgreat variety of different servers with different characteristics. They are allcharged with different prices. The time of writing this thesis, regions USEast (Virgina) and US West (Oregon) [20] are the cheapest one where torun the servers. Amazon charges for running the instances by the time theyare engaged. The time is measured from the instance boot (it takes sometime until the instance pending state is changed to running and for pendingstate Amazon does not charge money) to the instance termination. Charge istaken by calculating the full hour the instance was used, meaning that partialhours are charged as a full hour. This should be taken into considerationwhen closing the instances. For example, if you have large list of differentinstances started in different times, it would be wise to select those instancesout from the list, which are closest to the full hour to avoid paying for thecomputational power that was not fully used.
3.6 MediaWiki architecture
MediaWiki application in general uses different technologies to run thesystem. These technologies are not mandatory to use for a single server con-figuration with small amount of traffic, but for site, that has large amount ofusers, it is highly recommended. MediaWiki can be easily installed on top ofLAMP [15] stack (or WAMP - for windows, XAMPP - supports most of theoperating systems) without need for making any additional changes to thesystem. MediaWiki application is written in PHP, but there are some speedconcerns, as the PHP is interpreted language, meaning each time web pageis visited, the code to render the page has to be interpreted again, makingrendering the pages CPU intensive task. MediaWiki is using regular expres-sion to convert text in MediaWiki format to HTML every time a user visitsthe page. There are different applications and daemon programs to improveperformance of the MediaWiki application.
Performance gain through caching. The main idea for improving theperformance is to try to cache the data and the code, this will reduce theamount of time required to run for each request and therefore minimizingCPU usage. MediaWiki supports several data caching methods, e.g. savinginto files, storing visited pages in the database or storing pages in the memorywith help of the memcached daemon. This section outlines some basic toolsto run and improve the performance of the MediaWiki. For single server
22

configuration, it is recommended to use file caching, as it is easiest to setup and probably only way, when using virtual Apache server provider, youmight not have permissions to access shell to install additional programs andstart them [4]. File caching will use local or mounted file system (mountingextra space from the cloud using Walrus or S3 service) to store already com-piled pages on the hard disk that can be easily fetched and sent to users, whorevisit the page. MediaWiki stores its content in MediaWiki mark-up lan-guage in the database and this needs to be formatted into HTML. It meansthat each request to the database, the application needs to go through thecontent and format given text to appropriate HTML format. This processwill uses regular expressions and therefore for larger contents will use largeamount of CPU on the Apache server. To improve the performance of theserver, it is important to use caching, as it will eliminate the need to parsethe content into HTML again.
Figure 3.3: Flowchart showing how request and responses between different
servers are being transferred when the requested page is already cached.
Note that MediaWiki still makes request to database to see, whatever the
page exists and is not changed.
Figures 3.3 and 3.4 shows typical flow through the system between differ-ent servers to show, how the request is parsed and completed. Even thoughfor already cached pages, still request to MySQL is generated to see whateverthe page still exist in the system and is not changed. Second query goes intomemcached, that gets already cached page, this page is compiled from previ-ous user visiting the page and therefore fetching these types of pages are fasteras there is no need to parsing it again (formatting structured text to HTML,
23

this will also include checking whatever links are active or dead, includingpictures, formulas and other objects from the page). Figure 3.4 demonstrateshow multiple requests going through the system to memcached and MySQLdatabase server to fetch additional information that is needed for parsing thecontent. First, each entry is asked from the memcached, if it does not existin the memcached, it is queried from the MySQL. If the MySQL query is suc-cessful (link/page/object exists in the database), it is stored in memcached,so the later queries should be faster. Because of multiply queries made byApache server, it would be good, if memcached, MySQL and Apache serversare located in the same availability zone to reduce network latency.
Figure 3.4: Flowchart showing how request and responses between different
servers are being transferred when the requested page is not cached. There
are several queries and calls to memcached and MySQL server to compile
the page. Once ready, the parsed page is stored in the memcached.
3.6.1 Memcached reducing load on database server
Memcached is key-value based cached storage database program runningas daemon on the server, that holds all of the stored information in thememory. It is powerful and fast program able to retrieve entries from thedatabase in O(1) time and currently, maximum entry size is limited to 1 MB.Wikipedia has pages exceeding this limit, but it is solved by packing content
24

with gzcompress. This gives more flexibility in storing larger cached pagesin the memory [5]. Memcached is not a persistent storage engine, meaningthat when restarting the system, the cache becomes empty. This will increaseresponse time of the requests and to stabilize the system, the cache needs tobe filled again to improve the performance of the service.
Memcached in the MediaWiki application environment is deployed as aseparate server. All the back-end servers can connect with central memcachedserver to fetch pages and add new content into the memory. If using severalmemcached servers, system administrator has to be careful, when addingor removing memcached servers, as the cache becomes invalid, making theservice slower (response times increases, as the content of the pages has tobe parsed again) until the cache is filled again.
Three experiments have been conducted to see the difference, how muchmemcached and XCache can improve service speed. First experiment didnot use neither of the caching capabilities. The content was generated foreach page visited by PHP again and the PHP code was not cached in thememory. Second experiment uses XCache to cache PHP code into memoryand the third uses both caching option, where memcached was filled withthe requests. For the experiments, Amazon EC2 c1.medium instance wasused (see later chapters, why c1.medium instance was selected). Test setconsisted of random pages requested from the system, but for each test, theURI addresses requested stayed the same to have fair comparison betweenexperiments. The instance used for the testing gained slower CPU E5506from the cloud, which has clock speed 2.13 GHz (this is slower compared toE5510, which has 2.33 GHz clock speed). Without any caching the averageresponse time for one hour experiment was 469.6 ms. Enabling the XCachefor PHP code caching, the average response time improved to 335.7 ms. Itimproved the speed of the service, but not su much as enabling memcachedand the requests were fetched from the cache. The average response timedropped down to 79.2 ms. Using both caching options, the service speedincreased at least 6 times. Figure 3.5 shows response times distribution forall the experiments. Parsing the content by PHP is using more CPU power,showing clearly, that regular expressions takes more time when convertingthe content to HTML and validating the links. With constant load, onerequest using memcached and XCache for c1.medium Apache server usedon average 1.5% of CPU and without memcached, Apache server used onaverage 7.4% of CPU. When disabling both caching options, the averageCPU usage increased to 11.2%.
MediaWiki configuration file LocalSettings.php allows to change cachevalidation time limit. This will define the time it takes to mark entry inthe cache as invalid, meaning the requested page has to be parsed again
25

0
20
40
60
80
100
100 200 300 400 500 600 700 800 900 1000
Dis
trib
uti
on
[%
]
Response time [ms]
memcached + XCacheXCache
no caching
Figure 3.5: Cumulative distribution of response times for c1.medium instance
with different caching policies.
and converted to HTML. Changing the configuration file will invalidate thewhole cache and it is not accepted behaviour, when adding new servers andchanging IP addresses for memcached and MySQL in the configuration file,as it will affect response times. To overcome this, variable $wgCacheEpoch
has to be changed to 1 in order to disable the invalidation of the cache, whenchanging configuration file.
Documentation from MediaWiki gives instructions to start and activatememcached on the MediaWiki [24]. Configuration file variable $wgParser
CacheExpireTime shows for how many seconds the parsed content stored inthe memcached is considered valid. If this time has been passed, fetchinginformation from memcached will return false value and old value is clearedfrom cache. New value is therefore requested from MySQL database (includ-ing converting the content to HTML) and added to the memcached memory.Memcached does not itself go through values stored in its memory, they areinvalidated if someone tries to fetch old data. To get most of the system,it has to be made sure, that memcached is properly installed and running.On default, MediaWiki timeout for memcached server is set to 10 seconds,if the memcached server is not reachable and pages from MediaWiki appli-cation takes more than 10 seconds to respond, then there is a problem withmemcached installation and configuration.
3.6.2 LAMP stack
LAMP refers to Linux, Apache, MySql and PHP installation. There areseveral variations for having web-application server, but this thesis is look-ing for LAMP configuration to run MediaWiki application on the back-endservers. Requests from nginx reverse proxy are divided between these LAMP
26

stacks. The back-end servers are using PHP version 3.5.3, Apache with ver-sion 2.2.17 and MySQL server with version 5.1.54. MySQL is disabled forApache back-end servers and is used as a separate server.
Apache configuration
Apache is open-source software working as a server in default configu-ration on port 80 and serving files from the file system. Default Apacheconfiguration is meant for serving static files and is not suitable with servingdynamic content as the service time and resource utilization differs. Servingstatic pages does not use much resources compared when the page is gen-erated and render by the help of PHP. To improve the service throughputand reducing risk for overloading the servers, the configuration file has tochange for reducing maximal number of allowed users and to reduce timeoutperiod for requests. This helps to prevent overloading the Apache serverwith excessive requests and also reduce memory footprint. Memory can bereal bottleneck, if the server starts to run out of free memory, the operatingsystem starts swapping the memory. Swapping means that operating systemstarts to write old memory chunks to the hard disk, making fetching infor-mation from memory significantly slower, also adding items into memory isgoing to be slower and thus increasing back log.
Following configuration is valid for c1.medium server on Amazon cloud.It has been observed, that with following configuration (using memcachedand XCache) on average, one c1.medium server was able to handle 26-34request per second depending, which CPU was assigned to the virtual ma-chine, state of the virtual machine host, network utilization and wear ofthe system. Reducing MaxClients for each Apache to 10, helped to makeservice more stable under heavy load. The default option was set to 125,which is relatively large number as the server is only capable of serving 4×fewer requests and the requests should not be in the system at the sametime. Reducing timeout to 10 seconds and disabling KeepAlive to free upsockets immediately after the content has sent to the client also improvedservice throughput and making overloading the system harder. When usingdefault configuration, it can be noticed that, while generating more requeststhe server was capable of serving, the throughput started to decrease, show-ing that for each new request a new process was made. Because not usingcorrect number of limited maximum clients, the system had more jobs insidethan it was able to serve and affecting other jobs, making the response timelonger, resulting in one minute system load going over 20 units. Using 2 coremachine, meaning that when 1 minute load is going over 2, the job queueis longer than the server is able to serve. It has been problematic, as with
27

higher loads the server tends to crash.
PHP configuration
PHP is most widely used scripting language for serving dynamic contentover web. The language is simple to use, there is no need to define variablesand each variable type can be changed on the fly, that is not possible for manyother languages. PHP is interpreted language, meaning that for every requestthe written code is parsed again by the interpreter. This method is slowercompared to compiled languages, but gives more freedom for programming.There are several applications and utilities out that helps to cache PHP code,so it is not going to be parsed every time new request is made. This can leadto 2 to 5 times faster code execution depending how complex the code is andhow many different source files are included. For complex and large PHPfiles caching the code can help a lot as the server does not need to read thefiles from the hard disk every time a new request is made, helping to reduceresponse time. While decreasing response time, the server is able to servemore requests. But it is not always good to use PHP opcode cacher, as goingthrough small codes can increase overall time.
MySQL configuration
Default MySQL configuration is modest and is meant to run along withthe other applications in the same server. Infrastructure configuration pro-vided by the current thesis needs to run MySQL database on a separateserver for MediaWiki, meaning that MySQL can use more resources and toimprove the throughput, some of the parameters should be increased. In-creasing max connections allows more connections to be handled by thedatabase. With higher loads, the old connections changed to idle state andwere not given to the new connections, limiting the amount of new con-nections made to the database. Reducing TCP packet timeout for Ubuntuallowed to kill such connections. If MediaWiki cannot make connection tothe database, it will return database error to the end user. While generatingat least 300 request per seconds, some of the connections were changed tothe idle state and MySQL ran out of free connections, blocking new incomingrequests and making service unreachable.
The other configuration part concerns where to store the database files.The default option will use image file system to store the data, but it is limitedin size and has to be considered, while starting to upload data from Wikipediadumps to MySQL database. The second option is to use S3 (or Walrus)storage space, but this means that the extra storage has to be mounted to
28

MySQL instance. MySQL configuration variable datadir has to be changedand pointed to the mount point. If starting MySQL instance later, when theimage is already bundled, it will not be able to start the MySQL service,because data directory is missing. It is needed to the first mount S3 storagewith instance and then start MySQL service. It makes things more complexfor configuring and setting up the infrastructure, as it has to make sure,whatever the attached volume is correctly working and is mounted to correctfolder.
To mount Amazon S3 storage with instance, it is needed to run ec2-attach
-volume. When using newly created volume, it is need to format the volumein order to use it. To see, if attached volume command has worked, it can beused command sudo fdisk -l on the MySQL instance and check, whateverthe device is in the list, should be the last one. Mostly it can be /dev/sdd,but may vary depending on the image. Using command sudo mkfs -t ext4
/dev/sdd, it is possible to format the volume with ext4 file system. Afterthis, it is needed to make mount point, this can be folder in the file system. Tocreate new directory, use command sudo mkdir /var/data and for mount-ing attached volume, use command sudo mount /dev/sdd /var/data. Nowthe /var/data is containing mounted volume and it is possible to write filesthere. System administrator can copy MySQL data into newly created vol-ume, change the configuration file datadir location and make sure, thatmysql user has rights to write into this volume. If everything is done, it ispossible to start MySQL service, it should start instantly. If it takes time orfreezes, it can mean, that there is something wrong with the configuration.Rechecking permissions and whatever the image is mounted or not can solvethe issue.
3.6.3 Operating system configuration
There are some limitations in Ubuntu operating system, that might alsoaffect service quality and speed. Most important is to increase open file de-scriptors [17] for nginx, memcached and MySQL servers as opened socketsare also counted as file descriptors and under heavy load these servers mightrun out of free sockets and eventually starting to block incoming connec-tions making the service unresponsive. Because using same image for allthe servers, then these changes are system wide and affecting all the serversrunning in the cloud by the framework.
29
3.7 Study of load balancers
There are different load balancer servers that work as a reverse-proxyservers and are capable of redirecting traffic to the back end servers. Each ofthem has different characteristics and maximum throughput, depending howit was built and which language was used. This thesis will look two load bal-ancers. First is a Pen and the other is nginx, they are written in C language,meaning that they should have good performance and high throughput.
3.7.1 Pen
Pen is a simple reverse-proxy server, written in C language [39]. It iseasy to set up and make it running. It uses least round-robin algorithmfor distributing incoming requests. It keeps track of the clients and tries tosend them to the same server. It ensures that when using PHP sessions,user state is remembered. This helps to stay user logged in and the stateof the user can be saved in the same server, meaning there is no need forcentralized session (but when removing the server from the cloud, the statehas to be transferred into existing server). If lookup table is full (this istable, where pen is keeping track of the clients) it tries to remove oldestentries from the table and use most idle server to direct the traffic. It ispossible to remove lookup method and only direct traffic to most idle server(which has least connections). For benchmarking purposes, it would be bestto remove IP lookup table as load generators have fixed IP addresses and theload is therefore not evenly distributed or distributed only to small amountof servers, leaving other servers into the idle state. Note that nginx alsoprovides possibility to use lookup table (it is called hash table) to redirectthe traffic to the back-end servers, depending on the client IP.
Pen high availability and redundancy
Pen can ensure high availability by checking individual servers, what-ever they are up and running or are down and maintained. Pen supportsactive-passive failure server configuration when running multiple pen serversincreasing service redundancy, using VRRP (Virtual Router RedundancyProtocol) to decide which of the Pen servers is active. The Virtual RouterRedundancy Protocol (VRRP) is a computer networking protocol that pro-vides for automatic assignment of available Internet Protocol (IP) routersto participating hosts [40]. This thesis only focuses for single load balancerconfiguration and does not use active-passive failure configuration for loadbalancers.
30

Running pen from command line
Pen starts from command line and can be completely configured there.It is also possible to define configuration file. When trying to reconfigure theservers, it is needed to kill the process first and start it again.
$ sudo pen -r -t 10 -S 2 -p /var/run/pen.pid
80 server-1:80 server-2:80
Above command will start pen load balancer, that accepts connections onport 80 and redirects traffic to the servers server-1:80 and server-2:80.It has connection timeout set to 10 seconds with parameter -t and ignoresIP lookup for the users with parameter -r. Parameter -p is used for storingprocess ID for later usage and restarting the service. Starting services underport 1024 in Linux, it is needed to have super user privileges. Followingcommand will shut down the pen. This can be easily written into shell scriptto support running it as a service.
$ sudo kill -9 ‘cat /var/run/pen.pid‘
3.7.2 Nginx as reverse-proxy server
Nginx is reverse proxy application running on the server as daemon writ-ten in the C language by Russian programmer Igor Sysoev [31]. It usesnetwork OSI layer 7 (Application layer) [32, 50] to processes and forward therequests. This means that every request is entering to the operating systemand is not forwarded by the network card, thus meaning each request to ng-inx (working as a reverse proxy), is taking computer CPU time to processthe requests to the back-end servers. Nginx uses native operating systemfunctions to poll the existing asynchronous connections, making it possibleto serve large amount of request with small CPU usage. It uses Unix socketlayers, which also decreases CPU overhead as it passes messages betweenclient and back-end server directly through network card, without need tocommunicate with operating system.
On c1.medium, one nginx server is capable of handling over 10 000 re-quests per second (but with this traffic rate, it is possible to run into networkbandwidth problem). Wikipedia is getting traffic at 75 000 requests per sec-ond at the peak time [28]. To be capable of handling such load it means thatbigger machines should be used or servers should be separated between dif-
31

ferent regions to distribute load evenly and reducing traffic for one front-endreverse proxy server. Testing at these scales is difficult task and this thesisdoes not involve experiments with same amount of traffic as Wikipedia isgetting along. Nginx has been already installed in 19,121,348 (11.28% ofall servers) active servers based on Netcraft Web based survey on October2011 [6], showing that large amount of system administrators are alreadytrusting nginx as a front-end servers.
Nginx load balancing algorithm
The default distribution model for nginx server is in the round-robin fash-ion [7]. This model is one of the oldest and each system with capabilities ofdistributing requests supports this model by default. Round-robin methoduses a list of servers and an indicator to determine, in which server the lastrequest was sent. For every new request, the indicator value is increasedand next server is picked from the back-end server pool. If the value ex-ceeds servers count in the list, it starts from the beginning. This is noteffective method for distributing load, where request times vary, especiallyif the servers are under high load or the requests are not in equal size interms of CPU time they take. Wikipedia content varies in size and com-plexity, there are some pages that are just redirects and others, which arefull of information, meaning that they will need more CPU processor timeto parse the content. While distributing requests in round-robin fashion, wemight direct large page request to one server and redirects to other server,meaning that the first server might not be able to serve the requests in rea-sonable time, but the latter server is sitting in the idle state, the resourcesare not distributed equally. Variation for back-end servers CPU usage from50% to 90% has been observed, while conducting experiments with defaultround-robin and using different size of page requests. Unequal distributioncan overload the servers with high CPU utilization and some of the requestsare dropped, thus not resulting in best performance, that could be achievedfrom this configuration.
Nginx supporting least round-robin
To make distribution of the requests on the reverse proxy much better,it is possible to use add-on module fair [8]. Fair module for nginx doesnot use queuing on the proxy side. The main idea for using fair is to dropexcessive requests. It has option to define how many concurrent request oneserver can have. If there has no room left to send the request to back-endservers (i.e. all the servers are filled with the maximum amount of concurrent
32

request and there are no idle servers), the request is dropped. This behaviourof dropping excessive requests helps to avoid overloading back-end servers.Even if they are working at full power, they still manage to maintain goodresponse time and are capable of serving the requests. There is a thin linebetween maximum throughput and overloading the server. This must becarefully observed, but in the best case scenario, the maximum amount ofconcurrent connections should be smaller, as running servers over 90% CPUusage is not normal.
Nginx modules
Nginx has different modules 1 and addons 2. With HttpStubStatusModule
it is possible to gather information about active connections and how manyvisits there have been done. This helps to gather how many requests per timeunit there have been and this can be used for provisioning correct amountof servers using various policies. This module is deployed as a separate pageon the server and can be accessed with simple HTTP GET request and usercan define the page URI (Uniform Resource Identifier), where to access it.Unfortunately the statistics given by nginx is not as good as compared toHAProxy. HAProxy, is giving various information, including many connec-tions to the back end servers have been done, how much bytes have beentransferred and maximum queue for each server. To get similar information,it is needed for the back-end Apache servers to use module mod status 3.It will give information amount of connections generated and can be loggedto identify where and how the requests are distributed. Keeping track ofthis information can help to find possible bottlenecks in the service, are therequests forward to the back-end servers and are the requests distributed byload balancer equally.
3.7.3 Comparison between nginx and pen
Both of the load balancer with different configurations have been testedto identify best suitable load balancer. Pen is simpler to start the serviceas it can be done without any configuration file through the command line.Nginx needs some additional tuning, manual reading to get configurationright and how to use upstream module to set up reverse-proxy. Nginx hasbetter support for reloading the configuration on fly and has better documen-tation. For both cases, the documentation of load balancers are incomplete
1http://wiki.nginx.org/Modules2http://wiki.nginx.org/3rdPartyModules3http://httpd.apache.org/docs/2.0/mod/mod status.html
33

and much of the configuration examples have to be looked from differentInternet communities and forums. Nginx has good support for Russian andhas complete documentation in Russian, but lacks of English help.
Nginx is capable of serving more requests and has better overall perfor-mance compared to Pen. This is why the thesis will use nginx over Pen todistribute the load. It was easier to read total requests from nginx, as itwas already provided by HttpStubStatusModule to show active connectionsand how many requests have been made. This task was more complicated forPen, as there was a need to run shell script to receive the output of the statis-tics. Pen authors are strongly advising to use cronjob for this task. But evenwith this output it does not tell you how many requests have been generatedand how the requests have been divided. It only shows active connections,list of last clients and how much traffic (bandwidth) has been gone throughand only possible indicator of arrival rates would be to use bandwidth andaverage size for each request.
Nginx has plenty of third party libraries, but to use these, you have tocompile the nginx from source code and add library to the source. Someof the libraries are only compatible with old builds of nginx as they havenot been updated by the authors and therefore cannot be used with latestnginx versions. Some older nginx versions have problems with stability anduser has to be careful when running older version software as there might besecurity holes and bugs. It is strongly advised to read mailing lists and otherresources to see, if there are any known major problems. This thesis useslibrary called fair and in order to add it to nginx, it was needed to use olderversion of nginx to get it working. For that purpose nginx version 0.8.32 wasused and no strange behaviour for different experiments was observed. Someearlier versions had problems with reloading the configuration as they couldnot terminate old daemons and the service became stuck and unresponsive.It had to be killed manually and restart the service.
3.8 Configuration of the infrastructure
For keeping things simple, framework build by this thesis uses single imageand all the services are installed there. They are disabled at start up. Theidea is to run and start only necessary services depending which role theserver has. By default, additional HTTP server at port 8080 was started, thatwas showing content from /mnt folder. This mount point had plenty of roomto write and content saved there is not bundled to the new image (it needs tohave writing permissions, otherwise only privileged user can access it). Thisis good location to temporarily store private keys and bundle the new image
34

together. The image is packed and has to be uploaded to the cloud in orderto get the new image working and ready to launch new instances. This helpsto protect leaking the private key to other users, especially when the imagehas marked as public, extra care has to be taken. HTTP server running onport 8080 allows to easily download content from the cloud without the needto use scp (secure copy tool under Linux). Cloud user has to make sure,that additional ports are added into security group, otherwise they cannotbe accessed outside the cloud.
3.8.1 Endpoints for SciCloud and Amazon
Endpoints show where the SOAP service is accessible. From there, it ispossible to feed in commands to manage the cloud (kill instances, run new in-stances, query list of already running instances). SciCloud is accessible fromhttps://katel42.hpc.ut.ee:8443 and Amazon EC2 us-east region is ac-cessible from https://ec2.us-east-1.amazonaws.com. For each region,Amazon EC2 has different endpoints. The excellent tool to get overview ofrunning instances, add or remove instances is Mozilla Firefox add-on Elastic-fox 4. In order to get it working, user needs to configure endpoint location andenter keys, that were retrieved from the cloud administrator or downloadedfrom Amazon Web Service console. It is also possible to use euca or ec2 com-mand line tools to run and terminate instances (look euca-run-instances
and euca-terminate-instances). Commands starting with euca are meantfor Eucalyptus cloud and ec2 commands are meant for Amazon EC2 cloud.Elasticfox is compatible with Amazon EC2 cloud, but user can use AmazonWeb Service to log in to the web interface and manage keys, images andinstances there.
3.8.2 Setting up services and MediaWiki installation
In order to configure the infrastructure in the cloud, at the beginninguser has to use the base image, where to build its infrastructure. Thisthesis uses 11.04 Ubuntu with 32bit architecture for Amazon EC2, it willsupport running m1.small and c1.medium instances. Using aptitude tool(apt-get install packages), following packages were installed: apache2,apache2-mpm-prefork, mysql-server, php5, php5-mysql, php5-xcache, mem-cached, sysstat, openjdk-6-jre, ec2-api-tools.
Apache and php5 are used to serve the dynamic content using MediaWikiapplication. XCache will improve PHP script execution times as the code
4http://aws.amazon.com/developertools/609? encoding=UTF8
35

is cached and do not have to read it from the hard disk, MySQL is usedto run database and the content of MediaWiki is stored there, memcachedwill enable caching support for MediaWiki, sysstat gives tools to measureperformance of the instance and openjdk is used to run Java jar files. EC2 apitools add command line scripts that are necessary for framework produced bythis thesis. These are used to configure the cloud, add and remove instances.Some of the packages might already be installed, depending which image wasused to run the instance.
MediaWiki was downloaded 5 (version 1.16.5, released in May 2011) andunpacked to folder /var/www. This is default location for Apache home direc-tory and files from there are shown to the users who visit the web page. Me-diaWiki has simple installation interface and user is automatically redirectedfrom front page localhost/mediawiki/ to the installation page. To get in-stallation process to be smooth, it is recommended to use single instancesto install all the necessary services and install MediaWiki to local MySQLdatabase. Make sure that MySQL service is running when installing the Me-diaWiki. It will create necessary database structure to store the Wikipediacontent. Script for uploading the data from Wikipedia dumps to database donot support using prefix for table names, meaning that when installing Me-diaWiki, prefix form should be left empty. When installing the MediaWiki,user can use localhost as a host for MySQL and memcached services. Thisshould later be changed to the correct instance IP addresses, where the ser-vices are deployed, but this is automatically done by the framework. UsingMySQL and memcached service to install the application, it is possible laterto check whether both are running correctly and configuration works. This isimportant step, because if later on bundling the image together and findingout, the service does not work correctly, there is need to fix the errors andproblems. If later on requesting the new bundled image, for every instance,these fixes have to be done again, meaning it would be better to fix the im-age, bundle it again and upload to the cloud to retrieve new ID of the imagethat can be launched with fixed configuration.
3.8.3 Wikipedia article dumps
If the installation of MediaWiki is done, it is time to download the articlesof Wikipedia. Wikipedia makes the database dumps in regular bases toensure data availability for mirror sites or for users who want to run it locally.When using S3 storage to store the database data, make sure that it isworking correctly and it is mounted into correct place, MySQL is correctly
5http://www.mediawiki.org/wiki/Download
36

configured and MediaWiki tables have been created to the database.In the current study the infrastructure configuration uses file system given
by the image to store the data for MySQL database. Amazon EC2 gives 10GB disk space for c1.medium instance, it was enough to initialize databasewith two Wikipedia article dumps of January 15, 2011 6 7, consisting of166,977 articles. This corresponds to 2.8GB of file system space. The op-erational dataset, however, is composed of about 1000 randomly selectedarticles across the database. These restrictions have taken into account toavoid having large time spending on filling the cache. Filling the cache wasnecessary as the experiments conducted by this thesis were interested in per-formance of stable system with high cache hit ratio. Using fully filled cachedfor MediaWiki and using Wikipedia articles dumps, it is possible to achive97% memcached hit ratio and 75% of queries are cached by MySQL.
These dumps are in XML format and in order to upload them in to thedatabase, they have to be converted to SQL queries. There is Java programfrom WikiBench called (available on DVD) mwdumper.jar 8, that can beused to convert XML to SQL, pipe the output of the dumps into databaseusing MySQL. Following is example how to upload dumps into database.
$ java -jar mwdumper.jar --format=sql:1.5
enwiki-20110115-pages-articles1.xml.bz2 |
mysql -u root -p wikidb --password=root
To check, if it is working, open up browser and visit MediaWiki web pageand click on ”Random article”. If new page is fetched and it is different than”Main Page”, MediaWiki has been successfully installed. Framework buildby this thesis takes care of the rest, configuring correct IPs for MySQL andmemcached host, making it working in multi-server configuration, configur-ing back-end servers and adding them into load balancer server list.
3.9 Framework scaling instances in the cloud
Prerequisite tools are needed in order to add, remove and retrieve infor-mation about instances from command line. This study uses Amazon EC2
6http://download.wikimedia.org/enwiki/20110115/ enwiki-20110115-pages-
articles1.xml.bz2 (192 MB)7http://download.wikimedia.org/enwiki/20110115/ enwiki-20110115-pages-
articles2.xml.bz2 (263.3 MB)8http://math.ut.ee/∼wazz/mwdumper.jar
37

instance ami-e358958a (Ubuntu 11.04 32 bit, kernel 2.6.38) 9, it has repos-itory for these tools and can be installed with ease using aptitude tool [30].SciCloud is working on Eucalyptus cloud platform and it has euca tools tomanage the cloud. Amazon in the other hand uses ec2 tools to have ac-cess with the cloud. The commands are same as Eucalyptus is built to becompatible with Amazon cloud interface, only the first part of commanddiffers. To install Amazon tools on Ubuntu, you have to install packageec2-api-tools [26] and have to make sure, that multiverse is enabled [27].
Using commands euca-run-instances or ec2-run-instances respec-tively for starting the new instances. Using man page [29] under Linux, itwill give information how to use the commands and which parameters canbe used. With parameter -n user can define how many servers are going tobe started upon a request. These tools also need a private key and certificatekey to access Amazon EC2 service. Instances requested from the AmazonEC2 cloud starts relatively fast, it takes average 2 minutes to get c1.mediuminstance up and running, depending of the speed of the instance. Smallerinstance m1.small is slower to get running and takes more time comparedto c1.medium, because it has limited CPU power and the IO performance ismoderate.
Example of how to start instance on Amazon EC2
$ ec2-run-instances ami-e358958a -n 2 -key keypair -K user priv key
-C user cert key --instance-type c1.medium
--region us-east-1 --availability-zone us-east-1c
This command starts virtual machines image (image code ami-e358958a),parameter -n defines how many servers are requested, -K is private key (canget from AWS console) and -C is certificate key. Parameter --instance-typedefines, which machines are required, it is also possible to define in which re-gion the instance is started (default is us-east). Parameter -key will definekey pair, that is used to allow SSH access with the instance. If the requestis successful, this command will output list of requested instance identifiers.These can be used for tracking purpose, do check whatever requested in-stances are up and running, or still waiting in pending state. The logic foradding and removing servers is implemented by the framework and can befound, when looking CloudController source code.
9http://thecloudmarket.com/image/ami-e358958a–ebs-ubuntu-images-ubuntu-natty-
11-04-i386-server-20111003
38

3.9.1 Calculating arrival rate
Nginx uses HttpStubStatusModule module, that will provide informationabout how many requests has been made to the nginx. Knowing time andarrivals from the first measurement and from the last measurement, it ispossible to calculate arrival rate for that time period in request per secondusing following formula
λ =h2 − h1t2 − t1
(3.1)
where t notates time in seconds, h notates arrivals to the system, index1 means first measurement and index 2 means latter measurement. Withthis information, it is possible to calculate how many servers are going tobe needed, keeping in the mind the service time and maximum through-put of one server. Requesting additional servers can be achieved runningec2-run-instances. If this command is successful, it will return list con-taining unique ID for each requested server and this can be used later todetermine, whatever the requested server has started and is running, is stillpending or in rare conditions have failed. When requesting a new server,it takes some time to copy the image to physical host and start the virtualmachine. For programming logic, it is possible to use separate thread towatch status of the requested instances and not affecting the main loop. Ifthe instance is becoming available, it needs to run automatic script to changethe IP addresses in the MediaWiki configuration file and start Apache server.Addition to this, new servers have to be added to the list of upstream serversin nginx configuration and reload nginx. Using command nginx and sendingsignal with parameter -s to execute following command nginx -s reload
will reload already running nginx configuration. This will spawn new pro-cesses and sends signal to the old processes. If there are many jobs in thesystem, nginx old processes waits until all the requests are served and thenwill kill itself. This allows transparent reloading of the load balancer, withoutvisitor of the web page knowing, that service are restarted, making it possibleto update and reload nginx configuration, without losing any connections.
3.9.2 Removing servers from the cloud
Removing the servers is easier than adding them, as there are only twosteps necessary to do. First step is to remove servers that are going toput off from nginx upstream configuration and reload nginx. This makessure that we do not lose any connection in the process of shutting downApache server virtual machine. With command ec2-terminate-instances
instance-id we can terminate already running instance, it will closed down
39

quickly. Going through the steps for adding, keeping eye on already runninginstances and removing servers, it will give idea, how auto scaling in the cloudcan accomplished. For further information, how server adding and removingprocesses looks like and how the servers are monitored, you have to look atthe CloudController code.
3.10 Framework layout
Framework built by this study supports private (SciCloud running onEucalyptus) and public (Amazon EC2) cloud. It is capable of starting nec-essary services and terminating unneeded services depending on the serverrole. Output of this study is the development of three main programs thatwill give complete overview of the cloud and have possibility to configure thecloud on fly. The framework is still in experimental state and should not beused to run in the real applications.
Figure 3.6: Displaying experiment configuration in the cloud environment
and how the requests are going through. All the servers are located in the
cloud, for reducing network latency, they are located in the same availability
zone.
Figure 3.6 shows experiment configuration and how the serves are con-nected with each other. This figure shows how requests generated by the loadgenerator are passed through different servers. All the servers are runningServerStatus for measuring the performance metrics.
40

3.10.1 CloudController
CloudController is a Java program that takes care of configuring infras-tructure. It will run predefined commands using Secure Shell (SSH) depend-ing on the role marked for the configuration on each server. It is capable ofprovisioning servers. Using euca or ec2 tools, it can add or remove servers.These changes are synchronized with nginx load balancer to immediately di-rect traffic to the new instances and remove servers from the upstream listto avoid bad responses. Between adding and removing servers, none of therequests in the system nor upcoming requests are lost. It gathers arrival ratefrom nginx HTTPStubStatusModule, this can be used by policy algorithmsto determine amount of servers needed. It will also gather statistics andperformance metrics from running instances, connecting with each instanceServerStatus program and fetching collected data using TCP (TransmissionControl Protocol) connection. All the gathered statistics include time mea-sured from the beginning of experiments and outputs are written to files, itwill help easily to compare results and parameters throughout the experi-ment.
Figure 3.7: Showing interactions between cloud interface and virtual machine
running on the cloud through CloudController application.
Figure 3.7 shows common interactions made by CloudController to con-trol and monitor the status of the instances. Its main purpose is to gatherstatistics from running servers throughout the experiments to see how system
41

acts with varying load, giving vague idea how the requests are distributedand how loaded the other servers are. There are two ways for provision ofservers in the cloud using CloudController. First way to measure arrivalsrate and run algorithm to determine, how many servers are needed to copewith such load. Other option is to measure average CPU usage what is gath-ered from back-end Apache servers and can define threshold, when to addservers (e.g. average CPU exceeding 70%) or remove servers (e.g. averageCPU drops below 40%).
Adding or removing servers means additional configuration on the nginxconfiguration, changing server list in the nginx upstream module. For addingservers, CloudController will constantly request server state from cloud in-terface, to see whatever requested servers have been booted and changedits state for running. If the server changes state from pending to running,CloudController will send predefined commands to the instance to config-ure MediaWiki application with correct IP addresses to the memcached andMySQL servers. When the configuration has finished, it will add the newserver to nginx upstream list and reload nginx. This process for c1.mediumtakes on average 3 minutes.
Commands sent to the instances are defined in the files and can bechanged, depending whatever it needs to install additional software or startadditional services. It is possible to download files from public internet site,to get additional programs or configuration files, or copy them from nginxinstance using scp. The framework is not using any DNS service or staticIP service from Amazon EC2 to define memcached and MySQL locationsin the cloud. This decision was made to reduce the cost of the experimentsand support dynamical allocation, without need to rely on other services.Without using DNS service, all the traffic generated during the experimentwill stay inside cloud, meaning that no additional payment for bandwidth isnecessary as the traffic is not redirected out of the cloud.
3.10.2 ServerStatus
ServerStatus is a Java program, that is executed at the beginning of thevirtual machine operating system boot. To start it from the boot, executioncommand to the start up script /etc/rc.local has to be added. This willbe executed, when the virtual machine operating system has booted up andrunning. It works as a server and listens incoming TCP network packets onport 5555. Every 15 seconds, it gathers performance measures from the cloudand stores it in the memory. It does not output anything to the console norwrite any statistics to hard drive to minimize resource usage on the servernot to affect other service performances. CloudController will collect data
42

Figure 3.8: Common life cycle of instance running in the cloud and reconfig-
ured while the service change state [53].
gathered by ServerStatus and will save the results on the nginx instance.There are different ways to connect with ServerStatus for gathering the
statistics. One way is to connect through port 5555 and send messages inplain text mode (possible to use telnet) or generate HTTP requests, mak-ing it possible to use web browser to see gathered performance metrics. Itwill gather data about current CPU usage, memory usage, hard disk usage,network usage, Linux load, how many running processes there are and howmany requests are made to the Apache server. ServerStatus includes full setof different system metrics, that help to measure performance of the server.It is easy to combine the results, as the ClountController gathers them intothe one place. These parameters can be used by CloudController makingprovisioning decisions, do we need to add new servers or remove existingservers, looking Apache back-end servers average CPU usage.
Possibility to access and see statistics with the web browser gives quickoverview of the current state of servers. These statistics can be also lookedfrom the ClountController output to check, if everything works as expected.CloudController provides information about how the memcached is filledand how many requests to the memcached gets a hit (the requested page isfetched from the cache). Collecting data and showing them in real time helpsto notice problems early (e.g. one of the Apache servers is not reachableby nginx load balancer) and restart the experiment. It still needs activeinteraction by the user to keep eye on the server and does not include anykind of warning systems, for example sending e-mail to the user, while oneof the server has become unresponsive or the cache hit ratio is low.
There are some limitations with ServerStatus, but is an excellent tool forgiving feedback about the performance of the server. Its sole purpose is totrack server usage, it does not contain any warning system and, therefore, it
43

is not suitable for live monitoring servers in real life environments. It wouldbe better do use Nagios and Ganglia combination while monitoring largenumber of servers, as there is active support and user base behind it.
Following is an example command how to access ServerStatus statisticsfrom Ubuntu command line using bash.
$ echo "STATS" | /bin/netcat -q 2 127.0.0.1 5555
3.10.3 BenchMark
BenchMark is a Java program, that is stressing out load balancer andApache servers. It uses trace curves to follow the amount of requests neededand uses URL list to make random page requests. It will output all theresponse times with the response code for later analysis. The traffic curvecan be scaled depending of the user needs, it is possible to set maximumand minimum arrival values (requests per second). User can also definememcached IP to keep track of cache hit ratio to make sure that everythingis going as expected. With getting cache hit ratio and server response times,it will give adequate information whenever the servers are ready for runningthe full-scale experiment or not. Each experiments conducted by this studyuse filled cache as it represents stable system. Looking cache hit ratio, ithelped to determine, when it is the right time to start the experiment.
BenchMark is using Java sockets for generating the load. The requestsare simple and only first line of the response is parsed by the program togather information whenever the request was successful or not, other linesare discarded, buffer is cleaned and socket closed to make sure that serversdo not wait until all the content has been loaded. All responses with code200 are marked as successful (page redirects from URL lists were removed).MediaWiki uses error codes to define request state and gives informationabout current state of the service. For example, when the MySQL is notaccessible or is overloaded, it will return 503 error and if pages does notexist, it will return 404 error. There are also nginx error 502, that is givenby Fair module. This is returned, when the Fair module determines, thatthere are no more free sockets left to connect with the back-end servers (Fairis used to limit concurrent connections). Different error codes give an idea,where or why the error occurred. Sometimes it is needed to visit MediaWikiweb page to see exact error code as the BenchMark tool does not downloadrequested files.
There are two options for generating the requests. First one is to equallydistribute the requests into one second, but with small load, it does notpresent real traffic characteristics as the arrival rate varies. The other option
44

is to use randomly distributed requests that give better characteristics withthe real world applications. Making ramp up test or measuring service timeit would be better to use equally distributed requests as there is not somuch fluctuation in the traffic and is easier to interpret the data (to seemaximum throughput of one server). Under heavy load and using largeamount of back-end servers, it does not differ, if the requests are equallydistributed or randomly distributed for one second as the load balancer takescare of distributing these requests. If the load balancer is configured correctlyit is not possible to overload back-end servers, while most of the requestshave been done in the first part of the second, back-end servers should workwell with such load as they have enough power to cope with rapid increaseand decrease in the load curve. Randomly distributed traffic varies betweenseconds and do not guarantee the load defined by the user. Calculatingrandom arrival times can also affect amount of load that program is able togenerate and therefore using equally distributed load, the load generator isable to send more requests to the server.
3.10.4 Additional HTTP server
For each instance, an extra HTTP server is running on the port 8080 andhome directory set to /mnt to be able to download experiment results fromthe cloud. Folder /mnt uses external space, it does not use image file system,and therefore has more room. By default, Amazon EC2 built in file system inthe image has 3 to 10GB total virtual disk space depending which instancesare used. When running large scale experiments, this room can quickly runout and therefore it has been decisioned to use /mnt to store temporarily theresults. It is also possible to use scp program to copy the results from cloudusing private key to access the instance. It has to make sure, that folder/mnt has set proper permissions, so the other programs can access and writethere.
3.10.5 Distinguishing different servers by their role
MediaWiki framework is using different servers and roles to run the ser-vice. There are three options how to implement configuring the cloud. Forexample, MediaWiki configuration file needs correct IP addresses for mem-cachend and MySQL servers, these modifications have to be done for allthe Apache back-end servers. In order to distinguish different servers, it isneeded to assign tags or keep records of the running instances. One optionis to use Amazon AWS console to tag running instances. These tags can be
45

filtered out by using REST services for EC2 to query the requested servers.This option requires that application takes care of configuration of differentservers, has private and certificate key copied to the cloud to access the EC2services and could request list of running servers. Because of security reasons,it is not a good idea to store your private and certificate key on the virtualimage and also using key hashes for running ec2-describe-instances as theymight be grabbed by third persons or if the image is made public and userdoes not remember, that the key is stored there. This allows access to yourkey and thus others are able to run the instances and access cloud behalfof the key owner. When using AWS console to tag running instances, usermust copy its keys to the cloud to make sure that he can use Amazon EC2cloud commands to gather information about running instances and filterout correct roles for each instance.
Important caveat. When configuring IP addresses for MediaWiki con-figuration, it is important to use private IP address as it will reduce thelatency and also no additional data transfer fees are taken as the traffic isinside the cloud. When using public IP address, the traffic is redirected tothe outside of the cloud, thus increasing the latency and having to pay for thetraffic. Short experiment generating 15000 (4 request per second for a hour)requests can use 1 GB traffic between load balancer and back-end servers.1 GB traffic will cost 5 to 12 cents depending how much traffic has beenalready processed in the US East region.
Next option is to define roles based on private IP addresses and configurationis done solely relying on the predefined server list. This is used by CloudCon-troller. In this way, CloudController is aware of servers running in the cloudand which roles they have. Connecting with instances are done through SSH(Secure Shell) using private key to access them. With SSH, it is possible toexecute commands and copy new files in to the server. When setting up thecloud for the experiment, one instance needs to have CloudController alreadycopied or bundled with the image (make sure the private key is copied, notstored on the image). CloudController support two types of configuration,one is when user defines which servers to use and which roles to assign, otheroption would use CloudController automatic function to retrieve list of run-ning servers from the cloud and assign the roles automatically and make theconfiguration. CloudController uses predefined commands in the text files toconfigure the cloud instances (copying, removing files, changing permissions,executing applications, etc), these instances can be changed by the user, de-pending what he or she wants to achieve. When necessary software is copiedand services started, user needs to connect to worker instance and execute
46

BenchMark application to stress out the load balancer. Some parts of thedeployment has been still left to be done by the user, as some specific taskmay needed to be done before starting full scale experiment (e.g. filling thecache).
Example of secure shell, how to access instance in the cloud and executecommand.
$ ssh -o StrictHostKeyChecking=no -i private.key ubuntu@host ’ls’
SCP (Secure Copying Protocol) can be used to copy files from local machinesto remote machine. It uses same parameters as Secure Shell. In addition,user has to define which file or files he wants to copy and where they arecopied. It is also possible to change file name.
$ scp -o StrictHostKeyChecking=no -i private.key /home/ubuntu/local.txt
ubuntu@host:/home/ubuntu/
If user is interested in making experiments with empty MySQL cache, hehas to call out MySQL query RESET QUERY CACHE. It will clear the cache ofrecent queries. For clearing cache for memcached, one option is to restartthe service, next option is to send command flush all through TCP tomemcached (see shell command at the bottom) or modifying MediaWikiconfiguration file for invalidating cache (if $wgCacheEpoch is not modified).
$ echo "flush all" | /bin/netcat -q 2 127.0.0.1 11211
47

Chapter 4
Measuring Performance of The
Cloud
This chapter gives overview of statistics gathering utilities, that can beused to measure performance of the servers running in the cloud. Monitoringserver performance metrics gives good overview how the servers are workingin the cloud and it will help to solve bottlenecks and other issues, that canoccur while stress testing the system.
4.1 Using performance measuring tools un-
der Ubuntu
Ubuntu was used as a primary operating system, that has many usefultools installed by default. These tools are capable of measuring performanceof the machine and monitoring the current state. Ubuntu repository givesgood set of applications and programs, that have built in functionalities tomeasure and monitor performance of the server. They can be easily installedusing aptitude tool.
Ubuntu is storing some of the CPU, network, IO and memory metrics inthe /proc virtual directory, that can be used to read about the current stateof the server. It is possible to read server metrics, without having to installextra tools from repository.
4.1.1 Apache tool AB
Important caveat. Benchmarking tools are meant for generating highload for servers they are tested and, therefore, stressing out the system to get
48

idea of its limits. These tools should not be used for public services and webpages, as it is more-or-less a tool for a distributed denial-of-service attack(DDoS). One might look carefully, which systems it starts to test and makesure that it does not affect other running services on that system. It is thebest to do these benchmarks in closed systems.
To check performance of the cloud and measure performance metrics, weneed to stress test the system. AB (Apache Benchmark) [18] is utility thatcomes along with Apache installation. AB is simple tool to measure through-put of the web server using different parameters. This tool supports multi-threaded requests, giving possibility to define how many requests should begenerated and how many of the requests should run in parallel. Becauseof its robustness and simplicity, it does not support any flexibility definingcustom load curve or having varying traffic. It is good to measure maximumthroughput of the server or getting service time of the system. It should betested on the same network (availability zone) or otherwise bandwidth limitand latency could affect the results. Using Ubuntu manual man ab, it givesfollowing description for this tool:
ab is a tool for benchmarking your Apache Hypertext TransferProtocol (HTTP) server. It is designed to give you an impressionof how your current Apache installation performs. This especiallyshows you how many requests per second your Apache installationis capable of serving.
4.1.2 Ubuntu sysstat package
Sysstat package can be installed using command line tool aptitude: sudoapt-get install sysstat. This package installs various shell tools thatcan be used to collect system performance metrics. Using cron job, it ispossible for certain intervals collect the data into file and monitor systemperformance. Cron only allows running its jobs with minimum in 1 minuteintervals. Following is an example how to access cron and add job in to thelist.
$ crontab -e
# m h dom mon dow command
*/1 * * * * sar -u 1 1 >> /tmp/io usage.txt
With sysstat, important tools for gathering statistics are sar and iostat.With sar, the user can get overview of computer performance as it logs allthe necessary performance measurements in 10 minute intervals (when the
49

Figure 4.1: Standard output of iosatat command.
Figure 4.2: Standard output of sar using parameter to show memory usage.
user installs it first time, he/she must enable logging in the configurationfile /etc/sysstat/sysstat). It is also possible to call out sar directly fromcommand line to gain information about current state of the system. Com-mand sar 1 10 will output for each second ten times current average CPUusage. Command iostat -k is useful, when trying to measure informationabout disk operations and speeds. Parameter -k will force to show disk speedand kilobytes, by default, operations are used for the counters.
Using combined shell script of previous tools, it is possible to gathersystem performance statistics to monitor the usage and health for differentservers. This gathering process can be built into web service, that can beaccessed by other servers or use ssh to run the commands remotely.
4.2 Using third party tools
Here is a list of some of the popular third party tools, that can be usedfor measuring server performance in the cloud.
Figure 4.3: Standard output of free to get information about physical mem-
ory usage.
50

Figure 4.4: Standard output of sar using parameter to show CPU usage.
Figure 4.5: Standard output of ifconfig to gather network interface traffic
bandwidth.
Figure 4.6: Standard output of uptime to see information how long the
computer has been running and also get Linux load for 1, 5 and 15 minutes.
Figure 4.7: Standard output of ps with various options to gather how many
processes are working. Because command itself counts as a single process,
these results should be subtracted by 1.
51

4.2.1 RRD database
Next tools collectd and cacti are using RRD (Round-Robin database) tostore its data. Round-Robin database is a flat file structure. The RRD worksas a circular array, that has no end or start point. Because of this structure,the RRD files are always in fixed size. It contains information how the fileis structured and what variables it is containing at the header section of thefile. The other part of file will contain actual data. These data are dividedinto the separate sections, supporting different time spans and density ofdata (i.e. measurements for each seconds, weeks and months). This willbe useful when drawing the graphs for longer time span. RRDTool is usedfor drawing the graphs from RRD files. Using different resolutions and timespans, it will automatically select which data to use for plotting purpose.With bigger time spans, it will use measurements averaged from small unitsto larger units (from 10 second intervals to day, from day intervals to monthetc). This will reduce time it takes to draw graphs, when trying to plotCPU usage for one year, but also the file size is fixed and smaller. StoringCPU usage for one year with 10 second interval would not be feasible. Usingdifferent resolutions and arrays in RRD file, it is possible to achieve datagathering for larger time spans than 1 week.
4.2.2 Collectd
Collectd is tool written in C++ and it can be used to measure differentstatistics in the server. It has built-in plug-ins that eases gathering statis-tics from different servers to one central server, it is possible to define onecentral collectd server, that will gather other collectd servers statistics oruse multicast support. Main server for collectd will create for all the otherservers different folders in the file system, where RRD files are created anddata fetched from the client servers added. Multicast will be good to usein the cloud environment, where instance IP addresses are changing whileconducting new experiments, thus reducing effort to configure IP for clientservers.
By default, collectd gathers performance metrics at interval 10 seconds.This can be modified to reduce the traffic, if using server-client configuration.For local collection, it uses minimal amount of CPU to process requests as ithave highly optimized code written in C++ language and does not impactthe system performance, while measuring different metrics. With defaultconfiguration, one RRD file takes up to 0.1 megabytes in the file system andall the collected data with various RRD files can take up to 30 megabytes.Plugin rrdtool will write out gathered metrics into RRD files. This should
52

be activated on collectd server. Using collectd as server-client configuration,it is needed to use built-in plug-in network, this will gather statistics fromdifferent servers into one server. One option would be to copy RRD filesfrom the servers, but because of large size, it is not feasible to copy them atregular intervals, and network plug-in should be used when we want to drawthe real time graphics.
Collectd, in comparison to Ganglia (one of the most popular tools forvisualizing server performance in clusters), is not a visualization tool, it doesnot have built-in function to show the graphs of the server performances.RRDtool created by Tobias Oetiker [33] has functionality to draw the graphs.There are some examples added to the collectd package, that uses RRDtoolto draw graphs using PHP or CGI, introducing possibilities that collectdwith RRDtool can provide.
Amazon EC2 cloud gives great variety of servers to be used and the archi-tecture might be different (32bit or 64bit). If the architecture stays the samefor all servers, then there is no problem collecting and drawing the data usingcollectd. If some servers are using 64bit architecture (e.g. database server,needing more CPU power or memory) and some are using 32bit architecture,to merge these graphs or draw them from another machine, the files have tobe converted. With rrddump it is possible to convert RRD files into XML(Extensible Markup Language). They are at least 10× bigger, so it wouldbe wise to pack the results before downloading to local or another machine.Converting should be done in the same machine (otherwise rrdump is notable to read values from the file) or with the same architecture. If the filesare converted, it is possible to download them to another machine, that usesdifferent architecture. Program rrdrestore is used to convert XML filesback to RRD format. This should be done, where the graph drawing logicis done. Otherwise trying to draw different architecture RRD graphs willthrow an error.
4.2.3 Cacti
Cacti is an application bundle that consist of web application and systemtools to gather various data and visualize it. It has administration interface,where user can set up new graphs or download new ones from Cacti homepageand export them. Public interface gives information about metrics gatheredfrom servers. The system itself is using RRD files to store the data. Itis possible to add as many servers into the list as needed and role for eachserver can be assigned. Role will reduce user input, as they contain templates,what graphs and what metrics to gather. There is no need to gather MySQLstatistics for memcached server.
53

Figure 4.8: Showing Linux load gathered with Cacti and drawn by Cacti
using RRDTool.
During writing this thesis, Cacti was tested to measure the performance ofservers in the cloud, but unfortunately gathering the data was CPU intensiveand there were several spikes in CPU usage. Cacti default gathering intervalis set to 5 minutes, which should give enough precision for longer time andshould hold network traffic as minimum as possible when transferring dataacross different servers. Even though the gathering is done in 5 minuteintervals, it can generate spikes in CPU usage, while gathering parameters.There was at least 20% of CPU increase, when gathering various information(CPU, memory, network traffic, disk usage) from the server. For gathering,Cacti uses PHP script, that has added to cronjob list to fetch necessary data.While gathering metrics for 10 graphs, it took around 10 seconds for singleserver to process the data. Increasing the measuring points to 80, the timeit takes to collect the statistics increased at least 60 to 100 seconds. Cactigathering process was highly affecting CPU usage and affecting performanceand speed of the service.
Cacti homepage suggested using of Spine (Cactid, written in C language)for polling the performance metrics instead of the default PHP. Spine sup-ports multiple threads and should gather statistics much quicker way andwith less overhead. Even though going over to Spine, there were still spikesin the performance graphs. The CPU usage decreased compared to the PHPpoller, but still the spikes existed and affected service performance.
Cacti is not using caching when drawing graphs, meaning that whenbrowsing between different web pages, the graphs have to be drawn againby the RRDtool impacting the server performance, where the graphs arecollected. This means, that the service has to run in a separate server fromthe framework or it should be looked only at the end of the experiment.
Figure 4.9 shows clearly, that for every 5 minutes there are spikes, that
54

25
30
35
40
45
50
55
60
65
70
75
1 1.2 1.4 1.6 1.8 2
CP
U u
tili
zati
on
[%
]
Time [hours]
Apache [%]
100
150
200
250
300
1 1.2 1.4 1.6 1.8 2
Res
po
nse
tim
e [m
s]
Time [hours]
response time [ms]
Figure 4.9: Fraction of the experiment running 10 servers, showing average
CPU usage for Apache server and benchmark response time. For each 5
minutes, there is a spike, because cacti starts to measure metrics of the
server.
are caused by Cacti, trying to measure the different performance metrics.The gathering process seemed to work at least 30 seconds and affected theservice performance. For each spike, the response time increased at least100ms. Figure 4.10 shows 1 and 5 minute load for Ubuntu and indicating,that too much resource is used while collecting data. This data collectiondid not resulted in lost traffic for that hour, but still can be considered as aperformance issue.
0
0.2
0.4
0.6
0.8
1
1.2
1.4
1.6
1 1.2 1.4 1.6 1.8 2
Lo
ad
Time [hours]
load 1load 5
Figure 4.10: Showing spikes caused by Cacti, when collecting different per-
formance metrics from the server.
55

4.3 Framework Performance Measuring Tools
While trying different tools, there was not a single good tool for the frame-work to collect performance metrics from the cloud. Idea was to have simpletool for giving current performance measurements through HTTP request.Collectd is easy to install, configure and get it running, but usage of RRDfiles to store the data complicated the use, as there is need to use RRDtoolto fetch measured values and synchronize the results with response times col-lected by BenchMark. Synchronizing different files together was becomingcomplex when using dynamical allocation policies as the timestamps weredifferent for each file for each server. The process was not straightforwardand, therefore, collectd was not used in the framework. Collectd speed andperformance was good and did not affect other services running in the server,even if it was using small interval and frequently collecting the data. Cactiused also RRD files to store the data. However, its performance was notsatisfactory even while collecting data with 5 minute intervals.
One option is to use sar utility, gathering statistics with 10 minute in-tervals (or use cron job to collect data into one file). Tool sar is givingmetrics for different parameters and the previously measured values can beretrieved again. But for this option, the time interval was too large (1 hourexperiment means, that you have only 6 measuring points) and still somesynchronization has to be done at the end of experiment to align the valueswith BenchMark results.
Solution for gathering the metrics was to have for each virtual machinea web service, that will run sar and iostat commands and parse the out-put to gather performance metrics. These metrics are kept in the memory,no output or files are written. Only way to access these stored metrics isto connect through network with the service and it will return informationabout gathered values. There is a central program running on nginx server,that is aware of running virtual machines in the cloud and connects for cer-tain time periods with each server and retrieves values collected by the webservice. This solution helped to collect the performance metrics of all serversinto one location using timestamps. These collected values can be easilycompared with timestamps generated by the BenchMark utility and no fur-ther synchronization has to be done at the end of the experiment to putthe results together. ServerStatus program has been built, that will takecare of collecting and parsing performance metrics from instance for each 15seconds and listens incoming connection. Logic for collecting the statisticsfrom ServerStatus is done in CloudController that maintains list of runningservers and knows, which servers have to be visited to gather the statistics.For each gathering phase, CloudController shows in its output CPU, mem-
56

ory and network usage for each server, making it easy to keep an eye on theexperiment.
One option was to run sar and iostat commands through ssh (SecureShell), but under heavy load handshake, secure connection channel establish-ment and authentication will take significant amount of time and might failto collect the data, making it unusable at higher loads.
Figure 4.11: Modifying ServerStatus code and using JavaScript, it is possible
to draw graph of the CPU usage that can be viewed when opening browser
on port 5555.
57

Chapter 5
Preliminary Experiments and
Evaluation of The Framework
This chapter overviews the experiments conducted to learn MediaWikicharacteristics. This gives overview how well the framework scales and themaximum throughput of the servers. Experiments help to understand thesystem behaviour under high load, whether it would be possible to optimizethe service or one of its components and what would be the most suitableconfiguration to run the services in the cloud. Putting servers under highload will help to determine maximum throughput of each server. This valuecan be used for scaling purpose to know, when it is the right time to addservers and when the servers should be removed from the cloud.
Conducting experiments will help to find possible bottlenecks in the sys-tem. As the service configuration is complex, there is no single failure pointand without knowing the characteristics of application, there is no under-standing where the slowdowns can occur. This chapter will give experi-ments for different configuration, where the configuration files of services arechanged and different Amazon EC2 instances are used. If not told other-wise, experiments running the MediaWiki application have been done withc1.medium Amazon EC2 servers. Some of the servers can be downgraded,e.g. memcached, as during the experiments it is not possible to overloadthe memcached, but to have comparison between different services and howmuch resources they use, same server types are used for all the servers.
Experiments conducted here to measure service performance were onlyquerying dynamical pages (PHP files). Static files (CSS, pictures, JavaScriptetc) were left out, as the service time for these two requests is too differentto load balance in the same manner between back-end servers. There is aneed to define another upstream load balancing group for the static pages on
58

different servers. Another issue with the static pages is, that the servers arecapable of handling more requests, meaning, that there has to be deployedmore load generators to reach the increased load and using more serversmeans, that cost of conducting the experiments will definitely increase.
5.1 Importance of experiments and stress test-
ing
Experiments for stress testing the system have been a part of a QoS(Quality of Service) for a long time. It has important role to determinesystem flaws before it is going to the public and the system can be consideredas a final product. It gives performance measures and throughput limits foreach service, giving better vision in making capacity planning. Poor QoScan lead to frustrated customers, which tends to lead to the lost businessopportunities [46]. QoS includes measuring time it takes to process singleresponse and measure server overall throughputs. Increase in response timesmeans, that the jobs are staying longer in the system, eventually leading intobacklogging and making system unresponsive. Longer response times willkeep off potential customers, as they will not want to waste their time forwaiting when the new pages will be rendered. Without making stress testing,it might lead to following two outcomes [45]:
1. Service will fail at worst possible time, generating lots of frustratingcustomers or losing important transactions.
2. While bottlenecks happen in the system under heavy load, system ad-ministrator might not be aware, where or why they happen and findingthe problem solution a lot harder.
5.2 Identifying most suitable configuration
Amazon gives great number of different server types, that can be startedin the Amazon EC2 cloud. They vary in CPU speed, CPU threads, memoryamount, IO/Network performance and architecture (32bit or 64bit). Forexample m1.small and c1.medium uses 32bit architecture and, therefore,when building image for the Amazon, it is not possible to run the sameimage on servers that are using 64bit machines. In order to achieve it, it isnecessary to re-bundle the same image for 64bit machines.
59
This study was looking for the best server type to be used from Ama-zon EC2 cloud, when running MediaWiki application in the cloud. Exper-iments with instances m1.small, m1.large and c1.medium were conductedand performance measured. Servers m1.small and c1.medium shares thesame amount of physical memory (1.7 GB), but the latter one has 5 EC2units of CPU power with 2 virtual cores and m1.small has only 1 EC2 unit ofCPU power with single core. 1 EC2 unit is approximately equal to PentiumXEON 1.2GHz processor [10]. Instance m1.large has 4 EC2 units of CPUpower with 2 virtual cores and has more memory (7.5 GB) than previousinstances. Previous tests in the SciCloud have shown that Apache serversrunning MediaWiki application is CPU bound and, therefore, most suitableconfiguration would be to use servers that have more CPU power. Read-ing characteristics for each server type, the most suitable server for runningthe MediaWiki should be c1.medium. It has been proven by Cloudstonepaper [44] that when using High CPU instances (e.g. c1.medium), the per-formance is better compared with Standard instances, as the most of theapplications are CPU bound, meaning that giving more CPU power willsignificantly increase the throughput. Liu and Wee [50] demonstrated thatm1.small instance was more CPU-bound, whereas c1.medium instance wasusually bounded by a network bandwidth (800 Mbps).
CPU speed in Amazon EC2 cloud depends on two factors: (i) how muchresources virtualization gives for the instance and (ii) physical host CPUspeed and memory bandwidth. Information about CPU given for the in-stance can be looked from Ubuntu under virtual file /proc/cpuinfo. In-stance c1.medium was mostly using CPU E5410 @ 2.33GHz (6MB cache)in us-east region. There were occasionally servers working with lower fre-quency, e.g. E5506 @ 2.13GHz (4MB cache). Looking the results of ex-periments, there was clear difference that servers with smaller clock speedhad maximum throughput smaller. While E5410 was capable of serving 30+requests per second at maximum (with all the configuration optimizations),E5506 was little bit slower and was able to serve only 26+ requests per sec-ond. As the request complexity for different pages differs and performanceloss of virtualization [57], it is not possible to give the exact results, but theestimates of average. Following command can be used to look CPU relatedinformation, when using Ubuntu operating system.$ cat /proc/cpuinfo
60

5.2.1 Experiments with m1.small, m1.large and c1.medium
instances
For selecting the best instance from the list, it would be good to performthe comparison between the different instance types. These comparisonshave been performed based on the ratio between instance hour price andhow many requests one instance is capable of serving as a maximum withone hour. Amazon EC2 pricing policy takes charges for full hour, makingit reasonable smallest time unit to compare the results. Running instancefor one hour the m1.small instance costs 0.085$, c1.medium instance costs0.17$ and m1.large instance costs 0.34$ in Amazon us-east region [20].
Two types of experiments were conducted for different instances to mea-sure (i) service time (making one request for each second) and (ii) maximumthroughput (increasing load in certain time period). All the experiments per-formed here have necessary optimization already done, meaning that mem-cached is running and filled with pages and PHP is using XCache to improvespeed of showing dynamical pages. Service time was calculated by takingaverage response time for one hour experiment, where for each second, onerequest was made. This would use minimal load for the server and theoret-ical value of maximum throughput can be calculated. Notice that two coremachines are able to serve twice as much. If having service time 100 ms,it means that for one second one core machine is able to serve 10 requestsand two core machines are able to serve 20 requests. Second experimentwas conducted to measure the maximum throughput of the servers. Thiswas achieved using incremental ramp up test, where for certain time period,load was increased by one unit (request per second). This will give enoughinformation to calculate the price for single request, using estimated valuehow many requests one server is able to process in one hour and what is costof server. Most suitable instance should have lowest cost for one request.
5.2.2 Experiments configuration
The configuration consisted of one Apache server, one nginx server, onememcached server, one MySQL server and one load generator instance. In-stances m1.small, c1.medium or m1.large used as Apache depending of thepurpose of the test. Other servers were selected c1.medium to make sure, thatthe other services are not slowing down the Apache instance and the compar-ison would be fair. It was important to run the experiments with the samerequested instances (nginx, MySQL, memcached) and they were located inthe same availability zone to reduce latency. Running with the same instancesis vital as it might significantly affect end results. For example, if requesting
61

0
20
40
60
80
100
60 80 100 120 140 160 180 200
Dis
trib
uti
on
[%
]
Response time [ms]
c1.mediumm1.smallm1.large
0
1
2
3
4
5
6
7
8
60 80 100 120 140 160 180 200
Dis
trib
uti
on
[%
]
Response time [ms]
c1.mediumm1.smallm1.large
Figure 5.1: Instance m1.small, c1.medium and m1.large service time dis-
tribution. Left side shows service time cumulative distribution.
new servers and for some reasons memcached or MySQL server is workingwith lower speed (host system wear, different CPU), it will not give us com-parable values as the service speed is affected by other parameters. Loadgenerator used the same URI list for request to remove randomness of oneexperiment getting slightly smaller page requests than others, meaning thatthe pages are served faster and the pages were requested in the same order.Throughout the experiment, memcached hit ratio was over 97%, meaningthat the most of the pages were fetched from the cache. This will representstable system, as for typical web server running for a long time, the cacheshould be mostly filled and response times should not vary. It is easier todetermine service time, as the variation is smaller. Purpose of the ramp uptest was to check maximum throughput and how it works, when overloadingthe system. To achieve this, maximum connections were increased to 30 fornginx and Apache.
5.2.3 Measuring service time
First test was to measure the service time for each instance, to know howmuch time it takes to process one job by the server. Note that instancesc1.medium and m1.large use two cores, meaning that two jobs can be pro-cessed concurrently. Service time was determined with the experiment, wherefor each second one request was generated. Average service time can be usedalso for different algorithms to calculate how many servers are going to beneeded to successfully respond for every request entering into the system.
Table 5.1 shows the results for the service times between different instancetypes. Using mean or median value, it is possible to calculate theoreticalmaximum throughput of the server. This value can be validated with the next
62

Percentile m1.small (ms) c1.medium (ms) m1.large (ms)
min 62 57 56
25% 108 66 65
50% 140 70 68
75% 149 74 74
90% 165 80 82
95% 175 83 94
99% 210 96 131
max 459 278 367
Table 5.1: Service time distribution for m1.small (mean 132 ms), c1.medium
(mean 71 ms) and m1.large (mean 71 ms).
experiment, where maximum throughput is measured. Instance m1.small isable to serve half of the requests faster than 140 ms. Using formula 5.1,theoretically m1.small is capable of handling 7 requests per second.
µ =1
service time× CPUcores (5.1)
With high CPU instance (c1.medium), half of the requests with in a70 ms, meaning that for one second, one core can process 14.29 requests persecond and two cores are capable of serving 28 requests per second. In thesame way, instance m1.large is capable of handling half of the requests within a 68 ms and because of two cores, should be capable of serving 29 requestsper second.
Instance m1.large response time distribution is similar to c1.medium.This can be related, that they both use 2 cores to process the request. Thedifference comes with maximum throughput, where m1.large has 4 EC2units of CPU power (c1.medium has 5 EC2 units), meaning that with thesame physical core, it has fewer CPU cycles to use. Next experiment showedthat at least 26% of the CPU went to the steal, but for c1.medium, thenumber was around 6%.
5.2.4 Measuring maximum throughput
Second experiment was to test overall throughput of the system, makingramp up test, where load was increased in every two minutes by 2 requests persecond. All the experiments consist also network latency, but it is relativelysmall and mostly it was less than 1 millisecond and, therefore, it is not
63

consider as an important factor to be interested, while comparing differentserver types.
In this experiment, the load was increasing from 1 request per secondto 30 requests per second with in 1 hour. Load generator requested samepages in order to have fair comparison. Theoretical throughputs have beencalculated from the previous experiments.
Single Apache server, running c1.medium, had the largest throughputcompared to the others servers. It was capable of serving 28 (see figure 5.3)requests per second. Response times during the ramp up experiment werestable and did not fluctuate, some of the requests were larger, meaning thatfor some time periods there were more jobs in the system than the serverwas capable of handling, this is why there were several pikes in the responsetime. Another problem with this experiment was, that when starting ex-periment with Apache from the cold start (instance was just booted), thereweren’t enough workers started by the Apache. Center of the experiment,the response time was slightly increased as the workers were not able toserve the incoming requests. When Apache was spawning new workers, theresponse time dropped and everything worked again as intended. Observingthis behaviour through experiment, the experiment was restarted. Beforere-running, Apache server was spammed with large amount of request, tomake sure that there were enough workers by Apache to process the requeststo remove the strange waves and increases in the response times.
Even though c1.medium and m1.large use the same amount of coresand the service time experiment shows the similar results, the latter instancehas been capable of only serving 18 requests per second at maximum (seefigure 5.4). It was observed, that for this instance there was a large CPUsteal usage (over 25%), meaning that the Apache server was not capable offully utilizing CPU. The situation with m1.small was even worse, as moreCPU usage (over 55%) was blocked by virtualization and the system wascapable of serving only 6 requests per second (see figure 5.2).
5.2.5 Summary of different instance types performance
The results of different comparisons as well as the selection of the bestoption is presented in table 5.2. We were seeking instance that is capableof serving one request at the smallest possible price maximizing throughputover the cost.
In the ramp up experiment, the load was increased for every 2 minutesand statistics were gather for every 30 seconds, thus having 4 measured valuesfor each load. From the figures 5.2, 5.3 and 5.4, the response time averageis taken for every minute and showing minimum and maximum values for
64

0
200
400
600
800
1000
1200
0.2 0.4 0.6 0.8 1 0
5
10
15
20
25
30
35
40
Res
po
nse
tim
e [m
s]
Arr
ival
rat
e, λ
[rp
s]
Time [hours]
response time [ms]throughput [rps]arrival rate [rps]
0
20
40
60
80
100
120
140
0 0.2 0.4 0.6 0.8 1 0
5
10
15
20
25
30
35
40
CP
U u
tili
zati
on
[%
]
Arr
ival
rat
e, λ
[rp
s]
Time [hours]
CPU usage [%]CPU steal [%]
throughput [rps]arrival rate [rps]
Figure 5.2: Instance m1.small response time and CPU usage for ramp up
test. In the case of this instance type server was able for 6 requests at
maximum and then the service became unresponsive. Only 40% of the CPU
cycle was enabled for user. Most of the CPU cycle, over 55%, was going to
steal, meaning that virtualization was dividing available CPU usage to other
instances on the same physical machine.
that minute. These graphs show the performance for each instance to getunderstanding, how they work under the high load. Overloading m1.large
server shows clearly, that when exceeding the threshold of the maximumthroughput, the service degrades and actual throughput decreases. Usingconfiguration for all the instances to allow 30 maximum clients, there weremore jobs coming into system and overloading the system. This will explainwhy for m1.large the throughput will decrease, while the arrival rate willincrease. This can be easily fixed reducing the maximum number of clientsin Apache configuration or using connection limit for load balancer.
It was interesting to see that for m1.large instance, serving one requestcosts more money than for m1.small. Customers of Amazon EC2 pay extramoney for the extra memory (7.5 GB of memory) while using m1.large
instance. However, this amount of memory is not necessary for runningMediaWiki on Apache, as it will be never fully used. This is paying moremoney for the resources that actually will not be used. This instance wouldbe better to use for memcached or MySQL as there is more room in thememory to cache the requests and objects. The best option for runningMediaWiki application with the framework was to use c1.medium instance(1.7 GB of memory). Memory consumption was small and it was cheaper touse compared to the other instance types, as one request was significantlyless expensive.
65

0
200
400
600
800
1000
1200
0.2 0.4 0.6 0.8 1 0
5
10
15
20
25
30
35
40
Res
po
nse
tim
e [m
s]
Arr
ival
rat
e, λ
[rp
s]
Time [hours]
response time [ms]throughput [rps]arrival rate [rps]
0
20
40
60
80
100
120
140
0 0.2 0.4 0.6 0.8 1 0
5
10
15
20
25
30
35
40
CP
U u
tili
zati
on
[%
]
Arr
ival
rat
e, λ
[rp
s]
Time [hours]
CPU usage [%]CPU steal [%]
throughput [rps]arrival rate [rps]
Figure 5.3: Instance c1.medium response time and CPU usage for ramp
up test. Server was able for 28 requests at maximum and at the peak the
average response time increased to 3 seconds and server started to become
oversaturated.
0
200
400
600
800
1000
1200
0.2 0.4 0.6 0.8 1 0
5
10
15
20
25
30
35
40
Res
po
nse
tim
e [m
s]
Arr
ival
rat
e, λ
[rp
s]
Time [hours]
response time [ms]throughput [rps]arrival rate [rps]
0
20
40
60
80
100
120
140
0 0.2 0.4 0.6 0.8 1 0
5
10
15
20
25
30
35
40
CP
U u
tili
zati
on
[%
]
Arr
ival
rat
e, λ
[rp
s]
Time [hours]
CPU usage [%]CPU steal [%]
throughput [rps]arrival rate [rps]
Figure 5.4: Instance m1.large response time and CPU usage for ramp up
test. Server was able for 18 requests at maximum and at the peak the average
response time increased to 5 seconds and server was heavily overloaded.
66

measurement m1.small m1.large c1.medium
min. response time 62 ms 56 ms 57 ms
avg. response time 132 ms 71 ms 71 ms
max. response time 459 ms 367 ms 278 ms
max. throughput 6 rps 18 rps 28 rps
max. CPU steal 56.04 % 25.14 % 6.23 %
cost per hour 0.085 $ 0.34 $ 0.17 $
price per request 3.935× 10⁻⁶ $ 5.247× 10⁻⁶ $ 1.687× 10⁻⁶ $
Table 5.2: Comparison between different instance types, showing their capa-
bilities, cost and how much single request will cost (this is calculated using
estimated value how many request one instance is capable of serving in one
hour, dividing the total request count with the instance price for one hour).
Response time statistics are taken from service time experiment.
5.2.6 CPU cycle waiting behind Xen hypervisor
Figure 5.1 shows how response time distribution differs for m1.small
instance, having one portion of the requests served faster than the other por-tion. This can be caused by, because some of pages are relatively short and donot need excessive CPU usage to process the content, but for others it is nec-essary to process more objects through, meaning that operating system usesmore CPU while processing these requests. But because of virtualization andhaving limited amount of CPU power given, the Xen hypervisor is blockingCPU usage for virtual image, meaning that for processing request the appli-cation has to wait until CPU usage is allowed again, making the responsetime longer. Therefore, we selected out randomly two requests to comparethe page complexity and time it takes to serve it. First selected page (Stron-tianite) was relatively short and second page (Summary of Decameron tales)was larger and contained more items and links. Processing larger page wasusing more CPU and because m1.small instance is allowed to use 44% ofthe CPU for one core in the virtual environment, the CPU usage is beingblocked away by virtualization, increasing response time for larger pages atleast 2×.
There is a reference [49], that instances, which have large CPU steal usage,is not suitable for real time application (like web server) where under theheavy load all the CPU power is needed. It is better to run web applicationsat a constant speed without need to worry about virtualization taking awayCPU cycles. Results for m1.small are pretty bad, as it is really not capable
67
of serving adequate number of requests. At the peak it was able to serve 6requests per second that was too few taking into account today’s traffic andbandwidths. It will be easy to overload the server with excessive incomingrequests, making it harder for dynamically adding new servers depending ofthe load, as there is a need to run extra spare servers or add servers in pairs(while the load increases, at least 2 servers should be added).
During the experiments, it was observed, that when Apache was spawningnew processes, there were some peaks in CPU usage affecting the performanceof the server. If MaxClients was set to high and server reaches maximumthroughput, it was no longer capable of serving excessive request, but wouldgenerate many new processes. This moment, the maximum throughput de-creases, as more CPU will be used by Apache to manage the PHP workers.This can be also noticed while looking Apache process count and CPU usage.There seems to be a common trend.
5.2.7 Measuring CPU utilization with ramp up
To see how CPU utilization changes over time for different servers, an-other ramp up test with c1.medium instances was used (see figure 5.5). Nextexperiment shows results for ramp up stress test, where for 1 hour, load from1 request per second to 150 requests per second was generated in the increas-ing manner. The configuration consisted of 5 Apache, 1 nginx, 1 MySQL and1 memcached servers. Using Fair module, at the beginning of the experiment,most of the requests were going to the first two servers, as the other threewere staying in idle state. At 25 requests per second, all the 5 servers weregetting requests. This behaviour happened, because with the small loads,fewer servers were capable of serving request faster than they were comingin, meaning that the server became again into the idle state and, therefore,the next request is served by the same server. This configuration was usingFair module with nginx using least round-robin algorithm to distribute theload.
At the middle of the experiment, the jobs were evenly distributed and theCPU utilization stayed the same between Apache servers. Further increasein traffic will disrupt the evenness, this shows that some of the instances arefaster and capable of serving request with fewer CPU utilization. Throughdifferent experiments and tests conducted by writing this thesis, there weresome server running as c1.medium acting unexpectedly and capable of serv-ing only 20 requests per second with 100% of CPU utilization, others havebeen able to serve sometimes almost 34 requests per second. For servers per-forming only 20 requests per second, reboot, service restarts and other things
68
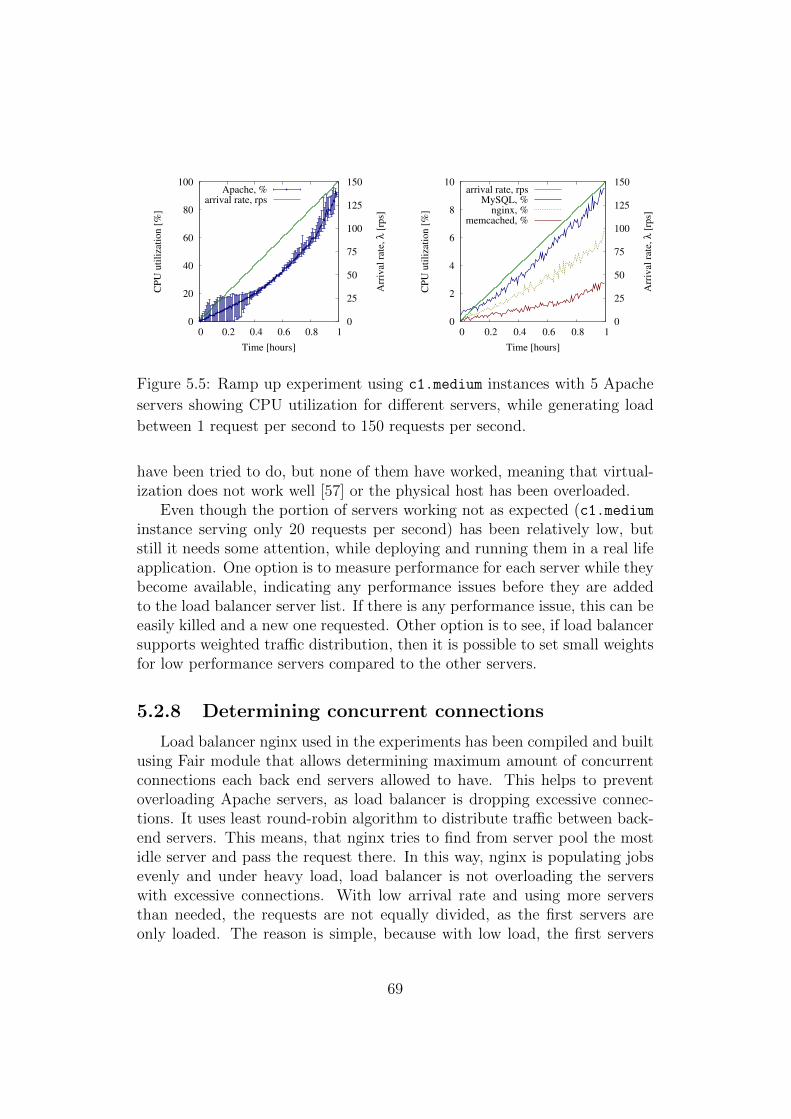
0
20
40
60
80
100
0 0.2 0.4 0.6 0.8 1 0
25
50
75
100
125
150
CP
U u
tili
zati
on
[%
]
Arr
ival
rat
e, λ
[rp
s]
Time [hours]
Apache, %arrival rate, rps
0
2
4
6
8
10
0 0.2 0.4 0.6 0.8 1 0
25
50
75
100
125
150
CP
U u
tili
zati
on
[%
]
Arr
ival
rat
e, λ
[rp
s]
Time [hours]
arrival rate, rpsMySQL, %
nginx, %memcached, %
Figure 5.5: Ramp up experiment using c1.medium instances with 5 Apache
servers showing CPU utilization for different servers, while generating load
between 1 request per second to 150 requests per second.
have been tried to do, but none of them have worked, meaning that virtual-ization does not work well [57] or the physical host has been overloaded.
Even though the portion of servers working not as expected (c1.mediuminstance serving only 20 requests per second) has been relatively low, butstill it needs some attention, while deploying and running them in a real lifeapplication. One option is to measure performance for each server while theybecome available, indicating any performance issues before they are addedto the load balancer server list. If there is any performance issue, this can beeasily killed and a new one requested. Other option is to see, if load balancersupports weighted traffic distribution, then it is possible to set small weightsfor low performance servers compared to the other servers.
5.2.8 Determining concurrent connections
Load balancer nginx used in the experiments has been compiled and builtusing Fair module that allows determining maximum amount of concurrentconnections each back end servers allowed to have. This helps to preventoverloading Apache servers, as load balancer is dropping excessive connec-tions. It uses least round-robin algorithm to distribute traffic between back-end servers. This means, that nginx tries to find from server pool the mostidle server and pass the request there. In this way, nginx is populating jobsevenly and under heavy load, load balancer is not overloading the serverswith excessive connections. With low arrival rate and using more serversthan needed, the requests are not equally divided, as the first servers areonly loaded. The reason is simple, because with low load, the first servers
69

are capable of serving the request faster than they enter into the systemmaking them again for nginx as a idle server, where next request will besent.
Determining difference between default round-robin and least round-
robin
To see difference between default and least round-robin distribution model,a small experiment with 5 back-end servers has been conducted to have pic-ture, how requests are distributed with varying traffic for one hour, usingramp up test. Ramp up test gives large variation in the traffic, that helps toexplain, what happens when the load is small, what happens if the servers aremoderately loaded and what happens under the high load. Highest arrivalrate is selected by the maximum throughput the servers should be capableof serving, using 5 × 30 = 150 requests per second, as this should be themaximum possible throughput in perfect situation.
55
60
65
70
75
80
85
90
95
100
125 130 135 140 145 150
CP
U u
tili
zati
on
[%
]
Arrival rate, λ [rps]
Max. 6 connMax. 10 conn
unlimited conn
0
5
10
15
20
25
125 130 135 140 145 150
Lo
ad (
1 m
in)
Arrival rate, λ [rps]
Max. 6 connMax. 10 conn
unlimited conn
Figure 5.6: Ramp up experiment showing difference between two Fair config-
uration (using 6 or 10 concurrent connections per Apache server) and without
Fair using c1.medium instances with 5 Apache servers. Left side graph shows
CPU usage for Apache servers and right side shows 1 minute load.
Figure 5.6 shows the difference between using Fair module for nginx withdifferent configurations and also without Fair activated on the nginx side.While reducing concurrent connections to 6, the experiment was only able tostress the back-end Apache servers to use 75% of CPU cycle, also the 1 minuteload stayed low and reasonable, indicating that there were no excessive jobswaiting for the execution. While not using Fair module, the system gets easilyoversaturated and excessive jobs will enter into the system. There is a largevariation for different Apache servers in terms of CPU usage and 1 minute
70

load, showing that the requests are not evenly distributed, congesting someof the servers, but the others are still able to serve the content, but the trafficis routed in wrong way and therefore decreasing the potential throughput.With Fair, the traffic is tried to be routed to the servers, which have leastconcurrent connections, making sure that busy servers do not get excessiverequests and trying to serve by least busy servers. Using cached data, thedifference between least round-robin and default round-robin was not large.Using empty memcached, the distribution was much better with the leastround-robin algorithm.
128
256
512
1024
2048
125 130 135 140 145 150
Res
po
nse
tim
e [m
s]
Arrival rate, λ [rps]
Max. 6 connMax. 10 conn
unlimited conn
23
24
25
26
27
28
29
30
31
125 130 135 140 145 150
Ap
ach
e ar
riv
al r
ate,
λ [
rps]
Arrival rate, λ [rps]
Max. 6 connMax. 10 conn
unlimited conn
Figure 5.7: Ramp up experiment showing difference between two Fair con-
figurations (using 6 or 10 concurrent connections per Apache server) and
without Fair using c1.medium instances with 5 Apache servers. Left side
graph shows average response times for requests and right side shows how
many jobs are being processed by Apache servers.
Figure 5.7 shows difference in response times and how the requests havebeen served between different Apache servers. At the higher loads, usingdefault round-robin and not dropping the excessive connections, some ofthe servers have to serve only 24 requests per second, while others haveto serve over 30 requests per second pushing some of the servers to thelimits. It expresses also in the response times, seeing at least 2 secondsaverage response time (for servers and clients, socket timeout was limited to10 seconds, actually the timeout is much higher in real systems).
It is logical to see that when using fewer connection, the response timeis also smaller as the load balancer is not saturating the service. Using 6concurrent connections, the average response time stayed around 160 ms.Increasing concurrent connections to 10, it was 245 ms, one and a half timeslarger. It is not possible to say, that 6 concurrent connections is the bestoption, as it depends on the configuration and also in the management de-
71

cisions. At the peak traffic, 150 requests per second, back-end servers wereable to serve 147 requests per second using 10 concurrent connections for eachback-end server, while with 6, the throughput was 139 requests per second.Losing 8 requests per second, improves response time 85 ms.
125
130
135
140
145
150
125 130 135 140 145 150
Th
rou
gh
pu
t, µ
[rp
s]
Arrival rate, λ [rps]
Max. 6 connMax. 10 conn
unlimited conn
Figure 5.8: Ramp up experiment showing difference between two Fair con-
figurations (using 6 or 10 concurrent connections per Apache server) and
without Fair using c1.medium instances with 5 Apache servers. This shows
amount of successful requests going through the system.
Experiments
Several experiments were conducted to see how concurrent connectionscan affect overall system performance by measuring the overall response time,CPU utilization and traffic lost. From the experiment it looks, that 10 con-current connections for c1.medium (that is capable of serving 30 requests persecond) is the limit where the system is already saturated. Increasing thisnumber will increase response time drastically and affect service badly.
The results showed that the perfect configuration would have to decreasethe concurrent connections to 6 as the system is more stable and the averageresponse time does not vary so much. Using fewer connections the servicemaximum throughput decreases, as fewer jobs are allowed into the system.Using only 2 concurrent connections per server and 5 Apache servers, Apacheservers utilize on average 50% CPU, showing clearly that using small amountof concurrent connections, large number of jobs will be rejected, decreasingsignificantly the maximum throughput of service.
Figure 5.9 shows that even if the throughput stays almost the same, thejobs are executed with much less CPU utilization. What happens is thatusing larger amount of concurrent connections, extra jobs are entering in to
72

40
50
60
70
80
90
100
200 220 240 260 280 300 320 340
CP
U u
tili
zati
on [
%]
Arrival rate, λ [req/sec]
Max 16 conn.Max 14 conn.Max 10 conn. 20
22
24
26
28
30
32
34
200 220 240 260 280 300 320 340
Ser
vic
e ra
te, µ
[re
q/s
ec]
Arrival rate, λ [req/sec]
Max 16 conn.Max 14 conn.Max 10 conn.
Figure 5.9: Concurrent connections experiment using c1.medium with 10
Apache servers showing CPU utilization and servers throughput. Service
rate shows, how many requests one Apache server is capable of serving.
the system and congesting the server, while using smaller number, those extrarequests are dropped to maintain good throughput with better response timeand smaller CPU utilization.
0
2
4
6
8
10
12
14
200 220 240 260 280 300 320 340
Load
[1 m
in]
Arrival rate, λ [req/sec]
Max 16 conn.Max 14 conn.Max 10 conn.
150
200
250
300
350
400
450
200 220 240 260 280 300 320 340
Res
ponse
tim
e [m
s]
Arrival rate, λ [req/sec]
Max 16 conn.Max 14 conn.Max 10 conn.
Figure 5.10: Concurrent connections experiment using c1.medium with 10
Apache servers showing Apache servers 1 minute load and response time.
Figure 5.10 shows that when using fewer concurrent connections, it ispossible to reduce response time as fewer jobs enter into the system. Whenusing 10 concurrent connections the load balancer slightly overloads the back-end servers. The response time has increased and the serves 1 minute averageload is over 2, meaning that there are more jobs in the system than theserver is capable of handling (job queue is larger than the server capable ofprocessing them). Instance c1.medium is having two cores, meaning that oneminute load should stay below 2.
73

Observations and findings
Even though, using fewer concurrent connections seems to be the betterchoice, the latter experiments use still 10 concurrent connections. This hasbeen selected, because it allows much higher throughput and shows howservice under heavy load actually works. It is getting better with the largeramount of back-end servers (the saturation point is shifted further away,making response time faster). Using fewer concurrent connections does notwork well, when having small amount of back-end servers running as thenginx is not capable of distributing incoming request to the free sockets (theyare filled) and they are dropped. Experiments shows, that when using 5 back-end Apache servers and 6 concurrent connections, 3 requests per second perserver have been lost on average and average CPU usage is 75%, meaningthat there is some unused room for serving the requests. Selection of the rightnumber how many concurrent connections to use depends, how the servicesis going to be distributed for the end users and are the clients willing to waitmore time or lose interest quickly and quit using the service. The intentionof thesis was to run servers in optimal way, meaning that amount of requestsdropped had to be minimum and meantime, to hold load high for all theservers. With 20 Apache servers and using 10 concurrent connections, it waspossible for some cases to serve 600 requests at the peak (30 requests persecond per server) and CPU utilization was varying for Apache instancesfrom 90% to 98%.
5.3 Experiment to establish limits of the ser-
vice for current configuration
This thesis set the border to run at maximum 20 back-end Apache servers,as it is capable of handling large scale traffic and overall experiments cost isnot high. This experiment should give feedback if the MediaWiki is config-ured correctly and is capable of handling the large amount of traffic. Thiswill also show how many MySQL, memcached or other instances are neededto support traffic for 20 back-end Apache servers. This amount of traffic isgenerated by using three load generators, it also reduces CPU usage for theload generators resulting in precise measured response times as they are notaffected by excessive CPU usage. This test tries to increase utilization forother services in the MediaWiki architecture in order to establish the limitsfor other servers.
74

Instance Sending Receiving Utilization
1 nginx 313.17 319.31 79%
1 memcached 37.57 3.12 5%
1 MySQL 121.32 25.83 18%
1 Worker 3.34 102.76 13%
1 Apache 15.78 9.46 3%
Table 5.3: Showing network traffic bandwidth for different servers using
c1.medium instance, while generating load of 600 requests per second (all
the values are shown as megabits per second).
5.3.1 Deadlock triggered by MySQL
First re-runs of this experiment were failures, as the MySQL server trig-gered deadlock error. This occurred every time and the deadlock error seemsto happen when generating HTTP request to nginx load balancer at rate of400 requests per second. Following error was thrown by MediaWiki applica-tion:
1213: Deadlock found when trying to get lock;
try restarting transaction
5.3.2 Fixing deadlock
This problem took some time and struggling to get rid of it. Findingglues from various mailing lists and going through MediaWiki manual therewas an option disabling the page counter. Page counter is used to keep trackof how many visits have been done for one page for statistics purpose. Whilegenerating large amount of requests, MySQL database was not able to copewith all the update queries sended by MediaWiki application and triggereddeadlock error while trying to update values in the same time. Its imple-mentation for counting the pages has been badly implemented and shouldbe reconsidered. It should probably use memcahed for temporary count inthe case of some visits and push them later into the database. Luckily, thisoption can be easily turned off from LocalSettings.php configuration file,modifying variable $wgDisableCounter to false. This solved the problemand deadlock did not occurred anymore.
75

Instance min avg max
1 nginx 25.46% 27.3% 29.18%
1 memcached 8.54% 9.48% 11.65%
1 MySQL 54.28% 57.9% 64.32%
20 Apache 92.2% 94.06% 99.36%
Table 5.4: Showing average CPU utilization for different servers (c1.medium),
while generating load of 600 requests per second for 5 minutes.
5.3.3 Network utilization
Table 5.3 shows network usage for different server types under the highload. The values presented here are taken maximum for 30 second time spanto see the maximum network usage for each instance to give idea of thelimitations for running the service on the cloud with following configuration.Only instance, that can be congested with network traffic is nginx as it issending and receiving pages from back-end servers to clients doubling theamount of traffic. Other studies have been shown, that 800 Mbps is thelimit of traffic for single instance, meaning that nginx network is highlyutilized, but still has some room for serving 600 requests per second withouta problem. The limit for this configuration was hit with 800 requests persecond and that was expected result.
5.3.4 CPU utilization
Framework built for this thesis measured performance and statistics met-rics from the cloud during the experiments. Table 5.4 shows instance CPUutilization using 20 Apache servers, while generating 600 requests per sec-ond to see how the jobs entering into the system are divided by differentresources. Please note, that these values were collected, while using onlyone memcached and one MySQL server. Apache servers had very large CPUutilization, but still were able to serve all the 600 incoming requests (some ofthe requests were blocked by nginx, 3 rps). Some of the servers were slower,because they were using different CPU, where clock speed was slower andcache size was smaller of the CPU. The difference can be looked from thetable 5.4, where faster servers were using only 92.2% of the CPU and slowerservers were overloaded and using 99.36% of the CPU.
Figure 5.11 shows CPU usage and variation with different arrival rates,when using 20 back-end Apache servers. This experiment used ramp up test
76

with increasing load for one hour. Fair module distributed requests to onlysmall portion of the servers with low arrival rate, thus the figure showinglarger variation between Apache CPU usage between the servers for the firstpart of the experiment.
0
10
20
30
40
50
60
70
80
90
100
0 100 200 300 400 500
CP
U u
tili
zati
on
[%
]
Arrival rate, λ [rps]
Apachenginx
MySQLmemcached
Figure 5.11: Ramp up experiment with 20 c1.medium Apache servers and
generating load up to 550 requests per second, showing CPU usage for dif-
ferent servers. Nginx used Fair module to distribute the traffic (used the
least round-robin), therefore there were large CPU usage difference between
various Apache servers at the beginning of the experiment.
5.3.5 Replicating MySQL and memcached instance
In this thesis, different configuration options were looked, whether itwould be possible to decrease the response time and to increase the over-all throughput. Adding another memcached and/or MySQL instance shouldtheoretically improve the service speed, as the MediaWiki database and cacherequests should take smaller time as they are processed by more servers, re-sulting in lower response times. When adding a new server, it reduced thejobs in one system by half and, therefore, meaning that each job can be servedfaster and probably reducing response time. Memcached CPU utilization fordifferent experiments was small, when nginx was getting 600 requests persecond traffic, it was mostly under 10% and adding a new memcached in-stance did not really decreased response time as the amount of the jobs wasalready relatively low in the memcached.
On the other hand, MySQL had quite a big CPU utilization, stayingaround 60%. Adding replicated MySQL server, it was possible to reduceMySQL CPU utilization to 20% for both MySQL instances. Even toughMySQL load was significantly decreased, the response time dropped only
77
25 ms (from 492 milliseconds to 467 milliseconds, note that the Apacheswere already little bit saturated, as the average response time was relativelylarge). Because the change in response time was small, this would indicatethat the Apache servers were not really waiting behind MySQL database normemcached server to serve the content and were more CPU bound by itsprocessing speed, how fast they could parse the PHP file and rendered thepage.
5.3.6 Finding out network bandwidth upper limit
Previous experiments have shown, that 600 requests per second with 20servers is not a problem to be served. This rate was possible by tuning someparameters in MediaWiki application configuration and changing some vari-ables for the operating system to allow more file descriptors to be opened.With default configuration (out of the box), the limits were hit quickly, as thefirst problem was with MySQL database, as it was becoming oversaturatedwith update requests. Other problem was that memcached hit ratio was lowand pages were not stored in the list. Tuning and changing parameters fromvarious places, the maximum throughput for one server in Amazon EC2 wasachieved. Network usage demonstrated that nginx had already very largenetwork utilization, meaning that when adding new Apache servers and in-creasing the load, it was possible to hit the limit. Next experiment was rampup test, generating load from 600 requests per second to 900 requests persecond for one hour to see the limits of other services or the nginx instance.10 extra back-end servers were added, ending up with 30 Apache servers,to make sure, that the connections were not dropped because Apache wasoverloaded.
When generating 700 requests per second, experiment showed, that MySQLwas largely overloaded (while using 1 MySQL instance) and jobs in the sys-tem were taking larger amount of time to be processed. As the jobs werestaying longer in the system, nginx quickly ran out of 10 concurrent con-nection limit for each server, as the Apaches were not able to serve thecontent in reasonable time. Looking CPU statistics gathered from the back-end servers showed, that Apache was only moderately utilized, using only50% of the CPU, this can mean that the Apache servers were waiting behindother services. Even adding new Apache servers did not help to solve thisproblem, as the CPU usage was still low and nginx was dropping incomingrequests. MySQL was the bottleneck, as the Apache servers had to waitbehind database queries. MySQL was using 95% of CPU and 1 minute loadwas over 10, while generating 700 requests per second.
Network bandwidth limit was still not reached for nginx. To improve the
78

service for much higher arrival rate, there is need to upgrade MySQL serverwith larger instance or replicate the server, so the read operations are dividedby the two database servers. Looking results of the experiments showed,that nginx and memcached servers CPU usage was still low, indicating thatthey were not CPU bound. Using command iftop (tool to see networktransmission speed) while the generated load was around 700 requests persecond, it was showing as a peak network bandwidth (incoming and outgoingrequests) 763Mbit/second. This is close to the maximum value given forc1.medium instance 800Mbit/second, meaning that nginx was already closeto hit the limit.
Next experiment was trying to push the limits and used 2 MySQL serversto reduce query time in the MySQL database as the CPU usage was reducedand the servers had to cope with incoming requests, in same time reduc-ing Apache response times. Experiment showed that the bandwidth upperlimit is between 700 and 800 requests per second, depending which requestswere sent and how much traffic other Amazon EC2 customers instances wereusing. While hitting the bandwidth limit, Apache average CPU (using 30servers) usage was around 64%, for both MySQL server it was around 30%,nginx was using 57% of the CPU and memcached 13%. Increasing amountof concurrent connections did not improve service throughput, as it seemedlike the connections were left opened and nginx lacked the network capacityto pass the requests and responses. At peak the traffic rate was at least792Mbit/second traffic (combined incoming and outgoing traffic) for the ng-inx instance and looking other parameters (CPU usage was normal for allthe servers), it could be concluded that nginx with c1.medium was not ableto go over 700 requests per second. If there is need to serve more requests,additional load balancer or server with larger bandwidth to cope with thetraffic is needed. With extra nginx it is possible to use DNS entries to dis-tribute the load between different nginx servers or use Amazon Elastic Cloudto distribute the traffic between those two instances (look figure 5.12 for oneof the possible solutions).
5.4 Validating difference between different avail-
ability zones in the same region
Currently region us-east-1 gives 6 different availability zones to run theinstances. With in the same availability zone, the network latency shouldbe minimal. Next experiment is to identify problems that might happen,when servers are scattered in different availability zones. One might think,
79

Figure 5.12: How to implement two nginx load balancers to increase re-
dundancy and fault tolerance, and in the same time increasing maximum
throughput of the service. For MySQL, there should be master-slave config-
uration, where updates and saves are done to the master and slave is used
for reading operations.
that the response time increases as the network latency affects each requestmade out of the availability zone. This can affect requests to memcachedand MySQL servers, as the MediaWiki is doing lots of queries to cache anddatabase server, meaning each request will increase delay in the responsetime and can affect throughput of the server.
Table 5.5 shows average response times for 10 ping requests to differentavailability zones. Zone us-east-1c seems to have slowest connection whileconnecting to us-east-1b and us-east-1e. It would be advised not touse these combinations of zones, especially when deploying memcached andMySQL servers into the different zones from Apache server. This definitelyincreases latency of the response time.
Running Apache server in us-east-1b and all the other servers in us-east-1c
zone, Apache was able to serve 25 requests per second as a maximum, overthat, the average response time was going over 1 second and started losing
80

zones east-1b east-1c east-1d east-1e
east-1b 0.322 ms 1.678 ms 0.967 ms 0.671 ms
east-1c 1.630 ms 0.332 ms 0.941 ms 1.654 ms
east-1d 0.886 ms 0.978 ms 0.327 ms 0.802 ms
east-1e 0.673 ms 1.928 ms 0.814 ms 0.321 ms
Table 5.5: Pivot table showing average response times for different availabil-
ity zones for ping command in us-east region. Availability zone us-east-1a
was not accessible when this thesis was written and, therefore, left out from
the table.
of jobs. It is clear, that running servers in different zones, it will increase theresponse time as requesting content from memcached and MySQL will takemore time. Running service time experiment, where MySQL and memcachedwere in the other availability zone it was showing 125 ms as an average forc1.medium instance compared to running all the services in the same zone,the average response time was 70 ms, indicating that multiple requests takemore time to be processed through network channels. For this experimentping command between MySQL and Apache server was resulting on average1.7 ms latency.
81

5.5 Conclusion of the configuration optimiza-
tion
First experiment demonstrated very bad results in terms of performanceand receiving large response times, thus request per second was relativelylowwe than expected. Various improvements and configuration tuning havebeen done to improve the performance and throughput of the services. Pro-cess to optimize the configuration has been long and slow, as there is notknow-how for setting up such system in the cloud environment.
There are many variables that can affect the service performance. Chang-ing smaller instances m1.small with faster instance c1.medium helped signif-icantly to increase the throughput. Tuning parameters of Apache and PHPfor Amazon EC2 m1.small instance did not really improve the service speedand the servers were easily crashing under heavy load.
Tuning of different services (MySQL, MediaWiki, Apache, PHP, nginx)eventually paid off. For example, c1.medium without any tuning and notusing memcached was only capable of serving 8 requests per second at fullsteam. Adding additional services and changing configuration files, it waspossible to raise the maximum throughput to 28 requests per second. Laterexperiments showed, that depending which CPU was assigned to the in-stance, the maximum throughput varies between 26 to 34 requests per sec-ond. Linux TCP parameters and open file descriptors have been changed toallow more connection and kill connection staying too long in the idle state.
5.5.1 MediaWiki configuration and tuning
MediaWiki gives system administrator a lot of different options to tuneand configure the application. It gives great variety of choices for caching: (i)memcached, (ii) store in MySQL and (iii) store in the file system. Enablingmemcached improved the speed of service significantly. Caching will storealready rendered page, making retrieving the same page much faster thanfor the first request. For small MediaWiki configurations (containing oneserver), it was advised to use file system caching as it was the easiest to setup. Memcached is the best solution for large MediaWiki installations, wherethere are tens to hundreds servers actively requesting cached informationfrom centralized location. Value retrieval from the memcached is fast as allthe content is stored in the physical memory and is limited to the networkspeed.
Using default MySQL configuration, deadlock was triggered with theheavy load when trying to get lock for update query by MySQL system
82

making any further queries impossible, unless the services or transactionswere restarted. It was caused by page counter, that had statistical purposeto log how many view to the page were made. While generating at least400 requests per second, some of the requests might have been for the sameentry or there were too many updates, that MySQL was not able to keeptrack with, resulting in the blocked content. This option can be turned offrom the configuration file setting variable $wgDisableCounter to the true,disabling the page counter updates.
Another problem that occurred during essential experiments was that thecache hit ratio was staying under 30%, meaning that requesting same pageshad to be processed again by PHP to generate the page, because they werenot stored in the cache. Cause of this problem was that memcached hadlimits for storing key-value pairs in the cache, the value had to not exceedover 1 megabyte. To ensure that the content was not large to store it in thecache, the content was packed by MediaWiki to reduce the size significantly,but the problem was trigged, because variable $wgMaxMsgCacheEntrySize bydefault was small, 10 kilobytes. This means that packed content, exceeding10 kilobytes were not stored in the cache and, therefore, resulting in smallcache ratio. The problem was solved by increasing the cache entry to 750kilobytes to allow larger pages to be stored in the cached. This helped toincrease the memcached hit ratio to 97%, improving the response time.
MediaWiki has built in a way, where configuration file changes will in-validate the cache immediately and every time configuration changes havebeen done, the cache has to be filled again. In order to overcome thisproblem, administrator can overwrite value in the configuration file for field$wgCacheEpoch to number 1, this will ensure that even if making changesto the configuration file, cache is not cleared. Field $wgCacheEpoch is hav-ing a value, storing previous configuration file date. If the configurationfile date will changes, the MediaWiki application will take care of invali-dating the cache entries in the memory. This is not a proper mechanism,while adding new servers, as the configuration file has to be changed to addmemcached and MySQL server IP addresses. While doing it, the cache is in-validated, increasing average response time and increasing load for back-endservers for every time a new server is added to the server list. Parameter$wgParserCacheExpireTime defines how much time it takes to expire entryfrom the cache. To make sure that during the experiments, the cache is notgoing to be invalidated, the value is set to 25 * 3600 (seconds are used todefine the cache length), making the cache valid at least for one day and onehour.
83

5.5.2 PHP caching
PHP code can be cached using opt code, this will reduce disk reads as itholds pre-interpreted PHP code in the memory and each time a new requestis made, it will not have to interpret the code again. Also this reduces mem-ory usage of the PHP scripts. For opt code caching, XCache [25] was used,available from Ubuntu repository as a package named php5-xcache. XCacheuses validation check to ensure, that the files have not been changed, whenthey are interpreted. If there are changes in files, cache is invalidated andthe new source is interpreted to execute code with the latest version. Exper-iments showed that when XCache opt code cacher was enabled, there wereat least 3 times faster response times. Without opt code cache, one AmazonEC2 c1.medium server was able to server 8 requests per second. Figure 5.13shows the difference between both configurations. When enabling XCacheon PHP it dropped average service time from 200 ms to 70 ms. This con-figuration was already using memcached showing that not only caching withmemcached helped to improve the service time, but other services needed tobe also tuned to maximize the throughput.
5.5.3 MySQL tuning
For MySQL max connections was increased from 100 to 500 to ensureenough connections are available, when service was under heavy load. Socketwait timeout value was reduced from 28800 (it is 8 hours) to 180 seconds.8 hours is long time to have sockets in the idle state waiting for new connec-tions, eating up available resources. Another variable changed in the con-figuration was connect timeout to make sure long queries or unresponsiveserver connections were killed and released for other connections.
84

0
50
100
150
200
250
300
350
400
0 0.2 0.4 0.6 0.8 1
Res
po
nse
tim
e [m
s]
Time [hours]
without XCachewith XCache
Figure 5.13: Comparisons when running MediaWiki infrastructure with
XCache enabled and without XCache on c1.medium Amazon instance. These
are response times with 30 second resolution. Both configurations used mem-
cached with filled cached.
85

Chapter 6
Policies and Validation of
Scalability
This section describes two policies used in running large scale experimentsfor 24 hours to validate the framework. First policy uses the revenue functionto calculate the optimal amount of servers, whereas, the other policy usesAuto Scale service provided by Amazon to add and remove servers fromthe cloud. Both of the policies are limited to 20 servers as maximum togive better comparison. For comparing the policies, important parametersare monitored with 30 seconds interval for every instance running on thecloud. At the end of each experiment, CPU utilization, server hours, jobslost, average response time and revenue generated have been calculated.
6.1 Why is elasticity of the cloud important
Cloud computing allows users to add and remove servers on fly depend-ing on their current needs, making possible to regulate servers count in thecloud by the number of incoming requests. This helps service owner to savemoney in terms of running smaller number of servers at night and servingall the clients in the peak hours. This will save money, as there is no needto run the extra servers needed at the peak hours for whole time, reducingcost significantly.
Example of elasticity. Let’s consider that owner of a service has at peak600 requests per second to his homepage and have cloud configuration sameas defined in the Table 6.1. Each server is capable of serving at maximum30 requests per second, this means at the peak there should be at least 20
86

servers to serve all the incoming requests. At midnight the service is visitedat interval 100 requests per second. Roughly at average, if the traffic curve isconstantly increasing and decreasing, the service equals to 350 requests persecond for a whole day. If the provisioning is done by the incoming traffic,it will use 350
30× 24 = 280 server hours, thus having to pay 47.60$ for the
resource used for a one day. For comparison, using fixed amount of serversrunning, provisioning servers count for the peak of 600 requests per second,meaning that 600
30×24 = 480 server hours are being used for a whole day and
having to pay 81.60$ for the resources. This is 1.7× larger than using thedynamical amount of servers, thus showing that with correctly provisioningit will save money for the service provider and therefore can increase netrevenue.
This configuration can be used by PaaS or SaaS providers, who are tryingto minimize the cost to run the services, but in the same time trying to beable to serve every client using their service, maximizing the profit. PaaSand SaaS provider are charging customers based on monthly usage or howmany requests have been done, in the same time IaaS provider Amazon EC2is charging PaaS or SaaS provider by instance hours. Using dynamicallyallocated servers, running servers at minimal costs at the night hours andserving all the customers at the peak hours, it is possible to take most outof the service provided by maximizing profit.
Figure 6.1 shows three different ways how to provision servers. If thearrival rate is exceeding the throughput, it is under provisioning. If there aremore servers than needed, then it is over provisioning and paying more moneyto run the servers. Ideal case would change servers depending of the arrivalrate. Optimal allocation tries to find the best configuration to meet thesedemands. To improve optimal allocation, one needs to predict the traffic ortrend of the traffic, as traffic fluctuates over the time, it is hard to provisionservers for the next hours without knowledge, how the traffic changes. Theseexperiment does not include traffic prediction and therefore with increasingtraffic, there is a slight loss in the incoming requests, depending how large isthe increase.
6.2 Basic configuration for running the ex-
periments
For using optimal policy and for comparing revenue for different exper-iments, it is needed to describe some basic parameters. The configurationfor experiments is shown below in table 6.1. Service time for each request
87
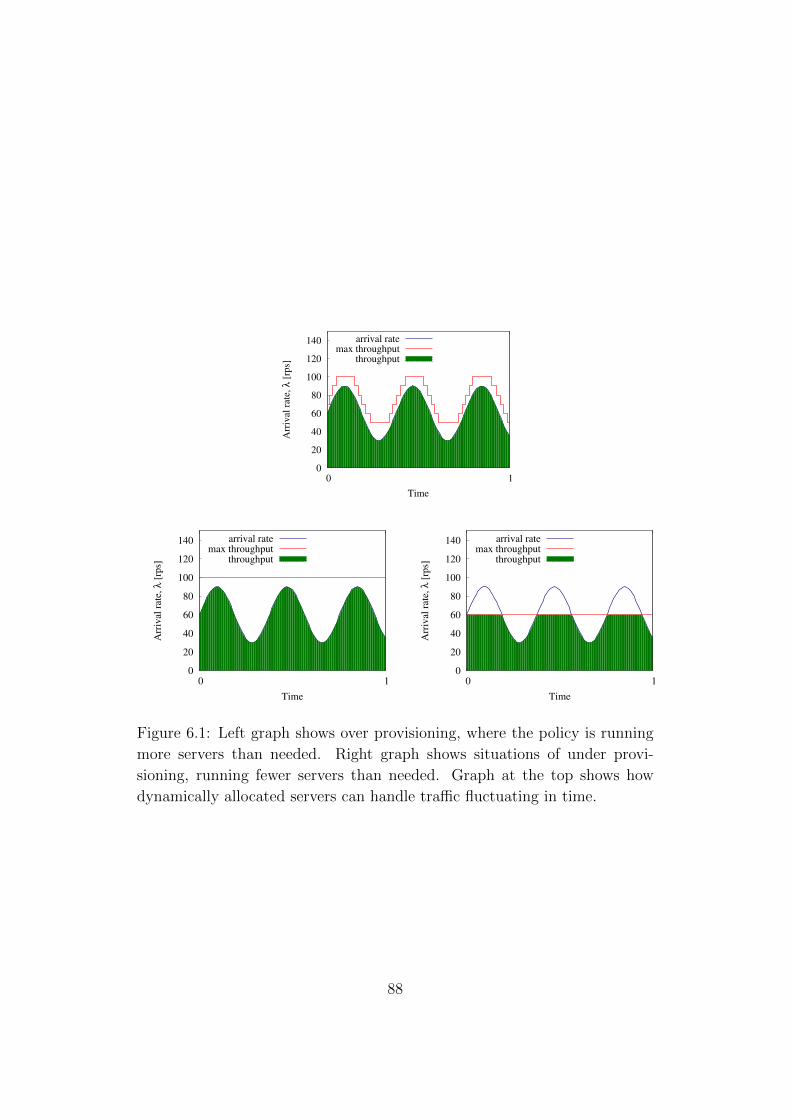
0
20
40
60
80
100
120
140
0 1
Arr
ival
rat
e, λ
[rp
s]
Time
arrival ratemax throughput
throughput
0
20
40
60
80
100
120
140
0 1
Arr
ival
rat
e, λ
[rp
s]
Time
arrival ratemax throughput
throughput
0
20
40
60
80
100
120
140
0 1
Arr
ival
rat
e, λ
[rp
s]
Time
arrival ratemax throughput
throughput
Figure 6.1: Left graph shows over provisioning, where the policy is running
more servers than needed. Right graph shows situations of under provi-
sioning, running fewer servers than needed. Graph at the top shows how
dynamically allocated servers can handle traffic fluctuating in time.
88

is set to 70 milliseconds, this is time it takes to serve 50% of the fastestrequests. Amazon EC2 cloud charges clients based on full hour for the in-stance they are using, there needs to be time limits when the servers can beadded and removed. To be safe side, for each full hour, servers are added andfor each full hour before 5 minutes, servers are removed. This will ensure,that no server, what is removed, is charged for an extra full hour, becausethe instance termination takes more time than regularly. This type of serveradding and removing cannot be managed when using proactive policies likeAmazon Auto Scale and this approach is used only for the optimal policy.
Apache server is using the multi-core configuration, two jobs can be con-currently executed in the server, meaning that we can serve 2 requests with70 milliseconds (one request can be counted as 35 milliseconds). That ex-plains, how the service rate can be 28 requests per second, as it determineshow many 35 milliseconds jobs server could serve during one second. Chargeper job is selected through multiple simulations in a manner, that with peakload, there are at least 20 servers involved.
Using at maximum 20 servers, the maximum generated load for the ex-periments was set to 600 requests per second. This gives the feedback howthe servers work under the saturation point. This amount of requests shouldensure, that load balancer is not hitting the network bandwidth limitation(800 Mbps). From previous experiments, the network overall utilization wasaround 79%. The limit of 800 Mbps has been tested and verified by HuanLiu and Sewook Wee [50]. Otherwise exceeding this limitation means, thatthere is need to use DNS load balancer or Amazon tools to distribute theload.
Parameter Description Value
µ Service rate 28.571 jobs/sec
c Charge per job 0.0017¢
d Cost per server 17¢/hour
n Running servers 1–20
Table 6.1: Parameters used for revenue based policy.
89

0
100
200
300
400
500
0 2 4 6 8 10 12 14
Arr
ival
rat
e, λ
[rp
s]
Time [day]
Figure 6.2: Two week ClarkNet traffic trace with 1 minute intervals showing
arrivals per second. The red line defines section of the trace used to generate
the load for the service. This section has been scaled up to 600 requests per
second in the experiment.
6.3 Traces used to test policies
For testing the framework and how well service scales in the cloud, ClarkNettraces were used, that were available from The Internet Traffic Archive 12 webpage. It contains two sets of ClarkNet traces with overall of two weeks oftraffic from WWW service provider. The traces were with one second preci-sion, but these were changed to 1 minute intervals. For certain time periods,there were sudden drops in arrival rate (from 200 requests per minute to 5requests per minute), the spikes were replaced with similar values from pre-vious minute. Figure 6.4 shows section of trace marked in a red color (oneday), that was used to run the experiments. The trace was scaled between35 requests to 600 requests per second for better fitting into the experimentconfiguration.
6.4 Utilization policies
Amazon Cloud gives great set of tools to manage cloud configuration onfly. One of the practical tools is auto scaling option based on variety ofparameters that user can set. Because the current configuration has bottle-necks mostly on Apache side, especially with CPU usage, it would be wise
1http://ita.ee.lbl.gov/2ftp://ita.ee.lbl.gov/traces/clarknet access log Sep4.gz
90

to monitor CPU Utilization on Apache instances and manage server countbased on average CPU usage over the certain time.
6.4.1 Auto Scale
Auto Scale allows scaling of Amazon EC2 capacity up or down automat-ically according to conditions defined [9]. This ensures, that enough serversare running during demand spikes to maintain performance and servers arereleased, when demand drops to minimize the cost. This service is availablewith Amazon CloudWatch and no additional charge is taken beyond the net-work transfer and API call fees. Auto Scaling is particularly well-suited forservices that experience variability in hourly or daily usage, and job size andtime it takes to be processed is not fixed.
Configuring and setting up Auto Scale is simple, user needs the additionaltools that are available on Amazon web page 3, have a valid Amazon accountand has configured instance, used for scaling. If each server has its owndatabase, no additional configuration is needed. It is up to user if they wantto use Load Balancing provided by Amazon or implement their own loadbalancing mechanism. Using Amazon Elastic Load Balancer, it provides thesingle IP, where the back-end servers are available and accessible, additionalfee is charged by amount of traffic it processes and how many hours it hasbeen working. For each hour, user has to pay 0.8¢to 2.5¢for each GB, pricedepends how much data has been already processed [20]. Compared withm1.micro spot instance for balancing load between back-end servers, it isstill cheaper to use Amazon Elastic Load Balancer.
It is more complicated, when user wants to implement their own loadbalancing or use some other program for load balancing, but still use AmazonAuto Scale to scale the servers in the autoscale group. It needs to track, whennew instances are started or already running instances have been terminated.One option is to use Amazon command line or API tools to retrieve list ofactive servers using command ec2-describe-instances and keep track of whichservers have been terminated and which have been added. The other optionis to build a script on the Auto Scale instance that sends the heart beatto load balancer at certain intervals. Load balancer has to listen incomingpackets and if it is coming from a new IP, it means that a new instance hasbeen started and if it does not receive the heart beat from already knowninstance for certain time period, it can be removed from list as the server isprobably removed by Auto Scale.
In order to replicate benchmarks and compare Amazon Auto Scale with
3http://aws.amazon.com/developertools/2535
91

optimal policy, nginx was used as the load balancer that had 10 concurrentconnections set to each back-end servers to avoid overloading the system.Going through Amazon manuals, there was no option to change maximumamount of concurrent connections with the back-end servers, while usingAmazon Elastic Load Balancer. Script for keeping eye on the cloud wasdeployed on the nginx instance. Script was responsible of keeping track ofthe active back-end servers allocated by Amazon Auto Scale in the scalinggroup and knows IP addresses for load balancer (nginx), cache (memcached)and database (MySQL). This allowed easier configuration, when the new in-stances were added by the Auto Scale algorithm into the cloud. The programmain loop queried running instances from the cloud, configured the new in-stances MediaWiki configuration with correct memcached and MySQL IP,and made modifications in nginx server list, adding the new servers. In thesame manner, terminated servers were removed by the program from thenginx server list and the service was restarted.
Figure 6.3: Showing Amazon Auto Scale experiment configuration in the
cloud. Servers were kept in the same availability zone to reduce the latency
of requests. Autoscaling group has been created, where Auto Scale algorithm
can replicate servers when the demand increases and terminate servers from
the group, while the demand decreases.
Figure 6.3 shows configuration in the Amazon cloud. Auto scale groupwas created with Amazon tools helping for Amazon to keep track of servers,which were added, when the demand increased. In that way, Amazon knows,which servers can be removed, if the demand decreases, as it takes from theautoscale server pool existing server and terminates it. Auto Scale config-uration requires, which instance (instance ID) has to be run and in whichavailability zone they has to be deployed. Auto Scale was configured with
92

following parameters: 1 server at minimum, 20 servers at maximum, up-per CPU utilization threshold 70%, lower CPU utilization threshold 60%,the breach time 15 minutes, upper breach increase as 1 and lower breachdecrease as 1. CPU utilization is taken based on average among all of the in-stances running in the autoscale group. Breach time defines how much timecertain threshold has to be in order to add or remove servers. For currentexperiment configuration, when average CPU utilization stays over 70% for15 minutes, it starts adding servers one by one and if it drops below 60%, itremoves servers in the same way as it adds.
The scaled traces from ClarkNet were starting with over 100 requestsper second, meaning that 1 back-end instance is not capable of serving therequest. As the arrival rate for the first hour was much larger than for thelast hour, it was not possible to set minimum amount of servers higher, asit might affect the results. Amazon Auto Scale has to be warmed up withconstant arrival rate of 100 requests per second in order to add necessaryamount of servers. If this was achieved, the experiment was started. Theresults are shown on the figure 6.4.
Auto Scale removing servers. During the experiment, Auto Scale al-gorithm removed instance from the running server pool that was not closestto the full hour, sometimes removing instances that was 30 minutes awayfrom the hour. Considering that Amazon charges for full hour, this is goodfor increasing their profit as many users use this service and they are notable to use the server provided by auto scale in full extent.
6.4.2 Auto Scale results
Experiment using Auto Scale was using large CPU utilization upperbound, meaning that new servers were added too late, thus losing the traffic.Characteristics of this approach are that it will try to increase rapidly moreserver, when the certain threshold has been reached. Even if one server hasbeen already added and the load is still high, it tries to add a new server.There is an option called cool-down when using command as-update-auto-scaling-group [12] that will freeze Auto Scale for the certain time periodwhen it has made a new decision to avoid excessive adding or removal ofservers. Parameter cool-down was set to 2 minutes as it would help to gainquickly more servers, when the load increases more than the system capabil-ities available for serving the load. Probably a small cool down time wouldbe bad, when the traffic is fluctuating more, as it might remove and addrapidly servers, making cost of the servers much higher, as they are removedtoo quickly from the cloud and are not used to full extent and the partial
93

20
40
60
80
100
0 5 10 15 20
CP
U u
tili
zati
on
[%
]
80
100
120
140
160
180
200
220
240
0 5 10 15 20
Res
po
nse
tim
e
Time [hours]
4
6
8
10
12
14
16
18
0 5 10 15 20
Ser
ver
s ru
nn
ing
0
100
200
300
400
500
600
0 5 10 15 20
Arr
ival
rat
e [r
eq/s
ec]
Time [hours]
Arrival rate λThroughput µ
Traffic lost
Figure 6.4: Running servers compared to arrival rate λ, CPU usage and
response times over 24 hours using Amazon Auto Scale policy.
94

hours are charged as full hours.The second part of the experiment gave better results as the traffic was
decreasing and all the requests went successfully through. Auto Scale diddescent job determining when to add or remove servers. There has someroom to improve the algorithm by changing some of parameters, thus itwould cope also with rising trend (one option would to decrease upper CPUthreshold to 60 %). One side-effect of the Auto Scale is that it tries to removesometimes servers to early not letting them to run proper amount of timereasonable for the Amazon Cloud service user.
6.5 Revenue based policies
Revenue based policies are calculating amount of servers depending howmuch revenue one request is generating, maximum throughput of the server,server charge for an hour and arrival rate for the next time interval. Everyprocessed request by a server generates a fixed revenue. This revenue mightcome from advertisements or from sales. It is not straightforward to setrevenue, as there is no clear linkage between how much one request canincrease overall income. Using these parameters, the revenue based policiestries to find the best trade off adding or removing servers, while maximizingthe profit. It needs to be careful when setting up parameters as all theparameters can largely affect policy decisions how many servers are needed.Setting income for each request larger, the servers are most likely to run inan idle state. Decreasing the income will decrease the amount of runningservers, which will decrease the maximum throughput, increases amount ofjobs in the system and increasing system utilization.
6.5.1 Algorithm for provisioning the servers
To use optimal policy for provisioning servers, there needs to be algorithmthat takes care of process of using policy to calculate the amount of servers,provisioning servers in the cloud and updating load balancer with the newserver list. Algorithm works as follows:
1. 5 minutes before the full hour measures arrival rate for the last hour(weighted average does not improve the net profit for policy basedalgorithms and therefore is left out). Arrival rate is taken from nginxHTTPStatusModule that is running on address localhost/server-status
2. 5 minutes before the full hour, run policy algorithm to determine theservers count using average arrival rate calculated from the previous
95

step
3. Removing servers from the cloud, if the algorithm calculated fewerservers than currently running and re-configures the load balancer
4. If algorithm calculated more servers than running, wait for 5 minutesand then request new servers from the cloud server pool
5. For each 30 seconds, check if requested servers have changed state frompending to running. If yes, configure the MediaWiki servers with cor-rect MySQL and memcached IP addresses, add new servers into theload balancer list and reload nginx
6. If all requested servers are configured and added into the load balancerserver list, halt previous step
Charge point
Allocationpoint
ttD
n- servers are released
Release completed
Figure 6.5: Removing servers should be done before full hour, because oth-
erwise there is need to pay for the extra instance hour.
Charge point
Allocationpoint
ttUn+ servers become available
n+ servers are acquired
Figure 6.6: Adding servers is done at the full hour mark to make sure that
while the servers are added and needed to be removed, there is no need to
pay for the extra instance hour.
Figures 6.5 and 6.6 show how the servers are added and removed fromthe cloud. Removing step occurs first and algorithm, calculating the amountof servers is triggered at this point. If there is no need to remove any servers,algorithm will wait until full hour, when the adding servers function is calledout. For adding servers, calculated amount of servers can be taken from the
96
previous step, as there is no need to calculate it again. Adding and removingservers in a way described by the algorithm ensures that there is no need topay for extra instance hour for the resources that cannot be use (i.e. instancehas been working for 1 hour and 1 minute and is terminated, meaning thatthe instance is charged for two hours).
6.5.2 Arrival rate for the next hour
There are several options how to feed in average arrival rate for algorithmsdetermining needed servers count for the next hour. Simplest way is totake average arrival rate for the previous measured hour and use this as aninput. The downside of this approach is that the average arrival rate canincrease or decrease for the next hour, because of the characteristics of thetraffic fluctuate over the time. To improve giving better arrival rate for thealgorithm, it is possible to use weighted average, where the last measuredunits have more weight while calculating the average, meaning that it shouldgive slight trend, whatever the arrival rate is going up or down. Becauseservers are charged based on full hours, the arrival rates should be measuredmore than once per hour to improve the accuracy of the trend. For example,if the load starts to increase at the end of the hour, probably it has to beincreased at the beginning of the next hour, making the given average arrivalrate more precise.
Experiments showed, that when using 20 servers, having 600 requests persecond at peaks and using ClarkNet traces, there was not a big differencebetween using the regular average and weighted average (calculating arrivalrate with 5 minute intervals), as the algorithms were resulting the sameamount of servers needed for the next hour.
Previous hour traffic gives a good presumption, what the traffic might befor the next hour. In the case of best scenario, it will stay at the same level.If the arrival rate increases, then amount of servers have been underprovi-sioned. It depends how optimistic the parameters are when using differentalgorithms. If letting too much room for the traffic and the arrival rate dropsfor the next hour, then the servers have been over provisioned. This meansthat there are more servers running than needed and we have to pay morefor running the service.
Second option is to predict the load for the next hour, based on the train-ing set or using previous arrival rates for each hour. Visits to the sites aremostly deterministic and can be predicted. You might say, that at the daytime, there are more visits than at the night, when everybody is sleeping. Italso depends, who are the visitors. In the site, visited from various locationsof the world, the traffic between night and day time does not differ, fluctuat-
97

ing only little. To increase the prediction, the predictor function has to takeinto account what weekday it is, since at the weekends the traffic volumetends to be smaller.
Even for both options, the decision should be taken carefully when to addor remove servers. It is rather easy to do if one takes an average hour duringa day, but it is hard to predict, when looking at much smaller time scale.Traffic fluctuates largely when looked arrival rates per second. Service ownermust ensure, that these spikes can be handled by the configuration providedand service is reachable for everyone, who tries to connect with it.
6.5.3 Optimal heuristics
Second experiment was using the optimal heuristics to determine theservers needed to run the service in the cloud. It uses several parametersto maximize the outcome, using hill climbing method. Tuning parametersfor optimal heuristics is tricky, as it can significantly change the end result.It needs to take into account, that service time used by optimal heuristicshas to be divided by number of cores, as the jobs can executed in parallel.Service time, cost of server and throughput are fixed values and the policymainly depends on how much income one request gives (or charge Saas orPaaS user pays for each request).
Formulation
Let us give a mathematical formulation for optimal heuristics. Considerarrival rate λ over time period one hour. Algorithm goal is to find the bestoptimal using hill-climbing method. It is unimodal function [56], meaningthat there is only one single maximum. This policy tries to maximize param-eter net revenue. The idea is to find the best option where enough jobs aregoing through the system, but still is capable producing maximum amountof money. It needs to find maximum for a function 6.1
rn = µ× c− n× d (6.1)
where µ is the maximum throughput for one hour for current configurationcalculated from arrival rate (using predictive arrival rate or last hour arrivalrate) using equation 6.6, c shows income per request, n is the incrementalvalue that shows how many servers there should be, d is charge for eachserver for an hour and r is the net revenue, that is tried to be maximized.These values are all presented in table 6.1. To find optimal solution, Erlang Band erlang unit is used to calculate maximum throughput for each n, while
98

knowing the arrival rate to the system. For each n, hill-climbing methodis used to find out local maximum. Server amount is increased until therevenue function starts to decrease, indicating that function has reached toits maximum.
Erlang B gives probability traffic going through the system and is usedby telephone companies to calculate, how many agents are needed to be ableto receive all the calls made by the customers. It uses service time, arrivalrate and amount of servers to show how many requests can be processed.Using Erlang B in the optimal policy calculations, it is possible to calculatemaximum theoretically throughput of the configuration, thus making possibleto find maximum of equation 6.1 (e.g. we cannot serve 60 requests persecond, while using only 1 server with maximum throughput of 28 requestsper second).
The formula provides the GoS (grade of service) which is the probabilityPb that a new request arriving will be dropped by the load balancer since,all the back-end servers will be busy [55].
Pb = B(E,m) =Em
m!∑mi=0
Ei
i!
(6.2)
E = λ× h (6.3)
Using equation 6.3, we can calculate the offered traffic rate in erlangs,using λ as an arrival rate and h as a service time (hold time). Becauseof using two core machine for the back-end servers, the service time is twotimes smaller as the server is capable of handling two requests concurrently(70ms/2cores = 35ms). Putting E from formula 6.3 to formula 6.2 andusing m as an amount of servers, we can calculate the blocking probability.Value Pb will be used, when calculating revenue for formula 6.1, calculatingλ from equation 6.6, thus getting the maximum throughput.
For finding optimal configuration, hill-climbing method is used in equa-tions 6.1 and 6.6 to find best local maximum. This approach iterates throughthe list of possible server configurations from 1 to ∞ (see equation 6.4) andstops only when finding that the next iteration has got a smaller value thancurrent iteration, meaning that the current iteration has got a maximumvalue. This function will return n, that represents amount of servers neededto run the service.
rbest = max(r1, r2, ..., r∞) (6.4)
Running several experiments and tests, Erlang B calculated throughputis not the same as the throughput achieved by the real environment. Erlang
99

B assumes that for each agent (server) is capable of handling only one call(request). This does not match with computer networks, where computeris capable of handling multiple requests in the same time. Blocking valuecalculated by Erlang B is much higher than in the real situation. Loadbalancer uses as maximum 10 concurrent connections for each back-end serverand excessive requests are dropped. This is M/M/n/n queue model and doesnot fit well with Erlang B.
Second approach is to use server count and traffic rate in erlangs calcu-lated by equation 6.3, this will give system utilization that is similar to theLinux 1 minute load. Equation 6.5 shows the way to calculate the block-ing probability, that is similar to the results of experiment. If the value isunder 0, it means no job is blocked and the value is assigned to 0, not toallow negative values. Using calculated blocking probability and lambda (seeequation 6.6), equation gives how many requests will go through the system.
Pb = 1− scountE
= 1− scountλ× h
, ifPb < 0 : Pb = 0 (6.5)
µ = (1− Pb)× λ (6.6)
In equation 6.5 the parameter scount is amount of servers and other param-eters are the same as previously described. Using modified version of erlangformula it shows the similar results as the experiments does, thus making thecalculation of revenue more precise. Figure 6.7 shows how the optimal max-imum is calculated with revenue function. The revenue is increasing in thefirst section of the graph, because more jobs are going through the system andeach job earns more money than there is a necessity to pay for engagementof additional servers. When the maximum is reached, adding more serversdo not improve throughput and the revenue starts to decrease, as we have topay more for the extra servers, but the income does not increase. Using forarrival rate 600 requests per second and other values are the same as shownin the table 6.1, the optimal maximum is achieved with 21 servers, meaningthat at the peak, there needs to be at least 21 servers to accommodate thetraffic.
Hill-climbing method. It is an iterative algorithm that starts with anarbitrary solution to a problem, then attempts to find a better solution byincrementally changing a single element of the solution. If the change pro-duces a better solution, an incremental change is made to the new solution,repeating until no further improvements can be found [21].
100

0
5
10
15
20
25
30
35
40
0 5 10 15 20 25 30 35 40
Rev
enu
e ea
rned
[$
]
Num. of servers
λ = 300 rpsλ = 600 rps
Figure 6.7: Revenue function values, when trying to find the optimal max-
imum for 300 requests per second and 600 requests per second using erlang
units to calculate the throughput.
6.5.4 Optimal heuristics results
For optimal heuristics, service time was set as 35 ms (using 2 core ma-chines, meaning 70 ms service time has to be divided by 2, as it is possibleto concurrently process two requests) and Fair module used 10 concurrentconnections for each back-end server. Figure 6.8 shows, that while load isincreasing, the servers are added later and maximum throughput is smallerthan actual arrival rate, thus losing jobs. There should be at least 1 extraserver in spare, when calculating amount of servers needed to run the service.The other half of the experiment was with the decreasing traffic closing tothe evening and fewer clients were visiting the page. Removing the serversworked well and failure count was minimal.
To improve the optimal policy, it needs to have a trend function that candetermine, when the traffic increases and if that happens, an extra servershould be added to the already provisioned servers to accommodate the in-creasing arrival rate.
This configuration seemed to work better than Amazon Auto Scale func-tion, resulting in a fewer jobs lost. This is caused by, that Auto Scale useslarge CPU utilization threshold when trying to add the new servers or thebreach time was set large. Decreasing one of these values should improve theoutcome.
101
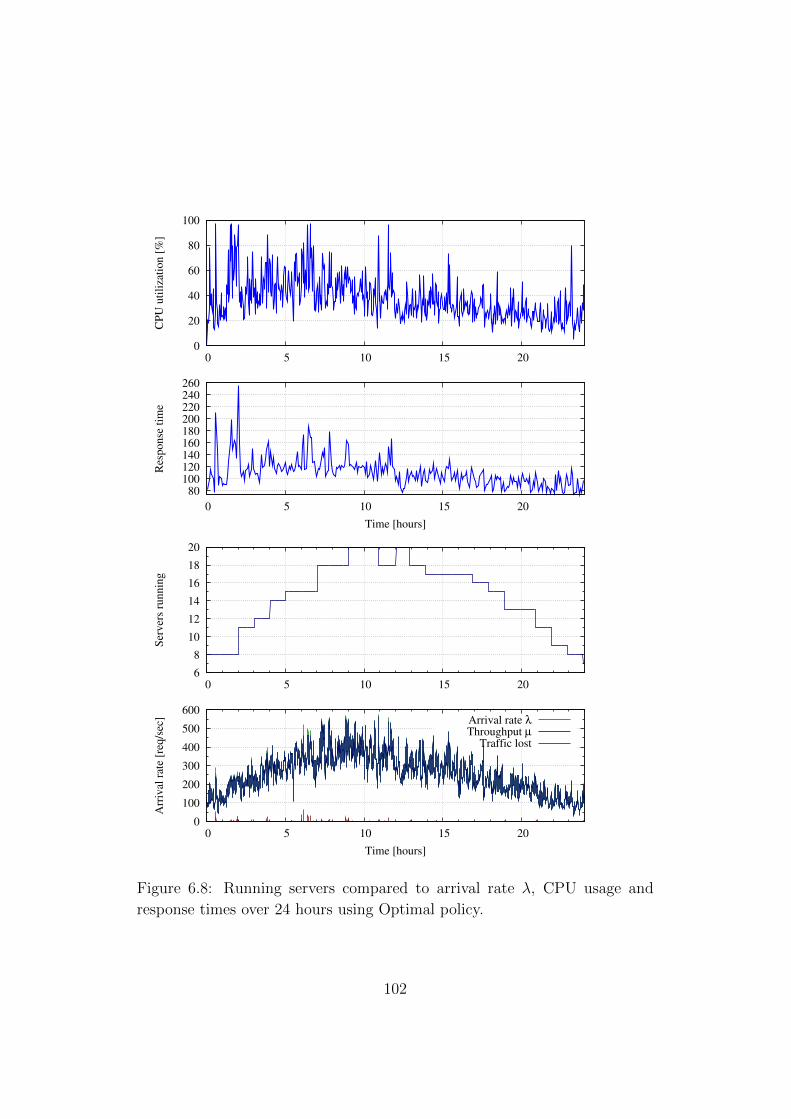
0
20
40
60
80
100
0 5 10 15 20
CP
U u
tili
zati
on
[%
]
80 100 120 140 160 180 200 220 240 260
0 5 10 15 20
Res
po
nse
tim
e
Time [hours]
6
8
10
12
14
16
18
20
0 5 10 15 20
Ser
ver
s ru
nn
ing
0
100
200
300
400
500
600
0 5 10 15 20
Arr
ival
rat
e [r
eq/s
ec]
Time [hours]
Arrival rate λThroughput µ
Traffic lost
Figure 6.8: Running servers compared to arrival rate λ, CPU usage and
response times over 24 hours using Optimal policy.
102

6.6 Summary and results
Each policy has its own pros and cons and using one of those policiesmainly depends on the system, and what the decisions management is takingin terms of what they are willing to pay. Amazon Auto Scale is mostlyenough when determining the needed servers count for the system. Currentconfiguration will work fine for traffics, where the load is steadily increasingfor each hour and does not have large spikes. Amazon Auto Scale has varietyof parameters, that can be tuned, but this mainly relies on the fact, whichtraffic the service is getting. If there are more spikes and traffic is fluctuatinglargely, lower CPU threshold for adding the servers should be used. It ispossible to define, how many servers are going to be added or removed whencertain threshold is exceeded. However, the system owner has to be carefulwhen defining this, as adding too many servers may result in lower CPUusage, meaning that those extra servers are removed in no time. AmazonAuto Scale policy will work fine for different traffics, that varies in responsetime as the primary unit for taking the decisions for server provisioning istaken from average CPU and therefore making it an easy service that canbe set up with small time and little effort, as mostly there is no need to doadditional experiments to identify service time.
Revenue based policies are much more complex as system owner mustbe aware of the servers capabilities and how they are running in the cloud.This is why some preliminary experiments with the servers have to be done,to know the limits for each server. Even though the service time is mostlyfixed value if the response time does not vary much and server hour basedcharge is fixed, there is need to calculate the correct charge (income) valuefor each request made. There is a trial and error process that involves manysimulation and running experiments to see the best configuration. Comparedwith Amazon Auto Scale, revenue based policies are harder to set up, asit involves mathematical complexity and other factors like response timevariation that can affect the results.
103

measurement Auto Scale Optimal policy always on
min. response time 56 ms 55 ms 53 ms
avg. response time 144.6 ms 116.0 ms 101.8 ms
99% response time 409 ms 321 ms 254 ms
avg. CPU usage 44.62% 37.22% 23.84%
Instance hours 312 351 480
Cost of the servers 53.04$ 59.67$ 81.60$
Amount of jobs lost 343763 32288 2148
Revenue 318.52$ 317.18$ 295.76$
Table 6.2: Summary table of Auto Scale and optimal policy algorithms.
Experiment conducted lasted 24 hours and the same traffic was used resulting
on 22.2 millions of requests. Cost of the servers and revenue are calculated
only using Apache servers and one instance hour for c1.medium charge is
0.17$.
104

Chapter 7
Conclusions
This master thesis studies possibilities to develop infrastructure to runMediaWiki application on the cloud, that is capable of scaling MediaWikireplica instances vertically, depending on arrival rate. This infrastructurewill support measuring performance of the cloud, making it possible to findpossible bottlenecks from the service. This work includes tools how to mea-sure and monitor performance of servers in the cloud.
Amazon EC2 cloud is used to deploy the infrastructure. It allows to runvirtual images on the cloud, that are charged by instance-hours used. Ama-zon users can make their own virtual images with the required software, thatcan be easily replicated throughout the cloud. MediaWiki application wasinstalled one of those images running Ubuntu operating system. Frameworkwas built to support scaling the cloud and configuring servers for differentexperiments.
During development phase, different experiments were performed to clar-ify the best possible solution to run service in the cloud environment, asAmazon EC2 cloud gave users great variability of servers and other services,that could be used. In the case of some servers and applications there was aneed for configuration tuning to improve performance and throughput of thesystem, as they did not work well as out-of-the-box.
This master thesis studied possibilities to scale servers in the cloud, usingAmazon own Auto Scale service, which is free of charge and optimal heuristicfor provision of needed servers. Two algorithms were used and compared,to see pros and cons and how to configure algorithms to support scaling.Amazon EC2 API tools were used to support managing the cloud. All theinstances were constantly measured and statistics gathered to get informa-tion about CPU, memory and network usage. Validating scaling propertiesand algorithms, large scale experiment for 1 day was conducted for both
105

of algorithms where at least 22 million requests were generated. Differentexperiments demonstrated that when calculating the cost function to holdserver up in the cloud would pay less money if using the dynamical allocationof servers than having the fixed number of servers running.
106

Chapter 8
Future Work
This section describes some important topics not covered within this the-sis. This topics have to be considered as the crucial ones and they should bestudied in future in order to improve the work flow of experiments or policies.
8.1 Benchmark Tool Updates
Wikijector, which came with Wikibench, was taken as an example, whilebuilding BenchMark program. BenchMark program supported the predefinedarrival rate (λ) for each time period and had URI list to make the traffic forthe front-end server. It made easier to conduct the experiments as the tracelogs provided by the Wikijector meant that the requests had to be changedto fit with the data dumped into the MySQL database or whole databasehad to be uploaded into the database. With Wikijector, it was harder to fillthe cache and remove 404 Not Found page errors from the trace files, makingit time consuming to conduct various experiments.
BenchMark had some certain fall-backs that degrades the performancefor generating new requests. It uses fixed size thread pool to hold generatedconnection. Initializing the thread and starting the thread took time. Ifsetting thread pool count too small, the available threads might run out withlarge experiments and already running threads were terminated, while stillprocessing response from the web service. Using c1.medium instance type,that had 2 cores, was only capable of generating 500 requests per second. Thesolution would be to use the non-blocking sockets for generating requeststo the server. It will allow to generate larger volume of traffic with lowernumber of load generators and reducing experiment cost. Instance runningthe load generator CPU usage was tried to hold under 50%, as larger usagemight affect response time measurement precision and this made comparing
107

different experiments harder.
8.2 Server Comparison
With cloud based configuration there are thousands of computers thathave been bought in separate times have different conditions in terms of wearand have different components. These results in inequality between differentservers requested from the cloud server pool. Experiments conducted by thisthesis did not take into account the performance of a single server. It ispossible to have some script on an instance image, that will be executed atserver boot and would measure the performance of the server, e.g. measureCPU speed, how much time it takes to calculate complex formulas, also speedof a virtual hard disk, measure of time and throughput of writing and readingfrom it. It is possible to build metrics from previously mentioned parametersand this value can be used to compare with the other servers, and the loadbalancer could use this as a measurement when putting servers weight whilereconfiguring server list in the configuration file. This will reduce load onservers that are slower and increase load on servers that are faster, but stillmaintain a stable performance and not overloading the system.
There were some cases, where one server was working at 12
or even 13
ofspeed of the fastest server under heavy load, even if they were same instancetype. Using above mentioned method to compare all the servers currentlyrunning, we could eliminate the problem, but there is still a problem withpolicies, because they have to consider maximum throughput based on themeasured performance.
108

Raamistik pilvel pohinevate
veebirakenduste skaleeruvuse ja
joudluse kontrollimiseks
Magistritoo (30 EAP)
Martti Vasar
Resumee
Antud magistritoo uurib voimalusi, kuidas kasutada veebirakendust Me-diaWiki, mida kasutatakse Wikipedia rakendamiseks, ja kuidas kasutada an-tud teenust mitme serveri peal nii, et see oleks koige optimaalsem ja samaskoik veebikulastajad saaks teenusele ligi moistliku ajaga. Amazon kusib rahapilves toimivate masinate ajalise kasutamise eest, umardades pooleldi kasu-tatud tunnid taistundideks. Antud too sisaldab vahendeid kuidas mootapilves olevate serverite joudlust ning voimekust ja skaleerida antud veebirak-endust.
Amazon EC2 pilvesusteemis on voimalik kasutajatel koostada virtuaal-seid tommiseid operatsiooni susteemidest, mida saab pilves rakendada XENvirtualiseerimise keskkonnas, kui eraldiseisvat serverit. Antud virtuaalsetommise peale sai paigaldatud tooks vaja minev keskkond, et koguda and-meid serverite kasutuse kohta ja voimaldada platvormi, mis lubab dunaamiliseltajas lisada servereid ja eemaldada neid.
Magistritoo uurib Amazon EC2 pilvesusteemi kasutusvoimalusi, millehulka kuulub Auto Scale, mis aitab skaleerida pilves kasutatavaid rakendusihorisontaalselt. Amazon pilve kasutatakse antud toos MediaWiki seadis-tamiseks ja suuremahuliste eksperimentide rakendamiseks. Vajalik on tehapalju optimiseerimisi ja seadistamisi, et suurendada teenuse labilaske voimsust.Antud too raames loodud raamistik aitab moota serverite kasutust, kogudes
109

andmeid protsessori, malu ja vorgu kasutamise kohta. See aitab leida susteemisolevaid kitsaskohti, mis voivad pohjustada susteemi olulist aeglustumist.
Antud too raames sai tehtud erinevaid teste, et selgitada valja parimvoimalik paigutus ja seadistus. Saavutatud seadistust kontrolliti hiljem 2suuremahulise eksperimentiga, mis kestis uks paev ja mille kaigus tekitati22 miljonit paringut, leidmaks kuidas raamistik voimaldab teenust pilvesskaleerida ulesse paringute arvu tousmisel ja vahendada servereid, kui paringutearv vaheneb. Uhes eksperimendis kasutati optimaalset heuristikat, et selgi-tada valja optimaalne serverite arv, mida on vaja pilves rakendada. Teineeksperimentidest kasutas Amazon Auto Scale teenust, mis kasutas serveritekeskmist protsessori kasutamist, et selgitada valja, kas pilves on vaja servereidlisada voi eemaldada. Antud eksperimendid naitavad selgelt, et kasutadesdunaamilist arvu servereid, olenevalt paringute arvust, on voimalik teenuseuleval hoidmiseks saasta raha.
110

Bibliography
[1] Scientific Computing on the Cloud (SciCloud) - Distributed SystemsGroup site;http://ds.cs.ut.ee/research/scicloud;last viewed 2. December 2011
[2] Satish Srirama, Oleg Batrashev, Eero Vainikko; SciCloud: ScientificComputing on the Cloud ; 10th IEEE/ACM International Symposium onCluster, Cloud and Grid Computing (CCGrid 2010), May 17-20, 2010,pp. 579. IEEE Computer Society.
[3] Cloud IaaS — Cloud Computing Software from Eucalyptus ;http://www.eucalyptus.com/products/eee;last viewed 2. December 2011
[4] Manual:File cache - MediaWiki ;http://www.mediawiki.org/wiki/Manual:File cache;last viewed 2. December 2011
[5] memcached - a distributed memory object caching system;http://memcached.org/;last viewed 2. December 2011
[6] October 2011 Web Server Survy ;http://news.netcraft.com/archives/2011/10/06/ october-2011-web-server-survey.html;last viewed 2. December 2011
[7] HTTPUpstreamModule;http://wiki.nginx.org/HttpUpstreamModule#upstream;last viewed 2. December 2011
[8] Dipankar Sarkar; Nginx 1 Web Server Implementation Cookbook ; PACKTpublishing, 1st Edition, 2011, Pages: 192, ISBN 978-1-849514-96-5.
111

[9] Auto Scaling ;http://aws.amazon.com/autoscaling/;last viewed 19. January 2012
[10] Amazon EC2 Instance Types ;http://aws.amazon.com/ec2/instance-types/;last viewed 26. January 2012
[11] Percona - Documentation - The tcprstat User’s Manual ;http://www.percona.com/docs/wiki/tcprstat:start;last viewed 26. January 2012
[12] Auto Scaling Command Line Tool : Developer Tools : Amazon WebServices ;http://aws.amazon.com/developertools/2535;last viewed 31. January 2012
[13] Twenty-One Experts Define Cloud Computing ;http://cloudcomputing.sys-con.com/node/612375/print;last viewed 09. February 2012
[14] Foster, I.; Yong Zhao; Raicu, I.; Lu, S.; Cloud Computing and GridComputing 360-Degree Compared ; Grid Computing Environments Work-shop, 2008. GCE ’08, Pages: 1-10, 12-16 Nov. 2008
[15] LAMP - (software bundle) - Wikipedia, the free encyclopedia;http://en.wikipedia.org/wiki/LAMP (software bundle);last viewed 09. February 2012
[16] PHP: Description of core php.ini directives - Manual ;http://www.php.net/manual/en/ini.core.php#ini.memory-limit;last viewed 09. February 2012
[17] Linux Increase The Maximum Number Of Open Files / File Descriptors(FD);http://www.cyberciti.biz/faq/linux-increase-the-maximum-number-of-open-files/;last viewed 09. February 2012
[18] ab - Apache HTTP server benchmarking tool - Apache HTTP server ;http://httpd.apache.org/docs/2.0/programs/ab.html;last viewed 09. February 2012
112

[19] Amazon Elastic Compute Cloud (Amazon EC2);http://aws.amazon.com/ec2/;last viewed 02. March 2012
[20] Amazon EC2 Pricing ;http://aws.amazon.com/ec2/pricing/;last viewed 09. February 2012
[21] Hill climbing - Wikipedia, the free encyclopedia;http://en.wikipedia.org/wiki/Hill climbing;last viewed 14. February 2012
[22] The CLOUDS Lab: Flagship Projects - Gridbus and Cloudbus ;http://www.cloudbus.org/cloudsim/;last viewed 14. February 2012
[23] Rajkumar Buyya, Rajiv Ranjan, Rodrigo N. Calheiros; Modeling andSimulation of Scalable Cloud Computing Environments and the CloudSimToolkit: Challenges and Opportunities ; High Performance Computing &Simulation, 2009. HPCS ’09. International Conference on, Pages: 1-11,21-24 June 2009
[24] [mediawiki] Contents of /trunk/phase3/docs/memcached.txt ;vhttp://svn.wikimedia.org/viewvc/mediawiki/trunk/phase3/docs/memcached.txt?view=markup;last viewed 25. February 2012
[25] XCache; http://xcache.lighttpd.net/;last viewed 25. February 2012
[26] EC2StartersGuide - Community Ubuntu Documentation;https://help.ubuntu.com/community/EC2StartersGuide;last viewed 25. February 2012
[27] Repositories/CommandLine - Community Ubuntu Documentation;https://help.ubuntu.com/community/Repositories/CommandLine#Adding the Universe and Multiverse Repositories;last viewed 25. February 2012
[28] Wikimedia Technical & Operational Infrastructure - A high leveloverview of Wikimedia Operations ;http://upload.wikimedia.org/wikipedia/commons/3/33/Rob Halsell -Wikimania 2009 - Wikimedia Operations %26 Technical Overview.pdf;
last viewed 27. February 2012
113

[29] Man Page - Wikipedia, the free encyclopedia;http://en.wikipedia.org/wiki/Manpage;last viewed 27. February 2012
[30] Apt-Get ;https://help.ubuntu.com/8.04/serverguide/C/apt-get.html;last viewed 27. February 2012
[31] Interview with creator of NGINX Igor Sysoev — Web Hosting Skills ;http://www.webhostingskills.com/open source/articles/interview with creator ofnginx igor sysoev;
last viewed 28. February 2012
[32] osi 7 layer model ;http://www.escotal.com/osilayer.html;last viewed 28. February 2012
[33] RRDtool - About RRDtool ;http://oss.oetiker.ch/rrdtool/;last viewed 1. March 2012
[34] Elastic Load Balancing ;http://aws.amazon.com/elasticloadbalancing/;last viewed 2. March 2012
[35] Amazon Simple Storage Service (Amazon S3);http://aws.amazon.com/s3/;last viewed 9. March 2012
[36] Amazon EC2 Spot Instances;http://aws.amazon.com/ec2/spot-instances/;last viewed 2. March 2012
[37] Erik-Jan van Baare; WikiBench: A distributed, Wikipedia based webapplication benchmark ; Master thesis, VU University Amsterdam, May2009.
[38] Nurmi, D., Wolski, R., Grzegorczyk, C., Obertelli, G., Soman, S., Yous-eff, L., Zagorodnov, D.; The Eucalyptus Open-source Cloud-computingSystem; Cluster Computing and the Grid, 2009. CCGRID ’09. 9thIEEE/ACM International Symposium on. 18-21 May 2009. Pages: 124 -131.
114

[39] TimingEvents - haproxy-docs - Timing events - HAProxy Documenta-tion;http://siag.nu/pen/;last viewed 16. March 2012
[40] Virtual Router Redundancy Protocol - Wikipedia, the free encyclopedia;http://en.wikipedia.org/wiki/Virtual Router Redundancy Protocol;last viewed 16. March 2012
[41] Software as a service - Wikipedia, the free encyclopedia;http://en.wikipedia.org/wiki/Software as a service;last viewed 16. March 2012
[42] Platform as a service - Wikipedia, the free encyclopedia;http://en.wikipedia.org/wiki/Platform as a service;last viewed 16. March 2012
[43] Infrastructure as a service - Wikipedia, the free encyclopedia;http://en.wikipedia.org/wiki/Infrastructure as a service;last viewed 16. March 2012
[44] Will Sobel, Shanti Subramanyam, Akara Sucharitakul, Jimmy Nguyen,Hubert Wong, Arthur Klepchukov, Sheetal Patil, Armando Fox, DavidPatterson; Cloudstone: Multi-Platform, Multi-Language Benchmark andMeasurement Tools for Web 2.0 ; 2008.
[45] Chuck McAuley; Watch Out for That Hockey Stick: The Need forNetwork Device Product Evaluations — BreakingPoint ;http://www.breakingpointsystems.com/community/blog/network-device-product-evaluations/;last viewed 22. March 2012
[46] Daniel A. Menasce; Load Testing of Web Sites ;http://cs.gmu.edu/ menasce/papers/IEEE-IC-LoadTesting-July-2002.pdf;last viewed 22. March 2012
[47] Byung Chul Tak, Bhuvan Urgaonkar, Anand Sivasubramaniam; ToMove or Not to Move: The Economics of Cloud Computing ; USENIXHotCloud’11 Conference, Portland, USA, June 14–17, 2011..
[48] What is ’steal time’ in my sysstat output? — Racker Hacker ;http://rackerhacker.com/2008/11/04/what-is-steal-time-in-my-sysstat-output/;last viewed 22. March 2012
115

[49] Nicolai Wadstrom; Why Amazon EC2 CPU Steal Time does not work(well) for Web apps — Nicolai Wadstrom;http://nicolaiwadstrom.com/blog/2012/01/03/why-amazon-ec2-steal-cpu-does-not-work-for-web-apps/;last viewed 22. March 2012
[50] Huan Liu, Sewook Wee; Web Server Farm in the Cloud: PerformanceEvaluation and Dynamic Architecture; Lecture Notes in Computer Sci-ence, 2009, Volume 5931/2009, 369-380, DOI: 10.1007/978-3-642-10665-1 34
[51] Scalr - Cloud Management Software;http://scalr.net/;last viewed 5. April 2012
[52] Cloud Comptuing Management Platform by RightScale;http://www.rightscale.com/;last viewed 5. April 2012
[53] Rafael Moreno-Vozmediano, Ruben S. Montero, Ignacio M. Llorent;Elastic management of web server clusters on distributed virtual infras-tructure; Volume 23, Issue 13, Article first published online: 14 FEB 2011;
[54] Mike Kirkwood; Enterprise Cloud Control: Q&A with Eucalyptus CTODr. Rich Wolski ;http://www.readwriteweb.com/cloud/2010/03/eucalyptus-amazon-vmware.php;last viewed 10. April 2012
[55] Erlang (unit) - Wikipedia, the free encyclopedia;http://en.wikipedia.org/wiki/Erlang (unit);last viewed 27. February 2012
[56] Mathematical Programming Glossary ;http://glossary.computing.society.informs.org/second.php?page=U.html;last viewed 08. May 2012
[57] S. N. Srirama, O. Batrashev, P. Jakovits, E. Vainikko; Scalability of Par-allel Scientific Applications on the Cloud ; Scientific Programming Jour-nal, Special Issue on Science-driven Cloud Computing, 19(2-3):91-105,2011.IOS Press. DOI 10.3233/SPR-2011-0320.
116

Appendix
All the necessary instructions, commands and scripts are located on theDVD.
117