
Operational framework for optimal utilisation of construction ...
Upload
khangminh22Category
view
3download
0
A FRAMEWORK FOR
OPERATIONAL EXCELLENCE IN
HOSPITAL LOGISTICS
Application of Industrial Engineering Techniques in
Healthcare Supply Chain Management
Karen MOONS
August 2020
Examination committee:
Prof. dr. ir. B. Demoen, chairman
Prof. dr. ir. L. Pintelon, supervisor
Prof. dr. D. De Ridder, co-supervisor
Prof. dr. ir. G. Waeyenbergh, co-supervisor
Prof. dr. ir. P. Chemweno
Prof. dr. W. Sermeus
Prof. dr. ir. P. Timmermans
Prof. dr. ir. P. Vansteenwegen
Dissertation presented in
partial fulfilment of the
requirements for the
degree of Doctor of
Engineering Science


© 2020 KU Leuven, Faculty of Engineering Science
Uitgegeven in eigen beheer, Karen Moons, Celestijnenlaan 300A box 2422, B-3001 Heverlee
Alle rechten voorbehouden. Niets uit deze uitgave mag worden vermenigvuldigd en/of
openbaar gemaakt worden door middel van druk, fotokopie, microfilm, elektronisch of op
welke andere wijze ook zonder voorafgaandelijke schriftelijke toestemming van de uitgever.
All rights reserved. No part of the publication may be reproduced in any form by print,
photoprint, microfilm, electronic or any other means without written permission from the
publisher.


i
DANKWOORD
Het verhaal achter dit manuscript nam zijn indrukwekkende start vijf jaar geleden. Het
begon op module 13 van KU Leuven Campus Groep T en eindigt in lokaal 04.51 bij
Centrum voor Industrieel Beleid (CIB), beter gekend als ‘de vierde verdieping boven
Fablab’ voor mijn vriendenkring. Graag neem ik jullie mee op mijn
doctoraatsavontuur. Ik richt me hierbij tot een aantal personen, zonder wiens steun het
me nooit gelukt was om de verschillende mijlpalen succesvol te behalen.
2015 – “Let the new adventures begin”
In dat eerste jaar kreeg ik de kans om studenten te onderwijzen, te begeleiden, te
coachen, én op zoek te gaan naar een onderzoeksproject waar ik mezelf ten volle mee
kon bezighouden de komende vier jaar. Hiervoor wil ik mijn co-promotor, Geert
Waeyenbergh, mijn uiterste dank betuigen. Je liet me kennis maken met je
academische netwerk en je nam me mee op werk-gerelateerde (sommigen noemden
het ook plezier) uitstapjes zoals onze twee-jaarlijkse conferentie in Innsbruck (met de
téléférique naar de Nordkette en Patscherkofel, schnaps drinken), een boottocht op de
Damse Vaart voor de Eco-Race Challenge of een lekker etentje/drankje. Ik prijs mezelf
gelukkig met een begeleider zoals jij, iemand die me steunt, motiveert en me wegwijs
gemaakt heeft in deze academische wereld met bijzondere aandacht voor het ‘fun’
gedeelte.
2016 – “Work hard, play harder”
Zo kwamen we in contact met UZ Leuven, waar het logistiek team van het
operatiekwartier een reorganisatie van de logistieke processen wou doorvoeren. De
ideale opportuniteit voor mij om een kijkje achter de schermen van het
operatiegebeuren te kunnen nemen. Al snel bleek dat de logistieke principes nog in
zijn kinderschoenen stonden. Een reden te meer om dit logistieke vraagstuk op te
lossen, waarbij ik ten zeerste apprecieer dat mijn doctoraatsonderzoek niet enkel een
puur academische bijdrage zou worden, maar ook voor het ziekenhuis een impact zou
kunnen hebben.
Ik zou heel graag mijn promotor, Liliane Pintelon, bedanken voor deze opportuniteit.
Je rotsvaste vertrouwen en geloof in mijn kunnen doen me sterker in mijn schoenen

ii
staan. Je deur stond altijd open voor kleine en grote problemen, en ook andersom
apprecieerde ik ten zeerste dat je bij mij kwam aankloppen om mijn mening te vragen.
Je kritische geest, zeer brede kennis en de vrijheid die je me steeds gaf zijn de
belangrijkste aspecten waardoor ik nu met trots dit manuscript kan voorstellen.
Bedankt voor de fijne samenwerking, Liliane!
2017 – “YES you can do it, NO it won’t be easy, but it’ll be worth it”
De eerste jaren van mijn doctoraat voelden aan als het beleven van een rollercoaster.
Met verschillende ‘Ups’ zoals het publiceren van mijn eerste artikels en deelname aan
conferenties, waren er toch ook emotionele ‘Downs’. Momenten waarop je beslist om
te stoppen wanneer je door de bomen het bos niet meer ziet. Een grote dankjewel,
Geert en Liliane, om me opnieuw de weg te wijzen en in mezelf te laten geloven. Als
beginnend doctoraatstudent weet je echt niet wat er op je pad zal komen, maar deze
ervaring heeft me sterker gemaakt op persoonlijk vlak met als bewijs mijn
doorzettingsvermogen, discipline, zelfstandigheid en positivisme.
2018 – “A little progress each day adds up to big results”
Dit onderzoek is tot stand gekomen in nauwe samenwerking met UZ Leuven. In het
bijzonder richt ik mijn dank tot Jo Artoos, de logistiek manager van het
operatiekwartier, bij wie ik steeds terecht kon voor het verzamelen van data en
oplossen van hands-on problemen. Ondanks zijn druk werkschema, maakte hij altijd
tijd vrij voor interessante discussies en liet hij me de ruimte om out-of-the-box te
denken over innovatiemogelijkheden. Zijn praktische ervaring vormt een verrijking
voor dit doctoraatsonderzoek om een goede balans te vinden tussen
wetenschappelijkheid en de implementatie op de werkvloer.
Daarnaast wens ik alle leden van mijn examencommissie te bedanken: Dirk De Ridder,
Paul Timmermans, Pieter Vansteenwegen, Walter Sermeus en Peter Chemweno. Dirk
en Paul, jullie jarenlange ervaring in het reilen en zeilen van het ziekenhuis, jullie
onbetaalbare inzichten en de ideeën die jullie hadden vormden een waardevolle basis
voor dit onderzoek. Dankzij jullie bleef het onderzoek steeds op het juiste spoor. Pieter
en Walter, bedankt voor jullie constructieve feedback op mijn tekst. Dit heeft ertoe
geleid dat mijn werk naar een hoger niveau getild kon worden. Also many thanks to
Peter, for your time and critical reflection on my work.

iii
2019 – “Make it simple but significant”
Doorheen mijn avontuur heb ik ook geleerd dat eenvoud siert. Het zoeken naar
eenvoudige en efficiënte oplossingen leidt tot meer begrip en betrokkenheid van
werknemers die dagelijks geconfronteerd worden met de logistieke problemen.
Samenwerking is de drijfkracht om een beter geheel te creëren. Daarom wil ik graag
alle personen bedanken die ik heb mogen interviewen om hun beeld te schetsen over
zorglogistiek en welke uitdagingen zij in de nabije toekomst zien. Ook een oprechte
merci voor alle thesisstudenten die ik heb mogen begeleiden: Ernest, Bram, Karishma,
Pieterjan, Ruben, Wim, Axelle, Lien en Goele. Jullie hebben telkens alles naar boven
gehaald om een stukje in deze puzzel te leggen en samen een impact te kunnen hebben
op de logistieke werking in het ziekenhuis. Jo, bedankt voor jouw onmisbare hulp en
toewijding bij deze thesissen.
2020 – “It always seems impossible until it’s done”
Een woordje van dank naar mijn naaste collega’s van module 13 en CIB kan natuurlijk
niet ontbreken. Bedankt Evy en Kristel, voor altijd paraat te staan, de leuke babbels en
de conferentie-tripjes tot in de puntjes te regelen. Most of the time I shared with my
office-mate, James. Thank you for your prayers and support that everything will be
fine. Although you liked to heaten up our office, I’m really thankful for the insights
we shared, the spiders/bees you killed for me and the nice working atmosphere you
created! Ook alle andere collega’s, bedankt voor de fijne koffiepauzes, pizza tijdens
de doctoral seminar days, en lekkere attenties bij verjaardagen, sinterklaas, paashaas.
Dit werk zou haast onmogelijk geweest zijn zonder ontspanning na de werkuren.
Basket was mijn uitlaatklep waarbij ik de PhD obstakels uit mijn hoofd kon zetten met
gezonde sport-agressie. Ik zou graag mijn twee ‘basketfamilies’ willen bedanken.
Enerzijds, de Dames A en B van Basket Lummen, voor het delen van hoogtepunten en
moeilijke momenten. Zowel op als naast het veld vormen wij een hecht team. Hoewel
ik soms niet met volle goesting ging trainen, maakten jullie elke training weer plezant
met de nodige humor en werden levenslange vriendschappen gesmeed! Anderzijds
maakte ik ook deel uit van de uniefploeg. Hier stond ‘fun’ en ‘teamspirit’ voorop wat
ook geleid heeft tot Belgisch Kampioen worden.

iv
De onvoorwaardelijke steun van mijn familie heeft er ook voor gezorgd dat ik dit
avontuur succesvol kan beëindigen. Een super grote dankjewel mama en papa voor
jullie liefde, de wijze raad, aanmoedigingen, het vertrouwen in mij en er altijd voor mij
te zijn! Jullie bewijzen steeds weer hoe trots ik mag zijn op wat ik al bereikt heb,
waarbij jullie misschien nog wel trotser zijn dan ikzelf. Ook Maarten en Shana,
bedankt voor jullie steun en de nodige afleiding. Ook bomma en bompa (Herk/Kermt),
bedankt voor het branden van de vele kaarsjes. Ze hebben geluk gebracht!
Tot slot, mijn liefste Jappie, zonder jou was me dit helemaal niet gelukt. We zijn dit
avontuur samen gestart, vijf jaar geleden, en altijd kon ik op jou rekenen. Een deel van
mijn werk mag ook op jouw naam geschreven worden, vb. Matlab codes schrijven.
Ook naast het werk bracht jij de beste afleiding die ik maar kon wensen en was je
steeds dichtbij! Je gaf me telkens weer de kracht om een nieuwe week te starten.
Blijkbaar waren mijn verhalen toch niet zo angstaanjagend, want zelf begon je ook aan
een doctoraat. Ik hoop dat ik voor jou dezelfde steun kan zijn als dat jij voor mij bent
geweest. Samen staan we sterk en maken we elkaar trots. I love you!
Het behalen van deze laatste mijlpaal geeft een gevoel van voldaanheid, vreugde en
dankbaarheid. Ik kijk uit naar waar de toekomst te bieden heeft. But for now, I am
#Ph.inisheD.
Karen Moons
Augustus 2020
v
ABSTRACT
The paradigm shift from volume-based to value-based care drives healthcare
organisations towards aligning logistics and medical processes. The Institute for
Healthcare Improvement (IHI) suggests health policy makers to follow the Quadruple
Aim strategy as a guide for reforming the health system. The overall population health
and the individual patients’ experience of care are at the centre of this strategy, while
simultaneously pursuing lower costs and improving staff satisfaction. Altogether,
optimizing the Quadruple Aim provides a measure for value in healthcare. Value is
defined as the ratio of quality of care over cost. In this dissertation, we call for action
to control the costs by streamlining the internal hospital supply chain processes.
Though often overlooked in the past, healthcare logistics, also referred to as healthcare
Supply Chain Management (SCM), is put forward as a crucial strategic target for
efficiency improvements in hospitals. Supply chain concepts are designed to reduce
costs, enhance visibility and streamline processes to the benefit of value-based care.
Moreover, SCM enhances integration among departments and therefore positively
impacts hospital performance through the effective use of resources. Today, hospitals
face multiple operational challenges, such as poor inventory control, redundant
distribution channels, standardization issues, lack of data, etc. which hinder the
material and information flows and cause misalignment between patient care and
supporting logistics services. The literature rarely addresses how logistics contribute
to value creation in healthcare by pursuing operational excellence. As a first step to
efficiency improvement, hospitals must be able to measure the performance of the
supply chain to identify the main source of waste and inefficiency. However, lack of
performance management systems as well as lack of expertise in Operations Research
and Operations Management (OR/OM) ask for a rigorous methodology that takes into
account the complex nature of the health system.
A data-driven approach is needed to evaluate logistics processes, monitor performance
and gain actionable insights to control the increasing healthcare expenses. Therefore,
this dissertation presents a healthcare logistics performance management framework.
On the one hand, we focus on internal hospital supply chain practices, including
storage and distribution of disposable medical supplies. Performance management, on
the other hand, allows to improve system understanding, identify efficiency gains,

ABSTRACT
vi
implement continuous improvement programs and enhance decision-making
capabilities by monitoring the relevant Key Performance Indicators (KPIs). The
framework developed in this dissertation will serve as proof-of-concept to show how
logistics contribute to healthcare by adopting SCM practices and addressing the unique
challenges inherent to the hospital supply chain. OR/OM tools from industrial
engineering applications (e.g. simulation, multi-criteria decision making, etc.) play a
key role in bringing objectivity in decision making and promoting data-driven process
improvement. Moreover, this reference framework incorporates stakeholder feedback
to stimulate more informed decision making, to reduce supply chain fragmentation and
to provide a common vocabulary and negotiation power. Hence, the framework is an
orchestrator for supply chain integration in healthcare by enabling uniform
performance measurement and increasing data transparency.
From both a theoretical and practical point of view, contributions are made when
developing the healthcare logistics performance management framework: (i) The
Analytic Network Process (ANP) allows to prioritize KPIs, which constitute the
elements of the “operational excellence” definition in healthcare. The ANP-based
prototype is presented to translate strategic/tactical objectives into operational KPIs
according to the studied application. (ii) ANP and Discrete-Event Simulation (DES)
are combined into a hybrid tool to quantify the logistics impact for value-based
healthcare. The Internal Logistics Efficiency Performance (ILEP) index is introduced
as a multi-dimensional evaluation tool for adopting SCM practices and identifying
potential efficiency gains. Besides the well-known trade-off between service level and
cost, we show that standardization is an important factor to streamline inventory and
distribution processes. (iii) Possibly conflicting stakeholder perspectives are integrated
in the framework. In contrast to early-participation of the stakeholders, our approach
aims to first increase understanding in order to create awareness of SCM. As a result,
the framework promotes stakeholder commitment to strive towards value
improvement, which is considered to be a shared goal that unites the interests of all
stakeholders. (iv) From a practical point of view, the framework aims to bridge the gap
between theory and practice-based SCM. The applicability of the framework is
demonstrated using real-life case studies focusing on storing and distributing surgical
disposables throughout the operating theatre. In addition, we present an
implementation roadmap acting as a guideline for implementing various logistics
strategies in different contexts using the framework as a blueprint. This dissertation
concludes with a note on how the digitalization trend will impact healthcare SCM.

vii
BEKNOPTE SAMENVATTING
In de transitie van volume-based naar value-based healthcare richten
gezondheidsinstellingen zich op het leveren van waardevolle zorg door kwaliteit en
kosten met elkaar te verbinden. In deze hervorming van het gezondheidszorgsysteem
dient de Quadruple Aim strategie als een kompas om de prestaties te optimaliseren.
Deze strategie heeft een vierledig doel, namelijk het verbeteren van de algemene
bevolkingsgezondheid, het verbeteren van de patiëntervaring, het verlagen van de
kosten en het verbeteren van het personeelswelzijn. Meer bepaald biedt de Quadruple
Aim een maatstaf voor waarde in de zorg, wat gedefinieerd wordt als de verhouding
tussen kwaliteit en kost. Dit doctoraatsonderzoek buigt zich voornamelijk over het
tweede aspect, en roept daarmee op tot actie om de toenemende kosten in de
gezondheidszorg te controleren door het stroomlijnen van de logistieke keten binnen
de ziekenhuismuren.
De rol van logistiek in de gezondheidszorg wordt alsmaar belangrijker om kwalitatieve
zorgverlening te garanderen aan een zo laag mogelijke kost. Hierbij wordt
zorglogistiek gezien als een strategisch wapen om efficiëntiewinsten te realiseren. Het
inburgeren van logistieke principes die leiden tot noodzakelijke kostenreducties,
verhoogde transparantie en op elkaar afgestemde processen zal uiteindelijk bijdragen
tot efficiënte zorg. Zorginstellingen zullen met minder middelen steeds meer moeten
bereiken. Daarom is het effectief beheer van deze middelen en een gecoördineerde
samenwerking in de logistieke keten essentieel om de prestaties van ziekenhuizen te
optimaliseren. Echter, vandaag de dag zien we verschillende logistieke knelpunten,
zoals intuïtief voorraadbeheer, parallelle materiaalstromen, gebrek aan logistieke data,
beperkte standaardisatie, enz. die leiden tot een belemmerde afstemming tussen de
zorgvraag en de logistieke ondersteuning. Ook in de literatuur is nog niet duidelijk
omschreven welke bijdrage logistiek heeft tot waardevolle zorg door het streven naar
operationele excellentie. Potentiële efficiëntiewinsten kunnen enkel geïdentificeerd
worden als men de huidige toestand van de logistieke keten kan opvolgen volgens het
principe ‘meten is weten’. Door de complexiteit van de zorgsector, het gebrek aan een
effectief prestatie-meting systeem en de beperkte training van personeel in logistieke
grondbeginselen is er nood aan een systematische aanpak om de impact van logistiek
te meten in zorgprocessen.

BEKNOPTE SAMENVATTING
viii
Het in kaart brengen en meten van de logistieke dienstverlening vraagt het gebruik van
instrumenten om processen te evalueren, prestaties op te volgen en inzichten te
verwerven die tot kostenbesparing leiden. In dit onderzoek integreren we relevante
operationele onderzoekstechnieken in een performance management framework voor
zorglogistiek. Enerzijds focust het framework op de interne logistieke processen in
ziekenhuizen, zoals voorraadbeheer en distributie van materialen, om operationele
excellentie te bereiken. Daarnaast benadrukt het framework de nood aan effectieve
prestatie-meting om een systeem beter te begrijpen, efficiëntiewinsten te identificeren,
continue verbeteringsinitiatieven te implementeren en beslissingsprocessen
transparanter te maken. Het framework biedt dus een proof-of-concept om logistiek te
meten in de zorgsector door het adopteren van logistieke concepten en deze aan te
passen aan de unieke eigenschappen van de interne zorglogistiek keten. Het arsenaal
van operationele onderzoekstechnieken (vb. simulatie, multi-criteria
beslissingsanalyse, enz.), die reeds succesvol toegepast zijn in andere industriële
sectoren, spelen een belangrijke rol om objectiviteit te verkrijgen in
beslissingsprocessen door evidence-based procesverbetering te promoten. Het
framework speelt ook een belangrijke rol als beslissingsondersteuning door het
betrekken van verschillende betrokken partijen. Op basis van de stakeholder feedback
kunnen er beter geïnformeerde beslissingen genomen worden, vermindert het
versnipperde karakter van de logistieke keten en vergemakkelijkt de communicatie en
de onderhandelingsmacht. Dit leidt tot uniforme prestatie-meting en meer
transparantie, en daarom bevordert het framework integratie in de logistieke keten.
De ontwikkeling van het performance management framework voor zorglogistiek
biedt perspectieven, zowel voor academici als professionele zorgverleners: (i) het
Analytisch Netwerk Proces (ANP) laat toe om prestatie-indicatoren te selecteren en
prioriteren, die de componenten vormen van de operationele excellentie definitie in
zorglogistiek. De netwerkstructuur biedt hulp in het vertalen van strategische
doelstellingen naar operationele indicatoren die relevant zijn voor de specifieke
context. (ii) ANP en Discrete-Event Simulatie (DES) zijn gecombineerd in een hybride
ANP-DES instrument om de logistieke impact te meten. Het resultaat hiervan wordt
geïntegreerd in een Interne Logistieke Efficiëntie Prestatie (ILEP) index, die dienst
doet als evaluatie-maatstaf voor het implementeren van logistieke initiatieven en
identificeren van potentiële efficiëntiewinsten. We tonen aan dat, naast de bekende
afweging tussen serviceniveaus en kosten, standaardisatie een cruciale factor is om
logistieke processen te stroomlijnen. (iii) De mogelijk conflicterende belangen van

BEKNOPTE SAMENVATTING
ix
verschillende stakeholders worden verwerkt in de laatste stap richting een multi-level,
multi-stakeholder framework. In tegenstelling tot stakeholder participatie in de eerste
ontwerpfase van het framework, beoogt onze aanpak eerst een toegenomen begrip van
logistieke principes, wat vervolgens bewustzijn zal verhogen van de logistieke impact.
Dit bewustzijn moedigt stakeholders aan zich in te zetten, tot actie over te gaan en te
streven naar waardevolle zorg, als een gedeelde doelstelling die elke belanghebbende
viseert, in plaats van eigen belangen voorop te stellen. (iv) De praktische kant van het
onderzoek streeft ernaar om de kloof te dichten tussen theorie en implementatie van
het framework. De toepasbaarheid van het framework wordt gedemonstreerd via case
studies, die verschillende scenario’s evalueren voor voorraadbeheer en
distributiesystemen van wegwerpbare materialen gebruikt in het operatiekwartier. Een
stappenplan is voorgesteld om alternatieve logistieke processen te implementeren in
verschillende toepassingen, waarbij het framework dienst doet als blauwdruk. Dit
onderzoek eindigt met een slotrede over de digitalisatietrend en hoe deze nieuwe
technologieën een impact hebben op zorglogistiek.

x
TABLE OF CONTENTS
ABSTRACT V
BEKNOPTE SAMENVATTING VII
TABLE OF CONTENTS X
LIST OF ABBREVIATIONS XIV
1 INTRODUCTION TO PHD DISSERTATION 1
1.1 Exploratory research: SCM in the healthcare sector 4 1.1.1 Current state of SCM in Belgian hospitals 4 1.1.2 Optimization of operations by simulation: a case study at the Red Cross Flanders 6 1.1.3 Need for training in logistics principles: Healthcare Logistics Education and Learning
Pathways 8 1.1.4 Similarities between manufacturing, maintenance and healthcare logistics 9 1.2 Problem statement 11 1.2.1 Research motivation 12 1.2.2 Research questions 14 1.3 Structure of the dissertation 17
2 METHODOLOGY 19
2.1 Framework development procedure 19 2.2 Healthcare logistics toolbox 22 2.2.1 Case study research design 22 2.2.2 Overview of OR/OM tools for healthcare SCM 23 2.2.3 Data collection 31
3 HEALTHCARE LOGISTICS AND PERFORMANCE MANAGEMENT 33
3.1 Defining logistics in the healthcare sector 33 3.1.1 Specificities in healthcare logistics 36 3.2 Performance management in healthcare logistics 37 3.2.1 Literature review: Measuring the logistics performance of internal hospital supply
chains 38 3.3 Conclusion 45 3.3.1 Research gaps 45

TABLE OF CONTENTS
xi
3.3.2 Research contributions 47
4 PRIORITIZATION OF PERFORMANCE INDICATORS USING AN ANP-
BASED PROTOTYPE FOR THE INTERNAL HOSPITAL SUPPLY CHAIN 51
4.1 Multi-Criteria Decision Making in healthcare 52 4.1.1 MCDM classification 53 4.1.2 Analytic Hierarchy/Network Process 55 4.2 Performance indicator selection and prioritization: an ANP-based
prototype for the operating theatre supply chain 58 4.2.1 Introduction 58 4.2.2 Stakeholder analysis: selecting logistics performance metrics for the OT 59 64 4.2.3 Performance indicator selection and prioritization using ANP 68 4.2.4 Results 73 4.2.5 Discussion 76 4.2.6 Sensitivity analysis 78 4.3 Challenges of AHP/ANP 80 4.3.1 Medical decision making for value-based healthcare: challenges in AHP 82 4.4 Conclusion 93
5 EMPIRICAL RESEARCH AT THE OPERATING THEATRE: POLICY
DECISION MAKING, PARAMETER SETTING AND PERFORMANCE
MONITORING 95
5.1 Inventory management and distribution systems in healthcare: State-of-
the-art 96 5.1.1 Overview of inventory classification techniques 96 5.1.2 Overview of inventory models in healthcare 99 5.1.3 Overview of healthcare distribution and scheduling systems 104 5.2 Empirical research at the operating theatre 108 5.2.1 Discrete-Event Simulation in healthcare logistics 109 5.2.2 Classification of inventory items in healthcare – A case study 117 5.2.3 Optimization of a two-echelon inventory system at the operating theatre – A case
study 133 5.2.4 Evaluating replenishment systems for disposable supplies at the operating theatre – A
case study 152 5.2.5 Evaluating case cart distribution systems in the operating theatre – A case study 161 5.3 Integrating inventory and distribution systems using surgical procedure
preference lists 181 5.3.1 Methodology 181 5.3.2 Results 182 5.3.3 Discussion 189 5.4 Conclusion 191

TABLE OF CONTENTS
xii
6 MULTI-LEVEL MULTI-STAKEHOLDER FRAMEWORK VALIDATION 195
6.1 Introduction 195 6.2 Literature 197 6.2.1 Stakeholder conflicts: how much do their preferences matter to decision making? 197 6.3 Methodology 198 6.3.1 Stakeholder analysis 200 6.3.2 Data collection and analysis 201 6.3.3 PROMETHEE methodology 203 6.4 Results 205 6.4.1 Multi-stakeholder KPI ranking 205 6.4.2 Robustness of the framework 210 6.4.3 Benchmarking 219 6.5 Discussion 224 6.5.1 Feedback loop 1: individual versus shared stakeholder ranking using ANP 224 6.5.2 Feedback loop 2: robustness in policy decision making 226 6.5.3 Benchmarking 230 6.6 Conclusion 232
7 ROADMAP FOR IMPLEMENTATION OF THE FRAMEWORK 235
7.1 Introduction 235 7.2 Healthcare logistics performance management framework 236 7.3 Working principle of the framework 238 7.3.1 Selecting indicators 239 7.3.2 Prioritizing indicators 239 7.3.3 Evaluating logistics policies and monitoring performance 240 7.3.4 Incorporating stakeholder feedback 241 7.4 Practice-based application of the framework 243 7.4.1 Testing the framework for internal distribution at the operating theatre 243 7.5 Level of replicability 247 7.5.1 Implementation roadmap 248 7.5.2 Implications for hospital-wide applications of the framework 252 7.5.3 Future directions 254 7.6 Conclusion 256
8 FUTURE OUTLOOK: DIGITAL TRENDS IN HEALTHCARE LOGISTICS 259
8.1 Introduction 259 8.2 Hospital of the future 260 8.3 Global healthcare trends 263 8.4 Implications for healthcare SCM 265 8.4.1 Fragmentation 266
TABLE OF CONTENTS
xiii
8.4.2 Stakeholders 267 8.4.3 Unpredictability 268 8.4.4 Expertise in OR/OM 268 8.4.5 Standardization 269 8.4.6 Automation 270 8.4.7 Other challenges 271 8.5 Conclusion 272
9 GENERAL CONCLUSION 275
APPENDIX 283
LIST OF REFERENCES 295
LIST OF PUBLICATIONS 321

xiv
LIST OF ABBREVIATIONS
ABS Agent-Based Simulation
ADM Automated Dispensing Machines
AGV Autonomous Guided Vehicles
AHP Analytic Hierarchy Process
AI Artificial Intelligence
ANP Analytic Network Process
ASHRM American Society for Healthcare Risk Management
CHUM Centre Hospitalier de l’Université de Montréal
CI Consistency Index
CR Consistency Ratio
CSA Central Sterilization Department (in Dutch: Centrale
Sterilisatie Afdeling)
DEMATEL Decision Making Trial and Evaluation Laboratory
DES Discrete-Event Simulation
DSN Digital Supply Networks
EDI Electronic Data Interchange
EHR Electronic Health Records
ELECTRE Elimination and Choice Translating Reality
EOQ Economic Order Quantity
FNS Fast-, Normal-, Slow-moving
GAIA Geometrical Analysis for Interactive Aid
GDP Gross Domestic Product
GDPR General Data Protection Regulation
GDSN Global Data Synchronisation Network
GPO Group Purchasing Organisation
GS1 Global Standards 1
GTIN Global Trade Item Number
HELP Healthcare logistics Education and Learning Pathways
HTA Health Technology Assessment

LIST OF ABBREVIATIONS
xv
ICHOM International Consortium for Health Outcomes Measurement
IDN Integrated Delivery Networks
IHI Institute for Healthcare Improvement
ILEP Internal Logistics Efficiency Performance
IOM Institute of Medicine
IoT Internet-of-Things
IRCC Interventional Radiological and Cardiovascular Centre
IT Information Technology
JIT Just-in-Time
KPI Key Performance Indicator
LabVIEW Laboratory Virtual Instrumentation Engineering Workbench
MACBETH Measuring Attractiveness by a Categorical Based Evaluation
Technique
MASTA Multi-Attribute Spare Tree Analysis
MAU(V)T Multi-Attribute Utility (Value) Theory
MC Monte Carlo
MCDM Multi-Criteria Decision Making
ML Machine Learning
MRP Material Requirements Planning
OECD Organisation for Economic Cooperation and Development
OR/OM Operations Research and Operations Management
OT Operating Theatre
OT1/2 Operating Theatre 1 (elaborative surgery) / 2 (day care surgery)
PAPRIKA Potentially All Pairwise RanKings of all possible Alternatives
PAR Periodic Automatic Replenishment
PDCA Plan, Do, Check, Act
POU Point-Of-Use
PREMs Patient Reported Experience Measures
PROMETHEE Preference Ranking Organisation Method for Enrichment
Evaluation
PROMs Patient Reported Outcome Measures
PSA Prostate-Specific Antigen
QR Quick Response

LIST OF ABBREVIATIONS
xvi
RFID Radio-Frequency Identification
RI Random Index
RQ Research Question
SCM Supply Chain Management
SCOR Supply Chain Operation Reference
SD System Dynamics
SKU Stock Keeping Unit
SLA Service Level Agreement
SPP Shortest Path Problem
TOPSIS Technique for Order Preference by Similarity to Ideal Solutions
TSP Travelling Salesman Problem
VED Vital, Essential, Desirable
VMI Vendor-Managed Inventory
WAM Weighted Arithmetic Mean
WGM Weighted Geometric Mean
Inventory-related indicators
Distribution-related indicators
ICo Inventory Cost ITu Inventory Turnover
IV Inventory Visibility IU Inventory Usage
IA Inventory Accuracy PS Product Standardization
ICr Inventory Criticality VoI Value of Inventory
ISL Inventory Service Level
CCE Case Cart Efficiency DSL Distribution Service Level
CI Centralization Impact PCo Personnel Cost
CSI Clinical Staff Involvement PM Personnel Management
DA Delivery accuracy RLT Replenishment Lead Time
DCo Distribution Cost RT Response Time
DF Delivery Frequency S Process Standardization

LIST OF ABBREVIATIONS
xvii
Prostate-cancer related indicators
AT Additional Therapy PSA Prostate Specific Antigen
BT Blood Transfusion SE Surgeon Experience
C Complications SM Surgical Margin
CS Clinical Stage TOR Total time in Operating Room
ED Erectile Dysfunction TTRF Time To Return to normal
Functioning
GS Gleason Score UI Urinary Incontinence
LOS Length of Stay

xviii

1
CHAPTER 1
1 Introduction to PhD Dissertation1
The healthcare sector is targeting its core activity to provide high-quality care to
patients. However, aging population, an increasing number of chronically ill patients,
reduced reimbursements and clinical innovations drive healthcare management to
deliver efficient and effective care services in order to reduce total costs of care and
simultaneously improve patient care (Deloitte 2019). Moreover, the reform from
volume-based to value-based care models forces healthcare organisations to balance
qualitative patient outcomes and healthcare expenses by encouraging coordination
between logistical and care processes across the healthcare continuum. According to
the Triple Aim initiative, as suggested by the Institute for Healthcare Improvement
(IHI), three overarching goals need to be simultaneously pursued in order to redesign
health systems and optimize overall healthcare performance (Berwick, Nolan, and
Whittington 2008):
Delivering the best treatment to patients in terms of quality and safety
Improving the health of the overall population
Reducing healthcare expenses per capita.
In addition, the critical role of physicians, nurses and other employees involved in the
care delivery cannot be underestimated in this healthcare reform journey. Therefore,
the Triple Aim is expanded to consider workforce engagement and safety into a
Quadruple Aim strategy by creating meaningful and joyful work, and thus improving
1 This chapter is partially based on the following paper/supervised Master’s Thesis:
Moons, K., Pintelon, L., Waeyenbergh, G. (2016). Optimization of operations by simulation – A case study at the
Red Cross Flanders. American Journal of Industrial and Business Management, 6(10), 1001-1017.
Vanpee, G. (2019). An insight view in the logistics processes of materials management of different health care
institutions: A multi-organisational, exploratory, cross-sectional study. KU Leuven.

CHAPTER 1
2
the experience of providing care (Sikka, Morath, and Leape 2015). The ultimate aim
in any healthcare organisation is protecting and improving patient population health,
while the other goals are considered to be of secondary importance to achieve the
primary goal (Bodenheimer and Sinsky 2014). In this dissertation, we aim to ensure
cost containment and coordination between logistical and care processes, and hence
achieve a more sustainable healthcare system.
In Belgium, the healthcare expenses amount 10.5% of GDP in 2015, which is greater
than the OECD average of 9.9% (OECD 2015). Nearly 40% of health expenditures is
assigned to hospitals (OECD 2017). Cost containment is thus a major target for
improvement in hospitals (OECD 2015). A financial analysis by the Belfius bank
agency shows that in 2017, 42% of the hospitals in Belgium make a loss (D’Hoore
2018). The cost of logistics operations (e.g. handling, moving and processing of
materials) ranges between 20% and 45% of the total hospital operating budget (Aptel,
Pomberg, and Pourjalali 2009; Landry and Beaulieu 2011; Pouline 2003; Who 2010),
constituting the second largest expenditure in hospitals after personnel cost (Volland
et al. 2017). This large share is mainly due to high service level requirements in
hospitals, criticality of medical supplies, independent clinician preferences for specific
brands or supplies and a considerable amount of waste in the healthcare supply chain
processes (Landry, Beaulieu, and Roy 2016). According to Pouline (2003), half of the
logistics-related costs in hospitals can be eliminated by implementing efficient
logistics management. Hence, the role of logistics services in healthcare can no longer
be neglected. On a global scale, there is increasing awareness of the benefits of
effective logistics support, such as significant impact on the hospital’s bottom line and
improved service levels in care delivery processes (Rosales, Magazine, and Rao 2019).
Surprisingly, little action has been taken to improve efficiency in the hospital supply
chain.
The global healthcare supply sector is faced with several operational challenges:
missed contract compliances, lack of inventory visibility, stock-outs resulting in
expensive emergency deliveries, highly diverse array of stakeholders, increased
involvement of clinical personnel in logistics tasks, lack of information technology
systems, etc. (Landry et al. 2016; Vanpee 2019). Sticking to traditional and intuitive-
based methods may come to the detriment of quality of care (Landry et al. 2016),
whereas tackling these challenges allows for pursuing operational excellence, cutting
costs and improving patient care by implementing well-coordinated healthcare Supply
Chain Management (SCM). Other sectors, such as manufacturing and retail, have

INTRODUCTION
3
significantly benefited from optimizing SCM practices (Chopra and Meindl 2010).
Examples are lean, six sigma, total quality management, benchmarking or business
process reengineering (Feibert 2017). Recently, healthcare providers start to recognize
the importance of SCM from operational, financial and clinical perspectives as a means
to realize efficiency targets by cutting back on costs and waste, streamlining operations
and improving productivity. However, transferring and adapting techniques or best
practices developed in industrial settings to the healthcare sector is not straightforward
due to the multi-dimensional complexity inherent to the healthcare supply chain. The
HIPS project is one of the few initiatives aligning and optimizing supporting processes
in hospitals by combining automation and supply chain integration. The supply chain
savings are estimated to be 30% (Devis and Van Ooteghem 2016).
While patient flows have been widely studied in literature, the discussion of healthcare
logistics processes is limited. Kumar et al. (2008) and de Vries and Huijsman (2011)
investigate the holistic supply chain in the healthcare context. Recently, Volland et al.
(2017) provide an overview of relevant quantitative methods useful to hospital
materials logistics. They distinguish between four streams of literature across the
supply chain: supply and procurement, inventory management, distribution and
scheduling, and holistic SCM. Rossetti et al. (2012) analyse the medical supply chain
from a materials management perspective and illustrate its complexity and uniqueness.
They state that medical supply logistics manage the flow of supplies and resources to
enable patient care, covering many stages such as purchasing, inventory control,
material handling, scheduling and distribution of medical supplies to point-of-use
locations. Healthcare supply chain operations, however, are often inefficient and
fragmented due to independent goals of multiple stakeholders, preventing the supply
chain from operating as a system (Belliveau 2016). The unique characteristics in a
healthcare setting complicate the adoption of a chain-oriented approach and hinder the
appropriate measurement of performance of logistics flow in order to reach operational
excellence while guaranteeing high service levels (Aronsson, Abrahamsson, and Spens
2011).
“Operational excellence is achieved through the use of best inventory
management and distribution systems, combined with continuous supply
chain process improvements and better integration with the patient care
process” (Landry and Beaulieu 2013).

CHAPTER 1
4
1.1 Exploratory research: SCM in the healthcare sector
Nowadays, a transition from volume-based to value-based healthcare requires
balancing costs with patient outcomes. This trade-off largely depends on the extent to
which logistics provide support to care processes. Unnecessary or inefficient
operations that do not contribute to value of patient care lead to wasteful processes.
Lean management, commonly associated with the Toyota Production System in the
manufacturing sector, is a relatively new concept to healthcare. The Institute for
Healthcare Improvement advocates the implementation of lean principles as it can
realize significant benefits in terms of maximizing value and eliminating waste
(Womack et al. 2005). In addition, total quality management, business process
reengineering, benchmarking, and information technology are useful tools to
implement an efficient supply chain. In other industrial sectors, SCM is widely applied
together with performance measurement techniques to achieve operational excellence.
Although the healthcare sector recognizes the importance of adopting these industrial
engineering techniques, the healthcare supply chain is yet at a very low level of
maturity, lagging behind the industrial supply chain. Rakovska and Stratieva (2018)
divide hospitals into three categories based on their level of adopting SCM techniques.
In general, hospitals classified as ‘leading institutions’ in terms of supply chain
integration have better overall performance and show improved inventory parameters
and quality of care compared to ‘developing hospitals’ or ‘underdeveloped hospitals’.
As an introduction to this dissertation, Section 1.1.1 discusses the current state of
adopting SCM in Belgian hospitals and analyses gaps between theory and practice. In
Section 1.1.2, an exploratory case study at the Red Cross Flanders shows the feasibility
of applying industrial engineering techniques, such as simulation, to identify efficiency
gain opportunities in care delivery systems. Section 1.1.3 emphasizes the importance
of stakeholder education and training to implement SCM programs in healthcare.
Finally, in Section 1.1.4, we compare the healthcare sector to industrial sectors to
explore parallels and differences in adopting logistics concepts.
1.1.1 Current state of SCM in Belgian hospitals
An exploratory study in four Flemish hospitals describes the current state of adopting
SCM (Vanpee 2019). The hospitals vary in size, infrastructure as well as organisation.
Typically, hospitals distinguish between a purchasing and internal logistics
department, where the latter is further divided into functions for transportation (e.g.

INTRODUCTION
5
internal/external transport, goods receipt, etc.), supply provision (e.g. last-mile
distribution, point-of-care warehouses) and access control.
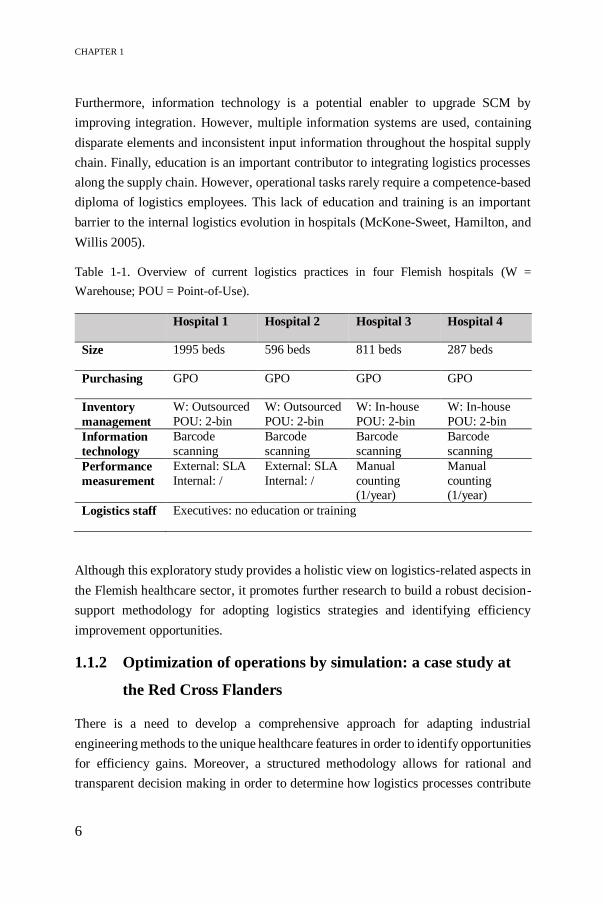
Table 1-1 shows the current hospital practices, focusing on purchasing, inventory
management, information technology, performance measurement and staff education.
As suggested in literature, most purchasing policies strive for efficient management by
participating in Group Purchasing Organisations (GPOs) and thus leveraging
economies of scale and enhancing price transparency (Burns and Lee 2008).
Recently, Kritchanchai et al. (2018) recommend to focus on the fields of inventory
management and information technology to improve operational processes in
hospitals. Although the central warehouse function is often outsourced to a third party
logistics provider or distribution centre, the internal supply is organised by the
hospitals. Regardless the size or organisation of the hospital logistics department, the
inventory parameters are similar, namely determining a minimum stock level and a
fixed order quantity. Most point-of-care locations control stock levels using a two-bin
system, where parameters are set based on gut feeling, such as holding two times four
days of stock to cover the longest possible weekend. As a consequence, hospitals suffer
from stock-outs due to unpredictability in materials consumption as well as lack of
storage space due to overstocking. Moreover, the type of care provided in each hospital
facility determines the supply complexity, consumption rate and diversity. In the
operating theatre for example, Vendor-Managed Inventory (VMI) is applied to
expensive materials such as stents and prostheses (Epstein and Dexter 2000). VMI is
an effective inventory management technique, where the vendor or supplier is
responsible for stock control and replenishment decisions, while the consignment
items are usually stored in the hospital wards under supplier ownership until the items
are consumed (Machado Guimarães, Crespo de Carvalho, and Maia 2013). In general,
outsourcing the central warehouse function to a logistics provider results in simplified
material flows, limited number of suppliers and decreased stock levels and costs.
Performance measurement allows hospital facilities to define benchmarks, increase
visibility of material flows and reduce costs by eliminating waste. The external
logistics provider monitors performance in the Service Level Agreement (SLA) in
terms of quality of their suppliers (e.g. supplier reliability, delivery time, backorders,
etc.), inventory goods (e.g. order lines, price transparency) and internal quality (e.g.
picking errors, cross-dock lines), whereas internal hospital practices lack Key
Performance Indicators (KPIs) to measure internal logistics efficiency. In contrast, in-
house inventory management verifies the stock once a year through manual counting.
CHAPTER 1
6
Furthermore, information technology is a potential enabler to upgrade SCM by
improving integration. However, multiple information systems are used, containing
disparate elements and inconsistent input information throughout the hospital supply
chain. Finally, education is an important contributor to integrating logistics processes
along the supply chain. However, operational tasks rarely require a competence-based
diploma of logistics employees. This lack of education and training is an important
barrier to the internal logistics evolution in hospitals (McKone-Sweet, Hamilton, and
Willis 2005).
Table 1-1. Overview of current logistics practices in four Flemish hospitals (W =
Warehouse; POU = Point-of-Use).
Hospital 1 Hospital 2 Hospital 3 Hospital 4
Size 1995 beds 596 beds 811 beds 287 beds
Purchasing GPO GPO GPO GPO
Inventory
management
W: Outsourced
POU: 2-bin
W: Outsourced
POU: 2-bin
W: In-house
POU: 2-bin
W: In-house
POU: 2-bin
Information
technology
Barcode
scanning
Barcode
scanning
Barcode
scanning
Barcode
scanning
Performance
measurement
External: SLA
Internal: /
External: SLA
Internal: /
Manual
counting (1/year)
Manual
counting (1/year)
Logistics staff Executives: no education or training
Although this exploratory study provides a holistic view on logistics-related aspects in
the Flemish healthcare sector, it promotes further research to build a robust decision-
support methodology for adopting logistics strategies and identifying efficiency
improvement opportunities.
1.1.2 Optimization of operations by simulation: a case study at
the Red Cross Flanders
There is a need to develop a comprehensive approach for adapting industrial
engineering methods to the unique healthcare features in order to identify opportunities
for efficiency gains. Moreover, a structured methodology allows for rational and
transparent decision making in order to determine how logistics processes contribute
INTRODUCTION
7
to value-based healthcare. A preliminary case study at the Red Cross Flanders is
conducted to show the relevance of applying industrial engineering techniques, such
as lean, operations analysis or simulation, to achieve operational excellence while
guaranteeing high service levels to patients. At the department Blood Service, the main
goal is to ensure availability of safe, high-quality blood products to satisfy the highly
critical public health need in the majority of hospitals in Flanders. Blood products are
collected across 11 fixed donor centres in Flanders. As the supply of these blood
products relies on voluntary donations by Belgian citizens, it is important to maximize
their comfort and satisfaction during the donation process. Satisfied donors will return
and guarantee continuous supply of blood products. Therefore, the Red Cross is
interested in optimizing the donor flow in donor centres by focusing on minimal
waiting times and optimal organisation of the donor centre.
By analysing the current operations at a donor centre, bottlenecks and non-value-
adding activities are identified. Moreover, external factors and unpredictability
complicate the organisation of donors and resources at donor centres. Discrete-event
simulation is used to model the donor flow. The best performance of the donor flow is
found through scenario analysis by changing input parameters, such as donor arrival
patterns, bed capacity or number of doctors. Visualizing the donor flow is a strong
advantage in communicating the relevant findings to the medical personnel and
stakeholders as it supports effective, transparent decision-making processes based on
the simulation model. On the other hand, the drawback of developing a simulation
model is the effort required to verify and validate the modelled flow. Validation in
healthcare presents a challenge to model developers due to absence of accurate data.
A gap analysis is conducted to identify additional data needs to build a more detailed
simulation model. Please see Moons et al. (2016) for more information on the findings.
This exploratory case study shows the feasibility and motivation for applying industrial
engineering techniques in a healthcare setting in order to improve efficiency without
compromising on patient care service levels. However, adaptation of logistics
techniques to the unique characteristics of the healthcare context is required to
overcome the barriers to achieve efficient, value-based care delivery processes.
Typical healthcare challenges are unpredictability, multi-stakeholder conflicting
perspectives, fragmentation, and lack of data, lack of standardization and lack of
automation.

CHAPTER 1
8
1.1.3 Need for training in logistics principles: Healthcare
Logistics Education and Learning Pathways
As a response to the need for improving internal logistics in the healthcare sector, the
HELP project is introduced. HELP stands for Healthcare Logistics Education and
Learning Pathways. In this Erasmus+ project, international universities and colleges in
Estonia, Finland, Spain, The Netherlands and Belgium are collaborating to develop a
continuous educational curriculum from vocational level up to PhD level. The main
goal is to create a healthcare logistician education pathway to ensure the right skills,
competencies, training and knowledge are available for different logistics functions in
a healthcare institution. Figure 1-1 displays the overlapping responsibility of a
healthcare logistician who understands the concepts of logistics and speaks the same
language as the medical staff (Kotonen et al. 2016; Kotonen and Tuominen 2014).
This, in turn, will enhance alignment between patient care and logistics processes and
thus benefits overall hospital performance.
The implementation of supply chain fundamentals and innovative best practices to
improve logistics in healthcare is often counteracted by healthcare professionals,
including nurses, doctors and other employees involved in the care delivery system.
One of the greatest challenges to efficient hospital logistics management relates to lack
of logistics education. Gowen and Tallon (2003) show that supply chain training at
both the executive and managerial level provides a greater competitive advantage.
Current hospital practices lead to interrupted workflows and clinical personnel
involvement in logistics tasks, wasting valuable time to be spent with patients to ensure
high quality care (Landry et al. 2016). Inefficient organisation of logistics functions
and vague descriptions of those functions make logistics one of the biggest sources of
waste in hospitals. Introducing a new profession of healthcare logisticians in the HELP
project will release the medical professionals from logistics tasks so they can focus on
their core activity of nursing or caring (Kotonen et al. 2016). At the same time, efficient
material handling as well as effective inventory control can be achieved supporting
patient care services. In addition, the human factor contributes to the delivery of high-
quality logistics services; and therefore, measuring several aspects of personnel
management or employee engagement is a relevant performance indicator for
increasing efficiency in internal hospital logistics. Finally, the HELP project provides
new perspectives on detecting bottlenecks, implementing efficient healthcare logistics
operations and change management.

INTRODUCTION
9
1.1.4 Similarities between manufacturing, maintenance and
healthcare logistics
Driven by globalization, the industrial sector acknowledges ongoing improvements in
the field of SCM, involving a management shift from individual processes to a
network-based orientation. Concepts of OR/OM providing advanced analytical models
gain popularity for making planning and controlling decisions in terms of purchasing,
inventory management, distribution and scheduling, partnerships with suppliers, lean
management (e.g. Just-In-Time (JIT)), etc. (De Vries and Huijsman 2011). The
healthcare sector, on the other hand, prioritizes patient care and safety while cost
drivers related to logistics processes are often forgotten.
The healthcare logistics sector can reap similar benefits, provided that the OR/OM
tools are adapted to meet the specific conditions in a hospital. The hospital supply
chain resembles most to manufacturing or other industrial facilities when compared to
complex patient flows, and thus is most likely to adopt SCM (Thorwarth and Arisha
2009). Zhong et al. (2017) explore the parallels between production systems and care
delivery systems. Common features in terms of system modelling, performance
management, continuous improvement, data standards, product selection, etc. make it
interesting to transfer the methodologies and philosophies from manufacturing to
healthcare, fostering multi-disciplinary research to improve overall healthcare
performance. De Vries and Huijsman (2011) also investigate the similarities between
the industrial and healthcare sector. Like in the manufacturing industry, the focus of
OR/OM in healthcare originates from optimizing individual processes such as demand,
Figure 1-1. Consolidation of logistics flows and patient care as competences of a healthcare
logistician (Kotonen and Tuominen, 2014).

CHAPTER 1
10
order, supplier or inventory management. Information technology acts as an important
enabler for successfully integrating supply chain processes (Rossetti et al. 2012).
Inventory management has been widely discussed in manufacturing, while recently it
is also identified as a key lever to realize efficiency targets in a healthcare setting. To
some extent, hospital inventory management is comparable to industrial inventory
management. For example, actual use inventory management can be inspired on retail
management (Varghese et al. 2012). Kwon et al. (2016) compare healthcare and
commercial supply chains and emphasize the similarity between both. The authors
especially highlight logistics operational tools and process improvement as key
strategic areas to fully benefit from effective supply chain operations in healthcare.
Finally, controlling spare parts inventory in maintenance operations as mentioned by
Danas et al. (2006) shows most similarities to hospital logistics, where the overall goal
is to achieve a high service level while controlling inventory levels to reduce inventory
costs (De Vries 2011). Hu et al. (2018) describe special characteristics related to spare
parts logistics. Demand is unpredictable as equipment breakdowns can occur at any
instant (Huiskonen 2001). Moreover, the cost of spare parts varies from cheap to
extremely expensive and there is a great variety of items. Furthermore, equipment
downtime causing production losses must be minimized, and thus requiring high
availability of spare parts (Braglia, Grassi, and Montanari 2004; Danas et al. 2006).
The healthcare sector is struggling to effectively manage inventory. Since spare parts
management has similar characteristics, it might be useful to look at these best
practices. A good modelling approach (e.g. mathematical models, simulation, multi-
attribute classification) enables effective decision making for planning, scheduling or
inventory control (Braglia et al. 2004; Danas et al. 2006; Huiskonen 2001).
Waeyenbergh and Pintelon (2009) and Van Horenbeek and Pintelon (2014) develop a
framework enabling performance monitoring to measure outcomes and identify
improvement opportunities for maintenance purposes in a manufacturing company.
Transferring and adapting this concept to the healthcare sector allows to measure the
performance of internal supply chain processes and to develop a rational, systematic
and transparent decision-support tool.
Although similarities exist between healthcare delivery and maintenance systems,
there are some barriers or constraints which prevent a simple ‘copy-paste’ of SCM
solutions that prove successful in production-oriented settings. Discovering and
examining these challenges can turn them into opportunities to achieve efficient
healthcare logistics by using rigorous quantitative methods.

INTRODUCTION
11
According to Zhong et al. (2017), many factors drive up the level of complexity in the
healthcare supply chain, making them unique. These unique features are the
unpredictable nature of its processes, the central role of patients, fragmented
responsibilities, etc. which will be discussed further in Section 3.1.1. Jarrett (1998) and
McKone-Sweet et al. (2005) investigate barriers that hinder the implementation of
supply chain initiatives in hospitals, such as poor reliability of data, lack of decision-
making models, lack of common standards on product identification (i.e. Global Data
Synchronisation Network or GDSN), lack of cross-functional integration, high degree
of resistance to change, etc. Nachtmann and Pohl (2009) indicate lack of integration
due to lack of a collaborative framework among supply chain partners as the major
obstacle in achieving cost-effective, standardized processes in hospitals. Melo (2012)
states lack of decisions support tools, underestimation of logistics impact, divergent
stakeholder interests and lack of coordination between hospital departments to be the
major issues when implementing effective SCM. Finally, multi-disciplinary research
efforts are required to improve healthcare systems. Participation of researchers or
experts from various areas, whether they are from commercial, manufacturing or
healthcare sectors, allows for knowledge and experience transfer of supply chain
fundamentals and concepts to the healthcare delivery system (Kwon et al. 2016; Zhong
et al. 2017).
1.2 Problem statement
Value-based healthcare is a hot topic in the healthcare sector, driving healthcare
organisations towards increasing efficiency and thus decreasing costs, without
sacrificing high-quality patient outcomes. Accordingly, the Triple Aim strategy
introduced by IHI “unites the pursuit of lower cost with the pursuit of better health and
care, which is totally consistent with the modern definitions of ‘quality’ in most sectors
of the economy” (Whittington et al. 2015). Globally, healthcare definitely needs to do
more with less, which provides opportunities for classical OR/OM topics. Especially
SCM becomes a primary target for efficiency improvements in hospitals. A well-
coordinated supply chain adopts quantitative modelling techniques and advanced
information technologies to reduce the ever-increasing healthcare expenditures
(Feibert 2017). In this dissertation, the internal supply chain is of interest, as it is stated
to be the weak link in supply chain integration compared to external SCM, with VMI
or Electronic Data Interchange (EDI) as popular research topics (Landry and Philippe
2004).
CHAPTER 1
12
High-quality patient care can only be delivered together with effectively managed
logistics processes to ensure supply availability in the most efficient way. This
interrelationship between primary patient care and secondary logistics services will
influence the overall performance of the hospital (Feibert 2017; De Vries 2011).
However, literature rarely addresses to what extent logistics activities contribute to the
healthcare delivery system (Nachtmann and Pohl 2009). The increasing importance of
SCM in healthcare also raises the need for suitable decision support. A decision-
support model is a simplified representation of reality, allowing to capture the essence
of problems in well-specified models. Given the complexity of hospital logistics
processes, a decision-support tool provides a systematic approach to translate objective
and subjective data into insights to drive decision making and implementation, where
information technology acts as an important enabler. However, most decision making
is based on intuition of a particular decision-maker without using any support system.
One important objective relates to evaluating logistics improvement initiatives, which
requires the ability to measure the performance of internal supply chain processes. The
literature review by Volland et al. (2017) points to investigating performance metrics
in hospital logistics as an interesting research opportunity. However, lack of
coordinated SCM and multiple definitions for ‘quality of care’ due to conflicting goals
among stakeholders are two major obstacles to performance measurement in a
healthcare setting (De Vries and Huijsman 2011), which indicate the need for
developing a rigorous healthcare logistics performance management framework.
1.2.1 Research motivation
SCM in the healthcare sector is less explored and less mature compared to
manufacturing. Hence, it is a great opportunity to fill gaps in literature and practice by
analysing logistics operations in healthcare. Ever-increasing costs drive hospitals to
reengineer their processes from a logistics perspective and rationalize expenses while
improving the patient experience of care and the health of the overall population as a
balancing exercise in the Triple Aim initiative. Addressing these goals on a global
scale requires a systematic methodology that allows to structure and understand
problem settings, defines operational measures to support decision making on all
organisational levels, while it enables flexibility in order to customize to context-
specific conditions (Berwick et al. 2008). However, logistics has long been overlooked
which results in a lack of understanding of the impact of logistics on value-based
healthcare. Measuring the performance of the supply chain is fundamental to identify

INTRODUCTION
13
and address deficiencies in the logistics flow, and it serves as a good input for
managerial decision making. Furthermore, coordinating a process reengineering
project in a hospital requires bringing together all stakeholders involved from various
departments, and thus results in solving a multi-level multi-actor performance
management problem. Stakeholders often work independently in silos, striving
towards different objectives due to different backgrounds and thus complicate the
definition of efficiency management. The workforce element, considered as the fourth
goal in the Quadruple Aim strategy, needs to be taken into account by improving
stakeholder education and training to improve more informed decision making, which
promotes stakeholder commitment in order to have an impact on overall health system
performance. The main motivation for this research is therefore related to solving the
challenge of fragmentation in the internal hospital supply chain when adopting
logistics concepts from other industrial sectors.
The framework is tested at the Operating Theatre (OT). The OT is the financial hub of
any hospital, making cost awareness and maximizing efficiency especially important
(Rothstein and Raval 2018). According to Weiss et al. (2016), operating rooms account
for about 60% of total hospital costs, and the logistics costs are responsible for 30% of
total hospital expenditures (Feibert, Andersen, and Jacobsen 2017). However, the OT
has never been held accountable for supply costs and hence, medical-surgical supplies
are duplicated in many stocking areas and high supply availability rates are maintained
through overstocking supplies according to a “nice-to-have” principle, rather than
“need-to-have” (Camp et al. 2014). Gitelis et al. (2015) investigate surgeon education
and show a 10% decrease in costs of disposable supplies for laparoscopic
cholecystectomy with annual savings of $27,000. Disposable supplies represent the
majority of inventory value and volume compared to other hospital inventories, and
they require the highest workload from logistics personnel as they are stocked in
multiple locations (Ahmadi, Masel, and Hostetler 2019; Melson and Schultz 1989).
Therefore, disposables are selected as the subject of this study. Moreover, at the OT,
the quality of surgical procedures heavily relies on processes that align patients,
hospital resources (e.g. infrastructure, supplies, and personnel planning) and related
information flows. The risk of non-availability of supplies must be minimized, while
inventory managers aim to minimize costs at the same time. Solving this main trade-
off between service level and inventory cost is crucial to improve efficiency and
eliminate waste. Finally, implementation of advanced technologies, such as RFID or
barcoding, and standardization efforts (i.e. GS1 standards) can increase the efficiency

CHAPTER 1
14
of the supply chain through productivity gains for logistics processes, inventory
shrinkage and cost savings (Bendavid and Boeck 2011). The ultimate goal is to achieve
“a well-coordinated system that delivers care with great efficiency and quality, at
reasonable cost, matching the resources for care to where (and when) they are needed
most” (Hall 2012).
1.2.2 Research questions
The overall aim of this dissertation is to develop a rigorous decision-support
framework for healthcare SCM decision making and to identify the value of logistics
and potential efficiency gains, especially when multiple stakeholders are involved.
Simply stated, logistics can be described as moving stock, or in other words, efficiently
handling and coordinating flows of materials among different supply chain entities
(Rossetti et al. 2012). The five rights of logistics call for the availability of the right
goods and services to the right place at the right time in the right quantity and at the
right price (Melo 2012).
In particular, the framework drives internal hospital supply chain practices to better
understand the system, to explore several logistics policies, to evaluate the impact of
logistics policies on overall performance and to have a more integrated healthcare
supply chain by accounting for multiple stakeholder’s perspectives and thus
facilitating group decision making. “Decision aids do not guarantee perfect decisions
but when appropriately used they will yield better decisions on average than intuition”
(Hogarth 1980).
Based on the problem situation and the goal statement, we investigate the following
overall research question (RQ):
To answer the overall RQ, different work modules need to be solved according to the
steps for creating a hospital logistics decision-support framework. The framework
development consists of four main modules, which are addressed throughout the
different chapters in this dissertation. Four research questions and underlying sub-
questions have been formulated while considering the modular logic. The first module
initiates the procedure for developing the framework. Measuring the supply chain
“How to develop a decision-support framework to guide hospitals in adopting
SCM practices to improve performance of the internal hospital supply chain
according to the stakeholders’ preferences?”
f

INTRODUCTION
15
performance is critical to identify and address inefficiencies in logistics operations
which drive up costs. Moreover, it serves as a valuable input for transparent,
managerial decision making. Therefore, an extensive literature search is conducted
together with expert knowledge in order to find relevant indicators for measuring
performance in a healthcare logistics context. As our focus is on logistics processes
within the boundaries of the hospital, the indicators reflecting the performance of
inventory management and internal distribution processes are considered. Hence, the
first RQ1 is formulated as:
RQ 1 - “What is the state-of-the-art to measure performance in internal healthcare
logistics?”
With the literature review, we aim to provide a list of indicators for healthcare SCM
within the scope of this dissertation. This list forms the foundation for building the
logistics performance management framework. The framework provides guidelines for
translating logistics objectives into relevant indicators in order to select appropriate
inventory or distribution policies according to the overall hospital strategy. Multi-
Criteria Decision Making (MCDM) is applied as a useful OR/OM tool to select KPIs
and prioritize among improvement initiatives (Danas et al. 2006). The main advantage
of MCDM is its ability to evaluate both quantitative and qualitative criteria by
considering stakeholders’ judgments. However, only few studies consider the
usefulness of multi-criteria approaches in healthcare SCM. This module aims at
delivering new insights into the field of healthcare logistics decision making by
creating an initial prototype of the framework. Solving the second module will provide
an answer to the second RQ2:
RQ 2 - “How to prioritize among logistics objectives and KPIs to measure the impact
of logistics processes on the internal hospital supply chain?”
A major issue in hospital SCM relates to implementing the appropriate inventory and
distribution policy by answering where items should be stored, and when and how
much should be replenished. Current logistics parameters are missing or tend to be set
based on experience rather than evidence-based (Nicholson, Vakharia, and Selcuk
Erenguc 2004; Rappold et al. 2011). Typically, hospitals carry large amounts of
inventory, resulting in a relatively small number of deliveries and high inventory
holding costs (Rossetti 2008). Therefore, the third module provide empirical evidence
for parameter setting, policy decision making and performance monitoring in terms of

CHAPTER 1
16
inventory management and distribution. The OT in the university hospital UZ Leuven
serves as a study design to apply the prototype of the framework. The third RQ3
summarizes the objectives of this work module:
RQ 3 - “How to improve the performance of hospital logistics processes in terms of
inventory and distribution systems?”
This research question can be further divided into two sub questions:
3a) “What are optimal inventory parameters and the appropriate policy for
holding items, depending on different item characteristics?
3b) “What is the best distribution strategy for moving disposable supplies to
point-of-care locations?”
By going through modules 1 to 3, hospital managers gain deeper insights in how
logistics contribute to value-based healthcare by quantifying the impact of inventory
and distributions systems. The policies are evaluated from a logistics point of view, as
only one logistics-minded stakeholder is involved in the KPI prioritization process.
However, stakeholders at different stages of the supply chain have misaligned
incentives, pursuing different objectives and thus complicate priority setting and policy
decision making. The initial prototype of the framework increases awareness of the
significant share of logistics when improving overall performance. The final module
extends this prototype to a general logistics performance management framework by
including multi-level, multi-stakeholder validation. The prototype enables
stakeholders to make informed decisions to define what is important for efficiency
management and how different logistics policies impact the performance by
quantifying trade-offs and thus reducing uncertainty in the decision-making process.
Moreover, this module addresses the possibility of bias that comes with a single
decision-maker’s attitude and generalizes the findings to a wider healthcare context.
Finally, the current state of performance measurement is explored, generating insights
into benchmarking opportunities and advice for improving efficiency with a focus on
materials management. The final RQ4 is formulated as:
RQ 4 – “How do conflicting stakeholders’ perspectives impact healthcare logistics
performance?”

INTRODUCTION
17
1.3 Structure of the dissertation
This dissertation continues by explaining the methodology for developing the
healthcare logistics framework in Chapter 2, together with an overview of the relevant
industrial engineering techniques used in this work and a note on data collection. The
remainder is organised following the modular build-up of the framework (see Figure
1-2):
Chapter 3 initiates the development procedure by introducing the unique
challenges of SCM in healthcare and providing a state-of-the-art overview of
performance indicators relevant to healthcare logistics. The chapter concludes
with identifying research opportunities and contributions from both an
academic and practical point of view.
In Chapter 4, we describe the framework foundation. MCDM is introduced
as a suitable decision-support technique for selecting and prioritizing among
performance indicators. A prototype has been developed and tested for one
hospital department. Finally, we propose different methods to deal with
challenges inherent in any MCDM study.
Chapter 5 represents the third module of the framework. The prototype, as
developed in Chapter 4, is tested using several case studies. The case studies
differ with respect to the nature of the logistics processes, and therefore we
prove the generalizability of the findings of the prototype to specific contexts
addressing multiple logistics needs. In this dissertation, the prototype is
applied to support policy decision making and determine operational
parameter values for inventory and distribution systems in the operating
theatre. In addition, physician preference card management is discussed as an
interesting opportunity to strive towards standardization and increased cost
awareness among hospital stakeholders.
Chapter 6 introduces two feedback loops to extend the prototype into a
general healthcare logistics performance management framework by
integrating multi-level, multi-stakeholder perspectives. The framework is
checked for robustness and validity, and potential benchmarking
opportunities are identified. The chapter concludes with practical
implications to enhance implementation of the findings.

CHAPTER 1
18
A critical reflection on the framework is given in Chapter 7. We present the
framework, how the modules relate to each other as well as an example of a real-world
application of the framework at the OT. In addition, a roadmap to implement the
framework in different healthcare logistics contexts is provided, where the modules
are generic in nature but the content of the modules can be customized to the studied
application.
Finally, Chapter 8 provides future implications of the digitalization trend on
healthcare SCM and Chapter 9 states the major conclusions.
Figure 1-2. Outline of PhD dissertation.

19
CHAPTER 2
2 Methodology
This chapter describes the methodology followed to design the
healthcare logistics performance management framework. A case study
research design is chosen to empirically test the framework. Thereafter,
a comprehensive overview is provided of the industrial engineering tools
relevant for this dissertation. We end with a note on data collection in
healthcare logistics.
2.1 Framework development procedure
In this dissertation, we use a modular approach to develop a healthcare logistics
performance management framework following an iterative procedure similar to the
PDCA-cycle – Plan, Do, Check and Act. The purpose is to design a decision-support
tool that evaluates various logistics policies to find efficiency improvement
opportunities for the specific problem context. An overview of the methodology is
presented in Figure 2-1. The PDCA cycle is a tool to monitor the quality of
improvements within an organisation. Due to its cyclical feature, it supports the idea
of continuous improvement. Planning is the first step, focusing on improving processes
by defining objectives, indicators and the available resources. Translated to our
framework, the planning step corresponds to the first and second module and thus has
a two-fold objective:
A state-of-the-art overview is requested to select logistics objectives and
indicators to measure the performance of the internal hospital supply chain.

CHAPTER 2
20
Relationships between the performance indicators are identified and priorities
are established using MCDM techniques.
In this initialization stage, a prototype is tested for one hospital department, namely
the OT, and only involves one stakeholder – the OT logistics manager. Hence, the KPI
prioritization in the prototype is determined from a logistics viewpoint as this
stakeholder is most impactful and knowledgeable when defining the role of logistics
services, which has often been overlooked in healthcare.
Next, module 3 is represented by the Do and internal Check stage, which aim to collect
relevant information, test improvement initiatives and compare the results to the ideal
situation. The prototype is applied to several case studies in order to test different
logistics policies and analyse parameter values for the relevant KPIs. This dissertation
mainly focuses on management areas such as inventory and distribution to point-of-
care locations in order to find efficiency opportunity gains. Case studies are chosen as
research design to explore and provide a proof-of-concept of how simulation and other
industrial engineering techniques are relevant to a healthcare setting. In particular, the
prototype is applied to UZ Leuven and uses the OT as a primary study setting because
it is a critical department to any hospital with regard to resource utilization and cost-
effectiveness. Simulation is the recommended tool to understand the behaviour of the
current system, visualize the inventory and distribution systems and perform a scenario
analysis to find the most efficient supply chain organisation.
In addition to the internal check, three external feedback loops are incorporated to
extend the prototype to a general framework, considering a broader perspective (i.e.
module 4):
The first loop is related to the sample size of the prototype. Since the attitude
of a single decision-maker may be biased, multiple stakeholders need to be
incorporated to validate the impact of logistics on value-based healthcare. The
dispersed logistics responsibility among several departments asks for a multi-
level, multi-stakeholder framework validation by iterating between the
indicators and solving challenges inherent in a MCDM study, such as
conflicting priorities between stakeholders.
A second feedback loop enables iteration in the policy decision-making
process. The prototype proves that importance of logistics in healthcare can
no longer be neglected and stakeholders gain deeper insights into operational

METHODOLOGY
21
processes resulting in adapted policies and quantification of trade-offs from
different stakeholder viewpoints based on the framework.
Third, a benchmarking iteration is added to gain insights in how the current
way of monitoring performance deviates from optimal performance
management. Overall, the framework provides a good foundation for
evaluating performance between different hospitals or departments by
ensuring uniform performance measurement. Moreover, the framework is
extended to other logistics processes to enhance generalizability of the
findings and striving towards an integrated hospital supply chain.
Finally, the acting step involves making adjustments to solve deviations from the
desired output. Actions based on the framework involve procedures for implementing
efficient inventory and distribution policies. Identifying SCM implementation paths
based on the framework by combining performance measures and stakeholder
information enhances trust building in the findings.
Altogether, the well-known PDCA-cycle has been extended to a P²DC²A-cycle, with
a two-fold function for the planning and checking step, in order to construct a
healthcare logistics performance management framework that stimulates continuous
improvement.
Figure 2-1. Overview of the P²DC²A methodology.
CHAPTER 2
22
2.2 Healthcare logistics toolbox
This PhD research contributes to the field of OR/OM to develop a healthcare logistics
performance management framework that supports decision making. A comprehensive
overview of tools included in this framework is given in this section. We focus on the
logistics processes within the hospital’s boundaries, reflecting the internal hospital
supply chain; more specifically several case studies are selected to test different
logistics policies for storing and distributing the materials from central storage rooms
to point-of-use locations.
2.2.1 Case study research design
The applicability of the healthcare logistics performance management framework is
demonstrated using case studies for evaluating inventory control and distribution
systems at the OT department. Case studies are chosen as research design to investigate
the problem in a real-life setting and to bridge the gap between theory and practice by
adopting effective SCM in healthcare which is still lacking maturity compared to other
industrial sectors. Therefore, we aim to explore and provide a proof-of-concept of how
industrial engineering tools are relevant to a healthcare logistics problem.
The case findings provide empirical evidence to support existing knowledge, gain new
insights for healthcare SCM and enhance evidence-based decision making. Moreover,
we prove the generalizability of the framework by addressing multiple logistics needs.
Although the case studies differ with respect to the nature of the logistics process, a
systematic approach and reference platform are developed to reproduce the framework
and generate fruitful insights to healthcare policy makers, managers and executives to
expand the framework to a hospital-wide level. We provide a roadmap to implement
the framework in different settings:
First, case studies are selected to structure the problem (e.g. relationships
between criteria, data requirements for modelling), improve understanding
and increase awareness of SCM in healthcare. In this work, we use the
inventory and distribution processes as an example based on a discussion with
the logistics manager at the OT and the potential for providing efficiency gain
opportunities.

METHODOLOGY
23
Second, the cases are evaluated from multiple logistics perspectives to
enhance stakeholder commitment and ensure more informed decision making
in terms of SCM.
Finally, a reference framework is presented that delivers a blueprint to
identify process improvements across case studies and can be customized to
multiple departments, processes or hospitals as an orchestrator for supply
chain integration in healthcare.
The case studies are inspired on existing logistics concepts described in literature and
successfully applied in many industrial sectors. However, these tools are not ready-
for-use in practice-based applications and thus need adaptation to the unique
characteristics of the internal hospital supply chain (Melo 2012; Volland et al. 2017).
The OR/OM tools are not applied as routinely in healthcare because they are not part
of the management toolbox. In this dissertation, we identify the need for a
methodological approach and provide a comprehensive overview of the tools and data
requirements to adopt SCM in healthcare.
2.2.2 Overview of OR/OM tools for healthcare SCM
OR/OM is a broad collection of analytical tools and plays a key role in bringing
objectivity in decision making and promoting data-driven process improvement. In
this dissertation, we aim to develop a decision-support tool to analyse how logistics
contributes to value-based healthcare and address the barriers to effective SCM by
integrating a toolbox into a healthcare logistics performance management framework.
The included tools originate from industrial engineering applications, such as
performance management, MCDM methods (e.g. ANP, PROMETHEE), simulation
modelling (e.g. DES) and SCM concepts. Figure 2-2 displays how the tools are
connected to develop the framework. More information on the tools can be found
below the figure.

CHAPTER 2
24
2.2.2.1 Performance management
Developing an effective framework for performance management and gathering
logistics data to show its impact on overall hospital performance is an interesting
research opportunity. Volland et al. (2017) points to identifying performance metrics
in healthcare logistics and to transferring OR/OM tools from industrial to healthcare
problems. However, the different expectations and possibly conflicting goals between
multiple stakeholders involved in the hospital supply chain complicate the
performance definition. As no single measure can represent every aspect of operational
excellence, we develop a multi-dimensional performance management framework that
can assist healthcare organisations in translating the strategic or tactical goals into
operational indicators to ensure perfect alignment between strategy and execution,
while striving towards maximal value creation (Melnyk, Stewart, and Swink 2004).
Moreover, an effective performance management framework allows to incorporate
feedback relationships between indicators, make adjustments to solve deviations from
the desired outcome and encourage continuous improvement, and therefore our
framework is considered to be dynamic when making the healthcare supply chain
future-proof (Yadav, Sushil, and Sagar 2013). In addition, the framework aims to fill
the literature gap by proposing an approach for selecting and prioritizing performance
metrics as well as addressing the unique obstacles to effective SCM in healthcare.
Figure 2-2. Overview of the healthcare logistics toolbox.

METHODOLOGY
25
2.2.2.2 MCDM
MCDM encompasses a wide range of quantitative methods to solve selection and
prioritization problems because it utilizes quantitative and qualitative information,
accounts for multiple objectives and makes the decision process more explicit, rational
and transparent (Adunlin, Diaby, and Xiao 2015; Beck and Hofmann 2014).
Table 2-1 provides an overview of the most frequently applied MCDM methods in
healthcare (Adunlin et al. 2015; Velasquez and Hester 2013), and for each method the
benefits and drawbacks are discussed (Jorissen 2018). Choosing the appropriate
method requires a careful selection process such that it is suitable to the problem type,
the desired output and decision-makers’ preferences. Moreover, the robustness,
consistency and transparency of the method should be guaranteed. In this work, the
desired outcome of applying MCDM is a prioritization of KPIs, which constitute the
core elements when defining operational excellence in healthcare SCM. The nature of
the problem does neither recommend the application of TOPSIS as we are interested
in identifying the ideal result rather than using it as input, nor the application of
outranking methods, such as PROMETHEE and ELECTRE, as precise values for
indicator weights are requested. MAU(V)T and AHP/ANP are the remaining methods
which enable to synthesize preferences across indicators into a quantitative score. The
former method, however, is data-intensive to create utility/value functions, which is
difficult to obtain in a healthcare setting. The latter methods structure the problem into
respectively a hierarchy or network form and use pairwise comparisons to select
relevant performance indicators, assign weights by eliciting stakeholder preferences
and assess alternatives by trading off KPIs to create an overall value score (Marsh et
al., 2014). Moreover, AHP/ANP allows for group decision making by aggregating
individual preferences which improves the robustness of the framework. Since the
decision needs to account for interdependency relations between indicators, AHP
would oversimplify the problem. ANP is a generalization of AHP and is the most
suitable approach to the formulated research problem as it can deal with complexity
inherent in the hospital environment by taking into account interdependencies.
The methods discussed above are the most commonly used MCDM methods found in
healthcare literature. However, other methods using pairwise comparisons are
available, such as MACBETH (Bana E Costa, De Corte, and Vansnick 2012) or
PAPRIKA (Hansen and Ombler 2008), which are both additive multi-attribute value
measurement models.

CHAPTER 2
26
Tab
le 2
-1. C
om
par
ison
of
MC
DM
met
hod
s u
sed i
n h
ealt
hca
re (
Rep
rinte
d f
rom
Jori
ssen
(2018))
.
Meth
od
W
ork
ing
prin
cip
le
Pro
ble
m
Ad
van
tag
es
Dis
ad
van
tag
es
Refe
ren
ces
Anal
yti
c H
iera
rchy
Pro
cess
(AH
P)
Hie
rarc
hy
Pai
rwis
e co
mpar
iso
ns
(1-9
sca
le)
Pri
nci
pal
eig
env
ecto
r m
eth
od
Ran
kin
g
Qu
alit
ativ
e an
d
qu
anti
tati
ve
Eas
y-t
o-u
se
Tra
de-o
ff b
etw
een
con
flic
ting
obje
ctiv
es
Inco
nsi
sten
cy r
atio
Ran
k r
ever
sal
Mar
sh e
t al
.,
20
14
Saa
ty,
19
90
Saa
ty,
19
96
Anal
yti
c N
etw
ork
Pro
cess
(AN
P)
Sim
ilar
to
AH
P,
bu
t net
wo
rk i
s co
nst
ruct
ed
rath
er t
han
hie
rarc
hy
Acc
ou
nt
for
inte
rdep
end
ency
rel
atio
ns
Ran
kin
g
Sim
ilar
to
AH
P
Inte
rdep
end
enci
es
Sim
ilar
to
AH
P
Co
mp
lex
cal
cula
tio
ns
Saa
ty a
nd
Var
gas
, 2
00
6
Mar
sh e
t al
.,
20
14
Mu
lti
Att
ribu
te U
tili
ty
(Val
ue)
Th
eory
(MA
U(V
)T)
Sin
gle
uti
lity
or
val
ue
fun
ctio
n t
o d
eriv
e
per
form
an
ce o
f al
tern
ativ
es f
or
each
cri
teri
on
Ass
ign w
eigh
ts a
ccord
ing
to r
elat
ive
imp
ort
ance
Co
mb
ine
into
ov
eral
l u
tili
ty o
r val
ue
funct
ion
Ran
kin
g
Ch
oic
e
Eas
y t
o u
nd
erst
an
d
Rel
ativ
e im
port
an
ce o
f
each
att
ribu
te
Un
cert
ain
ty i
s ta
ken
into
acc
ou
nt
Dat
a-i
nte
nsi
ve
and
tim
e-c
ost
ly t
o d
eriv
e
uti
lity
or
val
ue
fun
ctio
ns
Mar
sh e
t al
.,
20
16
Pre
fere
nce
Ran
kin
g
Org
anis
atio
n M
eth
od
for
Enri
chm
ent
Eval
uat
ion
(PR
OM
ET
HE
E)
Pre
fere
nce
fu
nct
ion
s base
d o
n p
airw
ise
com
par
ison
s o
f al
tern
ativ
es a
gai
nst
cri
teri
a
Wei
ghts
are
ass
ign
ed b
y d
ecis
ion
mak
er
Ran
kin
g
No s
cali
ng
eff
ects
Red
uce
d
inco
mpar
abil
ity
Use
r fr
ien
dly
Sim
ple
im
ple
men
tati
on
No c
lear
str
uct
ure
for
dec
isio
n p
rob
lem
Su
bje
ctiv
ity w
hen
assi
gn
ing w
eig
hts
Ran
k r
ever
sal
Pir
das
hti
et
al., 2
01
1
Beh
zadia
n e
t
al., 2
01
0
Eli
min
atio
n a
nd C
hoic
e
Tra
nsl
atin
g R
eali
ty
(EL
EC
TR
E)
Pai
rwis
e co
mpar
iso
ns
to c
on
stru
ct o
utr
ank
ing
rela
tio
ns
Ex
plo
itat
ion p
roce
du
re t
o e
lab
ora
te
reco
mm
endat
ion
s fr
om
th
e in
itia
l o
bta
ined
resu
lts,
dep
end
ent
on
the
pro
ble
m t
ype
(ran
kin
g,
choic
e or
sort
ing p
rob
lem
)
Ran
kin
g
Ch
oic
e
Sort
ing
Qu
anti
tati
ve
and
qu
alit
ativ
e
Sim
ple
log
ic
Sy
stem
atic
com
pu
tati
onal
pro
cedu
re
No a
xio
mat
ic
assu
mpti
on
s
All
oca
tio
n o
f w
eig
hts
by
dec
isio
n m
aker
No c
om
ple
te r
ank
ing
of
alte
rnat
ives
Bla
ck b
ox
Pir
das
hti
et
al., 2
01
1
Tec
hn
iqu
e fo
r O
rder
Pre
fere
nce
by
Sim
ilar
ity
to I
dea
l
Solu
tio
ns
(TO
PS
IS)
Ch
oo
se a
lter
nat
ive
as
clo
se a
s p
oss
ible
to i
dea
l
solu
tion
(m
axim
um
sco
re o
n a
ll c
rite
ria)
and
as
far
as
po
ssib
le f
rom
neg
ativ
e-i
dea
l so
luti
on
(min
imu
m s
core
)
Ch
oic
e
No r
ank
rev
ersa
l
Ver
y q
uic
k
Def
ine
bes
t an
d w
ors
t
case
fo
r al
l cr
iter
ia
Les
s acc
ura
te
Pir
das
hti
et
al., 2
01
1

27
2.2.2.3 Simulation modelling
Simulation has become an indispensable tool for various sectors, ranging from
automobile industry to construction, in order to achieve streamlined operations and
reduce costs. In the healthcare sector, however, we see limited application of SCM
simulation due to the unique challenges, such as inaccurate data collection and logistics
fragmentation. Technological enablers (e.g. RFID scanning or Artificial Intelligence)
will play an important role in future research to increase visibility throughout the
supply chain and capture data to improve decision making.
In general, simulation models are classified along three dimensions (Kelton, Sadowski,
and Zupick 2015): static or dynamic, continuous or discrete, and deterministic or
stochastic.
Most operational models are dynamic, as time plays a natural role in decision
making.
The system’s state can only change on certain times when events take place
in discrete models, whereas it changes every moment in continuous models.
Models operate with random or fixed inputs in respectively stochastic or
deterministic models. Stochastic models incorporate probability distributions
to account for random input.
Different types of simulation, which are applicable in a healthcare setting, are briefly
described and an overview is provided in Table 2-2.
Discrete-Event Simulation (DES) is preferred for operational and tactical studies to
model individual occurrences at particular time intervals, changing the state of the
system. The model is developed by using several components, such as entities,
attributes, global variables, resources, queues, etc. (Karnon et al. 2012). The internal
simulation clock jumps from event to event, and in-between events the system remains
stationary. The main advantages of DES are its flexibility, modularity in model
building, user-friendly animation of modelled flows, incorporation of stochastic
factors, individual patient or item focus, etc. (Gunal 2012).
Second, Monte Carlo (MC) simulation is a stochastic modelling type, though it
typically has a static character in contrast to the dynamic nature of DES (Wasserstein
and Fishman 2006). The models use random generators instead of a time dimension.
MC simulation is also called spreadsheet simulation as it is a numerical method in
spreadsheet form (e.g. MS Excel) which shows only input and output streams based

CHAPTER 2
28
on discrete events (Mielczarek & Uziałko-Mydlikowska, 2012). Typical examples of
this approach are evaluating the cost-effectiveness of medical treatments or assessing
health risks (Katsaliaki and Mustafee 2011).
In contrast to DES, System Dynamics (SD) is generally a deterministic and continuous
simulation approach, where time and system state are constantly being tracked. As a
consequence, the required computing power and model complexity increase. SD is
specifically designed to incorporate the relationship between many system elements,
using feedback loops, to examine how strategic decisions impact the dynamic
behaviour of the system and to reveal future trends. The models require a holistic view
and interactions between elements, rather than focusing on individual objects
(Brailsford et al. 2004). Therefore, these models are designed for macro-level
healthcare modelling (e.g. capacity decisions, healthcare infrastructure) and evaluating
cause-and-effect relationships in a system (Gunal 2012; Rohleder, Cooke, et al. 2013).
Finally, Agent-Based Simulation (ABS) is the most recent technique for modelling the
actions and interactions of autonomous individuals, also called agents, in a network to
assess the effects of these agents on the system as a whole (Gunal 2012; Katsaliaki and
Mustafee 2011). “Unlike entities in traditional simulation techniques, agents are
capable of making independent decisions and showing active and social behaviours”
(Abukhousa et al. 2014). However, the use of ABS in healthcare and other sectors is
not yet widespread. Typical examples of ABS in healthcare are devoted to problems
such as natural disasters (e.g. infectious disease outbreaks) (Katsaliaki and Mustafee
2011; Marshall et al. 2015).
Table 2-2. Comparison of simulation methods.
DES SD ABS
Nature Stochastic Generally deterministic Stochastic
Focus Individual level (process) Aggregate level Individual level (agent)
Complexity Detailed complexity
No interactions
Holistic view
Interactions
Interactions
Level of
modelling
Micro Macro Macro and micro
Purpose Decision support:
optimization and
comparison
Policy making: gaining
understanding
Human behaviour
modelling
Healthcare
applications
Planning of healthcare
services
Health economic models
Public health policy
evaluation
Modelling healthcare
systems and infrastructure
Spread of epidemics
Examples of
software
packages
Arena, Simulink, etc. AnyLogic, Simulink, etc. AnyLogic, Simulink, etc.

METHODOLOGY
29
Choosing the appropriate simulation model depends on the system as well as the
purpose of the model. Marshall et al. (2015), Mielczarek and Uziałko-Mydlikowska
(2012), Brailsford et al. (2019), Brailsford and Hilton (2001), Tako and Robinson
(2009) and Majid et al. (2016) compare different simulation methods. Since the
problem under study requires a dynamic character, MC simulation is excluded from
the comparison in Table 2-2. DES has been suggested as a powerful approach for
supply chain managers and is widely used for inventory and distribution modelling in
spare parts management (Hu et al. 2018). It also has great potential to be accepted in
healthcare facilities due to its flexible approach (Kuljis, Paul, and Stergioulas 2007;
Rego and Sousa 2009; Rytile and Spens 2006; Thorwarth and Arisha 2009; Zhang
2018). Literature suggests that SD and DES are the most suited techniques for
modelling logistics processes (Babulak and Wang 2012). According to Tako and
Robinson (2012), SD is better suited for solving problems at a strategic level, whereas
DES is more appropriate for solving operational-level problems. Because the subject
of this study is determining parameter values and measuring performance of inventory
and distribution systems, the simulation model should support the decision-making
process at a more detailed level to gain operational insights, which makes the use of
SD modelling approach overly complex. Moreover, the importance of tracking
individual items is necessary to collect information on consumption, stock-outs,
inventory accuracy, etc., and variability in specific attributes of entities is requested.
Since there is no need for modelling active objects nor interaction among items, ABS
is inappropriate in this case. Therefore, DES is chosen in this dissertation to study the
integration of healthcare logistics processes on a micro-level.
2.2.2.4 SCM interventions
Healthcare SCM consists of a variety of logistics tools for inventory control,
distribution, purchasing, demand planning, information systems, etc. In this work, we
use case studies to apply the framework to the processes of storing and distributing
medical materials in order to ensure that the right items are available at the right time
and right place, as efficiently as possible. Different scenarios can be evaluated by
changing logistics policy parameters, such as maximum inventory level, reorder point,
reorder quantity, inventory location, replenishment time, etc. In consultation with the
OT logistics manager, alternative logistics policies are formulated to test potential
improvement initiatives without the need for physically implementing the changes. In
future work, the framework can be extended to include other managerial areas, such as

CHAPTER 2
30
exploring how logistics processes, stakeholders and information technology systems
can be connected to achieve standardization and integration.
By combining ANP and DES, we provide a sound basis for performance management
in healthcare. We introduce the hybrid ANP-DES tool as a way of empirically testing
the framework by using case studies to experiment with SCM concepts and gain
insights into real-life problems and potential efficiency gains. DES helps to define
operations, map processes and analyse available logistics data in a structured way to
understand the current situation, identify bottlenecks and perform scenario analysis.
ANP provides a priority ranking of the KPIs while considering power and interest
relationships among multiple stakeholders. By combining both tools, we address some
unique features in healthcare logistics that complicate SCM adoption. Multiple KPIs
are evaluated simultaneously and synthesized into a multi-dimensional evaluation
score, which we call the Internal Logistics Efficiency Performance (ILEP) index. The
ILEP index is thus the overall outcome of the hybrid ANP-DES tool and allows to
quantify how logistics contributes to healthcare, where we strive towards operational
excellence by trading-off multiple objectives and identifying efficiency gains.
2.2.2.5 Robustness check
In the final module of the framework development procedure, two MCDM methods
are combined into a hybrid ANP-PROMETHEE tool to ensure the robustness of the
framework and guarantee transparent decision support. PROMETHEE as a standalone
method is not recommended in this research because it lacks a weighting procedure.
In the hybrid tool, PROMETHEE complements ANP which analyses the structure of
the performance management problem and establishes KPI weights, whereas
PROMETHEE is a user-friendly outranking method that provides a complete ranking
of various SCM policies by identifying the characteristics of the best policy for the
studied application. Outranking methods utilize the concept of dominance between
preference functions of alternatives and have a non-compensatory character (i.e.
alternatives are downgraded if they perform poorly on one indicator) (Thokala et al.
2016). In Chapter 6, we will examine similarities and differences between the ILEP
index (i.e. only taking into account the ANP weights) and the hybrid ANP-
PROMETHEE tool to find a consistent preference order of the logistics policies.

METHODOLOGY
31
2.2.3 Data collection
A well-known challenge in addressing any healthcare SCM problem relates to the
scarcity of accurate logistics data. The output is unlikely to be informative if incorrect
data is inserted in the framework. Therefore, data requirements are critical for selecting
the appropriate OR/OM tools. Simulation tools allow to develop a proof-of-concept by
constructing a more abstract model using a limited amount of input data, whereas
mathematical modelling is a powerful tool that heavily relies on algorithms, data and
statistics to solve optimization problems. Moreover, the goal is to find a satisfactory,
practice-oriented solution by analysing the effect of changing parameters on system
performance, rather than obtaining a non-intuitive optimal policy.
In this dissertation, both quantitative and qualitative data is collected to improve
understanding of SCM and stimulate stakeholder engagement. The quantitative data is
obtained from pairwise comparisons in the ANP method, time studies and internal
hospital logistics databases (e.g. consumption data based on scanning), whereas the
qualitative data is collected by conducting semi-structured interviews with the
involved stakeholders.
The framework development procedure starts with input from a logistics-oriented
stakeholder at the tactical level based on his background, expertise and accessibility to
logistics data in order to increase understanding of SCM in healthcare and avoid
conflicts due to biased stakeholder preferences. Next, several logistics policies are
evaluated based on scanning data, providing a first glimpse of how logistics can service
healthcare. The final step in the development procedure aims to validate the framework
by incorporating multiple stakeholder perspectives. Building on the initial logistics
prototype, viewpoints from executives and managers, differing in background (e.g.
medical or logistical) are added to share findings and operational insights from the case
studies. Moreover, materials managers in three departments – OT, hospital pharmacy
and IRCC – are selected to test the framework for different material types and other
department characteristics (e.g. complexity, predictability, etc.), which possibly strive
towards different objectives. In addition, a hospital policy maker in the logistics
department is involved to extrapolate the knowledge to strategic decision making from
a holistic SCM perspective.
Altogether, the interviewees in this work represent eight stakeholders working in three
departments and representing all organisational control levels. From this qualitative
perspective, the framework stresses the importance of stakeholder education to

CHAPTER 2
32
increase logistics awareness and enhance stakeholder commitment. The findings are
relevant input to managerial and more informed decision making by facilitating the
dialogue between all stakeholders to coordinate SCM and maximize contribution to
value-based healthcare.

33
CHAPTER 3
3 Healthcare Logistics and Performance
Management2
This chapter starts by defining logistics and SCM concepts relevant for this
dissertation, as well as by describing unique features in the healthcare
supply chain. Next, performance management is introduced to initiate the
framework development procedure, followed by a state-of-the-art overview
of performance indicators for healthcare logistics. The chapter concludes
with identifying the gaps in literature and the contributions of this
dissertation.
3.1 Defining logistics in the healthcare sector
Logistics is the key enabler for reducing costs in both industrial and service
organisations. In their definition, the Council of Supply Chain Management
Professionals (2016) indicate that logistics is part of SCM:
“Logistics management is that part of SCM that plans, implements and
controls the efficient, effective forward and reverses flow and storage of
goods, services and related information between the point of origin and the
point of consumption in order to meet customers’ requirements.”
2 This chapter partially corresponds to the following paper:
Moons, K., Waeyenbergh, G., Pintelon, L. (2019). Measuring the logistics performance of internal hospital
supply chains – A literature study. Omega, 82, 205-217.

CHAPTER 3
34
This definition can be translated to healthcare logistics as:
The activities of design, planning, implementation and control of coordination
mechanisms between supplies, equipment, services and information from
suppliers to point-of-care units in order to enhance clinical outcomes while
controlling costs.
Simply stated, Abukhousa et al. (2014) define SCM in healthcare, also referred to as
healthcare logistics, as:
“The process of delivering the right products in the right quantities to the
right patient care locations and at the right time with satisfying service levels
and minimized system-wide costs.”
However, the healthcare supply chain is very fragmented with many parties involved
at various stages of the supply chain without close management control. Three key
players are identified, typically operating in silos independently from one another,
which results in badly coordinated supply chain processes (Rossetti et al. 2012):
producers (e.g. manufacturers of medical supplies, medical devices, etc.)
purchasers (e.g. wholesale distributors and GPOs)
healthcare providers (e.g. hospitals, physicians).
This dissertation focuses on the healthcare providers, where the hospital constitutes
the main entity in the healthcare supply chain. A distinction is made between internal
and external supply chain practices. The latter includes the first tier or further upstream
in the supply chain (e.g. manufacturers, distributors and GPOs), while the former
focuses on a typical healthcare provider with many internal point-of-care locations
(e.g. nursing units, operating room wards), requiring processes for receiving, put away,
storage, picking and replenishment (Rossetti et al. 2012). The missing link in supply
chain integration, as stated by Rivard‐Royer et al. (2002), promotes focusing on the
internal supply chain in the remainder of this work. The internal supply chain plays a
key role in linking logistics processes and patient care services within the hospital.
Figure 3-1 gives an overview of the external and internal supply chain for the operating
theatre department.

HEALTHCARE LOGISTICS AND PERFORMANCE MANAGEMENT
35
Hospital logistics cover a diversity of activities for both primary and secondary
processes. First, it enables patient care by coordinating care pathways and second, it
optimizes supporting processes including drug distribution, patient transportation,
materials handling, etc. These activities are managed at three levels of control:
strategic, tactical and operational level (Di Martinelly 2008). The interaction between
different control levels and management areas is summarized in a planning and control
framework as proposed by Hans et al. (2012). Strategic decisions cover long-term
hospital strategies to reach the overall hospital’s objectives and mission, such as
determining resource capacity, implementing new information technology, improving
collaboration with vendors or outsourcing of certain activities. Hospitals implementing
holistic SCM and focusing on strategic problems may realize significant benefits, such
as improved employee satisfaction, patient safety and outcomes (Lee 2011). Next, the
tactical level involves decisions concerning resource planning based on capacity,
which is determined at the strategic level, to meet demand. The tactical planning
addresses questions such as what, where, how, when and who for organising hospital
operations. Uncertainty should be reduced as much as possible in order to build a
robust planning. At the lowest level, operational decisions are made every day related
to executing processes. Examples of operational planning decisions are appointment
scheduling, inventory replenishment ordering or nurse rostering (Hall 2012). At this
level, the performance of the processes is monitored. Performance management
provides feedback by linking the strategic, tactical and operational level KPIs and aims
at shaping the efficiency and effectiveness of health service delivery (Mettler and
Figure 3-1. External and internal supply chain for the operating theatre department in hospitals.

CHAPTER 3
36
Rohner 2009). However, defining performance in healthcare logistics is complex
because different stakeholders – patients, nursing staff, doctors, management staff, and
payers – are involved with these activities. The different expectations and perceptions
of the stakeholders complicate the performance definition in healthcare.
3.1.1 Specificities in healthcare logistics
The complex character of a healthcare setting is related to its unique characteristics
and operational challenges (Melo 2012; Yanamandra 2018; Zhong et al. 2017). Figure
3-2 gives an overview of the specificities in healthcare logistics. One of the most
influential factors is unpredictability or uncertainty in hospitals. The essence of SCM
in healthcare is matching supply and demand, though accurately forecasting the
demand for supplies is a difficult task due to unforeseen epidemic conditions and lack
of accurate consumption data. In addition, the great amount and variety of items
complicate inventory management. Especially in the operating theatre, physician
preference cards increase the spectrum of items held in stock and thus hinder
standardization. Lack of item/location identification standards and automation reduce
transparency and visibility throughout the entire supply chain. Another challenge
relates to the absence of coordination between different entities of the supply chain.
The logistics responsibility is dispersed among different departments, working in silos
and thus resulting in a very fragmented healthcare supply chain. Moreover, it is
challenging to engage different stakeholders to cooperate and to embrace changes due
to their conflicting goals for efficiency management. Hospital executives and payers
strive to get more value for less costs by purchasing affordable quality items and
minimizing operational costs, whereas the doctor’s primary concern is to optimize
service quality by maximizing material availability (Belliveau 2016). Therefore, no
single measure can represent every aspect of efficiency when different stakeholders
have individual takes on performance management. Finally, the impact of logistics in
hospitals has long been underestimated due to poor understanding of healthcare SCM.
Although patient care is the core process in hospitals, logistics-related activities have
a significant impact on the quality of service as well as on hospital costs. However, the
lack of expertise in the field of OR/OM results in inefficient operation of healthcare
processes characterized by stock-outs, expired products or hoarding behaviour.
Overcoming these challenges is essential to obtain effective SCM in healthcare.

HEALTHCARE LOGISTICS AND PERFORMANCE MANAGEMENT
37
3.2 Performance management in healthcare logistics
Many industrial sectors have implemented performance management to understand
operational performance and hence achieve their strategic goals (Mettler and Rohner
2009). The current state of performance management in healthcare logistics, however,
is still at a low level of maturity due to the inherent complex nature of this setting.
Measuring performance enables piloting the hospitals towards enhancing strategic,
tactical and operational planning and it is beneficial to quality of care. Although
hospitals recognize the importance of defining logistics goals and KPIs in terms of
efficiency and effectiveness of health service delivery, the crucial link between multi-
level indicators is often ignored (Mettler and Rohner 2009). Therefore, we investigate
in this dissertation how a performance management framework guides healthcare
organisations in identifying efficiency opportunity gains while not compromising on
quality of patient care.
Section 3.2.1 presents a literature review discussing the indicators relevant for
measuring performance of internal supply chain practices in healthcare, focusing on
inventory and distribution of medical supplies to point-of-care locations. Selecting and
monitoring relevant performance metrics provides valuable input for managerial
decision making. Logistics managers need to identify opportunities to improve the
logistics processes in order to lower costs and to improve patient care quality.
Figure 3-2. Unique challenges within the healthcare supply chain.

CHAPTER 3
38
However, in order to improve the logistics processes, you must understand how the
internal supply chain is currently performing in order to identify and address
inefficiencies in the logistics activities. Performance indicators will help monitor
management policies such that the logistics department can take evidence-based
decisions that can optimize the inventory and distribution system. Currently, there is a
lack of clear and measurable cost and quality metrics for measuring hospital logistics
performance (Nachtmann and Pohl 2009). “If you don’t have data, it’s hard to get
physicians on board and aware of the expenses associated with stocking many similar
products” (Cardinal Health 2015). Volland et al. (2017) points to investigating
performance metrics in healthcare logistics as an interesting research opportunity.
With this literature review, we initiate the procedure for developing the healthcare
logistics performance management framework.
3.2.1 Literature review: Measuring the logistics performance of
internal hospital supply chains
3.2.1.1 Performance indicators for inventory management
The majority of literature is devoted to inventory management systems that reduce
stock levels in order to achieve the main objective of cost reduction. Sole cost cutting
objectives, however, do not suffice since patient satisfaction is influenced by the
perceived quality of care and prices. Hospital managers need to balance inventory
levels by trading-off between quality metrics and costs (De Vries 2011). Nachtmann
and Pohl (2009), Aronovich et al. (2010) and Hoeur and Kritchanchai (2015) develop
a set of performance measures to monitor the quality of its inventory activities,
including inventory visibility, inventory availability, stock-out rates, inventory
accuracy rate, stock wastage due to expiration or damage, etc. Supply availability is a
crucial factor in a healthcare logistics system’s ability to support patient care processes
(Vila-Parrish and Simmons 2013). An interesting indicator to measure the performance
of an operating room is the percentage of unplanned operating room closures due to
non-availability of supplies (Fixler and Wright 2013). Understanding the relationship
between logistics processes and clinical care processes is important to manage the
utilization of supplies and services. For hospital logistics managers, knowing what is
used in a surgical case and how often is more effective than knowing the supply cost
per case (Nachtmann and Pohl 2009). On the other hand, the financial performance
indicators (e.g. inventory holding cost, value of stock, average response cost, etc.)

HEALTHCARE LOGISTICS AND PERFORMANCE MANAGEMENT
39
identify the supply chain cost drivers and help move toward a more efficiently
managed supply chain (Aronovich et al. 2010). Although the operating theatre
generates about 42% of a hospital’s revenue (Cardoen, Beliën, and Vanhoucke 2015),
supply costs can make up to 40% of total hospital expenses in surgery-intensive
hospitals (Abdulsalam and Schneller 2019). Moving toward product standardization in
clinical practices is one way to cut costs. The physician preference cards typically
contain 20% to 40% more items than what is actually consumed, which increases costs
in terms of waste, returned supplies and unnecessary labour (Camp et al. 2014). Epstein
and Dexter (2000) categorize the inventory costs into five types of costs: ordering,
shipping, purchasing, storage and opportunity costs. In addition, one should also
consider the cost of not having the items in stock when needed (i.e. stock-out cost).
Stock-out costs are difficult to measure given its high variability. Therefore, prevention
of stock-out is often handled via a service level constraint that is dependent on the item
criticality, which is a measure of the consequences of a stock-out (Gebicki et al. 2014;
Guerrero, Yeung, and Guéret 2013).
Supeekit et al. (2016, 2015) explore four supply chain performance criteria of cost,
time, reliability and productivity to evaluate internal hospital supply chain
performance. Typical performance criteria to evaluate inventory management include
value of buffer stock, inventory days of supply, stock-out at point-of-care, preparation
time, picking accuracy, etc. Bijvank and Vis (2012) list the characteristics of relevant
literature on inventory management for point-of-care locations in hospitals, such as
demand process, lead time, number of items, capacity restriction, etc. They redirect the
focus of controlling inventory from a cost objective function (Dellaert and Van De
Poel 1996; Lapierre and Ruiz 2007; Nicholson et al. 2004) to a service level objective
(Bijvank and Vis 2012; Little and Coughlan 2008). The service level is defined as the
fraction of demand that can be satisfied directly from inventory on-hand (i.e. item fill
rate) (Bijvank and Vis 2012). They introduce a capacity model and a service model in
order to determine the reorder level that maximizes the fill rate and minimizes the
required capacity, respectively. Furthermore, Gebicki et al. (2014) propose medication
inventory policies that combine three drug characteristics – drug availability (i.e.
probability that a drug is available from the supplier when ordered), criticality (i.e.
based on the criticality of the treatment for which the drugs is used) and expiration
dates – that influence the performance of the system with respect to total cost and total
number of stock-outs with the aim to minimize the trade-off between costs and patient
safety. Kelle et al. (2012) propose reorder point policies and discuss the KPIs for

CHAPTER 3
40
inventory management in the pharmaceutical supply chain, including the expected
number of daily refills, the service level and storage space utilization. In the operating
room environment, Beaulieu et al. (2013) describes four objectives to effectively
manage supplies: supply availability for scheduled surgical procedures, up-to-date
inventory management information, minimal clinical personnel involvement and
automating inventory management. An optimized inventory management system will
result in an improved workflow of all employees, improved control of both inventory
and waste, significant cost savings, increased traceability, data collection and accurate
case costing. In this work, we present an overview of four types of performance
indicators – Quality, Time, Financial and Productivity – as adapted from Aronovich et
al. (2010) who focus on holistic SCM, including product procurement, inventory
management, distribution, etc. (see Table 3-1).
3.2.1.2 Performance indicators for distribution systems
Coordination of the healthcare resources, effective delivery strategies and
measurement of the delivery services are crucial for creating high-value outcomes
(Rohleder, Bailey, et al. 2013). Therefore, hospital SCM is faced with developing
distribution strategies (e.g. direct shipment, cross-docking, etc.) to deal with
movements of goods in the supply chain, while minimizing storage and transportation
costs. Variables such as costs, resources, the capacity restriction in warehouses and the
lay-out of the hospital are taken into account when searching for optimized
transportation or routing solutions. Typically, distribution problems aim at determining
the routing, the number and type of carriers, and the working schedules of the
transporters (Di Martinelly 2008). Little and Coughlan (2008) propose to expand their
inventory model to incorporate delivery resources and routing information to combine
distribution and inventory decisions. The hospital material managers are responsible
for having medicines and other medical supplies available at the health facility, while
being aware of the distribution costs (including the handling and transportation costs,
e.g. in terms of frequency of delivery) (Little and Coughlan 2008).

HEALTHCARE LOGISTICS AND PERFORMANCE MANAGEMENT
41
Tab
le 3
-1. O
ver
vie
w o
f p
erfo
rman
ce i
nd
icat
ors
for
inven
tory
man
agem
ent.
Qu
ali
ty
Tim
e
Fin
an
cia
l P
ro
du
cti
vit
y
A
vai
labil
i
ty
(ser
vic
e
level
)
Inven
tory
vis
ibil
ity
Cri
tica
lity
of
invento
ry
item
s
Pat
ient
safe
ty
(del
ays,
erro
rs)
Rep
lenis
h
men
t ti
me
Cli
nic
al
staf
f
inv
olv
e-
men
t
Inven
tory
cost
Val
ue
of
sto
ck,
sto
ck
was
tage
Inven
tory
turn
over
Uti
liza
-
tion
rat
e
Sta
nd
ardi
zati
on
Fo
ng e
t al
. (2
01
6)
X
X
X
X
X
Su
pee
kit
et
al. (2
01
6)
X
X
X
X
X
X
X
Car
rus
et a
l. (
20
15
)
X
X
X
X
X
Ho
eur
et a
l. (
20
15
) X
X
X
X
Ro
sale
s et
al.
(2
01
5)
X
X
Su
pee
kit
et
al. (2
01
5)
X
X
X
X
X
Abu
khou
sa e
t al
. (2
01
4)
X
X
X
X
Cam
p e
t al
. (2
01
4)
X
X
X
Geb
ick
i et
al.
(2
01
4)
X
X
X
X
X
X
Sar
no (
20
14
) X
X
X
X
X
Bea
uli
eu e
t al
. (2
01
3)
X
X
X
Lan
dry
et
al.
(20
13
)
X
X
X
X
Bij
vank
et
al. (2
01
2)
X
X
X
X
Kel
le e
t al
. (2
01
2)
X
X
X
Ro
sset
ti e
t al
. (2
01
2)
X
X
X
X
X
Al-
Qata
wn
ez e
t al
. (2
01
1)
X
X
X
X
Bab
oli
et
al. (2
01
1)
X
X
X
X
X
De
Vri
es (
20
11
) X
X
X
Aro
no
vic
h e
t al
. (2
01
0)
X
X
X
X
X
X
X
Lan
ckzw
eirt
et
al. (2
01
0)
X
X
X
X
Au
gu
sto e
t al
. (2
00
9)
X
X
X
Di
Mar
tin
elly
(2
00
9)
X
X
X
X
X
Nac
htm
ann e
t al
. (2
00
9)
X
X
X
X
X
Par
k e
t al
. (2
00
9)
X
X
Lit
tle
et a
l. (
20
08
) X
X
X
Lap
ierr
e et
al.
(2
00
7)
X
X
X
Dan
as e
t al
. (2
00
6)
X
X
X
X
Bab
oli
et
al. (2
00
5)
X
X
Ep
stei
n e
t al
. (2
00
0)
X

CHAPTER 3
42
Typical problems in the transportation system involve inflexibility, communication
and time management issues and distribution inefficiencies, such as long walking
distances, excess transportation movements, elevator problems, etc. The performance
of the internal hospital distribution activities can be evaluated on several factors, such
as on-time delivery of supplies, response time to urgent requests, errors, waste,
satisfaction of patient and personnel, streamlined organisation, etc. (Miller 2009). The
Supply Chain Operation Reference (SCOR) model addresses, improves and
communicates SCM activities within and between all involved stakeholders (Lenin
2014). It can be used to define the current logistics processes, get benchmarks or best-
practices and define performance measures. Di Martinelly et al. (2009) apply the
Porter-SCOR modelling approach to the hospital supply chain and define reliability,
responsiveness, flexibility, costs and assets as five types of performance indicators.
Rossetti and Selandari (2001) use the AHP model to formulate the hospital delivery
system and select three groups of performance indicators – technical, economic and
qualitative – related to the distribution process to decide on the replacement of a
human-based delivery system by mobile robots to distribute pharmaceuticals. The
hospital pharmacy activities are highly intertwined with the primary patient care
activity and it is important to have a perfect coordination between these two flows (Di
Martinelly 2008). Baboli et al. (2005) evaluate the performance of the internal flow of
pharmaceutical products to care units by measuring the delivery performance, order
fulfilment, lead time, supply chain response time, inventory days of supply, storage
costs, distance covered, etc. Sarno (2014) considers the logistics costs related to
pharmacy management policies in terms of personnel and physical resources
(transportation resources, inventory costs). The number and type of logistics resources
depend on the frequency and quantity of transports from the pharmacy to point-of-use
locations, characteristics of material handling equipment, etc. Personnel shift
scheduling also influences internal transport frequency. Augusto and Xie (2009)
develop a supply and transportation planning in order to balance workloads for both
pharmacy assistants and transporters, while respecting the availability constraint of
having a mobile medicine closet at each medical unit. The supply planning determines
the refilling of medicine closets at the central pharmacy based on the number of
assistants available and the average time needed for inventory checking and refill,
whereas the transportation planning is similar to a classical vehicle routing problem in
which the number of pick-up routes for transporters are minimized. Table 3-2 shows
an overview of indicators identified in literature to measure the performance of
distribution activities.

HEALTHCARE LOGISTICS AND PERFORMANCE MANAGEMENT
43
T
able
3-2
. O
ver
vie
w o
f p
erfo
rman
ce i
nd
icat
ors
for
dis
trib
uti
on a
ctiv
itie
s
Q
uali
ty
Tim
e
Fin
an
cia
l P
ro
du
cti
vit
y
D
eliv
ery
accu
racy
Cen
tral
i-
zati
on
degre
e
Dis
rupti
on
of
dis
trib
uti
o
n a
ctiv
itie
s
Pre
par
atio
n t
ime
Res
pon
siv
e-ness
(on
-tim
e
del
ivery
)
Wo
rklo
ad
dis
trib
uti
o
n
Dis
trib
u-
tion
co
st
Cas
e ca
rt
cap
acit
y/
avai
labil
it
y
Del
iver
y
freq
uen
cy
Sta
nd
ardi-
zati
on
Su
pee
kit
et
al. (2
01
6)
X
X
X
Car
rus
et a
l. (
20
15
) X
X
X
X
X
X
Ho
eur
et a
l. (
20
15
) X
X
X
Pin
na
et a
l. (
20
15
)
X
X
X
X
X
Ro
bin
son e
t al.
(2
01
5)
X
X
Su
pee
kit
et
al. (2
01
5)
X
X
X
X
Iann
one
et a
l. (
20
14
)
X
Sar
no (
20
14
)
X
X
X
X
Lan
dry
et
al.
(20
13
)
X
X
Ro
sset
ti e
t al
. (2
01
2)
X
Bab
oli
et
al. (2
01
1)
X
X
De
Vri
es (
20
11
) X
X
Aro
no
vic
h e
t al
. (2
01
0)
X
X
X
Bet
t et
al.
(2
01
0)
X
X
Lan
ckzw
eirt
et
al. (2
01
0)
X
X
X
X
Au
gu
sto e
t al
. (2
00
9)
X
X
X
X
Di
Mar
tin
elly
(2
00
9)
X
X
X
X
X
X
X
Ess
ou
ssi
et a
l. (
20
09
)
X
Leb
eer
et a
l. (
20
09
) X
X
X
X
Mil
ler
(20
09
)
X
X
X
Par
k e
t al
. (2
00
9)
X
Lit
tle
et a
l. (
20
08
)
X
X
Lap
ierr
e et
al.
(2
00
7)
X
X
X
X
Has
san
et
al.
(20
06
) X
X
Bab
oli
et
al. (2
00
5)
X
X

CHAPTER 3
44
3.2.1.3 Performance management frameworks
The existence of conflicting interests and power relationships among different
stakeholders in the internal healthcare supply chain result in a multi-dimensional
character of the inventory and distribution system. It is a difficult task to determine the
contribution of supply chain activities to the performance of the healthcare delivery
system (Nachtmann and Pohl 2009). The different expectations and perceptions of the
stakeholders complicate the performance definition in the healthcare sector. A few
studies in OR/OM literature are concerned about performance measurement
frameworks in healthcare logistics. MCDM can be applied as a quantitative approach
to assess a number of alternatives on multiple criteria in order to find the best choice.
AHP/ANP are popular methods for solving MCDM problems in various industries,
such as maintenance. The research by Van Horenbeek and Pintelon (2014) serves as
an interesting opportunity to transfer the knowledge to develop a performance
measurement framework in a maintenance setting to a hospital setting. In their ANP-
based framework, relevant KPIs for specific business processes are selected in relation
with the company’s objectives. Recently, other researchers also recognize the potential
of AHP/ANP in the healthcare context. El Mokrini et al. (2018) propose a multi-criteria
framework using AHP to select the appropriate distribution network by considering
supply chain responsiveness and costs. Hoeur and Kritchanchai (2015) and
Kritchanchai et al. (2018) develop a logistics performance framework based on ANP
to develop a set of KPIs to assess the operational performance. Their results show that
inventory management and information and technology management are the most
important strategies for improving logistics performance in hospitals, with inventory
visibility and availability as the key strategic KPIs. In this dissertation, we will further
elaborate on operational KPIs covering all aspects of inventory management and
distribution to improve overall supply chain performance. Supeekit et al. (2016)
combine DEMATEL (i.e. Decision Making Trial and Evaluation Laboratory) and ANP
to evaluate the internal hospital supply chain performance. Their framework mainly
focuses on the interaction between clinical care processes, supporting processes and
patient safety while considering the main performance aspects of cost, reliability, time
and productivity. However, a more complete and detailed framework is required to
further link the performance aspects to business processes of the hospital supply chain
and to obtain KPIs for each process in order to improve overall hospital supply chain
performance. Finally, Feibert et al. (2017) and Feibert and Jacobsen (2015) assume a
process-oriented perspective and present an ANP-based tool for designing and

HEALTHCARE LOGISTICS AND PERFORMANCE MANAGEMENT
45
benchmarking efficient healthcare logistics processes. They identify a set of
performance indicators for assessing track-and-trace technologies in healthcare,
including quality, resources, productivity, satisfaction and service delivery.
3.3 Conclusion
3.3.1 Research gaps
Hospitals are forced to become operationally efficient by implementing effective SCM
and improving integration between patient care and logistics flows. The body of
literature on hospital logistics optimization is constantly growing, resulting in complex
OR/OM models mainly in the area of procurement and scheduling. However, there are
ample directions for promising future research as shown in Table 3-3.
What is missing in literature is a comprehensive work analysing how logistics
contribute to healthcare. Therefore, an interesting research opportunity is
understanding how the healthcare supply chain is currently performing. Different
stakeholders do not share the same perspectives, which complicates performance
management of SCM in hospitals. Performance measurement is important to address
inefficiencies in the logistics activities and it serves as a good managerial input for
decision makers in the healthcare supply chain. The literature review in Section 3.2.1
addresses this research gap and describes the performance indicators that impact the
internal logistics flow in hospitals. MCDM is proposed as a useful OR/OM technique
for determining relationships and prioritizing between performance indicators, while
considering the diverse interests from stakeholders.
In addition, there is still a missing link in literature of how the successful applied
industrial engineering techniques can be adopted in the healthcare sector, taking into
account the specificities of healthcare logistics. Although many complex mathematical
models have been presented in literature, there is little implementation in real-life cases
and the models are only valid for a specific department (e.g. hospital pharmacy), and
thus ignore integration among the hospital departments. The field of hospital logistics
lacks a structured approach for selecting the appropriate logistics concepts in order to
improve the overall performance of the internal hospital supply chain. Logistics
concepts have to be tailored to the specific needs of the healthcare organisation.

CHAPTER 3
46
Tab
le 3
-3.
Over
vie
w o
f re
sear
ch g
aps
and
op
port
unit
ies
Au
tho
r(s
) O
verv
iew
G
ap
s in
lit
era
ture
Fu
ture r
ese
arch
You
ng (
20
04
) E
xp
lori
ng i
nd
ust
rial
con
cep
ts i
n
hea
lth
care
con
text:
lea
n,
six
sig
ma a
nd
th
eory
of
con
stra
ints
Lack
of
imp
lem
enta
tion
in
rea
l-
life
hosp
ital
case
s
Sim
ula
tion
stu
dy a
nd
sce
nari
o a
naly
sis
to t
est
eff
ect
iven
ess
of
ind
ust
rial
con
cep
ts i
n h
ealt
hca
re.
De
Vri
es a
nd
Hu
ijsm
an
(20
11)
Sim
ilari
ties
bet
wee
n
man
ufa
ctu
rin
g a
nd
hea
lth
care
sup
ply
ch
ain
Ad
dre
ssin
g c
om
ple
xit
ies
of
ad
op
tin
g S
CM
in
hea
lth
care
Alt
hou
gh
recogn
izin
g t
he
imp
ort
an
ce,
ther
e are
lit
tle
or
no
act
ion
s to
over
com
e ch
all
eng
es
of
hosp
ital
SC
M
Ro
le o
f in
form
ati
on
tec
hn
olo
gy a
s en
ab
ler
to S
CM
ad
op
tion
Imp
act
of
stak
eho
lder
s on
SC
M
Per
form
an
ce
met
rics
in
SC
M
Co
ord
inati
on
bet
ween
su
pp
ly c
hain
part
ners
Melo
(2
01
2)
Revie
win
g c
hall
eng
es a
nd
op
port
un
itie
s o
f O
R/O
M
tech
niq
ues
in
hea
lth
care
Lim
ited
in
form
ati
on
on
ap
pli
cati
on
are
as
an
d u
sed
met
hod
olo
gie
s
Need
to a
dap
t O
R/O
M t
ech
niq
ues
to s
pecif
icit
ies
in
hea
lth
care
Ross
etti
et
al.
(20
12)
Over
vie
w o
f lo
gis
tics
pra
ctic
es i
n
inte
rnal
hosp
ital
sup
ply
ch
ain
Tech
no
log
ical
enab
lers
for
SC
M
Ap
pli
cati
on
of
blo
od
su
pp
ly
chain
Ign
ori
ng i
mp
act
of
imp
rop
er
mate
rial
man
ag
em
ent
on
pati
ent
safe
ty
Lack
of
imp
lem
enti
ng b
est
pra
ctic
es c
om
pare
d t
o r
etail
or
air
craft
in
du
stry
Ad
van
ced
fore
cast
ing f
or
bet
ter
dem
an
d m
an
agem
ent
Inte
gra
tin
g d
eman
d m
an
agem
ent
an
d i
nven
tory
mod
ell
ing o
f m
edic
al
sup
pli
es
Need
for
imp
lem
enti
ng b
est
pra
ctic
es
Vo
llan
d e
t al.
(20
17)
Co
mp
reh
ensi
ve
sum
mary
of
lite
ratu
re r
ela
ted
to h
osp
ital
mate
rials
man
ag
emen
t w
ith
a
focu
s on
qu
an
tita
tive
met
hod
s
Ex
clu
ded
top
ics:
in
form
ati
on
flo
w,
per
ish
ab
le m
edic
al
pro
du
cts
(e.g
. b
lood
), p
lan
nin
g
an
d s
ched
uli
ng a
ctiv
itie
s
Iden
tify
ing p
erfo
rman
ce
mea
sure
s in
hosp
ital
log
isti
cs
Tra
nsf
erri
ng c
on
cep
ts f
rom
in
du
stri
al
to h
ealt
hca
re
sett
ing
Inves
tigati
ng t
ech
no
log
ical
enab
lers
, su
ch a
s R
FID
syst
ems
Ass
essi
ng w
hy h
ealt
hca
re i
s st
ill
lag
gin
g b
ehin
d i
n S
CM

HEALTHCARE LOGISTICS AND PERFORMANCE MANAGEMENT
47
Thus every organisation requires a unique and customized concept, fitting its strategy
and objectives, which will yield significant cost savings and improve intangible
aspects such as staff and patient satisfaction. Therefore, this dissertation adds to the
literature by developing a rigorous performance management framework in internal
healthcare logistics.
According to Maestrini et al. (2017), supply chain performance measurement systems
are defined as:
“A set of metrics used to quantify the efficiency and effectiveness of supply
chain processes and relationships, spanning multiple organisational
functions and multiple firms and enabling supply chain orchestration”.
Designing effective frameworks ensures a clear definition of performance and requires
selecting meaningful performance indicators, which can be financial, non-financial,
quantitative or qualitative, and are related to the organisation’s strategy (Carlucci
2010; Piratelli, Claudio et al. 2010).
3.3.2 Research contributions
This dissertation presents a framework to bridge the gap between theory and practice.
In addition to the theoretical evidence provided in literature indicating the significant
share of logistics in care delivery processes, empirical evidence will be provided
through real-life case studies to support existing knowledge, gain new operational
insights for process improvement, and enhance evidence-based decision making in the
healthcare logistics context. Inspiration for the framework originates from existing
logistics concepts described in literature and successfully applied in industrial sectors,
though they are not ready-for-use in real-life cases and need adaptation to the unique
characteristics of a healthcare setting. Moreover, simple strategies with reasonable
implementation time and high degree of success are preferred rather than investing in
sophisticated mathematical models (Melo 2012).
The framework development starts at the heart of logistics with the OT logistics
manager, aiming for care delivery with great efficiency and quality, at reasonable cost,
matching the resources for care to where and when they are needed most (Hall 2012).
From this logistics perspective, other non-logistics oriented stakeholders gain insights
into the impact of logistics in supporting clinical care processes, which stimulates more
informed decision making and is an essential prerequisite for successful
CHAPTER 3
48
implementation of process improvement initiatives. The cyclical feature of the
framework brings together all stakeholders’ perspectives, resulting in a feedback loop
which reduces uncertainty in decision making and encourages continuous
improvement to achieve the desired output related to the organisation’s strategy.
Moreover, it allows to verify whether the logistics indicators, as monitored in other
industrial sectors, can be adapted to healthcare processes.
Unlike other research, this framework integrates multiple aspects of the internal supply
chain and enables to quantify trade-offs between cost and service levels. The major
challenge will be to overcome obstacles to efficient SCM, such as conflicting
stakeholder goals, physician preference items, lack of standardization, no visibility,
etc. Finally, the proposed approach is transparent, systematic, flexible and easy-to-use,
and thus leaving enough room for applications in other healthcare logistics settings.
The obtained outcomes are valuable for healthcare providers who are streamlining the
internal supply chain by implementing effective inventory and distribution systems.
Altogether, this dissertation contributes to literature from both an academic and
practical point of view:
The P²DC²A-cycle promotes a structured methodology to develop a
theoretically sound and objective decision-support framework. The
healthcare logistics performance management framework integrates multiple
logistics indicators as considered by ‘traditional’ industrial engineering
concepts, tailors logistics concepts to healthcare specificities and orchestrates
supply chain integration by considering multiple stakeholders’ perspectives.
In addition, the cyclical feature stimulates continuous improvement.
The developed framework contributes to literature domains covering
healthcare systems engineering and management science by identifying
performance measures impacting the internal logistics flow in hospitals and
addressing OR/OM techniques to analyse how logistics contributes to value-
based healthcare.
MCDM, and in particular ANP, is used as a powerful OR/OM technique to
select and prioritize KPIs according to organisation-specific objectives. The
optimal KPI ranking constitutes the core elements, which can be quantitative
or qualitative, when defining operational excellence to the benefit of the
overall health system.
HEALTHCARE LOGISTICS AND PERFORMANCE MANAGEMENT
49
By combining ANP and Discrete-Event Simulation, we provide a sound basis
for performance management in healthcare. The hybrid ANP-DES tool
allows for empirical testing of the framework by evaluating several logistics
policies as well as determining parameter values to improve inventory and
distribution systems for the studied application. We introduce the Internal
Logistics Efficiency Performance (ILEP) index as the synthesized value
which allows to quantify trade-offs among possibly conflicting objectives,
find appropriate improvement initiatives and encourage benchmarking
opportunities by pursuing the best-in-class KPIs according to the process
type.
In contrast to early-participation, the modules are verified and validated by
incorporating stakeholder feedback in the final development phase of the
framework. The multi-level, multi-stakeholder framework stimulates
transparent and more informed decision making by increasing awareness of
how logistics can service health systems in order to reduce supply chain
fragmentation and offer a common language for stakeholders on all
organisational levels. Hence, the framework promotes perfect alignment
between processes and stakeholders to orchestrate supply chain integration
for value-based healthcare.
Overall, the framework uses a closed-loop approach to support decision
making and bridge the gap between theory and practice-based SCM
applications in healthcare. From a practical point of view, the healthcare
logistics performance management framework has potential for building
implementation paths and thus building trust in the research findings. The
merits of the framework lie in its generic nature of the modules and the ability
to customize the content of the modules to the studied application. Hence, the
structured approach provides a reference platform for addressing various
logistics needs by adapting industrial engineering techniques according to the
context and stakeholders’ perspectives.

50

51
CHAPTER 4
4 Prioritization of Performance Indicators using
an ANP-based Prototype for the Internal
Hospital Supply Chain3
This chapter starts with introducing MCDM as a suitable decision-support
technique in healthcare. In this research, ANP is applied as a popular
MCDM method serving as the foundation for developing the logistics
performance management framework. The ANP-based prototype in Section
4.2 provides an answer to the second research question, and is illustrated
by applying it to one hospital department, namely the Operating Theatre
(OT). Finally, some challenges encountered in a typical MCDM study are
discussed using another application of the AHP in medical decision making
for value-based healthcare. This shows the versatility of AHP/ANP in a wide
range of healthcare applications focusing both on logistics and patient care
aspects.
3 This chapter partially corresponds to the following papers/poster/supervised Master’s Theses:
Moons, K., Pintelon, L., Jorissen, P., De Ridder, D., Everaerts, W. (2020). Identification of multi-stakeholder
value in medical decision-making. International Journal of the Analytic Hierarchy Process, vol. 12 (1), 82-103.
Moons, K. Waeyenbergh, G., Pintelon, L., Timmermans, P., De Ridder, D. (2019). Performance indicator
selection for operating room supply chains: an application of ANP. Operations Research for Health Care, vol. 23,
December 2019.
Jorissen, P., Moons, K., Pintelon, L., De Ridder, D., Everaerts, W. (2019). Identification of multi-stakeholder
value in prostate cancer treatment by application of multi-criteria decision-making. European Urology
Supplements, 18 (1), 2184-2185.
De Bie, R. (2019) Application of Multi-Criteria Decision Making in healthcare: Optimization of questionnaires
used in prostate cancer treatment. KU Leuven.
Jorissen, P. (2018). Identification of multi-stakeholder value in prostate cancer treatment by application of multi-
criteria decision making. KU Leuven.

CHAPTER 4
52
4.1 Multi-Criteria Decision Making in healthcare
Measuring the performance of internal hospital supply chain processes is a major
challenge faced by hospital management. The performance definition reflects a multi-
dimensional character, representing the possibly conflicting medical or logistics
objectives depending on the various stakeholders’ preferences. Input from all
stakeholders is required to identify relevant performance indicators and to evaluate
medical supplies for safety, clinical value to patients and cost-effectiveness (Hoeksema
2011). The complex nature of healthcare SCM decisions, involving uncertainty, trade-
offs and imperfect information, necessitates the use of a rigorous performance
measurement approach (Adunlin et al. 2015). This approach will guide hospital
managers in making transparent and systemic decisions, subject to conflicting criteria
and multiple objectives. A technique often used in literature to deal with multi-criteria
problems in all kinds of sectors is called Multi-Criteria Decision Making (MCDM).
MCDM stems from the field of OR/OM and is a quantitative technique to assess a
number of alternatives based on multiple criteria by assigning relative weights to these
criteria (Beck and Hofmann 2014). Typical application areas in SCM include design
(e.g. distribution network), purchasing (e.g. supplier selection), manufacturing (e.g.
production planning), distribution (e.g. distribution planning), logistics (e.g. supply
chain effectiveness) and performance management in general. In recent years, there
has been increased awareness for using MCDM techniques in Health Technology
Assessment (HTA), hospital resource optimization, benefit-risk analysis of drugs,
priority setting and clinical practice guidelines (Marsh et al., 2017). Marsh et al. (2017)
recommends MCDM as a supporting approach for better healthcare decision making,
because it allows to select relevant performance indicators, elicit stakeholder
preferences and assess alternatives depending on both performance and stakeholder
preferences. Moreover, MCDM is suitable for healthcare supply chain performance
management because it utilizes quantitative and qualitative information, accounts for
multiple objectives and makes the decision process more explicit, rational and
objective (Adunlin et al. 2015; Beck and Hofmann 2014).
In this dissertation, MCDM is used to develop a generic performance management
framework for healthcare SCM. Our work aims to help healthcare stakeholders in
translating strategic or tactical goals into relevant KPIs, which reflect the multi-
dimensional character of the supply chain and thus ensure a holistic viewpoint. In

PRIORITIZATION OF PERFORMANCE INDICATORS USING ANP
53
addition, we propose to combine MCDM and simulation modelling to quantify the
logistics impact in healthcare and highlight the areas for efficiency improvement.
The next section describes different types of MCDM methods, whereas an overview
of the most commonly used MCDM methods has been introduced in our healthcare
logistics toolbox (see Section 2.2.2).
4.1.1 MCDM classification
Literature describes many types of MCDM methods appropriate to different problem
settings. Marsh et al. (2014) define MCDM as:
“Any method that establishes criteria, weights them in terms of importance,
and scores each alternative on each criterion to create an overall assessment
of value.”
MCDM is suitable to make consistent, rational and transparent decisions in complex
problems when multiple stakeholders are involved with possibly conflicting
viewpoints (Thokala et al., 2016). However, there is no guidance in selecting
appropriate MCDM methods, though the chosen method should be suitable for the
problem at stake requiring a rational thought exercise. The choice of the method
strongly influences the level of transparency and accountability.
Typically, MCDM methods are divided into three categories: value measurement,
outranking and goal programming approaches (Figure 4-1). Value measurement
methods aim to construct a ranking of alternatives based on a real number consistent
with decision-maker value judgments, such that alternative A is preferred to alternative
B whenever the value for A is higher. Value or utility functions are used depending on
decision-maker preferences to convert performance into value on each criterion. In a
simple additive model, the overall evaluation of each alternative is found by summing
the product of each criterion weight and the performance score. The value
measurement approach is widely adopted with common examples being Analytic
Hierarchy Process (AHP), Analytic Network Process (ANP), and Multi-Attribute
Utility (Value) Theory (MAU(V)T) (Marsh et al., 2014a). A second category uses
outranking (Thokala et al. 2016). In this approach, no numerical value is required to
select the best alternative as compared to the former approach. Outranking relies on
the principle of dominance between the alternatives. An alternative is stated to be
dominant when it scores better on a sufficient number of criteria. A drawback of this

CHAPTER 4
54
working principle is that outranking methods are not compensatory, or in other words,
alternatives are downgraded when they perform poorly on one criterion, in contrast to
value measurement methods. PROMETHEE and ELECTRE are examples of
outranking methods. The final approach is categorized as goal programming with
TOPSIS being the most commonly used technique. This technique measures how good
alternatives achieve the pre-defined desirable levels of achievement for each criterion,
by computing the distance from the ideal point and most negative point.
Not every MCDM approach is recommended for solving any decision problem. In this
dissertation, the desired outcome of applying MCDM is a priority setting of the
performance indicators and alternatives. Thus, the nature of this problem does not
allow the application of goal programming as we are interested in identifying the most
ideal result, rather than using it as input. In further research, however, the obtained
priorities can be used as input to apply the goal programming approach. What remains
is the choice between value measurement and outranking. Since the goal is to find and
interpret priority setting, precise values for the criteria weights are required. Therefore,
the value measurement approach is preferred to the outranking approach for solving
the prioritization problem. In addition, value measurement approaches are the most
applied methods in healthcare (Marsh et al., 2014a).
Figure 4-1. MCDM taxonomy.

PRIORITIZATION OF PERFORMANCE INDICATORS USING ANP
55
Typically, there are six main elements when conducting a value measurement approach
(Marsh et al., 2016):
Clear definition of problem statement
Identifying exhaustive, coherent and non-redundant criteria (French and Roy
1997)
Measuring performance
Scoring alternatives
Weighting criteria
Calculating aggregate scores
MAU(V)T and AHP/ANP are value measurement methods which enable to synthesize
preferences across indicators into a quantitative score. The former method, however,
is data-intensive to create utility/value functions, which is difficult to obtain in a
healthcare setting. The latter methods use pairwise comparisons to support decision
making by defining and prioritizing objectives and indicators which are important to
measure, monitor, control and improve the overall performance of the internal hospital
supply chain. Since the decision needs to account for interdependency relations
between indicators, AHP would oversimplify the problem. ANP is less transparent
compared to AHP for generalizing the results to similar problem settings, though ANP
can deal with complexity inherent in the hospital environment by taking into account
interdependencies. In the next section, we will elaborate more on the ANP approach
and why its application is believed to be the most suitable to the formulated research
problem. For more detailed information on the principles of the AHP/ANP
methodology, we refer to the papers by Saaty (1996, 2006; Saaty and Vargas, 2006).
4.1.2 Analytic Hierarchy/Network Process
AHP and its extended form ANP are used to assign relative weights to indicators
representing their importance as a quantitative measure. Therefore, this approach
enables to define and prioritize healthcare logistics objectives and indicators
(Jharkharia & Shankar, 2007; Saaty & Vargas, 2006; Van Horenbeek & Pintelon,
2014). AHP simplifies complex decision problems by using a hierarchical structure,
consisting of the goal, objectives and (sub-)indicators (Saaty, 1990a). The goal or
control criterion is associated with the decision problem, and refers in this work to
finding the best set of indicators that influence the performance of the internal hospital
supply chain the most. Several indicators are assigned to specific healthcare logistics

CHAPTER 4
56
objectives. A pairwise comparison process is used to express preferences among
indicators on a 1-9 ratio scale based on decision makers’ judgments (Van Horenbeek
and Pintelon 2014). The principal eigenvector method is used to extract local and
global priority vectors (Saaty 1996). A consistency ratio of 10% is allowed to check
for inconsistent stakeholder judgments.
ANP is similar to AHP with the exception that the former transforms the decision
problem into a network rather than a hierarchy. The network structure consists of
different clusters and elements. ANP takes a holistic view by taking into account
connections among these elements and clusters and thus allows for capturing
relationships between or within clusters (i.e. outer or inner dependence). This feature
of interdependence is ignored in AHP, resulting in no feedback between different
levels and independent elements within each level. The four main steps of the ANP
process are listed below (Carlucci 2010) and illustrated in Section 4.2 to a test design:
Step 1 – Model construction and problem formulation
Step 2 – Building pairwise comparison matrices
Step 3 – Supermatrix formation
Step 4 – Prioritization and selection of KPIs
ANP is believed to be the most appropriate method for the KPI selection and
prioritization problem in this hospital logistics context:
First of all, ANP models are successfully used in many applications as a
strategic decision-support tool (Jharkharia and Shankar 2007; Verdecho et
al. 2012). In the healthcare context, AHP/ANP are the most commonly used
MCDM methods, especially when addressing topics related to HTA,
diagnosis or performance management (Marsh et al., 2014a). An inherent
characteristic of AHP/ANP is that they are powerful tools for decision
making because of their flexibility and ability to capture both quantifiable
and non-quantifiable aspects of decisions (Hummel et al., 2012). This is
essential for criteria, such as patient safety, which are difficult to be
expressed quantitatively.
Second, ANP offers a participatory approach where decision makers are
directly involved in the pairwise comparison process to derive priorities for
all indicators. A better understanding of the problem, in turn, leads to more
informed decision making. As a result, the right logistics strategy can be
PRIORITIZATION OF PERFORMANCE INDICATORS USING ANP
57
formulated based on the decision maker’s personality (Van Horenbeek and
Pintelon 2014). In addition, pairwise comparisons are perceived to be easier
than comparing all criteria at once, and the difficulty to express preferences
between criteria is countered by allowing inconsistent judgments until a
specified threshold (i.e. consistency ratio) to achieve a good solution.
Third, trade-offs exist as not all performance indicators are equally important
to the value creation in health systems. ANP is a useful tool for balancing
different stakeholders’ perspectives, such as the conflicting objectives of the
medical and logistics professionals. Optimal performance of the internal
supply chain in hospitals can be achieved by trading-off logistics objectives,
such as cost minimization, maximization of supply availability or
maximization of staff productivity.
A final reason to adopt the ANP approach is its structuring characteristic to
transform the decision problem into a network form. The network allows for
specifying objectives on all organisational levels (i.e. strategic, tactical and
operational), whereby higher-level objectives are translated to relevant
indicators at operational levels (Van Horenbeek and Pintelon 2014). The
network also accounts for interdependent criteria, which is not valid in AHP
(Lee 2010). For example, “a change in supporting process efficiency can
cause a change in clinical care process efficiency” (Supeekit et al. 2016).
Ignoring dependencies may result in low quality of the outcomes for the
indicator prioritization process.
Despite the many advantages, the decision maker should pay attention to the
limitations and challenges incurred when performing an ANP study. MCDM methods
have been criticized by many researchers. The main reason for this criticism is that
MCDM may create a false sense of accuracy due to the possibility of manipulation.
Another weakness relates to uncertainty in both input data as well as the decision-
making process (Zardari et al. 2015). However, other researchers advocate the MCDM
approach due to its systematic and transparent methodology which increases
objectivity (Janssen 2001; Macharis, Verbeke, and De Brucker 2004). According to
some authors, the theoretical basis provided for AHP is limited (Dyer 2008; Pirdashti
et al. 2011), while this claim is countered by others (Ayag & Gürcan Özdemir, 2012;
Podvezko, 2009; L. Saaty & Vargas, 2006). ANP is a tool for comparative evaluation,
rather than providing an absolute measure of goodness of alternatives (Barfod and

CHAPTER 4
58
Leleur 2014). Another issue mentioned by Pérez et al. (2007) is that the method suffers
from rank reversals when introducing new alternatives. Hariharan et al. (2004) claim
that deriving criteria weights remains subjective. Finally, ANP solves the problem of
interdependence, though it is more demanding in terms of the number of pairwise
comparisons (i.e. n(n-1)/2 where n is number of criteria) and more advanced
calculations. Because of the resource-intensive and time-consuming nature of pairwise
comparisons, a maximum of 15 criteria is recommended. Despite all criticism about
AHP/ANP, the popularity of this method increases in different applications, which is
mainly motivated by the intuitive structure, the simplicity of application, its flexibility
and the user-friendly supporting software available (Ishizaka and Labib 2011).
4.2 Performance indicator selection and prioritization: an
ANP-based prototype for the operating theatre supply
chain
4.2.1 Introduction
Achieving operational excellence poses a major challenge to hospital managers as they
lack systems for assessing performance of the current processes in order to set future
goals according to the hospital’s strategy and objectives (Anupindi et al. 2012).
Performance management is a major research opportunity in healthcare SCM and
OR/OM literature (Volland et al. 2017). Hospitals using a performance management
framework gain a competitive advantage as they have control of their supply chain
strategy, can implement continuous improvement programs, and have improved
decision-making capabilities by focusing on relevant indicators (Maestrini et al.
2017).The performance metrics described in Chapter 3 provide a foundation for
establishing a performance management framework for internal hospital supply chain
processes. A stakeholder analysis is presented to customize the performance metrics
to the studied application.
MCDM techniques provide effective decision-support tools to select and prioritize
performance indicators, reflecting what is most important or contributes most to
process performance. ANP is a well-known MCDM method applied for performance
management by taking into account the complexity of the problem, multiple
conflicting criteria, information availability, stakeholders’ preferences and expertise in
modelling and analysis (Poh and Liang 2017). Therefore, we propose a prototype,

PRIORITIZATION OF PERFORMANCE INDICATORS USING ANP
59
based on ANP, to measure the performance of internal supply chain processes by
aligning the hospital objectives and KPIs in order to provide a holistic view of the
health system performance. An illustration of the ANP methodology is presented by
implementing the prototype to one hospital department, namely the operating theatre
(OT). The OT is a critical resource and cost driver in the health system and hence, it is
an excellent opportunity for identifying efficiency gains. Starting from the logistics
perspective, the OT logistics manager is closely involved in the design and testing
phase of the prototype. In Chapter 6, more details will be provided on extending the
framework to a wider healthcare logistics context by incorporating all stakeholders in
the OT supply chain. The purpose is to define the best set of KPIs for evaluating
internal logistics processes (e.g. inventory and distribution systems) in accordance
with the objectives of the hospital department under study. The final outcome will be
a prioritization of KPIs, which serves as a useful input for hospital stakeholders to gain
managerial insights into tackling the trade-offs which are inherent to OT logistics
processes. The ANP method aligns with the value-based care model by striving
towards a shared goal that unites the interests of all stakeholders based on a clear
definition for operational excellence as obtained by the KPI prioritization. Hence, we
provide a common language for stakeholders to enhance alignment between patient
care and logistics processes in order to maximize value creation by identifying
efficiency gain opportunities.
4.2.2 Stakeholder analysis: selecting logistics performance
metrics for the OT
Selecting meaningful performance metrics is a challenging task for decision makers,
as different organisations use different metrics based on company goals, strategies or
policies (Ordoobadi 2012). In order to design a generic performance management
framework applicable to various healthcare logistics processes, the purpose is to select
a list of traditional performance metrics as considered in logistics engineering, which
can be customized according to the specific context or situation needs (Van Horenbeek
and Pintelon 2014; El Mokrini et al. 2018). Based on the extensive literature review in
Chapter 3, the OT logistics manager selects a set of performance indicators and
categorizes the indicators according to four objectives – quality, time, financial and
productivity/organisation – to represent the interests of the OT department. A single
stakeholder is consulted in this second module of the framework development
methodology based on his logistics expertise, tactical responsibility and accessibility

CHAPTER 4
60
to logistics data in order to interpret the relevance of KPIs for the problem situation
and to avoid potential conflicts as powerful stakeholders largely impact the weighting
procedure which might lead to biased results that maximize their own objectives. In
contrast to early-participation, the indicators are verified by including stakeholder at
the strategic, tactical and operational level in the final testing phase of the framework
to ensure more informed decision making and reduce supply chain fragmentation.
Table 4-1 and Table 4-2 give an overview of objectives and indicators for measuring
the performance of inventory and distribution systems respectively in the internal OT
supply chain. The first column contains KPIs categorized per objective, followed by a
definition in column two. The KPI definitions ensure uniform performance
measurement and thus allow for comparing different departments and learning from
best practices to achieve operational excellence. Depending on the process type, the
indicators need to be customized to monitor relevant KPIs for the problem situation.
In the third column, we propose potential sub-indicators that are related to the KPIs.
An interpretation of dependencies between the indicators is given in the final column
based on the guide to KPIs for public health managers by Aronovich et al. (2010). The
interrelationships among KPIs are generic as the indicators are based on traditional
logistics engineering processes regardless of the context. For instance, increasing the
level of safety stock will change the inventory turnover ratio, reduce the stock-out rate
and increase the capital tied up to stock. However, the strength of the dependency
depends on context-specific characteristics.

PRIORITIZATION OF PERFORMANCE INDICATORS USING ANP
61
Tab
le 4
-1.
Over
vie
w o
f in
ven
tory
per
form
an
ce m
etri
cs.
Qu
ali
ty
Qu
ali
ty s
pecif
ies
ho
w w
ell
a s
pec
ific
act
ivit
y h
as
bee
n p
erfo
rmed
, en
suri
ng t
hat
pati
ents
rec
eiv
e ca
re s
ervic
e in
a s
afe
man
ner
an
d t
hat
pro
ble
ms
such
as
med
ical
erro
rs a
re m
inim
ized
KP
Is
Defi
nit
ion
S
ub
-in
dic
ato
rs
Inte
rp
reta
tio
n
Inven
tory
ser
vic
e
level
(IS
L)
Th
e ab
ilit
y t
o f
ulf
il i
nco
min
g o
rder
s
fro
m s
tock
on
-han
d
Inven
tory
avail
ab
ilit
y
Sto
ck-o
ut
rate
ISL
is
main
ly d
eter
min
ed b
y t
he
sto
ck-o
ut
rate
, w
hic
h
shou
ld b
e as
low
as
poss
ible
to e
nsu
re i
tem
avail
ab
ilit
y.
Inven
tory
vis
ibil
ity (
IV)
Th
e ab
ilit
y t
o m
on
itor
the
am
ou
nt
of
stock
on
-han
d i
n t
he
cen
tral
stora
ge
an
d p
oin
t-o
f-u
se l
oca
tion
s
Inven
tory
level
Safe
ty s
tock
Su
pp
ly l
oca
tion
(ce
ntr
al
or
dec
entr
al)
Un
der
stan
din
g w
hat
you
have
in s
tock
an
d w
her
e it
is
loca
ted
is
imp
ort
an
t to
in
crea
se I
V t
hro
ugh
ou
t th
e
sup
ply
ch
ain
an
d r
edu
ce i
nven
tory
(sa
fety
) le
vels
. In
ad
dit
ion
, it
en
sure
s a b
ette
r accu
racy
rate
, lo
wer
sto
ck-
ou
t ra
te,
red
uce
d c
ost
s an
d s
trea
mli
ned
pro
ces
ses.
Inven
tory
acc
ura
cy (
IA)
Th
e ab
ilit
y t
o c
om
pare
sto
ck r
ecord
s
an
d a
ctu
al
stock
on
-han
d
Inven
tory
dis
crep
an
cy
Sto
cked
accord
ing t
o p
lan
Item
s in
over
sto
ck
Item
s in
un
der
sto
ck
Ass
ess
the
qu
ali
ty o
f in
ven
tory
con
tro
l b
y m
easu
rin
g
devia
tion
s o
f d
ata
on
in
ven
tory
levels
in
ord
er t
o
acc
ura
tely
tra
ck i
tem
s. L
ow
er i
s b
ette
r b
y r
ati
on
ali
zin
g
item
s to
im
pro
ve
ISL
an
d I
V t
hro
ugh
ou
t th
e su
pp
ly
chain
.
Inven
tory
crit
icali
ty (
ICr)
Th
e im
pact
of
erro
rs o
r d
ela
ys
of
sup
pli
es o
n t
he
surg
ical
pro
ced
ure
Avail
ab
ilit
y o
f su
bst
itu
te
sup
pli
es
% o
f er
rors
(w
ron
g i
tem
or
qu
an
tity
of
item
s)
Dela
ys
of
pro
ced
ure
s
ICr
ind
irec
tly m
easu
res
pati
ent
safe
ty b
y m
easu
rin
g t
he
eff
ect
of
inacc
ura
te o
r in
com
ple
te s
up
ply
pro
vis
ion
on
the
con
tin
uati
on
of
the
pro
ced
ure
. T
his
mig
ht
be
cau
sed
by b
ack
ord
ers,
pic
kin
g e
rrors
, et
c. L
ow
er i
s b
ette
r,
wh
ich
als
o i
mp
roves
IS
L.

CHAPTER 4
62
Fin
an
cia
l F
inan
cial
ind
icato
rs i
den
tify
su
pp
ly c
hain
cost
dri
ver
s, s
uch
as
exp
ense
s in
curr
ed b
y d
epart
men
ts f
or
pro
vid
ing s
ervic
es,
inclu
din
g d
irec
t an
d o
ver
hea
d c
ost
s fo
r in
ven
tory
an
d i
nte
rnal
dis
trib
uti
on
KP
Is
Defi
nit
ion
S
ub
-in
dic
ato
rs
Inte
rp
reta
tio
n
Inven
tory
cost
(IC
o)
Th
e an
nu
al
cost
of
ho
ldin
g i
nven
tory
at
a s
pec
ific
sto
rag
e ro
om
Ord
erin
g c
ost
Ho
ldin
g c
ost
Sh
ort
ag
e cost
Over
sto
ckin
g c
ost
Sto
rag
e sp
ace
cost
Th
e an
nu
al
ICo c
an
be
bro
ken
do
wn
in
to d
iffe
ren
t co
st
com
pon
ents
. M
on
itori
ng t
he
cost
s en
sure
s b
ette
r IS
L,
IV a
nd
IA
.
Eff
ect
ive i
nven
tory
con
trol
ensu
res
low
er c
ost
s an
d t
hu
s
less
cap
ital
tied
up
to i
nven
tory
.
Valu
e o
f
inven
tory
(V
oI)
Th
e d
eter
min
ati
on
of
the
cost
of
aver
ag
e in
ven
tory
at
the
end
of
a
per
iod
Valu
e o
f in
ven
tory
per
stora
ge
roo
m
Valu
e o
f exp
ired
/dam
ag
ed
stock
Week
ly a
nd
dail
y v
alu
e fo
r re
spect
ively
th
e cen
tral
an
d
dec
entr
al
sto
ck.
Inaccu
rate
mate
rial
han
dli
ng c
au
se a
hig
her
am
ou
nt
of
dam
ag
ed o
r exp
ired
sto
ck,
wh
ich
has
a n
egati
ve
imp
act
on
th
e fi
nan
cial,
qu
ali
ty a
nd
pro
du
ctiv
ity o
bje
ctiv
es.

PRIORITIZATION OF PERFORMANCE INDICATORS USING ANP
63
Pro
du
cti
vit
y/
Org
an
isa
tio
n
Pro
du
ctiv
ity
/Org
an
isati
on
in
volv
es
op
erati
on
al
con
tro
l m
etri
cs f
or
log
isti
cs d
epart
men
ts u
sed
for
stre
am
lin
ing p
roce
sses
,
red
uci
ng c
ost
s, f
acil
itati
ng i
nfo
rmati
on
flo
w a
nd
en
han
cin
g p
rovid
ed c
are
ser
vic
es
KP
Is
Defi
nit
ion
S
ub
-in
dic
ato
rs
Inte
rp
reta
tio
n
Inven
tory
turn
over
(IT
u)
A m
easu
re o
f h
ow
fast
in
ven
tory
is
use
d i
n t
he
stora
ge
room
Inven
tory
days
on
-han
d
Sto
ck r
ota
tion
: sl
ow
-,
norm
al-
, fa
st-m
ovin
g
item
s
Th
e su
b-i
nd
icato
rs m
easu
re t
he
nu
mb
er o
f d
ays
inven
tory
is
store
d.
Low
er i
s b
ette
r si
nce
les
s ca
pit
al
is
tied
up
to i
nven
tory
an
d t
he
inven
tory
level
is l
ow
er.
More
over,
it
ind
icate
s h
ow
mu
ch i
nven
tory
is
con
sum
ed i
n a
cer
tain
tim
e p
erio
d a
nd
en
cou
rages
stan
dard
izati
on
.
Inven
tory
usa
ge
(IU
)
Th
e am
ou
nt
of
inven
tory
un
its
con
sum
ed d
uri
ng a
cer
tain
tim
e p
erio
d
Con
sum
pti
on
rate
Ph
ysi
cia
n p
refe
ren
ce
card
usa
ge
rate
% o
f re
turn
ed i
tem
s
Sto
rag
e sp
ace
uti
liza
tion
Pro
du
ctiv
ity i
s m
easu
red
by t
rack
ing I
U r
eco
rds,
wh
ich
inclu
des
con
sum
pti
on
as
well
as
retu
rn o
f it
em
s. T
his
pro
vid
es e
ssen
tial
info
rmati
on
for
sett
ing i
nven
tory
levels
an
d i
mp
rove
dem
an
d f
ore
cast
ing.
In a
dd
itio
n,
stora
ge
space
uti
liza
tion
can
be
imp
roved
by m
on
itori
ng
IU.
Pro
du
ct
stan
dard
izati
on
(PS
)
Th
e ab
ilit
y t
o r
edu
ce
vari
ati
on
of
med
ical
sup
pli
es i
n o
rder
to i
ncr
ease
tim
e sp
ent
at
core
act
ivit
ies
Pro
du
ct d
up
lica
tion
Un
iform
work
flow
s
Pro
du
ct/l
oca
tion
iden
tifi
cati
on
sta
nd
ard
s
Pro
du
ct d
up
lica
tion
in
mu
ltip
le l
oca
tion
s an
d d
iffe
ren
t
refe
ren
ce
nu
mb
ers
neg
ati
vely
im
pact
pro
du
ctiv
ity.
Vari
ati
on
in
pro
du
ct s
tan
dard
s m
ust
be
min
imiz
ed t
o
ensu
re q
uali
tati
ve a
nd
un
iform
in
ven
tory
con
trol,
wh
ile
con
tain
ing c
ost
s.
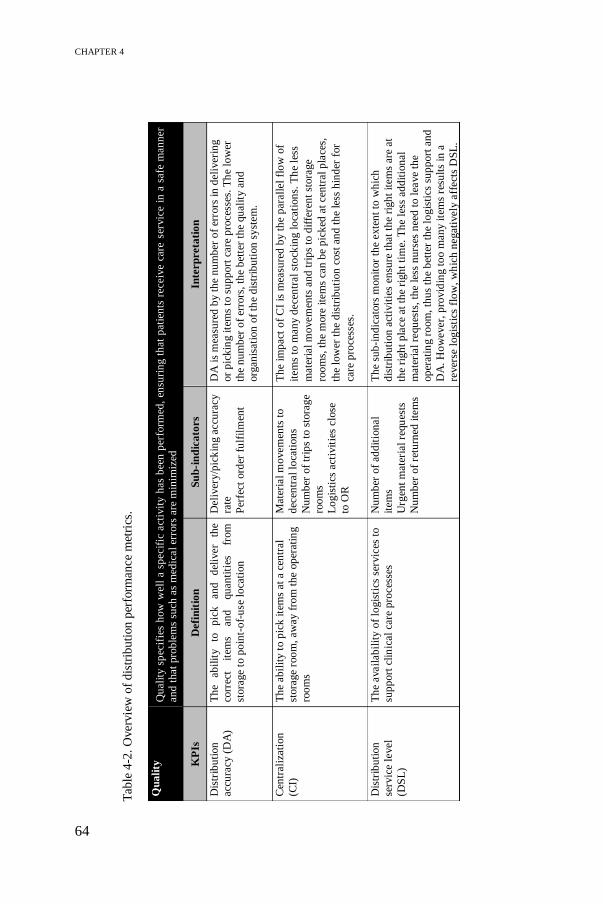
CHAPTER 4
64
Tab
le 4
-2.
Over
vie
w o
f d
istr
ibu
tion
per
form
ance
met
rics
.
Qu
ali
ty
Qu
ali
ty s
pec
ifie
s h
ow
well
a s
pecif
ic a
ctiv
ity
has
bee
n p
erfo
rmed
, en
suri
ng t
hat
pati
ents
receiv
e ca
re s
ervic
e in
a s
afe
man
ner
an
d t
hat
pro
ble
ms
such
as
med
ical
erro
rs a
re m
inim
ized
KP
Is
Defi
nit
ion
S
ub
-in
dic
ato
rs
Inte
rp
reta
tio
n
Dis
trib
uti
on
acc
ura
cy (
DA
)
Th
e ab
ilit
y
to
pic
k
an
d
del
iver
the
corr
ect
item
s an
d
qu
an
titi
es
from
stora
ge
to p
oin
t-o
f-u
se l
oca
tion
Deli
ver
y/p
ick
ing a
ccu
racy
rate
Per
fect
ord
er f
ulf
ilm
ent
DA
is
mea
sure
d b
y t
he
nu
mb
er o
f er
rors
in
deli
ver
ing
or
pic
kin
g i
tem
s to
su
pp
ort
care
pro
ces
ses.
Th
e lo
wer
the
nu
mb
er o
f er
rors
, th
e b
ette
r th
e qu
ali
ty a
nd
org
an
isati
on
of
the
dis
trib
uti
on
sy
stem
.
Cen
trali
zati
on
(CI)
Th
e ab
ilit
y t
o p
ick
ite
ms
at
a c
entr
al
stora
ge
roo
m,
aw
ay f
rom
th
e op
erati
ng
roo
ms
Mate
rial
mo
vem
ents
to
dec
entr
al
loca
tion
s
Nu
mb
er o
f tr
ips
to s
tora
ge
roo
ms
Lo
gis
tics
act
ivit
ies
clo
se
to O
R
Th
e im
pact
of
CI
is m
easu
red
by t
he
para
llel
flo
w o
f
item
s to
man
y d
ece
ntr
al
sto
ckin
g l
oca
tion
s. T
he
less
mate
rial
mo
vem
ents
an
d t
rip
s to
dif
fere
nt
stora
ge
roo
ms,
th
e m
ore
ite
ms
can
be
pic
ked
at
cen
tral
pla
ces,
the
low
er t
he
dis
trib
uti
on
cost
an
d t
he
less
hin
der
for
care
pro
cess
es.
Dis
trib
uti
on
serv
ice
level
(DS
L)
Th
e avail
ab
ilit
y o
f lo
gis
tics
ser
vic
es t
o
sup
port
cli
nic
al
care
pro
ces
ses
Nu
mb
er o
f ad
dit
ion
al
item
s
Urg
ent
mate
rial
requ
ests
Nu
mb
er o
f re
turn
ed i
tem
s
Th
e su
b-i
nd
icato
rs m
on
itor
the
exte
nt
to w
hic
h
dis
trib
uti
on
act
ivit
ies
ensu
re t
hat
the
righ
t it
em
s are
at
the
righ
t p
lace
at
the
righ
t ti
me.
Th
e le
ss a
dd
itio
nal
mate
rial
requ
ests
, th
e le
ss n
urs
es n
eed
to l
eave
the
op
erati
ng r
oom
, th
us
the
bet
ter
the
log
isti
cs s
up
port
an
d
DA
. H
ow
ever,
pro
vid
ing t
oo m
an
y i
tem
s re
sult
s in
a
rever
se l
og
isti
cs f
low
, w
hic
h n
egati
vely
aff
ect
s D
SL
.

PRIORITIZATION OF PERFORMANCE INDICATORS USING ANP
65
Tim
e
Tim
e in
vo
lves
the
per
iod
to c
om
ple
te t
he
log
isti
cs o
per
ati
on
s to
en
sure
th
at
the
righ
t it
em
s are
at
the
righ
t p
lace
an
d t
ime
KP
Is
Defi
nit
ion
S
ub
-in
dic
ato
rs
Inte
rp
reta
tio
n
Rep
len
ish
men
t
lead
tim
e (R
LT
)
Th
e to
tal
am
ou
nt
of
tim
e th
at
ela
pse
s
fro
m
the
mo
men
t an
it
em
is
ord
ered
un
til
the
item
is
back
on
th
e sh
elf
Ord
er +
pic
kin
g +
tran
sport
atio
n +
un
load
ing
tim
e
RL
T i
nclu
des
ord
erin
g,
pic
kin
g,
tran
sport
ing a
nd
un
load
ing t
ime.
Sh
ort
er l
ead
tim
es w
ill
imp
rove
the
eff
icie
ncy o
f b
oth
th
e d
istr
ibu
tion
an
d i
nven
tory
syst
em
(e.g
. le
ss s
afe
ty s
tock
).
Res
pon
se t
ime
(RT
)
Th
e ab
ilit
y t
o d
eli
ver
ite
ms
on
tim
e,
pre
ven
tin
g d
ela
ys
in s
urg
ical
pro
ced
ure
s
Avera
ge
deli
ver
y t
ime
On
-tim
e d
eli
ver
y
Rati
o o
f d
eli
ver
y t
ime
to
dis
tan
ce t
ravel
led
Th
e su
b-i
nd
icato
rs m
easu
re t
he
ord
ers
deli
ver
ed b
y t
he
requ
este
d t
ime
an
d p
oss
ible
del
ays
of
surg
ical
pro
ced
ure
s. O
n-t
ime
deli
ver
ies
posi
tively
aff
ect
th
e
qu
ali
ty a
nd
pro
du
ctiv
ity o
bje
ctiv
es,
wh
ile
avo
idin
g
cost
s o
f ex
ped
itin
g o
rder
s.
Cli
nic
al
staff
invo
lvem
ent
(CS
I)
Th
e am
ou
nt o
f ti
me
cli
nic
al st
aff
is
bu
sy
wit
h
logis
tics
ta
sks,
ra
ther
th
an
thei
r
core
act
ivit
ies
Tim
e sp
ent
at
log
isti
cs
act
ivit
ies
Tim
e sp
ent
to r
equ
est/
retr
ieve
sto
ck-o
ut
item
s
Fre
qu
ency
an
d t
ime
of
leavin
g O
R
Cli
nic
al
staff
mu
st b
e re
lieved
as
mu
ch a
s p
oss
ible
fro
m
an
y l
og
isti
cs a
ctiv
itie
s in
ord
er t
o f
ocu
s on
th
eir
core
act
ivit
y.
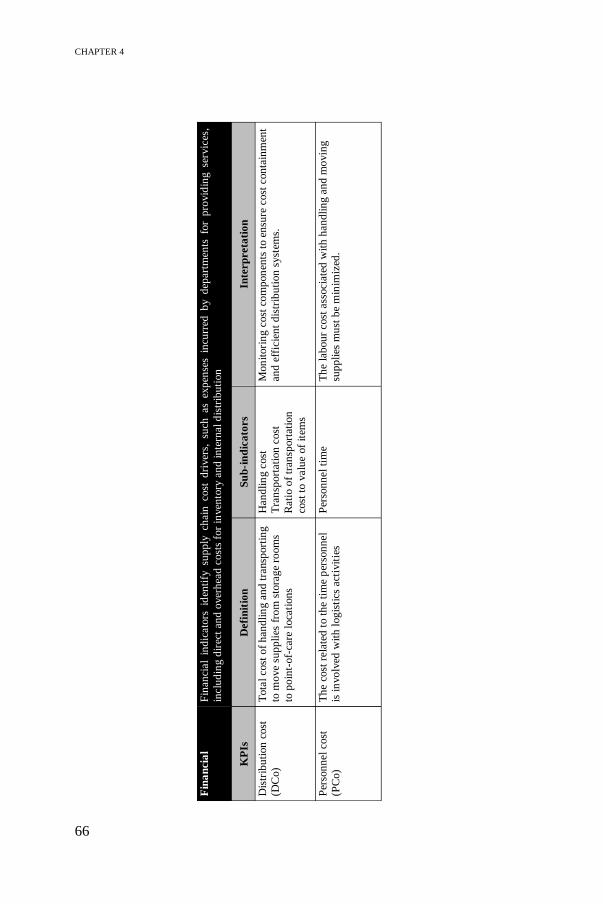
CHAPTER 4
66
Fin
an
cia
l F
inan
cial
ind
icato
rs id
enti
fy su
pp
ly ch
ain
cost
d
river
s, su
ch as
exp
ense
s in
curr
ed b
y d
epart
men
ts fo
r p
rovid
ing se
rvic
es,
inclu
din
g d
irec
t an
d o
ver
hea
d c
ost
s fo
r in
ven
tory
an
d i
nte
rnal
dis
trib
uti
on
KP
Is
Defi
nit
ion
S
ub
-in
dic
ato
rs
Inte
rp
reta
tio
n
Dis
trib
uti
on
cost
(DC
o)
Tota
l cost
of
han
dli
ng a
nd
tra
nsp
ort
ing
to m
ove
sup
pli
es f
rom
sto
rag
e ro
om
s
to p
oin
t-of-
care
loca
tion
s
Han
dli
ng c
ost
Tra
nsp
ort
ati
on
cost
Rati
o o
f tr
an
sport
ati
on
cost
to v
alu
e of
item
s
Mon
itori
ng c
ost
co
mp
on
ents
to e
nsu
re c
ost
con
tain
men
t
an
d e
ffic
ien
t d
istr
ibu
tion
syst
ems.
Per
son
nel
cost
(PC
o)
Th
e co
st r
ela
ted
to t
he
tim
e p
erso
nn
el
is i
nvo
lved
wit
h l
og
isti
cs a
ctiv
itie
s
Per
son
nel
tim
e
Th
e la
bou
r cost
ass
ocia
ted
wit
h h
an
dli
ng a
nd
mo
vin
g
sup
pli
es m
ust
be
min
imiz
ed.

PRIORITIZATION OF PERFORMANCE INDICATORS USING ANP
67
P
ro
du
cti
vit
y/
Org
an
isa
tio
n
Pro
du
ctiv
ity
/Org
an
isati
on
in
vo
lves
op
erati
on
al
con
tro
l m
etri
cs
for
log
isti
cs d
epart
men
ts u
sed
fo
r st
ream
lin
ing
p
roce
sses
,
red
uci
ng c
ost
s, f
acil
itati
ng i
nfo
rmati
on
flo
w a
nd
en
han
cin
g p
rovid
ed c
are
ser
vic
es
KP
Is
Defi
nit
ion
S
ub
-in
dic
ato
rs
Inte
rp
reta
tio
n
Case
cart
eff
icie
ncy (
CC
E)
Th
e avail
ab
ilit
y a
nd
uti
liza
tion
of
case
cart
s to
pro
vid
e su
rgeon
s w
ith
th
e
requ
ired
su
pp
lies
Case
cart
avail
ab
ilit
y
Case
cart
uti
liza
tion
Th
e p
rod
uct
ivit
y o
f th
e lo
gis
tics
tea
m i
mp
roves
if c
ase
cart
s are
eff
icie
ntl
y u
sed
in
ord
er
to e
lim
inate
wast
e or
rever
se l
og
isti
cs f
low
s. C
ase
cart
uti
liza
tion
dep
end
s on
the
acc
ura
cy o
f p
hysi
cian
pre
fere
nce
card
s an
d t
hus
has
an
im
pact
on
both
th
e d
istr
ibu
tion
an
d i
nven
tory
syst
em.
Deli
ver
y
frequ
ency (
DF
)
Th
e n
um
ber
of
vis
its
to d
ecen
tral
stora
ge
loca
tion
s to
del
iver
or
rep
len
ish
item
s in
th
ese
loca
tion
s
% o
f it
em
s re
ple
nis
hed
Sca
nn
ing f
requ
ency
Revie
w p
erio
d
Th
e n
um
ber
of
vis
its
to d
ecen
tral
stora
ge
roo
ms
mu
st b
e
red
uce
d b
y i
ncr
easi
ng t
he
nu
mb
er o
f it
em
s re
ple
nis
hed
or
incr
easi
ng t
he
revie
w p
erio
d,
wh
ich
in
tu
rn w
ill
dec
rease
dis
trib
uti
on
cost
s.
Pro
ces
s
stan
dard
izati
on
(S)
Th
e ab
ilit
y t
o s
imp
lify
work
flow
s
bet
wee
n o
per
ati
ng r
oom
s an
d i
mp
rove
work
ing c
on
dit
ion
s
Un
iform
/sta
nd
ard
ized
work
flo
ws
an
d p
ick
ing
list
s
% o
f sc
an
nab
le i
tem
s
Th
e su
b-i
nd
icato
rs m
on
itor
init
iati
ves
to s
imp
lify
work
flo
ws
by i
ncr
easi
ng t
he
nu
mb
er o
f sc
an
nab
le i
tem
s
an
d s
tan
dard
izin
g t
he
lay
ou
t o
f p
ick
ing l
ists
th
rou
gh
ou
t
the
OT
, w
hic
h i
n t
urn
wil
l re
du
ce
DC
o a
nd
im
pro
ve
the
qu
ali
ty o
f th
e d
istr
ibu
tion
syst
em.
Per
son
nel
man
agem
ent
(PM
)
A m
easu
re o
f h
ow
to o
bta
in,
use
an
d
main
tain
a s
ati
sfie
d w
ork
forc
e
Per
son
nel's
sati
sfact
ion
Work
load
dis
trib
uti
on
Per
son
nel
flexib
ilit
y
Per
son
nel
uti
liza
tion
Erg
on
om
ics
frie
nd
lin
ess
Em
plo
yee
invo
lvem
ent
is a
cru
cia
l su
cces
s p
ara
met
er
for
eff
icie
ntl
y o
rgan
isin
g t
he
log
isti
cs a
ctiv
itie
s. I
n
ad
dit
ion
, in
crea
sin
g t
he
ab
ilit
y t
o d
o a
ll t
ask
s
(fle
xib
ilit
y)
hel
ps
to s
trea
mli
ne
the
op
erati
on
s.

CHAPTER 4
68
4.2.3 Performance indicator selection and prioritization using
ANP
KPI selection and prioritization problems can be solved as a MCDM problem (Carlucci
2010). The KPIs do not equally contribute to the overall performance of logistics
processes. ANP is recommended as a prioritization methodology which takes into
account stakeholder judgments. Moreover, the interrelationship property of ANP is
particularly important when addressing topics related to performance management due
to the existence of feedback relationships between indicators. For example, Supeekit
et al. (2016) show that a change in supporting process efficiency results in a change in
clinical care process efficiency. This section presents an ANP-based prototype to select
and prioritize indicators that could be of any importance for measuring the efficiency
of the healthcare supply chain processes, illustrated for a case study at the OT of the
University Hospital in Leuven (UZ Leuven). For more detailed information on the
ANP method, the interested reader is referred to the work of Saaty (2008).
Step 1 – Model construction
In the first step of the ANP methodology, the model is constructed based on the
problem formulation. ANP structures decision problems into a network of clusters,
nodes and dependency relations among the network elements. Figure 4-2 displays the
generic network structure for performance management of inventory and distribution
systems in hospitals. The clusters and nodes refer to the objectives and KPIs
respectively, which are based on Table 4-1 and Table 4-2.
At the top level, the goal is defined as ranking KPIs to measure efficiency of OT
logistics processes. A distinction is made between inventory and distribution activities,
where the former represents the process of storing disposable medical-surgical
supplies and the latter refers to replenishment policies for getting materials at the right
place and time for surgical procedures. The ANP ranking will guide hospital managers
to identify improvement opportunities for both processes that will enhance overall OT
logistics performance.
At the second and third level, the clusters contain respectively the objectives and KPIs
for inventory and distribution processes. The definitions can be found in Table 4-1 and
Table 4-2. Remark that the KPIs in the tables slightly deviate from the ones presented
in Table 3-1 and Table 3-2 as extracted from the literature review. Customized to the
OT setting, the time objective is important for determining replenishment or

PRIORITIZATION OF PERFORMANCE INDICATORS USING ANP
69
distribution policies, but it is not considered as an objective for inventory management.
Clinical Staff Involvement (CSI) is identified as a time-related KPI and thus needs to
be re-categorized to the distribution indicators. Furthermore, we decompose
preparation time into Replenishment Lead Time (RLT) and Response Time (RT) to
distinguish between the time needed for replenishing and the ability to deliver on time.
Moreover, finding a workload balance is considered as a time-related KPI, though in
this setting it is shifted to productivity/organisation to measure staff satisfaction within
the Personnel Management (PM) KPI. In addition, patient safety is a key parameter to
determine the quality of the inventory system. In this work, patient safety is indirectly
included within Inventory Criticality (ICr), which measures the impact of errors or
delays of supplies on the surgical procedure (see Table 4-1). Patient safety is difficult
to measure quantitatively, whereas the Vital-Essential-Desirable (VED) analysis
provides a quantitative measure for ICr.
Finally, ANP considers inner dependencies (i.e. elements of a cluster depend on each
other) or outer dependencies (i.e. feedback between clusters from different levels)
among the network elements (Van Horenbeek and Pintelon 2014). The direction of the
arrow determines the relationship between the elements or clusters. For example,
Inventory Visibility (IV) is inner dependent on Inventory Service Level (ISL) since
higher stock levels will decrease the stock-out rate and thus improve ISL. In addition,
an increase in stock levels implies a larger Inventory Cost (ICo) which specifies the
outer dependence of ICo on IV and ISL. The relationships are described by inner link
A and outer link B respectively in Figure 4-2.

CHAPTER 4
70
Step 2 – Building pairwise comparison matrices
After customizing the network structure to the context-specific problem, pairwise
comparison matrices are constructed for each relationship between clusters and/or
nodes in the network. The pairwise comparison approach is based on Saaty’s nine-
point scale to derive decision makers’ preferences (Karpak, 2017; Saaty, 2008, 2010).
Next, the priorities or weights of each criterion can be derived from the pairwise
comparison matrix Wi by solving the principal eigenvector problem in Equation 4.1.
In this equation, λmax is the largest or principal eigenvalue of matrix Wi and w is the
local priority vector containing the weights (Saaty, 1990a). As an illustrative example,
Table 4-3 presents a pairwise comparison matrix for the inventory problem, indicating
the preferences of the OT logistics manager, namely how much an indicator in a row
is preferred to indicators in the columns. Table 4-3 illustrates that, with respect to the
‘Quality’ objective, ‘Inventory service level’ is five times more important or preferred
than ‘Inventory visibility’. The column ‘Priorities’ contains the local priority vector,
Figure 4-2. A generic hospital logistics performance measurement framework.

PRIORITIZATION OF PERFORMANCE INDICATORS USING ANP
71
representing the weight of each element in the pairwise comparison matrix while
always considering the goal criterion in the network.
𝑊𝑖 𝑤 = 𝜆𝑚𝑎𝑥 𝑤 (4.1)
Table 4-3. Pairwise comparisons of indicators with respect to 'Quality' objective.
Performing pairwise comparisons in a consistent way is almost never the case.
Therefore, Saaty (2008) recommends calculating a Consistency Ratio (CR) with a
threshold of 10% for all judgments of the decision makers. If this ratio exceeds the
threshold, judgments must be revised or the weighted consistency method by Jarek
(2016) can be used to reduce inconsistency without changing decision makers’
judgments. CR is included in the final column of Table 4-3. CR is calculated as the
ratio of the Consistency Index (CI) and the average random consistency index (RI),
which is dependent on the rank n of the square matrix Wi as can be seen in Table 4-4
(Saaty, 2013). CI is calculated in Equation 4.2. Finally, it is important to note that other
challenges can be encountered in this step, such as uncertainty or vagueness of
preferences, gaps in knowledge or lack of problem understanding, or conflicts between
different decision makers, which may lead to wrong decisions based on the framework.
𝐶𝐼 =𝜆𝑚𝑎𝑥 − 𝑛
𝑛 − 1 (4.2)
Table 4-4. Random index (RI) (Saaty, 2013).
Step 3 – Supermatrix formation and overall priority calculation
The third step of the ANP methodology consists of composing a supermatrix including
all interactions between clusters and/or nodes in the network to describe the impact of
a row element on the column elements. The local priority vectors obtained in step 2
form the segments of the supermatrix. Three types of supermatrices can be
distinguished, namely the unweighted, weighted and limit supermatrix. The
Quality ISL IV IA ICr Priorities CR
Inventory service level 1 5 5 1/3 0.305 0.058
Inventory visibility 1/5 1 1 1/5 0.078
Inventory accuracy 1/5 1 1 1/5 0.078
Inventory criticality 3 5 5 1 0.538
n 1 2 3 4 5 6 7 8 9 10 …
RI 0 0 0.52 0.89 1.11 1.25 1.35 1.40 1.45 1.49 …

CHAPTER 4
72
unweighted supermatrix (see Table 4-5) contains the local priority vectors as obtained
by the pairwise comparisons of the OT logistics manager in this test design. Table 4-3
provides the priority vectors for the quality-related KPIs in the first column. The
priority vectors for the other elements are derived in a similar way.
Table 4-5. Unweighted supermatrix for inventory management network.
Quality Cost Productivity O ISL IV IA ICr ICo VoI ITu IU PS
Objectives (O) 0.000 0.000 0.000 0.000 0.000 0.000 0.000 0.000 0.000 0.000
Inventory
service level
(ISL)
0.305 0.000 0.750 0.800 0.614 0.625 0.540 0.429 0.439 0.594
Inventory
visibility (IV)
0.078 0.088 0.000 0.200 0.117 0.136 0.163 0.429 0.265 0.249
Inventory
accuracy (IA)
0.078 0.195 0.250 0.000 0.268 0.238 0.297 0.143 0.110 0.157
Inventory
criticality (ICr)
0.538 0.717 0.000 0.000 0.000 0.000 0.000 0.000 0.187 0.000
Inventory cost
(ICo)
0.750 0.000 0.200 0.500 0.000 0.000 1.000 0.800 0.000 0.750
Value of
inventory (VoI)
0.250 0.000 0.800 0.500 0.000 1.000 0.000 0.200 0.000 0.250
Inventory
turnover (ITu)
0.167 1.000 0.655 0.750 0.000 0.648 0.540 0.000 0.167 0.125
Inventory
usage (IU)
0.667 0.000 0.250 0.000 0.750 0.230 0.297 0.500 0.000 0.875
Product
standardization
(PS)
0.167 0.000 0.095 0.250 0.250 0.122 0.163 0.500 0.833 0.000
The clusters are not equally important as the objectives differ in how they contribute
to the overall performance of OT logistics processes. Therefore, clusters are also
pairwise compared to establish their relative importance by deriving cluster weights.
Link C in Figure 4-2 represents the inner dependence loop within the objective cluster
and the cluster weights can be found in Appendix A. The cluster weights are used to
normalize the unweighted supermatrix and subsequently form the weighted
supermatrix. Finally, the weighted supermatrix is raised to large powers in order to
reach convergence or stability. This matrix with equal scores in all rows is called the
limit supermatrix, and the scores denote the overall or global priorities of each element
in the network. The weighted supermatrix and limit supermatrix are shown in
Appendix A.
PRIORITIZATION OF PERFORMANCE INDICATORS USING ANP
73
Step 4 – Prioritization and selection of KPIs
The limit supermatrix contains the overall priorities of the indicators, representing the
impact of each element on every other element in the network with which it interacts.
Table 4-6 presents the global priorities of the indicators (column 4), together with a
ranking of performance indicators (column 5) for measuring the efficiency of the OT
supply chain operations. The objective weights (column 2) are determined based on
the weights of the individual indicators. For further analysis, the indicator weights are
used to assess different logistics policies. The highest-ranked indicators represent the
most important KPIs with the greatest contribution to improving inventory
management and distribution systems.
4.2.4 Results
The example illustrates a methodological approach for ranking logistics objectives and
selecting KPIs that contribute most to improving OT supply chain processes, such as
inventory and distribution. The generic network in Figure 4-2 is established based on
literature and interviews with hospital logistics experts. In this initial prototype of the
logistics performance management framework, one stakeholder, namely the OT
logistics manager at UZ Leuven, has judged the pairwise comparisons. According to
this stakeholder’s preferences, the following preliminary results are found.
For improving inventory management systems, quality is the first-ranked objective
with a weight of 68% (see Table 4-6) and thus the greatest contributor to efficiency
improvements. Also note the low weight for the financial objective (i.e. 6%) which is
surprising as the logistics manager’s goal is to reduce costs while maintaining high
service levels. The objective weights are based on the individual indicator weights,
though they are independent of the number of indicators per objective. A sensitivity
analysis has been performed to verify the objective weights when removing one KPI
(e.g. inventory visibility) in the quality objective. Similar results can be found, even a
small increase in the quality weight to 69% has been observed because the cluster
weights in Appendix A show that quality has the most impact on both financial and
productivity objectives. The final column in Table 4-6 computes the cumulative
weights by sorting the indicators in a descending order according to their weight-based
ranking. When exploring the results into detail, the cumulative percentage shows that
the four highest ranked indicators account for almost 70% of the total weight assigned
to all indicators. These four indicators are inventory service level, inventory criticality,
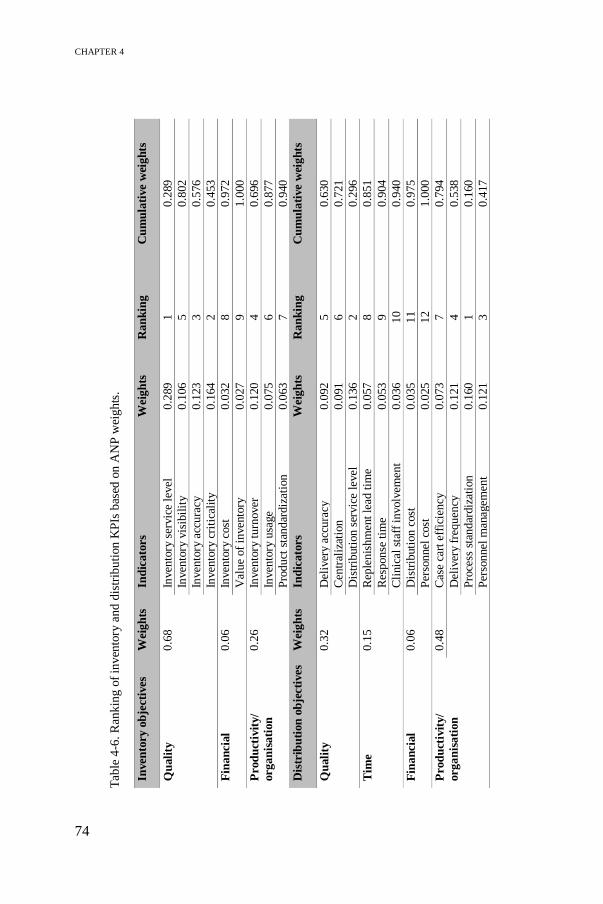
CHAPTER 4
74
Tab
le 4
-6. R
ank
ing
of
inv
ento
ry a
nd
dis
trib
uti
on K
PIs
bas
ed o
n A
NP
wei
ghts
.
Inven
tory
ob
ject
ives
W
eigh
ts
Ind
icato
rs
Wei
gh
ts
Ran
kin
g
Cu
mu
lati
ve
wei
gh
ts
Qu
ali
ty
0.6
8
Inven
tory
ser
vic
e le
vel
0.2
89
1
0.2
89
Inven
tory
vis
ibil
ity
0.1
06
5
0.8
02
Inven
tory
acc
ura
cy
0.1
23
3
0.5
76
Inven
tory
cri
tica
lity
0.1
64
2
0.4
53
Fin
an
cial
0.0
6
Inven
tory
cost
0.0
32
8
0.9
72
Val
ue
of
inven
tory
0.0
27
9
1.0
00
Pro
du
ctiv
ity/
org
an
isati
on
0.2
6
Inven
tory
turn
over
0.1
20
4
0.6
96
Inven
tory
usa
ge
0.0
75
6
0.8
77
Pro
duct
sta
ndar
diz
atio
n
0.0
63
7
0.9
40
Dis
trib
uti
on
ob
ject
ives
W
eigh
ts
Ind
icato
rs
Wei
gh
ts
Ran
kin
g
Cu
mu
lati
ve
wei
gh
ts
Qu
ali
ty
0.3
2
Del
iver
y ac
cura
cy
0.0
92
5
0.6
30
Cen
tral
izat
ion
0.0
91
6
0.7
21
Dis
trib
uti
on s
ervic
e le
vel
0.1
36
2
0.2
96
Tim
e 0.1
5
Rep
lenis
hm
ent
lead
tim
e 0.0
57
8
0.8
51
Res
ponse
tim
e 0.0
53
9
0.9
04
Cli
nic
al s
taff
involv
emen
t 0.0
36
10
0.9
40
Fin
an
cial
0.0
6
Dis
trib
uti
on c
ost
0.0
35
11
0.9
75
Per
sonnel
cost
0.0
25
12
1.0
00
Pro
du
ctiv
ity/
org
an
isati
on
0.4
8
Cas
e ca
rt e
ffic
iency
0.0
73
7
0.7
94
D
eliv
ery
freq
uen
cy
0.1
21
4
0.5
38
Pro
cess
sta
ndar
diz
atio
n
0.1
60
1
0.1
60
Per
sonnel
man
agem
ent
0.1
21
3
0.4
17

PRIORITIZATION OF PERFORMANCE INDICATORS USING ANP
75
inventory accuracy and inventory turnover. Inventory service level is the most
important indicator in the OT setting, representing the ability to fulfil orders from stock
on-hand. At the operational level, inventory service level can be measured using sub-
indicators inventory availability or stock-out rate. The second most important indicator
is inventory criticality, measuring the impact of errors, delays of supplies or adverse
effects on the surgical procedure. Inventory criticality is indirectly related to patient
safety, which is the ultimate goal in any healthcare process. Third, having accurate
inventory is important to eliminate overstocking or hoarding behaviour of clinical staff
who hold many items in stock as a response to the high variability encountered in the
OT. Furthermore, product standardization and the cost indicators appear to be less
important compared to the quality-related indicators. However, improving product
standardization and introducing appropriate product/location identification standards
is crucial to reduce variability due to physician preferences, and hence improve
inventory control and reduce inventory costs.
The framework can also be customized to guide hospital management in selecting and
prioritizing KPIs related to internal distribution or replenishment policies to point-of-
care, ensuring that the right materials are at the right place and time. Table 4-6 shows
that productivity/organisation (48%) and quality (32%) are the main objectives when
evaluating distribution processes. It is remarkable that productivity is ranked higher
compared to quality. A plausible explanation is that the logistics manager emphasizes
process standardization, personnel management and delivery frequency as the relevant
KPIs to simplify the workflow and enhance staff satisfaction. Together with
distribution service level, these four indicators make up more than 50% of all
indicators. Notice that the time indicators have lower weights, although the logistics
manager aims to provide all materials for surgical procedures in time.
The findings show that different objectives and KPIs are selected dependent on the
process type in order to create a clear performance definition. The ANP-based
prototype serves as a reference model providing hospital stakeholders with a better
understanding of KPIs that are most important for a specific problem, or in other
words, it helps identifying the best set of KPIs for assessing the performance of
inventory and distribution systems. This study contributes to literature by proposing a
methodological and transparent approach, integrating multiple indicators considered
by traditional OR/OM techniques to enhance decision making based on context-
specific objectives. The prototype is based on ANP to calculate global priority weights,
which allows to select and prioritize relevant KPIs to improve inventory and

CHAPTER 4
76
distribution systems. Moreover, the prototype enables quantification of trade-offs
between different objectives, and thus improves evidence-based decision making when
the OT logistics manager defines service levels in order to reduce costs or reduce
number of stock-outs.
4.2.5 Discussion
The increased pressure to reduce costs forces hospital managers to develop new
managerial tools to ensure efficient operations of their care delivery systems (Serrou
and Abouabdellah 2016). The proposed approach selects a set of KPIs to support
decision making and guides hospital stakeholders in identifying performance gaps or
deficient areas. Step 1 discusses the inclusion or exclusion of criteria compared to the
literature review in Section 3.2.1. Some indicators are combined or eliminated due to
overlap or too broad interpretation. The prototype can be used with any set of criteria,
and thus is generic enough to evaluate other healthcare supply chain processes by
customizing it to specific contexts. In this case study, the prototype is adapted to the
OT setting to evaluate internal logistics processes such as inventory and distribution
activities. Logistics-oriented KPIs in the OT setting are similar to any industrial setting,
but the weights attached to the KPIs can differ significantly between sectors. Indicators
such as inventory service level, inventory turnover or inventory cost are used to assess
traditional supply chain concepts, though the consequence of having a stock-out is far
more severe in a healthcare setting than in a manufacturing process and thus requires
a higher weight. In addition, hospitals have poor inventory management, lack of data
and non-standardized procedures due to physician preference cards, which complicates
KPI monitoring and results in costly and ineffective systems (Camp et al. 2014). This
prioritization approach contributes to supporting evidence-based decision making in
healthcare environments. Quantitative methods, such as ANP, can be applied to
prioritize a set of indicators. ANP is preferred over AHP because logistics-related
objectives are often interdependent, like for example quality and cost (Link B and C
in Figure 4-2). Moreover, ANP allows for balancing opposing influences, such as
different performance perspectives between logistics and medical stakeholders.
Two internal logistics activities are considered, namely inventory and distribution.
Both activities interact since distribution ensures that material stocks are replenished
in time such that stock-outs can be minimized. However, the prototype considers one
activity at a time, as the goal is to understand which decision criteria are important for
different process types. The results show that different objectives are important to
PRIORITIZATION OF PERFORMANCE INDICATORS USING ANP
77
evaluate inventory or distribution policies, with respectively quality and
productivity/organisation being the most important objectives. By obtaining efficient
inventory and distribution processes, the overall performance of the OT supply chain
will improve which in turn will enhance care processes. Similar results can be found
in literature. Hoeur and Kritchanchai (2015) and Kritchanchai et al. (2018) show the
significant impact of inventory management to the overall performance of healthcare
logistics. We elaborate on this work by suggesting a structured approach to translate
inventory objectives into relevant indicators and to prioritize between KPIs in order to
identify opportunities for efficiency gains.
The results show that the four highest-ranked KPIs – inventory service level, accuracy,
criticality and turnover – contribute most to the overall performance of the inventory
system. In Chapter 5, several inventory control policies will be evaluated by tracking
KPIs and determining optimal parameter values. Moreover, our findings also confirm
the dominance of patient safety, which is represented by the indicator Inventory
Criticality, as being the ultimate goal in healthcare. Furthermore, product
standardization proves to be a significant enabler to reduce costs and variability and
improve healthcare supply chain performance (Camp et al. 2014; Longaray et al.
2018), though its importance has not yet been emphasized by the logistics manager.
Inventory costs are ranked in the last position, however the main goal of the logistics
flow is to hold inventory to guarantee availability while reducing costs (Carrus,
Marras, and Pinna 2015).
Besides proper inventory management, the logistics flow should also ensure timely
provision of medical supplies at the right place in the most efficient way. Therefore,
the prototype also covers KPIs measuring the performance of internal distribution
systems and it provides valuable insights, e.g. in the case study productivity has a
higher weight than quality. This is mainly due to the high importance attached to
simplifying the logistics flow for hospital staff, which is considered as the fourth goal
in the Quadruple Aim strategy for hospitals. Carrus et al. (2015), Pinna et al. (2015)
and Robinson and Kirsch (2015) also show the importance of balanced workload
distribution and process standardization in their work. Furthermore, the impact of
centralization on costs, service level and the workflow is also considered important,
which is confirmed by Pinna et al. (2015), Iannone et al. (2014) and Landry and
Beaulieu (2013).

CHAPTER 4
78
Furthermore, the case study draws the attention of the OT logistics manager to the
potential of the ANP-based prototype to be highly relevant in improving the logistics
flow. The outcome is a ranking of indicators used as a guideline for optimizing
inventory systems and distribution activities in order to provide high-quality patient
care in the most efficient way. The KPI ranking stimulates evidence-based decision
making, reflecting the contribution of logistics supporting activities to value-based
healthcare. For example, the logistics manager can justify decisions to hold items in
stock close to the operating room and to define a standardized workflow to increase
staff satisfaction. Other advantages are its transparency and systematic approach. The
prototype enables to evaluate the impact of new logistics practices, which improves
managerial communication significantly and in turn enhances stakeholder
commitment. Engaging stakeholders in the design and testing phase of the prototype
is crucial to develop a generic framework addressing various healthcare logistics
needs.
4.2.6 Sensitivity analysis
A final sensitivity or ‘what-if’ analysis is performed to validate the robustness of the
KPI prioritization approach. It helps in understanding which indicators drive changes
in the results and to what extent the ranking is valid when changing the importance of
the indicators (Piratelli, Claudio et al. 2010; Poh and Liang 2017). Typical ‘what-if’
questions can be: what if all stakeholders have equal importance in their judgments,
what if all criteria are equally important, what if one criterion is given more
importance, etc. Since the approach is heavily dependent on possibly uncertain
judgments of the decision makers to derive the weights of the indicators, the accuracy
of these judgments is crucial. A sensitivity check is performed whereby the ANP
network is extended with alternatives. These alternatives represent potential strategies
for controlling inventory or distribution activities in the OT setting. For inventory
management, three alternative inventory control policies are included based on the
objectives: cost minimization, service level maximization or inventory
standardization. Similarly for distribution, four objective-related alternative strategies
are added: centralization, time/distance ratio, distribution cost minimization and
balanced workload.
PRIORITIZATION OF PERFORMANCE INDICATORS USING ANP
79
In a single-factor sensitivity analysis, the weight of an indicator is varied, one at a time,
while keeping the remaining weights relatively unchanged, to examine the effect on
the ranking of alternatives (Modak, Ghosh, and Pathak 2018). The Super Decisions4
software is utilized to conduct the sensitivity analysis by varying the sensitivity
parameter, α, which provides a measure for comparative judgments of adjustments in
the priority vectors with respect to a specific node (Dobrea, Molănescu, and Busu
2015). The original ANP values of the alternatives are displayed when α equals 0.5.
Adjusting α with respect to a specific node can lead to changes in the ranking of
alternatives. For example, when the parameter value of inventory service level is
adjusted from 0.0001 to 0.9999 (see left plot in Figure 4-3), cost minimization (green
line) is found to be the best strategy for inventory control with a weight of 0.423,
followed by service level maximization (red line) and standardization (blue line) with
a weight of 0.306 and 0.271 respectively. However, beyond a parameter value
α=0.274, service level maximization raises to 0.751, whereas for cost minimization the
weight decreases to 0.103 and standardization to 0.146 at α=0.9999. Similarly, the
right plot of Figure 4-3, shows how the ranking of alternatives changes by adjusting
α for the inventory cost indicator. At α=0.580, which is similar to an increase of 15%
in the inventory cost weight, cost minimization policies are preferred above service
level. At smaller parameter values, service level maximization is the recommended
strategy. This analysis guides hospital stakeholders in selecting appropriate inventory
control policies by quantifying the trade-off between costs and service level. The plots
provide insights into the stakeholders’ preferences to maximize service levels, which
comes at the expense of increasing inventory costs. Strategies for inventory
standardization in order to improve productivity are dominated by the main trade-off
between balancing inventory levels and costs. However, improving product
standardization will reduce costs and simplify inventory control, and thus is important
when tackling the trade-off between cost and service level.
4 Super decisions is a computer software for decision-making purposes within several areas ranging from
manufacturing and aviation to service organisations. AHP and ANP are implemented in the software to combine
judgment and data to obtain rankings and predict outcomes (Creative Decisions Foundation 2019).
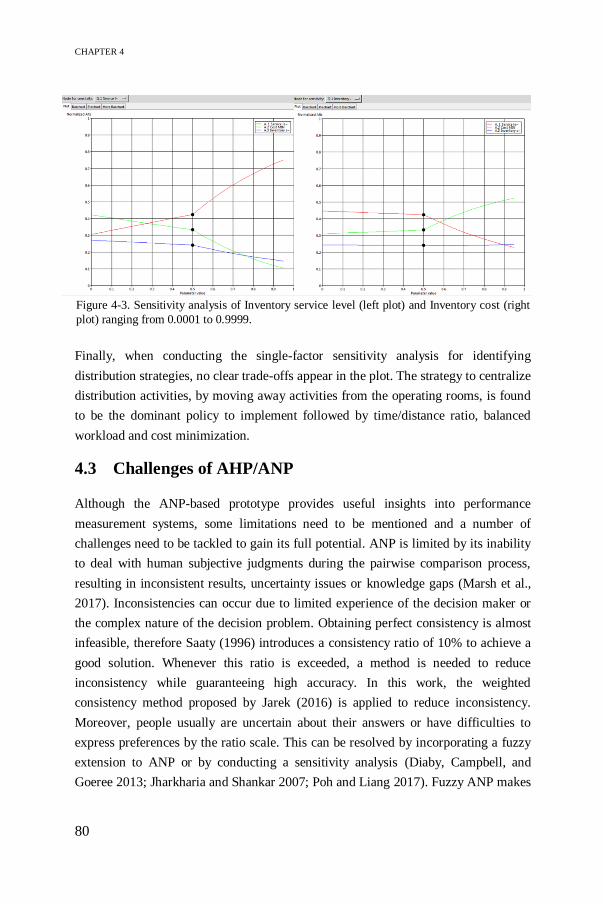
CHAPTER 4
80
Finally, when conducting the single-factor sensitivity analysis for identifying
distribution strategies, no clear trade-offs appear in the plot. The strategy to centralize
distribution activities, by moving away activities from the operating rooms, is found
to be the dominant policy to implement followed by time/distance ratio, balanced
workload and cost minimization.
4.3 Challenges of AHP/ANP
Although the ANP-based prototype provides useful insights into performance
measurement systems, some limitations need to be mentioned and a number of
challenges need to be tackled to gain its full potential. ANP is limited by its inability
to deal with human subjective judgments during the pairwise comparison process,
resulting in inconsistent results, uncertainty issues or knowledge gaps (Marsh et al.,
2017). Inconsistencies can occur due to limited experience of the decision maker or
the complex nature of the decision problem. Obtaining perfect consistency is almost
infeasible, therefore Saaty (1996) introduces a consistency ratio of 10% to achieve a
good solution. Whenever this ratio is exceeded, a method is needed to reduce
inconsistency while guaranteeing high accuracy. In this work, the weighted
consistency method proposed by Jarek (2016) is applied to reduce inconsistency.
Moreover, people usually are uncertain about their answers or have difficulties to
express preferences by the ratio scale. This can be resolved by incorporating a fuzzy
extension to ANP or by conducting a sensitivity analysis (Diaby, Campbell, and
Goeree 2013; Jharkharia and Shankar 2007; Poh and Liang 2017). Fuzzy ANP makes
Figure 4-3. Sensitivity analysis of Inventory service level (left plot) and Inventory cost (right
plot) ranging from 0.0001 to 0.9999.
PRIORITIZATION OF PERFORMANCE INDICATORS USING ANP
81
use of crisp numbers to assess the pairwise comparisons. Crisp numbers are often
defined as triangular numbers representing three parameters, namely the smallest
value, the most promising value and the largest value. However, Chatterjee and
Mukherjee (2013) argue that Fuzzy AHP does not outperform AHP. In case of
knowledge gaps, simple heuristic rules or learning algorithms can be used to complete
the pairwise comparison matrix (Hua, Gong, and Xu 2008). This work prefers to use
simple heuristic rules because learning algorithms require time-consuming teaching
examples.
Another limitation is related to the sample size of the ANP application. A biased
attitude of the single decision maker may result in subjectivity when selecting the
alternatives, indicators and their weights. However, multiple stakeholders with
possibly conflicting goals for efficiency management are involved in the OT supply
chain. ANP accommodates a group decision-making approach by aggregating
individual opinions to prevent a single decision-maker’s bias, and hence improve the
robustness of the framework (Marsh et al., 2017; Van Horenbeek & Pintelon, 2014).
The expert group preferably represents a responsible person of each department at
different organisational levels. However, when more than one expert is involved, the
challenge pops up to deal with potentially conflicting views, which may lead to
discrepancies in the final ranking. In literature, aggregation techniques such as
consensus, vote, compromise or geometric mean of individual judgments are proposed
(Dyer and Forman 1992; Jharkharia and Shankar 2007). Consensus is often believed
to be the best approach to balance conflicting views by discussion. Aggregating
individual results can lead to an average result, which can cause dissatisfaction of all
stakeholders. Alternatively, Song and Hu (2009) suggest to cluster stakeholders
according to similarities between priority vectors and calculate the weighted arithmetic
mean for all clusters. In case of biased decisions, sensitivity analysis is useful to
investigate the impact of changing weights.
Finally, we assume that all the proposed KPIs can be measured. However, the lack of
information systems and missing product identification numbers or data standards
typically lead to poor performance management at the hospital supply chain
(Kritchanchai et al. 2018). Different types of technologies, such as RFID or cloud-
based platforms are potential enablers for a successful implementation and enhanced
system efficiency.

CHAPTER 4
82
Table 4-7. Solutions to deal with challenges in a MCDM study.
Table 4-7 presents an overview of solutions to the challenges that occur in AHP/ANP
studies. In the next section, the methods indicated in italic are applied to identify multi-
stakeholder value for medical decision making by using AHP. According to Porter
(2010), the overarching goal for any stakeholder must be to maximize value for
patients. Value is defined as health outcomes (i.e. quality of care) achieved per dollar
spent (Mukherjee 2008), and value improvement reflects the shared goal that unites
the interests and activities of patients, payers, care providers and suppliers. However,
measuring value in multiple dimensions is a major challenge to OR/OM modellers who
need to ensure sound modelling of contradicting preferences by engaging multiple
stakeholders. MCDM is aligned with value-based healthcare as it provides synthesis
and enables aggregating value in multiple dimensions (Goetghebeur et al. 2012;
Oliveira, Mataloto, and Kanavos 2019).
4.3.1 Medical decision making for value-based healthcare:
challenges in AHP
This case study is conducted at UZ Leuven during the first half of 2018 (Jorissen 2018).
We focus on the urology department, and more particular prostate cancer since it is
among the most commonly diagnosed type of cancers observed among men after skin
cancer (Belgian Cancer Registry 2017; Richman et al. 2005; Roth, Weinberger, and
Nelson 2008). Different treatment options are available, such as surgery, radiation or
active surveillance, though we focus only on surgery or (robot-assisted) radical
prostatectomy in this work. Recently it has become more important to guide patients
in the treatment selection process and follow-up of the disease. Patient preferences and
Challenges Solution methods References
Inconsistency Weighted consistency method
Non-linear programming approach based on
transitive cycles principle
Complete transitivity convergence algorithm
Jarek, 2016
Pereira and Costa, 2015
Tseng et al., 2007
Knowledge
gaps
Simple heuristic rules
Learning algorithms
Dempster-Shafer (DS) AHP
Hua et al., 2008
Uncertainty Fuzzy AHP/ANP
Sensitivity analysis
Diaby et al., 2013
Jharkharia and Shankar,
2007
Conflicting
judgments
Weighted geometric mean
Cluster similarity approach
Moreno-Jiménez et al.,
2016
Song and Hu, 2009

PRIORITIZATION OF PERFORMANCE INDICATORS USING ANP
83
value for prostate cancer treatments are studied in the literature (Loeb, 2016), but
discrepancies remain between what patients value most and what medical
professionals (e.g. urologists, surgeons, radiotherapists, etc.) think that patients value
most. The increasingly central role of patients suggests an emerging role for shared
medical decision making in treatment selection (Litwin & Tan, 2017). In shared
decision making, patients need to be informed about the available treatment options
and possible consequences of the selected therapy. This section presents a pilot study
to detect misalignment between patient preferences and medical experts in order to
identify the most important aspects that determine value in radical prostatectomy. By
focusing on the modelling perspective, we show the feasibility and challenges of
applying AHP as a guideline for medical decision making and identify opportunities
for future research.
4.3.1.1 Methodology
The decision problem is to identify a definition for value (i.e. quality/cost) in this
treatment, considering multiple, possibly conflicting stakeholders’ perspectives. Value
measurement should encompass all provided services that aim for meeting the desired
patient outcomes. In case of radical prostatectomy, this involves the three stages of the
treatment including the pre-operative, per-operative and post-operative stage. Value
measurement over these stages is needed to realign reimbursement practices with
value, so that it provides payments covering the full care cycle as a reward for value
creation. However, different perceptions of quality of care between various
stakeholders and institutions influence the outcomes. Therefore, we present a model
for measuring the quality of prostate cancer surgery that encompasses the three
treatment stages. Multiple patient outcomes, however, can be competing (e.g. near-
term safety versus long-term functionality), and thus must be traded-off against each
other. In this work, we map the trade-offs, set priorities and construct a ranking of
quality criteria according to their relative importance depending on each stakeholder’s
perspective. This is a problem including multiple criteria, which necessitates the use
of MCDM techniques.
AHP is selected to be most suitable for solving this prioritization problem. It is a
transparent tool to support decision makers by structuring the problem into a hierarchy
and assigning weights to the quality criteria. The overall goal is shown at the top of the
hierarchy in Figure 4-4, namely identifying multi-stakeholder value definition in
radical prostatectomy treatment. At the second level of the AHP hierarchy, quality and
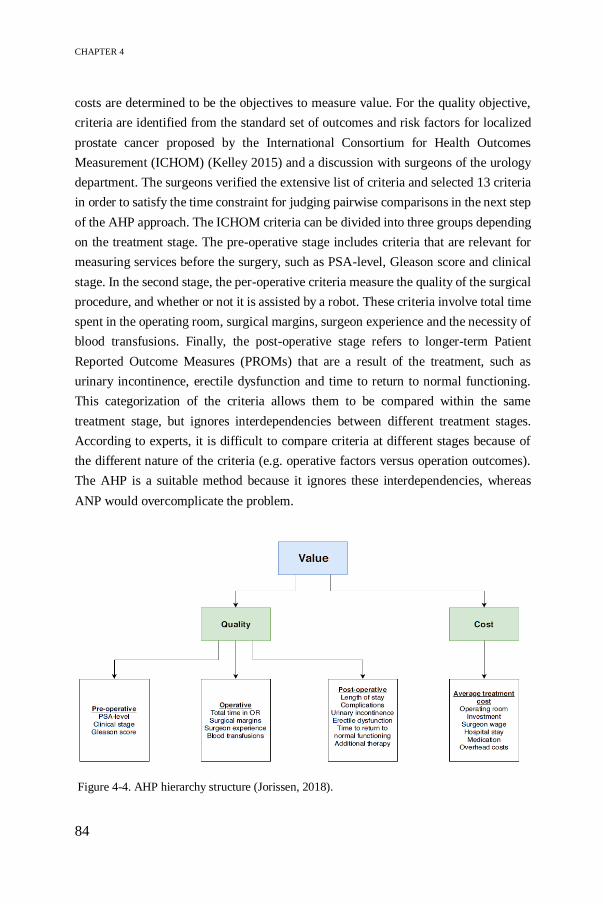
CHAPTER 4
84
costs are determined to be the objectives to measure value. For the quality objective,
criteria are identified from the standard set of outcomes and risk factors for localized
prostate cancer proposed by the International Consortium for Health Outcomes
Measurement (ICHOM) (Kelley 2015) and a discussion with surgeons of the urology
department. The surgeons verified the extensive list of criteria and selected 13 criteria
in order to satisfy the time constraint for judging pairwise comparisons in the next step
of the AHP approach. The ICHOM criteria can be divided into three groups depending
on the treatment stage. The pre-operative stage includes criteria that are relevant for
measuring services before the surgery, such as PSA-level, Gleason score and clinical
stage. In the second stage, the per-operative criteria measure the quality of the surgical
procedure, and whether or not it is assisted by a robot. These criteria involve total time
spent in the operating room, surgical margins, surgeon experience and the necessity of
blood transfusions. Finally, the post-operative stage refers to longer-term Patient
Reported Outcome Measures (PROMs) that are a result of the treatment, such as
urinary incontinence, erectile dysfunction and time to return to normal functioning.
This categorization of the criteria allows them to be compared within the same
treatment stage, but ignores interdependencies between different treatment stages.
According to experts, it is difficult to compare criteria at different stages because of
the different nature of the criteria (e.g. operative factors versus operation outcomes).
The AHP is a suitable method because it ignores these interdependencies, whereas
ANP would overcomplicate the problem.
Figure 4-4. AHP hierarchy structure (Jorissen, 2018).

PRIORITIZATION OF PERFORMANCE INDICATORS USING ANP
85
After constructing the hierarchy, AHP uses pairwise comparisons to extract
stakeholders’ preferences in order to prioritize the selected criteria. In total, 33 patients
(i.e. 11 pre-operative and 22 post-operative patients), 5 urologists, 3 members of the
nursing staff, 2 representatives of hospital management, 2 general practitioners (GPs)
and 1 representative of health insurances participate in this case study. From the
pairwise comparison matrix, the weights for the respective criteria, representing a
measure for the relative importance of the quality criteria in each treatment stage.
In the next step, the overall quality score can be calculated. Quality of care is defined
by multiple outcomes collectively. The Institute of Medicine (IOM) (2001) defines six
dimensions of quality of care, namely safe, effective, patient-centred, timely, efficient
and equitable care. In consultation with the urology department, the ICHOM criteria
in the treatment stages are reassigned to these pillars of quality in order to derive the
final weights for measuring the quality of prostate cancer surgery. The quality
objectives as defined by the IOM are discussed in Table 4-8.
Table 4-8. Overview of six dimensions of quality of care according to IOM (2001).
Quality of care Description Criteria
Safe Avoiding injuries to patients from the care that is
intended to help them
Complications (C)
Blood transfusions (BT)
Effective Providing services based on scientific knowledge
to all who could benefit and refraining from
providing services to those not likely to benefit
(avoid overuse and underuse, respectively)
Surgical margins (SM)
Surgeon experience (SE)
Additional therapy (AT)
Patient-centred Providing care that is respectful of and responsive
to individual patient preferences, needs and
values, and ensuring that patient values guide all
clinical decisions
Urinary incontinence
(UI)
Erectile dysfunction
(ED)
Time to return to normal
functioning (TTRF)
Timely Reducing waiting time and sometimes harmful
delays for both those who receive and those who
provide care
Waiting time is not
included in this study
Efficient Avoiding waste, including waste of equipment,
supplies, ideas and energy
Total time in operating
room (TOR)
Length of stay (LOS)
Equitable Providing care that does not vary in quality
because of personal characteristics such as gender,
ethnicity, geographic location, and socioeconomic
status
PSA level (PSA)
Gleason score (GS)
Clinical stage (CS)

CHAPTER 4
86
4.3.1.2 Results
In this section, we propose solutions to address typical challenges in AHP/ANP
studies, such as inconsistencies in pairwise comparisons, knowledge gaps and conflicts
between stakeholders. AHP is used to determine weights representing the relative
importance of several quality criteria while considering possibly conflicting interests
of different stakeholder groups. As an example, we discuss the AHP ranking of quality
criteria according to 11 pre-operative patients. The same procedure is applied to other
stakeholder groups.
A priority vector, containing the weights for each criterion, is obtained based on the
pairwise comparison matrix for each patient. Equation 4.3 presents the original
pairwise comparison matrix WO and priority vector wO for criteria involved in the pre-
operative treatment stage. More information on deriving weights according to the
principal eigenvector method can be found in Section 4.2 or in Saaty (1990).
𝑊𝑂 = (𝑃𝑆𝐴𝐶𝑆𝐺𝑆
) (1 9 1 7⁄
1 9⁄7
15
1 5⁄1
) 𝑤𝑂 = (
0.23440.06060.7050
) (4.3)
𝐶𝑅𝑂 = 0.7276
The consistency of this matrix is checked by calculating the consistency ratio. This
ratio should be lower than 10% to ensure qualitative judgments. In this example, the
ratio exceeds the threshold value and thus further computations are required. The
weighted consistency method by Jarek (2016) is applied to reduce inconsistency. In
this technique, the pairwise comparison matrix WO is adapted by multiplying the
priority vector wO with the reciprocal of its transpose. Then, the new pairwise
comparison matrix W1 takes into account the original stakeholder judgments by taking
the geometric mean of the original and adapted matrix (see Equation 4.4). This process
is repeated until the consistency constraint is satisfied. Equation 4.5 contains the final
pairwise comparison matrix WN and the corresponding priority vector wN.
𝑊1 = √[(𝑤0 ∗ (1
𝑤0
)𝑇) ∗ 𝑊0] (4.4)
𝑊𝑁 = (𝑃𝑆𝐴𝐶𝑆𝐺𝑆
) (1 5 1 4⁄
1 5⁄4
18
1 8⁄1
) 𝑤𝑁 = (
0.23700.06430.6986
) (4.5)

PRIORITIZATION OF PERFORMANCE INDICATORS USING ANP
87
𝐶𝑅𝑁 = 0.0904
The adjusted AHP-based priority vector wN, containing weights for every criterion in
the pre-operative treatment stage, is calculated for each stakeholder in each treatment
stage. Whenever the consistency ratio exceeds its limit, the weighted consistency
method, as described above, is applied.
The next step is to determine one ranking for the pre-operative patients group, by
integrating the priority vectors of the 11 pre-operative patients. However, different
experiences during the treatment or personal characteristics may cause conflicts within
the same stakeholder group. Taking normal average would not satisfy any stakeholder.
Song and Hu (2009) propose to use the cluster similarity approach to combine
stakeholders’ conflicting views within one stakeholder group. The degree of similarity
is calculated for all priority vector combinations by determining the distance between
two vectors dij. This distance value ranges between 0 and 1, indicating the degree of
similarity between the vectors. For example, vector 3 and 5, representing the criteria
weights for pre-operative patient 3 and 5 have a similarity degree of:
𝑑35 =𝑤3𝑤5
‖𝑤3‖‖𝑤5‖=
∑ 𝑤3𝑤5
√∑ 𝑤32 √∑ 𝑤5
2= 0.7638 (4.6)
The distance values for all vector combinations are combined into a similarity score
matrix, which is used for deciding on cluster groups. A threshold value of dij equal to
or greater than 0.80 is used to decide if the two vectors belong to the same cluster. This
step is iterated for every row in the matrix, resulting in a final cluster grouping. Next,
cluster weights are determined based on the cluster size. A bigger cluster gets a higher
weight as it represents more stakeholders, and thus will have higher impact on the final
result. The cluster weights are calculated as follows:
𝑤(𝐶1) =𝑆1
𝑆12 + 𝑆2
2 =8
82 + 32= 0.1096 (4.7)
𝑤(𝐶2) = 0.0411
Assume the pre-operative patients are divided into two clusters C1 and C2, with
respective cluster sizes S1=8 and S2=3. Cluster C1 contains the most stakeholders and
thus has the greatest weight. Finally, one ranking of quality criteria is defined,
reflecting the preferences of one stakeholder group. The Weighted Arithmetic Mean
(WAM) is used for multiplying cluster weights w(Ci) and priority vectors wi in the
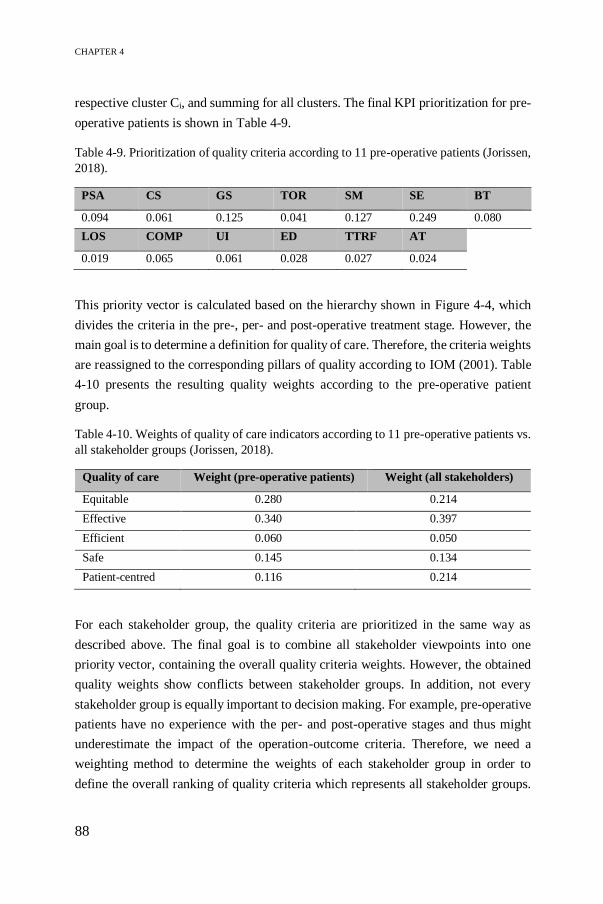
CHAPTER 4
88
respective cluster Ci, and summing for all clusters. The final KPI prioritization for pre-
operative patients is shown in Table 4-9.
Table 4-9. Prioritization of quality criteria according to 11 pre-operative patients (Jorissen,
2018).
PSA CS GS TOR SM SE BT
0.094 0.061 0.125 0.041 0.127 0.249 0.080
LOS COMP UI ED TTRF AT
0.019 0.065 0.061 0.028 0.027 0.024
This priority vector is calculated based on the hierarchy shown in Figure 4-4, which
divides the criteria in the pre-, per- and post-operative treatment stage. However, the
main goal is to determine a definition for quality of care. Therefore, the criteria weights
are reassigned to the corresponding pillars of quality according to IOM (2001). Table
4-10 presents the resulting quality weights according to the pre-operative patient
group.
Table 4-10. Weights of quality of care indicators according to 11 pre-operative patients vs.
all stakeholder groups (Jorissen, 2018).
Quality of care Weight (pre-operative patients) Weight (all stakeholders)
Equitable 0.280 0.214
Effective 0.340 0.397
Efficient 0.060 0.050
Safe 0.145 0.134
Patient-centred 0.116 0.214
For each stakeholder group, the quality criteria are prioritized in the same way as
described above. The final goal is to combine all stakeholder viewpoints into one
priority vector, containing the overall quality criteria weights. However, the obtained
quality weights show conflicts between stakeholder groups. In addition, not every
stakeholder group is equally important to decision making. For example, pre-operative
patients have no experience with the per- and post-operative stages and thus might
underestimate the impact of the operation-outcome criteria. Therefore, we need a
weighting method to determine the weights of each stakeholder group in order to
define the overall ranking of quality criteria which represents all stakeholder groups.

PRIORITIZATION OF PERFORMANCE INDICATORS USING ANP
89
A similar approach is used as before when tackling conflicts within stakeholder groups,
namely the WAM based on cluster similarity, to compute the overall priority vector
(Song and Hu 2009). The seven stakeholder groups are assigned to clusters based on
their similarity degree, as explained in Equation 3.6. Three clusters remain, cluster
weights are computed according to Equation 4.7, and the WAM is applied to derive
the final weights. A reallocation of the weights is required to measure quality according
to the IOM definition of quality of care (see final column in Table 4-10). From the
table, we find that effectiveness, patient-centredness and equity greatly contribute to
high quality of radical prostatectomy. Effective care is represented by the high weights
attributed to surgical margins and surgeon experience, whereas equity and patient-
centredness are determined by the high weights for respectively Gleason score and
post-operative consequences, such as urinary incontinency or additional therapy.
4.3.1.3 Discussion
This study aims to propose a multi-stakeholder definition of value for improving
medical decision making in radical prostatectomy. AHP proves to be most suitable for
solving the prioritization problem among the quality criteria to address the multiple
stakeholders’ preferences. However, a few challenges must be overcome to unfold the
full potential of the AHP methodology.
Saaty (2008) allows for 10% of inconsistent judgments to achieve qualitative output.
However, when this threshold is exceeded, a method is needed to reduce the
inconsistency. In this work, the weighted consistency method by Jarek (2016) was
applied to reduce the inconsistency without changing the stakeholder’s judgments. On
the other hand, knowledge limitation can lead to incomplete pairwise comparisons.
These gaps can be filled by taking the geometric mean of other stakeholder judgments
for the respective criterion as a simple heuristic (Hua et al. 2008). Furthermore,
stakeholders often have conflicting views, which may lead to discrepancies in the
ranking of quality criteria. Reaching a consensus is often believed to be the best
approach to balance conflicting views (Dyer and Forman 1992). In this work, we
applied a cluster similarity approach, as proposed in Song and Hu (2009), to deal with
conflicts between and within stakeholder groups.
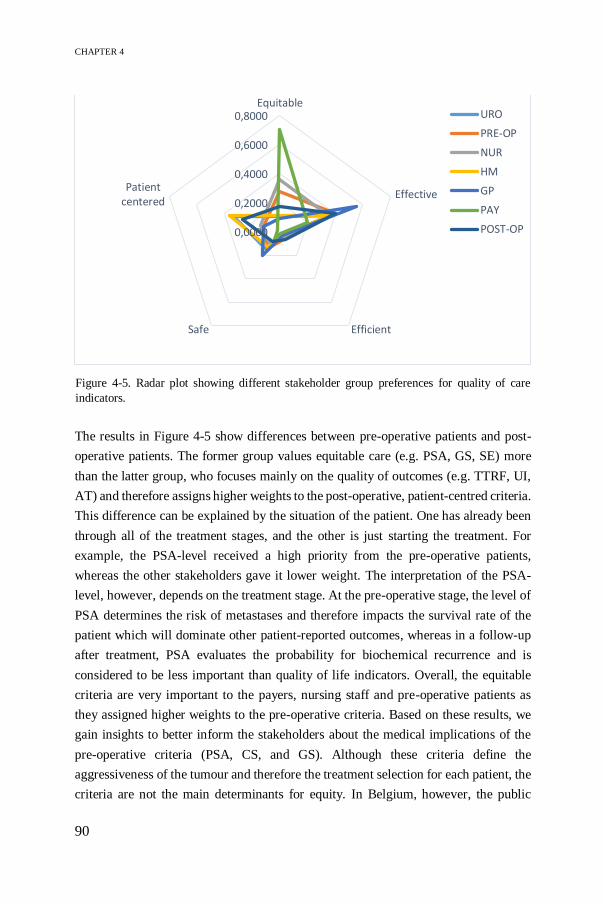
CHAPTER 4
90
The results in Figure 4-5 show differences between pre-operative patients and post-
operative patients. The former group values equitable care (e.g. PSA, GS, SE) more
than the latter group, who focuses mainly on the quality of outcomes (e.g. TTRF, UI,
AT) and therefore assigns higher weights to the post-operative, patient-centred criteria.
This difference can be explained by the situation of the patient. One has already been
through all of the treatment stages, and the other is just starting the treatment. For
example, the PSA-level received a high priority from the pre-operative patients,
whereas the other stakeholders gave it lower weight. The interpretation of the PSA-
level, however, depends on the treatment stage. At the pre-operative stage, the level of
PSA determines the risk of metastases and therefore impacts the survival rate of the
patient which will dominate other patient-reported outcomes, whereas in a follow-up
after treatment, PSA evaluates the probability for biochemical recurrence and is
considered to be less important than quality of life indicators. Overall, the equitable
criteria are very important to the payers, nursing staff and pre-operative patients as
they assigned higher weights to the pre-operative criteria. Based on these results, we
gain insights to better inform the stakeholders about the medical implications of the
pre-operative criteria (PSA, CS, and GS). Although these criteria define the
aggressiveness of the tumour and therefore the treatment selection for each patient, the
criteria are not the main determinants for equity. In Belgium, however, the public
0,0000
0,2000
0,4000
0,6000
0,8000Equitable
Effective
EfficientSafe
Patientcentered
URO
PRE-OP
NUR
HM
GP
PAY
POST-OP
Figure 4-5. Radar plot showing different stakeholder group preferences for quality of care
indicators.

PRIORITIZATION OF PERFORMANCE INDICATORS USING ANP
91
health system guarantees accessibility to care for everyone, whereas in private health
systems other criteria, such as level of income, race/ethnicity or the specialization
degree of the hospital, could affect equity.
Another discrepancy was observed in the post-operative phase, where urologists,
hospital management and post-operative patients attach more importance to patient-
centredness, such as complications (COMP) and additional therapy (AT) since these
indicate how they performed during the per-operative stage. The patient-centred
indicators mainly consist of Patient Reported Outcome Measures (PROMs) rather than
Patient Reported Experience Measures (PREMs). The latter focuses on the wellbeing
of patients and their care process by measuring satisfaction (e.g. quality of information,
communication with care providers, etc.), whereas the former aims to measure the
impact of the disease on the health-related quality of life and therefore allows to
compare different institutions in terms of value improvements. This pilot study helps
healthcare policy makers to identify the relevant PROMs for measuring value based
on the relative importance between the indicators. However, assigning weights to the
PROMs also depends on the patient perspective, since priorities might change when
patients go through the treatment stages.
From the results, we also observe some similarities among the stakeholders, such as
low importance for the operation time (TOR) and length of stay (LOS), as these criteria
reflect cost factors or efficiency, which are relatively unimportant compared to criteria
related to quality of care. Furthermore, safety is considered to be less important
because the indicators are objective measures, such as blood transfusions. Effective
care, on the other hand, has high weights for all stakeholders involved. Literature
shows that surgical margins (SM) are related to the quality of patient outcomes and
can predict recurrence (Fontenot and Mansour 2013), and surgeon experience (SE)
impacts the patient outcome as well as the probability of complications (Fossati et al.
2017; Di Pierro et al. 2014).
In addition, preferences can deviate within stakeholders groups due to personal
characteristics or previous experiences with medical treatments. A further
classification of the pre- and post-operative patient groups according to their age and
level of education would give more insights into the different preferences. The
preliminary results showed that age does not necessarily influence preferences, since
older patients assign similar weights to erectile dysfunction and complications when
compared to younger patients. Furthermore, level of education had an influence on the

CHAPTER 4
92
pre-operative criteria, as patients with a lower level of education attached more
importance to the PSA level than highly educated patients. As described above, a better
understanding of this medical term is required. Moreover, level of education could
impact equity since it determines how easy patients can have access to care.
4.3.1.4 Limitations and further work
The research also has some limitations. The quality criteria are limited to 13, which
are verified by the urologists at the hospital under study. The more indicators, the more
time-intensive the pairwise comparison process becomes. Moreover, the AHP process
starts with an inherent bias since only one stakeholder group was included who
assigned the criteria to the six pillars of the quality definition according to their
expertise. Hence, a pragmatic approach is used in this pilot study to prioritize criteria
for measuring value improvement. The overall goal was to show the feasibility of using
AHP for this medical decision making problem and provide insights to what extent the
criteria are relevant for measuring quality in radical prostatectomy in order to improve
future decision making. Due to the small sample size in this pilot study, the results
cannot be validated for all of the stakeholder groups. A larger sample size would lead
to more reliable results and allow for stratification to identify discrepancies within
stakeholder groups. Furthermore, the AHP approach does not allow for
interdependency between criteria to simplify the problem. However, the relative
importance of the treatment stages is not necessarily independent, since poor pre- or
per-operative conditions may cause undesired patient outcomes. Moreover,
uncertainty perceived by stakeholders during pairwise comparisons is not taken into
account in this AHP approach. This can be resolved by incorporating fuzzy logic into
AHP or conducting a sensitivity analysis as in Section 4.2.6.
The equity and time dimension in the quality of care definition are inaccurately
represented in this pilot study because the selected criteria do not measure any
difference between race/ethnicity (Orom et al. 2018) or waiting time respectively. In
further work, the value model will be adjusted to account for these indicators. Another
future research avenue concerns the weighting method used for calculating an
aggregate priority score for all the stakeholder groups. Instead of cluster similarity,
weights for stakeholder groups can be calculated based on the size of the groups or
based on the knowledge of the stakeholder for the respective criterion. In the latter
method, post-operative patients could have higher weights for the patient-centred
criteria when compared to pre-operative patients who have not been through the

PRIORITIZATION OF PERFORMANCE INDICATORS USING ANP
93
treatment stages yet. However, still a large deviation could be found within the post-
operative patient group depending on the patient perspective. Patients attach different
weights to for example having a high risk on Urinary Incontinence (UI) when they
know they would otherwise not survive compared to patients who have a high survival
rate. Hence, the priorities depend on the patient perspective and this pilot study aims
to bring together all perspectives in order to measure overall quality of care. Moreover,
the resulting weights can be varied in a sensitivity analysis to investigate the impact
on the overall ranking. Finally, alternatives can be added to the hierarchy. Alternatives
represent the different treatment options (i.e. surgery, radiation therapy or active
surveillance). The established criteria weights are used to assign an overall score for
each alternative. As a result, AHP guides decision makers in choosing the treatment
that provides most value based on a ranking of the alternatives. Extending the model
with alternatives allows to validate the model in terms of functionality and consistency.
4.4 Conclusion
Healthcare logistics decisions are often based on intuition or experience, and thus lack
transparency and rationality, though the decisions are affected by a range of indicators
involving trade-offs between, sometimes conflicting, objectives. The complex
structure, multi-faceted decisions and the high impact of decisions increase the need
for MCDM. ANP is a popular MCDM technique known as a valuable, analytical tool
for supporting managerial decision making related to performance measurement. It
generates insights in understanding the complex relationships in the decision problem
and thus, improves the reliability of the corresponding decisions. MCDM is designed
to reflect, assess and better understand the problem in order to ensure rational and
consistent decision-making processes (Marsh et al., 2017).
This chapter presents an ANP-based prototype to guide hospital stakeholders in
translating logistics objectives to relevant KPIs measuring the overall performance of
the hospital supply chain. This prototype provides an answer to the second research
question which relates to building module 2 in the logistics performance management
framework development process. The findings are relevant for stakeholders involved
within the hospital logistics flow to gain insights into priority-setting and quantifying
trade-offs among indicators to focus on what matters most to the performance of the
internal hospital supply chain. As surgical supply costs take up more than 40% of the
CHAPTER 4
94
hospital operating budget, a well-defined supply chain strategy is needed to align
logistics and care processes and reduce costs. Although this case study deals with the
OT logistics flow, the decision-support framework can also be customized according
to specific objectives and process-related KPIs in other hospital logistics processes. In
Chapter 6, we will extend the prototype to a generic framework as a guide for hospital
practitioners and academics to improve transparency in decision-making processes by
considering multiple stakeholders’ perspectives.
Finally, several challenges inherent to applying AHP/ANP in a healthcare context are
addressed in a pilot study concerning medical decision making. AHP is used as an
innovative and structured approach to reflect healthcare decision-makers’ preferences
to the benefit of value-based healthcare by providing synthesized value in multiple
dimensions. The major challenge is to map all stakeholder preferences into one value
definition in order to identify opportunities for quality improvement and cost
containment. Based on these findings, we prove the versatility of the AHP/ANP
methodology for performance management problems in a wide range of healthcare
applications focusing both on logistics and medical aspects.
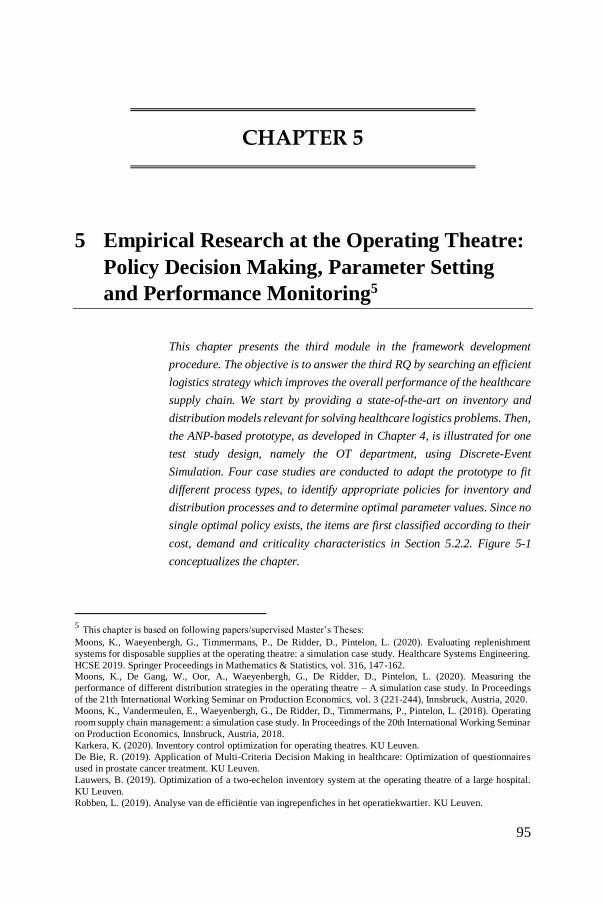
95
CHAPTER 5
5 Empirical Research at the Operating Theatre:
Policy Decision Making, Parameter Setting
and Performance Monitoring5
This chapter presents the third module in the framework development
procedure. The objective is to answer the third RQ by searching an efficient
logistics strategy which improves the overall performance of the healthcare
supply chain. We start by providing a state-of-the-art on inventory and
distribution models relevant for solving healthcare logistics problems. Then,
the ANP-based prototype, as developed in Chapter 4, is illustrated for one
test study design, namely the OT department, using Discrete-Event
Simulation. Four case studies are conducted to adapt the prototype to fit
different process types, to identify appropriate policies for inventory and
distribution processes and to determine optimal parameter values. Since no
single optimal policy exists, the items are first classified according to their
cost, demand and criticality characteristics in Section 5.2.2. Figure 5-1
conceptualizes the chapter.
5 This chapter is based on following papers/supervised Master’s Theses:
Moons, K., Waeyenbergh, G., Timmermans, P., De Ridder, D., Pintelon, L. (2020). Evaluating replenishment
systems for disposable supplies at the operating theatre: a simulation case study. Healthcare Systems Engineering.
HCSE 2019. Springer Proceedings in Mathematics & Statistics, vol. 316, 147-162. Moons, K., De Gang, W., Oor, A., Waeyenbergh, G., De Ridder, D., Pintelon, L. (2020). Measuring the
performance of different distribution strategies in the operating theatre – A simulation case study. In Proceedings
of the 21th International Working Seminar on Production Economics, vol. 3 (221-244), Innsbruck, Austria, 2020.
Moons, K., Vandermeulen, E., Waeyenbergh, G., De Ridder, D., Timmermans, P., Pintelon, L. (2018). Operating
room supply chain management: a simulation case study. In Proceedings of the 20th International Working Seminar
on Production Economics, Innsbruck, Austria, 2018.
Karkera, K. (2020). Inventory control optimization for operating theatres. KU Leuven.
De Bie, R. (2019). Application of Multi-Criteria Decision Making in healthcare: Optimization of questionnaires
used in prostate cancer treatment. KU Leuven.
Lauwers, B. (2019). Optimization of a two-echelon inventory system at the operating theatre of a large hospital.
KU Leuven.
Robben, L. (2019). Analyse van de efficiëntie van ingrepenfiches in het operatiekwartier. KU Leuven.
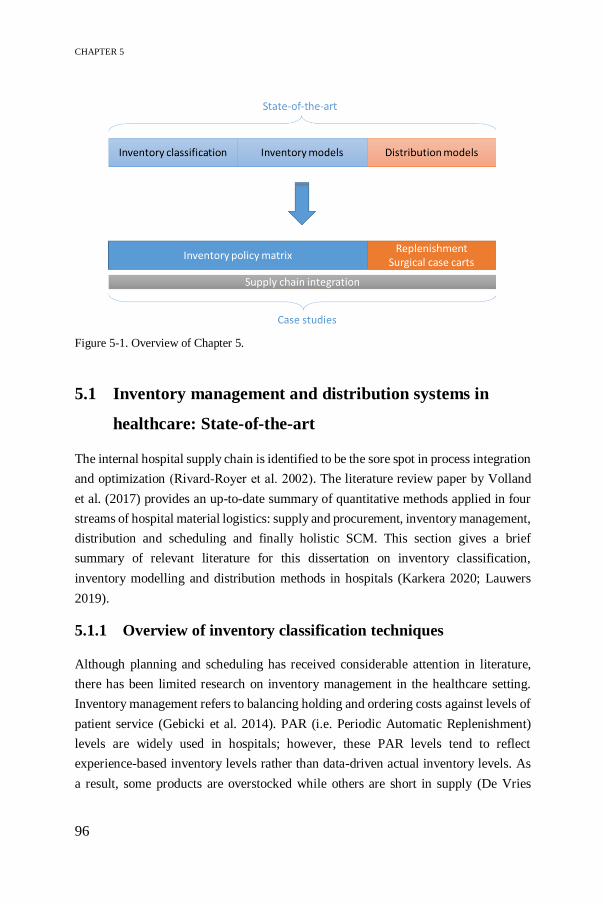
CHAPTER 5
96
5.1 Inventory management and distribution systems in
healthcare: State-of-the-art
The internal hospital supply chain is identified to be the sore spot in process integration
and optimization (Rivard‐Royer et al. 2002). The literature review paper by Volland
et al. (2017) provides an up-to-date summary of quantitative methods applied in four
streams of hospital material logistics: supply and procurement, inventory management,
distribution and scheduling and finally holistic SCM. This section gives a brief
summary of relevant literature for this dissertation on inventory classification,
inventory modelling and distribution methods in hospitals (Karkera 2020; Lauwers
2019).
5.1.1 Overview of inventory classification techniques
Although planning and scheduling has received considerable attention in literature,
there has been limited research on inventory management in the healthcare setting.
Inventory management refers to balancing holding and ordering costs against levels of
patient service (Gebicki et al. 2014). PAR (i.e. Periodic Automatic Replenishment)
levels are widely used in hospitals; however, these PAR levels tend to reflect
experience-based inventory levels rather than data-driven actual inventory levels. As
a result, some products are overstocked while others are short in supply (De Vries
Figure 5-1. Overview of Chapter 5.
EMPIRICAL RESEARCH AT THE OPERATING THEATRE
97
2011). Managing medical-surgical supplies is more complex compared to production-
oriented environments, due to lack of standardization, lack of traceability of items, lack
of accurate consumption data, and high risk of obsolescence, expiration or damage.
Moreover, industrial sectors closely control inventory cost, which is typically not the
case in healthcare where several stakeholders are involved (Ahmadi et al. 2018).
Hospital stakeholders are working towards different objectives, impacting inventory
management and causing fragmented logistics responsibilities. In addition, medical
supplies differ in characteristics, such as cost, criticality or usage rate, which require
different levels of control to manage stock in hospitals.
Several methods for inventory classification exist to determine the level of
management control. Classification is required since no single inventory model can be
used for every article in stock. Therefore, depending on supply characteristics, other
inventory policies can be applied. Overall, we distinguish between three types of
medical supplies used at the operating theatre: disposables (e.g. gloves, syringes),
reusables (e.g. surgical instruments) and perishables (e.g. blood, medicines). This
dissertation focuses on disposable items, as they take up a large portion of the storage
space and they are an important source of waste and costs in hospitals.
The most familiar classification method used in both industrial and healthcare settings
is the ABC analysis, which classifies inventory items based on the dollar/euro usage
value (i.e. product of annual demand and unit cost). It is based on Pareto’s principle of
“vital few and trivial many”, which states that approximately 10% of the items are
classified in class A, constituting about 70% of the total dollar/euro usage value, and
thus requiring strict management attention (Gupta et al. 2007). Though, it is commonly
used and easy to apply, ABC classification considers only a single criterion, often
costs, and hence ignores the holistic view of the inventory system (Smith et al. 2017).
For example, non-availability of low-cost critical items can endanger a patient’s life.
Since cost is the only parameter in the ABC analysis, it might occur that low-cost items
are getting too little attention, and as a consequence, can have stock-outs (Devnani,
Gupta, and Nigah 2010). Therefore, the VED classification is proposed, which
classifies items into Vital (V), Essential (E), and Desirable (D) categories based on
criticality (Gupta et al. 2007; Molenaers et al. 2012). Criticality of items is determined
by the impact of stock-outs on the quality of the treatment to patients. As some items
are more critical than others, or in other words, a hospital cannot function without these
items, availability of items plays a pivotal role in inventory classification. Huiskonen
(2001) suggests two approaches to criticality in the context of spare parts management:
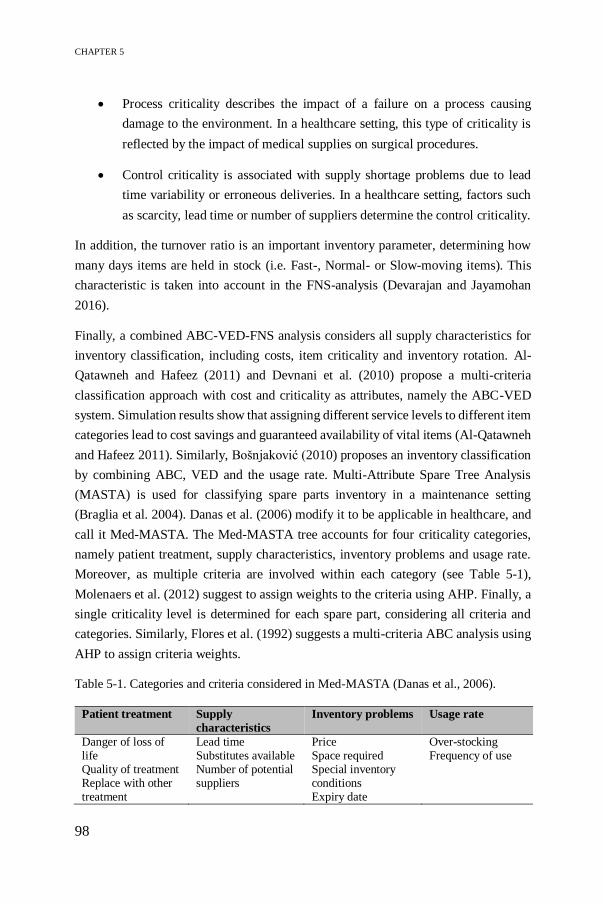
CHAPTER 5
98
Process criticality describes the impact of a failure on a process causing
damage to the environment. In a healthcare setting, this type of criticality is
reflected by the impact of medical supplies on surgical procedures.
Control criticality is associated with supply shortage problems due to lead
time variability or erroneous deliveries. In a healthcare setting, factors such
as scarcity, lead time or number of suppliers determine the control criticality.
In addition, the turnover ratio is an important inventory parameter, determining how
many days items are held in stock (i.e. Fast-, Normal- or Slow-moving items). This
characteristic is taken into account in the FNS-analysis (Devarajan and Jayamohan
2016).
Finally, a combined ABC-VED-FNS analysis considers all supply characteristics for
inventory classification, including costs, item criticality and inventory rotation. Al-
Qatawneh and Hafeez (2011) and Devnani et al. (2010) propose a multi-criteria
classification approach with cost and criticality as attributes, namely the ABC-VED
system. Simulation results show that assigning different service levels to different item
categories lead to cost savings and guaranteed availability of vital items (Al-Qatawneh
and Hafeez 2011). Similarly, Bošnjaković (2010) proposes an inventory classification
by combining ABC, VED and the usage rate. Multi-Attribute Spare Tree Analysis
(MASTA) is used for classifying spare parts inventory in a maintenance setting
(Braglia et al. 2004). Danas et al. (2006) modify it to be applicable in healthcare, and
call it Med-MASTA. The Med-MASTA tree accounts for four criticality categories,
namely patient treatment, supply characteristics, inventory problems and usage rate.
Moreover, as multiple criteria are involved within each category (see Table 5-1),
Molenaers et al. (2012) suggest to assign weights to the criteria using AHP. Finally, a
single criticality level is determined for each spare part, considering all criteria and
categories. Similarly, Flores et al. (1992) suggests a multi-criteria ABC analysis using
AHP to assign criteria weights.
Table 5-1. Categories and criteria considered in Med-MASTA (Danas et al., 2006).
Patient treatment Supply
characteristics
Inventory problems Usage rate
Danger of loss of life Quality of treatment Replace with other treatment
Lead time Substitutes available Number of potential suppliers
Price Space required Special inventory conditions Expiry date
Over-stocking Frequency of use

EMPIRICAL RESEARCH AT THE OPERATING THEATRE
99
5.1.2 Overview of inventory models in healthcare
Depending on the classification, different inventory models are suitable for different
item categories. Inventory models typically provide answers to the fundamental
questions of when to order and how much to order (Rossetti et al. 2012). Furthermore,
inventory systems are characterized by the number of storage units through which
inventory is moved. A single-echelon inventory system represents the management of
one storage unit, whereas multiple storage units are controlled by a multi-echelon
inventory system. The latter system is often applicable in the operating theatre, where
multiple point-of-care units are supplied by a central storage (Ahmadi et al. 2018).
Table 5-2 provides an overview of the most commonly used inventory policies in
healthcare, distinguishing between continuous and periodic review policies (Ahmadi
et al. 2018; Rosales, Magazine, and Rao 2015). In the former, the inventory levels are
continuously monitored and a re-order quantity is placed whenever the inventory level
drops below the reorder point, s. Typical examples are the (s, Q) and (s, S) policies
with a fixed re-order quantity, Q, or a variable order-up-to level, S, respectively. On
the other hand, periodic review policies, such as (R, S), also known as PAR level, or
(R, Q), monitor inventory levels at fixed moments in time (i.e. review period, R). In
addition, the two-bin system or (R, s, Q) policy, is a simple periodic policy for
maintaining supplies at point-of-use locations (Beaulieu and Landry 2010; Rosales et
al. 2015). The two-bin system is an example of a Kanban system, introduced for
Toyota Production Systems, which introduces lean principles to eliminate waste,
decrease costs and improve service quality (Papalexi, Bamford, and Dehe 2016).
Rosales et al. (2015) suggest a RFID-enabled two-bin system to compare periodic and
continuous inventory control policies. According to them, average inventory cost is
minimized in the continuous policy. However, this policy is only preferred for Fast-
moving items supported with technological infrastructures, such as RFID tags or
barcodes, whereas periodic review policies are appropriate for slow-movers (Rossetti
et al. 2012). Most hospitals use periodic review policies because they are easy-to-
manage, compared to continuous monitoring of inventory which requires high set-up
costs and more complicated workforce schedules (Rosales et al. 2015). We refer to
Rossetti et al. (2012) for a comprehensive overview of inventory modelling, such as
the state of inventory over time, periodic or continuous review policies, Just-In-Time
or stockless inventory, etc.

CHAPTER 5
100
Table 5-2. Overview of inventory policies (Lauwers, 2019).
Periodic review Continuous review
(R, S) Every review period (R), an order
is placed up to level S.
(s, S) When inventory reaches the reorder
point (s), an order is placed up to
level S.
(R, Q) Every review period (R), a fixed
order quantity (Q) is placed.
(s, Q) When inventory reaches the reorder
point (s), a fixed order quantity (Q)
is placed.
(R, s, S) Every review period (R), when
inventory is below reorder point
(s), an order is placed up to level
S.
RFID-
enabled
two-bin
An empty bin automatically triggers
a replenishment.
(R, s, Q) Every review period (R), when
inventory is below reorder point
(s), a fixed order quantity (Q) is
placed.
Two-bin Every review period (R), an
empty bin is replenished.
Mostly, literature focuses on the cost minimization objective when controlling
inventory. The Economic Order Quantity (EOQ) model aims to minimize inventory
holding and ordering costs while computing the optimal order quantity (Rossetti et al.
2012). The EOQ model holds true under assumptions of deterministic demand, zero
lead times, constant unit costs and no back-orders. However, real-life demand is often
stochastic, which violates the assumption, and thus more advanced techniques are
required to determine the reorder point. A great variety of inventory models exist in
literature. However, not all models are representative for problems in a healthcare
setting, and therefore a number of inventory models are selected based on model
characteristics, shown in Table 5-3. First of all, we distinguish between optimization
and simulation models. In the former, unrealistic assumptions need to be made as
analytical models are unable to model the complexity of the health system. Although
an optimization model will more likely find an optimal solution compared to
simulation, the assumptions may lead to biased solutions (Jun, Jacobson, and Swisher
1999). Therefore, this work focuses on simulation models to identify initial values for
decision parameters subject to predefined constraints and to perform scenario analysis.
A second model characteristic relates to input requirements. A well-known problem in
healthcare settings is the scarcity of accurate logistics data. Hence, the model needs to
provide a proof-of-concept using limited data requirements. Furthermore, the great
variety of items requires different policies to be assigned to different item categories,
and thus model flexibility is required. Finally, the degree of complexity of the model

EMPIRICAL RESEARCH AT THE OPERATING THEATRE
101
determines transparency and ability to replicate the model for different hospital
contexts. Simple inventory policies with reasonable implementation costs and efforts
are preferred due to limited OR/OM experience, rather than investing in sophisticated
mathematical models with considerable computing times (Melo 2012).
Table 5-3. Model characteristics (Lauwers, 2019).
Authors Simulation Limited data
requirements
Flexibility Transparency
Smith et al. (2017) X X X X
Gebicki et al. (2014) – Policy 1 and 2 X X X X
Gebicki et al. (2014) – Policy 3 and 4 X X
Guerrero et al. (2013) X
Little and Coughlan (2008) X
Bijvank and Vis (2012) X
Kelle et al. (2012) X X
Four optimization models are included in Table 5-3, from which we derive interesting
constraints or decision variables. Guerrero et al. (2013) model a one-warehouse, n-
retailer distribution system to decide on the reorder point and order-up-to level under
a service level constraint. Little and Coughlan, (2008) develop a single-echelon
optimization model with the objective function to maximize the minimum and average
service level subject to a space constraint in a single storage room for multiple
products. In their model, delivery frequency is added as a decision variable. Similarly,
Bijvank and Vis (2012) develop two models to control inventory at point-of-use
locations in hospitals, with review period and order quantity as the main decision
variables:
Capacity model maximizes service level under storage space constraint
Service model uses service level as a constraint to minimize inventory holding
costs.
Finally, Kelle et al. (2012) use constraint-based optimization to define values for
reorder point and order-up-to level of items held in Automated Dispensing Machines
(ADMs). The model aims to minimize replenishing and holding costs subject to service
level and space constraints.
To summarize, Table 5-4 provides an overview of different inventory optimization
models. In this work, the aim is to minimize the overall inventory cost and stock-outs

CHAPTER 5
102
subject to service level. Potential decision variables are reorder point, order up-to level,
review period and item locations.
Table 5-4. Overview of healthcare inventory optimization models (Karkera, 2020).
Authors Model Objective Decision
variables
Constraint Multi-
echelon
Guerrero et al. (2013)
Markov optimization
Minimize stock on-hand value
Reorder point and order up-to level
Service level and storage space
Two-echelon
Little and Coughlan
(2008)
Constraint-based
optimization
Maximize minimum and
average service level
Service level, delivery
frequency and order up-to level
Storage space
Single-echelon
Bijvank and Vis (2012)
Markov optimization
Minimize capacity and maximize service level
Order quantity and review period
Service level and capacity
Single-echelon
Kelle et al. (2012)
Constraint-based optimization
Minimize total refill (ordering) cost plus the inventory holding cost
Reorder point and order up-to level
Service level and storage space
Single-echelon
A multi-echelon inventory system, on the other hand, requires more advanced
modelling techniques to determine inventory parameters in each echelon (Rossetti et
al. 2012). Lapierre and Ruiz (2007) present a multi-echelon inventory model to
schedule logistics activities while aiming for minimal inventory costs and balanced
workload schedules for better inventory control. Ahmadi et al. (2018) suggest a robust
stochastic mixed-integer programming model for surgical supplies to reduce costs by
determining the optimum item location and quantity. However, sophisticated
analytical models often make unrealistic assumptions, and thus fail to represent the
complexity of the multi-echelon inventory system. Most closely related to this work
are the simulation models proposed by Smith et al. (2017) and Gebicki et al. (2014) in
Table 5-3.
Smith et al. (2017) use Monte Carlo simulation to develop a centralized inventory
model and a stockless model. In the latter model, the central storage is eliminated as
suppliers directly replenish the care units. The authors find a lower cost for slow- to
normal-movers in the stockless system. The centralized model, on the other hand, uses
a central pharmacy to deliver supplies to different care units in a single-item, two-
echelon system. The model can easily be extended to a multi-item model as PAR levels
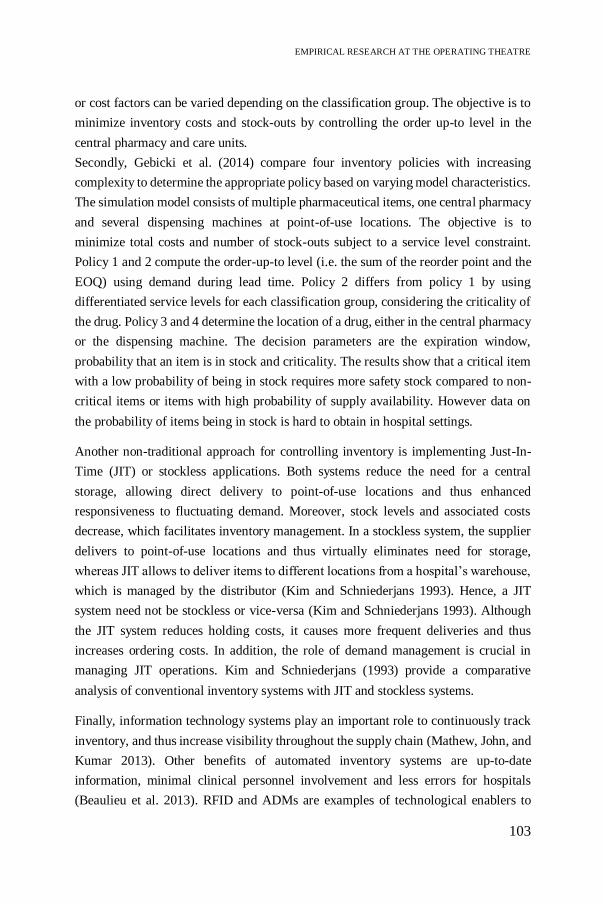
EMPIRICAL RESEARCH AT THE OPERATING THEATRE
103
or cost factors can be varied depending on the classification group. The objective is to
minimize inventory costs and stock-outs by controlling the order up-to level in the
central pharmacy and care units.
Secondly, Gebicki et al. (2014) compare four inventory policies with increasing
complexity to determine the appropriate policy based on varying model characteristics.
The simulation model consists of multiple pharmaceutical items, one central pharmacy
and several dispensing machines at point-of-use locations. The objective is to
minimize total costs and number of stock-outs subject to a service level constraint.
Policy 1 and 2 compute the order-up-to level (i.e. the sum of the reorder point and the
EOQ) using demand during lead time. Policy 2 differs from policy 1 by using
differentiated service levels for each classification group, considering the criticality of
the drug. Policy 3 and 4 determine the location of a drug, either in the central pharmacy
or the dispensing machine. The decision parameters are the expiration window,
probability that an item is in stock and criticality. The results show that a critical item
with a low probability of being in stock requires more safety stock compared to non-
critical items or items with high probability of supply availability. However data on
the probability of items being in stock is hard to obtain in hospital settings.
Another non-traditional approach for controlling inventory is implementing Just-In-
Time (JIT) or stockless applications. Both systems reduce the need for a central
storage, allowing direct delivery to point-of-use locations and thus enhanced
responsiveness to fluctuating demand. Moreover, stock levels and associated costs
decrease, which facilitates inventory management. In a stockless system, the supplier
delivers to point-of-use locations and thus virtually eliminates need for storage,
whereas JIT allows to deliver items to different locations from a hospital’s warehouse,
which is managed by the distributor (Kim and Schniederjans 1993). Hence, a JIT
system need not be stockless or vice-versa (Kim and Schniederjans 1993). Although
the JIT system reduces holding costs, it causes more frequent deliveries and thus
increases ordering costs. In addition, the role of demand management is crucial in
managing JIT operations. Kim and Schniederjans (1993) provide a comparative
analysis of conventional inventory systems with JIT and stockless systems.
Finally, information technology systems play an important role to continuously track
inventory, and thus increase visibility throughout the supply chain (Mathew, John, and
Kumar 2013). Other benefits of automated inventory systems are up-to-date
information, minimal clinical personnel involvement and less errors for hospitals
(Beaulieu et al. 2013). RFID and ADMs are examples of technological enablers to

CHAPTER 5
104
capture data and thus stimulating demand-related inventory parameter optimization.
Rossetti et al. (2012) use ADMs to generate a realistic bill of materials. Rosales et al.
(2015) use RFID technology to implement a continuous two-bin inventory system,
together with a periodic review policy to improve inventory visibility. Beaulieu et al.
(2013) present the CHUM case (Centre Hospitalier de l’Université de Montréal) in
which inventory management systems are combined with RFID technology to improve
operating room supply chain performance. However, automation should start at the
manufacturer stage in the external supply chain, providing labels with standardized
barcodes, such as GS1 standards with additional logistics parameters (e.g. lot and serial
number, GTIN) to enable medical supply tracking and improve inventory control. Data
standards are required to ensure effective communication and information exchange
among various supply chain partners (Varghese et al. 2012). Implementing data
standards will positively contribute to performance metrics such as staff productivity,
inventory accuracy or item/location identification standards.
This review discusses several inventory models used in a healthcare setting. Based on
the decision variables and constraints used in the above mentioned models, a two-
echelon inventory system will be established for disposable supplies at the operating
theatre. Providing inventory management solutions is vital for achieving efficiency
targets in hospital supply chain operations. However, the unique characteristics and
possibly conflicting interests among different stakeholders need to be considered to
overcome the main obstacles to inventory management in hospitals. A detailed
situation description, the inventory classification methods and the simulation model
development are discussed in Sections 5.2.1, 5.2.2 and 5.2.3.
5.1.3 Overview of healthcare distribution and scheduling systems
Supply availability is crucial in any healthcare setting, and thus coordination and
distribution of time-critical supplies and medical equipment are of utmost importance.
In addition to optimizing inventory parameters, optimal replenishment policies and
distribution strategies should be developed to efficiently move medical supplies to
point-of-use locations. Well-coordinated replenishment policies and effective delivery
strategies positively contribute to the performance of the internal hospital supply chain,
which results in streamlined, cost-effective processes and fewer cancelled or delayed
interventions (Lanckzweirt 2010; Rohleder, Cooke, et al. 2013). The models discussed
in literature, as discussed below, use several decision variables to determine the impact
of distribution and scheduling policies at point-of-use locations.

EMPIRICAL RESEARCH AT THE OPERATING THEATRE
105
5.1.3.1 Scheduling decisions for optimal replenishment
The supply department has to coordinate the replenishment activities. Therefore,
scheduling decisions, such as how often and when to visit each care unit, should be
made related to inventory. Lapierre and Ruiz (2007) develop such a scheduling
approach to coordinate distribution activities while respecting inventory capacities.
Moreover, they incorporate workload balancing to find an optimal replenishment
schedule by evaluating holding costs, time consumption and the uniformness of the
workload distribution. Bijvank and Vis (2012) investigate the impact of different
inventory models on medical supplies by establishing simple replenishment rules to
determine reorder levels and reorder quantity. The optimal replenishment policy
depends on whether inventory levels are monitored continuously, by introducing RFID
technology, or periodically. Although a continuous review policy utilizes the available
capacity more efficiently, periodic review policies perform almost equally well with
high service levels. Other studies regarding the use of continuous review policies can
be found in Rosales et al. (2015, 2014), who analyse the impact on costs, inventory
levels and replenishment frequency at point-of-use locations. The main disadvantage
of continuously reviewing stock is the high investment cost of introducing a RFID
system. Moreover, it incurs a higher fixed cost due to a more complex workload
schedule for logistics staff and more frequent interruptions to perform inventory tasks.
Periodic review, on the other hand, is more straightforward scheduling-wise, though it
requires higher stock levels. Choosing the appropriate replenishment system is also
dependent on the number and size of stocking locations, which is typically
architecturally fixed for most hospitals. Therefore, the trade-off should consider
operating several small stocking locations using a continuous review policy or a large
central storage with a periodic review policy (Rosales et al. 2015).
5.1.3.2 Distribution and routing of case carts
In a traditional distribution network, suppliers ship their products to distributors, from
where the products continue to the hospital’s warehouse. Typically, a large amount of
stock is held in hospitals with a low delivery frequency, low ordering costs and high
inventory holding costs. Supply chain integration can be achieved by setting up a
centralized warehouse system for direct shipments from supplies, as proposed by the
Mercy Health System (Rossetti et al. 2012), which results in improved fill rates and
cost savings. Landry and Beaulieu (2013) consider two aspects when determining
distribution methods to point-of-use locations:
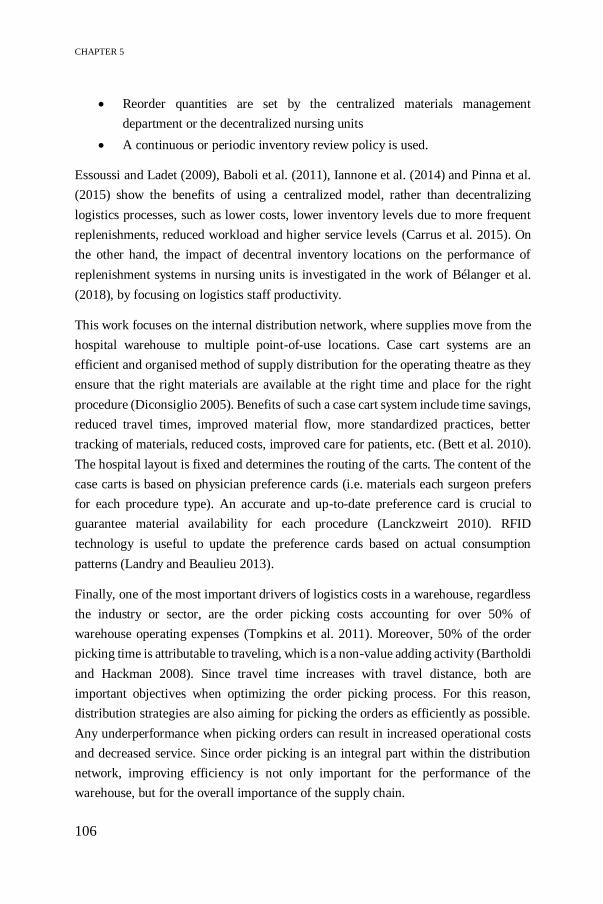
CHAPTER 5
106
Reorder quantities are set by the centralized materials management
department or the decentralized nursing units
A continuous or periodic inventory review policy is used.
Essoussi and Ladet (2009), Baboli et al. (2011), Iannone et al. (2014) and Pinna et al.
(2015) show the benefits of using a centralized model, rather than decentralizing
logistics processes, such as lower costs, lower inventory levels due to more frequent
replenishments, reduced workload and higher service levels (Carrus et al. 2015). On
the other hand, the impact of decentral inventory locations on the performance of
replenishment systems in nursing units is investigated in the work of Bélanger et al.
(2018), by focusing on logistics staff productivity.
This work focuses on the internal distribution network, where supplies move from the
hospital warehouse to multiple point-of-use locations. Case cart systems are an
efficient and organised method of supply distribution for the operating theatre as they
ensure that the right materials are available at the right time and place for the right
procedure (Diconsiglio 2005). Benefits of such a case cart system include time savings,
reduced travel times, improved material flow, more standardized practices, better
tracking of materials, reduced costs, improved care for patients, etc. (Bett et al. 2010).
The hospital layout is fixed and determines the routing of the carts. The content of the
case carts is based on physician preference cards (i.e. materials each surgeon prefers
for each procedure type). An accurate and up-to-date preference card is crucial to
guarantee material availability for each procedure (Lanckzweirt 2010). RFID
technology is useful to update the preference cards based on actual consumption
patterns (Landry and Beaulieu 2013).
Finally, one of the most important drivers of logistics costs in a warehouse, regardless
the industry or sector, are the order picking costs accounting for over 50% of
warehouse operating expenses (Tompkins et al. 2011). Moreover, 50% of the order
picking time is attributable to traveling, which is a non-value adding activity (Bartholdi
and Hackman 2008). Since travel time increases with travel distance, both are
important objectives when optimizing the order picking process. For this reason,
distribution strategies are also aiming for picking the orders as efficiently as possible.
Any underperformance when picking orders can result in increased operational costs
and decreased service. Since order picking is an integral part within the distribution
network, improving efficiency is not only important for the performance of the
warehouse, but for the overall importance of the supply chain.

EMPIRICAL RESEARCH AT THE OPERATING THEATRE
107
In hospital warehouses, typical distribution problems involve inefficient picking path,
long walking distances, excess movements or elevator problems. According to Chan
and Chan (2011) and Le-Duc and De Koster (2005), assigning Stock Keeping Units
(SKUs) to a storage location in the picking area, also known as the storage location
assignment problem, significantly improves the performance of the order picking
system. Storage space allocation policies, such as class-based storage, are widely used
to optimize space and distance, retrieval time as well as handling costs (Chan and Chan
2011; Reyes, Solano-Charris, and Montoya-Torres 2019). In addition, routing has a
direct impact on the travel time and thus the overall performance of the system.
Routing algorithms determine the sequence of visits to pick the requested products in
order to find the optimal picking path that minimizes the travelled distance, picking
time and congestion in the aisles (Khodabandeh 2016). Key and Dasgupta (2015) solve
two common routing problems, namely the Travelling Salesman Problem (TSP) and
the Shortest Path Problem (SPP) to find the optimal picking path. The Nearest-
Neighbour algorithm and Dijkstra, or the enhanced A*, algorithm are the most
frequently used algorithms for solving TSP and SPP respectively. However, Horvat
(2012) indicates that these heuristic approaches for optimizing picking routes are
difficult to implement due to complexity and inflexibility to adapt to different
warehouse layouts. As an alternative, routing strategies determine the picking path in
a simple and logical, but not necessarily optimal way. The three most common routing
strategies are the S-Shape, Return and Largest Gap, as shown in Figure 5-2.
The following studies show real-world applications of routing or distribution strategies
in hospitals. Little and Coughlan (2008) incorporate delivery resources and routing
information in their inventory model. Banerjea-Brodeur et al. (1998) model the linen
distribution as a periodic vehicle routing problem to determine the routing and delivery
frequency to care units. Augusto and Xie (2009) develop a hybrid supply and
transportation planning for a French hospital pharmacy, where the transportation
Figure 5-2. Three routing strategies (Horvat, 2012).

CHAPTER 5
108
planning is similar to a classical vehicle routing problem in order to minimize pick-up
routes for transporters. The number of movements can be further reduced by
reorganising the supplies in the shelves. In addition, the supply planning problem
respects the availability constraint of having a mobile medicine closet at each care unit.
Rossetti and Selandari (2001) show the technical, economic and qualitative benefits of
replacing a human-based delivery system by mobile robots to distribute
pharmaceuticals. Although the number of studies on partially automated order picking
systems, robotic couriers or Autonomous Guided Vehicles (AGVs) is increasing,
manual operations remain a necessity in hospital environments since the automated
systems do not offer enough capacity and flexibility to support the complex material
transfers. De Koster et al. (2007) state that up to 80% of all Western European
warehouses using ‘picker-to-part’ order picking systems are managed manually. On
the other hand, automated ‘parts-to-picker’ systems have become popular in recent
years with the introduction of robotized material handling solutions such as Automated
Storage and Retrieval systems in e-commerce warehouses (Tappia et al. 2019).
However, a large investment cost comes along when integrating automation
technology (Rais et al. 2018). Finally, Chen et al. (2013) indicate the incorporation of
picker congestion when solving routing problems as an interesting research
opportunity.
Altogether, the organisation of the internal distribution within hospitals is complex, as
different types of medical supplies are stored in various central and decentral storage
locations. Implementing an effective internal distribution system requires determining
optimal replenishment policies, case cart distribution systems and efficient picking
paths to improve the performance of the hospital supply chain. Increasing the
efficiency of these activities allows for significant cost savings, while improving staff
satisfaction and service levels. Sections 5.2.4 and 5.2.5 evaluate potential distribution
strategies for the operating theatre setting.
5.2 Empirical research at the operating theatre
The ANP-based prototype as developed in Chapter 4 serves as a first step towards
defining operational excellence in healthcare logistics. We assess the prototype by
providing empirical evidence through the use of case studies. Case studies are chosen
as research design to experiment with SCM concepts in real-life problems to generate
a proof-of-concept of how SCM can contribute to value-based healthcare. In particular,
the case studies are illustrated for the operating theatre (OT) at UZ Leuven, which

EMPIRICAL RESEARCH AT THE OPERATING THEATRE
109
serves as a test setting for implementing the prototype by measuring performance and
identifying process improvement initiatives. This section describes the potential of
combining simulation modelling and ANP to identify opportunities for efficiency
gains by introducing the Internal Logistics Efficiency Performance (ILEP) index.
5.2.1 Discrete-Event Simulation in healthcare logistics
In Chapter 2, the healthcare logistics toolbox is presented with Discrete-Event
Simulation (DES) being one of the most commonly used types of simulation for a wide
variety of healthcare problems. DES allows to understand the healthcare operations
and has an impact on the complex system by conducting “what-if” analyses
(Kammoun, Loukil, and Hachicha 2014; Thorwarth and Arisha 2009). Although DES
has been mainly used for quantitatively supporting health and care systems operations
(e.g. patient/staff scheduling, workflows of emergency departments, etc.), it has not
been widely applied to healthcare SCM problems (Günal and Pidd 2010; Zhang 2018).
Jun et al. (1999) describe healthcare simulation as follows:
“… DES is an operational research technique that allows the end user
(namely hospital administrators or clinic managers) to assess the efficiency
of existing healthcare delivery systems, to ask ‘what if?’ questions and to
design new systems. “
Due to the complex and highly stochastic nature of hospitals, sophisticated methods
are required to support decision making. The complex problem structure makes
traditional tools, such as queueing theory or other analytical models, impractical as
they require many assumptions to simplify modelling, making models
unrepresentative of reality (Hu et al. 2018). Physically changing the healthcare supply
chain would disrupt daily operations, cost money and could endanger patient safety.
In the OT, the complexity mainly comes from the multitude of materials, stocking
locations and replenishing systems, which makes simulation a prime tool for analysing
and improving logistics services (Abukhousa et al. 2014; Rego and Sousa 2009; Rytile
and Spens 2006). The popularity of DES increases due to its flexibility, ability to
construct versatile models of complex systems and consideration of uncertainty and
variability by integrating stochasticy into the model (Kelton et al., 2015; Mielczarek
& Uziałko-Mydlikowska, 2012; Thorwarth & Arisha, 2009). Moreover, it enables to
model several scenarios and predict the system’s performance and the impact of
alternative improvement strategies (Pidd 2004). Multiple, often competing,
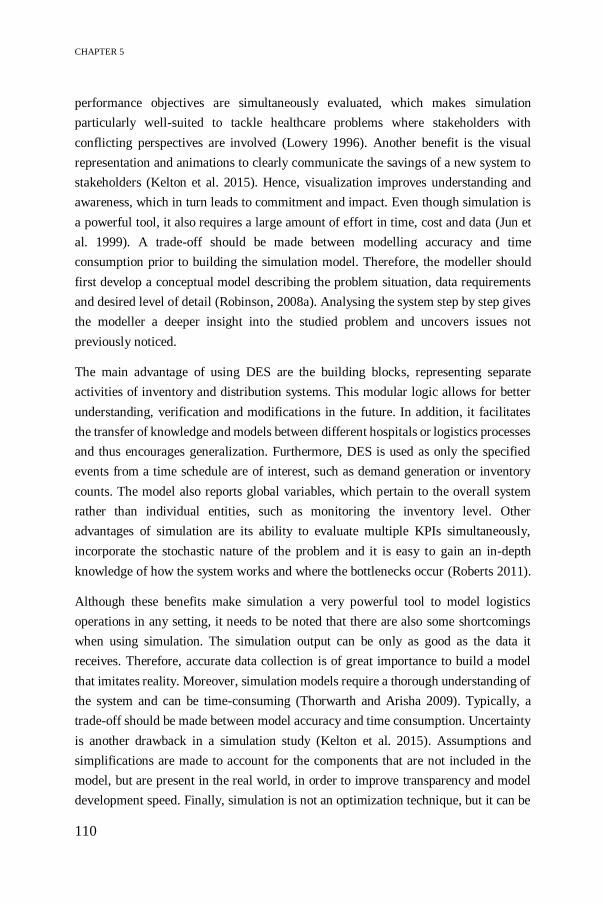
CHAPTER 5
110
performance objectives are simultaneously evaluated, which makes simulation
particularly well-suited to tackle healthcare problems where stakeholders with
conflicting perspectives are involved (Lowery 1996). Another benefit is the visual
representation and animations to clearly communicate the savings of a new system to
stakeholders (Kelton et al. 2015). Hence, visualization improves understanding and
awareness, which in turn leads to commitment and impact. Even though simulation is
a powerful tool, it also requires a large amount of effort in time, cost and data (Jun et
al. 1999). A trade-off should be made between modelling accuracy and time
consumption prior to building the simulation model. Therefore, the modeller should
first develop a conceptual model describing the problem situation, data requirements
and desired level of detail (Robinson, 2008a). Analysing the system step by step gives
the modeller a deeper insight into the studied problem and uncovers issues not
previously noticed.
The main advantage of using DES are the building blocks, representing separate
activities of inventory and distribution systems. This modular logic allows for better
understanding, verification and modifications in the future. In addition, it facilitates
the transfer of knowledge and models between different hospitals or logistics processes
and thus encourages generalization. Furthermore, DES is used as only the specified
events from a time schedule are of interest, such as demand generation or inventory
counts. The model also reports global variables, which pertain to the overall system
rather than individual entities, such as monitoring the inventory level. Other
advantages of simulation are its ability to evaluate multiple KPIs simultaneously,
incorporate the stochastic nature of the problem and it is easy to gain an in-depth
knowledge of how the system works and where the bottlenecks occur (Roberts 2011).
Although these benefits make simulation a very powerful tool to model logistics
operations in any setting, it needs to be noted that there are also some shortcomings
when using simulation. The simulation output can be only as good as the data it
receives. Therefore, accurate data collection is of great importance to build a model
that imitates reality. Moreover, simulation models require a thorough understanding of
the system and can be time-consuming (Thorwarth and Arisha 2009). Typically, a
trade-off should be made between model accuracy and time consumption. Uncertainty
is another drawback in a simulation study (Kelton et al. 2015). Assumptions and
simplifications are made to account for the components that are not included in the
model, but are present in the real world, in order to improve transparency and model
development speed. Finally, simulation is not an optimization technique, but it can be

EMPIRICAL RESEARCH AT THE OPERATING THEATRE
111
combined with quantitative models, such as integer programming or Markov models
(Mielczarek & Uziałko-Mydlikowska, 2012).
5.2.1.1 Conceptual modelling
Conceptual modelling is defined as the process of abstracting a model from a complex
real-world problem by depicting the processes using a computer-specific logic
(Robinson, 2008a). However, designing the right model (i.e. what to model and what
not to model) is generally agreed to be the most difficult and least understood task to
be carried out in the beginning of a simulation study. Including too many details will
make the model too complex to be built within the time frame and knowledge
restrictions, as opposed to making the model too simple to accurately represent reality.
Furthermore, using correct and relevant data is crucial for a functioning valid model.
An often repeated phrase is “garbage in, garbage out”. In general, hospitals do not have
extensive logistics databases, so relevant data must be collected manually from time
studies, interviews or observation studies (Gebicki et al. 2014). The design of the
model will determine the data requirements, the speed with which the model can be
developed, the validity of the model, the speed of experimentation and the confidence
that is put in the model outcome. The four steps in a simulation study as described by
Robinson (2018) are:
System description: providing a thorough understanding of the problem
situation and those elements of the real world that relate to the problem.
Conceptual model: a blueprint for the computer model, though it is not
specific to any software. It describes the modelling objectives, system’s
boundaries, inputs, outputs, assumptions and simplifications of the model.
The conceptual model facilitates the development of the computer model and
ensures that the relevant KPIs are measured to compare different
improvement scenarios.
Model design: the design of the constructs for the computer model (e.g. data,
components, model execution). The object flow diagram symbols, suggested
by Greenwood et al. (2013), are often used to depict key system elements and
their relationships.
Computer model: software-specific representation of the conceptual model.
Typically, general-purpose software is used for simulation models rather than
industry-specific tools (e.g. MedModel for healthcare), because most

CHAPTER 5
112
academics are familiar with this software and appreciate its flexibility (i.e. not
limited to healthcare issues). In this chapter, two simulation software
packages, namely Arena and Simulink, are used for modelling inventory
policies, replenishment systems and distribution flows. In addition, a systems
engineering software, LabVIEW, is applied to visualize order picking paths
in the hospital warehouse.
Finally, models must be properly validated and verified for their intended purpose
(Persson 2002; Sargent 2013). However, objective validation and verification
techniques, such as confidence intervals or hypothesis testing, are difficult to adopt in
a healthcare setting due to lack of logistics data. Formal statistical tests might lead to
the conclusion that the model is not accurate, though the model might still be useful
for its intended purpose to compare alternative scenarios, rather than predicting
absolute answers (Lowery 1996). For more information on conceptual modelling
frameworks for simulation, we refer to papers by Robinson (2018, 2013, 2011, 2008a,
2008b).
5.2.1.2 Application of simulation in healthcare SCM
Most healthcare simulation literature focuses on patient flows and care pathways,
making the modelling of supply chain problems in hospitals rather novel. Brailsford et
al. (2009) examine the literature on simulation in the healthcare sector by analysing
the frequency of using modelling methods as well as the application domains. This
section presents a short overview of problems in healthcare SCM that have been
attempted to solve by simulation. For more applications of healthcare simulation, we
refer to review papers by Günal and Pidd (2010), Katsaliaki and Mustafee (2011),
Mielczarek (2016) and Zhang (2018).
Holm et al. (2013) investigate the bed allocation problem among hospital wards by
using DES to reduce hospital crowding. Furthermore, DES is applied to assess
efficiency improvement in the emergency department by evaluating multiple
performance objectives (Komashie and Mousavi 2005). Several studies show the
benefits of simulation to healthcare SCM, such as improved process flows, location
and capacity of facilities or inventory management (Abukhousa et al. 2014). Recently,
Duan and Liao (2013) propose a simulation-optimization framework for managing
highly perishable products in inventory by developing a new age-based replenishment

EMPIRICAL RESEARCH AT THE OPERATING THEATRE
113
policy. Zhou and Olsen (2018) analyse long-life perishable products. They use a
simulation-optimization model for rotating medical supplies to reduce expiration.
Nevertheless, a wide application of simulation studies in healthcare SCM is limited, as
it requires a large effort in time and data analysis (Katsaliaki and Mustafee 2011). Lack
of accurate logistics data complicate the validation and verification steps to determine
the accuracy of the model. Furthermore, Brailsford et al. (2009) and Katsaliaki and
Mustafee (2011) show that most of the developed models in academic settings are not
accepted by healthcare organisations due to high implementation costs. In addition,
models are often built specifically for the hospitals they were developed for, indicating
a need for generalized models with a high degree of flexibility and scalability. The
adoption of promising technologies, such as RFID, will mitigate the aforementioned
challenges as they enable supply chain managers to collect accurate data and hence,
support simulation modelling in healthcare SCM (Abukhousa et al. 2014).
5.2.1.3 Methodology for simulation study design
This chapter mainly focuses on identifying appropriate logistics policies for inventory
and distribution systems and determining the best set of parameter values. DES is the
recommended tool to understand the system’s behaviour and integrated with the ANP-
based prototype, it allows to visualize the impact of efficiency improvement
opportunities on the performance of the healthcare supply chain. Values for the
relevant KPIs are monitored based on simulation output, and scenario analysis is
conducted to support policy decision making. Based on a thorough system description
and by additionally consulting the OT logistics manager, alternative logistics policies
are formulated by mapping the current As-Is situation and identifying bottlenecks,
while ensuring that the policies fit to the overall hospital’s goal. This stakeholder is
responsible for a team of executives on the OT-floor and thus represents both the
tactical and operational level. Figure 5-3 presents a high-level overview of the
simulation methodology.
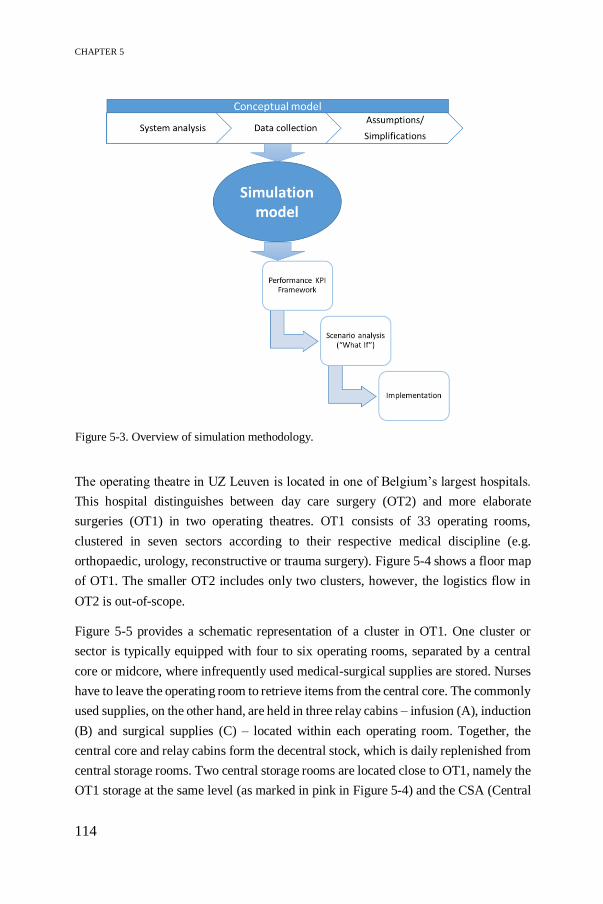
CHAPTER 5
114
The operating theatre in UZ Leuven is located in one of Belgium’s largest hospitals.
This hospital distinguishes between day care surgery (OT2) and more elaborate
surgeries (OT1) in two operating theatres. OT1 consists of 33 operating rooms,
clustered in seven sectors according to their respective medical discipline (e.g.
orthopaedic, urology, reconstructive or trauma surgery). Figure 5-4 shows a floor map
of OT1. The smaller OT2 includes only two clusters, however, the logistics flow in
OT2 is out-of-scope.
Figure 5-5 provides a schematic representation of a cluster in OT1. One cluster or
sector is typically equipped with four to six operating rooms, separated by a central
core or midcore, where infrequently used medical-surgical supplies are stored. Nurses
have to leave the operating room to retrieve items from the central core. The commonly
used supplies, on the other hand, are held in three relay cabins – infusion (A), induction
(B) and surgical supplies (C) – located within each operating room. Together, the
central core and relay cabins form the decentral stock, which is daily replenished from
central storage rooms. Two central storage rooms are located close to OT1, namely the
OT1 storage at the same level (as marked in pink in Figure 5-4) and the CSA (Central
Figure 5-3. Overview of simulation methodology.
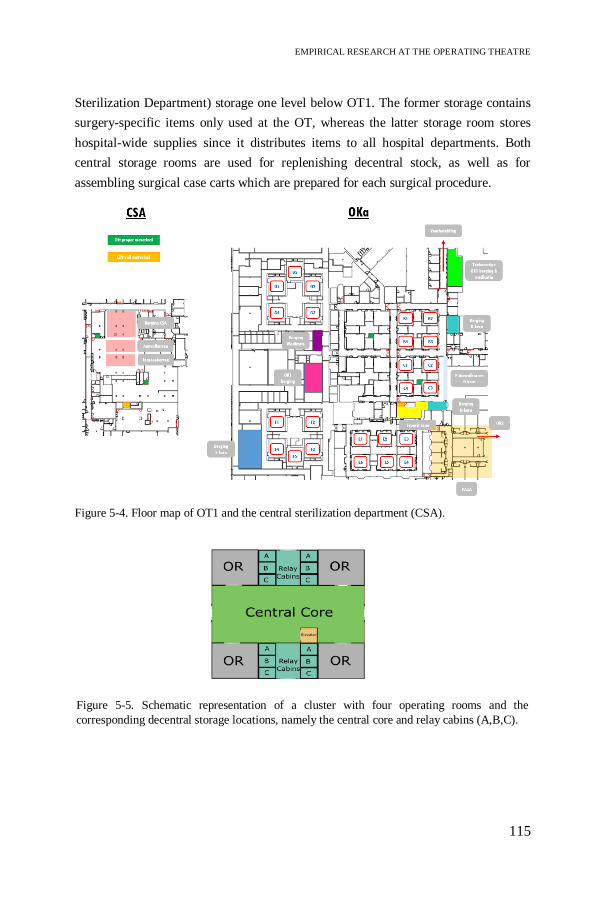
EMPIRICAL RESEARCH AT THE OPERATING THEATRE
115
Sterilization Department) storage one level below OT1. The former storage contains
surgery-specific items only used at the OT, whereas the latter storage room stores
hospital-wide supplies since it distributes items to all hospital departments. Both
central storage rooms are used for replenishing decentral stock, as well as for
assembling surgical case carts which are prepared for each surgical procedure.
Figure 5-4. Floor map of OT1 and the central sterilization department (CSA).
Figure 5-5. Schematic representation of a cluster with four operating rooms and the
corresponding decentral storage locations, namely the central core and relay cabins (A,B,C).
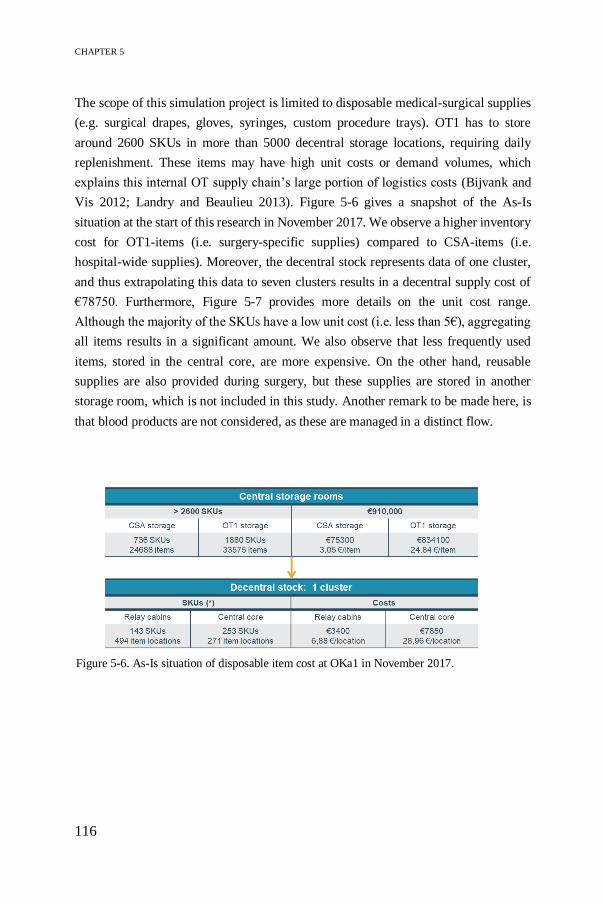
CHAPTER 5
116
The scope of this simulation project is limited to disposable medical-surgical supplies
(e.g. surgical drapes, gloves, syringes, custom procedure trays). OT1 has to store
around 2600 SKUs in more than 5000 decentral storage locations, requiring daily
replenishment. These items may have high unit costs or demand volumes, which
explains this internal OT supply chain’s large portion of logistics costs (Bijvank and
Vis 2012; Landry and Beaulieu 2013). Figure 5-6 gives a snapshot of the As-Is
situation at the start of this research in November 2017. We observe a higher inventory
cost for OT1-items (i.e. surgery-specific supplies) compared to CSA-items (i.e.
hospital-wide supplies). Moreover, the decentral stock represents data of one cluster,
and thus extrapolating this data to seven clusters results in a decentral supply cost of
€78750. Furthermore, Figure 5-7 provides more details on the unit cost range.
Although the majority of the SKUs have a low unit cost (i.e. less than 5€), aggregating
all items results in a significant amount. We also observe that less frequently used
items, stored in the central core, are more expensive. On the other hand, reusable
supplies are also provided during surgery, but these supplies are stored in another
storage room, which is not included in this study. Another remark to be made here, is
that blood products are not considered, as these are managed in a distinct flow.
Figure 5-6. As-Is situation of disposable item cost at OKa1 in November 2017.

EMPIRICAL RESEARCH AT THE OPERATING THEATRE
117
5.2.2 Classification of inventory items in healthcare – A case
study
Inventory classification is pivotal to managing storage units in hospitals. It helps in
identifying item-specific characteristics, such as costs, demand patterns or criticality.
Due to the large amount and wide variety of medical supplies and their divergent
attributes, no single inventory policy applies to all supplies and complicates inventory
management. Thus, inventory classification is a crucial prerequisite when developing
appropriate inventory models depending on the item characteristics. Based on the
classification, different service levels can be specified for different types of supplies,
serving as a starting point for choosing appropriate scenarios of the inventory model.
In this section, two classification methods are compared, both featuring multiple
criteria. The case study includes data on 1541 SKUs stored in OT1 storage room at UZ
Leuven, collected in December 2018.
Figure 5-7. Unit cost (€) range of disposable supplies in decentral stock.
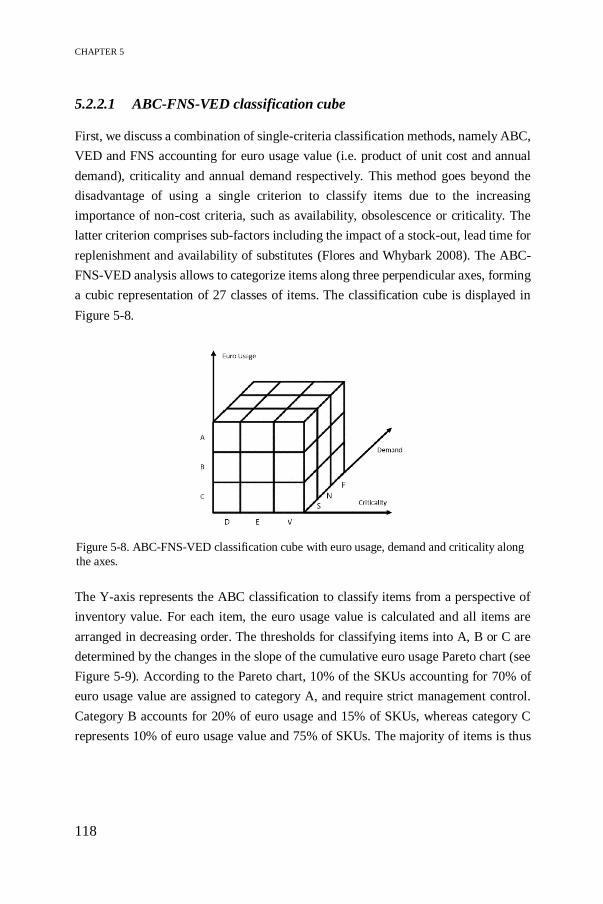
CHAPTER 5
118
5.2.2.1 ABC-FNS-VED classification cube
First, we discuss a combination of single-criteria classification methods, namely ABC,
VED and FNS accounting for euro usage value (i.e. product of unit cost and annual
demand), criticality and annual demand respectively. This method goes beyond the
disadvantage of using a single criterion to classify items due to the increasing
importance of non-cost criteria, such as availability, obsolescence or criticality. The
latter criterion comprises sub-factors including the impact of a stock-out, lead time for
replenishment and availability of substitutes (Flores and Whybark 2008). The ABC-
FNS-VED analysis allows to categorize items along three perpendicular axes, forming
a cubic representation of 27 classes of items. The classification cube is displayed in
Figure 5-8.
The Y-axis represents the ABC classification to classify items from a perspective of
inventory value. For each item, the euro usage value is calculated and all items are
arranged in decreasing order. The thresholds for classifying items into A, B or C are
determined by the changes in the slope of the cumulative euro usage Pareto chart (see
Figure 5-9). According to the Pareto chart, 10% of the SKUs accounting for 70% of
euro usage value are assigned to category A, and require strict management control.
Category B accounts for 20% of euro usage and 15% of SKUs, whereas category C
represents 10% of euro usage value and 75% of SKUs. The majority of items is thus
Figure 5-8. ABC-FNS-VED classification cube with euro usage, demand and criticality along
the axes.

EMPIRICAL RESEARCH AT THE OPERATING THEATRE
119
assigned to the latter category, which is typically characterized by cheap, non-critical
and slow-moving items.
Figure 5-10 depicts the annual euro usage for each item category. From this bar chart,
we observe that category A accounts for the highest inventory value in terms of euro
usage (8.35 million euros) corresponding to only 10% SKUs. Similarly, category B
includes 18% of SKUs accounting for 2.37 million euros and the majority of the items
(72%) is assigned to class C, representing 1.18 million euros. Since the demand in all
categories is at a similar level, we state that items in category A are mainly expensive
items, whereas category C consists of cheaper items.
A B C
Annual demand 184.428 162.912 131.426
Number of SKUs 159 270 1.112
Annual euro usage 8.354.515 2.378.934 1.188.553
0
2.000.000
4.000.000
6.000.000
8.000.000
10.000.000
0
50.000
100.000
150.000
200.000
Annual
euro
usa
ge
(€)
Annu
al D
eman
d (
SK
Us)
Figure 5-9. Pareto chart of cumulative annual euro usage.
Figure 5-10. ABC analysis.
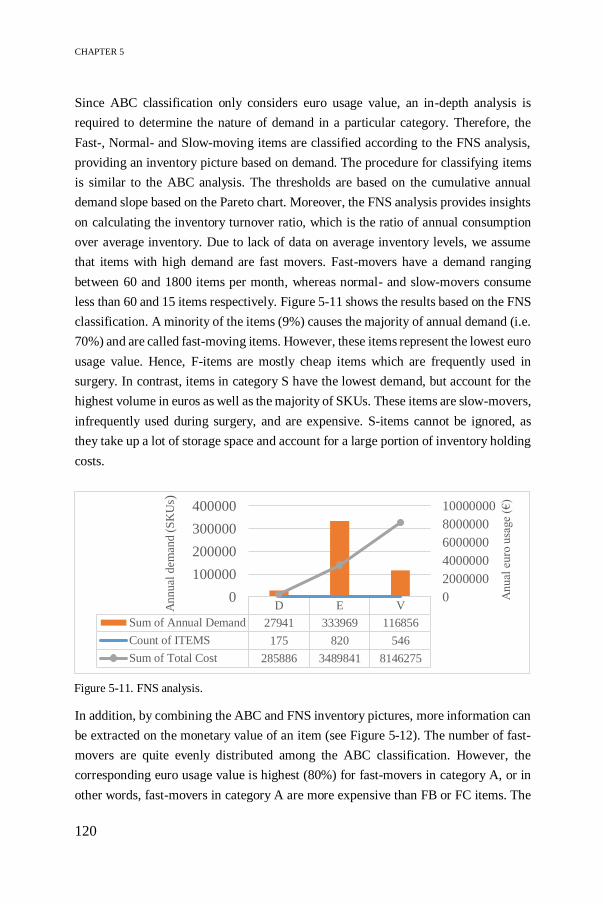
CHAPTER 5
120
Since ABC classification only considers euro usage value, an in-depth analysis is
required to determine the nature of demand in a particular category. Therefore, the
Fast-, Normal- and Slow-moving items are classified according to the FNS analysis,
providing an inventory picture based on demand. The procedure for classifying items
is similar to the ABC analysis. The thresholds are based on the cumulative annual
demand slope based on the Pareto chart. Moreover, the FNS analysis provides insights
on calculating the inventory turnover ratio, which is the ratio of annual consumption
over average inventory. Due to lack of data on average inventory levels, we assume
that items with high demand are fast movers. Fast-movers have a demand ranging
between 60 and 1800 items per month, whereas normal- and slow-movers consume
less than 60 and 15 items respectively. Figure 5-11 shows the results based on the FNS
classification. A minority of the items (9%) causes the majority of annual demand (i.e.
70%) and are called fast-moving items. However, these items represent the lowest euro
usage value. Hence, F-items are mostly cheap items which are frequently used in
surgery. In contrast, items in category S have the lowest demand, but account for the
highest volume in euros as well as the majority of SKUs. These items are slow-movers,
infrequently used during surgery, and are expensive. S-items cannot be ignored, as
they take up a lot of storage space and account for a large portion of inventory holding
costs.
In addition, by combining the ABC and FNS inventory pictures, more information can
be extracted on the monetary value of an item (see Figure 5-12). The number of fast-
movers are quite evenly distributed among the ABC classification. However, the
corresponding euro usage value is highest (80%) for fast-movers in category A, or in
other words, fast-movers in category A are more expensive than FB or FC items. The
D E V
Sum of Annual Demand 27941 333969 116856
Count of ITEMS 175 820 546
Sum of Total Cost 285886 3489841 8146275
0
2000000
4000000
6000000
8000000
10000000
0
100000
200000
300000
400000A
nual
euro
usa
ge
(€)
Annual
dem
and (
SK
Us)
Figure 5-11. FNS analysis.

EMPIRICAL RESEARCH AT THE OPERATING THEATRE
121
majority of S-items (82%) are classified in class C, being cheap. In contrast, slow-
movers classified as A or B items are expensive, though they are rarely used in surgery.
A similar pattern can be observed for normal-moving items. Furthermore, when
looking at the ABC classification, we observe an even distribution of fast, normal and
slow movers in category A. The fast-movers (28%), however, account for the majority
of demand (88%) and the lowest euro usage value (28%) in this category. Hence, we
can conclude that the FA items are less expensive, but they are used in daily surgery.
In contrast, the normal- and slow-moving items in category A are very expensive and
less frequently used. In addition, half of the B-items are expensive slow-movers. 80%
of euro usage is represented by N- and S-items which account for 21% of annual
demand. Fast-moving B-items are cheap. Finally, items in category C are mainly slow-
moving items (83%). Due to the high euro usage and low demand, these medical-
surgical supplies are considered to be expensive.
Although costs and demand are important criteria from a logistics perspective, quality
of patient care and patient safety rank higher than the monetary benefits. Therefore, a
third type of classification is added to the X-axis in Figure 5-8, namely VED analysis,
to consider criticality of items. The items are classified by consulting the logistics
manager and nursing staff, who takes into account the impact of stock-outs on surgical
procedures, the ease of substitutability and the lead time for replenishment. The
criticality classification is based on the Med-MASTA approach (Braglia et al. 2004;
Danas et al. 2006), taking into account three attributes: surgery criticality, availability
A B C A B C A B C
F N S
Number of SKUs 44 52 41 52 75 147 63 143 924
Annual demand 162290 128183 45054 17430 25749 52175 4708 8980 34197
Annual euro usage 2334462 493204 99022 3040217 637935 208039 29798361247795 881492
0
500000
1000000
1500000
2000000
2500000
3000000
3500000
0
20000
40000
60000
80000
100000
120000
140000
160000
180000
Annu
al e
uro
usa
ge
(eu
ros)
Annu
al d
eman
d (
SK
Us)
Figure 5-12. Combination of ABC and FNS analysis.

CHAPTER 5
122
of substitutes and lead time for replenishment. Surgery criticality is a parameter of
utmost importance as it measures the impact of an item on the surgical procedure and
thus can directly affect patient safety. Therefore, the tree structure in Figure 5-13 starts
with this attribute. Second, substitutability considers items with no substitutes to have
a more adverse impact compared to items which can easily be substituted. Finally, lead
time measures the period of procurement of an item and thus determines the ease to
have an item in stock within the desired time frame. The Med-MASTA classification
tree for this work is displayed in Figure 5-13. For each node, three levels of importance
(1 – Critical, 2 – Important, 3 – Not important) are indicated, except for availability of
substitutes, which is considered to have a yes/no condition. First, surgery criticality is
determined and depending on this outcome one of the three different tree structures
according to the importance level is followed until one reaches the final classification
into V, E or D. In general, as more parameters are evaluated with high importance, the
resulting category will be V. Table 5-5 contains the definitions for assigning items to
node levels for each attribute.
Table 5-5. Definitions of criticality attributes.
Attribute Importance level
Surgical
criticality
Critical – Non availability of items cause postponement of urgent
surgery (e.g. reanimation or trauma)
Important – Non availability of items cause postponement of scheduled surgery
Not important – Non availability of items do not affect urgent or scheduled surgery
Availability of
substitutes
Yes – Item has one or more substitutes.
No – Item has no substitutes.
Lead time for
replenishment
Critical – Lead time is more than two weeks.
Important – Lead time is between one and two weeks.
Not important – Lead time is less than one week.

EMPIRICAL RESEARCH AT THE OPERATING THEATRE
123
Figure 5-14 shows the results of the VED analysis. Remarkable is that V-items account
for an intermediate demand, but a peak in euro usage value. This is plausible as V-
items are often medical equipment, such as oxygenators, which have a unit cost of
approximately €1140 and an annual usage of €187000. Approximately 5% of vital
items have an average unit cost range between €1000 and €4000. Although these items
are less frequently used, they require stricter control in order to prevent critical
shortages which have adverse impact on surgery. The majority of items (53%) are
classified to be essential and they represent the highest annual demand. Most E-items
are priced below €200. Finally, the desirable items account for the least euro usage and
annual demand with an average unit cost less than €50. Examples of D-items are
surgical face masks, gloves, etc. These items have several substitutes, in varying sizes
or colours, and have short replenishment lead times. Therefore these items are
classified as desirable.
Figure 5-13. Med-MASTA tree structure for determining criticality of items (based on Danas et
al., 2006).

CHAPTER 5
124
Linking the VED analysis to the combined ABC-FNS classification provides further
insights into the item characteristics. A remarkable aspect is the high euro usage value
for slow-moving items in Figure 5-11 and Figure 5-12. The combined FNS-VED-ABC
analysis in Figure 5-15 and the inventory classification matrix in Figure 5-16 show that
the majority of this euro usage value (32.4%) is taken up by vital items in category A.
Since the SAV items do not have very high demand and account only for 3% of SKUs,
we can conclude that these items are very expensive and require strict management
control. A similar pattern is shown for NAV items, accounting for a high euro usage
value (23.8%) due to expensive and critical items. Furthermore, essential items
account for the highest number of SKUs as they are used on a daily basis and thus are
essential for surgeries. Two peaks in annual demand are observed for FBE and FAE
items. Both are fast-moving items which are frequently used in surgery. Since these
classes have low euro usage value, they are considered to be cheaper items. Finally,
the class of desirable items have extremely low annual demand (5.98%), annual euro
usage (2.30%) and the least number of SKUs. Most of these items are cheap, have high
substitutability and short lead times which lowers the surgical impact (e.g. gloves,
clipper blades, etc.).
D E V
Annual demand 27941 333969 116856
Number of SKUs 175 820 546
Annual euro usage 285886 3489841 8146275
01000000
2000000300000040000005000000
60000007000000
80000009000000
0
50000
100000
150000
200000
250000
300000
350000
400000
Anu
al e
uro
usa
ge
(€)
Annu
al d
eman
d (
SK
Us)
Figure 5-14. VED analysis.
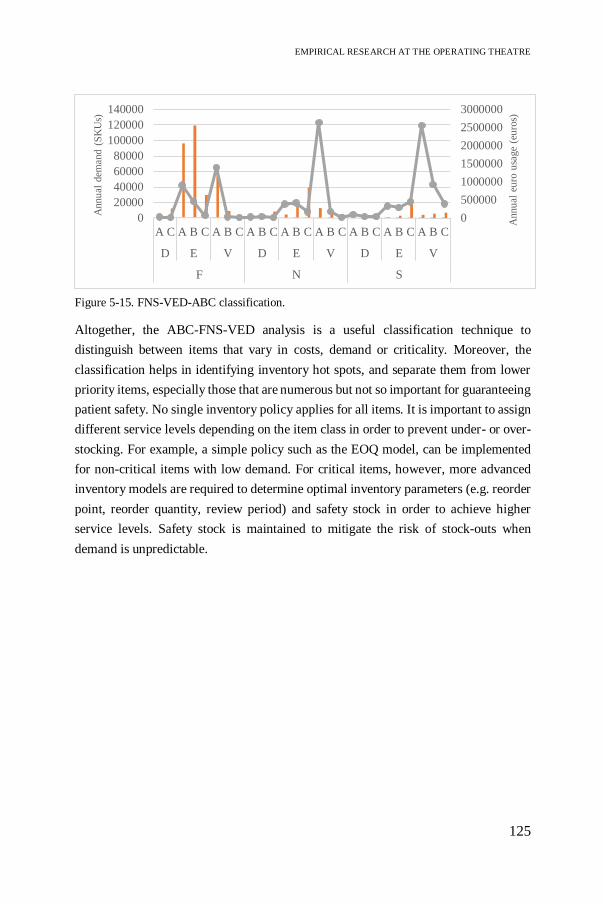
EMPIRICAL RESEARCH AT THE OPERATING THEATRE
125
Altogether, the ABC-FNS-VED analysis is a useful classification technique to
distinguish between items that vary in costs, demand or criticality. Moreover, the
classification helps in identifying inventory hot spots, and separate them from lower
priority items, especially those that are numerous but not so important for guaranteeing
patient safety. No single inventory policy applies for all items. It is important to assign
different service levels depending on the item class in order to prevent under- or over-
stocking. For example, a simple policy such as the EOQ model, can be implemented
for non-critical items with low demand. For critical items, however, more advanced
inventory models are required to determine optimal inventory parameters (e.g. reorder
point, reorder quantity, review period) and safety stock in order to achieve higher
service levels. Safety stock is maintained to mitigate the risk of stock-outs when
demand is unpredictable.
0
500000
1000000
1500000
2000000
2500000
3000000
0
20000
40000
60000
80000
100000
120000
140000
A C A B C A B C A B C A B C A B C A B C A B C A B C
D E V D E V D E V
F N S
Annu
al e
uro
usa
ge
(eu
ros)
Annu
al d
eman
d (
SK
Us)
Figure 5-15. FNS-VED-ABC classification.

CHAPTER 5
126
Fig
ure
5-1
6.
Inven
tory
cla
ssif
icat
ion m
atri
x i
n t
erm
s of
SK
Us,
% a
nnual
dem
and a
nd %
euro
usa
ge
(Kar
ker
a, 2
020).

EMPIRICAL RESEARCH AT THE OPERATING THEATRE
127
5.2.2.2 AHP-based classification
A second classification method uses a well-known MCDM technique to calculate a
classification score for each inventory item, while considering multiple attributes. The
AHP is developed by Saaty (2008) as a tool supporting decision-making processes
when several influencing criteria are involved to find the solution that best suits their
goal and understanding of the problem. In a first step, AHP decomposes the complex
decision problem into a hierarchical structure consisting of branching nodes as in
Figure 5-17. Applied to the OT1 setting, the influencing criteria for ranking inventory
items are average unit cost, euro usage, demand pattern, criticality and surgeon’s item
preferences. Surgeon preferences can significantly impact inventory management as
the item assortment continuously changes due to the launch of new, innovative
surgical-medical items or due to surgeon’s partnerships with medical companies.
Increased transparency is required by engaging surgeons and improving awareness
regarding the costs of surgical instruments in order to limit item variety and ensure
proper management of physician preference cards. In this study, however, surgeon
preferences are disregarded due to limited data.
The second step of AHP uses pairwise comparisons to express preferences for each of
the influencing nodes on a 1-9 scale based on expert knowledge and judgment of
decision makers. Table 5-6 shows the values for the pairwise comparisons as judged
by the OT logistics manager.
Inventory classification
score
Average unit cost
Annual euro usage
Annual demand Criticality
Figure 5-17. Hierarchy of criteria for inventory classification (Karkera, 2020).

CHAPTER 5
128
Table 5-6. Pairwise comparison table in AHP procedure.
Average
unit cost
Annual
euro
usage
Criticality Annual
demand
Priorities
Average unit cost 1 1/9 1/8 1/6 0.04
Annual euro
usage
9 1 5 2 0.45
Criticality 8 1/2 1 2 0.31
Annual demand 6 1/2 1/2 1 0.20
In the next step, AHP converts these judgments to numerical weights or priorities for
each of the influencing criteria. A consistency ratio of 10% is achieved to check for
inconsistent judgments. The resulting priorities can be found in the final column of
Table 5-6. The highest weight is attributed to annual euro usage, followed by
criticality, annual demand and average unit cost. Based on these priorities, critical
items or items with high euro usage value will be ranked higher, whereas items with a
high unit cost do not necessarily have a high-ranked classification score due to its low
weight. Since euro usage value is the product of annual demand and unit cost, a high
unit cost does not necessarily imply a high euro usage value when demand is very low.
This difference between the priorities emphasizes the importance of patient safety,
rather than costs, when classifying items for inventory optimization.
Finally, the classification of items based on the AHP priority vector is determined. The
goal is to calculate a classification score for each inventory item by taking into account
the priorities for each attribute in Table 5-6, representing the relative importance of the
item characteristics. In addition, for each item a value on each criterion is required.
The classification score is computed as the sum product of the criteria weights and the
corresponding criteria values (see Equation 5.2). The criteria values are determined by
data on average unit cost, annual euro usage value and annual demand. Since no
numerical value is available for criticality, Flores and Whybark (2008) assign values
of 1, 0.5 and 0.01 for vital, essential and desirable items respectively. However, the
criteria values differ significantly in units of measure, with annual euro usage
amounting up to hundreds of euros whereas criticality takes up values in the range of
0 and 1. Therefore, the criteria values are normalized using:
𝐹𝑛𝑒𝑤 =𝐹𝑎𝑐𝑡𝑢𝑎𝑙 − 𝐹𝑚𝑖𝑛𝑖𝑚𝑢𝑚
𝐹𝑚𝑎𝑥𝑖𝑚𝑢𝑚 − 𝐹𝑚𝑖𝑛𝑖𝑚𝑢𝑚
(5.1)
EMPIRICAL RESEARCH AT THE OPERATING THEATRE
129
In Equation 5.1, Fnew represents the normalized criterion value, Factual is the initial value
for each criterion, and Fminimum/maximum are the minimum and maximum criterion values
for all items included in the dataset. After normalization, the classification score for
each inventory item is calculated:
𝐶𝑙𝑎𝑠𝑠𝑖𝑓𝑖𝑐𝑎𝑡𝑖𝑜𝑛 𝑠𝑐𝑜𝑟𝑒 = 0.04 ∗ 𝑎𝑣𝑒𝑟𝑎𝑔𝑒 𝑢𝑛𝑖𝑡 𝑐𝑜𝑠𝑡 + 0.45 ∗ 𝑎𝑛𝑛𝑢𝑎𝑙 𝑒𝑢𝑟𝑜 𝑢𝑠𝑎𝑔𝑒+0.31 ∗ 𝑐𝑟𝑖𝑡𝑖𝑐𝑎𝑙𝑖𝑡𝑦 + 0.20 ∗ 𝑎𝑛𝑛𝑢𝑎𝑙 𝑑𝑒𝑚𝑎𝑛𝑑 (5.2)
The classification scores are now arranged in decreasing order and thresholds are
defined to classify items into different groups. Flores and Whybark (2008) suggest to
use cut-offs of 10%, 20% and 70% of the classification score to classify items into
three groups. The items accounting for the top 10% of classification scores are the
most important items (i.e. category 1), requiring strict management control, whereas
category 2 and 3 receive moderate or low priority respectively. Category 1 contains
mostly expensive and vital items, characterized by the high euro usage and lower
annual demand. In category 2, slow-moving vital items are observed. However, these
items also need strict management control as a stock-out can adversely impact a
surgery. The majority of SKUs is classified as category 3, reflecting high annual
demand and euro usage. The classification cut-offs, however, should be decided based
on the understanding of the problem and the goals of the organisation. Unlike the ABC
and FNS analysis, the slope variations in the Pareto chart cannot be used as reference
points for cut-offs due to the linear relationship in Equation 5.2. Further analysis of the
cut-offs suggested by Flores and Whybark (2008) shows that 189 vital items are
classified under category 2 and 292 vital items under category 3. Figure 5-18 provides
an overview of the number of SKUs by linking the ABC-FNS-VED classification to
the AHP categories.

CHAPTER 5
130
If these classification results would be used to assign service levels for the
development of the inventory model, it could be catastrophic as several vital or
essential items have insufficient control due to their classification in category 2 and 3.
Therefore, the threshold values as suggested by Flores and Whybark (2008) are
adapted to the current situation in consultation with the OT logistics team, and one
category is added as proposed by the Med-MASTA classification by Danas et al.
(2006) to determine the importance of inventory items. The goal when setting the
thresholds is to assign as many vital items as possible to category 1 and 2, the majority
of essential items to category 3 and the remainder, mainly desirable items, in category
4 based on their classification score. The thresholds are changed to 25%, 35%, 39%
and 1% of the cumulative classification score. As a result, the vital items fall into
category 1 and 2. 95% of essential items are classified in category 3 and all desirable
items are grouped in category 4. Figure 5-19 shows the results for the AHP
classification based on the adapted cut-offs, tailored to the specific inventory problem
at OT1. Based on this classification, different service levels can be assigned to four
classes of items and appropriate inventory parameters can be found depending on the
item characteristics.
Figure 5-18. Combination of AHP-based (category 1, 2, 3) and ABC-FNS-VED classification.
A C A B C A B C A B C A B C A B C A B C A B C A B C
F N S F N S F N S
D E V
AHP category 3 1 10 1 5 22 1 5 130 19 48 28 15 51 111 8 36 499 13 2 277
AHP category 2 3 1 6 4 3 14 19 1 24 100 18
AHP category 1 1 14 22 29
Number of SKUs
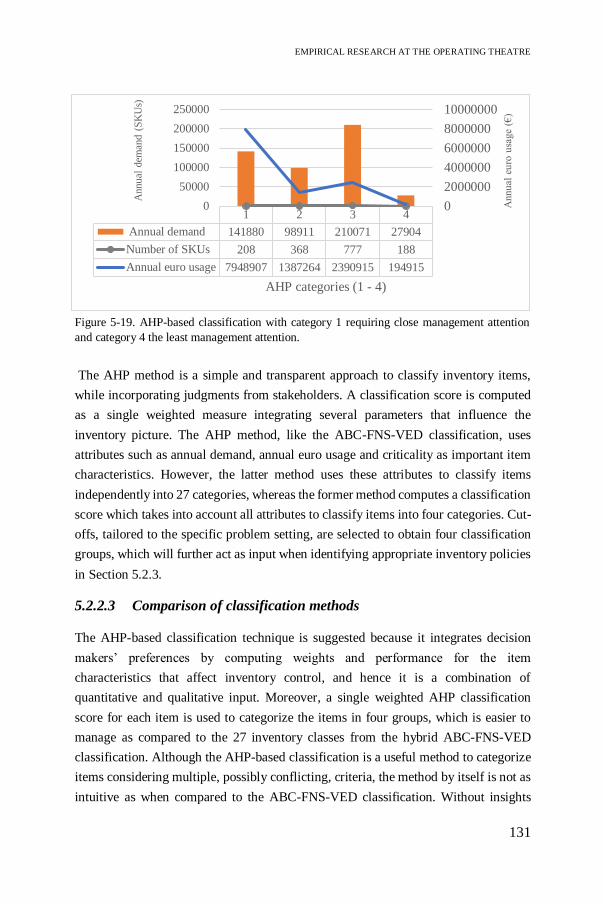
EMPIRICAL RESEARCH AT THE OPERATING THEATRE
131
The AHP method is a simple and transparent approach to classify inventory items,
while incorporating judgments from stakeholders. A classification score is computed
as a single weighted measure integrating several parameters that influence the
inventory picture. The AHP method, like the ABC-FNS-VED classification, uses
attributes such as annual demand, annual euro usage and criticality as important item
characteristics. However, the latter method uses these attributes to classify items
independently into 27 categories, whereas the former method computes a classification
score which takes into account all attributes to classify items into four categories. Cut-
offs, tailored to the specific problem setting, are selected to obtain four classification
groups, which will further act as input when identifying appropriate inventory policies
in Section 5.2.3.
5.2.2.3 Comparison of classification methods
The AHP-based classification technique is suggested because it integrates decision
makers’ preferences by computing weights and performance for the item
characteristics that affect inventory control, and hence it is a combination of
quantitative and qualitative input. Moreover, a single weighted AHP classification
score for each item is used to categorize the items in four groups, which is easier to
manage as compared to the 27 inventory classes from the hybrid ABC-FNS-VED
classification. Although the AHP-based classification is a useful method to categorize
items considering multiple, possibly conflicting, criteria, the method by itself is not as
intuitive as when compared to the ABC-FNS-VED classification. Without insights
1 2 3 4
Annual demand 141880 98911 210071 27904
Number of SKUs 208 368 777 188
Annual euro usage 7948907 1387264 2390915 194915
0
2000000
4000000
6000000
8000000
10000000
0
50000
100000
150000
200000
250000
Annu
al e
uro
usa
ge
(€)
Annu
al d
eman
d (
SK
Us)
AHP categories (1 - 4)
Figure 5-19. AHP-based classification with category 1 requiring close management attention
and category 4 the least management attention.
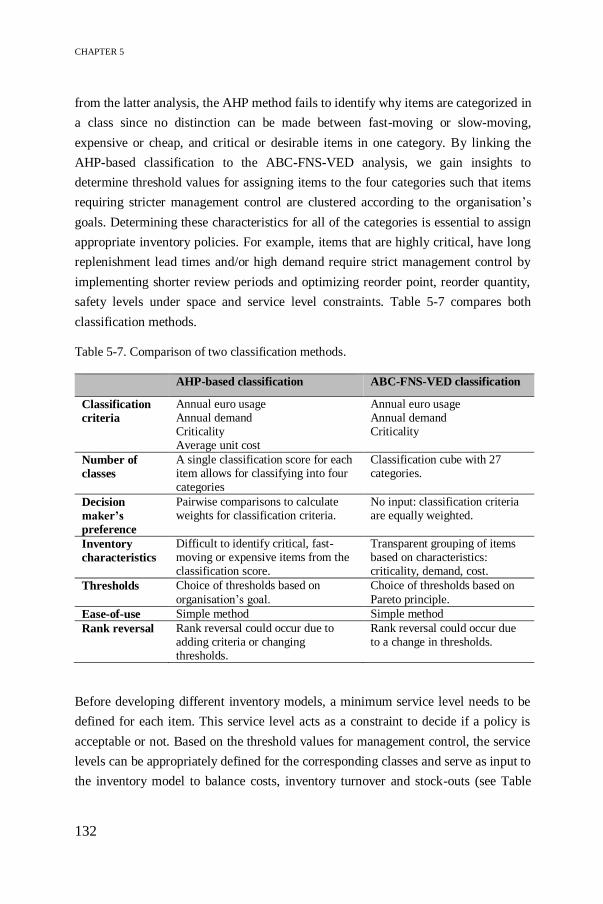
CHAPTER 5
132
from the latter analysis, the AHP method fails to identify why items are categorized in
a class since no distinction can be made between fast-moving or slow-moving,
expensive or cheap, and critical or desirable items in one category. By linking the
AHP-based classification to the ABC-FNS-VED analysis, we gain insights to
determine threshold values for assigning items to the four categories such that items
requiring stricter management control are clustered according to the organisation’s
goals. Determining these characteristics for all of the categories is essential to assign
appropriate inventory policies. For example, items that are highly critical, have long
replenishment lead times and/or high demand require strict management control by
implementing shorter review periods and optimizing reorder point, reorder quantity,
safety levels under space and service level constraints. Table 5-7 compares both
classification methods.
Table 5-7. Comparison of two classification methods.
AHP-based classification ABC-FNS-VED classification
Classification
criteria
Annual euro usage Annual demand Criticality Average unit cost
Annual euro usage Annual demand Criticality
Number of
classes
A single classification score for each item allows for classifying into four categories
Classification cube with 27 categories.
Decision
maker’s
preference
Pairwise comparisons to calculate weights for classification criteria.
No input: classification criteria are equally weighted.
Inventory
characteristics
Difficult to identify critical, fast-moving or expensive items from the classification score.
Transparent grouping of items based on characteristics: criticality, demand, cost.
Thresholds Choice of thresholds based on
organisation’s goal.
Choice of thresholds based on
Pareto principle.
Ease-of-use Simple method Simple method
Rank reversal Rank reversal could occur due to adding criteria or changing thresholds.
Rank reversal could occur due to a change in thresholds.
Before developing different inventory models, a minimum service level needs to be
defined for each item. This service level acts as a constraint to decide if a policy is
acceptable or not. Based on the threshold values for management control, the service
levels can be appropriately defined for the corresponding classes and serve as input to
the inventory model to balance costs, inventory turnover and stock-outs (see Table

EMPIRICAL RESEARCH AT THE OPERATING THEATRE
133
5-8). For category 1 and 2, a service level of 99.7% and 98% respectively should be
achieved since a stock-out of these items has adverse impact on the surgical procedure
and patient safety. Category 3 and 4 have service levels of 95% and 90% respectively.
A lower service level can be maintained as these items have several substitutes and
short lead times. In addition, increasing the items in stock for items in category 4 has
limited impact on holding costs due to the low unit costs, and hence a longer review
period can be implemented for this type of items. As a conclusion, no single inventory
model can be used for every item in stock. Depending on the item characteristics, other
policies will be applied.
Table 5-8. Service level assigned per classification group
AHP-classification 1 2 3 4
Service level [%] 99.70 98 95 90
5.2.3 Optimization of a two-echelon inventory system at the
operating theatre – A case study
Inventory control of medical-surgical supplies is a challenging field in OR/OM due to
dynamic and critical supply needs compared to other hospital units. The nature of
surgical procedures varies widely depending on the medical discipline (e.g. cardiology,
neurology, and traumatology), physicians often have preferences for different supplies
and the patient’s medical history plays a central role. Today, the OT is dealing with
several inventory issues, such as stock-outs, backorders, lack of visibility or paper-
based exchange of information between different units. These problems can adversely
affect patient safety, decrease service levels and lead to higher inventory costs. In this
case study, a two-echelon inventory system is established where the central storage
room and the operating rooms constitute the two echelons (Lauwers 2019). The main
objective is to identify inefficiencies in the current situation and propose possible
improvements based on the ANP-based prototype, as suggested in Chapter 4. The
scope is limited to disposable supplies used at the OT. The inventory classification
based on AHP serves as an input for identifying multiple scenarios by assigning
appropriate service levels for each item group in order to minimize costs, improve
inventory turnover and reduce stock-outs. A DES model is developed to determine
values for the operational inventory parameters, and potential trade-offs among the

CHAPTER 5
134
KPIs are quantified by introducing the Internal Logistics Efficiency Performance
(ILEP) index that combines the ANP and DES output.
5.2.3.1 Methodology
Figure 5-20 shows the materials flow within OT1. A situation description and
schematic overview of OT1 were given in Section 4.2.1.4, Figure 4-4 and Figure 4-5.
The flow starts downstream in the supply chain where demand is generated by using
supplies during surgery. For each procedure, a surgical case cart is prepared in the
central storage room with the minimum required amount of items. Any additional
supplies required during surgery can be pulled from decentral stock. Logistics
employees check the consumption in the decentral storage (i.e. central core and relay
cabins) by daily scanning the amount of used items. The requested items are collected
in the central storage to replenish the central core and relay cabins. Similarly, the
central storage room is scanned on a weekly basis and is replenished by external
suppliers. This study focuses on the two-echelon inventory system, where the decentral
stock is replenished by the central storage. Currently, a periodic (R,S) policy is applied
where, every review period R, the supplies are counted to generate a picking list with
the orders that bring inventories up to the maximum stock level S, or the PAR level.
However, these PAR levels are based on intuitive reasoning to satisfy average demand
for a period of four days, or the longest possible weekend. Moreover, limited visibility
in inventory costs and stock-outs, high inventory turnover, stocking excessive amounts
of items, etc. are typical problems encountered due to lack of appropriate inventory
policy.
Figure 5-20. Schematic overview of supply chain in operating theatre.

EMPIRICAL RESEARCH AT THE OPERATING THEATRE
135
5.2.3.2 Conceptual model
Modelling objective
The overall objective of this work is to identify opportunities for efficiency gains by
selecting the most appropriate inventory policy for each item category and improving
inventory parameters accordingly. A two-echelon inventory model is developed as a
first step towards the optimal inventory allocation decision, which aims to determine
where to locate supplies between different locations (Ahmadi et al. 2018). The supplies
are categorized according to common characteristics, such as surgical criticality, price
or usage rate. Each category requires different management control by assigning
different service levels (see Table 5-8). The simulation model runs different scenarios
for each item category by adjusting the decision parameters, namely maximum stock
level and reorder point. The best performing scenario for each category is identified
by comparing the ILEP index, which integrates three KPIs, namely inventory cost,
service level and productivity, based on the ANP-based prototype as designed in
Chapter 4.
Model structure
A conceptual model is constructed providing an overview of the inventory system logic
and facilitating the development of the computer model. The inventory items are
divided into four categories based on their AHP-based classification score to determine
the importance of the inventory items. Ten items for each group are selected to test the
applicability of different inventory policies using service level as a constraint, being
99.7%, 98%, 95% and 90% for the four categories respectively. Every day at 6:00 PM,
demand is generated in the decentral storages, which needs replenishment from central
storage, and thus also creates demand in the latter. The model structure consists of two
main parts, namely fulfilling the daily, decentral demand based on the consumption
rate of an item during surgery, and replenishing the stock. Figure 5-21 represents the
conceptual model for part 1, namely fulfilling demand during surgery. If demand is
fulfilled from decentral stock, the inventory level is updated according to Equation 5.3.
𝐼𝑛𝑣𝑒𝑛𝑡𝑜𝑟𝑦𝑡 = max(𝑖𝑛𝑣𝑒𝑛𝑡𝑜𝑟𝑦𝑡−1 − 𝑑𝑒𝑚𝑎𝑛𝑑𝑡 ; 0) (5.3)
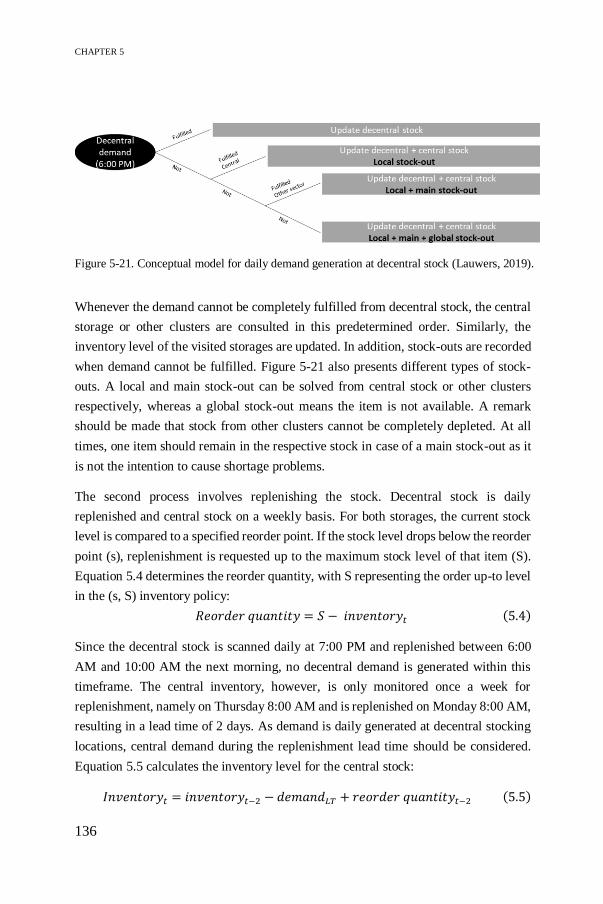
CHAPTER 5
136
Whenever the demand cannot be completely fulfilled from decentral stock, the central
storage or other clusters are consulted in this predetermined order. Similarly, the
inventory level of the visited storages are updated. In addition, stock-outs are recorded
when demand cannot be fulfilled. Figure 5-21 also presents different types of stock-
outs. A local and main stock-out can be solved from central stock or other clusters
respectively, whereas a global stock-out means the item is not available. A remark
should be made that stock from other clusters cannot be completely depleted. At all
times, one item should remain in the respective stock in case of a main stock-out as it
is not the intention to cause shortage problems.
The second process involves replenishing the stock. Decentral stock is daily
replenished and central stock on a weekly basis. For both storages, the current stock
level is compared to a specified reorder point. If the stock level drops below the reorder
point (s), replenishment is requested up to the maximum stock level of that item (S).
Equation 5.4 determines the reorder quantity, with S representing the order up-to level
in the (s, S) inventory policy:
𝑅𝑒𝑜𝑟𝑑𝑒𝑟 𝑞𝑢𝑎𝑛𝑡𝑖𝑡𝑦 = 𝑆 − 𝑖𝑛𝑣𝑒𝑛𝑡𝑜𝑟𝑦𝑡 (5.4)
Since the decentral stock is scanned daily at 7:00 PM and replenished between 6:00
AM and 10:00 AM the next morning, no decentral demand is generated within this
timeframe. The central inventory, however, is only monitored once a week for
replenishment, namely on Thursday 8:00 AM and is replenished on Monday 8:00 AM,
resulting in a lead time of 2 days. As demand is daily generated at decentral stocking
locations, central demand during the replenishment lead time should be considered.
Equation 5.5 calculates the inventory level for the central stock:
𝐼𝑛𝑣𝑒𝑛𝑡𝑜𝑟𝑦𝑡 = 𝑖𝑛𝑣𝑒𝑛𝑡𝑜𝑟𝑦𝑡−2 − 𝑑𝑒𝑚𝑎𝑛𝑑𝐿𝑇 + 𝑟𝑒𝑜𝑟𝑑𝑒𝑟 𝑞𝑢𝑎𝑛𝑡𝑖𝑡𝑦𝑡−2 (5.5)
Figure 5-21. Conceptual model for daily demand generation at decentral stock (Lauwers, 2019).

EMPIRICAL RESEARCH AT THE OPERATING THEATRE
137
Data
Data availability is a well-known problem in any healthcare setting. At the hospital
under study, scanning data is available covering consumption in almost all operating
rooms in a period of one year (i.e. April 2018 – March 2019). Therefore, we include
demand data based on the consumption rate of items which are stocked decentral.
Demand is generated in the model using an empirical distribution, which means that
occurrence of demand is proportional to the data sample. These data also partially
represent the central storage demand. The remaining demand in the central storage
room originates from preparing surgical case carts. However, due to lack of data,
surgical case cart demand is omitted from this study and thus it can be expected that
the final inventory parameters for the central storage room will be an underestimation.
Although the simulation output will deviate from reality, our approach provides
interesting insights as proof-of-concept for optimizing inventory management.
Another problem relates to the information on stock-outs. When a stock-out occurs in
the operating room, a local stock-out is recorded and the item is retrieved from the
central storage. However, this information is not included in the consumption data of
the decentral and central stock. As a consequence, the demand data of the central stock
contain information on decentral consumption, surgical case cart consumption and
local stock-outs. In case of a global stock-out, the item is not scanned and thus not
consumed in the data. Instead, demand is generated for a substitute item.
Key performance indicators
Three KPIs are identified to measure the cost, quality and productivity of the two-
echelon inventory system at the OT. These objectives are specified in the prototype to
improve the efficiency of inventory management in a healthcare setting. Table 5-9
includes the weights attributed to these KPIs, which are defined using the Analytic
Network Process (ANP). More information about the ANP methodology and the
weight factors can be found in Chapter 4 and Saaty (2010, 1990).
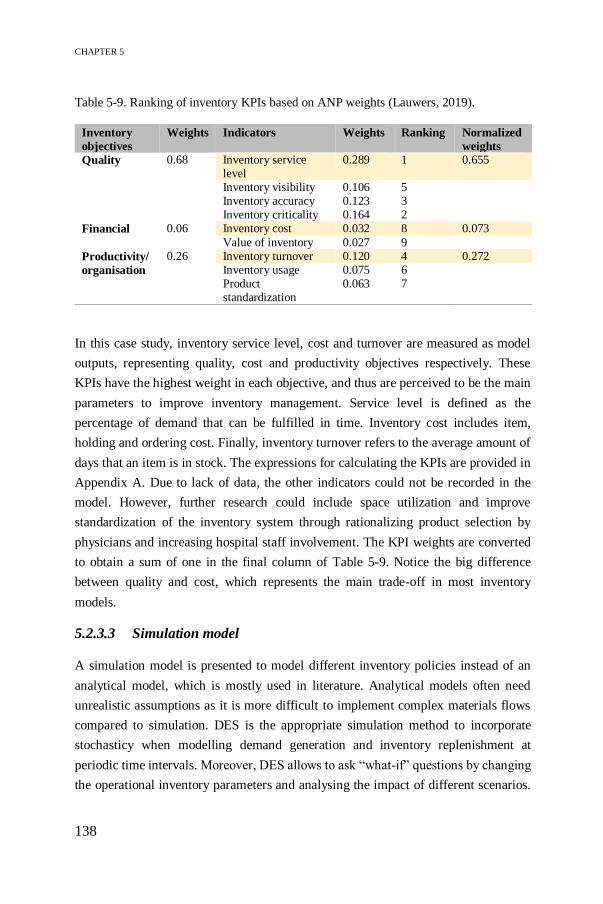
CHAPTER 5
138
Table 5-9. Ranking of inventory KPIs based on ANP weights (Lauwers, 2019).
Inventory
objectives
Weights Indicators Weights Ranking Normalized
weights
Quality 0.68 Inventory service level
0.289 1 0.655
Inventory visibility 0.106 5 Inventory accuracy 0.123 3 Inventory criticality 0.164 2
Financial 0.06 Inventory cost 0.032 8 0.073
Value of inventory 0.027 9
Productivity/
organisation
0.26 Inventory turnover 0.120 4 0.272 Inventory usage 0.075 6 Product standardization
0.063 7
In this case study, inventory service level, cost and turnover are measured as model
outputs, representing quality, cost and productivity objectives respectively. These
KPIs have the highest weight in each objective, and thus are perceived to be the main
parameters to improve inventory management. Service level is defined as the
percentage of demand that can be fulfilled in time. Inventory cost includes item,
holding and ordering cost. Finally, inventory turnover refers to the average amount of
days that an item is in stock. The expressions for calculating the KPIs are provided in
Appendix A. Due to lack of data, the other indicators could not be recorded in the
model. However, further research could include space utilization and improve
standardization of the inventory system through rationalizing product selection by
physicians and increasing hospital staff involvement. The KPI weights are converted
to obtain a sum of one in the final column of Table 5-9. Notice the big difference
between quality and cost, which represents the main trade-off in most inventory
models.
5.2.3.3 Simulation model
A simulation model is presented to model different inventory policies instead of an
analytical model, which is mostly used in literature. Analytical models often need
unrealistic assumptions as it is more difficult to implement complex materials flows
compared to simulation. DES is the appropriate simulation method to incorporate
stochasticy when modelling demand generation and inventory replenishment at
periodic time intervals. Moreover, DES allows to ask “what-if” questions by changing
the operational inventory parameters and analysing the impact of different scenarios.

EMPIRICAL RESEARCH AT THE OPERATING THEATRE
139
For this case study, the Simulink simulation platform is used which enables data
processing within the software package Matlab.
Figure 5-22 gives a high-level overview of the different building blocks in the
simulation model. The modular build-up allows for easy understanding, flexibility and
modifications by the end user. The model is characterized by a single-item, two-
echelon inventory system. Since there is no interaction among items, extending the
model to multiple items would be too time-consuming. The inventory modules (e.g.
InventoryA_Item1) contain the current inventory level of one item in each storage
room, central and decentral. At the start of the simulation, two attributes, namely the
maximum stock level and reorder point, are assigned to each data module, which can
easily be changed to test different scenarios. The ‘Read inventories’ module saves the
current inventory levels to a data file with a fixed time interval of one hour in order to
calculate the average inventory. The decentral and central storage modules contain the
daily demand generation and inventory replenishment. An overview of the demand
generation in decentral stock and the model logic of the inventory check are shown in
Appendix B.
Validation and verification
Verification and validation are crucial steps in any simulation study. A verified model
ensures that the outcome of the model is as expected according to the conceptual
model. A simple Material Requirement Planning (MRP) logic in which the inventory
level and stock-outs can easily be predicted is compared to the simulation outcome.
Similar results are obtained. The robustness of the model is also verified by creating a
Figure 5-22. High-level overview of simulation model.

CHAPTER 5
140
similar model in a different DES software, namely Arena. In the long run, both models
converge to the same outcome, though there are negligible deviations in demand due
to random number generation.
Validation deals with building the right model. Since data availability is a well-known
issue in healthcare, limited validation is performed by calculating the expected
consumption rate and number of decentral orders. Table 5-10 gives an overview of the
number of possible scanning days of one item in decentral stock and the frequency.
Extrapolating this data to one year (i.e. 260 days) gives similar results as the simulation
output, and thus validation ensures that the model gives a good representation of
reality.
Table 5-10. Validation of annual demand and order size.
Decentral
stock
Scanning
days
Scanned
amount
Frequency Expected
frequency
(260 days)
Expected
consumption
A 189 1 7 9.6 9.6
CD 249 1/2/3 57/29/6 96.1 139
F 247 1/2/3/4 43/17/10/1 74.7 116.6
G 250 1/2/3/4/5 8/2/1/3/2 16.6 38.4
Expected total
Simulated total
197 303.6
197.7 306
Scenario analysis
For each item of the four classification groups, three scenarios with varying stock
levels (S) and reorder points (s), are simulated and compared by monitoring the impact
of these decision parameters on the service level. The service level is the restricting
factor as a minimum level must be achieved for each classification group. The As-Is
scenario represents the current situation of the item, with experience-based inventory
parameters (s, S). Due to the large differences between items, no general description
of this scenario can be provided since the service level is too low for 12% of the items,
while the remaining items have excessive safety stocks. In the second scenario, the
goal is to adapt the parameters to the demand characteristics of the items while
respecting the requested service level in each classification group. A box plot of the
order sizes (see Figure 5-23) is used to determine the maximum stock level and reorder
point. For the most critical categories, the maximum stock level and reorder point are
equal to the maximum peak demand (Dp) to maintain sufficient safety stock and thus

EMPIRICAL RESEARCH AT THE OPERATING THEATRE
141
ensure high service levels. The lower the item criticality, the less safety stock will be
allowed and thus the decision parameters decrease to the maximum (Dm), first quartile
(D1q) or median (Dmed) demand. Finally, in the third scenario more risk is taken by
reducing the safety stock and thus lowering inventory levels, holding costs and
inventory turnover. As a consequence, the service level will be lower, but still
acceptable for non-critical items. Table 5-11 provides an overview of the decision
parameters for each scenario, each storage location and each classification group. Due
to varying demand characteristics within one classification group, different
combinations of parameters are tested in a trial-and-error approach in order to
determine the combination generating the lowest costs and stock-outs. If for all items
within the same group acceptable service levels are obtained, the inventory policy can
be generalized for the whole group and the KPIs are measured to find the most efficient
inventory policy for each group in terms of cost, quality and productivity.
5.2.3.4 Results
The simulation model is used to assess three scenarios summarized in Table 5-11 and
find the most appropriate inventory policy for each classification group. No single
inventory policy applies to all supplies due to divergent item characteristics, such as
criticality, price or usage rate. After a warm-up period of one year to achieve steady
state, the simulation model has run for ten years. For each scenario, ten items of each
classification group are simulated. Yearly statistics are extracted to obtain average
values for the three KPIs, namely costs, stock-outs and inventory turnover. By
aggregating the normalized values into the ILEP index, using the ANP weights, the
best-performing scenario is selected for each item group. Finally, an inventory policy
matrix is proposed.
Figure 5-23. Boxplot of order size as a guide to determine decision parameters.

CHAPTER 5
142
Tab
le 5
-11
. O
ver
vie
w o
f d
iffe
ren
t sc
enar
ios.
Scen
ario
G
ro
up
A
Gro
up
B
Gro
up
C
Gro
up
D
Cen
tra
l D
ecen
tra
l
Cen
tra
l D
ecen
tra
l C
en
tra
l D
ecen
tra
l C
en
tra
l D
ecen
tra
l
1
(As-
Is)
S,s
G
ut
feeli
ng
2
S
1.2
∗𝐷
𝑝
1.2
∗𝐷
𝑝
𝐷𝑚
𝑎𝑥
𝐷𝑝
1
.2∗
𝐷1
𝑞
𝐷𝑝
2
+𝐷
1𝑞
𝐷
𝑝
s
𝐷𝑝
𝐷
𝑝
0.9
∗𝐷
𝑚𝑎
𝑥
𝐷𝑝
−𝐷
𝑚𝑖𝑛
𝐷
𝑚𝑒
𝑑
𝐷𝑝
−𝐷
𝑚𝑖𝑛
1
1
3
S
1.1
∗𝐷
𝑝
1.1
∗𝐷
𝑝
𝐷𝑚
𝑎𝑥
𝐷𝑝
𝐷
𝑚𝑎
𝑥
𝐷𝑚
𝑎𝑥
/ /
s
0.9
∗𝐷
𝑝
0.9
∗𝐷
𝑝
𝐷1
𝑞
𝐷𝑝
−𝐷
𝑚𝑖𝑛
−1
𝐷𝑚
𝑒𝑑
𝐷
𝑚𝑒
𝑑
/ /

EMPIRICAL RESEARCH AT THE OPERATING THEATRE
143
Single-item inventory model
First, the outcome of a single-item inventory model is explained. One item from group
C is arbitrarily chosen and its inventory diagram is plotted in Figure 5-24, showing the
first 50 days of year 1. In the As-Is scenario, the maximum stock level equals the
reorder point (i.e. max = min), or in other words, every time an item is used an order
is placed. The diagram also clearly shows the weekly and daily review period for the
central and decentral (cluster F) inventory respectively. In the former stock, however,
incomplete refills (i.e. stock is not filled to the maximum level) occur due to demand
during the 2 days lead time. Further analysis shows sufficient safety stock or no stock-
outs in both storages, and thus a service level of 100% is achieved, which is higher
than the requested 95%. As the inventory parameters are mainly based on gut feeling,
the inventory tend to be overstocked as S typically exceeds the maximum peak
demand. Therefore, scenario 2 and 3 adapt the inventory parameters to the demand
characteristics, which can be read from the boxplot in Figure 5-23. The inventory
diagram for scenario 2 and 3 show decreased S and s values, though there are more
stock-outs in these scenarios. Table 5-12 provides further details on the differences
between the three scenarios.
It is clear that the two improvement scenarios outperform the As-Is situation in terms
of costs and productivity, whereas quality of care seems to decrease at first sight. First,
the yearly total cost decreases and is lowest in the risk-taking scenario 3. The lower
holding cost is due to decreasing the S and s values, which results in lower average
inventory levels. The low reorder point also causes the ordering cost to drop, as the
item will be ordered less frequently. Furthermore, the item cost decreases, however,
this saving should be carefully interpreted. Since there are more global stock-outs in
scenario 3 and backorders are not allowed, less items are ordered and thus the item
cost goes down. In reality, the item is substituted or an emergency order is placed. Due
to lack of data, it is not considered in this study. We assume to have constant item costs
for all scenarios with equal demand, and the item cost can thus be omitted in further
analysis. Second, inventory turnover is used as a productivity metric to streamline
inventory processes and improve logistics staff utilization. Since it represents the
period that an item is in stock, it is related to the average inventory level as can be seen
in the formula in Appendix C.

CHAPTER 5
144
Fig
ure
5-2
4.
Cen
tral
an
d d
ecen
tral
in
ven
tory
dia
gra
m f
or
single
ite
m.
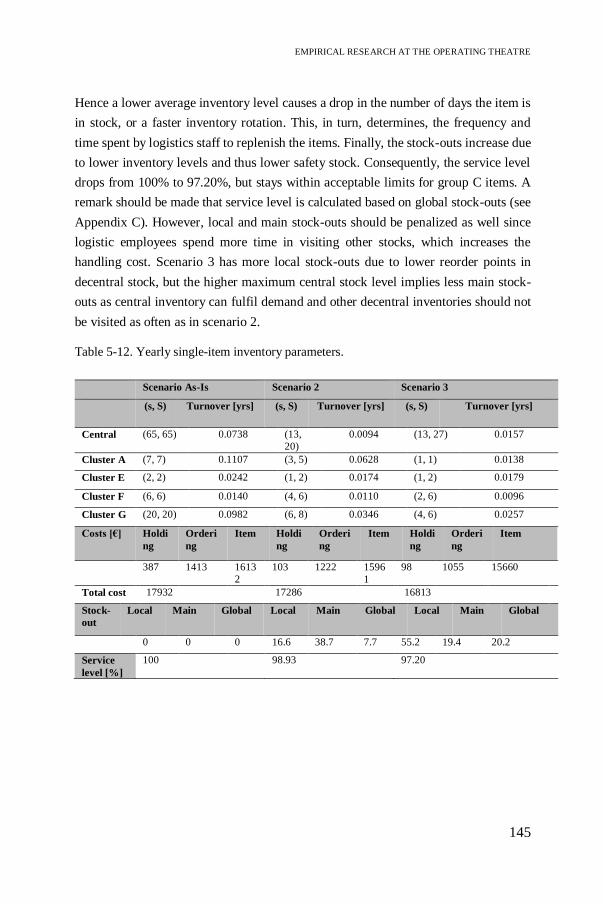
EMPIRICAL RESEARCH AT THE OPERATING THEATRE
145
Hence a lower average inventory level causes a drop in the number of days the item is
in stock, or a faster inventory rotation. This, in turn, determines, the frequency and
time spent by logistics staff to replenish the items. Finally, the stock-outs increase due
to lower inventory levels and thus lower safety stock. Consequently, the service level
drops from 100% to 97.20%, but stays within acceptable limits for group C items. A
remark should be made that service level is calculated based on global stock-outs (see
Appendix C). However, local and main stock-outs should be penalized as well since
logistic employees spend more time in visiting other stocks, which increases the
handling cost. Scenario 3 has more local stock-outs due to lower reorder points in
decentral stock, but the higher maximum central stock level implies less main stock-
outs as central inventory can fulfil demand and other decentral inventories should not
be visited as often as in scenario 2.
Table 5-12. Yearly single-item inventory parameters.
Scenario As-Is Scenario 2 Scenario 3
(s, S) Turnover [yrs] (s, S) Turnover [yrs] (s, S) Turnover [yrs]
Central (65, 65) 0.0738 (13,
20)
0.0094 (13, 27) 0.0157
Cluster A (7, 7) 0.1107 (3, 5) 0.0628 (1, 1) 0.0138
Cluster E (2, 2) 0.0242 (1, 2) 0.0174 (1, 2) 0.0179
Cluster F (6, 6) 0.0140 (4, 6) 0.0110 (2, 6) 0.0096
Cluster G (20, 20) 0.0982 (6, 8) 0.0346 (4, 6) 0.0257
Costs [€] Holdi
ng
Orderi
ng
Item Holdi
ng
Orderi
ng
Item Holdi
ng
Orderi
ng
Item
387 1413 1613
2
103 1222 1596
1
98 1055 15660
Total cost 17932 17286 16813
Stock-
out
Local Main Global Local Main Global Local Main Global
0 0 0 16.6 38.7 7.7 55.2 19.4 20.2
Service
level [%]
100 98.93 97.20

CHAPTER 5
146
Multi-item inventory policy per classification group
The simulation model has run for ten items in each classification group and the relevant
KPIs are computed. For each KPI, the simulation output is normalized using the As-Is
scenario as a baseline. The lower the KPI value, the better. The ILEP index is obtained
by calculating the weighted sum of all normalized KPI values using the ANP weights.
The best scenario is identified as the one with the highest ILEP index.
Items in category A are mostly critical items due to lack of substitutes or high surgical
impact, whereas the average unit cost and yearly demand vary between cheap and
expensive items and fast and slow movers respectively. Table 5-13 presents the annual
average values of ten items for three KPIs. The service level is specified to be 99.7%
for this category, which is based solely on global stock-outs. However, only
considering global stock-outs results in higher service levels, and thus rewards
overstocking. Therefore, the service level-1 in Equation 5.6 is determined based on
local and main stock-outs, replacing the formula in Appendix C. Still, service level-1
is defined as the percentage of demand that can be fulfilled in time, though Equation
4.6 takes the inverse to ensure that lower KPI values in the framework represent higher
service levels. For example, due to the high amount of safety stock in the risk averse
scenario 2, no stock-outs are observed resulting in a value of 1 or 100% and a
normalized value of 98.85, whereas scenario 3 has a service level value of 1.01 (or
98.81%) based on local and main stock-outs, reflecting the higher normalized value
100.12 in Table 5-13 and Equation 5.6:
𝑆𝑒𝑟𝑣𝑖𝑐𝑒 𝑙𝑒𝑣𝑒𝑙−1 = ( 𝑑𝑒𝑚𝑎𝑛𝑑 − (𝑙𝑜𝑐𝑎𝑙 + 𝑚𝑎𝑖𝑛 𝑠𝑡𝑜𝑐𝑘𝑜𝑢𝑡)
𝑑𝑒𝑚𝑎𝑛𝑑)
−1
= 1.01 (5.6)
From a cost perspective, savings of approximately 28% and 37% are generated in
scenario 2 and 3 respectively. Further analysis shows that the order cost is the main
contributor as reorder point is below the maximum stock level and thus orders are
placed less frequently compared to the As-Is situation. As most items are cheap, the
impact of lowering the inventory parameters is limited for the holding cost. Finally,
inventory turnover is halved, or in other words, items rotate 50% faster compared to
the As-Is, where items are overstocked and thus stay longer in stock. A weighted
combination of the normalized KPI values gives the ILEP index for this classification
group. Although the service level in scenario 3 is lowest, it performs better than the
other scenarios. However, the logistics manager should always consider the trade-off

EMPIRICAL RESEARCH AT THE OPERATING THEATRE
147
between multiple inventory objectives when choosing an appropriate policy. Making
decisions based on a single score may be misleading.
Table 5-13. KPI scores for classification group A.
KPI As-Is Scenario
2
Scenario
3
Normalized values
(weights) As-
Is
Scenario
2
Scenario
3
Service
level
1.01 1.00 1.01 (0.66) 100 98.85 100.12
Cost [€] 10441.84 7513.07 6544.50 (0.07) 100 71.95 62.68
Turnover
[yrs]
0.25 0.12 0.11 (0.27) 100 48.00 44.00
ILEP index 0 16.88 17.88
A similar analysis is performed for categories B, C and D. Category B contains mainly
expensive items and normal to fast movers. Remarkably, the As-Is scenario has a
service level far below the target of 98% for four out of ten items due to a large amount
of global stock-outs. However, this is not visible in the KPI value, since this calculation
only takes into account local and main stock-outs (see Equation 5.6). Although Table
5-14 provides a distorted overview, scenario 2 and 3 perform still better than the As-
Is. Scenario 2 saves 4% in costs, while these savings go up to 18% in scenario 3. The
savings will be even larger, since the holding cost is underestimated in the As-Is
scenario due to understocking. As category B contains mainly expensive items, the
holding cost has a significant impact on the total cost savings. Finally, items stay on
average seven days longer in stock in the As-Is scenario. Again, this is an
underestimation due to lack of safety stock.
Table 5-14. KPI scores for classification group B.
KPI As-Is Scenario
2
Scenario
3
Normalized values
(weights) As-
Is
Scenario
2
Scenario
3
Service
level
1.04 1.01 1.02 (0.66) 100 97.11 98.30
Cost [€] 17273.26 16611.63 14205.47 (0.07) 100 96.17 82.24
Turnover
[yrs]
0.08 0.05 0.05 (0.27) 100 62.50 62.50
ILEP index 0 12.37 12.61

CHAPTER 5
148
Less critical items are assigned to category C. In general, these items are cheaper and
have high demand. The target service level is 95%, however, Table 5-15 shows that
the As-Is scenario reaches a service level of almost 100%. Scenario 2 and 3 tackle the
overstocking problem by lowering maximum stock levels and as a results have more
local and main stock-outs. This also leads to a turnover drop from 44 days to 8 days
and cost savings of up to 40% in scenario 3. Based on the total KPI score, scenario 2
performs best, so the cost savings in scenario 3 are not compensated by the difference
in service level, as is the case for category A and B.
Table 5-15. KPI scores for classification group C.
KPI As-Is Scenario
2
Scenario
3
Normalized values
(weights) As-
Is
Scenario
2
Scenario
3
Service
level
1.00 1.04 1.10 (0.66) 100 104.34 110.38
Cost [€] 9799.18 7076.37 5908.07 (0.07) 100 72.21 60.29
Turnover
[yrs]
0.17 0.04 0.03 (0.27) 100 23.53 17.65
ILEP index 0 19.99 18.50
Finally, classification group D contains slow-moving items and the service level to
achieve is 90%. However, because demand is low, one improvement scenario is
simulated. The general policy for slow-movers is to reorder an item if it is used. Local
and main stock-outs increase compared to the nearly 100% service level in the As-Is
scenario. Cost savings are around 38% due to lower stock levels and less frequent
replenishment orders, and inventory turnover drops from 48 days to 16 days in stock.
Summarizing the results in Table 5-16 shows that scenario 2 outperforms the As-Is,
despite the higher number of stock-outs.
Table 5-16. KPI scores for classification group D.
KPI As-Is Scenario 2 Normalized values
(weights) As-Is Scenario 2
Service level 1.00 1.09 (0.66) 100 109.35
Cost [€] 4832.16 2981.70 (0.07) 100 61.71
Turnover
[yrs]
0.18 0.06 (0.27) 100 33.33
ILEP index 0 14.80

EMPIRICAL RESEARCH AT THE OPERATING THEATRE
149
5.2.3.5 Discussion
The hybrid ANP-DES tool acts as a decision-support tool to select the most appropriate
inventory policy at the operating theatre by evaluating the ILEP index, which gives a
more holistic overview of internal inventory control. In general, the two improvement
scenarios outperform the As-Is situation in terms of costs and productivity. Although
quality is slightly lower for class A, C and D, the service levels remain in the requested
range. The current situation exists of a two-bin system, in which inventory parameters
are set based on intuition to fulfil demand for the longest possible weekend. Moreover,
all items are treated in the same way, regardless of their criticality, which results in a
100% service level for most items. However, no consistency can be found in the
current policy, or in other words, some items are in understock while others are
overstocked.
In scenario 2 and 3, the inventory parameters are adapted based on the item
classification attributes. Scenario 2 is more risk averse compared to scenario 3, which
contains less safety stock. Overall, scenario 3 has a positive effect on the financial and
productivity factor, but a negative effect on service level. Due to ANP weighting
factors, the cost saving cannot always compensate for lower service levels, which
emphasizes the main trade-off between cost and quality in healthcare. In classification
group A and B, an inventory policy as proposed in scenario 3 performs best. Stock-
outs are limited due to the high service level target. As a result, the additional cost
saving and productivity gain in scenario 3 due to reduced safety stock have more
impact on the ILEP index, and thus compensate for the stock-outs. On the other hand,
the lower requested service levels in category C and D allow for more stock-outs
compared to the As-Is, so the negative effect on service level grows in scenarios 2 and
3. Scenario 2 performs best, where more items are held in decentral storage room and
less items in central storage compared to scenario 3. For these classification groups,
the cost saving by decreasing safety stock in scenario 3 does not compensate for the
difference in service level. In Table 5-17, we propose an inventory policy matrix
depending on item classification groups. If for ten items with different characteristics
acceptable service levels can be obtained, we assume that a policy can be generalized
for the whole classification group. However, making decisions based on a single ILEP
index may be misleading. Therefore, the logistics manager should always consider the
trade-off between multiple criteria when choosing an appropriate inventory policy.

CHAPTER 5
150
Table 5-17. Inventory policy matrix.
A B C D
As-Is policy
Risk averse policy 2 X X
Risk taking policy 3 X X
Some remarks can be made regarding the simulated inventory policies and the
performance framework using the KPIs. Service level is the main contributor when
determining the score for each scenario, as it has the highest weight in Table 5-9.
Although the main intention is to find policies that meet the service levels based on the
global stock-outs, only the local and main stock-outs are included when calculating the
service levels. Using a service level based on global stock-outs, as shown in Table
5-12, results in a service level of 100% for the As-Is scenario due to holding excessive
safety stocks. As a consequence, scenarios with lower service levels are penalized,
though they are within the acceptable range as required for their classification group.
Therefore, global stock-outs are left out of the service level calculation in Equation 5.6
in order to not reward overstocking. Moreover, in case of local or main stock-outs,
valuable time is wasted to obtain any stock-out items, potentially disrupting patient
care (Rosales et al. 2015), whereas the wage cost of a global stock-out is limited as no
extra actions are needed. In the future, a study can be executed to calculate a
penalization cost for a local and main stock-out and consider service level as a
constraint. In addition, the need for this high weighting factor for service level is
questionable for less critical items. Reconsidering the weights for different
classification groups may have an impact on the ILEP index to select the appropriate
inventory policy, as other criteria will get more influence. Next, another policy not
considered in this work relates to group C and D. As the majority of the items are
cheap, holding costs are negligible and order costs can be reduced even more by
increasing the gap between the maximum stock level and reorder point. As a result,
inventory rotation will increase (i.e. items are longer in stock) and service levels are
higher. However, one should remark that other restrictions, such as expiry date or
limited storage space, also influence the inventory level. Furthermore, review period
is also a potential decision variable, but changing this parameter is equivalent to
lowering the reorder point, since no costs are charged for manually counting the
inventory and not ordering any items.

EMPIRICAL RESEARCH AT THE OPERATING THEATRE
151
Furthermore, the inventory model also allows to analyse the impact of decentralization
as a key dimension when designing a distribution network (Abdul-Jalbar et al. 2003;
Bélanger et al. 2018). In this stockless case, the central inventory is eliminated and the
external suppliers deliver directly to decentral storages that are closer to point-of-use.
This behaviour can be imitated by increasing the inventory level to a very high amount
and a reorder point of one, so that the central inventory acts as an external supplier.
The simulation results of decentralization for an expensive item show a large decrease
in holding costs compared to the above mentioned scenarios, due to elimination of the
central stock. However, the savings in holding cost will be less noticeable for cheap
items. The order costs, on the other hand, increase since the external order cost plus a
cost for the scanning process and internal logistics problems is charged every time an
order is placed. Moreover, the replenishment lead time could be problematic,
especially for critical items. From the simulation, we can conclude that optimizing
inventory parameters for the As-Is scenario results in a better policy. This outcome
reinforces the hospital’s past decision to not implement decentralization.
Finally, due to assumptions and simplifications made in the simulation model, there
are some limitations. A trade-off should be made between computational effort, model
complexity and time spent modelling. From the organisational perspective, we assume
only one inventory per cluster. However, one cluster exists of four operating rooms
with their own stock. The obtained inventory parameters therefore apply to four
stocking locations in the cluster, and still need to be separated to individual operating
rooms. Moreover, the available data only contains daily consumption. We assume no
demand during replenishment lead time in decentral stock, though in reality demand
occurs at several times during a day. Also, no data is available on surgical case carts
which are prepared in the central storage. The same policies can be applied, however,
the maximum stock levels and reorder points need to be reconsidered (i.e. upscale).
Finally, information sharing between echelons is very inefficient. If a shortage occurs
at the central storage, no signal is made to the decentral stock. When checking the
decentral stock, a replenishment order is placed, even if the item is out-of-stock in the
central storage room. As a consequence, an order cost is charged multiple times for
placing the same order without replenishing the items. Since no information is
available on the fulfilment of replenishments, the same order cost is applied. However,
the time spent replenishing will be lower in case of a central stock-out. Further research
could conduct a time study to consider a broader management cost perspective.
Furthermore, hospitals could change to continuous review policies by investing in

CHAPTER 5
152
technology such as RFID to reduce inventory cost and increase inventory visibility
(Rosales et al. 2015). Kochan et al. (2018) propose cloud-based hospital supply chains
to enhance collaborative information-sharing in a multi-echelon inventory system with
improved inventory visibility and increased supply chain responsiveness.
5.2.4 Evaluating replenishment systems for disposable supplies at
the operating theatre – A case study
From a distribution perspective, coordination of the resources, effective delivery
strategies and efficiently managing healthcare delivery services are a necessity to
provide high-quality patient care (Rohleder, Cooke, et al. 2013). Implementing
effective internal distribution systems require determining optimal replenishment
policies to minimize stock-outs at the OT. Increasing the efficiency of replenishment
activities allows for significant cost savings, while improving staff satisfaction and
satisfying service level requirements. In this case study, the hybrid ANP-DES tool is
customized to assess internal OT replenishment policies at decentral stocking
locations. The goal is to measure performance of three replenishment policies in the
OT to identify efficiency targets.
5.2.4.1 Methodology
Currently, a periodic review replenishment policy is used with a fixed stocking limit,
based on gut feeling. However, stock-outs, imperfect order fulfilment, stock
duplication on replenishment carts, non-standardized processes and ergonomic burden
for logistics staff are typical problems. With this study, we aim to improve the
efficiency of the internal replenishment process at OT, focusing at the flow of
disposable supplies (e.g. surgical drapes, gloves, syringes). Figure 5-25 shows the
study design. The decentral storage locations represent the final link in the internal
supply chain before consumption during surgery. Different replenishment policies are
investigated to move materials from the central storage room to the decentral stock.

EMPIRICAL RESEARCH AT THE OPERATING THEATRE
153
Scenario analysis
Three scenarios, representing alternative replenishment systems for disposable
supplies, are introduced. In the As-Is scenario, the decentral stock is replenished using
copy carts from the central stock (see Figure 5-25). These carts contain a duplicate of
all disposables stored in decentral stock, meaning that the carts are a permanent double
stock. The great amount of items on these carts cause heavily loaded carts, which
increases ergonomic burden for logistics staff. Furthermore, all information exchange
is paper-based and no record is made of what has been consumed. This complicates
effective inventory control, requiring consumption data of each surgery. The As-Is
scenario serves as the baseline scenario throughout the rest of this study. The
alternative scenarios represent two potential logistics improvements, both featuring
barcode scanners. The Standard scenario eliminates the copy carts to reduce the
amount of stock in circulation. Barcode scanners are introduced to scan decentral stock
(see Figure 5-25). Based on the scanning data, the requested items are picked in central
stock to replenish decentral stock. Moreover, scanning enables collecting daily
consumption data in operating rooms, which is essential for inventory optimization as
suggested in Section 5.2.3. A disadvantage of this scenario, however, is that decentral
locations are not immediately restocked, resulting in more visits and higher incomplete
refills (i.e. location cannot be refilled to the stocking limit). This drawback is countered
by the Copy carts scenario, which features both barcode scanners and copy carts. Three
copy carts, for each relay cabin (see Figure 5-5), are used to immediately replenish
decentral stock. The copy carts hold a selection of commonly used items to avoid
heavily loaded double carts. In addition, scanning enables daily consumption data on
the copy cart level. Table 5-18 gives an overview of the replenishment scenarios.
Figure 5-25. Internal replenishment process at operating theatre.
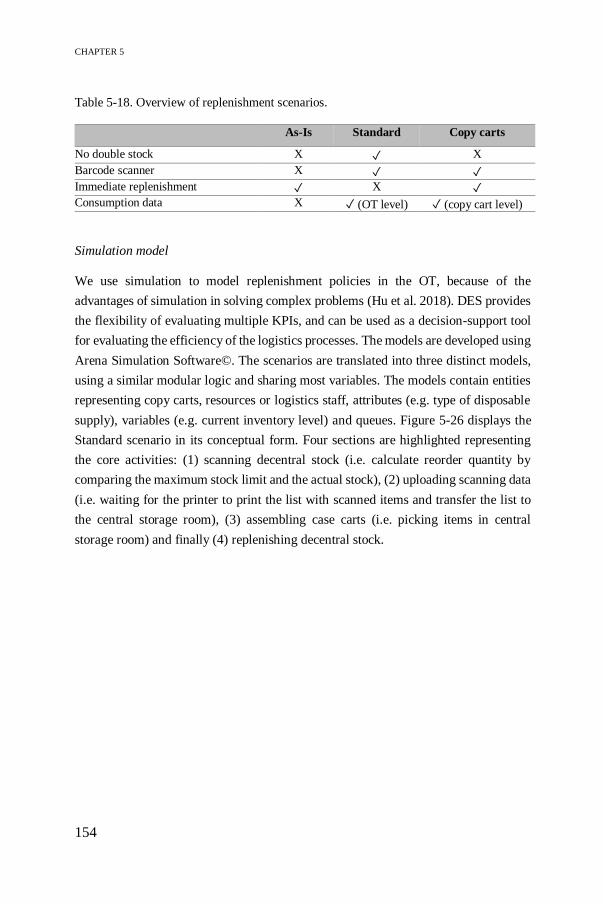
CHAPTER 5
154
Table 5-18. Overview of replenishment scenarios.
As-Is Standard Copy carts
No double stock X ✓ X
Barcode scanner X ✓ ✓
Immediate replenishment ✓ X ✓
Consumption data X ✓ (OT level) ✓ (copy cart level)
Simulation model
We use simulation to model replenishment policies in the OT, because of the
advantages of simulation in solving complex problems (Hu et al. 2018). DES provides
the flexibility of evaluating multiple KPIs, and can be used as a decision-support tool
for evaluating the efficiency of the logistics processes. The models are developed using
Arena Simulation Software©. The scenarios are translated into three distinct models,
using a similar modular logic and sharing most variables. The models contain entities
representing copy carts, resources or logistics staff, attributes (e.g. type of disposable
supply), variables (e.g. current inventory level) and queues. Figure 5-26 displays the
Standard scenario in its conceptual form. Four sections are highlighted representing
the core activities: (1) scanning decentral stock (i.e. calculate reorder quantity by
comparing the maximum stock limit and the actual stock), (2) uploading scanning data
(i.e. waiting for the printer to print the list with scanned items and transfer the list to
the central storage room), (3) assembling case carts (i.e. picking items in central
storage room) and finally (4) replenishing decentral stock.
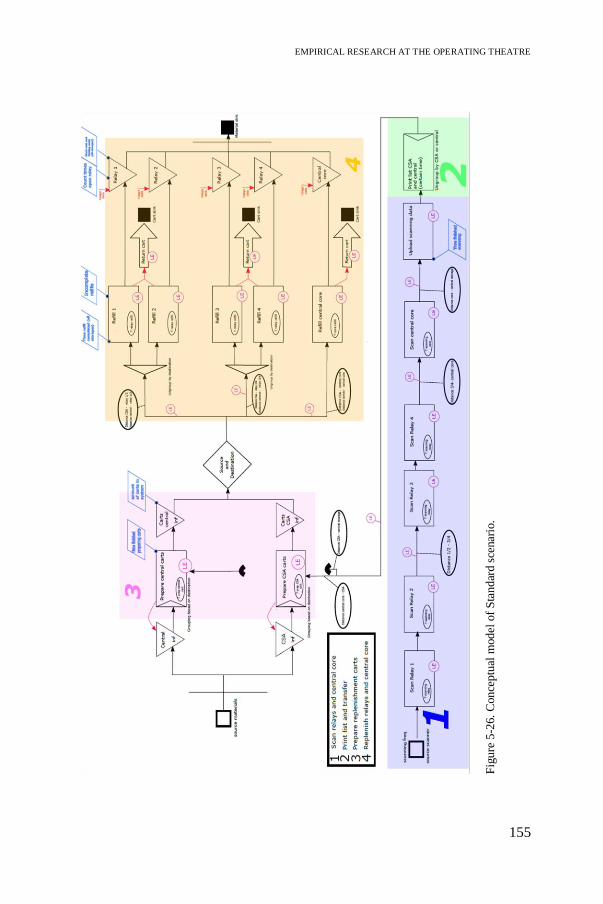
EMPIRICAL RESEARCH AT THE OPERATING THEATRE
155
Fig
ure
5-2
6.
Conce
ptu
al m
odel
of
Sta
nd
ard s
cenar
io.

CHAPTER 5
156
Data collection
The simulation model requires two types of data. During a ten-day observation period,
a time study is performed on replenishment jobs (e.g. scanning, picking and
replenishing times). Due to the stochastic nature of these process times related to
human-performed tasks, the time data fit statistical distributions (e.g. Beta
distribution). The second type of data deals with daily item usage of decentral stock.
The introduction of barcode scanners allows collecting data over one year (August
2017 – July 2018). In total, 264 disposable SKUs stored at 454 locations in one OT
cluster are included in the simulation study. A Poisson distribution is fit to the data,
expressing the probability of items consumed in one day.
Verification and validation
Attention must be paid to verification and validation, ensuring that the model performs
as intended to the modelling assumptions and behaves the same as the real system,
respectively (Sargent 2013). Due to lack of accurate logistics data, we focus on best
judgment of the expert to explore the model as thoroughly as possible. First, adding
animation, by showing the (de)central storage rooms, logistics staff, copy carts and a
clock, facilitates communication with various stakeholders, increases confidence in the
simulation results and thus enhances commitment and impact. Second, graphical
visualizations aid in monitoring the values of various performance indicators, such as
stock-outs, incomplete refills and items in stock per item per storage room (see Figure
5-27). Finally, task completion times and workload distribution are validated by
comparing them to the real system. The OT logistics manager is knowledgeable about
the direction of the output behaviour and knows the acceptable range of the value
magnitudes. Graphs are commonly used to check for operational validity when
statistical assumptions cannot be satisfied or when there are insufficient data. Based
on these graphs, the model developer and system expert decide the model accuracy is
within its acceptable range for its intended purpose, namely evaluating three
replenishment scenarios to identify the best-performing one.

EMPIRICAL RESEARCH AT THE OPERATING THEATRE
157
5.2.4.2 Results
The computer models are used to assess three replenishment policies in order to realize
efficiency opportunities. The simulation output provides a score for the performance
indicators, which is normalized across all scenarios using the As-Is scenario as a
baseline. All of the indicators are measured such that a lower score represents a better
outcome. By aggregating the normalized values into a single score for each objective
using the ANP-based prototype, the best-performing scenario is selected on the level
of one objective for which it holds that the lowest total objective score is better. More
information on how the KPIs are computed can be found in Appendix D. Table 5-19
shows the values for these KPIs in each scenario as well as the ILEP index to select
the appropriate policy, which integrates the four efficiency dimensions of quality, time,
financial and productivity. In contrast to the performance indicators, the best scenario
is selected as the one with the highest ILEP index.
Figure 5-27. Simulation output visualizing items in stock, incomplete refills and stock-
outs for item FA366823 in one operating room of cluster D.

CHAPTER 5
158
Table 5-19. KPI scores and ANP weights.
The Standard scenario provides the best quality, due to the high weight attributed to
the distribution service level. Distribution service level allows to monitor the urgent
delivery rate and the additional items needed, and thus is a critical KPI to reduce the
number of stock-outs. Furthermore, delivery accuracy is performing badly in the As-
Is scenario due to the time gap between making picking lists and replenishing stock,
which causes incomplete refills. The Copy carts scenario eliminates this time gap by
immediately restocking decentral locations and thus improving the delivery accuracy
by guaranteeing a maximal order fulfilment. Finally, the impact of centralization is
investigated to free up space for primary patient care services in the OT by reducing
parallel material flows to decentral stocking locations. The Standard scenario
eliminates copy carts which need additional replenishment as a permanent double
stock and also benefits from reducing decentral stocking limits.
Metric/Scenario
Standard Copy
carts
As-Is Normalized values
Standard Copy
carts
As-Is
Quality (0.32) Distribution service level
(0.136)
12.86 16.04 13.32 96.99 115.30 100
Delivery accuracy
(0.092)
78.67 35.33 139.69 56.32 25.29 100
Centralization (0.091) 5963.31 8836.84 7480.47 39.88 109.07 100
Total Quality Score 68.97 87.57 100
Time (0.15) Replenishment lead time
(0.057)
219.53 202.21 373.46 58.87 54.24 100
Response time (0.053) 11h41 11h29 14h13 80.74 79.89 100
Clinical staff
involvement (0.036)
171.42 197.14 105.11 163.09 187.57 100
Total Time Score 92.51 96.43 100
Financial (0.06) Inventory cost 2798.05 3907.12 3416.97 81.89 114.34 100
Total Financial Score 81.89 114.34 100
Productivity/
Organisation
(0.48)
Delivery frequency
(0.121)
307.89 279.03 293.67 83.73 49.80 100
Standardization (0.16) 291 291 291 100 100 100
Personnel management
(0.121)
0.46 0.42 1.78 25.79 23.76 100
Total productivity
Score
72.77 61.94 100
ILEP index 24.21 20.92 0

EMPIRICAL RESEARCH AT THE OPERATING THEATRE
159
In addition, the model keeps track of the time required to perform replenishment
activities by logistics staff. The time-related KPIs in Table 5-19 indicate the best (i.e.
lowest) score for the Standard scenario. However, the results should be carefully
interpreted. All items are delivered on time (i.e. before the end of the day), with the
As-Is scenario having the latest response time at 14h13. Both the response time and
the replenishment lead time are considerably higher in the As-Is scenario due to
discontinuities in the replenishment process. These interruptions are mainly caused by
the involvement of CSA employees, who are not included in the study. Although the
time CSA employees are working adds to the replenishment lead time in the As-Is
scenario, it does not apply for clinical staff involvement since it only considers OT
employees. This also explains the low value for clinical staff involvement, whereas the
Standard and Copy carts scenarios only use OT employees to perform replenishing
activities.
From a financial perspective, an important indicator for assessing replenishment
policies is the inventory holding cost. Table 5-19 shows a 20% reduction in holding
cost in the Standard scenario, whereas the Copy carts scenario incurs a 15% increase.
The lower holding cost in the former scenario is a result of eliminating copy carts,
which carry permanent double stock. The Copy carts scenario, on the other hand,
requires a careful selection of items to be held on the copy cart in order to reduce
holding costs. In future work, inventory on copy carts must be optimized in
collaboration with the nursing staff. Although costs are an important indicator to
evaluate replenishment policies, the financial factor has the least impact (0.06) on the
overall performance.
Furthermore, productivity and organisational KPIs aid in streamlining processes,
facilitating information flows and improving staff satisfaction. Delivery frequency
determines productivity by the number of item locations that need replenishment and
the visits to decentral locations. In all scenarios, an average of 40% of decentral item
locations are daily replenished, though these items are classified as fast-movers when
they are justified to be held in stock close to the operating room. On the other hand,
the Copy carts scenario improves productivity most because employees visit the
decentral stocking locations only once for immediate replenishment. Furthermore, a
recent trend in healthcare management stimulates process standardization to simplify
workflows and create uniform replenishment practices throughout the OT.
Standardization is measured by the number of items that could be scanned for
replenishment, and is thus equal for all scenarios. The scanning data provides accurate
CHAPTER 5
160
consumption details which can be used during product selection negotiations between
different stakeholder to foster standardization and thus decreasing product variety,
reducing costs and facilitating inventory control.
Finally, the ILEP index is developed by converting the scores of the four KPIs into a
single score using ANP priorities, demonstrating the Internal Logistics Efficiency
Performance for each scenario. This index provides an objective evaluation basis for
logistics managers to identify the best strategy for managing internal healthcare
logistics processes. The higher this index, the better the performance of the process.
The ILEP index is added to Table 5-19. Overall, we observe that the Standard scenario
provides the best service quality at the lowest cost, although it is slightly more
demanding for logistics staff compared to the Copy carts scenario. Hence, the logistics
manager should always consider the trade-off between multiple criteria when choosing
an appropriate replenishment policy.
5.2.4.3 Discussion
The hybrid tool, combining the simulation and ANP model, supports decision making
when selecting the most appropriate scenario for organising the internal OT
replenishment process. The identified KPIs serve as a guideline for monitoring the
performance of internal healthcare logistics processes. Both the Standard and Copy
carts scenarios demonstrate better performance in terms of quality, time and
productivity/organisation compared to the As-Is scenario. From a financial
perspective, the Standard scenario is preferred due to lower inventory holding costs.
When analysing the findings of this case study, some limitations must be considered.
One limitation is related to the sample size of the ANP application. This work presents
preliminary results of a healthcare logistics performance management framework as
only one stakeholder is included, namely the OT logistics manager expressed his
preferences for KPIs. Second, the accuracy of the data used in the simulation model
must be critically assessed. The input data contain 264 of 404 (65%) unique SKUs
stored at 454 of 743 (61%) supply locations in decentral stock, representing 98% of
total items ordered. The remaining items are excluded due to limited scanning data for
various reasons, such as scanning problems, new items, backorders or IT-related
problems. For inventory optimization purposes, accurate data is essential to determine
appropriate stock limits and reorder points in order to minimize costs and maximize
service levels. Despite these limitations, this case study provides insights on the impact
EMPIRICAL RESEARCH AT THE OPERATING THEATRE
161
of three replenishment scenarios on the workflow, quality and costs of the operating
theatre.
In further research, the simulation model can be extended by including other clusters,
thereby improving the scalability of the findings. The ILEP index for one cluster shows
a 24% improvement for the Standard scenario compared to the As-Is situation.
Extension to all clusters will reveal even better results due to standardization
opportunities for obtaining a uniform replenishment process throughout the entire OT.
In addition, the methodology can be customized to various healthcare logistics
problems using the ILEP index as an objective evaluation basis for assessing
improvement scenarios. Hospitals using a performance management framework have
a competitive advantage. The corresponding ILEP index enables hospitals to control
their supply chain strategy, implement continuous improvement programs and
improve decision making by focusing on relevant KPIs (Maestrini et al. 2017).
5.2.5 Evaluating case cart distribution systems in the operating
theatre – A case study
With the OT being one of the most patient- and supply-critical departments in a
hospital, the significance of adopting efficient logistics supporting services must be
emphasized. Delays in surgical procedures due to missing or erroneous medical
supplies can endanger patients’ lives. By simulating the logistics flow and analysing
multiple scenarios, we show that our ANP-based prototype is a powerful decision-
support framework for a hospital environment to determine efficiency gain
opportunities. In this case study, two main aspects of the surgical case cart distribution
system are assessed, namely the logistics flow of case carts and picking paths within a
storage room. Current practice relies on experience and intuition of logistics staff to
pick the right items and visit the different storage locations, which often leads to extra
travelling times and distances. In the logistics flow, standardization efforts are
analysed by focusing on employee workload in order to increase staff flexibility and
implement uniform distribution practices. The impact of standardization is further
investigated by modelling the workflow within a storage room to identify optimal
picking path strategies. In addition, two central storages are combined to examine the
impact of centralization on the distribution process. The overall objective is to
determine potential efficiency gains in the organisation of the logistics process for
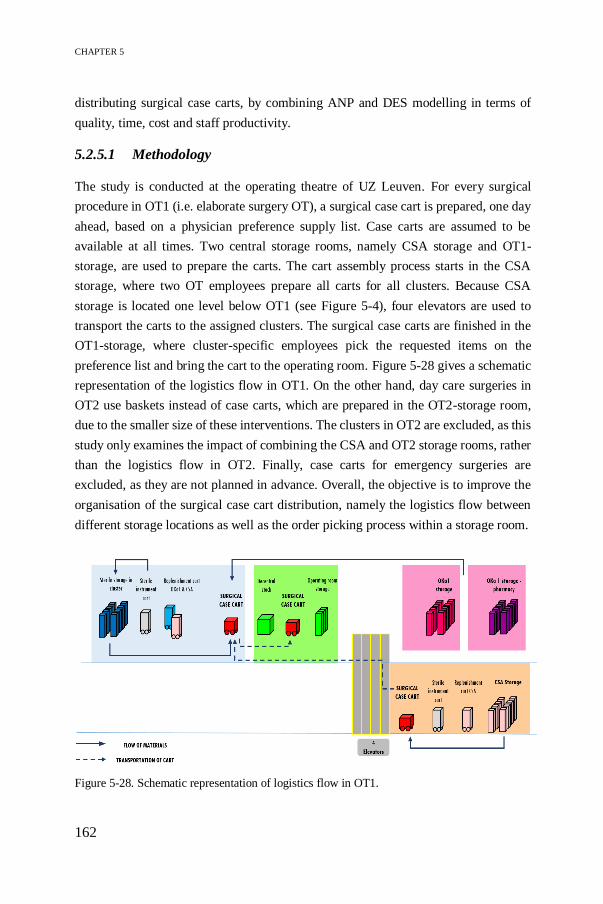
CHAPTER 5
162
distributing surgical case carts, by combining ANP and DES modelling in terms of
quality, time, cost and staff productivity.
5.2.5.1 Methodology
The study is conducted at the operating theatre of UZ Leuven. For every surgical
procedure in OT1 (i.e. elaborate surgery OT), a surgical case cart is prepared, one day
ahead, based on a physician preference supply list. Case carts are assumed to be
available at all times. Two central storage rooms, namely CSA storage and OT1-
storage, are used to prepare the carts. The cart assembly process starts in the CSA
storage, where two OT employees prepare all carts for all clusters. Because CSA
storage is located one level below OT1 (see Figure 5-4), four elevators are used to
transport the carts to the assigned clusters. The surgical case carts are finished in the
OT1-storage, where cluster-specific employees pick the requested items on the
preference list and bring the cart to the operating room. Figure 5-28 gives a schematic
representation of the logistics flow in OT1. On the other hand, day care surgeries in
OT2 use baskets instead of case carts, which are prepared in the OT2-storage room,
due to the smaller size of these interventions. The clusters in OT2 are excluded, as this
study only examines the impact of combining the CSA and OT2 storage rooms, rather
than the logistics flow in OT2. Finally, case carts for emergency surgeries are
excluded, as they are not planned in advance. Overall, the objective is to improve the
organisation of the surgical case cart distribution, namely the logistics flow between
different storage locations as well as the order picking process within a storage room.
Figure 5-28. Schematic representation of logistics flow in OT1.

EMPIRICAL RESEARCH AT THE OPERATING THEATRE
163
Conceptual model
A conceptual model is established to better understand the problem and facilitate the
development of the computer model, without being specific to one software language.
The first challenge relates to improving the case cart flow between different storage
and point-of-care locations. Seven possible improvement scenarios are proposed by
changing three parameters. These input parameters reflect three improvement
strategies assessing the impact of standardization, centralization and elevator usage as
shown in Table 5-20. First, the impact of standardization is measured by creating more
uniform distribution practices in OT1-storage. Currently, two types of OT employees
are involved in the case cart distribution process. The general OT employees prepare
carts for all clusters in the CSA storage, whereas cluster-specific OT employees only
prepare carts for their cluster in the OT1-storage causing overcrowding in this small
stocking location. By increasing the number of general OT employees in the OT1-
storage, the distribution processes will become more standardized. Second, the impact
of centralization is analysed by combining the CSA and OT2-storage room to reduce
product duplication and free up space in the small OT2-storage. With this
centralization effort, the impact on the workload in the central CSA-storage must be
measured and a third general OT employee is added in this strategy. Finally, the
elevator is detected to be a bottleneck in the logistics flow. Time savings could be
achieved by changing the elevator usage. In the current situation, the elevator only
operates when all case carts are assembled in CSA storage. A new strategy suggests to
operate the elevator whenever the maximum number of case carts for the elevator is
reached. Table 5-20 provides all combinations of the three strategies for conducting
scenario analysis. Scenario 1 reflects the As-Is scenario without any efforts on
standardization, centralization or elevator usage.
Table 5-20. Overview of input parameters and scenarios.
Input/Scenario 1 2 3 4 5 6 7 8
Standardization X X X X
Centralization X X X X
Elevator usage X X X X

CHAPTER 5
164
The conceptual model ensures that the relevant KPIs are measured to evaluate the
impact of different organisations of the distribution system. However, measuring the
efficiency of the logistics flow is not straightforward in a healthcare context. In Chapter
4, a prototype is presented based on ANP, where multiple KPIs are identified for
monitoring distribution processes and the ILEP index is developed from the point of
view of the OT logistics manager. More details on the relevant KPIs can be found in
Table 5-21.
Table 5-21. Overview of KPIs.
Objective KPI Description Formula
Time [s] Average
waiting time
(for elevator)
Average time
that case cart
spends waiting,
without any
handling of
logistics staff
=𝑤𝑎𝑖𝑡𝑖𝑛𝑔 𝑡𝑖𝑚𝑒
𝑡𝑜𝑡𝑎𝑙 𝑎𝑚𝑜𝑢𝑛𝑡 𝑜𝑓 𝑐𝑎𝑟𝑡𝑠
Average time
to finish cart
Average time
needed to finish
all case carts
=𝑇𝑖𝑚𝑒 𝑛𝑒𝑒𝑑𝑒𝑑 𝑡𝑜 𝑓𝑖𝑛𝑖𝑠ℎ 𝑎𝑙𝑙 𝑐𝑎𝑟𝑡𝑠
𝑡𝑜𝑡𝑎𝑙 𝑎𝑚𝑜𝑢𝑛𝑡 𝑜𝑓 𝑐𝑎𝑟𝑡𝑠
Time to finish
in CSA/OT1
storage
Time that
employee needs
to finish daily
case cart task
= 𝑇𝑖𝑚𝑒 𝑓𝑖𝑛𝑎𝑙 𝑐𝑎𝑟𝑡 − 𝑆𝑡𝑎𝑟𝑡 𝑡𝑖𝑚𝑒
Financial [€] Personnel cost The cost to hire
the needed
employees,
regardless the
required time to
perform the task
= 𝑁𝑢𝑚𝑏𝑒𝑟 𝑜𝑓 𝑒𝑚𝑝𝑙𝑜𝑦𝑒𝑒𝑠∗ 𝑑𝑎𝑖𝑙𝑦 𝑤𝑎𝑔𝑒
Quality Centralization A qualitative
measure on how
centralized a
scenario is
{1 𝑖𝑓 𝐶𝑆𝐴 𝑎𝑛𝑑 𝑂𝑇2 𝑠𝑡𝑜𝑟𝑎𝑔𝑒 𝑐𝑜𝑚𝑏𝑖𝑛𝑒𝑑
0 𝑜𝑡ℎ𝑒𝑟𝑤𝑖𝑠𝑒
Risk of errors Indicator of the
risk that logistics
employees make
mistakes
=% 𝑡𝑖𝑚𝑒 𝑏𝑢𝑠𝑦 ∗ 𝑡𝑖𝑚𝑒 𝑤𝑜𝑟𝑘𝑖𝑛𝑔
𝑡𝑜𝑡𝑎𝑙 𝑡𝑖𝑚𝑒 𝑤𝑜𝑟𝑘𝑠ℎ𝑖𝑓𝑡
Productivity/
Organisation
Avg percentage
busy in OT1
storage
Percentage of
time that
logistics staff is
working
=𝑇𝑖𝑚𝑒 𝑤𝑜𝑟𝑘𝑖𝑛𝑔
𝑇𝑖𝑚𝑒 𝑡𝑜 𝑓𝑖𝑛𝑖𝑠ℎ 𝑖𝑛 𝑠𝑡𝑜𝑟𝑎𝑔𝑒
Standardization A qualitative
measure on how
standardized a
scenario is
{1 𝑖𝑓 𝑛𝑜 𝑐𝑙𝑢𝑠𝑡𝑒𝑟 𝑠𝑝𝑒𝑐𝑖𝑓𝑖𝑐 𝑒𝑚𝑝𝑙𝑜𝑦𝑒𝑒
0 𝑜𝑡ℎ𝑒𝑟𝑤𝑖𝑠𝑒

EMPIRICAL RESEARCH AT THE OPERATING THEATRE
165
Furthermore, the hospital is interested in tackling inefficient picking paths travelled by
logistics employees within storage rooms. Current picking practice is similar to the
Return strategy, as shown in Figure 5-2 (Horvat 2012), whereby the aisle with the
picking location is entered and left from the same baseline-aisle. In the hospital,
however, the travelled path depends largely on experience and intuition of logistics
staff, resulting in extra travelling distance and picking times. Other factors, such as
small aisles and illogical organisation of supplies in the shelves, also increase waste in
the picking process. In this case study, three models for picking path optimization in
the CSA storage are established. Although the high-level conceptual model is similar,
different routing strategies or algorithms are applied to sort the picking locations and
visualize the path. The models reflect two commonly used routing strategies, namely
the Return and S-shape strategy, and one routing algorithm that solves the well-known
Shortest Path Problem (SPP) and Traveling Salesman Problem (TSP) consecutively.
For each model, the picking location in the aisle, the walking speed and the picking
time are implemented as inputs in order to visualize a picking path. First the picking
locations (i.e. aisle and row) are extracted from the picking list and sorted in the right
order according to the respective strategy. The second step involves visualizing the
travelled path of the cart to the requested location. The overall objective is to minimize
travelling distances or time, resulting in a standardized or uniform picking path for
preparing case carts in the CSA storage. In addition, the impact of reassigning supplies
in the storage area is investigated. Currently, supplies are ordered in aisles according
to product families, such as custom procedure trays, anaesthesia materials, etc. as
represented by the different colours in Figure 5-30.
Finally, both problems are integrated by implementing the optimal picking path into
the logistics flow. The logistics flow model, however, makes abstraction of the picked
items. Instead, the model considers picking times based on the order quantity,
regardless of the type of medical supplies. By integrating the optimal picking path in
the logistics flow model, the picking time is more accurate, since it considers the exact
location of the requested supplies in the storage room. Potential opportunities for
efficiency gains are identified and recommendations are provided to the OT logistics
manager.

CHAPTER 5
166
Data requirements
Data from the UZ Leuven hospital is collected in the year 2018-2019. Two types of
data are required: number of items to be picked and time data. First, the average
number of items to be picked per case cart are identified from frequently used
physician preference supply lists in OT1. This data will be used as input in the logistics
flow model. From the supply list, the exact locations of the items can be derived as
input for the routing model. Second, an observation study is performed to estimate the
duration of certain tasks to complete the surgical case cart, such as picking time,
travelling time, waiting for elevator, etc. The average time per item is assumed to be
independently distributed among different employees or clusters. The logistics flow
model incorporates stochastic into the model by assuming a normal distribution of the
picking time in each cluster.
Computer model
In this section, the software-specific representation of the conceptual model is
described for both aspects of the surgical case cart distribution process. The first
challenge is modelled using a DES software package from Matlab (i.e. Simulink),
whereas the picking path is visualized using a systems engineering software, namely
LabVIEW.
In Simulink, different models representing different organisations of the logistics flow
are built, but they all share the same modular logic. The modular build-up increases
flexibility to adapt models by changing the input parameters and customize to different
hospital layouts. An overview of the As-Is model is given in Figure 5-29. The models
consist of entity generators, representing surgical case carts that will move through the
model. Every day, a random number between n=80 and n=100 carts are created.
Servers divide the carts over the clusters with equal probability (1/n). Every line in the
model represents the tasks performed in one cluster, which is similar to all clusters.
The orange rectangle represents queues in the model, which can be a waiting time
before picking starts at the CSA or OT1-storage or waiting time in front of the elevator.
The black box shows the picking process in the CSA storage. The function block,
circled in yellow, regulates the number of carts that queue in front of the elevator
(yellow rectangle). This parameter can be changed to analyse the impact of elevator
usage. The blue part represents the picking process at the OT1-storage and the
travelling times to the specific cluster. Note that the employees who work in the blue

EMPIRICAL RESEARCH AT THE OPERATING THEATRE
167
rectangle are cluster-specific employees, whereas the black rectangle seizes general
employees who work for all clusters in the CSA storage. The impact of standardization
is evaluated by changing the number of employees. Finally, the bottom line in Figure
5-29 represents the picking process for OT2. Only the OT2-storage is used to prepare
baskets for each surgical procedure, which explains the limited number of building
blocks. In scenario 2, 4, 6 and 8, the impact of centralization is evaluated by combining
OT2- and CSA storage to reduce product duplication. Although OT2 is located
elsewhere in the hospital, travelling times are not modelled.

CHAPTER 5
168
Fig
ure
5-2
9.
Over
vie
w o
f A
s-Is
sce
nar
io i
n S
imuli
nk.

EMPIRICAL RESEARCH AT THE OPERATING THEATRE
169
Second, a LabVIEW model is constructed for modelling the picking process within the
CSA storage room. The main advantage of this software is its graphical approach of
programming which facilitates picking path visualization. In the model, the items are
organised in aisles, scaled from the real-life storage area, and the travelled distances
are converted to actual distances. A walking speed of 3 km/h and a picking time of 10s
is estimated, regardless of the employees.
First, the Return strategy (see Figure 5-30) is modelled whereby the employee always
returns to the baseline aisle. The cart is parked in the baseline aisle due to space
restrictions in-between aisles. The picking locations are sorted such that the location
farthest from the baseline aisle is first reached. The distance array stores the distances
from the starting position to all possible locations. For each model, the total travelling
distance per picking list is calculated in meters.
In the second strategy, a picking path in the shape of an S is developed in order to solve
the problem that only one cart at a time can traverse an aisle in the storage room. As
can be observed in Figure 5-30, the carts follow one line while being transported along
the aisles. To formulate the S-Shape, the picking locations are sorted alternately from
lowest to highest or highest to lowest location. The total travelling distance is similar
for each cart, since the entire S-Shape need to be traversed.
Third, a routing algorithm is tested which implements both Dijkstra and Nearest
Neighbour algorithm, solving respectively the SPP and TSP problem. The Dijkstra
algorithm searches for the shortest distance between a current location and all other
locations that need to be visited, whereas the Nearest Neighbour algorithm selects the
nearest location starting from the current location and it requires that the cart starts and
ends the picking path at the same position. A two-dimensional distance array is
constructed to calculate every possible travelling distance between two locations. In
this scenario, the cart can be carried along the picking path or be placed in the baseline
aisle.
Figure 5-30. Difference between two routing strategies (Return and S-shape) and one routing
algorithm (right).
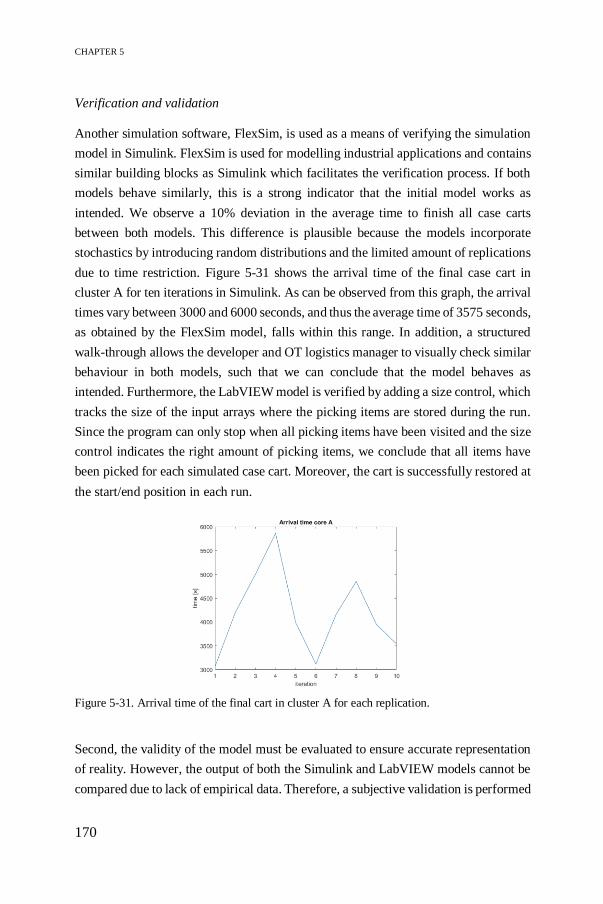
CHAPTER 5
170
Verification and validation
Another simulation software, FlexSim, is used as a means of verifying the simulation
model in Simulink. FlexSim is used for modelling industrial applications and contains
similar building blocks as Simulink which facilitates the verification process. If both
models behave similarly, this is a strong indicator that the initial model works as
intended. We observe a 10% deviation in the average time to finish all case carts
between both models. This difference is plausible because the models incorporate
stochastics by introducing random distributions and the limited amount of replications
due to time restriction. Figure 5-31 shows the arrival time of the final case cart in
cluster A for ten iterations in Simulink. As can be observed from this graph, the arrival
times vary between 3000 and 6000 seconds, and thus the average time of 3575 seconds,
as obtained by the FlexSim model, falls within this range. In addition, a structured
walk-through allows the developer and OT logistics manager to visually check similar
behaviour in both models, such that we can conclude that the model behaves as
intended. Furthermore, the LabVIEW model is verified by adding a size control, which
tracks the size of the input arrays where the picking items are stored during the run.
Since the program can only stop when all picking items have been visited and the size
control indicates the right amount of picking items, we conclude that all items have
been picked for each simulated case cart. Moreover, the cart is successfully restored at
the start/end position in each run.
Second, the validity of the model must be evaluated to ensure accurate representation
of reality. However, the output of both the Simulink and LabVIEW models cannot be
compared due to lack of empirical data. Therefore, a subjective validation is performed
Figure 5-31. Arrival time of the final cart in cluster A for each replication.

EMPIRICAL RESEARCH AT THE OPERATING THEATRE
171
where the OT logistics manager acts as the expert and confirms that the results of the
model are in line with his daily experience in the hospital.
5.2.5.2 Results
This section presents the results as obtained by the models in Simulink and LabVIEW
for the logistics flow and picking path problem respectively.
Logistics flow of surgical case carts
Three improvement strategies are formulated aimed at increasing efficiency in the OT
distribution process in terms of quality, time, cost and productivity. The strategies are
as follows: implementing standardized distribution practices, centralizing storage
rooms and improving elevator usage. The impact of the alternative improvement
strategies is measured by the simulation output, which provides a value for each KPI.
This value is normalized across all scenarios using the As-Is as a baseline, and a lower
score is better. The ANP weights as proposed in Chapter 4 are applied to define the
overall impact of the indicators on the logistics flow. They show that quality (0.32)
and productivity (0.48) are the most important objectives with the greatest contribution
to improving the internal distribution process in the OT. More details on the ANP
weights can be found in Appendix E. Finally, the most efficient scenario is chosen by
calculating the ILEP index, which is computed by multiplying the ANP weights with
the performance scores on the four efficiency dimensions. The higher the ILEP index,
the better the scenario. The results are obtained by running the simulation model ten
times, where one run represents an eight-hour work shift. Table 5-22 shows the
normalized data as obtained from the Simulink models. Note that the normalized
values for centralization and standardization are reversed, as a lower score is better. In
other words, a value of 1 represents no centralization or standardization effort.
Furthermore, a ninth scenario is added to this table. This scenario has the same inputs
as the baseline scenario, but the picking times are adapted to mimic the behaviour of
the enhanced picking path based on a routing algorithm as suggested in the LabVIEW
model. This scenario will be discussed more extensively in Section 5.2.5.3.

CHAPTER 5
172
Tab
le 5
-22. N
orm
aliz
ed K
PI
val
ues
ob
tain
ed f
rom
Sim
uli
nk o
utp
ut.
Met
ric/
Sce
na
rio
1
2
3
4
5
6
7
8
9
Qu
ali
ty (
0.3
2)
Ris
k o
f er
rors
(0.1
7)
1
1.1
88
0.8
13
1.1
25
1
1.1
88
0.9
38
1.0
63
1
Cen
tral
izat
ion (
0.1
7)
1
0
1
0
1
0
1
0
1
Tota
l Q
uali
ty K
PI
0.3
4
0.2
02
0.3
08
0.1
91
0.3
40
0.2
02
0.3
29
0.1
81
0.3
40
Tim
e
(0.1
5)
Res
pon
se t
ime
(0.1
0)
1
0.6
74
0.7
03
0.6
71
0.7
21
0.9
20
1.0
44
0.9
10
0.8
43
Avg
wait
ing tim
e 1
0.0
42
0.1
14
0.0
42
0.1
43
0.7
64
1.0
70
0.7
64
0.8
60
Avg
fin
ish t
ime
1
0.8
03
0.7
94
0.8
03
0.8
31
0.9
54
1.0
10
0.9
54
0.8
30
Tim
e C
SA
1
0.9
57
1.0
20
0.9
76
1.0
30
0.9
6
1.0
40
0.9
39
0.8
50
Tim
e O
T1
1
0.8
88
0.9
00
0.8
52
0.8
83
0.9
96
1.1
00
0.9
71
0.8
60
Tota
l T
ime
KP
I 0.1
0
0.0
67
0.0
70
0.0
67
0.0
72
0.0
92
0.1
04
0.0
91
0.0
84
Fin
an
cial
(0.0
6)
Per
sonnel
cost
(0.0
5)
1
1.2
50
1.1
30
1.1
30
1
1.2
50
1.1
30
1.1
30
1
Tota
l F
ina
nci
al K
PI
0.0
5
0.0
63
0.0
56
0.0
56
0.0
50
0.0
63
0.0
56
0.0
56
0.0
50
Pro
du
ctiv
ity
(0.4
8)
Sta
ndar
diz
atio
n (
0.2
9)
1
0
0
1
1
0
0
1
1
Per
sonnel
uti
liza
tion (
0.2
2)
1
1.3
70
0.9
30
1.3
00
1.1
70
1.2
00
0.8
30
1.1
00
1.0
30
Tota
l P
rod
uct
ivit
y K
PI
0.5
1
0.3
01
0.2
05
0.5
76
0.5
47
0.2
64
0.1
83
0.5
32
0.5
17
ILE
P I
nd
ex
0
0.1
49
0.1
61
0.0
20
-0.0
13
0.1
63
0.1
59
0.0
41
-0.0
01

EMPIRICAL RESEARCH AT THE OPERATING THEATRE
173
The impact of the different improvement strategies will now be discussed. First,
standardization efforts are measured in scenarios 2, 3, 6 and 7. In these scenarios,
general employees prepare carts in the storage rooms, while cluster-specific employees
are responsible for transporting the carts to their respective clusters. Scenario 7
represents the standalone effect of standardization, which significantly increases
overall performance. This increase is mainly due to a good score on productivity KPIs
which encourage uniform practices and balanced staff utilization rates. However, the
negative impact on the time perspective cannot be ignored, as general employees need
to sequentially prepare all case carts compared to cluster-specific employees who
prepare carts at the same time. Moreover, an additional employee is hired in this
strategy, which increases costs without any time savings. In the other scenarios,
standardization interacts with other improvement strategies. In scenario 3 and 6, we
observe that standardization increases performance more when respectively the
improved elevator strategy and centralization are adopted. Centralization positively
affects quality by decreasing number of trips to storage rooms and reducing logistics
activities close to the operating rooms. Changing the elevator usage, on the other hand,
allows for more evenly spread arrival of carts, reduces workload variability and has a
positive impact on time needed in OT1-storage. Furthermore, risk of errors depends
on personnel productivity. The utilization rate is better in scenario 3 and 7, ensuring a
balanced workload. An argument could be that the working time of general employees
is lower than the working time of all cluster-specific employees since standardization
allows for pooling tasks. Centralization, on the other hand, increases workload. The
longer an employee is busy, the higher the probability of making a mistake. However,
it is difficult to draw an unambiguous conclusion for delivery accuracy due to limited
number of replications.
Scenarios 2, 4, 6 and 8 combine the CSA-storage and OT2-storage to analyse the
impact of centralization. The results show a decrease in the time needed in CSA
storage, though the workload in CSA storage increases. As discussed in Section
5.2.5.1, a third employee is seized for preparing surgical case carts to compensate the
higher workload. However, the additional baskets from OT2 require less items, and
thus the extra employee overcompensates the extra work which results in a lower
number of items to be picked per employee and thus less time needed to finish tasks
in the CSA storage. Moreover, the sooner the employees finish carts in the CSA
storage, the sooner employees start picking in the OT1-storage, and thus the total time
to finish case carts decreases. The total time saving is reinforced when centralization

CHAPTER 5
174
interacts with elevator strategies and standardization. Finally, the risk of errors appears
to be highest in centralization scenarios due to the extra workload for picking baskets
for OT2 in the CSA storage.
Finally, the impact of changing the elevator strategy is clearly visible in the average
waiting time. In scenario 2, 3, 4 and 5, the elevator operates every time the maximum
number of case carts according to the elevator size is reached. As a consequence, case
carts are sent in smaller batches to the respective clusters compared to the current
strategy where the elevator starts to operate as soon as all carts at the CSA storage are
finished. This results in an average waiting time that is seven times lower compared to
As-Is. This time saving is also noticeable in the average time to finish all carts, though
not proportionally due to shifting waiting times to OT1-storage. Nevertheless, this
waiting time is shorter than waiting in front of the elevator. From a time perspective,
implementing the elevator strategy is beneficial, whereas overall performance
decreases by adopting it as a standalone strategy. Combining elevator usage and
standardization in scenario 3 provides the best results due to the positive impact on
productivity. In the other scenarios, personnel utilization rates increase because the
elevator strategy decreases waiting times and thus results in less idle time for
employees, which also has a positive effect on time needed in OT1-storage.
Picking path problem
The LabVIEW model has been used to visualize three possible routing solutions for
27 physician preference supply lists, which are most frequently used in OT1. These
picking lists differ in number of items depending on the respective clusters or types of
surgeries. For example, trauma surgeries are non-elective and less predictable,
resulting in a low number of items on the case cart. On average, 18 items need to be
picked for each surgical case cart.
Three routing solutions are evaluated by comparing the travelled distance, as an output
from the LabVIEW model, which is expressed in meters (m). Moreover, this distance
provides an indication for the travelling time of employees to pick all the items on the
list as well as the average time required per item. These times, expressed in seconds
(s), are useful to calculate the impact of an optimized picking path on the total logistics
flow of the surgical case cart, which is presented in Section 5.2.5.3. As illustrated in
Table 5-23, the total travelling distance is calculated for three possible picking paths.
For example, the first picking list for cluster D contains 13 picking items. The results

EMPIRICAL RESEARCH AT THE OPERATING THEATRE
175
show that the routing algorithm performs best with a gain of 42m and 11m compared
to the S-Shape and Return strategy respectively. Converted to travelling times, using
Equation 5.7, results in a time saving of 50s and 14s respectively.
𝑇𝑟𝑎𝑣𝑒𝑙𝑙𝑖𝑛𝑔 𝑡𝑖𝑚𝑒 =𝑇𝑟𝑎𝑣𝑒𝑙 𝑑𝑖𝑠𝑡𝑎𝑛𝑐𝑒
0.833𝑚𝑠
+ (𝑛𝑢𝑚𝑏𝑒𝑟 𝑜𝑓 𝑖𝑡𝑒𝑚𝑠 ∗ 10𝑠) (5.7)
In total, for 52% of the picking lists, the routing algorithm has the shortest picking
path, whereas the Return strategy performs best in 30% and the S-Shape strategy is
most efficient for 18% of the case carts. On average, the savings in distance or time
are negligible between the Return strategy and the optimal routing algorithm. The
average distance is 78m and the average time per item is 16s. The small difference can
be explained as the Return strategy operates with an ordered sequence of picking items
in LabVIEW. In reality, however, logistics employees use their intuition to pick items
according to the order of the items on the picking lists, resulting in longer travelling
times. In addition, a time delay for parking the case carts in the baseline aisle is not
included in the model, but it takes a considerable amount of time to place the items on
the right shelve or basket on this cart. Furthermore, the largest time saving is achieved
when changing from the S-Shape strategy to the routing algorithm, amounting up to
10s on average. On a daily basis with 90 surgeries, this represents a saving of 900s or
15 minutes.
Finally, the supplies are reorganised in the CSA storage area according to their usage
pattern in each aisle rather than product type. In other words, the most frequently used
items are placed in the upper half of the aisle, such that employees do not need to
traverse the entire aisle, unless for rarely picked items, which reduces the total
travelling distances. In LabVIEW, this reorganisation is implemented only for the
routing algorithm. The fourth column in Table 5-23 presents the impact of this storage
reorganisation. On average, the routing algorithm with reorganisation saves 0.21m in
distance compared to the current organisation. However, the impact of reorganisation
depends on the respective cluster, as for cluster D, the reorganisation is not favourable,
whereas a gain of 12.61m can be achieved in cluster F.

CHAPTER 5
176
Tab
le 5
-23
. R
esult
s fr
om
Lab
VIE
W m
odel
s.
Clu
ster/
Item
s
To
tal
tra
vell
ing
dis
tan
ce (
m)
To
tal
tra
vell
ing
tim
es
(s)
Avera
ge t
ime p
er i
tem
(s/
item
)
Retu
rn
S
R
ou
tin
g
Ro
uti
ng
+ l
ayo
ut
Retu
rn
S
R
ou
tin
g
Ro
uti
ng
+ l
ayo
ut
Retu
rn
S
R
ou
tin
g
Ro
uti
ng
+ l
ayo
ut
A
29
10
3.9
1
87
.15
10
7.0
4
97
.14
41
4.7
4
39
4.6
2
41
8.5
0
40
6.6
1
14
.30
13
.61
14
.43
14
.02
A
17
89
.69
87
.15
81
.57
10
6.6
2
27
7.6
7
27
4.6
2
26
7.9
2
29
8.0
0
16
.33
16
.15
15
.76
17
.53
A
28
99
.17
87
.15
10
4.2
5
92
.4
39
9.0
5
38
4.6
2
40
5.1
5
39
0.9
2
14
.25
13
.74
14
.47
13
.96
A
16
85
.97
87
.15
74
.29
69
.55
26
3.2
1
26
4.6
2
24
9.1
8
24
3.4
9
16
.45
16
.54
15
.57
15
.22
B
8
51
.95
87
.15
64
.82
77
.93
14
2.3
6
18
4.6
2
15
7.8
2
17
3.5
5
17
.80
23
.08
19
.73
21
.69
B
16
78
.52
87
.15
82
.25
72
.6
25
4.2
6
26
4.6
2
25
8.7
4
24
7.1
5
15
.89
16
.54
16
.17
15
.45
B
16
83
.43
87
.15
10
0.0
2
96
.97
26
0.1
6
26
4.6
2
28
0.0
7
27
6.4
1
16
.26
16
.54
17
.50
17
.28
B
18
72
.6
87
.15
84
.11
89
.69
26
7.1
5
28
4.6
2
28
0.9
7
28
7.6
7
14
.84
15
.81
15
.61
15
.98
D
13
56
.69
87
.15
45
.02
45
.02
19
8.0
6
23
4.6
2
18
4.0
5
18
4.0
5
15
.24
18
.05
14
.16
14
.16
D
5
55
.68
87
.15
48
.06
48
.06
11
6.8
4
15
4.6
2
10
7.7
0
10
7.7
0
23
.37
30
.92
21
.54
21
.54
D
9
98
.32
87
.15
58
.38
58
.38
20
8.0
3
19
4.6
2
16
0.0
8
16
0.0
8
23
.11
21
.62
17
.79
17
.79
D
10
33
87
.15
51
.78
49
.25
13
9.6
2
20
4.6
2
16
2.1
6
15
9.1
2
13
.96
20
.46
16
.22
15
.91
D
20
85
.12
87
.15
82
.42
82
.42
30
2.1
8
30
4.6
2
29
8.9
4
29
8.9
4
15
.11
15
.23
14
.95
14
.95
D
8
51
.78
87
.15
48
.4
48
.4
14
2.1
6
18
4.6
2
13
8.1
0
13
8.1
0
17
.77
23
.08
17
.26
17
.26
F
22
83
.43
87
.15
10
9.8
3
96
.8
32
0.1
6
32
4.6
2
35
1.8
5
33
6.2
1
14
.55
14
.76
15
.99
15
.28
F
12
66
.34
87
.15
61
.09
76
.24
19
9.6
4
22
4.6
2
19
3.3
4
21
1.5
2
16
.64
18
.72
16
.11
17
.63
F
29
84
.28
87
.15
93
.75
99
.59
39
1.1
8
39
4.6
2
40
2.5
5
40
9.5
6
13
.49
13
.61
13
.88
14
.12
F
30
83
.6
87
.15
11
0.6
8
10
4.2
5
40
0.3
6
40
4.6
2
43
2.8
7
42
5.1
5
13
.35
13
.49
14
.43
14
.17
F
34
10
2.3
8
87
.15
98
.07
90
.62
46
2.9
1
44
4.6
2
45
7.7
3
44
8.7
9
13
.61
13
.08
13
.46
13
.20
F
32
93
.25
87
.15
10
3.7
4
97
.05
43
1.9
4
42
4.6
2
44
4.5
4
43
6.5
1
13
.50
13
.27
13
.89
13
.64
G
29
10
2.2
2
87
.15
80
.72
86
.48
41
2.7
1
39
4.6
2
38
6.9
0
39
3.8
2
14
.23
13
.61
13
.34
13
.58
G
16
77
.85
87
.15
87
.32
79
.88
25
3.4
6
26
4.6
2
26
4.8
3
25
5.8
9
15
.84
16
.54
16
.55
15
.99
G
32
10
8.8
2
87
.15
10
1.5
4
11
3.1
3
45
0.6
4
42
4.6
2
44
1.9
0
45
5.8
1
14
.08
13
.27
13
.81
14
.24
G
22
86
.82
87
.15
80
.72
89
.02
32
4.2
3
32
4.6
2
31
6.9
0
32
6.8
7
14
.74
14
.76
14
.40
14
.86
G
8
68
.88
87
.15
51
.62
53
.14
16
2.6
9
18
4.6
2
14
1.9
7
14
3.7
9
20
.34
23
.08
17
.75
17
.97
G
6
65
.66
87
.15
58
.05
46
.71
13
8.8
2
16
4.6
2
12
9.6
9
11
6.0
7
23
.14
27
.44
21
.61
19
.35
G
6
55
87
.15
53
.48
50
.09
12
6.0
3
16
4.6
2
12
4.2
0
12
0.1
3
21
.00
27
.44
20
.70
20
.02
Avg
18
7
8.6
8
87
.15
78
.63
78
.42
27
6.3
1
28
6.4
7
27
6.2
5
27
6.0
0
16
.41
17
.94
16
.19
16
.18

EMPIRICAL RESEARCH AT THE OPERATING THEATRE
177
5.2.5.3 Discussion
The ANP-based prototype and KPIs as suggested in Chapter 4 are useful to monitor
the performance of internal distribution processes in a transparent and rational way.
The simulation output provides several insights and recommendations for improving
the logistics flow of surgical case carts. Most scenarios, except for scenario 5,
demonstrate better performance based on the ILEP index compared to the As-Is
situation. Overall, scenario 6, which incorporates standardization and centralization
actions, performs best. From the ANP weights, as shown in Appendix E,
standardization is the most important KPI influencing the choice of distribution
policies as it improves productivity of logistics personnel by balancing workload and
promoting uniformity. Moreover, centralization greatly contributes to high quality of
the distribution process by decreasing materials flows to several storage locations and
as a result reduces product duplication. Scenario 3 and 7 occupy the second and third
place respectively. However, remark that scenario 7 only performs well on
productivity KPIs, which have the highest weights according to the OT logistics
manager. A trade-off should be made between multiple criteria to evaluate the benefits
of centralization, standardization and balanced elevator usage in terms of quality,
productivity, cost or time improvements.
Second, the LabVIEW models visualize different picking paths to minimize travel
distances. Based on the average output, the optimal routing algorithm performs best as
it searches for the shortest picking path, in contrast to a routing strategy. However,
heuristic approaches for optimizing picking paths are difficult to implement due to
complexity and inflexibility to adapt to different storage rooms (Horvat 2012).
Moreover, optimal algorithms provide non-intuitive routing solutions which often
result in employees deviating from this path, and thus causing a sub-optimal routing.
One picking path is displayed in Figure 5-30 for the three routing methods, where the
optimal routing solution does not follow a logical route among the aisles. As shown in
Table 5-23, the Return strategy behaves equally well and has a more logical picking
path. A possible improvement of the current, Return-like picking practice is to order
the picking locations per aisle, instead of following the order of the items on the
picking lists. This improvement is ready-to-use, accepted by employees with less
resistance and the results show that this Return strategy performs similarly as the
routing algorithm. In general, we can conclude that the routing algorithm is preferred
for picking lists with a low number of items, whereas a high number of items favours

CHAPTER 5
178
the Return or S-Shape strategy. In addition, the location of the items in the aisles plays
a key role in selecting the appropriate strategy. If items are spread evenly across all
aisles, the S-shape strategy is more efficient compared to the Return strategy. For
example, for clusters B and F, the Return strategy performs better because many
picking items are situated in the same aisle. Finally, it should be noted that the travelled
distance is equal for each path in the S-Shape strategy due to the assumption that the
entire storage room needs to be traversed. In reality, however, logistics employees will
stop the picking path at the final item location and go back to the start position.
Therefore, the S-Shape strategy only pays off when many items need to be picked,
equally spread over all aisles in the storage room.
Although a storage reassignment could have a positive influence on the travelled
picking path of the employees, the models in LabVIEW cannot support mixed aisle
configurations. As a result, only full aisles can be replaced in order to develop more
efficient picking paths. Table 5-23 presents the small gain by a reorganisation
implemented in the routing algorithm. Other possibilities for reorganising the storage
room involve changing the locations from different aisles. This can be done by locating
the most commonly picked items from the entire storage room in the two aisles closest
to the start position in order to decrease travelling distances. The remaining aisles can
be ordered according to product families to ensure a logical organisation of the storage
room. Another approach stores the most frequently used items across the entire storage
room in the upper half of each aisle, whereas the less commonly picked items are
located farther away from the baseline aisle. However, this rearrangement may be
confusing for logistics employees.
The enhanced picking path is implemented in the current logistics flow (i.e. scenario
9 in Table 5-22) to analyse the impact on the distribution process. The routing
algorithm with the new storage organisation is selected as it has the minimal travel
distance and average time per item (16.18s). The logistics flow, however, represents
the current picking path travelled by logistics employees, which is a free interpretation
of the Return strategy. Hence, a time difference is observed between picking times per
item in the Simulink model (19.79s) and those obtained from the Return strategy in the
LabVIEW model (16.41s). The final column in Table 5-22 presents the ninth scenario,
integrating the optimal picking path in the As-Is situation. The improved picking times
result in a saving of 53 minutes in the CSA storage. However, the enhanced picking
path does not provide any benefits to the performance compared to the As-Is situation.
The time KPI has a relative low weight in the framework, and thus the picking time

EMPIRICAL RESEARCH AT THE OPERATING THEATRE
179
savings should be big to generate a positive impact on the logistics flow performance.
Although the enhanced picking path presents no clear advantages in the logistics flow,
the reduction in travelled distances cannot be underestimated when evaluating
productivity. In addition, an optimal picking path results in more uniform and
streamlined picking processes, and thus less obstacles along the storage aisles.
Finally, delivery accuracy is difficult to measure due to lack of data. In this case study,
we assume a relationship between risk of errors and working time. Moreover, the
impact of picking errors depends on the time of detection (Rammelmeier, Galka, and
Gunthner 2011). Especially in the OT, a picking error on the surgical case cart can
have tremendous effects on the procedure, leading to delays or endangered patients’
lives. Several picking error prevention technologies can be implemented to improve
picking accuracy and thus improve the quality of the OT distribution flow. These
technologies differ with respect to implementation costs and accuracy rates. Cameras
are often used as a means for detecting errors. However, the picking errors are not
prevented by camera identification. Therefore, we focus only on error prevention. A
first technology is 2D or QR-code scanning. The QR codes can easily be generated,
maintained and are readable to any kind of mobile device with camera (Nilsson and
Elmar Merkle 2018). Moreover, QR-codes provide more storage capacity, flexible
design and assured visibility compared to 1D barcode scanning. In addition, a low
implementation and maintenance cost make this technology financially attractive,
though a relabelling of codes is necessary to implement this strategy in the hospital.
Second, a pick-by-light system can be introduced to prevent picking errors. The picker
receives all picking information on small display boards attached at the storage
shelves. A pick is indicated with the lightning of a lamp and a display shows the
quantity to pick. Although this technology guarantees high picking accuracy, it is
something to bear in mind for the future due to long implementation times and high
costs.
When analysing the findings of this case study, some limitations should be considered.
First, the ANP methodology as proposed in Chapter 4 calculates weights for the KPIs
based on one stakeholder’s preferences, namely the OT logistics manager. Second, the
Simulink model does not model any employees to operate the elevator or to transport
baskets between CSA storage and OT2-storage, which will have a negative impact on
the time needed in CSA storage. Third, the number of replications as well as data
availability is limited. As a result, no statistical validation can be performed on the
simulation outcome. Next, the picking path optimization problem does not include the
CHAPTER 5
180
exact spot of the item on the shelf. Moreover, in the S-Shape strategy, the final aisle
(F) must have at least one picking location in order to return the cart automatically to
its start position, resulting in equal travel distances as the full S-Shape needs to be
traversed. Finally, reorganising the storage room layout is not possible due to lack of
integration within LabVIEW.
In future work, extensions to both models are possible. In LabVIEW, the current model
serves as a baseline for further research to obtain a routing algorithm adjusted to the
organisation of items in each storage room and to determine optimized storage layout.
In contrast, the model can optimize the routing solution for each cluster by
implementing cluster-specific picking lists. However, using a different strategy or
algorithm is confusing for logistics employees and stimulates deviation from the
optimal path. Second, the logistics flow model in Simulink is only applicable for the
current situation in the hospital under study. However, DES studies have proven its
use in multiple industrial applications (Babulak and Wang 2012). This study provides
a proof-of-concept that building a simulation model is universally applicable and also
works in a healthcare environment, especially in distribution processes without any
patient interactions (Kuljis et al. 2007). Furthermore, the centralization scenario should
be further elaborated to investigate the impact on inventory. Pooling inventory into
one location often translates into cost savings for the hospital by reducing product
duplication. Finally, it is difficult to isolate the impact of the surgical case cart process
on the total logistics flow. The next section considers integrating inventory and
distribution processes in the OT.

EMPIRICAL RESEARCH AT THE OPERATING THEATRE
181
5.3 Integrating inventory and distribution systems using
surgical procedure preference lists
An important aspect of the internal logistics processes at the OT relates to preparing
surgical case carts for elective procedures. Section 5.2.5 discusses the organisation of
the distribution process to ensure timely delivery of surgical case carts and optimal
routing paths for picking items in storage rooms. However, the content of the case carts
has been ignored, though outdated preference lists for these carts might cause delays
of surgical procedures due to erroneous materials provision. In addition, Section 5.2.3
propose to improve the inventory levels in central and decentral stock, where we
disregard standardization efforts or physician preferences to update surgical case carts.
Surgeons have preferences for their own brands/suppliers of products, which results in
lack of product and process standardization and hence it presents a major challenge to
implement effective materials management systems (Nguyen et al. 2014; Schneller,
Burns, Lawton, and Smeltzer 2006). Surgeons represent the final link in the OT supply
chain, where operating time, quality of patient outcomes and supply availability are
crucial success parameters (Gitelis et al. 2015). Healthcare logistics aims to integrate
inventory and distribution systems in order to ensure supply availability by preparing
case carts based on procedure-specific preference lists. These lists are composed of
materials required to perform the surgery. The goal of this study is to investigate the
impact of up-to-date procedure preference lists on both medical and logistics processes
within the OT (Robben 2019). Efficient surgical preference lists are an effective
enabler for standardization initiatives, which results in cost containment and improved
transparency, safety and value for the overall health system (Huntley, Howard, and
Simpson 2018).
5.3.1 Methodology
Data on 14 surgical preference lists are collected between January and February 2019
from one OT cluster at UZ Leuven. An example of a preference list is added in
Appendix F. The data contain empty packages of materials used during each surgery
as well as the associated procedure-specific preference lists. The cluster is specialized
in abdominal surgery. More specifically hepatobiliary surgery is selected for this case
study since a great variety of materials are used in the preference lists of this sub-
discipline. Although only one surgeon is working in this field, this section presents an
exploratory study to enhance cost awareness among surgeons in general. Second,

CHAPTER 5
182
variability in supply consumption by surgeon is investigated by analysing 72 procedure
lists. A multi-disciplinary OT cluster at UZ Leuven is considered, including neuro,
reconstructive and plastic, oral and maxillofacial, and breast surgery. The individual
procedure-specific preference lists allow to explore standardization opportunities
because two to six different surgeons perform similar procedures depending on the
sub-discipline. For both analyses, the focus is on disposable medical-surgical supplies,
such as covering materials, surgical materials or anaesthesiological materials. Due to
the great amount and great variety, disposables provide significant opportunities for
standardization, whereas sterile instrument sets are more or less constant. Therefore,
sterile sets are excluded from this research. It should be noted, however, that much of
the literature focuses on the content of the sterile sets, which needs to be optimized to
reduce waste (Copenhaver et al. 2017).
5.3.2 Results
First, we analyse the efficiency of the preference lists used in hepatobiliary surgery by
comparing the materials on the lists and actual material consumption during surgery.
In total, 38 elective surgeries have been performed in the study interval. Figure 5-32
displays how the consumed items deviate from the preference lists for the included
surgeries. Five categories are identified:
Not – Items included in the list, but not consumed.
Less – Items included in the list, but consumed in a lower quantity.
Correct – Items included in the list, and consumed in the predefined quantity.
More – Items included in the list, but consumed in a larger quantity.
Extra – Items not included in the list, but consumed.
In addition, a distinction can be made between different types of items (‘Count’) and
the total number of items (‘Sum’) consumed. On average, each surgery uses 60
different types of items and 82 items in total, whereas the preference lists contain 43
different items. Hence, the preference lists obtain an accuracy level of 72%, or in other
words, the lists contain 72% of the different types of items which are actually
consumed during surgery though the quantity consumed may differ. This can be found
in Figure 5-32 by adding the ‘Count’ percentages for categories Not, Less, Correct and
More. Since one item can only be attributed to one category, all items on the preference
list are divided over these four categories. Taking a closer look at total item
consumption (‘Sum’), we observe that 39% of the items are consumed as prescribed

EMPIRICAL RESEARCH AT THE OPERATING THEATRE
183
in the list and 35% of the items are additionally retrieved from decentral stock. A minor
percentage of items is consumed in a different quantity. A large percentage of items,
however, is not consumed, though the logistics employees indicated the items as being
prepared. Plausible explanations could be that the items have no package, the package
is lost, the items are from the central sterilization department or the items have been
restocked. Further research is required to justify the inclusion or exclusion of these
items on the list.
Figure 5-33 gives an overview of the total number of items consumed (‘Sum’) for
different surgery types. We observe that surgeries B, G and A represent the best
correctness ratio, namely 50%, 48% and 46% respectively. Notice that surgeries J and
K have used the least number of correct items, whereas they represent the highest ratio
for retrieving extra items. The ratios provide an objective justification for evaluating
the surgical preference lists, or in other words, the higher the ratio of extra items, the
less efficient the list, and thus the more room for improvement. Figure 5-32 shows that
35% of total consumed items are additionally provided during surgery. This
corresponds, on average, to 28 items extra. The majority of the extra materials (49%)
are suture materials. Clinical staff is involved with preparing suture, since it is stored
in the operating room and therefore not included on the preference list. Moreover,
gloves account for 18% of the extra material types. The size and type of gloves depend
on the surgical team, and therefore are not included on the list. Other extra materials
20,58%
0,57%
2,02%
28,48%
48,35%
19,38%
0,55%
6,71%
34,60%
38,76%
Not
Less
More
Extra
Correct
0,00% 10,00% 20,00% 30,00% 40,00% 50,00% 60,00%
Item
cat
egori
es
Percentage of items
Sum items Count items
Figure 5-32. Deviation in item types and item consumption between preference lists and actual
practice.

CHAPTER 5
184
are harder to catalogue, such as laparoscopic materials, clips, reloads, needles,
catheters, etc. In general, improvement initiatives are mainly useful for suture materials
in order to minimize clinical staff involvement, increase cost transparency and improve
inventory control, whereas other extra materials are subject to large variability
dependent on the surgical team and thus request more standardization efforts.
Furthermore, procedure F uses, on average, more items than provided in the list. For
one item, a systematic pattern can be found which justifies an increase in the specified
quantity. In contrast, a limited number of items are used less often than indicated.
Unused items are often referred to as waste, which should be avoided as much as
possible. Moreover, restocking unopened items is a costly and time-consuming task.
Although Figure 5-33 shows very small ratios for ‘Less’, the items categorized as ‘Not’
might also include unused items. Finally, data on ‘Extra’, ‘More’, and ‘Less’ categories
are especially useful for inventory control as it helps identifying where to locate
supplies, such that frequently added materials are stored closer to the point-of-care
locations and clinical staff spend less time in retrieving these items.
0,00%
10,00%
20,00%
30,00%
40,00%
50,00%
60,00%
A B C D E F G H I J K L M N
Percentage of
items
Surgery types
Not Less Correct More Extra
Figure 5-33. Overview of different surgery types in terms of item consumption deviation from
the preference lists.
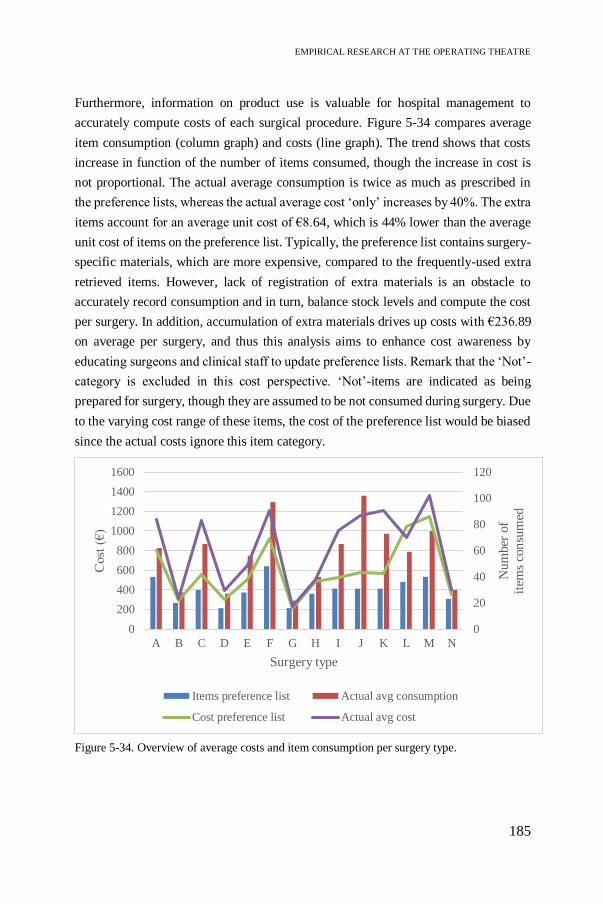
EMPIRICAL RESEARCH AT THE OPERATING THEATRE
185
Furthermore, information on product use is valuable for hospital management to
accurately compute costs of each surgical procedure. Figure 5-34 compares average
item consumption (column graph) and costs (line graph). The trend shows that costs
increase in function of the number of items consumed, though the increase in cost is
not proportional. The actual average consumption is twice as much as prescribed in
the preference lists, whereas the actual average cost ‘only’ increases by 40%. The extra
items account for an average unit cost of €8.64, which is 44% lower than the average
unit cost of items on the preference list. Typically, the preference list contains surgery-
specific materials, which are more expensive, compared to the frequently-used extra
retrieved items. However, lack of registration of extra materials is an obstacle to
accurately record consumption and in turn, balance stock levels and compute the cost
per surgery. In addition, accumulation of extra materials drives up costs with €236.89
on average per surgery, and thus this analysis aims to enhance cost awareness by
educating surgeons and clinical staff to update preference lists. Remark that the ‘Not’-
category is excluded in this cost perspective. ‘Not’-items are indicated as being
prepared for surgery, though they are assumed to be not consumed during surgery. Due
to the varying cost range of these items, the cost of the preference list would be biased
since the actual costs ignore this item category.
0
20
40
60
80
100
120
0
200
400
600
800
1000
1200
1400
1600
A B C D E F G H I J K L M N
Nu
mber
of
item
s co
nsu
med
Cost
(€
)
Surgery type
Items preference list Actual avg consumption
Cost preference list Actual avg cost
Figure 5-34. Overview of average costs and item consumption per surgery type.

CHAPTER 5
186
Finally, Figure 5-35 provides an overview of one surgery, which has been performed
12 times during the research period. On average, this procedure consumes 97 items
compared to the 48 items as suggested in the preference list. As a consequence, the
cost of the preference list is an underestimation, since the average cost of this
procedure is €295 more expensive. The standard deviation is also displayed. If we
assume that the costs are normally distributed, then 68.27% of the procedures are
within one standard deviation of the mean. We observe that one outlier reports a cost
increase of €588 and consumes up to 119 items.
This work presents a pilot study showing how to enhance cost awareness among
surgeons in general. Variability in supply consumption by surgeon often results in a
great variation in average costs while similar patient outcomes are obtained (Simon,
Frelich, and Gould 2018). Therefore, the second aim in this study is to identify
opportunities for standardization initiatives and increase surgeon engagement by
providing justification to rationalize their product portfolio and to ensure cost
containment. 72 procedure lists are evaluated for 21 surgery types in a multi-
disciplinary cluster, or in other words, on average three surgeons perform a similar
procedure using an individualized preference list. In contrast to analysing the
efficiency of the lists based on actual consumption, only materials on the lists are
evaluated. As a consequence, the cost saving represents an underestimation due to
ignoring any additional materials consumed during surgery. Figure 5-36 displays the
0
200
400
600
800
1000
1200
1400
1600
0 1 2 3 4 5 6 7 8 9 10 11 12
Cost
(€
)
Replications of surgery type F (#)
Surgery type FCost list
Actual cost
Avg actual cost
Standard deviation (+1σ)
Standard deviation (-1σ)
Figure 5-35. Comparison of costs between preference list and actual practice for surgery type F.
EMPIRICAL RESEARCH AT THE OPERATING THEATRE
187
average cost as well as the number of items for four surgery types performed by
respectively six, four, four and five different surgeons. The maximum cost difference
amounts €100, €32, €232 and €124 per case respectively, whereas the number of items
is less variable. The higher cost is often associated with a higher number of items,
however, the cost of the extra items greatly exceeds the average unit cost in the
procedure list. For example, in the first surgery type, surgeon F consumes four extra
items corresponding to a cost increase of €100. In terms of average unit cost, we thus
observe an increase from €5 to €25 for the extra items compared to the average number
of items on the list. Moreover, surgery types 2 and 3 are performed by similar surgeons.
As can be seen, surgeon B accounts for higher costs in both surgery types, whereas the
other surgeons perform similarly. Hence, the analysis provides valuable information
to negotiate which items to include on standardized preference lists. On average,
designing standardized preference lists in this multi-disciplinary OT cluster yields a
cost saving of 30%.

CHAPTER 5
188
Figure 5-36. Comparison of costs and number of items for different surgeons performing
similar surgery types.

EMPIRICAL RESEARCH AT THE OPERATING THEATRE
189
5.3.3 Discussion
This work investigates how preference lists deviate from actual practice in terms of
consumption and costs. The findings show that 39% of the consumed items correspond
to the lists, whereas 35% additional items are retrieved from decentral stock. An up-
to-date preference list ensures minimal clinical staff involvement by decreasing the
frequency of leaving the operating room for retrieving additional materials. From a
logistics point of view, procedure lists provide useful information on materials
consumption for each surgery and hence, improve cost transparency. As a
consequence, inventory parameters can be adapted to material needs by balancing
stock levels and costs. The limited storage space within the operating room only
justifies to stock very frequently used or critical items. Moreover, accurate
consumption data and a balanced stock facilitate the replenishment process. Therefore,
surgical preference lists serve as a crucial link for integrating inventory and distribution
systems. The consumption data allow to identify where to locate materials, how many
to stock, and when to replenish in order to ensure supply availability. The lists also
contain details on product description and location identification to standardize the
distribution process. From a cost perspective, this work shows that the average cost is
40% higher than reported in the procedure lists. As we know that the hospital in this
case study performs 21000 surgical procedures per year (UZ Leuven 2018), the costs
of extra materials mount up to €5 million per year which is not recorded. This finding
stimulates to create cost awareness among hospital personnel.
Although the procedure lists are an enabler for achieving an efficient OT supply chain,
many lists are customized by surgeon preferences which results in lack of
standardization. Educating surgeons on material consumption and associated costs will
enhance surgeon engagement to identify standardization opportunities which allows
for rationalizing the products portfolio, minimizing costs and streamlining logistics
operations to the benefit of value-based healthcare. Simon et al. (2018) aim to reduce
variation by designing standardized procedure lists of disposable supplies. This
standardization effort yields a cost saving of 32% which is in line with the 30% as
found for the multi-disciplinary OT cluster in the hospital under study. Hence, we can
argue that in general, significant cost savings can be realized by educating surgeons on
disposable supply costs.
From an overall inventory perspective, the standardization cost savings need to be
integrated with the 30% cost saving obtained in the two-echelon inventory model
CHAPTER 5
190
without any standardization (Section 5.2.3). The latter model calculates the inventory
cost based on total item consumption throughout the OT, whereas the standardization
case study only accounts for materials on the preference lists and thus excludes any
additionally retrieved or returned items. From Figure 5-32, we learn that 39% of the
items on the preference lists are correct and therefore it is assumed that the inventory
cost saving in the two-echelon model distinguishes between 12% based on adjusting
inventory levels for items on the preference lists and 18% for all other items. Together
with the cost saving from rationalizing the product portfolio, the items on the
preference lists could reduce inventory costs up to 42% which corresponds to a saving
of 17% in the total inventory picture. Remark that this might be an overestimation,
because the savings from adjusting the inventory levels are partially double-counted.
In addition, the cost saving for all other items need to be considered, and thus overall,
the OT could save 35% of money tied up to inventory.
Finally, a major source of waste in the post-operative stage is associated with the cost
of unused materials, which are thrown away, are restocked or need extra sterilization,
and thus involve a resource-intensive logistics task, since individual items have no
location identification attached. A study by Harvey et al. (2017) shows a cost saving
of up to 289 dollar per surgery. Hence, educating and engaging surgeons when
composing preference lists bridges the gap between logistics and medical processes.
This will improve the efficiency of care processes in the pre-, per- and post-operative
stage, as well as integrate inventory and distribution systems by realizing cost savings,
reduce waste, balance stock levels, limit product variation and improve replenishment
processes.
This section presents an exploratory pilot study to investigate the impact of up-to-date
procedure lists on both medical and logistics processes within the operating theatre.
Due to the small sample size, some procedures are only performed once during the
research period. Increasing the number of procedures is likely to enhance trust in the
findings, which are valuable for discussing surgical preferences and increase cost
awareness. In further work, standardization efforts can be evaluated by creating action
groups of multiple stakeholders to rationalize product portfolios. Furthermore, items
in the category ‘Not’ need further analysis in order to decide to eliminate these items
from the procedure list, which will impact the distribution process to restock redundant
materials. In addition, optimizing sterile instrument sets provides opportunities to
eliminate waste, which has been ignored in this study. Finally, increasing awareness
in terms of costs and consumption requires implementing product identification

EMPIRICAL RESEARCH AT THE OPERATING THEATRE
191
standards (e.g. GS1 standards) in a uniform database for different hospital
departments, such as purchasing, logistics and medical departments.
5.4 Conclusion
Cost containment in healthcare is of increasing concern. Streamlining hospital supply
chains is critical to provide superior, low-cost patient care. This chapter answers to the
third research question by integrating different management aspects to improve the
performance of the internal hospital logistics flow using the prototype as suggested in
Chapter 4. The methodology is illustrated by applying the prototype to five case studies
conducted at the operating theatre. By combining Discrete-Event Simulation, scenario
analysis and the ANP prototype, we prove that the hybrid ANP-DES tool is supportive
in identifying appropriate logistics policies, determining parameter values and
quantifying trade-offs among KPIs to improve inventory and distribution processes,
while taking a holistic view of the hospital supply chain. Moreover, the ILEP index is
introduced as a transparent outcome of the hybrid tool and provides a sound basis for
evaluating logistics improvement initiatives.
Providing inventory management solutions is vital for achieving efficiency targets in
hospital supply chain operations. However, no single inventory policy applies to all
items due to divergent attributes, such as costs, demand patterns or criticality. The first
case study addresses inventory classification methods to develop inventory strategies
based on item characteristics. Two classification methods are compared, both featuring
multiple criteria. The AHP-based classification divides items into four classes based
on a weighted classification score compared to the 27 inventory classes for the ABC-
FNS-VED classification. Inventory classification helps in distinguishing between
inventory hot spots and lower priority items, and accordingly service levels are
specified for four classes of items based on the AHP method.
Second, a DES model is developed to represent a single-item, two-echelon inventory
system, where operating rooms are replenished by a central storage room. The overall
objective is to provide an efficient, yet simple model that varies the maximum stock
level and reorder point to identify the best inventory policy based on the ILEP index.
Service levels for the four item classes act as an important constraint when identifying
appropriate inventory policies. We observe that for critical items in category A and B,
the risk-taking policy 3 performs best due to limited amount of stock-outs, significant

CHAPTER 5
192
cost savings of 37% and faster inventory rotation. Items in category C and D are
assigned a lower service level target, though the positive effect on the financial and
productivity factor do not compensate for the 10% increase of stock-outs in policy 3.
Therefore, a risk-averse policy 2 is preferred for less critical or slow-moving items.
However, the high weighting factor in the ANP-based prototype for service level is
questionable for less critical items. Reconsidering the weights for different
classification groups may have an impact on the ILEP index to select the appropriate
inventory policy. Overall, the framework supports inventory policy decision making
by solving the trade-off between service level and costs, depending on item
classification. Further research will extend the model to identify where to locate
supplies in the internal supply chain. Applying the inventory-policy matrix to other
departments will enhance the scalability of the key findings.
Furthermore, the complex distribution channels within hospitals require determining
optimal replenishment policies, case cart distribution systems and efficient picking
paths to improve the performance of the hospital supply chain. The third case study
analyses the logistics workflow in one OT cluster by focusing on replenishment of
disposable supplies. Overall, we demonstrate that two replenishment scenarios both
result in efficiency improvements compared to the current As-Is situation. The
Standard scenario provides a better service than the As-Is at lower costs, whereas the
Copy carts scenario improves the logistics staff productivity. However, the latter
scenario contains a higher inventory cost due to non-optimal selection of items carried
on copy carts. In addition, both scenarios increase data collection through scanning,
resulting in valuable information for inventory control. Ultimately, the logistics
manager should consider the trade-off between service, time, costs and productivity
when defining efficiency targets, and discuss this trade-off with medical staff, as they
have critical insights into the challenges of achieving an operationally efficient
workflow, supporting care delivery.
The fourth case study demonstrates the impact of surgical case cart distribution and
order picking in storage rooms on the internal supply chain performance. In terms of
case cart distribution, the best strategy is to adopt standardization and centralization
resulting in increased uniformity and balanced workload in the logistics chain.
However, the multi-faceted character of achieving operational excellence often results
in different policy decisions. From a time perspective, centralization and enhancing
the elevator usage perform best, whereas the cheapest policy strives for improved
elevator usage only. Furthermore, modelling the optimal path for order pickers

EMPIRICAL RESEARCH AT THE OPERATING THEATRE
193
provides deeper insight into improving traveling time, which constitutes the largest
portion of the picking time. A comparison is made between optimal routing algorithms
and routing strategies. In each model, picker congestion is taken into account by
allowing pickers to cross aisles one at a time due to space restrictions. In addition,
optimizing the storage assignment decision further contributes to reductions in travel
time and distance. In our case study, it is optimal to implement centralization,
standardization and elevator policies, rather than improving the order picking process.
However, the reduced traveling time (i.e. saving of 53 minutes) and distance cannot be
underestimated from a time and productivity perspective. Summarized, improving
distribution activities can significantly impact system performance and should be
aligned with inventory control when streamlining internal supply chain operations in
hospitals. Although the recommended distribution policies are case study-specific,
using the prototype as a tool for policy decision making is generalizable to other
healthcare settings since the ILEP index allows for identifying efficient logistics
practices.
The chapter closes by linking inventory and distribution strategies to foster integrated
supply chain processes, which positively impacts performance. The case study
investigates surgical procedure lists and aims for increasing cost awareness among
hospital stakeholders as a crucial step towards standardization efforts. Standardization
will reduce product variety and thus facilitate inventory management and cost
containment. This work reveals a total inventory cost saving of 35% by implementing
standardization initiatives for items on preference lists as well as improving inventory
levels of all items consumed within the OT. Moreover, this finding provides insights
in identifying areas of low-hanging fruits to easily reduce costs as a prerequisite to
optimize the whole supply chain. Up-to-date surgical preference lists provide
information on supply consumption, which enables balancing of inventory levels and
costs as well as identifying optimal distribution processes to streamline the logistics
flow to the benefit of value-based healthcare.
Finally, we offer a critical reflection to the methodology related to the choice for
simulation packages. Guimarães et al. (2018) list a number of evaluation criteria for
selecting Discrete-Event Simulation software in a manufacturing setting. The most
important criteria assess technical requirements for model development and execution.
First, the Arena simulation package is known as a comprehensive tool for DES
modelling applied to a wide range of problems (e.g. manufacturing, SCM, patient
modelling, etc.) (Ait El Cadi, Gharbi, and Artiba 2016). The main advantage of this

CHAPTER 5
194
DES package is its library of icons, global variables and entity attributes as well as its
ability to show animations. The software is highly-flexibly and thus allows for high-
end modelling in an object-oriented environment and easy customization to different
application domains (Guseva et al. 2018). In addition, the graphical user interface
integrates specialized simulation languages (i.e. SIMAN) featuring easy-to-use drag
and drop modules, though it is found to be unintuitive and outdated. A major drawback
of the software is the time-intensive debugging process and the expensive acquisition
cost. Furthermore, a thorough introduction into any simulation software is
recommended as model developers need to learn and gain experience to overcome
technical complexities (Kelton et al. 2015). A second simulation model uses
SimEvents which adds DES to the Simulink environment and is fully integrated with
Matlab. The Simulink simulation platform allows to model discrete-event, dynamics
and agent-based simulation. In general, Simulink is more appropriate for continuous
time simulation, but the integration with Matlab facilitates data processing and offers
a multi-paradigm tool for optimization. Although both simulation software packages
provide similar results, Arena is preferred for entity-based DES, whereas Simulink
outperforms Arena for complex system simulation in terms of ease-of-use, speed,
integration of modelling paradigms and the optimization toolbox (Ait El Cadi et al.
2016).

195
CHAPTER 6
6 Multi-Level Multi-Stakeholder Framework
Validation6
This chapter describes the final module in the development of the healthcare
logistics performance management framework. This module adds three
feedback loops in order to address the possibility of bias that comes with a
single decision-maker’s attitude and generalize the findings to a wider
healthcare logistics context. In addition, the iterations stimulate continuous
improvement by identifying benchmarking opportunities.
6.1 Introduction
Three modules in the development of the logistics performance management
framework have been described throughout Chapters 3 till 5, resulting in an initial
prototype which has been tested for an operating theatre (OT) setting. This prototype
considers only one stakeholder’s opinion as a first step towards increasing awareness
of how logistics can service healthcare systems. In this case, the logistics manager is
selected as the single decision-maker, as his main responsibility is managing the
material and information flows throughout the OT.
In this dissertation, a structured approach is proposed to measure the impact of
different logistics policies on the overall performance of the hospital supply chain, and
especially a prototype is evaluated for OT logistics. Savings in costs and time as well
as improvements in quality and productivity are identified from a logistics perspective.
6 This chapter partially corresponds to the following paper:
Moons, K., Waeyenbergh, G., De Ridder, D., Pintelon, L. (2020). A Framework for Operational Excellence in
Hospital Logistics: Implementation Roadmap. Health Care Management Science, Submitted.

CHAPTER 6
196
This understanding increases awareness how logistics support contributes to
qualitative care. Moreover, it promotes evidence-based decision making among
multiple stakeholders by defining the best set of indicators to achieve the overall goal
of operational excellence and value-based healthcare.
Recently, multi-stakeholder multi-criteria analysis is gaining attention to enhance
stakeholder commitment as well as to elicit divergent perspectives of each stakeholder
(Macharis, De Witte, and Ampe 2009). Group decision making has a positive impact
on the robustness of the approach, since any decision taken is more likely to be
accepted when considering a broader perspective. Therefore, the final step in the
framework development is to include different stakeholders’ objectives and
viewpoints. Alternative logistics concepts are evaluated from multiple stakeholders’
perspectives and the appropriate policy can be identified by quantifying the main trade-
off between costs and service levels. Dealing with this trade-off reduces logistics
fragmentation in healthcare organisations, and in turn improves overall performance
of the hospital. The goal of this chapter is two-fold, namely to find a generic ranking
of the indicators constituting the definition for operational excellence in healthcare
logistics and to demonstrate that the framework is robust for its intended purpose of
identifying efficiency improvement initiatives in the internal hospital supply chain.
The former objective faces a major challenge inherent to any MCDM study, namely
comparing different stakeholders’ perspectives, analysing conflicts between
stakeholders and generating consensus decisions when setting priorities for the KPIs.
By including medical-oriented stakeholders, the logistics indicators are verified on
relevance from medical perspective, which allows to gain insights on how logistics
principles can be transferred from industrial processes to a healthcare setting. For
example similarities to spare parts logistics in maintenance operations can be found,
though measuring logistics indicators in a healthcare setting is more complicated due
to outdated information technology systems and conflicting goals among stakeholders.
In addition, the importance of the indicators differs since endangering patient’s lives
is far more severe than having lost revenues due to a stock-out.
The second objective aims to propose a robust decision-support tool serving as a
guideline for practitioners and academics to quantify trade-offs between objectives and
reap the benefits from adopting SCM concepts in healthcare. For this purpose, two
prevalent MCDM techniques, ANP and PROMETHEE, are combined into a hybrid
tool to verify the performance management in healthcare logistics. Both techniques are

MULTI-LEVEL MULTI-STAKEHOLDER FRAMEWORK VALIDATION
197
capable of addressing complex decision problems, involving a group of stakeholders
and evaluating interdependencies among the indicators.
Finally, this chapter concludes with a benchmarking study to address the need for
effective performance measurement in healthcare logistics and to identify best
practices by pursuing the best set of KPIs among different hospital processes.
6.2 Literature
6.2.1 Stakeholder conflicts: how much do their preferences
matter to decision making?
A typical challenge in any MCDM study for healthcare problems relates to dealing
with disagreement among diverse stakeholders. This problem is roughly translated as
how to value and interpret the divergent opinions or perspectives in a transparent,
accountable, consistent and reliable manner (Marsh et al., 2014b). Conflicting
stakeholder goals often lead to discrepancies between rankings of alternatives, and thus
complicate the overall objective of finding a ranking that fits all stakeholders. A multi-
stakeholder MCDM analysis enhances stakeholder commitment and allows to gain
insights in the stakeholder perspectives (Macharis et al. 2009). Moreover, group
decision making increases the robustness of the approach, since a generalized result
often leads to a more successful implementation (Beierle 2002).
This section elaborates on different methods to solve this group decision-making
problem in a solid, mathematical manner and thus aggregating preferences that satisfy
all individuals. Belton and Pictet (1997) apply MCDM methods to group decision
making and distinguish between sharing (i.e. single decision-makers), aggregating (i.e.
pooling of individual judgments) and comparing. The AHP/ANP approach usually
adopts the aggregating approach for group decision making. From a qualitative
perspective, on the one hand, group decision-support techniques, such as voting,
consensus, compromise or the Delphi method are used (Ehrgott, Figueira, and Grego
2010; García-Melón, Gómez-Navarro, and Acuña-Dutra 2012; Jharkharia and Shankar
2007). In case not all stakeholders have equal stakes in the decision-making process,
the question arises how much their preferences matter to decision making and weights
can be assigned to different stakeholder groups. A larger weight can be given to
stakeholder groups, reflecting their experience or knowledge when judging a certain
criterion. The weights can be obtained by identifying the relative importance of
CHAPTER 6
198
decision makers by pairwise comparisons, or by a supra-decision-maker, who defines
the individual stakeholder weights (Rietkötter 2014).
From a quantitative perspective, on the other hand, the most straightforward
aggregation method is by calculating the arithmetic or geometric mean of each
individual stakeholder (Danner et al., 2011; García-Melón et al., 2012, 2016; Govindan
et al., 2014; Gumus, 2017; J. Hummel et al., 2014). The geometric mean aims to hold
central tendency by taking into account the product of the individual values, rather than
the sum of the values for calculating the arithmetic mean. Saaty (1989) recommends
to aggregate individual judgments using geometric mean. Less popular aggregation
methods are linear programming or the Bayesian approach (Altuzarra, Moreno-
Jiménez, and Salvador 2007; Mikhailov 2004; Moreno-Jiménez et al. 2016). A more
sophisticated method is the cluster similarity method as proposed by Song and Hu
(2009). This method is often used in complement with the AHP/ANP method as
already explained in Chapter 4, though it can be applied on every ranking as obtained
by a certain MCDM analysis. The main reasoning is that two stakeholders are assigned
to the same cluster whenever the degree of similarity exceeds a certain threshold. The
cluster weights are determined proportionally to the number of stakeholders in the
cluster. A final ranking considering multiple stakeholder viewpoints can be obtained
by calculating the Weighted Arithmetic Mean (WAM) or the Weighted Geometric
Mean (WGM) (Moreno-Jiménez et al. 2016). Finally, a sensitivity analysis can further
investigate the impact of changing stakeholder weights on the final result which can
lead to new insights in the decision-making process.
6.3 Methodology
In this chapter, three feedback loops are integrated to extend the prototype to a general
framework by considering multiple stakeholders’ perspectives and a wider healthcare
logistics context. The prototype starts from the heart of logistics, where the logistics
manager aims to efficiently store and move medical supplies to the right location at
the right time, while minimizing costs and improving satisfaction of logistics
personnel. The results based on the ILEP index as obtained from the pilot case studies
at the OT in Chapter 5 serve as input for more informed decision making in healthcare
logistics in general, which is useful when stakeholders have no clue of the potential
added value of logistics to the care delivery system. Two key questions for value
measurement in multi-level multi-stakeholder environments need to be answered: who
and how to involve multiple stakeholders. The former addresses the need for tools to
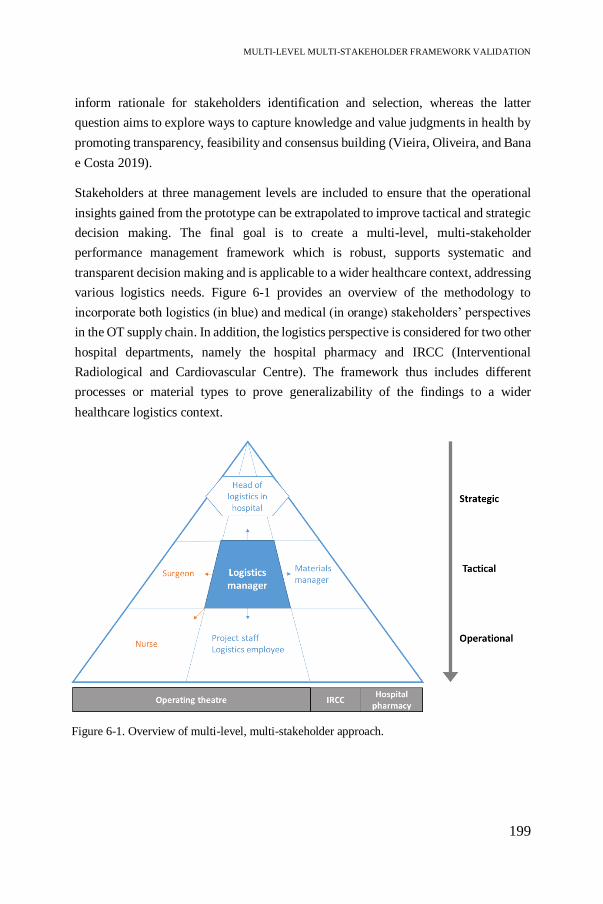
MULTI-LEVEL MULTI-STAKEHOLDER FRAMEWORK VALIDATION
199
inform rationale for stakeholders identification and selection, whereas the latter
question aims to explore ways to capture knowledge and value judgments in health by
promoting transparency, feasibility and consensus building (Vieira, Oliveira, and Bana
e Costa 2019).
Stakeholders at three management levels are included to ensure that the operational
insights gained from the prototype can be extrapolated to improve tactical and strategic
decision making. The final goal is to create a multi-level, multi-stakeholder
performance management framework which is robust, supports systematic and
transparent decision making and is applicable to a wider healthcare context, addressing
various logistics needs. Figure 6-1 provides an overview of the methodology to
incorporate both logistics (in blue) and medical (in orange) stakeholders’ perspectives
in the OT supply chain. In addition, the logistics perspective is considered for two other
hospital departments, namely the hospital pharmacy and IRCC (Interventional
Radiological and Cardiovascular Centre). The framework thus includes different
processes or material types to prove generalizability of the findings to a wider
healthcare logistics context.
Figure 6-1. Overview of multi-level, multi-stakeholder approach.

CHAPTER 6
200
6.3.1 Stakeholder analysis
The stakeholder analysis helps to identify the people who are directly or indirectly
influenced by the consequences of any decisions taken, and thus whose perspectives
need to be considered in the validation process. Understanding the objectives of
different stakeholder groups is crucial when appropriately assessing the different
alternatives (Macharis et al., 2012). This chapter includes three levels of decision
making and three stakeholder groups – OT, IRCC and hospital pharmacy – to validate
the framework development procedure. Initially, the prototype has been developed for
disposable surgical supplies using input from the logistics manager at the OT. Building
on this tactical level, the medical point of view of surgeons can be added. Surgeons are
powerful stakeholders as they determine scheduling decisions and have individual
material preferences, which impacts daily execution of both clinical and logistics
processes. Furthermore, operational insights are gained by including nurses and
logistics employees at the department or hospital ward level. Nurses are responsible
for the proper execution of surgical procedures without any delays, whereas logistics
employees support the care process by timely storing and distributing the supplies to
the right operating rooms. Many OR/OM techniques are suitable for operational
models, however, they are restricted by the tactical and strategic decisions. The head
of logistics decides on the overall logistics strategy to improve performance of the
overall healthcare institution. Moreover, strategic decisions concerning policy-
making, information technology systems or organisation structure are made. Typically,
soft systems methodologies are used, such as cognitive mapping, influence
diagramming or system dynamics. By taking into account hospital upper management,
the framework is validated on a broader perspective and other hospital departments are
included as a way of generalizing the findings. In this work, the hospital pharmacy and
IRCC department are selected because different types of materials are handled by each
department requiring different objectives to be pursued. The pharmaceutical supplies
in the former department are characterized by obsolescence, product expiry or strict
regulatory requirements, whereas the IRCC department deals with expensive medical-
invasive supplies, such as catheters, compared to disposables used in the OT. For each
department, the materials manager iterates between the logistics indicators as included
in the prototype. Altogether, eight stakeholders from three stakeholder groups
participate in this study to quantify trade-offs between objectives in order to reduce
logistics fragmentation and streamline internal supply chain processes.

MULTI-LEVEL MULTI-STAKEHOLDER FRAMEWORK VALIDATION
201
6.3.2 Data collection and analysis
We use an inductive approach to refine the prototype by iterating between the (1)
indicators and (2) logistics policies as well as (3) identifying best practices to ensure a
reference framework can be developed as an aid for more informed decision making
in healthcare logistics (see Figure 6-2). Data is collected from conducting interviews
with eight stakeholders at three control levels in the period between August and
September 2019. The average duration of an interview was around 90 minutes. The
interview consists of a semi-structured questionnaire (Appendix G).
First, a feedback loop is introduced in the final development stage of the framework
to avoid bias of a single decision-maker’s attitude when defining what is important for
efficiency management. All respondents iterate between the indicators by judging
pairwise comparisons and an individual prioritization of KPIs is determined using the
ANP approach. For each stakeholder group or department, the priorities are compared
and consensus is achieved using a similarity-based clustering approach as explained in
Chapter 4 (Song and Hu 2009). The overall priority vector is derived by computing the
WAM or WGM, which represents the multi-stakeholder KPI ranking for the context-
specific setting.
Figure 6-2. Converting the prototype to a robust multi-level multi-stakeholder framework:
three iterations.
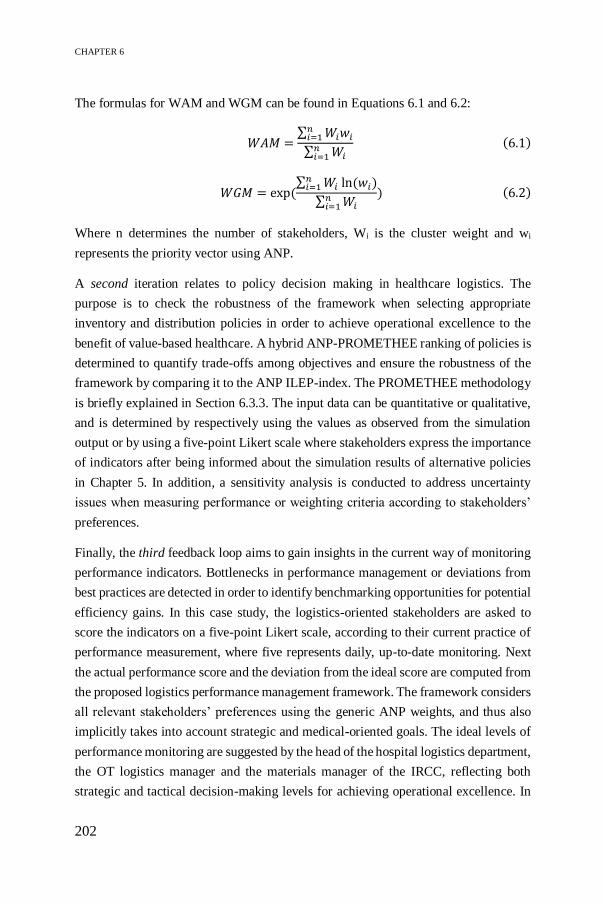
CHAPTER 6
202
The formulas for WAM and WGM can be found in Equations 6.1 and 6.2:
𝑊𝐴𝑀 =∑ 𝑊𝑖𝑤𝑖
𝑛𝑖=1
∑ 𝑊𝑖𝑛𝑖=1
(6.1)
𝑊𝐺𝑀 = exp (∑ 𝑊𝑖 ln (𝑤𝑖)
𝑛𝑖=1
∑ 𝑊𝑖𝑛𝑖=1
) (6.2)
Where n determines the number of stakeholders, Wi is the cluster weight and wi
represents the priority vector using ANP.
A second iteration relates to policy decision making in healthcare logistics. The
purpose is to check the robustness of the framework when selecting appropriate
inventory and distribution policies in order to achieve operational excellence to the
benefit of value-based healthcare. A hybrid ANP-PROMETHEE ranking of policies is
determined to quantify trade-offs among objectives and ensure the robustness of the
framework by comparing it to the ANP ILEP-index. The PROMETHEE methodology
is briefly explained in Section 6.3.3. The input data can be quantitative or qualitative,
and is determined by respectively using the values as observed from the simulation
output or by using a five-point Likert scale where stakeholders express the importance
of indicators after being informed about the simulation results of alternative policies
in Chapter 5. In addition, a sensitivity analysis is conducted to address uncertainty
issues when measuring performance or weighting criteria according to stakeholders’
preferences.
Finally, the third feedback loop aims to gain insights in the current way of monitoring
performance indicators. Bottlenecks in performance management or deviations from
best practices are detected in order to identify benchmarking opportunities for potential
efficiency gains. In this case study, the logistics-oriented stakeholders are asked to
score the indicators on a five-point Likert scale, according to their current practice of
performance measurement, where five represents daily, up-to-date monitoring. Next
the actual performance score and the deviation from the ideal score are computed from
the proposed logistics performance management framework. The framework considers
all relevant stakeholders’ preferences using the generic ANP weights, and thus also
implicitly takes into account strategic and medical-oriented goals. The ideal levels of
performance monitoring are suggested by the head of the hospital logistics department,
the OT logistics manager and the materials manager of the IRCC, reflecting both
strategic and tactical decision-making levels for achieving operational excellence. In

MULTI-LEVEL MULTI-STAKEHOLDER FRAMEWORK VALIDATION
203
general, the multi-level, multi-stakeholder benchmarking approach allows to identify
best practices by determining the best set of KPIs reflecting the objectives of the
overall health system and multiple stakeholders’ perspectives.
6.3.3 PROMETHEE methodology
In this study, the PROMETHEE method is applied as outranking approach to rank
alternatives from highly performing on all criteria to bad performance. PROMETHEE
stands for Preference Ranking Organisation Method for Enrichment Evaluations and
is developed by Brans et al. (1986). This method is chosen because of its simplicity in
conception and computation and its ability to outrank a finite set of alternatives
considering multiple, sometimes conflicting, criteria (Abdullah, Chan, and Afshari
2019). Another reason for its popularity is the existence of user friendly software
packages, such as ‘Visual PROMETHEE’ (Mateo 2012). PROMETHEE is widely
applied in many different fields, such as chemistry, energy management or logistics
and transportation (Behzadian et al. 2010). The main working principle of
PROMETHEE relies on creating preference functions based on pairwise comparisons
of alternatives across multiple criteria by several stakeholders. These judgments can
be qualitative or quantitative, depending on the criteria characteristics. Different types
of PROMETHEE exist, however, this work applies PROMETHEE II in order to obtain
a complete ranking of alternatives with respect to the desired objectives, compared to
a partial ranking in PROMETHEE I (Brans et al. 1986). The following steps explain
the PROMETHEE II procedure (Behzadian et al. 2010):
Step 1: Determine deviations based on pairwise comparisons between two evaluations:
𝑑𝑗(𝑎, 𝑏) = 𝑓𝑗(𝑎) − 𝑓𝑗(𝑏) (6.3)
Where 𝑑𝑗(𝑎, 𝑏) denotes the difference between the evaluations of alternative a and b
on each criterion. A non-negative value implies that the first alternative is favoured in
the pairwise comparison, the opposite is true for a negative value.
Step 2: The difference between two evaluations is translated into a preference matrix
using a preference function:
𝑃𝑗(𝑎, 𝑏) = 𝑃𝑗 [𝑑𝑗(𝑎, 𝑏)] (6.4)
Where 𝑃𝑗 (𝑎, 𝑏) represents the preference of alternative 𝑎 with regard to 𝑏 on each
criterion, as a function of 𝑑𝑗(𝑎, 𝑏), ranging from 0 to 1. For large deviations, a strong
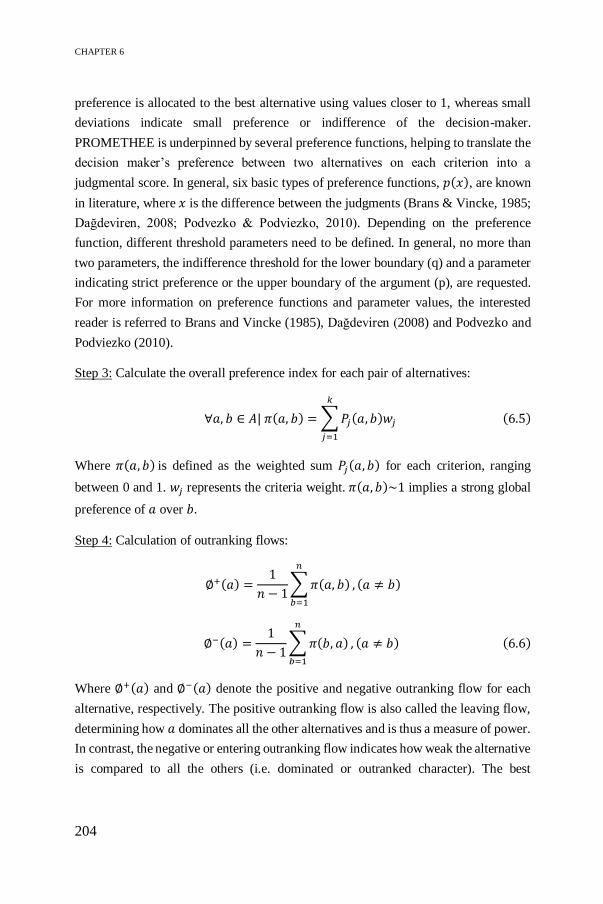
CHAPTER 6
204
preference is allocated to the best alternative using values closer to 1, whereas small
deviations indicate small preference or indifference of the decision-maker.
PROMETHEE is underpinned by several preference functions, helping to translate the
decision maker’s preference between two alternatives on each criterion into a
judgmental score. In general, six basic types of preference functions, 𝑝(𝑥), are known
in literature, where 𝑥 is the difference between the judgments (Brans & Vincke, 1985;
Dağdeviren, 2008; Podvezko & Podviezko, 2010). Depending on the preference
function, different threshold parameters need to be defined. In general, no more than
two parameters, the indifference threshold for the lower boundary (q) and a parameter
indicating strict preference or the upper boundary of the argument (p), are requested.
For more information on preference functions and parameter values, the interested
reader is referred to Brans and Vincke (1985), Dağdeviren (2008) and Podvezko and
Podviezko (2010).
Step 3: Calculate the overall preference index for each pair of alternatives:
∀𝑎, 𝑏 ∈ 𝐴| 𝜋(𝑎, 𝑏) = ∑ 𝑃𝑗(𝑎, 𝑏)𝑤𝑗
𝑘
𝑗=1
(6.5)
Where 𝜋(𝑎, 𝑏) is defined as the weighted sum 𝑃𝑗(𝑎, 𝑏) for each criterion, ranging
between 0 and 1. 𝑤𝑗 represents the criteria weight. 𝜋(𝑎, 𝑏)~1 implies a strong global
preference of 𝑎 over 𝑏.
Step 4: Calculation of outranking flows:
∅+(𝑎) =1
𝑛 − 1∑ 𝜋(𝑎, 𝑏)
𝑛
𝑏=1
, (𝑎 ≠ 𝑏)
∅−(𝑎) =1
𝑛 − 1∑ 𝜋(𝑏, 𝑎)
𝑛
𝑏=1
, (𝑎 ≠ 𝑏) (6.6)
Where ∅+(𝑎) and ∅−(𝑎) denote the positive and negative outranking flow for each
alternative, respectively. The positive outranking flow is also called the leaving flow,
determining how 𝑎 dominates all the other alternatives and is thus a measure of power.
In contrast, the negative or entering outranking flow indicates how weak the alternative
is compared to all the others (i.e. dominated or outranked character). The best

MULTI-LEVEL MULTI-STAKEHOLDER FRAMEWORK VALIDATION
205
alternative is characterized by high values of leaving flows and low values of entering
flows.
Step 5: Calculation of net outranking flow:
∅(𝑎) = ∅+(𝑎) − ∅−(𝑎) (6.7)
Where ∅(𝑎) refers to the net outranking flow for each alternative, and thus represents
the final ranking of alternatives. The best alternative is defined as the alternative with
the highest net flow value.
6.4 Results
6.4.1 Multi-stakeholder KPI ranking
This study aims to validate the findings by extending the prototype to a general
logistics performance management framework for healthcare settings. This section
describes the results from adding a first feedback loop to the single decision-maker
prototype by eliciting multiple stakeholders’ perspectives in order to obtain an overall
ranking which constitutes the definition for operational excellence in a healthcare
supply chain. The priority vectors resulting from the ANP method are determined for
stakeholders involved in the OT supply chain. In addition, the framework is applied to
other hospital departments including decision making at all organisational levels.
From the OT perspective, five stakeholders are included and Figure 6-3 presents the
normalized ANP inventory weights (i.e. sum of weights for each stakeholder equals
one). In general, the average weights of the OT stakeholder group are similar to the
preferences elicited by the logistics manager in the prototype developed in Chapter 4.
One exception is inventory criticality, which is ranked to be less important according
to the OT stakeholder group. However, the discrepancy between the weights can be
attributed to the stakeholder backgrounds. Medical-oriented stakeholders rank
criticality, which is indirectly related to patient safety, as one of the most important
elements to improve performance of inventory systems, whereas the logistics
stakeholders are less educated on the impact of items on the surgical procedure and
thus assign a lower weight. More conflicts can be observed for the productivity-related
indicators. Inventory usage and turnover are especially important to logistics personnel
for determining the cost of a surgery as well as to efficiently use expensive storage

CHAPTER 6
206
space close to the operating room. In contrast, medical personnel assign higher weights
to quality-related indicators.
Furthermore, conflicts occurring within the logistics stakeholder group can be
attributed to the level in the decision-making hierarchy. The logistics manager
prioritizes tactical decisions, such as ensuring accurate inventory levels to minimize
overstocking and linking medical and logistics processes by emphasizing inventory
criticality. At an operational level, however, more attention is focused on metrics to
streamline daily operations, such as monitoring inventory rotation and usage. Finally,
product standardization is considered to be moderately important as all stakeholders
recognize the potential benefits of engaging healthcare professionals and increasing
cost awareness for future improvements. However, the logistics manager has a lower
weight for this indicator since other components in the supply chain must first be
improved in order to express the importance of surgeon engagement when
standardizing products and thus facilitating inventory management.
To generalize the findings, two other settings are included in this study. Consequently,
two flows of materials are considered. Potential differences in the ANP ranking can be
attributed to the type of materials, namely disposables, pharmaceuticals and expensive
surgical-invasive items in respectively the OT, hospital pharmacy and IRCC
department. One would expect costs to be more important for the expensive materials,
0,000
0,050
0,100
0,150
0,200
0,250
0,300
0,350
AN
P w
eights
Inventory indicators
Logistics Manager OT
Average Logistics
Average Medical
Average OT ranking
Figure 6-3. ANP inventory weights of OT stakeholder group.

MULTI-LEVEL MULTI-STAKEHOLDER FRAMEWORK VALIDATION
207
however, Figure 6-4 shows only a slight increase in the weights for financial indicators.
In any healthcare setting, costs are ranked at the lowest position as patient health will
always get priority.
The main conflict between the different settings is observed for inventory criticality,
turnover and usage. The former indicator is more important for pharmaceutical
supplies since the right drug must be provided based on the prescription. At the OT
and IRCC, on the other hand, many alternatives are available for surgical disposables
and the appropriate invasive item is selected from the full product assortment
depending on patient characteristics. Hence, these material types are stored close to the
operating room, which makes inventory turnover more important. Fast-moving items
requiring daily replenishment are justified to be in stock in the operating room in order
to avoid overstock and waste valuable space for care processes. Furthermore, the
weight assigned to inventory usage of pharmaceuticals is extremely low due to the
legal requirements, which enables easy monitoring of usage and therefore this factor
is considered to be not important.
Finally, we include the strategic decision-making level to present an overall logistics
perspective for all hospital departments. This viewpoint displays some conflicting
objectives compared to the studied settings, aiming at tactical and operational
performance metrics. Although service level is top-priority at all decision-making
levels to balance inventory levels and patient safety, the logistics director emphasizes
the importance of cost and productivity objectives to achieve operational excellence.
Quality indicators are lower ranked since these metrics typically impact the execution
of daily processes at the operational level, which is beyond the responsibility of
strategic management.
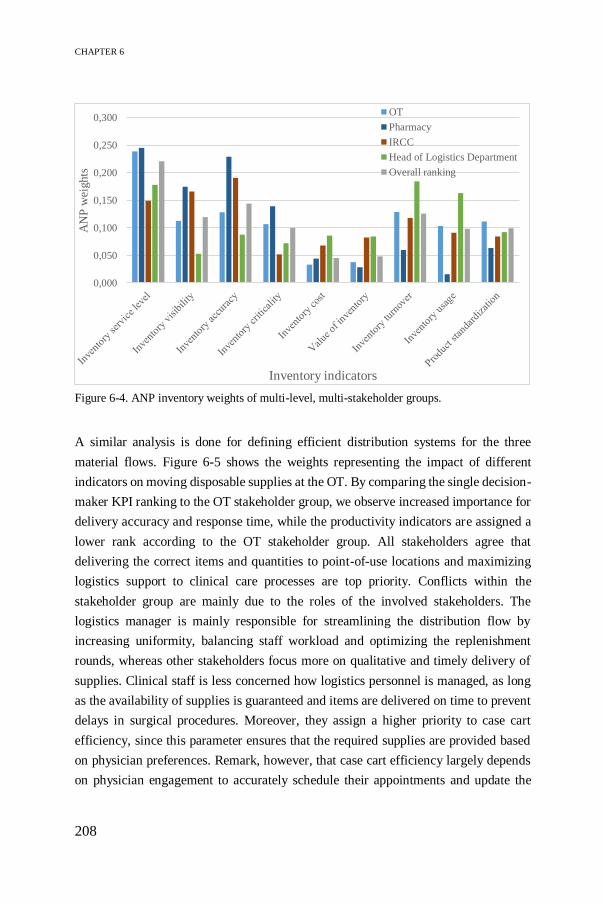
CHAPTER 6
208
A similar analysis is done for defining efficient distribution systems for the three
material flows. Figure 6-5 shows the weights representing the impact of different
indicators on moving disposable supplies at the OT. By comparing the single decision-
maker KPI ranking to the OT stakeholder group, we observe increased importance for
delivery accuracy and response time, while the productivity indicators are assigned a
lower rank according to the OT stakeholder group. All stakeholders agree that
delivering the correct items and quantities to point-of-use locations and maximizing
logistics support to clinical care processes are top priority. Conflicts within the
stakeholder group are mainly due to the roles of the involved stakeholders. The
logistics manager is mainly responsible for streamlining the distribution flow by
increasing uniformity, balancing staff workload and optimizing the replenishment
rounds, whereas other stakeholders focus more on qualitative and timely delivery of
supplies. Clinical staff is less concerned how logistics personnel is managed, as long
as the availability of supplies is guaranteed and items are delivered on time to prevent
delays in surgical procedures. Moreover, they assign a higher priority to case cart
efficiency, since this parameter ensures that the required supplies are provided based
on physician preferences. Remark, however, that case cart efficiency largely depends
on physician engagement to accurately schedule their appointments and update the
0,000
0,050
0,100
0,150
0,200
0,250
0,300
AN
P w
eights
Inventory indicators
OT
Pharmacy
IRCC
Head of Logistics Department
Overall ranking
Figure 6-4. ANP inventory weights of multi-level, multi-stakeholder groups.

MULTI-LEVEL MULTI-STAKEHOLDER FRAMEWORK VALIDATION
209
material lists for each cart. Case carts are often inaccurately prepared due to missing
information on patient characteristics or the executing physician.
Overall, the distribution ranking is less ambiguous for different settings, as shown in
Table 6-1. For the OT and pharmacy, qualitative distribution systems gain in
importance, whereas the IRCC department prioritizes the productivity or organisation
of the workflow. Moreover, a higher weight is assigned to cost indicators for
pharmaceuticals, since the distribution of supplies goes beyond the OT and IRCC to
all hospital departments. Since the ranking depends on the material types, the
distribution ranking is considered to be context-specific. Therefore, three overall
rankings are established in Table 6-1. In addition, the strategic decision-making level
is added to the analysis to provide an overall perspective on distribution in hospitals.
From a holistic view, the time perspective is an important determinant for providing
high-quality patient care in the most efficient way, as logistics is typically defined as
delivering the right supplies to the right places at the right time. Moreover, process
standardization efforts require support from higher managerial levels, since this also
influences the cost and productivity of distribution systems.
0,000
0,050
0,100
0,150
0,200
0,250
AN
P w
eights
Distribution indicators
Logistics Manager OT
Average Logistics
Average Medical
Average OT ranking
Figure 6-5. ANP distribution weights of OT stakeholder group.

CHAPTER 6
210
In terms of inventory management, on the other hand, we observe more consensus
across stakeholders for the highest-ranked indicators, such as quality indicators, and
less consensus for the moderate-to-low ranked indicators, such as cost or productivity
indicators. This suggests that the criteria are of high importance and the inventory
ranking is generalizable, regardless of the material types which vary in terms of costs,
legal requirements or nature of the items. The overall KPI ranking can be found in
Table 6-1.
Table 6-1. Multi-level, multi-stakeholder ranking of inventory and distribution indicators.
Average ranking OT Pharm
acy
IRCC Average ranking OT/Pharmacy/
IRCC
Delivery accuracy 1 1 9 Inventory service level 1
Centralization 6 6 12 Inventory visibility 4
Distribution
service level
2 8 10 Inventory accuracy 2
Replenishment
lead time
7 4 4 Inventory criticality 5
Response time 5 5 2 Inventory cost 9
Clinical staff
involvement
12 10 6 Value of inventory 8
Distribution cost 9 3 8 Inventory turnover 3
Personnel cost 11 7 11 Inventory usage 7
Case cart
efficiency
8 9 5 Standardization 6
Delivery frequency 10 12 7
Process
standardization
3 2 1
Personnel
management
4 11 3
6.4.2 Robustness of the framework
The second feedback loop relates to policy decision making. The average OT ranking
in Table 6-1 serves as input for choosing the most appropriate policy based on the
ILEP index. In addition, a hybrid approach, combining ANP and PROMETHEE II, is
applied in order to check the robustness of the ILEP index and the developed
framework.
6.4.2.1 Hybrid ANP-PROMETHEE II ranking
The ANP-PROMETHEE II method is applied as a second-stage validation of the
logistics performance management framework, aiming to select the policy that

MULTI-LEVEL MULTI-STAKEHOLDER FRAMEWORK VALIDATION
211
improves efficiency in the internal hospital supply chain according to multiple
stakeholders’ preferences. The different steps as elaborated in Section 6.3.3 are
executed, ANP is applied as weighting procedure and the software ‘Visual
PROMETHEE’ is used to obtain the ranking of alternatives, which represent
improvement policies for inventory and distribution systems in the OT. The highest-
ranked alternative (i.e. rank 1) represents the best policy based on the normalized ANP
weights and the net outranking flow (PROMETHEE II). The policies are judged across
the indicators in the framework serving as input data, which can be qualitative or
quantitative. Quantitative judgments are derived from the simulation output as
provided in Chapter 5, whereas qualitative judgments are obtained by asking the OT
stakeholder group to score the importance of indicators with respect to the alternative
policies on a five-point Likert scale.
Quantitative analysis
Figure 6-6 displays the ANP-PROMETHEE II rankings for inventory and distribution
policies from a quantitative perspective. Individual stakeholder preferences as well as
the average OT ranking are shown in the graphs. For most stakeholders, a similar
ranking can be found for both inventory and distribution policies. The As-Is policy is
at the lowest spot (i.e. rank 3), which implies that all stakeholders recognize the impact
of improving logistics processes at the OT and thus increase awareness of logistics
value.
In terms of distribution, the Standard scenario (see Section 5.2.4) is identified to be the
most suitable policy to increase efficiency since it reduces product duplication and
enhances data collection for inventory optimization. The inventory picture, on the
other hand, shows different rankings dependent on the item classification. For critical
items, classified in group A, stakeholders agree to adapt inventory parameters to
demand characteristics (i.e. scenario 2 in Section 5.2.3) to become more efficient.
However, for C-items, conflicts arise among stakeholders. Stakeholders expressing a
stronger trade-off between service level and costs or turnover, prefer the As-Is scenario
over the risk-taking scenario 3. This trade-off is largest for nurses, who select the As-
Is to be the best policy. Due to the high weight assigned to inventory service level, a
decrease in this KPI in scenarios 2 and 3, though it still satisfies the requirements for
C-items, cannot be compensated by cost savings or improved turnover rates as their

CHAPTER 6
212
weights are low. On average, however, the trade-off is alleviated and therefore the risk-
averse scenario 2 is preferred.
Qualitative analysis
On the other hand, a similar analysis is done using qualitative judgments. The
stakeholders are provided with a detailed problem description from the logistics
viewpoint, focusing on the main bottlenecks in the As-Is situation and efficiency gain
opportunities. The potential improvements are presented by using the normalized KPI
values as obtained from the simulation output for the different inventory and
distribution policies. This understanding promotes more informed decision making
when stakeholders are asked to score the importance of relevant indicators with respect
to the different policies. Although all stakeholders were reported about the advantages
and disadvantages of each policy, the ANP-PROMETHEE II ranking may differ
depending on the stakeholders’ perception. Most stakeholders converge their
preferences for distribution systems as the Standard scenario is selected to be the best
policy. The quantitative analysis resulted in the same ranking, thus we assume that the
Figure 6-6. Quantitative PROMETHEE II ranking for OT stakeholder group.

MULTI-LEVEL MULTI-STAKEHOLDER FRAMEWORK VALIDATION
213
simulation results increase awareness of potential efficiency improvements in
distribution processes.
However, for inventory systems, the stakeholder rankings are divergent, as can be seen
in Figure 6-7. Surprisingly, logistics stakeholders show indifference or even prefer the
least efficient As-Is scenario, whereas clinical stakeholders gain deeper insights into
the importance of indicators and recognize the potential efficiency gain in the proposed
policies. The positive impact of information is thus especially noticeable for clinicians,
who learn about the impact of service level, inventory cost and turnover when
inventory levels are adapted. Further analysis are conducted using the quantitative
data, rather than the impacts as estimated by experts to avoid misinterpretation of the
indicators.
Trade-off quantification
Furthermore, the hybrid ranking can be graphically displayed in the GAIA
(Geometrical Analysis for Interactive Aid) plane, showing the relative alternatives’
point coordinates depending on their contributions to the indicators (Brans and
Mareschal 1994). Alternatives are represented by points and indicators by vectors.
Conflicting indicators are easily identified since their vectors point in opposite
directions, in contrast to indicators expressing similar preferences. The length of the
vectors represent the relative discriminating power of the indicator on the alternatives:
the longer the vector, the more discriminating power. In addition, the direction of the
decision vector 𝜋 reflects the overall preference by compromising between indicator
weights, and the best alternative according to the ANP-PROMETHEE II ranking is
oriented in the same direction (Wang & Yang, 2007). Figure 6-8 displays the GAIA
Figure 6-7. Qualitative PROMETHEE II inventory ranking for OT stakeholder group.
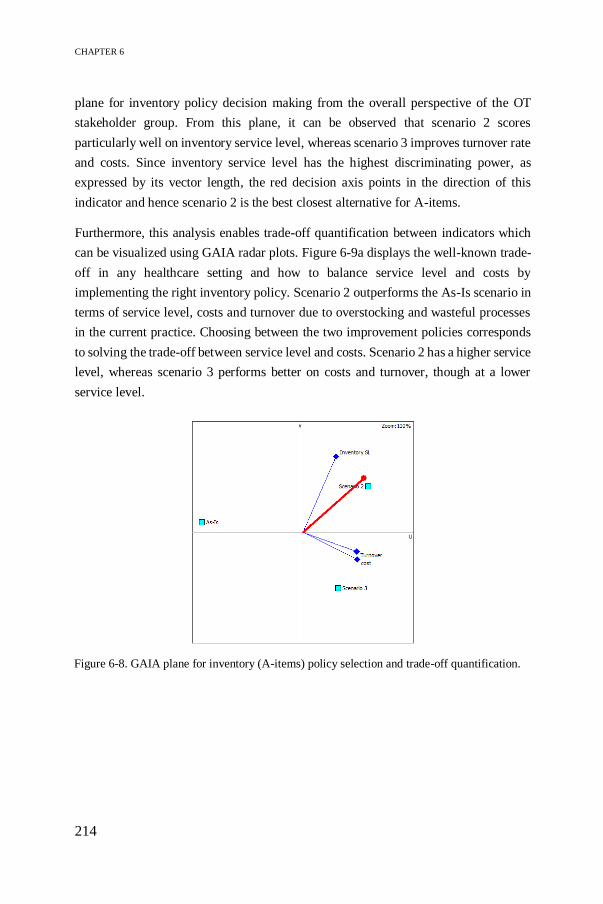
CHAPTER 6
214
plane for inventory policy decision making from the overall perspective of the OT
stakeholder group. From this plane, it can be observed that scenario 2 scores
particularly well on inventory service level, whereas scenario 3 improves turnover rate
and costs. Since inventory service level has the highest discriminating power, as
expressed by its vector length, the red decision axis points in the direction of this
indicator and hence scenario 2 is the best closest alternative for A-items.
Furthermore, this analysis enables trade-off quantification between indicators which
can be visualized using GAIA radar plots. Figure 6-9a displays the well-known trade-
off in any healthcare setting and how to balance service level and costs by
implementing the right inventory policy. Scenario 2 outperforms the As-Is scenario in
terms of service level, costs and turnover due to overstocking and wasteful processes
in the current practice. Choosing between the two improvement policies corresponds
to solving the trade-off between service level and costs. Scenario 2 has a higher service
level, whereas scenario 3 performs better on costs and turnover, though at a lower
service level.
Figure 6-8. GAIA plane for inventory (A-items) policy selection and trade-off quantification.

MULTI-LEVEL MULTI-STAKEHOLDER FRAMEWORK VALIDATION
215
Similarly, the Figure 6-9b displays the trade-offs when selecting distribution policies.
As can be seen in the GAIA radar plots, distribution service level and delivery
frequency are conflicting criteria due to their opposite position. The Standard scenario
mainly focuses on distribution service level, centralization and costs, whereas the Copy
carts scenario emphasizes good performance on delivery frequency, accuracy and
replenishment lead time. Overall, the stakeholders value distribution service level
higher than delivery frequency, and therefore the Standard scenario is the preferred
policy. Remark that clinical staff involvement is the main factor favouring the As-Is
situation, however, this discrepancy is largely due to inaccurate staff representation as
explained in Chapter 5.
Figure 6-9a. GAIA radar plots for inventory policy selection and trade-off quantification.

CHAPTER 6
216
6.4.2.2 Sensitivity analysis
With the help of a sensitivity analysis, the robustness of the final ranking of alternatives
can be checked. Group decision making often implies larger variability or uncertainty
in the criteria weights, and thus complicates the process of obtaining a robust ranking.
A robust ranking is a ranking that does not change significantly when minor changes
are made to different steps in the MCDM procedure (Adunlin et al. 2015). Two ways
of performing sensitivity analysis are described, namely comparing two MCDM
approaches and evaluating the impact of changing indicator weights on the final
ranking.
A first method to check the sensitivity of the framework output is by comparing two
MCDM procedures. In the standalone ANP approach, the local priorities are
synthesized to obtain a global priority vector, indicating the extent to which
alternatives contribute to efficiency improvement in the OT supply chain. Different
logistics policies in terms of inventory and distribution systems are evaluated using
simulation (see Chapter 5). The ILEP index is introduced to find the most suitable
policy for each process type. Figure 6-3 and Table 6-1 display the average ANP
Figure 6-9b. GAIA radar plots for distribution policy selection and trade-off quantification.

MULTI-LEVEL MULTI-STAKEHOLDER FRAMEWORK VALIDATION
217
weights for the OT stakeholder group. According to this KPI ranking and the
corresponding ILEP index, scenario 3 is preferred for A-items, whereas C-items
request a more risk-averse scenario for inventory management. The Standard scenario
is the best option for replenishing supplies to operating rooms.
Alternatively, a hybrid ranking is proposed by combining ANP and PROMETHEE II.
Figure 6-10 shows the comparison between both methods. The last option is the As-Is
situation, which indicates that stakeholders are aware of the current bottlenecks in the
logistics system. For distribution systems, both methods rank the Standard scenario to
be the best policy for improving efficiency, demonstrating the robustness of the
framework for this process type. However, the best inventory alternative depends on
the MCDM procedure. ANP selects scenario 3 for A-items because this method allows
to compensate the slight decrease in service level with reduced costs and improved
turnover rate. The ANP-PROMETHEE II method, on the other hand, is non-
compensatory in nature and therefore reinforces this trade-off by ranking scenario 2
with the highest service level at the top. For less critical items, both methods agree on
the highest-ranked policy, whereas a change occurs in the adjacent lower ranks
depending on the trade-off between service level and costs or turnover. Although the
ranking differs for inventory management, both improvement alternatives present
significant cost savings and turnover improvements, such that the final choice depends
on the nature of the decision-maker, who is more risk-averse or risk-taking. Since the
PROMETHEE II method takes into account ANP weights, the ILEP index is assumed
to present a robust ranking.
Figure 6-10. ANP vs. PROMETHEE II ranking for inventory (left) and distribution (right)
policies.

CHAPTER 6
218
Secondly, a sensitivity analysis is conducted by varying the weights assigned to the
indicators (Diaby and Goeree 2014). ‘Visual PROMETHEE’ proposes an interactive
tool, namely ‘walking weights’. A value for an indicator weight is arbitrarily chosen,
and the other weights are adjusted accordingly. This analysis allows to assess within
which stability interval the weights can change without adapting the final ANP-
PROMETHEE II ranking. The smaller the interval of the indicator weight, the greater
its impact on the ranking. Table 6-2 displays the stability intervals for each indicator
for each process type.
For controlling inventory of A-items, there is a change in the first-ranked alternative
(i.e. scenario 2) if service level weight decreases below 6% or if cost or turnover
become very important (i.e. 83% or 95% respectively). Since A-items are classified to
be critical high-cost items, the service level will always have top priority, and thus
probability of changing the final ranking is small. In contrast, for C-items, the stability
intervals are smaller, or in other words, the indicator weights have more impact on the
ranking. Figure 6-11 presents the net outranking flows. Whenever the inventory
service level weight increases by 10%, the As-Is scenario is preferred over scenario 2.
However, service level weight is expected to decrease as the items are less critical. A
drastic decrease to 9% will change the ranking in favour of scenario 3, where cost
savings and improved turnover compensate for the reduced service level. From a cost
perspective, small changes in the weights results in an interchange of the second and
third rank (i.e. As-Is and scenario 3) unless costs become the main objective (i.e. 72%),
then scenario 3 outperforms scenario 2.
In terms of distribution systems, distribution service level, clinical staff involvement
and delivery frequency have the greatest impact on the ranking. However, the best
policy in the ranking is only changed when delivery frequency gets more important
(i.e. 27%). In this case, Copy carts scenario is preferred over Standard scenario. In
general, modifying the weights of all other indicators does not change the ranking, or
only changes in adjacent ranks 2 and 3. Therefore, we can conclude that the best policy
does not become the worst one, and vice versa, and thus, the framework is considered
to be robust.

MULTI-LEVEL MULTI-STAKEHOLDER FRAMEWORK VALIDATION
219
Table 6-2. Stability intervals for the weights of each criterion.
Criteria Stability
interval
Criteria A-items Stability
interval
Distribution service level
0 33 Inventory service level
6 94
Delivery accuracy 0 47 Inventory cost 0 83
Centralization 0 79 Turnover 0 95
Lead time 0 80
Response time 0 92
Clinical involvement 0 22 Criteria C-items Stability
interval
Cost 0 43 Inventory service level
48 70
Delivery frequency 0 27 Inventory cost 0 26
Standardization 0 100 Turnover 21 46
Personnel management 0 94
6.4.3 Benchmarking
In this section, benchmarking allows to compare logistics performance measurement
efforts between different hospital departments, depending on the material types used.
Benchmarking opportunities are identified by analysing how far the As-Is situation
deviates from the desired performance score, and thus highlights those areas that are
under-performing or misaligned. The best practice frontier contains the ideal
performance score, which defines the best set of KPIs to achieve operational
excellence in healthcare logistics. Figure 6-12 displays the As-Is performance score
Figure 6-11. Impact on ranking by changing inventory weights for C-items.

CHAPTER 6
220
for managing inventory systems at the OT, which is calculated as a weighted average
of ANP weights and a score of 1-5. Different performance shapes and sizes can be
observed for two reasons:
First, multiple stakeholders use different definitions for the indicators and
strive towards different objectives. As a consequence, the extent to which
KPIs are monitored is often biased by the decision-maker’s attitude, leading
to possibly conflicting performance scores. This work aims to solve the
disagreement among stakeholders on how to measure the indicators.
Second, the relative importance of indicators differs between different
stakeholders, even if they belong to a similar stakeholder group. Inventory
service level seems to outperform the other indicators, though the peak is
mainly caused by the high ANP weight factor (i.e. 0.229) assigned to this
indicator rather than a high performance score (i.e. 2.5 on 5). Due to this high
relative importance, service levels should be monitored closely in order to
achieve operational excellence. The same trend can be found in each
department, so we can conclude that service level plays a crucial role in
healthcare logistics in general. Moreover, a big difference can be observed
when measuring inventory criticality, which is mainly due to varying ANP
weights between the logistics stakeholders.
Figure 6-12. As-Is performance score of inventory indicators at OT.

MULTI-LEVEL MULTI-STAKEHOLDER FRAMEWORK VALIDATION
221
The radar plot in Figure 6-13 compares performance measurement in three
departments. The overall OT, IRCC and pharmacy weights are used as general ranking
(see Table 6-1). Therefore, differences in the radar plots are only due to differences in
performance monitoring scores rather than varying importance. The OT setting is
centred with an average total performance rate of 43%, whereas the performance
shapes for pharmacy and IRCC department are larger, 66% and 64% respectively. The
low performance score for the OT disposables (see blue line: Average As-Is score OT
in Figure 6-13) is mainly attributable to poor monitoring of productivity indicators,
though these indicators contribute greatly to efficient inventory management. As
mentioned in Section 5.2.2, 90% of the items stored at the OT are normal- to slow-
moving items with a low turnover rate, and the consumption rate is not recorded due
to inability of track-and-tracing. Also, lack of inventory visibility complicates efficient
inventory management. The pharmacy (see grey line: As-Is score pharmacy) scores
especially good on the inventory quality indicators, which are also highly valued as
shown in Section 6.4.2 due to strict legal regulations for drugs management.
Furthermore, the expensive invasive materials (see yellow line: As-Is score IRCC)
perform well in terms of recording consumption rate and managing stock rotation.
These indicators are more important because the items are directly charged to patients,
waste due to product expiry must be minimized and these items are allocated to space
close to the operating rooms resulting in high opportunity costs.
To achieve operational excellence, the three settings strive towards an average
performance rate of 85% by focusing mainly on inventory service level, accuracy and
productivity indicators. Criticality also contributes greatly to operational excellence by
balancing inventory levels and patient safety requirements. This ideal percentage is set
by taking into account the strategic and tactical mission of the organisation in this case
study. Figure 6-13 compares the As-Is and To-Be performance scores for managing
inventory systems. The ideal score for the OT and pharmacy (orange line) are
combined as we only consider pharmaceutical supply delivery to the OT in this case
study, whereas the IRCC (green line) operates independently. The best-practice
frontier allows the performance scores to increase by 42%, 17% and 21% for
disposables, pharmaceuticals and invasive supplies respectively, up to the optimal
score. The study shows that no records are made for incoming and outgoing flows of
surgical disposables, which results in typical issues such as overstocking, lack of
inventory visibility or high value of product expiry. Poor performance on these
indicators results in lower quality and therefore, hospitals must strive for qualitative

CHAPTER 6
222
inventory systems to improve efficiency while maintaining high service levels.
Pharmaceutical supplies, on the other hand, are strictly regulated resulting in more
information on the inventory status. However, actions are required to improve
productivity or organisation of the materials flow to the OT. In addition, supply
consumption during surgery is not properly recorded, except for invasive medical
supplies which are used at the IRCC department and are accountable to the patient’s
invoice. As a result, cost information per surgery is inaccurate, which might lead to
overall loss when costs exceeds the revenues. Altogether, hospitals face many
obstacles and resistance to adopt SCM techniques, standardize supplies and implement
information technology systems which would improve integration among departments.
By identifying these improvement initiatives, hospitals can improve supply tracking,
contain costs and facilitate inventory control.
Similarly, Figure 6-14 shows the benchmarking analysis for internal distribution
systems in hospitals. The distribution ranking is considered to be context-specific, and
therefore multiple rankings are used considering the perspectives of OT, pharmacy and
IRCC stakeholder groups. The goal, as determined by upper management, is to achieve
Figure 6-13. As-Is vs. To-Be performance score of inventory indicators for each department.

MULTI-LEVEL MULTI-STAKEHOLDER FRAMEWORK VALIDATION
223
an overall performance score of 86% for surgical disposables and pharmaceuticals
(blue line). However, waste in current distribution practices result in an average score
of 62% (yellow line) and 67% (green line) respectively and thus leaves room for
efficiency improvement. Delivery accuracy, distribution service level and process
standardization have the highest weighting factors, and thus contribute most to
achieving efficient distribution systems. However, the performance scores are
moderate which presents significant improvement initiatives. From a time perspective,
the indicators perform quite good. Clinical staff involvement is limited, enabling
medical personnel to focus on their core activities. Finally, working towards up-to-date
surgical case carts, uniform workflows and a balanced workload for personnel will
enhance the productivity or organisation in the OT supply chain. Especially,
standardizing processes by introducing information technology systems will increase
the efficiency in the distribution flow. Similar trends are observable for the IRCC
department (brown line), where the performance shape is oriented towards initiatives
improving standardization, balancing workload and timely delivering supplies to the
right locations.
Figure 6-14. As-Is vs. To-Be performance score of distribution indicators for each department.
CHAPTER 6
224
6.5 Discussion
This study represents the final link in the framework development by providing three
feedback loops to integrate multi-level, multi-stakeholder perspectives. The prototype
as developed in Chapter 4 provides insights on how logistics can service healthcare
systems, and hence stimulates more informed decision making among all stakeholders
from a logistics perspective. Based on this understanding, different stakeholders’
objectives and viewpoints are quantified and alternative logistics concepts are
evaluated using the logistics performance management framework. Involving
stakeholders in the final development phase of the framework is a crucial success
parameter for increasing awareness of logistics benefits in hospitals and implementing
efficiency improvement initiatives. This is in contrast to early-participation, where
stakeholders have no knowledge of how logistics contribute to a value-based
healthcare system and as a consequence strive for the objectives that maximize their
own benefits.
6.5.1 Feedback loop 1: individual versus shared stakeholder
ranking using ANP
The first feedback loop allows for eliciting multiple stakeholders’ preferences to
determine individual and shared rankings of KPIs, generalizing the elements that
constitute the definition of operational excellence in healthcare logistics. To ensure a
valid framework, group decision making enhances consensus on which performance
indicators are relevant for evaluating the internal logistics flow in hospitals. The ANP
methodology supports shared decision making by engaging stakeholders in
participatory processes to value and prioritize multiple outcomes or indicators
(Hummel et al. 2014).
Regardless of the process or material type, improving performance management will
enhance the generalizability of the findings. The formulas, as presented in Chapter 5,
ensure uniform measurements and thus allow for comparing different hospital
departments and pursuing operational excellence to the benefit of value-based
healthcare. In addition, the logistics indicators are verified by medical stakeholders to
enhance awareness of logistics benefits and to provide insights on tailoring SCM
techniques to a healthcare setting. The findings in Table 6-1 reinforce the well-known
trade-off, namely service levels need to be maximized without considering the costs,

MULTI-LEVEL MULTI-STAKEHOLDER FRAMEWORK VALIDATION
225
which are ranked as least important. However, recent trends force hospitals to cost
containment without compromising on quality of care. Thus the logistics performance
management framework serves as a powerful tool to support managerial decision
making, while considering multiple stakeholder perspectives, to identify improvement
initiatives and streamline the internal hospital supply chain.
The overall ranking integrates multi-level group decision making, and therefore
possibly conflicting preferences must be solved. A quantitative approach is used to
allocate weights to stakeholders. In this study, the stakeholders are clustered according
to their similarity as introduced in Chapter 4 (Song and Hu 2009). The number of
stakeholders allocated to a cluster determines the cluster weight. Next, the overall
ranking is computed using the WAM or WGM from Equations 6.1 and 6.2. The WGM
accounts for the central tendency and thus results in a more stretched ranking compared
to WAM. In other words, the most important indicators are assigned a higher score and
the least important indicators get a lower score compared to WAM, where all scores
are averaged. Figure 6-15 shows minimal differences between both approaches. In this
work, we use WAM for computing the overall ranking because WGM often ignores
smaller clusters, which is not desirable for the small sample size in this case study.
Further work could reconsider the group decision making approach by determining
stakeholder weights in terms of the nature of the respective indicators and the expertise
to judge the indicator. The weights can be obtained by identifying the relative
importance of decision makers by pairwise comparisons, or by a supra-decision-
maker, who defines the individual stakeholder weights (Rietkötter 2014). The limited
number of stakeholders is a shortcoming in this case study, where one stakeholder
sometimes represent an entire department. For further research, we suggest to validate
the overall ranking using a qualitative procedure. The Delphi method as suggested by
Freitas et al. (2018) and Falzarano and Pinto Zipp (2013) provides a useful web-
platform for monitoring stakeholder participatory processes in order to generate
consensus by going through several iteration rounds. This socio-technical multi-
criteria approach aims to create collective alignment while developing a sound and
coherent model of values synthesizing the multiple perspectives (Vieira et al. 2019).
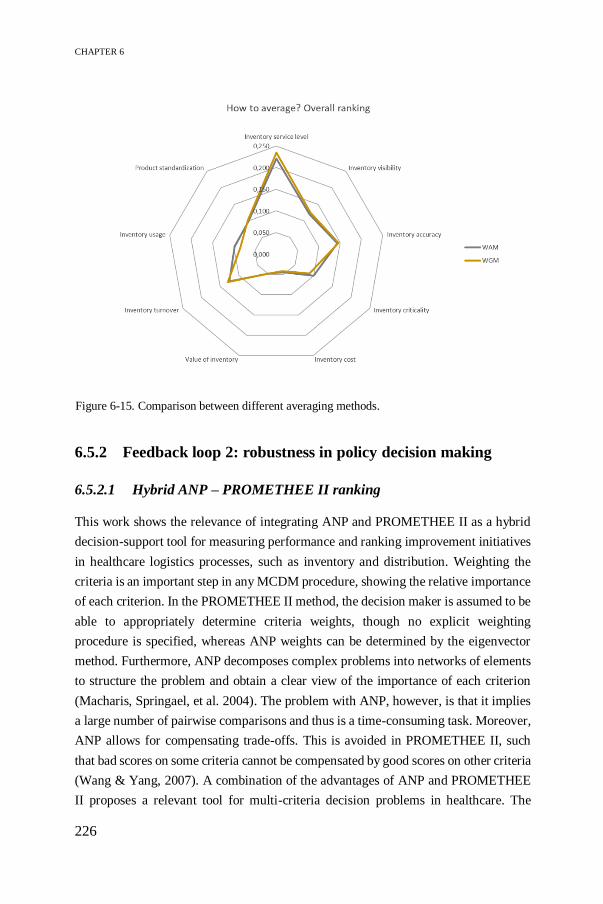
CHAPTER 6
226
6.5.2 Feedback loop 2: robustness in policy decision making
6.5.2.1 Hybrid ANP – PROMETHEE II ranking
This work shows the relevance of integrating ANP and PROMETHEE II as a hybrid
decision-support tool for measuring performance and ranking improvement initiatives
in healthcare logistics processes, such as inventory and distribution. Weighting the
criteria is an important step in any MCDM procedure, showing the relative importance
of each criterion. In the PROMETHEE II method, the decision maker is assumed to be
able to appropriately determine criteria weights, though no explicit weighting
procedure is specified, whereas ANP weights can be determined by the eigenvector
method. Furthermore, ANP decomposes complex problems into networks of elements
to structure the problem and obtain a clear view of the importance of each criterion
(Macharis, Springael, et al. 2004). The problem with ANP, however, is that it implies
a large number of pairwise comparisons and thus is a time-consuming task. Moreover,
ANP allows for compensating trade-offs. This is avoided in PROMETHEE II, such
that bad scores on some criteria cannot be compensated by good scores on other criteria
(Wang & Yang, 2007). A combination of the advantages of ANP and PROMETHEE
II proposes a relevant tool for multi-criteria decision problems in healthcare. The
Figure 6-15. Comparison between different averaging methods.

MULTI-LEVEL MULTI-STAKEHOLDER FRAMEWORK VALIDATION
227
relative importance of the weights are determined using the ANP method, serving as
an input to find the best alternative by going through the different steps of the
PROMETHEE II method. A crucial step in the PROMETHEE II methodology
involves defining preference functions for all indicators, which determines the
indicators’ thresholds and hence affects the final outcome of evaluation. The choice of
preference function is not supported by any guidelines, but is an arbitrary choice based
on the indicator characteristics and decision maker preferences. Depending on the
nature of the indicators, linear and level preference functions are suggested for
quantitative and qualitative indicators respectively (Abdullah et al. 2019). The
threshold parameter values are set based on the suggestion by ‘Visual PROMETHEE’,
which takes into account the individual judgment of experts.
The ranking obtained by analysing the net outranking flow values using the ANP-
PROMETHEE II methodology learns that most stakeholders tend to converge their
preferences, and thus increase awareness of the logistics impact to value-based
healthcare and strive for integrated inventory and distribution systems in the OT.
However, some discrepancies occur among stakeholders when selecting an appropriate
inventory policy for C-items (see Figure 6-6). Items classified in group C are
characterized by lower costs, low criticality and are less frequently used. However, the
ANP weight for service level remains top priority regardless of the inventory
classification. As a consequence, this weight dominates the ranking and hence policy
decision making, even though lower service levels suffice for C-items. Medical
personnel strives towards maximal availability by having items on-hand at all times.
No distinction is made between different inventory classes, though a lower service
level for C-items still guarantees high-quality of patient care. Reassigning weights
based on characteristics of the inventory items is an interesting opportunity for future
research, such that policy decision making is aligned with inventory classification.
Moreover, the framework increases evidence-based decision making, such that
medical personnel strives towards the overall goal of value-based healthcare that
balances care and logistics processes.
In addition, the framework is qualitatively assessed. Although stakeholders are
informed about the potential benefits of inventory and distribution policies based on
simulation models, a biased attitude remains when judging the importance of the
inventory indicators. Surprisingly, the logistics stakeholders prefer the least efficient
As-Is scenario, which is in conflict with their ANP weights as shown in Figure 6-3. A
plausible explanation could be misinterpretation of how the indicators relate to the

CHAPTER 6
228
logistics policies. For distribution, on the other hand, the information proves to be
valuable when defining efficiency gains. Further research should focus more on
practice-based SCM implementation programs and informing decision-makers of the
logistics impact on overall healthcare performance by promoting stakeholder
participation in logistics optimization processes.
Finally, the GAIA analysis is a powerful graphical tool to quantify trade-offs by
determining differentiation power and conflicting criteria. However, keep in mind that
Principal Components Analysis is applied to construct a two-dimensional plane in
Figure 6-8, and thus the aim is to cover the highest possible percentage of information
to improve reliability. The information covered by the GAIA plane guides hospital
practitioners and academics to understand the trade-offs and identify the best set of
KPIs to improve efficiency in the internal OT supply chain.
6.5.2.2 Sensitivity analysis
The criteria weights play a major role in any MCDM study, and therefore it is essential
to perform a sensitivity analysis. The framework is considered to be robust, because
the indicator weights can be modified considerably without changing the best
alternative in the ranking or by changes only in adjacent ranks. Moreover, ANP and
PROMETHEE II provide similar results in general. Some deviations can be observed
because ANP allows for compensation, which is ignored in PROMETHEE. A
distinction can be made between the PROMETHEE I partial ranking and
PROMETHEE II complete ranking.
The partial ranking is defined by the intersection of two, possibly non-identical
rankings, which are deduced from the positive and negative outranking flows (Brans
et al., 1986). For example, when selecting inventory policies for C-items from the
nurses’ perspective, the As-Is and scenario 2 are incomparable alternatives due to
conflicting indicators. The As-Is dominates the other alternatives in terms of service
level, but scenario 2 has a lower weakness (i.e. less negative outranking flow) because
the As-Is is dominated more in terms of costs and turnover. Therefore, two non-
identical partial rankings can be observed in Figure 6-16, where the decision-maker
should decide on the best policy.

MULTI-LEVEL MULTI-STAKEHOLDER FRAMEWORK VALIDATION
229
Alternatively, the PROMETHEE II complete ranking finalizes the decision by
balancing the two outranking flows. Although the information is more disputable, the
complete ranking from the nurses’ perspective prioritizes the As-Is over scenario 2
(see Figure 6-6) and thus the difference in service level does not compensate for the
cost and turnover improvements. A similar trade-off is made in the inventory ranking
for the OT stakeholder group, though the cost and turnover improvements compensate
for the reduced service level due to different indicator weights. As a result, scenario 2
is ranked first. ANP also ranks scenario 2 first for C-items (see Figure 6-10), however,
there is a change in the adjacent ranks 2 and 3 between both MCDM methods. The
ANP-PROMETHEE II method prioritizes the As-Is scenario over scenario 3 due to
the high weight assigned to inventory service level. As a consequence, there is no
compensation for the cost savings or turnover improvements. Figure 6-11 indicates
that a decrease in service level weight to 8% adjusts the ranking in favour of scenario
3. The ANP-ILEP index, on the other hand, prefers scenario 3 at the initial weights
because the improvements in costs and turnover rate compensate for the reduced
service level. In further research, the sensitivity analysis can be extended by calculating
the final ranking multiple times using different preference functions, and thus
exploring the dependence of evaluation results on the choice of preference function
types and their parameters (Podvezko and Podviezko 2010).
Figure 6-16. The partial PROMETHEE I ranking for inventory policies of C-items.

CHAPTER 6
230
6.5.3 Benchmarking
Benchmarking is a powerful tool for performance evaluation (Ozcan 2014). Feibert et
al. (2017) identify the most important decision criteria and suggest performance
metrics to enable benchmarking in healthcare logistics processes by comparing bed
logistics and pharmaceutical distribution in Danish and US hospitals. Inspired on these
case studies, we provide insights on the current practice of performance measurement
in healthcare logistics and which KPIs are best-in-class indicators when designing
effective inventory and distribution policies in different departments. The analysis
considers benchmarking between three material flows – surgical disposables,
pharmaceuticals and invasive supplies – and supports decision making by identifying
KPIs which need close monitoring to reduce the gap to the ideal performance score.
This best set of KPIs (i.e. ideal performance score) is located on the outer frontier in
the radar plot, representing the highest performance scores while taking into account
multiple stakeholders’ perspectives. Depending on the material type, the extent to
which KPIs contribute to the efficiency definition differs and hence different logistics
policies constitute best practices among departments. Learning from best practices in
other departments and understanding the impact of logistics policies is pivotal to the
success of implementation and hence will improve overall hospital performance.
Volland et al. (2017) point out measurement of performance in hospital logistics as a
major research opportunity to promote continuous improvement. Healthcare
benchmarking is defined as “a continuous, systematic process of measuring products,
services and practices against organisations regarded to be superior with the aim of
rectifying any performance ‘gaps’” (Kouzmin et al. 1999). Further research should
evaluate performance management and best practice opportunities in other hospitals
as well as in maintenance settings which show similarities to healthcare logistics.
Altogether, the strategy for improving OT logistics performance should focus more on
quality and productivity objectives for inventory and distribution systems, since these
objectives constitute the most important elements of the efficiency definition as
obtained by the weights in the ANP procedure. An efficient inventory system also
enhances distribution performance by adopting efficient replenishment policies.
Depending on the process type or context, the priority of performance measures differs
and thus results in different best practices. The IRCC department is more productivity-
focused while maintaining high service levels, whereas the objectives of the OT and
pharmacy are quality-driven with increasing awareness for product and process
MULTI-LEVEL MULTI-STAKEHOLDER FRAMEWORK VALIDATION
231
standardization. Hence, the framework guides and supports decision-makers in
identifying context-specific improvement initiatives. The results can be extended to
healthcare logistics in general, as consistent results are found by Kritchanchai et al.
(2018), who emphasize the need for efficient inventory management and effective
information systems. Their strategy for improving healthcare logistics performance
focuses on four KPIs: inventory availability, inventory visibility, track-and-traceability
and standardized product identification. Feibert et al (2017) also focus on the quality
aspect, employee engagement and security of supplies as important decision criteria in
the literature on healthcare logistics benchmarking.
A remark should be made that the ideal performance score does not equal the
maximum performance score (i.e. 100%) in this case study. The logistics manager is
responsible for managing decentral wards, and therefore the ideal performance scores
reflect the strategic or tactical goals for efficiently managing internal supply chain
activities. Typically, a large part of hospital logistics flows (e.g. central warehouse) is
outsourced to a third-party logistics provider in order to focus on core activities. The
framework also applies to outsourcing decisions as monitoring KPIs is required for
effective performance management, regardless of who is responsible. Moreover, the
framework supports the logistics manager when negotiating the KPI measures and
standards with the external provider. For example, using a holding cost percentage
rather than a detailed cost breakdown structure suffices for monitoring the inventory
cost within the hospital, resulting in a To-Be performance score of 3 on 5.
Another drawback when measuring performance in hospitals relates to lack of data and
thus subjectivity in stakeholder judgments. As a consequence, different stakeholders
assess the current situation from their logistics or medical perspective. For example,
the logistics stakeholders rank inventory service level as the most important indicator
for handling surgical disposables. However, the scores for this indicator vary from bad
to moderate, resulting in a similar performance peak in the radar plot, though with a
different size. Therefore, more attention is needed to uniformly measure performance
indicators in a healthcare logistics setting in order to identify appropriate action plans.

CHAPTER 6
232
6.6 Conclusion
This study investigates the robustness of the framework by providing three feedback
loops to integrate multi-level, multi-stakeholder perspectives.
The first feedback loop involves eliciting stakeholder preferences by iterating between
the indicators and determining aggregated KPI rankings. The results show conflicting
rankings due to different professional backgrounds, decision-making levels, process
types and material characteristics. In terms of inventory management, consensus is
achieved on high-ranked indicators and thus a general ranking is proposed. The
distribution ranking, on the other hand, diverges among the stakeholder groups and is
considered to be context-specific. Regardless of the process type, improving
performance management will enhance the generalizability of the findings by
quantifying how logistics processes contribute to value-based healthcare. In addition,
the multi-stakeholder analysis improves transparency by dealing with the problem
from multiple viewpoints.
A second feedback loop to refine the framework relates to policy decision making. A
decision-support model is proposed integrating ANP and PROMETHEE II. The hybrid
method provides a powerful tool to quantitatively support practitioners and academics
in ranking improvement initiatives, making more informed and rational decisions, and
quantifying trade-offs when adopting SCM concepts in healthcare. The findings
reinforce the well-known trade-off, namely service levels need to be maximized
without considering the costs, which are ranked as least important. The impact of
changing criteria weights on the final ranking is examined by performing a sensitivity
analysis. Minor changes reflect a robust ranking. Although the hybrid MCDM
approach provides robust results, the awareness of the logistics impact on value-based
healthcare as well as physician engagement is at a low level of maturity, resulting in
decision making based on intuition.
Third, the proposed framework provides a good foundation for evaluating logistics
performance gaps between different hospitals or departments, and thus enables
benchmarking. The benchmarking study provides insights for decision makers to
identify which objectives and indicators are important for designing efficient logistics
processes and determining best practice opportunities in healthcare logistics.
Moreover, the performance gaps focus attention on which data to collect in order to
appropriately monitor the relevant KPIs. In addition, the benchmarking analysis can

MULTI-LEVEL MULTI-STAKEHOLDER FRAMEWORK VALIDATION
233
be extended by including more operational data, rather than measuring the extent to
which indicators should be monitored to become more efficient.
In further research, domain experts will assess the validity of the results. The
collaborative nature of this study improves the degree of confidence the experts have
in the findings and thus improves logistics awareness in healthcare. Consulting several
stakeholder perspectives enhances staff commitment and ensures robust results. Future
work should focus on supply chain integration by aligning inventory and distribution
policies to the benefit of value-based healthcare. The methodological approach can be
extended to a wider healthcare logistics context as an interactive decision-support tool,
engaging multiple stakeholders with conflicting perspectives.

234

235
CHAPTER 7
7 Roadmap for implementation of the
framework7
Chapter 7 presents the healthcare logistics performance management
framework by bringing together the four modules discussed throughout this
dissertation. We explain how the framework works and we present a real-
life application to enhance trust building in the framework. Finally, an
implementation roadmap provides guidelines both for scholars and
healthcare practitioners to apply the framework on a wider scale in
healthcare logistics, without rebuilding from scratch.
7.1 Introduction
SCM plays an important role in the current transition from volume-based to value-
based healthcare. In contrast to the traditional financial model focusing on fee-for-
services and isolated care, the new fee-for-value model aims to balance qualitative
patient outcomes and healthcare expenses by encouraging coordination between
logistical and care processes across the healthcare continuum. From a logistics
perspective, however, healthcare organisations lack data and tools for containing costs
and thus delivering value-based care (Deloitte 2018b). A data-driven approach is
needed to evaluate logistics processes, monitor performance and gain actionable
insights to support decision making within the hospital supply chain.
7 This chapter partially corresponds to the following paper:
Moons, K., Waeyenbergh, G., De Ridder, D., Pintelon, L. (2020). A Framework for Operational Excellence in
Hospital Logistics: Implementation Roadmap. Health Care Management Science, Submitted.

CHAPTER 7
236
OR/OM is a rich field consisting of quantitative tools to support data-driven process
improvement. We present a toolbox to help healthcare stakeholders in understanding
SCM and increase awareness of logistics processes, which in turn will improve
stakeholder commitment and have an impact on the overall hospital performance. The
included tools originate from industrial engineering applications in the field of
OR/OM, such as decision-making methods, inventory control models, simulation
modelling, performance management, etc. However, transferring successfully applied
SCM tools from other sectors is not a simple copy-paste due to the unique challenges
inherent to the internal hospital supply chain. We aim to support decision making and
address the barriers to effective healthcare SCM by integrating the toolbox into a
healthcare logistics performance management framework that identifies efficiency
improvement opportunities and adapts best practices to the healthcare logistics needs.
With this framework we create a proof-of-concept, though the actions required for real-
world implementation cannot be neglected since it determines how the results
contribute to healthcare performance (Brailsford et al., 2019). The remainder of this
chapter discusses the framework, its building blocks, potential applications as well as
guidelines for implementing the framework in any healthcare logistics setting.
7.2 Healthcare logistics performance management
framework
We develop a healthcare logistics performance management framework to adopt SCM
strategies as a first step towards achieving operational excellence at the internal
hospital supply chain and accordingly delivering value-based care. “Operational
excellence is achieved through the use of best inventory management and distribution
systems, combined with continuous supply chain process improvements and better
integration with the patient care process” (Landry and Beaulieu 2013). We distinguish
between two components in the conceptual framework, namely healthcare logistics
and performance management:
Healthcare logistics is defined as “design, planning, implementation and
control of coordination mechanisms between supplies, equipment, services
and information from suppliers to point-of-care in order to enhance clinical
outcomes while controlling costs” (Di Martinelly, 2008). More particularly,
this work focuses on materials planning, including storage and distribution of
disposable medical supplies to achieve operational excellence.
ROADMAP FOR IMPLEMENTATION OF THE FRAMEWORK
237
Performance management allows to understand the current system and
identify deficiencies, where performance indicators are used to monitor how
well the organisational goals are realized. In contrast to the fragmented
logistics responsibilities in hospitals, effective performance management
requires an integrated approach to control the supply chain strategy,
implement continuous improvement programs and improve decision-making
capabilities by focusing on relevant KPIs (Maestrini et al. 2017).
The healthcare logistics performance management framework is designed as a modular
structuring platform to provide decision support for applying industrial engineering
tools in order to determine the extent to which logistics contribute to healthcare. Four
modules or building blocks are designed with a special focus on describing and linking
the criteria to assess efficiency improvements. These modules are considered as critical
success factors for effective performance management by translating strategic or
tactical goals into operational indicators and establishing interdependency
relationships to account for a system-thinking perspective when adopting SCM
strategies that fit the specific context needs. Moreover, the cyclical feature in the
framework allows to iterate between the modules by bringing together all stakeholders’
perspectives in order to ensure SCM is tailored to the unique healthcare setting and
continuous improvement is supported to achieve the desired output according to the
organization’s goals. The framework addresses three barriers to adapt SCM to the
healthcare specificities:
Increasing transparency: through information-sharing across the healthcare
continuum. The framework guides healthcare managers to collect the right
data for KPI monitoring and thereby reducing uncertainty in decision making.
Reducing supply chain fragmentation: by transforming silo-based
practices into integrated supply chain processes provides a competitive
advantage, and therefore the framework also stimulates strategic thinking
(Maestrini et al., 2017).
Introducing common language for stakeholders: through uniform
performance measurement results in more informed decision making and
increased awareness of logistics impact to value-based healthcare. Hence, the
framework strives towards alignment between patient care and logistics by
implementing cost-effective, standardized processes.
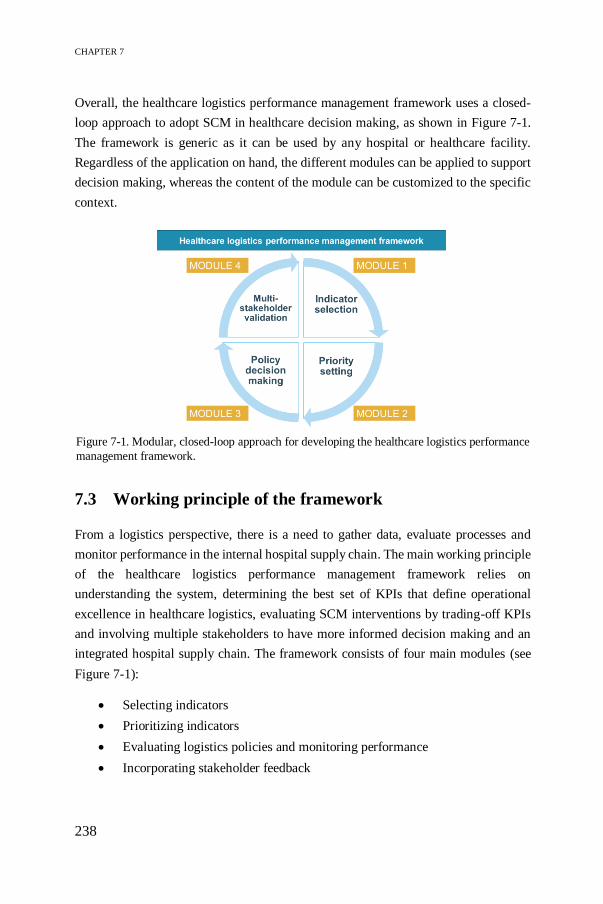
CHAPTER 7
238
Overall, the healthcare logistics performance management framework uses a closed-
loop approach to adopt SCM in healthcare decision making, as shown in Figure 7-1.
The framework is generic as it can be used by any hospital or healthcare facility.
Regardless of the application on hand, the different modules can be applied to support
decision making, whereas the content of the module can be customized to the specific
context.
7.3 Working principle of the framework
From a logistics perspective, there is a need to gather data, evaluate processes and
monitor performance in the internal hospital supply chain. The main working principle
of the healthcare logistics performance management framework relies on
understanding the system, determining the best set of KPIs that define operational
excellence in healthcare logistics, evaluating SCM interventions by trading-off KPIs
and involving multiple stakeholders to have more informed decision making and an
integrated hospital supply chain. The framework consists of four main modules (see
Figure 7-1):
Selecting indicators
Prioritizing indicators
Evaluating logistics policies and monitoring performance
Incorporating stakeholder feedback
Figure 7-1. Modular, closed-loop approach for developing the healthcare logistics performance
management framework.

ROADMAP FOR IMPLEMENTATION OF THE FRAMEWORK
239
7.3.1 Selecting indicators
The first module in the framework is concerned with defining a set of criteria to
measure the performance of the internal hospital supply chain. Based on a literature
review and in consultation with healthcare logistics experts, performance indicators
are assigned to four objectives – quality, time, cost and productivity/organisation –
representing the multi-dimensional character of SCM. More particularly, the indicators
are customized to assess the impact of two managerial functions or process types,
namely a set of 9 and 12 indicators for monitoring storage and distribution of
disposable medical supplies respectively. To obtain effective performance
management, the objectives need to be aligned with the performance indicators as
considered relevant to the managerial function. Choosing the right indicators is
essential to meet the objectives and build a widely applicable foundation for the
framework. The selected indicators must comply to the following specifications
(Marsh et al., 2016):
Exclusive: ability to distinguish among alternatives
Complete: justify clear definition covering the full range of factors relevant
to decision making
Non-redundant: avoid unimportant or unnecessary information
Measurable: provide operational and meaningful information to decision
makers
According to Marsh et al. (2014), the number of indicators ranges between 3 and 19 to
assess the value of healthcare interventions. The larger the number of indicators
included, the more complete the set of indicators, though it requires more time and
cognitive effort for both model developers and decision makers. Furthermore, the
framework involves indicators as used in traditional logistics engineering concepts to
ensure uniform performance measurement, enable benchmarking opportunities and
learn from best practices. Having streamlined standards drives hospital management
to clearly define operational excellence, reduce barriers to SCM implementation and
support decision making on all organisational levels.
7.3.2 Prioritizing indicators
Since not all criteria are equally important in various hospital departments or
healthcare organisations, a prioritization step is needed to customize the indicator list.

CHAPTER 7
240
The inter-relationships between objectives and indicators are determined in
consultation with hospital logistics experts, whereas priorities are established using
MCDM techniques. ANP is a popular, easy-to-use MCDM method that is frequently
used for performance management, providing a synthesized value that reflects the
possibly conflicting logistics and medical goals in healthcare SCM. The performance
management framework strives towards value improvement considered as a shared
goal that unites the interests of all stakeholders (Porter 2010), and therefore the ANP
method aligns with the value-based care model.
ANP decomposes the decision problem into a generic network structure, referred to as
the ANP-based prototype, to assign relative weights by eliciting stakeholder
preferences and assess alternatives by trading off KPIs. The prioritization problem is
initially translated into a prototype to model different aspects of decision making in
hospitals materials management and improve understanding of the logistics impact to
value-based healthcare. The prototype only takes into account the expertise of the
logistics stakeholder to define the role of logistics in healthcare by aligning objectives
and indicators as considered relevant for the studied process. The outcome shows the
best set of KPIs to assess supply chain improvement interventions while striving for
operational excellence.
7.3.3 Evaluating logistics policies and monitoring performance
The generic network structure in the ANP-based prototype offers a starting point for
customization to various logistics needs. Therefore, the third module uses case studies
to experiment and gain insights into real-life problems and potential efficiency gains.
Improvement opportunities are identified as the desired consequence of monitoring the
relevant KPIs and developing logistics policies triggered by these KPIs in different
managerial areas.
The ANP-based prototype is combined with Discrete-Event Simulation modelling as
a sound basis for the reference framework (see Figure 7-2). DES helps to define
operations, map processes and analyse available logistics data in a structured way to
understand the current situation, identify bottlenecks and test several improvement
scenarios (Roberts 2011). The simulation output determines objective values for the
selected KPIs, which are prioritized using the ANP-based prototype. The Internal
Logistics Efficiency Performance (ILEP) index integrates these KPI values into a
multi-dimensional evaluation score. Hence, the ILEP index is the main output from

ROADMAP FOR IMPLEMENTATION OF THE FRAMEWORK
241
the hybrid ANP-DES tool to support data-driven process improvement by quantifying
trade-offs among the possible conflicting objectives (i.e. quality, time, cost and
productivity).
7.3.4 Incorporating stakeholder feedback
Finally, Figure 7-3 shows three external feedback loops to consider a broader
perspective and describe how the indicator selection and prioritization modules relate
to policy decision making and performance monitoring. The single decision-maker
perspective is extended to a multi-stakeholder, multi-level framework that ensures
SCM is tailored to the healthcare setting.
Figure 7-3. Incorporating three feedback loops to validate the multi-level, multi-stakeholder framework.
Figure 7-2. Hybrid ANP-DES tool to identify data-driven process improvement.
CHAPTER 7
242
In the first feedback loop, the indicators are verified by addressing potential conflicts
between multiple stakeholders using a clustering approach as proposed by Song and
Hu (2009). Stakeholders often have biased preferences due to fragmented logistics
responsibility in each department, their background (e.g. logistical, medical) or level
of control (e.g. operational, tactical, strategic). Via group decision making, ANP finds
a generic importance ranking of the indicators that constitute the definition for
operational excellence, dependent on the managerial function.
The second loop highlights the robustness of the framework as a transparent and
informed decision-making tool by promoting stakeholder commitment. A sensitivity
analysis is performed to increase the accuracy of the obtained ILEP index. The ILEP
index is compared to a hybrid ANP-PROMETHEE II method, which ranks the
logistics policies and identifies the characteristics of the best policy for the studied
application. Small deviations in the ranking of policies are attributed to the non-
compensatory nature of the PROMETHEE II method. However, compensation for the
high service level requirement is justified in any healthcare setting because the
productivity objective plays an intermediating role to neutralize the trade-off between
costs and service level by emphasizing the need for streamlined and integrated
workflows. Furthermore, a stability interval is determined for the indicator weights to
determine their impact on the choice of the best policy. The greater the interval, the
lower the impact and thus the framework and ILEP index are considered as a robust
assessment tool for SCM in healthcare. From a qualitative perspective, the framework
stresses the importance of stakeholder education to increase understanding of SCM,
which creates awareness of logistics and enhances stakeholder commitment. Hence,
the framework stimulates more informed decision making by providing a common
language for all stakeholders to maximize value contribution.
The two feedback loops discussed above provide insights on the extent to which
indicators impact policy decision making. A third feedback loop is added to identify
benchmarking opportunities and accordingly promote continuous improvement
programs. A comparison is made between the actual and ideal performance score to
identify the need for collecting the right data. Having accurate data availability is
essential input information for future work to validate the hybrid ANP-DES tool by
fine-tuning the modelling of the logistics policies and to ensure uniform ways of
monitoring the relevant KPIs. Uniform performance measurement allows for a
transparent comparison between operational efficiency and patient outcomes for value-
based healthcare.

ROADMAP FOR IMPLEMENTATION OF THE FRAMEWORK
243
Altogether, the closed-loop framework as shown in Figure 7-3 provides actionable
insights for both academics and healthcare practitioners to tailor SCM to the healthcare
setting, encourage effective communication between stakeholders and increase data
transparency for modelling SCM interventions.
7.4 Practice-based application of the framework
The developed framework guides healthcare organisations in making logistics
adjustments to solve deviations from the desired performance outcome. The decision
makers can act in different ways: do nothing, change policies, change objectives,
change KPI prioritization, etc. Do nothing is a viable alternative in case the expected
resistance to change in the organisation is too big. Implementing SCM in healthcare
requires evaluating the extent to which logistics contributes to qualitative patient care
based on stakeholder feedback. An overlooked logistics culture and lack of stakeholder
commitment at different levels of control are significant obstacles to implementation
(Ageron, Benzidia, and Bourlakis 2018). Moreover, only 5% of literature reports the
practical use of healthcare simulation modelling results compared to the large amount
of suggested or conceptualized models without input from healthcare practices
(Brailsford et al., 2009; Brailsford et al., 2019; Katsaliaki & Mustafee, 2011). In this
work, we present a framework with potential for practice-based applications. Case
studies are chosen as empirical research design to illustrate the feasibility of the
framework for understanding various logistics needs in hospitals, gain actionable
insights and generate a proof-of-concept on how logistics can contribute to value-based
care.
7.4.1 Testing the framework for internal distribution at the
operating theatre
This section presents a practice-based application of a SCM intervention at the OT in
order to gain new insights by bridging the gap between theory and practice. The
outcome of the framework is compared to a real-world implementation in order to
enhance trust building in the framework. Referring to Section 5.2.4, the framework has
been tested to evaluate replenishment systems for disposable supplies at the OT, by
focusing on the materials flow between central and decentral stocking locations while
reducing logistics activities close to the operating room. According to the ILEP index,
the Standard scenario outperformed the other replenishment policies by eliminating

CHAPTER 7
244
double stock and collecting consumption data on the operating room level. In practice,
the most efficient replenishment scenario (i.e. the Standard scenario) has been
implemented and significant efficiency gains are reported by comparing the historical
situation in 2017 (i.e. As-Is) to the current situation in 2019, which uses the Standard
replenishment policy. The stock on-hand and the inventory value (i.e. product of
average inventory level and unit cost) of disposable medical supplies are given for both
the central and decentral stock:
First, two inventory pictures are taken for 616 SKUs in the central storage
rooms, namely the CSA and OT1 stock, reflecting the As-Is (i.e. 2017) and
2019 situation based on one-year data for the same SKUs. The data reflect the
weekly replenishment activity. Figure 7-4 shows a decrease in the number of
CSA items held in stock due to eliminating double stock on replenishment
case carts in the Standard scenario. Accordingly, we observe a drop of 22%
in the CSA value. A stronger effect is observed for the OT1 storage room with
a 55% reduction in OT1 value, mainly because these items are on average
more expensive than CSA items. Based on the included SKUs in the dataset,
a saving of more than €65.000 has been realized on a weekly basis.
Figure 7-4. Comparison of central stock in 2017 and after implementing the Standard scenario
in 2019.
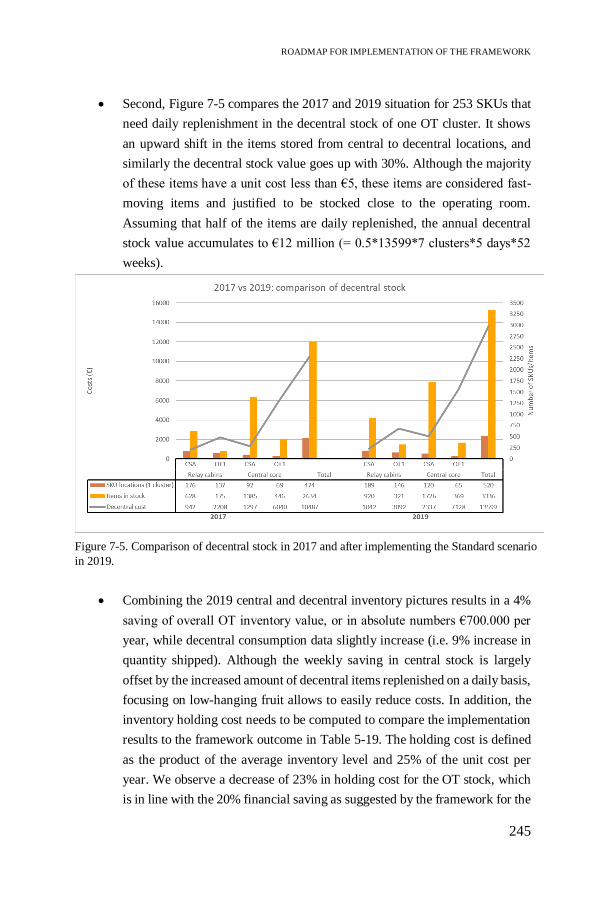
ROADMAP FOR IMPLEMENTATION OF THE FRAMEWORK
245
Second, Figure 7-5 compares the 2017 and 2019 situation for 253 SKUs that
need daily replenishment in the decentral stock of one OT cluster. It shows
an upward shift in the items stored from central to decentral locations, and
similarly the decentral stock value goes up with 30%. Although the majority
of these items have a unit cost less than €5, these items are considered fast-
moving items and justified to be stocked close to the operating room.
Assuming that half of the items are daily replenished, the annual decentral
stock value accumulates to €12 million (= 0.5*13599*7 clusters*5 days*52
weeks).
Combining the 2019 central and decentral inventory pictures results in a 4%
saving of overall OT inventory value, or in absolute numbers €700.000 per
year, while decentral consumption data slightly increase (i.e. 9% increase in
quantity shipped). Although the weekly saving in central stock is largely
offset by the increased amount of decentral items replenished on a daily basis,
focusing on low-hanging fruit allows to easily reduce costs. In addition, the
inventory holding cost needs to be computed to compare the implementation
results to the framework outcome in Table 5-19. The holding cost is defined
as the product of the average inventory level and 25% of the unit cost per
year. We observe a decrease of 23% in holding cost for the OT stock, which
is in line with the 20% financial saving as suggested by the framework for the
Figure 7-5. Comparison of decentral stock in 2017 and after implementing the Standard scenario
in 2019.

CHAPTER 7
246
Standard scenario. A discussion of the implementation results with all
stakeholders increases confidence in the framework, which in turn will
improve stakeholder commitment and align logistics and medical goals to
improve overall hospital performance.
It is important to note that the differences between the 2017 and 2019 situation are not
only attributable to implementing the Standard scenario in practice, as other parameter
values have also changed during the studied time period. Therefore, the improvement
cannot be interpreted as an isolated impact of adjusting the distribution system.
Effective materials planning requires integrated coordination of both inventory and
distribution systems. In addition, the studied application underestimates the real-world
savings due to a limited dataset (e.g. 616 out of 3241 SKUs included in the central
dataset). Lack of data availability is one of the largest obstacles to implement effective
performance management in the internal hospital supply chain. Although health
systems generate vast quantities of data, the quality of logistics data is often poor. The
output is unlikely to be informative if inaccurate or incomplete data is inserted in the
framework, or it can be stated as “garbage in, garbage out”. The framework guides
hospital management to collect the right data, which is a critical prerequisite for
creating a decision-support tool for adopting SCM in healthcare. Also, the scarcity of
right-skilled logistics staff hinders implementation of effective SCM. The framework
stimulates transparent decision making, however, lack of expertise and training
complicate the interpretation of the results. Finally, healthcare stakeholders often are
too busy dealing with today’s problems and have no spare money to invest in
improvement initiatives that will lead to future savings.
In general, research on healthcare logistics provides a fragmented picture of isolated
hospital processes, where the modelling is typically done by scholars without input
from healthcare practitioners. Our framework orchestrates supply chain integration,
encourages hospital stakeholders to identify data requirements for OR/OM modelling,
stimulates more informed decision making and enhances knowledge transfer to
increase SCM understanding. Identifying SCM implementation paths based on the
framework by combining performance measures and stakeholder information
enhances trust building in the findings. Overall, the framework guides hospital
management to identify areas of low-hanging fruit to easily increase efficiency by
addressing the unique SCM challenges, such as stakeholder commitment, OR/OM
training or standardization. In addition, disposable medical supplies are often

ROADMAP FOR IMPLEMENTATION OF THE FRAMEWORK
247
overlooked, though accumulating small bits results in significant savings and improved
hospital performance.
7.5 Level of replicability
From both a theoretical and practical point of view, the following question pops up:
“How can we use this framework on a wider scale in healthcare logistics”.
The level of replicability is a major academic concern addressed in literature, which
aims at maximizing the probability of reusing the framework and extending findings
to different settings without rebuilding from scratch (Monks et al. 2019; Uhrmacher et
al. 2016). The majority of healthcare frameworks focus on one managerial area or
hospital department (Hans et al. 2012), whereas we aim to develop a generic
framework that increases transparency by providing modelling details to both scholars
and healthcare practitioners for repeating the same process and achieving similar
results while orchestrating supply chain integration in hospitals. The ability to
customize the framework to various logistics needs significantly adds to the academic
value of this work by including information about the framework architecture in terms
of tools (e.g. ANP, DES) used and data requirements for modelling (Brailsford et al.,
2019). The modular building blocks as presented in Section 7.3 enhance the extent to
which the framework can be reassembled to fit to the specific context needs, regardless
of the data requirements. Moreover, stakeholder commitment is a crucial parameter to
ensure replicability of the framework, since incorporating stakeholder feedback by
adding iteration rounds to the framework development process improves confidence
in the findings to customize the framework to different needs. From a practical point
of view, we suggest to use the available software packages for visualizing features and
simple solutions rather than sophisticated black box operations in order to enhance
user-friendliness and encourage stakeholder participation. However, this work does
not provide any guidelines on selecting software as the modules in the framework are
software independent.
Our framework focuses on integrated coordination of inventory and distribution in
materials planning at the operating theatre. Aligning inventory and distribution
processes is essential to define parameter values for stock levels, identify where to
stock and when to replenish, reduce the reverse logistics flow, increase uniformity as
well as realize time and cost savings. The framework reflects the need for holistic SCM
by taking into account multiple aspects of decision making in hospital materials

CHAPTER 7
248
management and striving for supply chain integration. Hence, the framework is not
exclusively intended for addressing a single logistics need. The merit of the framework
lies in its generic nature and ability to customize to various departments, the entire
hospital or other managerial processes. The remainder of this section describes how
the different modules can be replicated for different departments (e.g. OT, emergency
department, hospital pharmacy, etc.) and processes (e.g. purchasing, demand planning,
resource management, etc.) as well as the extent to which the framework can impact
overall hospital performance. Finally, potential research avenues are suggested.
7.5.1 Implementation roadmap
We provide guidelines to successfully adopt SCM in different healthcare applications
using the framework as a starting point. The framework helps to incorporate the
OR/OM perspective in healthcare by transferring logistics concepts from other
industries, while accounting for the characteristics that are unique in care delivery
systems. The overall purpose is to structure the underlying problem situation using the
generic modules and support decision making by adapting the content to context-
specific needs. Figure 7-6 gives an overview of the steps that need to be undertaken to
effectively implement SCM interventions in healthcare. The implementation path
starts from a request for a logistics reengineering project in order to improve the
performance of the healthcare supply chain. The developed framework supports
decision making by understanding the current system, identifying bottlenecks and
performing a scenario analysis before implementing the most efficient solution.
Although the starting point varies depending on the problem description, following
this implementation roadmap will lead to transparent performance measurement and
finally a successfully integrated healthcare supply chain. We will describe ten steps of
the journey to understand how to apply these steps for practice-based implementations.
❶ Selecting indicators
The first step in the framework guides decision makers to derive a list of indicators for
measuring the performance of the processes included in the studied application. Based
on an extensive literature search and an additional discussion with healthcare logistics
experts, a maximum of 15 indicators are selected. The team of experts consists of
stakeholders on the tactical control level who are most experienced to interpret the
relevance of the indicators for the application in order to avoid potential conflicts or
biased attitude. For instance, logistical indicators are verified by the logistics/materials

ROADMAP FOR IMPLEMENTATION OF THE FRAMEWORK
249
manager who is responsible for tactical planning (e.g. what, where, how when and
who) for organising hospital operations. Moreover, the framework intends to create
uniform performance measurement by including traditional indicators as considered in
logistics engineering processes. Therefore, the same set of indicators is copied for a
similar process type in different departments.
❷ Constructing network with dependencies
Second, a network structure needs to be established using the ANP method by aligning
the objectives with relevant indicators and determining potential interdependencies.
The latter are defined by the healthcare logistics experts. For each process type, this
relationship is considered to be generic due to its traditional nature, and therefore it is
transferable to different hospital departments. For example, increasing the level of
safety stock will change the inventory turnover ratio, reduce the stock-out rate and
increase the capital tied up to stock.
❸ Prioritizing indicators
The next step in the ANP method aims to solve the prioritization problem according to
the logistics experts’ preferences. They determine how strong the objectives and
indicators relate to each other using Saaty’s 1-9 scale for pairwise comparisons (Saaty,
1990b). Context-specific characteristics, such as patient arrival rate, predictability or
complexity, are key drivers when setting priorities. The outcome of this step represents
the best set of KPIs that constitute the elements for defining operational excellence and
delivers a blueprint to customize the framework for reengineering the hospital logistics
processes. The ANP software ‘Super Decisions’ is used to capture and structure
stakeholder judgments into indicator rankings and examine the impact of changing
weights on the ranking.
❹ Mapping current situation
In the fourth step, Business Process Mapping tools provide a thorough understanding
of the problem situation, the people involved and the elements that have an impact on
the current system (Antonacci et al. 2018). Process flowcharts, swim lane diagrams or
value stream maps visualize the logistics flow and underlying bottlenecks are
identified in order to streamline processes and implement an efficient supply chain.
Moreover, adopting Lean management/Six sigma techniques (e.g. 5S) or Theory of

CHAPTER 7
250
Constraints principles enable to identify and eliminate non-value-adding activities
from a system-thinking perspective.
❺ Defining logistics scenarios
Based on the above system description, various scenarios are analysed to predict the
impact of possible future events on supply chain performance. The scenarios represent
alternative logistics policies or SCM tools, where the current (i.e. As-Is) situation acts
as a baseline scenario for comparing the potential logistics improvements. The highest-
ranked KPIs are considered to have the greatest contribution to realizing efficiency
gains. Healthcare SCM consists of a variety of traditional logistics tools for multiple
process types, such as EOQ or more sophisticated models for inventory control, Line
Balancing technique for distribution, vendor management for procurement, Systematic
Layout planning for hospital architecture, forecasting methods for demand planning,
etc.
❻ Modelling logistics processes
Next, the different scenario outcomes are modelled using simulation. DES is a popular
simulation method in the OR/OM toolbox because it enables simultaneous evaluation
of multiple KPIs to represent the multi-dimensional perspective of healthcare SCM.
Moreover, its visualization feature and user-friendly software programs (e.g. Arena,
Enterprise Dynamics, Simulink, etc.) encourage stakeholder participation. In addition,
simulation is a powerful method for scenario analysis and allows to compare different
SCM techniques (e.g. (R,Q) versus (s,S) inventory policy). The same simulation
model, however, does not apply to each healthcare setting, but requires context-
specific and structural modifications. The simulation logic can be reproduced to model
general inventory and distribution processes based on the included information about
the conceptual design, such as software used, system’s boundaries, data requirements,
assumptions, experimentation, etc. Modelling other process types is more challenging,
though the modellers can use the systematic approach for performing a simulation
study as a reference tool.
❼ Interpreting ILEP index
In step 7, the simulation outcome from the previous step and the KPI prioritization as
obtained in step 3 are integrated in an Excel worksheet. The hybrid ANP-DES tool
provides a reference platform for the decision makers to quantify trade-offs among

ROADMAP FOR IMPLEMENTATION OF THE FRAMEWORK
251
objectives and indicators, compute a weighted single performance score (i.e. ILEP
index) and identify the most suitable policy for the hospital supply chain. A higher
ILEP index represents a better performing SCM tool for the studied application. Until
now, however, the framework only takes into account input from the logistics-oriented
stakeholder at the tactical level based on his background, expertise and accessibility to
logistics data in order to increase awareness of SCM in healthcare and avoid potential
conflicts due to biased stakeholder preferences.
❽ Sharing information between stakeholders
Step 8 considers a broader perspective to ensure a more robust framework by
incorporating stakeholder feedback. Stakeholder feedback plays a key role to pave the
way for potential efficiency gains in future logistics applications and generate insights
to overcome SCM implementation barriers in healthcare. The outcome presented by
the hybrid ANP-DES tool serves as input for more informed decision making in
healthcare logistics by promoting stakeholder commitment. The single decision maker
attitude is extended to create a multi-level, multi-stakeholder framework that
represents the goals of each stakeholder group (i.e. logistics or medical background)
on each organisational level (i.e. strategic, tactic, operational). Visual Management
techniques, such as dashboards, are effective communication tools to enhance the
information flow by providing feedback of the process performance to all stakeholders.
Moreover, visual management stimulates continuous improvement initiatives
(Torghabehi et al., 2016). In addition, the future trend towards digitalization suggests
technological enablers, such as cloud-based platforms, to facilitate information sharing
among all stakeholders in the supply chain.
❾ Choosing best policy tailored to healthcare setting
Next, all stakeholders verify the indicators to ensure that the suggested logistics tools
are tailored to the healthcare setting. Based on the information on dashboards, the
stakeholders repeat step 3 to express their preferences using pairwise comparisons.
Although most of the stakeholders are not familiar with SCM tools, the Visual
Management techniques improve understanding of SCM without any need for
interpreting raw data. By stimulating more informed decision making, stakeholders
will develop a positive attitude towards the framework and build trust in the findings.
However, as long as stakeholders strive towards achieving their own objectives,
conflicts will occur which can be solved using a clustering approach (Song and Hu
CHAPTER 7
252
2009). On the other hand, consensus could be achieved by the Delphi method, which
is a qualitative web-platform for stakeholder participation to generate collective
alignment by going through time-intensive iteration rounds (Falzarano and Pinto Zipp
2013; Freitas et al. 2018; Vieira et al. 2019). Based on the generic KPI prioritization,
the logistics policy that best suits the specific application is selected as described by
the ILEP index in step 7.
❿ Benchmarking
Finally, the framework can be used as a benchmarking tool to enable continuous
improvement in the healthcare supply chain. The visual cues allow to monitor current
performance and how it deviates from the target performance. Moreover, the uniform
performance measurements ensure a transparent comparison of operational efficiency
between hospitals and departments. By providing a common language to all
stakeholders, the overall goal is to pursue shared interests and thus converging KPI
priorities to ensure integrated processes on a hospital-wide level.
7.5.2 Implications for hospital-wide applications of the
framework
In addition, Figure 7-6 shows that the framework is an orchestrator for supply chain
integration in healthcare. By considering multiple stakeholder perspectives, the
framework provides fruitful insights to foster integration among functions and/or
departments in order to increase awareness of holistic SCM to value-based healthcare.
In this section, we describe how the framework can be used to further push
implementation of SCM on a hospital-wide level.
On the individual department level, the framework identifies improvement
opportunities based on the ILEP index to achieve operational efficiency for each
process type. Monitoring performance on the operational level provides feedback to
stakeholders on the extent to which tactical and strategic objectives could be realized.
Hence, the framework incorporates vertical integration by providing a common
language and negotiation power for stakeholders to enhance alignment between patient
care and logistics processes.

ROADMAP FOR IMPLEMENTATION OF THE FRAMEWORK
253
Fig
ure
7-6
. R
oad
map
for
imple
men
tati
on o
f th
e fr
amew
ork
.

CHAPTER 7
254
The horizontal integration between departments and managerial functions reflects the
implications for hospital-wide applications of the framework. Hospitals contain a
variety of departments (e.g. operating theatre, emergency department, intensive care
unit, oncology, etc.) and logistics processes (e.g. purchasing, demand planning,
inventory control, etc.), working independently from each other and maximizing their
own interests. Breaking down this silo-based practice requires carefully coordinated
and integrated processes to positively impact the patient flow and operational
efficiency. The framework addresses this unique challenge in healthcare SCM by
reducing the fragmented logistics responsibilities and transferring knowledge between
departments and logistics processes. On the one hand, the framework supports
stakeholder education and more informed decision making to increase awareness of
logistics impact by adopting SCM in healthcare and promoting stakeholder
commitment. Closing the gap between awareness and willingness to commit will result
in taking actions to solve problems to the benefit of overall hospital performance. On
the other hand, we identify the need for uniform performance measurement which
enables benchmarking between departments or hospitals and learning from best
practices. It ensures a transparent comparison of operational efficiency between
hospitals and departments and thus the framework is aligned to the value-based
healthcare model.
Finally, the framework identifies the need for data transparency as a critical factor for
achieving integration in the hospital supply chain. Data capturing, data analytics and
information-sharing among stakeholders across the healthcare continuum is essential
to increase transparency and foster data-driven process improvements in healthcare
SCM. Future applications of the framework could focus on investigating consistent
information technology systems, uniform RFID technology and data standards across
hospital departments as potential enablers for holistic SCM.
7.5.3 Future directions
Further work can be undertaken to extend the framework to other departments,
managerial functions or hospitals. Stakeholder feedback plays a key role to tailor SCM
strategies to the unique healthcare context. The customized selection and prioritization
modules deliver a blueprint to apply the performance management framework in
different departments. However, validating the framework for other managerial
functions requires more effort, though we provide a systematic approach and reference
platform to reproduce each module. By increasing the sample size of this work, we

ROADMAP FOR IMPLEMENTATION OF THE FRAMEWORK
255
could extract more stakeholder preference data for different departments and
managerial functions. The ANP prioritization procedure will become generic if
convergence of the KPI weights occurs, or in other words, if all stakeholders pursue a
shared goal based on a clear performance definition as obtained by the framework.
Another interesting future research initiative is to focus on improving the dynamic
character of the framework. More specifically, the ANP-DES tool is a dynamic model
because it takes into account interaction among network elements when deriving
priorities related to the context, though more work can be undertaken to automate the
network construction and weighting procedure (i.e. step 2 and 3) based on the collected
stakeholder preference data. Technological enablers for Big Data analytics, such as
Machine Learning or Internet-of-Things, could be integrated with ANP to reduce the
complexity of structuring the problem information (e.g. indicators and dependencies)
and dynamically change the KPI priorities according to the context. Furthermore, the
DES models allow to analyse the implications of changing inventory parameters (i.e.
reorder point and order up-to level) based on historical demand data. The parameter
values define different inventory policies dependent on the item classification. A
change in this classification will impact overall decision support as the inventory
parameters are highly variable. Future work could implement a robust data collection
procedure to periodically update inventory classification and use Machine Learning to
propose general inventory guidelines for each classification group.
Finally, promising research opportunities are related to analysing the impact of the data
analytics trend on healthcare SCM. The framework can be reproduced to align
information technology systems, logistics processes and stakeholders to the benefit of
supply chain integration and standardization. Having accurate data availability is
essential input information for further validating the hybrid ANP-DES tool by fine-
tuning the modelling of SCM interventions (e.g. inventory policies) from a holistic
viewpoint.

CHAPTER 7
256
7.6 Conclusion
The paradigm shift from volume-based to value-based care drives healthcare
organisations towards aligning logistics and medical processes. From a logistics
perspective, a data-driven approach is needed to evaluate processes, monitor
performance and gain actionable insights to manage the increasing healthcare
expenses. We propose a healthcare logistics performance management framework,
which guides hospitals in adopting SCM practices in order to improve overall hospital
performance, while covering multiple stakeholders’ perspectives as to comply with
possibly conflicting objectives. With this reference framework, we show how logistics
contributes to healthcare by adapting industrial engineering tools to unique
characteristics and by monitoring measurable KPIs to foster data-driven process
improvement.
Four modules make up the framework to ensure effective performance management
and strive towards operational excellence in healthcare. A structured ANP approach
provides guidelines for hospital management to translate strategic or tactical goals into
operational performance indicators. The generic network structure establishes inter-
relationships among indicators and takes into account multiple dimensions (i.e. quality,
cost, time, productivity) of decision making in holistic SCM. Furthermore, combining
ANP and DES allows to quantify the logistics impact by integrating relevant KPI
values into a multi-dimensional ILEP index to assess efficiency improvement
initiatives. Finally, each module is verified and validated based on stakeholder
feedback to stimulate more informed decision making, to reduce supply chain
fragmentation and to propose a common language for stakeholders on all
organisational levels.
Overall, the framework is a closed-loop approach to support decision making and to
bridge the gap between theory and practice-based SCM applications in healthcare. We
offer a proof-of-concept that industrial engineering tools are useful to identify
efficiency gains in healthcare settings by adopting SCM. Moreover, the
implementation roadmap provides guidelines for implementing SCM strategies using
the framework as a blueprint. Although each healthcare setting is different, following
the implementation path will lead to transparent performance management by
addressing the unique challenges to healthcare SCM, such as enhancing data
transparency, knowledge transfer and stakeholder commitment. The framework is not
exclusively intended for addressing materials planning problems, but the merits of the

ROADMAP FOR IMPLEMENTATION OF THE FRAMEWORK
257
framework lie in the generic nature of the modules and the ability to customize the
content of the modules to the studied application.
Finally, the framework provides fruitful insights to healthcare policy makers,
managers and executives to implement the framework on a hospital wide-level by
orchestrating supply chain integration. Vertical integration can be achieved by
promoting stakeholder commitment and providing common language to support
decision making on all organisational levels, whereas data transparency is a critical
factor to ensure uniform performance measurement between departments and process
types in order to achieve horizontal integration.

258

259
CHAPTER 8
8 Future Outlook: Digital Trends in Healthcare
Logistics8
An epilogue is added to discuss the digitalization trends in healthcare. We
identify four trends holding considerable promises for moving towards
digital, patient-centred and cost-effective healthcare. A future outlook is
presented describing the implications for supply chain optimization, where
we focus on turning the unique challenges as mentioned in Section 3.1.1 into
opportunities to achieve value improvement in healthcare.
8.1 Introduction
In this PhD dissertation, we focus on the importance of healthcare SCM and we call
for action to control the increasing healthcare expenses as one aspect of the Quadruple
Aim strategy to achieve value-based care. A healthcare logistics performance
management framework has been developed to address the unique challenges inherent
to the internal hospital supply chain. The adoption of effective SCM is typically
obstructed in healthcare organizations due to dispersed logistics responsibilities, lack
of data, conflicting stakeholder perspectives, poor understanding of OR/OM, etc.
However, the overall goal in value-based care is to perfectly align medical and SCM
processes, and therefore this chapter takes a broader perspective to reform the
healthcare system. Interoperability between processes is playing a vital role in this
reform due to the rapid evolution of digitalization in healthcare. With the increasing
8 This chapter partially corresponds to the following paper:
Moons, K., Waeyenbergh, G., De Ridder, D., Pintelon, L. (2020). Future outlook: Implications of digital trends in
healthcare logistics. Health and Technology, Submitted.

CHAPTER 8
260
number of patients pushed out of the hospital (i.e. outpatients) and a more important
role for patients in self-controlling their health (i.e. patient empowerment), the
digitalization trend has significant implications for coordinating primary and
supportive care delivery services across the extended healthcare continuum with
multiple service providers outside the hospital walls. Hence, moving towards a
“hospital” of the future brings additional optimization opportunities, where digital
technologies act as potential enablers to support this transformation by enhancing data-
gathering, real-time data analytics and automation.
8.2 Hospital of the future
SCM will play a crucial role in navigating hospitals on their innovation journey by
supporting future trends and technologies that enable this transformation (DHL 2017).
The hospital of the future facilitates collaboration between clinical and
logistics/facility services and provides a significant opportunity for cost reduction.
Figure 8-1 visualizes the care components which will constitute different layers in the
future hospital design, following the strategic care plan of Flemish hospitals (Belgium)
that aims for collaboration, qualitative care, efficient processes and staff or patient
satisfaction (Cardoen and De Ridder 2019). The clinical services contain patient flows
throughout a hospital platform consisting of five categories:
Primary care represents first-line actors supporting and coordinating care
services as long as possible in patients’ home environment (e.g. hospital at
home, telehealth).
Ambulatory care services distinguish between medical day care hospitals and
polyclinics. The latter are free-standing outside the hospital and provide
services without offering a patient room such as wound care, chemotherapy
or outpatient diagnostics. Due to low-technological requirements these
services can be located off-campus, in contrast to highly technology-
dependent day care hospitals for surgical procedures.
Chronic care facilities offer care in rehabilitation and residential care centres
with supervision and assistance in daily living, medical and nursing services
included.
Bridging homes or transition houses facilitate the return to normal functioning
after hospitalization including patient education, social services and active

FUTURE OUTLOOK: DIGITAL TRENDS IN HEALTHCARE LOGISTICS
261
engagement of family and surroundings in order to alleviate the bed-blocking
problem in bed houses.
Bed houses or focused clinics represent traditional hospitalization beds for
surgical, medical, paediatric or other pathologies. These tertiary centres are
often integrated with university and technology campuses, foster
specialization and aim to serve larger populations.
Creating hospital networks on a loco-regional level supports basic care provision in
the proximity of the patients. On the other hand, supra-regional collaborations provide
complex treatments in specialized tertiary centres embedded in the loco-regional
network. Moreover, the supra-regional network houses the logistics and facility
services. The technological platform involves technology-dependent services. A
distinction can be made between standard and advanced technologies, such as
operating rooms or imaging and radiotherapy or intensive care units respectively.
Finally, reengineering the logistics flows can yield significant savings. Healthcare
logistics engineering involves the activities of design, planning, implementation and
control of coordination mechanisms between supplies, equipment, services and
information from suppliers to point-of-care locations in order to enhance clinical
outcomes while controlling supply chain costs (Council of Supply Chain Management
Professionals, 2016; Di Martinelly, 2008).
Adopting effective hospital information systems is a prerequisite for reengineering the
supply chain and accurately balance patient care and logistics processes while
considering economic constraints (Di Martinelly et al., 2009; Iannone et al., 2013;
Kritchanchai et al., 2018). Digital technologies are an important enabler for
information-sharing between clinical and logistical aspects, which facilitates
integration among different supply chain actors by leveraging enhanced connectivity
and data analytics. Hospitals get a smaller role in the care continuum as they switch
from integrated providers to high-tech specialists or knowledge hubs in collaboration
with other care professionals and patients. As a consequence, the scope of future
healthcare logistics will be extended to a health system without walls, involving all
aspects of prevention, diagnosis and treatment ranging from primary to tertiary care.

CHAPTER 8
262
Fig
ure
8-1
. C
are
com
ponen
ts a
nd c
oll
abora
tion b
etw
een c
linic
al, lo
gis
tics
and f
acil
ity
serv
ices
. (R
epri
nte
d f
rom
the
gre
en p
aper
by
(Car
doen
an
d D
e R
idder
, 2019))
.

FUTURE OUTLOOK: DIGITAL TRENDS IN HEALTHCARE LOGISTICS
263
8.3 Global healthcare trends
Digital technology has become a buzzword in the tech industry providing opportunities
for an innovative future for healthcare. In addition to medical technologies, digital
innovation also focuses on patient empowerment and data analytics to ensure cost-
effective and transparent healthcare practices. Starting from exploratory research by
Flemish hospitals, the Green Paper by Cardoen and De Ridder (2019) provides a
roadmap of future trends to be incorporated in the hospital’s strategic plan, which is
also confirmed in the global healthcare outlook by Deloitte (2020). Based on these
papers, we distinguish between four trends impacting the global healthcare
community: organisation, Big Data analytics, technological enablers and hospital
architecture.
Organisation: Hospital networks or Integrated Delivery Networks (IDN) are
proposed between hospitals and multiple care providers with centralization of
logistics and facility services, and therefore providing opportunities for
efficiency and quality gains in all links of the care chain. The Green Paper
distinguishes between loco-regional and supra-regional networks, with the
former providing basic care within reasonable distance from patients with
optimal investment of equipment and the latter providing complex care in
high-tech, specialized reference hospitals (Cardoen and De Ridder 2019). In
addition, home care will be provided more frequently, which sets new
challenges to functionality, efficiency and competences of logistics processes
(KCE 2015). Finally, the human component is a unique feature in the field of
healthcare SCM. The shift towards patient empowerment significantly
influences the power relationship between healthcare professionals and
patients, where the latter take responsibility for managing their own health
decisions to ensure efficient, effective and transparent care services through
partnership rather than paternalistic (i.e. the doctor knows what is good for
me) behaviour.
Big Data analytics: The greater prevalence of outpatient care challenges the
health system to support data-gathering in order to improve patient, material
and information flows and accordingly enhance transparency and traceability
in the healthcare supply chain. The increasingly popular term “Big Data”
describes the technology of managing and analysing large amounts of data in
order to provide insights into individual patient data and public health data as

CHAPTER 8
264
well as process and logistics data, where traditional data processing
applications will fail (Bates et al. 2018). Integrated software systems (e.g.
Enterprise Resource Planning) and Electronic Health Records (EHR) enable
information-sharing among different actors and stimulate the use of common
logistics vocabulary. Data aggregation is core and allows for proactive care,
prevention, personalized care and real-time monitoring of quality between
home care, chronic care, hospitals and authorities. In the world of Big Data,
however, security is an important pitfall for digital hospitals of the future. The
large volume of data and interconnectivity raises concerns on privacy,
ownership and cybercrime. Therefore, the European Union adopted a General
Data Protection Regulation (GDPR) to avoid data misuse (Armstrong and
Bywater 2018). GDPR controls the relation between hospital supply chain
processes and privacy concerns.
Technological enablers: Technology will underlie most future trends by
building a sustainable infrastructure for affordable, accessible, high-quality
and patient-centred care. The main challenges are related to solving
interoperability issues and standardizing processes. Technological enablers
such as Artificial Intelligence (AI) and Machine Learning (ML) facilitate
dealing with Big Data, customizing healthcare services and integrating
processes. Furthermore, Internet-of-Things (IoT) and virtual health or
telehealth enhance accessibility of care by providing a continuous connected
infrastructure of medical devices, software applications and health services.
It enhances data aggregation, supports cloud-based computing, and enables
remote clinical monitoring for outpatient services. During the COVID-19
pandemic, telehealth is becoming the new norm to provide long-distance care
by remotely access patients’ medical records and collaborate with other
providers. Although Big Data and technological innovations are the main
drivers of digitalization in healthcare, it is still early days for healthcare
stakeholders to adopt applications due to technical barriers, high costs and
privacy concerns. Table 8-1 gives an overview of technological enablers and
potential applications to shape the future of hospitals.

FUTURE OUTLOOK: DIGITAL TRENDS IN HEALTHCARE LOGISTICS
265
Table 8-1. Technological enablers and applications driving the road towards digital
healthcare.
Enabler Application Functionality
AI/ML Logistics robots, Autonomous Guided Vehicles (AGVs)
Food, linen or medication distribution Patient transportation
Chatbots Communication with patients
Risk prediction approaches Risk assessment of (new) equipment and devices
Decision-support systems Operating room programming
IoT/virtual health/ telehealth
Mobile applications (health apps), wearables Teleconference appointment
Remote monitoring of personalized healthcare Live video conferencing for
virtual appointments between patient and doctor
Block chain EHR Accessibility to decentral medical records
Additive manufacturing 3D/4D printing of medical devices
Highly responsive care provision close to patient bed
Hospital architecture: The transition from institution-centric to patient-
centric care asks for a patient-oriented building, whereby spatial qualities
allow for creating a healing environment for patients. The increasing
popularity of remote clinical monitoring holds promising opportunities to
improve patient centeredness because the patient is actively involved in
determining care pathways through shared decision making. This active
participation can also be reflected in the hospital design by introducing
customized patient rooms, smart ergonomic premises, modular lighting and
noise management in order to improve care and well-being of patients as well
as staff. In addition, the hospital design strives towards prevention and early
intervention to move from a ‘sick’ to a ‘health’ care environment. Safety and
environmental friendliness are also considered important when activating the
hospital building.
8.4 Implications for healthcare SCM
A deeper understanding of SCM practices is required to achieve operational excellence
by integrating all tiers of the health system while ensuring qualitative patient care
(Feibert 2017; Melo 2012). Moreover, the transformation to a digitalized healthcare
sector asks for aligning a digital strategy with the organisation’s strategy, people and
CHAPTER 8
266
processes. Digitalization and technological advancements of hospital Information
Technology (IT) systems will improve the information flow, enhance connectivity and
integrate services among healthcare partners (e.g. hospitals, patients, blood transfusion
centre, lab, etc.) (Ageron et al. 2018).
The healthcare sector, however, is facing several operational challenges, such as
fragmentation, many stakeholders involved, lack of expertise, growing demand
variability, etc. (see Figure 3-2). In addition, lack of management commitment and
data standards as well as inefficient processes are major obstacles to the
implementation of effective SCM for many hospitals. Further research needs to
address how these challenges can be turned into opportunities, related to the four global
trends – organisation, Big Data, technology and architecture. Although this dissertation
addresses part of the research gaps identified in Table 3-3 by developing OR/OM
techniques to support decision making for logistics operations and process
improvement, much room is left for future research avenues to investigate how the
digitalization trends impact the logistics flow by addressing its unique challenges.
8.4.1 Fragmentation
The logistics responsibility is rather fragmented among different healthcare partners
and policy makers, resulting in ill-coordinated supply chain processes in the ever-
expanding care continuum. Landry and Beaulieu (2013) and Feibert (2017) consider
supply chain integration as an important strategic weapon to improve the coordination
of material and information flows in hospitals. By taking a holistic perspective on
SCM, further research is needed to adopt operations research techniques, focusing on
integrated resource and planning management at different levels of the decision-
making hierarchy (Ageron et al., 2018; Hans et al., 2012; Rakovska & Stratieva, 2018;
Rohleder et al., 2013). Furthermore, Volland et al. (2017) state performance
management in healthcare logistics as a promising research opportunity. In contrast to
the fragmented healthcare supply chain, effective performance management requires
an integrated approach to control the supply chain strategy, implement continuous
improvement programs and improve decision-making capabilities by focusing on Key
Performance Indicators (KPIs) (Maestrini et al., 2017). In this dissertation, we
developed a healthcare logistics performance management framework to evaluate
SCM strategies in order to achieve operational excellence and strive towards supply
chain integration. Rakovska and Stratieva (2018) also stress the importance of internal
and external supply chain integration for improving hospital performance. Recent

FUTURE OUTLOOK: DIGITAL TRENDS IN HEALTHCARE LOGISTICS
267
innovations include the transformation from static supply chains to dynamic Digital
Supply Networks (DSN) and virtual supply chain centralization, which enhance
connectivity and responsivity, contain costs, improve supply chain relations and
efficiently use resources (Deloitte, 2018; Feibert, 2017; Vila-Parrish & Simmons,
2013).
8.4.2 Stakeholders
A second challenge relates to the impact of different stakeholders (e.g. providers,
payers, consumers, government) on the healthcare supply chain, as all stakeholders
have individual takes on performance management with for example conflicting goals
for efficiency and responsiveness (De Vries and Huijsman 2011). Misalignment of
incentives across the supply chain is a major obstacle leading to poor hospital
performance (Callender and Grasman 2010; Feibert 2017).
Second, it is challenging to engage different healthcare stakeholders to cooperate and
embrace changes, as they have individual takes on performance management with
possibly conflicting goals to achieve operational excellence(De Vries & Huijsman,
2011). Misalignment of incentives across the supply chain is a major obstacle leading
to poor hospital performance due to silo-based practices (Callender & Grasman, 2010;
Feibert, 2017). The healthcare logistics performance management framework as
developed in this dissertation investigates the multi-dimensional character of the
healthcare supply chain by quantifying the trade-off between four goals – quality, cost,
time and productivity. The Analytic Network Process is applied as a popular Multi-
Criteria Decision Making (MCDM) tool to prioritize KPIs, representing the extent to
which different aspects contribute to hospital performance according to multiple
stakeholders. Moreover, Hans et al. (2012) present a collaborative planning framework
offering a common language for stakeholders on all organizational levels to promote
supply chain integration and implement cost-effective, standardized processes.
Information-sharing is especially important in the expanding care continuum with an
increasing number of outpatients. The digitalization trends are promising to achieve
supply chain integration, though active participation, collaboration and investment by
all healthcare stakeholders is required in shaping this future (Deloitte, 2019). The
human component is often underexplored, though resistance to change is one of the
biggest obstacles to implementing SCM in healthcare. Creating inter-organizational
training environments and expanding skill sets, as well as recruiting, developing and
retaining sustainable and flexible workforce is crucial to build strong relationships and

CHAPTER 8
268
respond efficiently to care needs (Ageron et al., 2018; Min, 2017). The HELP project,
as discussed in Section 1.1.3, is an excellent initiative to introduce a new profession of
healthcare logisticians to ensure logistics flows and patient care are consolidated.
8.4.3 Unpredictability
Unpredictability significantly adds to the complexity in the healthcare supply chain
due to variations in both demand and supply processes (Zhong et al., 2017). Data-
driven inventory management can improve hospital performance by updating
forecasting tools, increasing transparency and identifying performance benchmarks
(Alotaibi & Mehmood, 2018).
In the digital hospital era, data plays a key role to enable real-time monitoring of
operations to improve demand accuracy, reduce unnecessary variation and identify
substantial efficiency gains. Massive amounts of data will be generated and new ways
of managing this data, such as AI or ML, are indispensable to respond to the growing
data needs by providing a holistic view of the logistics flow as well as clinical
processes (Kwon et al., 2016). Hence, Big Data predictive analytics is crucial to
support more informed decision-making, streamline logistics processes and it has a
prominent role in improving hospital performance (Wang et al., 2016). The greatest
challenge faced in the healthcare sector today is the problematic nature of missing,
isolated and non-standardized data across different stages in the supply chain. In future
work, hospital networks, supply chain integration, and AI or other smart world systems
are essential to optimize supply chains by implementing consistent hospital IT
systems, standardizing processes and guaranteeing data privacy (Alotaibi &
Mehmood, 2018; Davenport & Kalakota, 2019; Tawalbeh et al., 2016).
8.4.4 Expertise in OR/OM
The impact of logistics in hospitals has been neglected for many years due to poor
understanding of the fundamentals of healthcare SCM and limited expertise in the field
of operations research (Dobrzykowski et al., 2014). The healthcare supply chain is a
complex system requiring a multi-disciplinary approach, combining theories and
transferring knowledge from different research areas (Kwon et al., 2016; Min, 2017).
Therefore, adopting best practices from manufacturing or maintenance operations
provides valuable opportunities for future research as they successfully benefited from
process optimization, performance benchmarking, etc. (Zhong et al., 2017). The

FUTURE OUTLOOK: DIGITAL TRENDS IN HEALTHCARE LOGISTICS
269
current body of healthcare SCM literature is rich in describing analytical and
conceptual methodologies focusing on isolated planning/scheduling of operating
theatres, emergency departments or patient appointments. In contrast, healthcare SCM
studies rarely address the holistic impact of inventory control, IT or purchasing (Min,
2017). Moreover, many industrial sectors are exploring the potential of Big Data
analytics (Alotaibi & Mehmood, 2018). Varela and Tjahjono (2014) state that “Major
business players who embrace Big Data as a new paradigm are seemingly offered
endless promises of business transformation and operational efficiency
improvements”. In future work, healthcare SCM studies will benefit greatly from the
massive amounts of data as well as the ability to account for interrelationship between
supply chain operations in order to achieve global optimization (Ranjan, 2014; Wang
et al., 2016). Especially with the increasing popularity of digitalization, healthcare
organizations need to strengthen their supply chain capabilities to reap the benefits of
technological advancements in order to enhance both efficiency and responsivity.
8.4.5 Standardization
Lack of uniformity, missing global identifiers for products/locations and outdated
physician supply preferences have been reported as major challenges to integrate and
streamline healthcare supply chain processes (Dooner, 2014; Feibert, 2017). The great
amount and variety of items held in hospitals are a significant driver of supply chain
costs and complicate activities related to purchasing, inventory and distribution (Melo,
2012). Initiatives for product standardization are a first step towards process
improvement in order to increase coordination and eliminate non-value adding
activities (Min, 2017). In addition, data standardization is a crucial value imperative to
the future trend towards digital hospitals (Kwon et al., 2016; Min, 2017). Digital
technologies support supply chain integration by sharing data, automating processes
and hence improving efficiency. EHR constitute the main source of data in the health
system, where the greatest challenge is creating supply chain data standards to ensure
effective communication and information exchange among various healthcare
stakeholders (Alotaibi & Mehmood, 2018). Moreover, implementing Global
Traceability Standards (e.g. GS1) for healthcare provides consistent clinical and
logistical information (e.g. Global Location Numbers and Global Trade Identification
Numbers), and thus yields important benefits for end-to-end visibility and automated
inventory control (GS1, 2018). Future work should address challenges related to RFID
and barcoding technology in order to improve the quality of barcodes, standardize the

CHAPTER 8
270
layout and encourage manufacturers upstream in the supply chain to adopt global
identifiers in the tags.
8.4.6 Automation
Technological interventions are slowly adopted in healthcare logistics processes due
to lack of automation, though technology will have a significant impact on shaping
future hospitals. Automating hospital IT systems, together with data standards,
represent a significant opportunity for accurately measuring healthcare performance
(Böhme et al., 2016; Di Martinelly, 2008; Feibert, 2017; Volland et al., 2017). IT plays
a key role in monitoring daily operations as it enhances accessibility to real-time data
and hence there is much potential for applying operations research techniques and
optimizing SCM (Denton, 2013; Kritchanchai et al., 2018).
Current best practices in healthcare logistics employ barcoding technology since the
benefits of RFID technology in terms of efficiency, visibility, patient security, etc. do
not outweigh the high investment cost (Böhme et al., 2016; Feibert, 2017). In the
future, hospitals require automated data capture using barcodes, RFID or QR
technology to ensure end-to-end supply chain visibility from ordering to bedside
administration. Another future trend examines the role of IoT by configuring the IT
infrastructure and communication architecture as potential enablers for tracing, storing
and analysing data as well as facilitating interoperability among healthcare supply
chain partners (Min, 2017). Moreover, innovations in telehealth, wearable devices and
cloud-based computing platforms have the potential of becoming a key differentiator
for monitoring processes, since healthcare will move away from the hospital to the
home environment and thus necessitates automated and integrated information-sharing
among healthcare partners (Claes et al., 2019; Dinh-Le et al., 2019).
Finally, other technological advancements in future hospitals include automated
transport (e.g. pneumatic tubes, AGVs), automated storage and retrieval systems for
goods, robots for unit dose production and picking, etc. (Feibert, 2017). However, no
single policy exists for implementing all technological interventions. Further work
should investigate which technologies are appropriate under certain circumstances.

FUTURE OUTLOOK: DIGITAL TRENDS IN HEALTHCARE LOGISTICS
271
8.4.7 Other challenges
Another hot topic in healthcare SCM studies is the hospital architecture. The building
aims to embrace the vision of value-based healthcare and to adopt a patient-oriented
approach by creating a healing “health” care environment to encourage active
participation and a strong patient-doctor relationship. Moreover, the services provided
by traditional hospital institutions are pushed towards the community and home
environment which necessitates a change from the conventional single-echelon
institution to a hospital network design model. Integrated Delivery Network (IDN) has
received less attention, though it incorporates several value imperatives into the
healthcare supply chain, such as accessibility to healthcare providers or efficient
distribution of supplies (Landry & Beaulieu, 2013; Min, 2017). The network tends to
reflect a hub-and-spoke model, bridging the gap between inpatient and outpatient care
in respectively a specialized, high-tech hospital and local clinic or at home (see Figure
8-1). Moreover, centralizing logistics services, such as sterile services department,
pharmacy or laboratories, stimulates supply chain integration and standardization in
terms of purchasing, inventory and distribution, while operational costs are reduced
(Abdulsalam et al., 2015). Further work should address outsourcing of hospital supply
chain activities within one network to third parties as a strategic tool (Ageron et al.,
2018; Guimarâes & de Carvalho, 2011).
A relatively new concept is the adoption of block chain technology in healthcare,
which eliminates the need for a centralized third party in distribution networks (Agbo
et al., 2019). With this decentralized architecture, block chain technology allows all
stakeholders to have access to EHR by connecting disparate data silos. Moreover it
improves data security by developing a GDPR-compliant hospital IT system, provides
a transparent supply chain and guarantees patients’ health data ownership. Although a
number of use cases are presented in a healthcare environment (e.g. EHR and
pharmaceutical supply chain management), addressing the challenges of scalability,
interoperability, standardization and security present a rich field for future research.
Furthermore, supplier relationship management greatly contributes to a strategic
benefit by proactively engaging healthcare providers with Group Purchasing
Organizations (GPOs) (Kwon et al., 2016). GPOs help to secure supplies and reduce
costs by leveraging economies of scale and enhancing price transparency through
framework contracts (Burns & Lee, 2008; Jayaraman et al., 2014). Purchasing could
greatly benefit from operations research techniques by developing a systematic

CHAPTER 8
272
decision-support tool to select appropriate GPOs in order to enhance relationship
management (Min, 2017).
Finally, further work can be undertaken to create a risk management framework for
value-based healthcare. The ASHRM (i.e. American Society for Healthcare Risk
Management) determines basic building blocks constituting the framework, such as
managing uncertainty, maximizing value creation, utilizing data to prioritize risks, and
ensuring safe and trusted care services, when making risk management decisions
(Carroll, 2014). SCM decisions are identified as operational risks resulting from lack
of coordination in internal logistics and clinical processes. Etges et al. (2018) also list
SCM as one of the largest operational concerns in healthcare, presenting a risk to
overall hospital performance.
8.5 Conclusion
Over the next ten years, the hospitals of today will transform into an almost
unrecognizable hospital of the future. This shift is mainly driven by rapidly evolving
technologies, opening up the way towards digitalization in healthcare. Although digital
technologies enhance patient or staff experience, improve care delivery and create
operational efficiencies, hospitals need to align their processes, technology and people
to achieve affordable, accessible, high-quality care (Deloitte 2017).
The supply chain acts as the backbone in navigating the innovation journey towards
the future digital trends in healthcare. This work provides insights into the major
research avenues for future hospitals and aims to highlight how trends of remote
monitoring and patient-centric care affect the logistics processes. In particular,
learning from multi-disciplinary research fields will encourage the future development
of healthcare OR/OM techniques within areas such as supply chain integration,
automation, data analytics, organisation and architecture.
Big Data pave the way to digital hospitals and efficiency gains are realized by
integrating all tiers of the healthcare supply chain. Hospitals will have a smaller role
in the care continuum, representing specialized knowledge hubs in collaboration with
other providers and patients supported by centralized logistics and technological
platforms. Enhanced connectivity and data analytics smoothen information exchange
among healthcare stakeholders, and in turn result in highly responsive supply chains.
Automation through technological enablers and innovations in telehealth, wearable
devices, IoT and AI all have the potential of becoming the engine for monitoring

FUTURE OUTLOOK: DIGITAL TRENDS IN HEALTHCARE LOGISTICS
273
processes and accurately measuring healthcare supply chain performance. Finally,
attention must be given to patients and healthcare professionals’ well-being and human
resource management when shaping the future.

274
275
CHAPTER 9
9 General Conclusion
In an era where “time is money”, operational excellence becomes a prime objective
for various sectors, such as manufacturing, construction or energy. These sectors have
lead the way to cost-efficient operations by adopting effective and integrated Supply
Chain Management (SCM). Recently, the healthcare sector started to recognize the
importance of SCM in the paradigm shift from volume-based to value-based care in
order to improve operational performance while sustaining high-quality patient care.
Four dimensions play a critical role in reforming the healthcare system. According to
this Quadruple Aim strategy hospitals strive towards better outcomes, improved
patient experience, lower costs and enhanced staff satisfaction. In this dissertation, we
mainly focus on the cost and personnel aspect to streamline the internal hospital supply
chain processes.
Hospitals typically carry large amounts of a great variety of items. The logistics
processes that involve storing and distributing these items to point-of-care locations in
the hospital supply chain are of great importance to support patient care services.
However, the medical material costs constitute the second largest hospital expenditure,
after personnel costs. Due to the increasing cost pressures, hospitals definitely need to
do more with less. Aligning clinical, material and information flows is essential for
achieving operational excellence and supply chain integration. From a logistics
perspective, there is a need to understand how the internal supply chain processes are
currently performing. Measuring the performance of the supply chain is fundamental
to identify data-driven process improvements which provide valuable input
information for managerial decision making to the benefit of value-based healthcare.

CHAPTER 9
276
In this dissertation, we develop a methodologically rigorous healthcare logistics
performance management framework as a guide for adopting SCM practices in order
to achieve operational excellence. Given the complexity of a healthcare setting, a
robust decision-support tool is required that provides a systematic approach to evaluate
processes, monitor performance and gain actionable insights to effective materials
management. The Operations Research and Operations Management (OR/OM) field
plays a key role in bringing objectivity in decision making, supporting data-driven
process improvement and thus quantifying how logistics contributes to healthcare.
Although OR/OM modelling techniques have been successfully used in industrial
engineering applications to improve performance, adapting these tools to the
healthcare sector is not a simple copy-paste due to the unique challenges inherent to
the internal hospital supply chain. The framework aims to bridge the gap between
theory and practice-based SCM applications by incorporating multiple stakeholders’
perspectives as to comply with possibly conflicting goals when defining operational
excellence. Other barriers to effective healthcare SCM involve lack of standardization
and Information Technology (IT) systems for orchestrating supply chain integration.
Four modules make up the healthcare logistics performance management framework
to support decision making and strive towards operational excellence. We demonstrate
a proof-of-concept to apply industrial engineering techniques, such as SCM concepts,
performance management, Multi-Criteria Decision Making (MCDM) methods and
simulation modelling, for targeting efficiency improvement opportunities in the
internal hospital supply chain. Moreover, the cyclical feature in the framework embeds
feedback loops iterating between the modules in order to ensure SCM is tailored to the
unique healthcare setting. Altogether, the framework uses a closed-loop approach that
enables continuous improvement and allows for customization to specific healthcare
logistics needs.
We initiate the framework development procedure by formulating an answer to the
first research question. In an extensive literature review, the state-of-the-art of
hospital logistics performance management has been described. A comprehensive
methodology is missing for selecting relevant Key Performance Indicators (KPIs) to
measure the performance of the internal hospital supply chain. Chapter 3 addresses
this gap. Several metrics are of interest to different stakeholders, and therefore the KPIs
are assigned to four objectives – quality, time, financial and productivity/organisation
– representing the multi-dimensional character of the internal hospital supply chain.
The framework needs to support decision making by clearly defining and linking the

GENERAL CONCLUSION
277
performance criteria to evaluate efficiency improvements, while taking into account
the organisation’s strategy. MCDM is proposed as a useful OR/OM technique for
determining relationships and prioritizing between performance indicators, since
healthcare SCM decisions involve trade-offs between sometimes conflicting
objectives.
The second research question addresses this prioritization problem using the Analytic
Network Process (ANP). ANP is a popular MCDM technique known as a valuable
analytical tool for supporting decision making related to performance management.
Relative weights are assigned to the indicators by eliciting stakeholder preferences and
SCM interventions are evaluated by trading-off between the KPIs. In Chapter 4, this
prioritization problem is transformed into an ANP-based prototype to provide
guidelines for hospital management to translate strategic or tactical objectives into
KPIs, that make up the definition for operational excellence in healthcare logistics and
thus focus attention on what matters most to healthcare performance. The prototype
only takes into account the expertise of the logistics manager to improve understanding
of the logistics impact to value-based care.
The third module in the framework development procedure aims to provide empirical
evidence for choosing the appropriate logistics policy and determining values for the
parameters by monitoring measurable KPIs and identifying data-driven process
improvements. By combining the ANP-based prototype and Discrete-Event
Simulation (DES) modelling, we provide a theoretically sound basis for the reference
framework to understand the behaviour of the supply chain, visualize improvement
strategies and perform a scenario analysis. The Internal Logistics Efficiency
Performance (ILEP) index is introduced to evaluate logistics policies by quantifying
trade-offs among KPIs. Case studies are chosen as research design to experiment and
gain insights into real-life problems by bridging the gap between theory and practice.
Chapter 5 provides an overview of several case studies focusing on inventory control
and distribution systems in an operating theatre environment in order to answer the
third research question:
From an inventory perspective, the hybrid ANP-DES tool drives policy
decision making by quantifying the main trade-off between service levels and
costs. Classifying inventory items is an essential prerequisite to policy
decision making by distinguishing between inventory hot spots and lower
priority items. No single policy applies to all items, and therefore service

CHAPTER 9
278
levels are determined for different item categories acting as a constraint when
identifying the appropriate inventory policy. For critical items, the risk-taking
inventory policy meets very high service levels (i.e. 99,7%) with a cost saving
of up to 37%. The same policy is penalized for non-critical items due to a
10% decrease in service level though similar cost savings could be realized
and the service level requirement is still satisfied. As a consequence, a risk-
averse policy is preferred for controlling non-critical items, which seems
counterintuitive as service level becomes less important when compared to
critical items. Further work can be undertaken to reassign priorities for service
level in the ANP-based prototype depending on the inventory classification.
This in turn will impact the ILEP index and therefore may change the
appropriate inventory policy. Furthermore, more data is needed to
periodically update inventory classification and propose general inventory
parameters for each classification group.
Second, the hybrid tool is illustrated to evaluate internal distribution systems
by determining optimal replenishment policies and surgical case cart flows.
The ILEP index shows a 24% improvement for the Standard replenishment
policy compared to the As-Is situation by eliminating double stock on
replenishment carts and collecting consumption data on the operating room
level. Both the Standard and Copy carts replenishment policies demonstrate
better performance in terms of quality, time and productivity/organisation
compared to As-Is, where the former focuses on a better service and the latter
improves staff productivity. Barcode scanning technology is introduced in
both policies for inventory optimization purposes. In addition, surgical case
carts need to be in place at the right time. Adopting standardization and
centralization initiatives improve distribution performance by increasing
uniformity and balancing workload throughout the supply chain.
Aligning inventory management and distribution systems is essential to
achieve operational excellence by defining parameter values for stock levels,
identifying where to stock and when to replenish, reducing the reverse
logistics flow, increasing uniformity as well as realizing time and cost
savings. The framework guides hospital management to identify areas of low-
hanging fruit to increase efficiency by addressing unique SCM challenges,
such as standardization and stakeholder commitment. Standardization

GENERAL CONCLUSION
279
initiatives are a first step towards supply chain integration by updating
physician preference card management and increasing cost awareness among
hospital stakeholders. The findings show that standardization yields a cost
saving of 30% by rationalizing the surgical product portfolio and educating
surgeons on disposable supply costs. Altogether, a total cost saving of 35%
could be realized by combining the inventory policies and standardization
efforts to streamline the logistics flow to the benefit of value-based
healthcare. The case study findings offer a proof-of-concept that industrial
engineering tools are useful to identify efficiency gains in a healthcare setting
by adopting SCM strategies. Moreover, we prove the generalizability of the
framework by addressing multiple logistics needs and identifying
implementation paths which enhances trust building in the framework. The
framework is not exclusively intended for addressing materials management
problems, but future research may use the reference framework for evaluating
other managerial functions, such as procurement strategies or information
technology systems.
By going through modules 1 to 3, hospital stakeholders gain deeper insights in how
logistics contribute to value-based healthcare by quantifying the impact of SCM
interventions. The final module presents an answer to the fourth research question
by considering a broader perspective to ensure that SCM is tailored to fit the unique
healthcare challenges. The dispersed logistics responsibility among several hospital
departments asks for a multi-level, multi-stakeholder framework validation. Each of
the three modules is verified by incorporating multiple stakeholders’ perspectives.
Stakeholder feedback plays a key role to pave the way for potential efficiency gains in
future logistics applications and generate insights to overcome SCM implementation
barriers in healthcare. Starting from the logistics perspective, the case study findings
allow to increase understanding of SCM, which enhances awareness of logistics and
in turn stimulates stakeholder commitment. Hence, the multi-level, multi-stakeholder
healthcare logistics performance management framework promotes more informed
decision making in order to reduce supply chain fragmentation. In addition, we identify
the need for uniform performance measurement throughout the supply chain which
enables benchmarking and continuous improvement. In this way, the framework
supports knowledge transfer through multi-disciplinary teams and proposes a common
vocabulary for stakeholders on all organisational levels to align patient care and

CHAPTER 9
280
logistics processes by having streamlined standards that define operational excellence
and contribute to overall hospital performance.
By providing the answers to the research questions, we gain fruitful insights in
structuring a healthcare logistics performance management framework. Our
framework guides hospital management to identify data requirements for OR/OM
modelling and to monitor the most relevant KPIs for the studied application, and
thereby reducing uncertainty in decision making. Data transparency is a critical factor
that needs to be taken into account in future research avenues in order to have
streamlined data standards, ensure uniform performance measurement and finally
achieve integration in the hospital supply chain. Moreover, data capturing, data
analytics and information-sharing among stakeholders across the healthcare
continuum asks for implementing effective IT systems as potential enablers for holistic
SCM. Chapter 8 presents a future outlook describing the implications of the
digitalization trend in healthcare logistics. Big Data analytics and technological
advancements (e.g. Artificial Intelligence, Internet-of-Things, etc.) have the potential
of becoming the engine for evaluating processes and monitoring healthcare supply
chain performance.
Furthermore, the framework is robust by integrating group decision making. It
stimulates more informed decision making by engaging stakeholders and increasing
knowledge transfer in order to adopt SCM and strive towards operational excellence.
The methodology promotes continuous improvement programs that contribute to the
global interest of the hospital. Finally, the approach is transparent, systematic, flexible
and easy-to-use, and therefore leaves room for applicability in other hospital
departments and on a hospital-wide level by orchestrating supply chain integration. A
roadmap to implement the framework in different contexts is provided in Chapter 7.
Altogether, the merits of the framework lie in the generic nature of the modules as well
as the ability to customize the content of the modules to specific healthcare logistics
applications.

281

282

283
APPENDIX
Appendix A – Supermatrix formation following ANP approach
Cluster weights
Quality Cost Productivity
Quality 0,674 0,648 0,558
Cost 0,101 0,230 0,122
Productivity 0,226 0,122 0,320
Weighted supermatrix
Quality Cost Productivity O ISL IV IA ICr ICo VoI ITu IU PS
Objectives (O) 0.000 0.000 0.000 0.000 0.000 0.000 0.000 0.000 0.000 0.000
Inventory
service level
(ISL)
0.218 0.000 0.505 0.539 0.460 0.405 0.350 0.239 0.279 0.331
Inventory
visibility (IV)
0.056 0.066 0.000 0.135 0.088 0.088 0.106 0.239 0.169 0.139
Inventory
accuracy (IA)
0.056 0.146 0.168 0.000 0.201 0.155 0.193 0.080 0.070 0.088
Inventory
criticality (ICr)
0.385 0.537 0.000 0.000 0.000 0.000 0.000 0.000 0.119 0.000
Inventory cost
(ICo)
0.140 0.000 0.020 0.050 0.000 0.000 0.230 0.098 0.000 0.091
Value of
inventory (VoI)
0.047 0.000 0.081 0.050 0.000 0.230 0.000 0.024 0.000 0.030
Inventory
turnover (ITu)
0.016 0.251 0.148 0.169 0.000 0.079 0.066 0.000 0.061 0.040
Inventory
usage (IU)
0.065 0.000 0.056 0.000 0.188 0.028 0.036 0.160 0.000 0.280
Product
standardization
(PS)
0.016 0.000 0.022 0.056 0.063 0.015 0.020 0.160 0.303 0.000

APPENDIX
284
Limit supermatrix
Quality Cost Productivity O ISL IV IA ICr ICo VoI ITu IU PS
Objectives (O) 0.000 0.000 0.000 0.000 0.000 0.000 0.000 0.000 0.000 0.000
Inventory
service level
(ISL) 0.289 0.289 0.289 0.289 0.289 0.289 0.289 0.289 0.289 0.289
Inventory
visibility (IV) 0.106 0.106 0.106 0.106 0.106 0.106 0.106 0.106 0.106 0.106
Inventory
accuracy (IA) 0.123 0.123 0.123 0.123 0.123 0.123 0.123 0.123 0.123 0.123
Inventory
criticality (ICr) 0.164 0.164 0.164 0.164 0.164 0.164 0.164 0.164 0.164 0.164
Inventory cost
(ICo) 0.032 0.032 0.032 0.032 0.032 0.032 0.032 0.032 0.032 0.032
Value of
inventory (VoI) 0.027 0.027 0.027 0.027 0.027 0.027 0.027 0.027 0.027 0.027
Inventory
turnover (ITu) 0.120 0.120 0.120 0.120 0.120 0.120 0.120 0.120 0.120 0.120
Inventory
usage (IU) 0.075 0.075 0.075 0.075 0.075 0.075 0.075 0.075 0.075 0.075
Product
standardization
(PS) 0.063 0.063 0.063 0.063 0.063 0.063 0.063 0.063 0.063 0.063
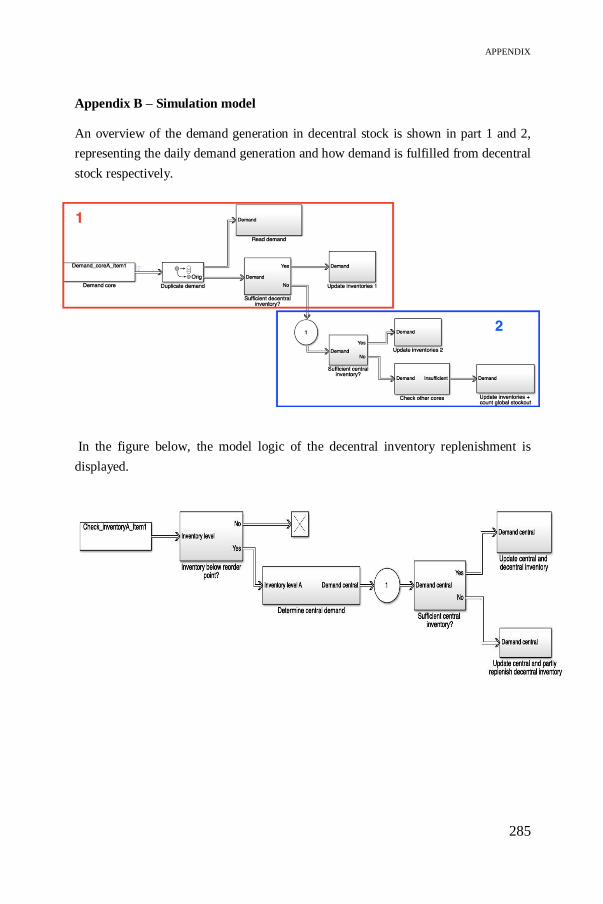
APPENDIX
285
Appendix B – Simulation model
An overview of the demand generation in decentral stock is shown in part 1 and 2,
representing the daily demand generation and how demand is fulfilled from decentral
stock respectively.
In the figure below, the model logic of the decentral inventory replenishment is
displayed.
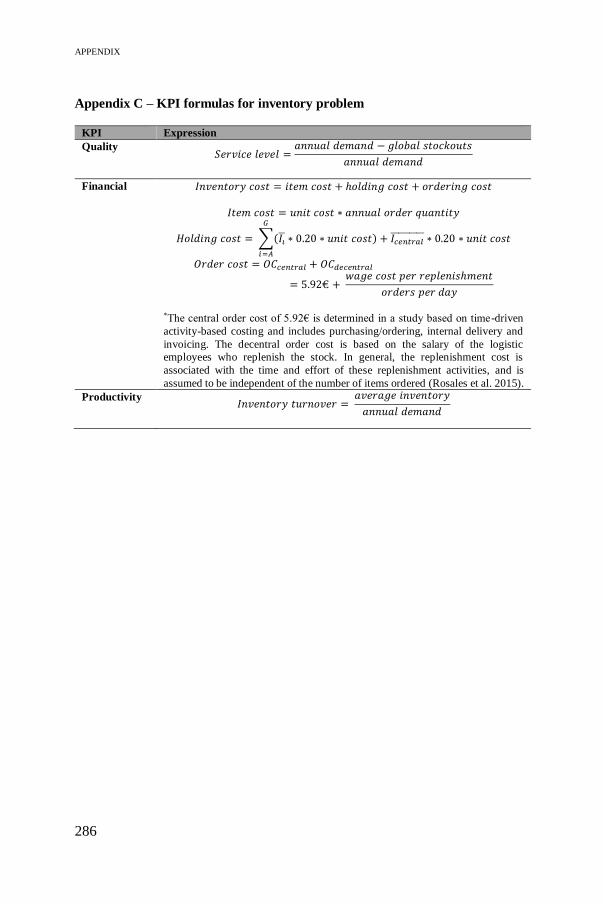
APPENDIX
286
Appendix C – KPI formulas for inventory problem
KPI Expression
Quality 𝑆𝑒𝑟𝑣𝑖𝑐𝑒 𝑙𝑒𝑣𝑒𝑙 =
𝑎𝑛𝑛𝑢𝑎𝑙 𝑑𝑒𝑚𝑎𝑛𝑑 − 𝑔𝑙𝑜𝑏𝑎𝑙 𝑠𝑡𝑜𝑐𝑘𝑜𝑢𝑡𝑠
𝑎𝑛𝑛𝑢𝑎𝑙 𝑑𝑒𝑚𝑎𝑛𝑑
Financial 𝐼𝑛𝑣𝑒𝑛𝑡𝑜𝑟𝑦 𝑐𝑜𝑠𝑡 = 𝑖𝑡𝑒𝑚 𝑐𝑜𝑠𝑡 + ℎ𝑜𝑙𝑑𝑖𝑛𝑔 𝑐𝑜𝑠𝑡 + 𝑜𝑟𝑑𝑒𝑟𝑖𝑛𝑔 𝑐𝑜𝑠𝑡
𝐼𝑡𝑒𝑚 𝑐𝑜𝑠𝑡 = 𝑢𝑛𝑖𝑡 𝑐𝑜𝑠𝑡 ∗ 𝑎𝑛𝑛𝑢𝑎𝑙 𝑜𝑟𝑑𝑒𝑟 𝑞𝑢𝑎𝑛𝑡𝑖𝑡𝑦
𝐻𝑜𝑙𝑑𝑖𝑛𝑔 𝑐𝑜𝑠𝑡 = ∑(𝐼�̅� ∗ 0.20 ∗ 𝑢𝑛𝑖𝑡 𝑐𝑜𝑠𝑡) + 𝐼𝑐𝑒𝑛𝑡𝑟𝑎𝑙̅̅ ̅̅ ̅̅ ̅̅ ̅ ∗ 0.20 ∗ 𝑢𝑛𝑖𝑡 𝑐𝑜𝑠𝑡
𝐺
𝑖=𝐴
𝑂𝑟𝑑𝑒𝑟 𝑐𝑜𝑠𝑡 = 𝑂𝐶𝑐𝑒𝑛𝑡𝑟𝑎𝑙 + 𝑂𝐶𝑑𝑒𝑐𝑒𝑛𝑡𝑟𝑎𝑙
= 5.92€ + 𝑤𝑎𝑔𝑒 𝑐𝑜𝑠𝑡 𝑝𝑒𝑟 𝑟𝑒𝑝𝑙𝑒𝑛𝑖𝑠ℎ𝑚𝑒𝑛𝑡
𝑜𝑟𝑑𝑒𝑟𝑠 𝑝𝑒𝑟 𝑑𝑎𝑦
*The central order cost of 5.92€ is determined in a study based on time-driven
activity-based costing and includes purchasing/ordering, internal delivery and
invoicing. The decentral order cost is based on the salary of the logistic
employees who replenish the stock. In general, the replenishment cost is
associated with the time and effort of these replenishment activities, and is
assumed to be independent of the number of items ordered (Rosales et al. 2015).
Productivity 𝐼𝑛𝑣𝑒𝑛𝑡𝑜𝑟𝑦 𝑡𝑢𝑟𝑛𝑜𝑣𝑒𝑟 =
𝑎𝑣𝑒𝑟𝑎𝑔𝑒 𝑖𝑛𝑣𝑒𝑛𝑡𝑜𝑟𝑦
𝑎𝑛𝑛𝑢𝑎𝑙 𝑑𝑒𝑚𝑎𝑛𝑑
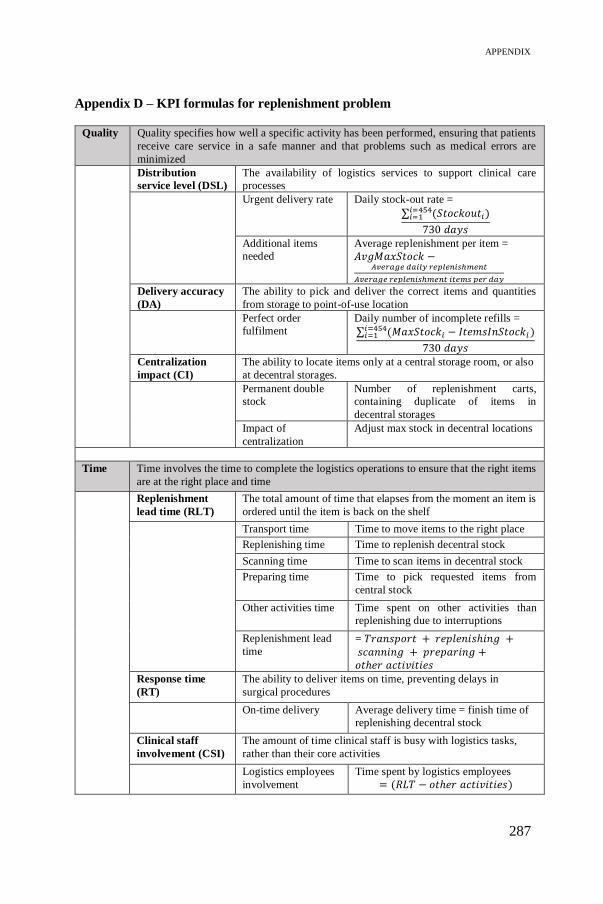
APPENDIX
287
Appendix D – KPI formulas for replenishment problem
Quality Quality specifies how well a specific activity has been performed, ensuring that patients
receive care service in a safe manner and that problems such as medical errors are
minimized
Distribution
service level (DSL)
The availability of logistics services to support clinical care
processes
Urgent delivery rate Daily stock-out rate =
∑ (𝑆𝑡𝑜𝑐𝑘𝑜𝑢𝑡𝑖𝑖=454𝑖=1 )
730 𝑑𝑎𝑦𝑠
Additional items
needed
Average replenishment per item =
𝐴𝑣𝑔𝑀𝑎𝑥𝑆𝑡𝑜𝑐𝑘 −𝐴𝑣𝑒𝑟𝑎𝑔𝑒 𝑑𝑎𝑖𝑙𝑦 𝑟𝑒𝑝𝑙𝑒𝑛𝑖𝑠ℎ𝑚𝑒𝑛𝑡
𝐴𝑣𝑒𝑟𝑎𝑔𝑒 𝑟𝑒𝑝𝑙𝑒𝑛𝑖𝑠ℎ𝑚𝑒𝑛𝑡 𝑖𝑡𝑒𝑚𝑠 𝑝𝑒𝑟 𝑑𝑎𝑦
Delivery accuracy
(DA)
The ability to pick and deliver the correct items and quantities
from storage to point-of-use location
Perfect order
fulfilment
Daily number of incomplete refills =
∑ (𝑀𝑎𝑥𝑆𝑡𝑜𝑐𝑘𝑖 − 𝐼𝑡𝑒𝑚𝑠𝐼𝑛𝑆𝑡𝑜𝑐𝑘𝑖 )𝑖=454𝑖=1
730 𝑑𝑎𝑦𝑠
Centralization
impact (CI)
The ability to locate items only at a central storage room, or also
at decentral storages.
Permanent double
stock
Number of replenishment carts,
containing duplicate of items in
decentral storages
Impact of
centralization
Adjust max stock in decentral locations
Time Time involves the time to complete the logistics operations to ensure that the right items
are at the right place and time
Replenishment
lead time (RLT)
The total amount of time that elapses from the moment an item is
ordered until the item is back on the shelf
Transport time Time to move items to the right place
Replenishing time Time to replenish decentral stock
Scanning time Time to scan items in decentral stock
Preparing time Time to pick requested items from
central stock
Other activities time Time spent on other activities than
replenishing due to interruptions
Replenishment lead
time
= 𝑇𝑟𝑎𝑛𝑠𝑝𝑜𝑟𝑡 + 𝑟𝑒𝑝𝑙𝑒𝑛𝑖𝑠ℎ𝑖𝑛𝑔 + 𝑠𝑐𝑎𝑛𝑛𝑖𝑛𝑔 + 𝑝𝑟𝑒𝑝𝑎𝑟𝑖𝑛𝑔 +𝑜𝑡ℎ𝑒𝑟 𝑎𝑐𝑡𝑖𝑣𝑖𝑡𝑖𝑒𝑠
Response time
(RT)
The ability to deliver items on time, preventing delays in
surgical procedures
On-time delivery Average delivery time = finish time of
replenishing decentral stock
Clinical staff
involvement (CSI)
The amount of time clinical staff is busy with logistics tasks,
rather than their core activities
Logistics employees
involvement
Time spent by logistics employees
= (𝑅𝐿𝑇 − 𝑜𝑡ℎ𝑒𝑟 𝑎𝑐𝑡𝑖𝑣𝑖𝑡𝑖𝑒𝑠)

APPENDIX
288
Financial Financial indicators identify supply chain cost drivers, such as expenses incurred by
departments for providing services, including direct and overhead costs for inventory
and internal distribution
Distribution cost
(DCo)
Total cost of handling and transporting to move supplies from
storage rooms to point-of-care locations
Replenishing cost Related to replenishment lead time
Personnel cost
(PCo)
The cost related to the time personnel is involved with
logistics activities
Personnel cost Related to logistics employees
involvement
Inventory cost The annual cost of holding inventory at a specific storage
room
Holding cost Average holding cost =
[∑ (𝐼𝑡𝑒𝑚𝑠𝐼𝑛𝑆𝑡𝑜𝑐𝑘𝑖
𝐼𝑛𝑣𝑒𝑛𝑡𝑜𝑟𝑦𝐶𝑜𝑢𝑛𝑡)]𝑖=454
𝑖=1 ∗
𝑈𝑛𝑖𝑡𝐶𝑜𝑠𝑡𝑖 ∗ 0.25
Productivity/
Organisation
Productivity/Organisation involves operational control metrics for logistics
departments used for streamlining processes, reducing costs, facilitating information
flow and enhancing provided care services
Case cart
efficiency (CCE)
The availability and utilization of case carts to provide
surgeons with the required supplies
Not applicable for replenishment process
Delivery
frequency (DF)
The number of visits to decentral storage locations to
deliver or replenish items in these locations
Percentage of items
replenished
Daily percentage of item
replenishment = 𝑇𝑜𝑡𝑎𝑙 𝑖𝑡𝑒𝑚𝑠 −𝐷𝑎𝑖𝑙𝑦 𝑛𝑢𝑚𝑏𝑒𝑟 𝑜𝑓 𝑖𝑡𝑒𝑚𝑠 𝑟𝑒𝑝𝑙𝑒𝑛𝑖𝑠ℎ𝑒𝑑
𝑇𝑜𝑡𝑎𝑙 𝑖𝑡𝑒𝑚𝑠 𝑖𝑛𝑐𝑙𝑢𝑑𝑒𝑑
Scanning frequency Use of scanner (0/1)
Visits to decentral
locations
Number of opening relay cabins
Standardization
(S)
The ability to simplify workflows between operating rooms
and improve working conditions
Percentage of
scannable items for
replenishment
= 𝑇𝑜𝑡𝑎𝑙 𝑖𝑡𝑒𝑚𝑠 −𝑁𝑢𝑚𝑏𝑒𝑟 𝑜𝑓 𝑠𝑐𝑎𝑛𝑛𝑎𝑏𝑙𝑒 𝑖𝑡𝑒𝑚𝑠
𝑇𝑜𝑡𝑎𝑙 𝑖𝑡𝑒𝑚𝑠
Personnel
management
(PM)
A measure of how to obtain, use and maintain a satisfied
workforce
Personnel
utilization =
𝑇𝑖𝑚𝑒 𝑏𝑢𝑠𝑦 𝑟𝑒𝑝𝑙𝑒𝑛𝑖𝑠ℎ𝑖𝑛𝑔
480 𝑚𝑖𝑛𝑢𝑡𝑒𝑠
Ergonomics
friendliness
Use of double carts
Workload
distribution
Timeline of logistics employees
interrupted by other activities

APPENDIX
289
Appendix E – ANP weights for surgical case cart distribution problem
ANP weights adapted from Chapter 4.
Distribution objectives Weights KPIs Weights
Quality 0.32 Delivery accuracy 0.17
Centralization 0.17
Time 0.15 Response time 0.10
Financial 0.06 Personnel cost 0.05
Productivity/organisation 0.48 Process standardization 0.29
Personnel utilization 0.22
Response time Weights
Average waiting time 0.23
Average time to finish carts 0.37
Time needed in CSA storage 0.20
Time needed in OKa1-storage 0.20
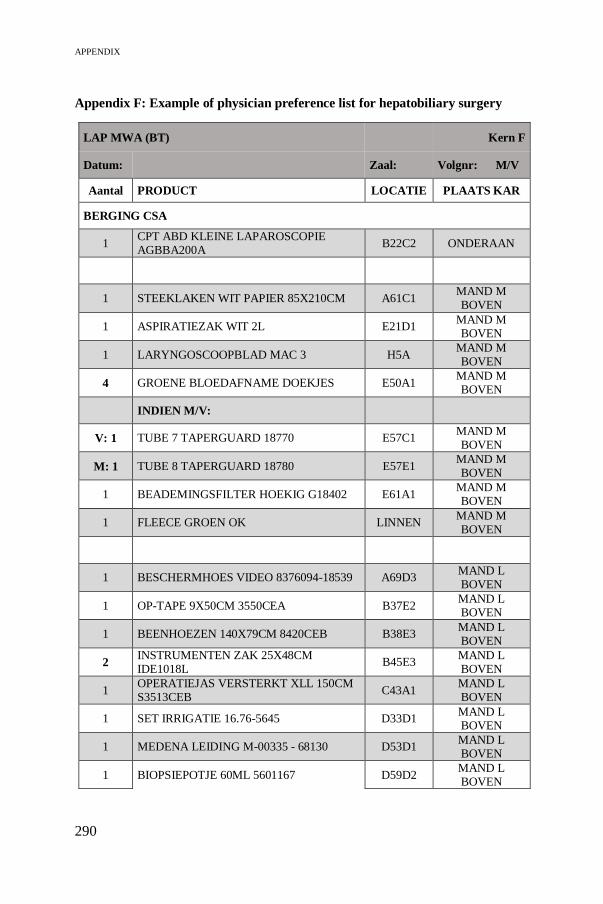
APPENDIX
290
Appendix F: Example of physician preference list for hepatobiliary surgery
LAP MWA (BT) Kern F
Datum: Zaal: Volgnr: M/V
Aantal PRODUCT LOCATIE PLAATS KAR
BERGING CSA
1 CPT ABD KLEINE LAPAROSCOPIE AGBBA200A
B22C2 ONDERAAN
1 STEEKLAKEN WIT PAPIER 85X210CM A61C1 MAND M BOVEN
1 ASPIRATIEZAK WIT 2L E21D1 MAND M BOVEN
1 LARYNGOSCOOPBLAD MAC 3 H5A MAND M BOVEN
4 GROENE BLOEDAFNAME DOEKJES E50A1 MAND M BOVEN
INDIEN M/V:
V: 1 TUBE 7 TAPERGUARD 18770 E57C1 MAND M BOVEN
M: 1 TUBE 8 TAPERGUARD 18780 E57E1 MAND M BOVEN
1 BEADEMINGSFILTER HOEKIG G18402 E61A1 MAND M BOVEN
1 FLEECE GROEN OK LINNEN MAND M BOVEN
1 BESCHERMHOES VIDEO 8376094-18539 A69D3 MAND L BOVEN
1 OP-TAPE 9X50CM 3550CEA B37E2 MAND L BOVEN
1 BEENHOEZEN 140X79CM 8420CEB B38E3 MAND L BOVEN
2 INSTRUMENTEN ZAK 25X48CM IDE1018L
B45E3 MAND L BOVEN
1 OPERATIEJAS VERSTERKT XLL 150CM S3513CEB
C43A1 MAND L BOVEN
1 SET IRRIGATIE 16.76-5645 D33D1 MAND L BOVEN
1 MEDENA LEIDING M-00335 - 68130 D53D1 MAND L BOVEN
1 BIOPSIEPOTJE 60ML 5601167 D59D2 MAND L BOVEN

APPENDIX
291
1 LAPAROSCOPISCHE GAS FILTER E66F1 MAND L BOVEN
1 LAMPENTOPPEN KERN F / G I1D MAND L
BOVEN
1 NIERBEKKEN C65A1 LEGGER 2
BERGING OKA 1
1 SOLERO MW APPLICATOR 00A1 LEGGER 5
1 XCEL TROCAR 12MM ZONDER MES B12LT
02C1 MAND L BOVEN
1 ANGIOCATH 10GX76MM 382287 05B1 NIERBEKKEN
LEGGER 2
1 TRUCUTNAALD LANG GTZ 1420 05B6 MAND L BOVEN
1 HACDIL 50ML UNI DOSIS MED NIERBEKKEN
LEGGER 2
BERGING KERN F
1 LAP CCE R3 6 - A LEGGER 4
1 VIDEOLAP 5MM 30° ZELF TE NEMEN R3 9 - A LEGGER 4
1 DOOSJE OPEN/TOE R3 10 - A LEGGER 2
1 BLAUWE LAP BIPOLAIRE PINCETTEN TOPAL
R4 4 - B LEGGER 3
1 ECHOPROBE BKM LAPSC NIEUW R4 7 - G/H LEGGER 5
TE CHECKEN VOOR DE INGREEP
3L NACL 0,9% IN KOELKAST
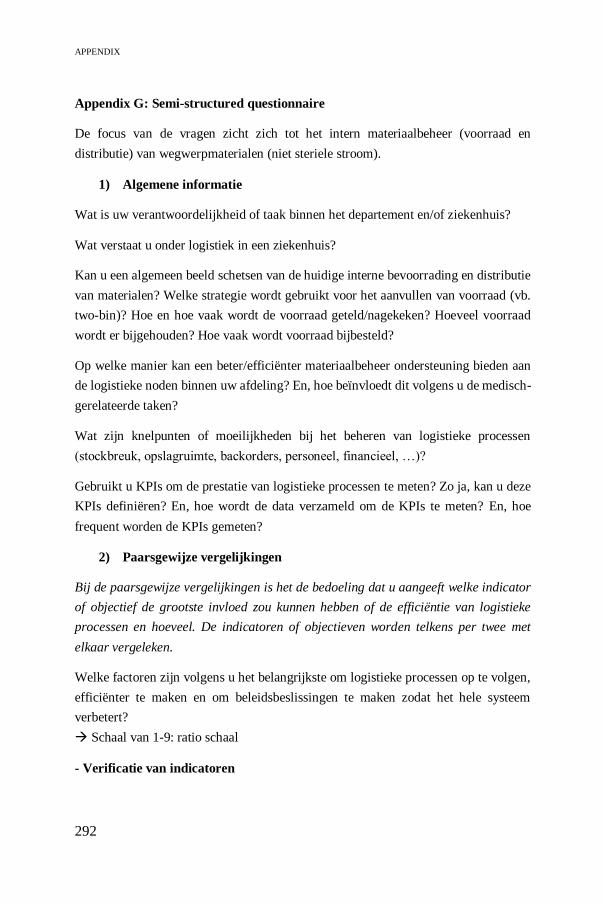
APPENDIX
292
Appendix G: Semi-structured questionnaire
De focus van de vragen zicht zich tot het intern materiaalbeheer (voorraad en
distributie) van wegwerpmaterialen (niet steriele stroom).
1) Algemene informatie
Wat is uw verantwoordelijkheid of taak binnen het departement en/of ziekenhuis?
Wat verstaat u onder logistiek in een ziekenhuis?
Kan u een algemeen beeld schetsen van de huidige interne bevoorrading en distributie
van materialen? Welke strategie wordt gebruikt voor het aanvullen van voorraad (vb.
two-bin)? Hoe en hoe vaak wordt de voorraad geteld/nagekeken? Hoeveel voorraad
wordt er bijgehouden? Hoe vaak wordt voorraad bijbesteld?
Op welke manier kan een beter/efficiënter materiaalbeheer ondersteuning bieden aan
de logistieke noden binnen uw afdeling? En, hoe beïnvloedt dit volgens u de medisch-
gerelateerde taken?
Wat zijn knelpunten of moeilijkheden bij het beheren van logistieke processen
(stockbreuk, opslagruimte, backorders, personeel, financieel, …)?
Gebruikt u KPIs om de prestatie van logistieke processen te meten? Zo ja, kan u deze
KPIs definiëren? En, hoe wordt de data verzameld om de KPIs te meten? En, hoe
frequent worden de KPIs gemeten?
2) Paarsgewijze vergelijkingen
Bij de paarsgewijze vergelijkingen is het de bedoeling dat u aangeeft welke indicator
of objectief de grootste invloed zou kunnen hebben of de efficiëntie van logistieke
processen en hoeveel. De indicatoren of objectieven worden telkens per twee met
elkaar vergeleken.
Welke factoren zijn volgens u het belangrijkste om logistieke processen op te volgen,
efficiënter te maken en om beleidsbeslissingen te maken zodat het hele systeem
verbetert?
Schaal van 1-9: ratio schaal
- Verificatie van indicatoren

APPENDIX
293
Zijn volgens jou alle relevante criteria geïncludeerd in de evaluatie? Zo niet, welk
criterium zou je toevoegen, of verwijderen?
Zijn er factoren die ontbreken in bovengenoemde vragenlijst?
Zijn er factoren die geen invloed hebben in bovengenoemde vragenlijst, en dus
redundant zijn?
- Werking van framework
Hebben de volgende product karakteristieken een impact op wat er belangrijk is in het
opvolgen van de logistieke processen:
Prijs van het product: Zo ja, hoe verandert dit welke aspecten belangrijk zijn
in het logistiek proces? Welke indicatoren worden minder belangrijk of
belangrijker om logistiek efficiënter te maken?
Kriticiteit van het product (door backorder, door impact op operatie, door lead
time): Zo ja, welke indicatoren worden minder belangrijk of belangrijker om
logistiek efficiënter te maken?
Hoe denkt u dat een logistiek framework kan helpen om beleidsbeslissingen te nemen,
zoals bijvoorbeeld outsourcing of producten aankopen in consignatie?
3) Robuustheid framework (enkel OT stakeholders)
De stakeholders worden op de hoogte gebracht van de resultaten van de simulaties. Op
basis hiervan wordt hen gevraagd een score te geven van 1 – 5 om te bepalen wat het
belang is van een indicator met betrekking tot een logistieke verbeteringsmogelijkheid
(vb. scenario).
4) Benchmarking: reële performance score (enkel logistieke stakeholders)
Stakeholders worden gevraagd om op een 5-punten schaal, waarbij 1 ‘strongly
disagree or inadequate’ en 5 ‘strongly agree or adequate’, indicatoren te scoren op de
mate waarin ze momenteel gemeten worden. Op strategisch niveau wordt er ook
gevraagd naar de optimale score om de indicatoren te meten.

APPENDIX
294
Informed consent: Geïnformeerd toestemmingsformulier
Titel van het onderzoeksproject:
Analyse van meerdere stakeholders om de prestatie van interne logistieke processen
binnen de gezondheidszorg te meten.
Naam en statuut van de onderzoeker:
Karen Moons, doctoraatsonderzoeker bij departement werktuigkunde, KU Leuven
1) Ik bevestig dat ik het informatiedocument betreffende het onderzoeksproject
gelezen en begrepen heb en de mogelijkheid heb vragen
te stellen.
2) Ik begrijp dat mijn deelname volledig vrijwillig is en dat
ik op elk moment de kans heb om mij terug te trekken uit
dit onderzoeksproject zonder voorafgaand enige
verklaring te geven.
3) Ik ben akkoord deel te nemen aan het onderzoeksproject
4) Ik ga ermee akkoord dat er audio opnames gemaakt
worden van de interviews: JA - NEEN
5) Ik ga ermee akkoord dat citaten anoniem worden weergegeven in
toekomstige publicatie: JA - NEEN
Naam
(deelnemer):………………………………Handtekening………………………
Karen Moons (onderzoeker) Datum:…………………..Handtekening:………………
Parafeer

295
LIST OF REFERENCES
Abdul-Jalbar, B., J. Gutiérrez, J. Puerto, and J. Sicilia. 2003. “Policies for
Inventory/Distribution Systems: The Effect of Centralization vs.
Decentralization.” Pp. 281–93 in International Journal of Production
Economics. Vols. 81–82.
Abdullah, Lazim, Waimun Chan, and Alireza Afshari. 2019. “Application of
PROMETHEE Method for Green Supplier Selection: A Comparative Result
Based on Preference Functions.” Journal of Industrial Engineering
International.
Abdulsalam, Yousef, Mohan Gopalakrishnan, Arnold Maltz, and Eugene Schneller.
2015. “Health Care Matters: Supply Chains In and Of the Health Sector.”
Journal of Business Logistics.
Abdulsalam, Yousef, and Eugene Schneller. 2019. “Hospital Supply Expenses: An
Important Ingredient in Health Services Research.” Medical Care Research
and Review.
Abukhousa, Eman, Jameela Al-jaroodi, Sanja Lazarova-molnar, and Nader
Mohamed. 2014. “Simulation and Modeling Efforts to Support Decision
Making in Healthcare Supply Chain Management.” The ScientificWorld
Journal 2014:16.
Adunlin, Georges, Vakaramoko Diaby, and Hong Xiao. 2015. “Application of
Multicriteria Decision Analysis in Health Care: A Systematic Review and
Bibliometric Analysis.” Health Expectations 18(6):1894–1905.
Agbo, Cornelius, Qusay Mahmoud, and J. Eklund. 2019. “Blockchain Technology in
Healthcare: A Systematic Review.” Healthcare.
Ageron, Blandine, Smail Benzidia, and Michael Bourlakis. 2018. “Healthcare Logistics and Supply Chain – Issues and Future Challenges.” Supply Chain
Forum.
Ahmadi, Ehsan, Dale T. Masel, and Seth Hostetler. 2019. “A Robust Stochastic Decision-Making Model for Inventory Allocation of Surgical Supplies to
Reduce Logistics Costs in Hospitals: A Case Study.” Operations Research for
Health Care.
Ahmadi, Ehsan, Dale T. Masel, Ashley Y. Metcalf, and Kristin Schuller. 2018. “Inventory Management of Surgical Supplies and Sterile Instruments in
Hospitals: A Literature Review.” Health Systems.
Ait El Cadi, Abdessamad, Ali Gharbi, and Abdelhakim Artiba. 2016.
“Matlab/Simulink vs Arena/Optquest: Optimal Production Control of

LIST OF REFERENCES
296
Unreliable Manufacturing Systems.” in 11th International Conference on
Modeling, Optimization and Simulation. Montréal.
Al-Qatawneh, L., and K. Hafeez. 2011. “Healthcare Logistics Cost Optimization
Using a Multi-Criteria Inventory Classification.” International Conference on
Industrial 506–12.
Alotaibi, Shoayee, and Rashid Mehmood. 2018. “Big Data Enabled Healthcare
Supply Chain Management: Opportunities and Challenges.” in Lecture Notes
of the Institute for Computer Sciences, Social-Informatics and
Telecommunications Engineering, LNICST.
Altuzarra, Alfredo, José María Moreno-Jiménez, and Manuel Salvador. 2007. “A
Bayesian Priorization Procedure for AHP-Group Decision Making.” European
Journal of Operational Research.
Antonacci, Grazia, Julie E. Reed, Laura Lennox, and James Barlow. 2018. “The Use
of Process Mapping in Healthcare Quality Improvement Projects.” Health
Services Management Research.
Anupindi, Ravi, Sunil Chopra, Sudhaker Deshmukh, Jan Van Mieghem, and Eitan
Zemel. 2012. Managing Business Process Flows: Principles of Operations
Management.
Aptel, Olivier, Michèle Pomberg, and Hamid Pourjalali. 2009. “Improving Activities
of Logistics Departments in Hospitals: A Comparison of French and U.S.
Hospitals.” Journal of Applied Management Accounting Research.
Armstrong, J., and A. Bywater. 2018. “What Healthcare Organizations Should Know
about the GDPR.” Absolute Healthcare Whitepaper.
Aronovich, Dana, Marie Tien, Ethan Collins, Adriano Sommerlatte, and Linda Allain. 2010. “Measuring Supply Chain Performance: Guide to Key
Performance Indicators for Public Health Managers.” U.S. Agency for
International Development (May):62.
Aronsson, Håkan, Mats Abrahamsson, and Karen Spens. 2011. “Developing Lean
and Agile Health Care Supply Chains.” Supply Chain Management.
Augusto, Vincent, and Xiaolan Xie. 2009. “Redesigning Pharmacy Delivery
Processes of a Health Care Complex.” Health Care Management Science
12(2):166–78.
Ayag, Zeki, and Rifat Gürcan Özdemir. 2012. “Evaluating Machine Tool
Alternatives through Modified TOPSIS and Alpha-Cut Based Fuzzy ANP.” in
International Journal of Production Economics.
Baboli, A., T. Hassan, A. Guinet, G. Leboucher, and M. T. Brandon. 2005.
“Modélisation de La Chaîne Logistique Aval d’un Établissement Hospitalier
Par Le Modèle SCOR.” in 6e congrès international de génie industriel.
LIST OF REFERENCES
297
Besançon.
Baboli, Armand, Julien Fondrevelle, Reza Tavakkoli-Moghaddam, and Ali Mehrabi.
2011. “A Replenishment Policy Based on Joint Optimization in a Downstream
Pharmaceutical Supply Chain: Centralized vs. Decentralized Replenishment.”
International Journal of Advanced Manufacturing Technology 57(1–4):367–
78.
Babulak, Eduard, and Ming Wang. 2012. “Discrete Event Simulation: State of the
Art.” in Discrete Event Simulations.
Bana E Costa, Carlos A., Jean Marie De Corte, and Jean Claude Vansnick. 2012.
“MACBETH.” International Journal of Information Technology and Decision
Making.
Banerjea-Brodeur, M., J. F. Cordeau, G. Laporte, and A. Lasry. 1998. “Scheduling
Linen Deliveries in a Large Hospital.” Journal of the Operational Research
Society.
Barfod, Michael, and Steen Leleur. 2014. “Multi-Criteria Decision Analysis for Use
in Transport Decision Making.” DTU Transport Compendium Series (2).
Bartholdi, John, and Steven Hackman. 2008. Warehouse & Distribution Science :
Release 0.89. The Supply. Atlanta.
Bates, David W., Axel Heitmueller, Meetali Kakad, and Suchi Saria. 2018. “Why
Policymakers Should Care about ‘Big Data’ in Healthcare.” Health Policy and
Technology.
Beaulieu, Martin, and Sylvain Landry. 2010. Achieving Lean Healthcare by
Combining the Two-Bin Kanban Replenishment System with RFID Technology.
Beaulieu, Martin, C. Quellette, Monique Bielen, and Maria Costin. 2013.
“Automating Inventory Management.” Healthcare Purchasing News, 42–43.
Beck, Patrick, and Erik Hofmann. 2014. “Multiple Criteria Decision Making in
Supply Chain Management : Currently Available Methods and Possibilities for
Future Research.” Die Unternehmung 66(2):2012.
Behzadian, Majid, RB Kazemzadeh, A. Albadvi, and M. Aghdasi. 2010. “Promethee:
A Comprehensive Literature Review on Methodologies and Applications.”
European Journal of Operational Research 200(1):198–215.
Beierle, Thomas C. 2002. “The Quality of Stakeholder-Based Decisions.” Risk
Analysis.
Bélanger, Valérie, Martin Beaulieu, Sylvain Landry, and Pablo Morales. 2018.
“Where to Locate Medical Supplies in Nursing Units: An Exploratory Study.”
Supply Chain Forum: An International Journal.

LIST OF REFERENCES
298
Belgian Cancer Registry, BCR. 2017. Cancer Fact Sheet Prostate Cancer.
Belliveau, Jacqueline. 2016. “Exploring the Role of Supply Chain Management in
Healthcare.” Retrieved (https://revcycleintelligence.com/news/exploring-the-
role-of-supply-chain-management-in-healthcare).
Belton, Valerie, and Jacques Pictet. 1997. “A Framework for Group Decision Using
a Mcda Model: Sharing, Aggregating or Comparing Individual Information?”
Journal of Decision Systems.
Bendavid, Ygal, and Harold Boeck. 2011. “Using RFID to Improve Hospital Supply
Chain Management for High Value and Consignment Items.” in Procedia
Computer Science.
Berwick, Donald M., Thomas W. Nolan, and John Whittington. 2008. “The Triple
Aim: Care, Health, and Cost.” Health Affairs.
Bett, Lawrence, M. Van Oyen, M. Claysen, and M. Duck. 2010. Analysis of the Instrument Picking Process in a Case Cart System at the University of
Michigan Hospital.
Bijvank, M., and I. F. A. Vis. 2012. “Inventory Control for Point-of-Use Locations in
Hospitals.” Journal of the Operational Research Society 63(4):497–510.
Bodenheimer, Thomas, and Christine Sinsky. 2014. “From Triple to Quadruple Aim:
Care of the Patient Requires Care of the Provider.” Annals of Family Medicine.
Böhme, Tillmann, Sharon J. Williams, Paul Childerhouse, Eric Deakins, and Denis
Towill. 2016. “Causes, Effects and Mitigation of Unreliable Healthcare
Supplies.” Production Planning and Control.
Bošnjaković, Mladen. 2010. “Multicriteria Inventory Model for Spare Parts.” Issn.
Braglia, Marcello, Andrea Grassi, and Roberta Montanari. 2004. “Multi-Attribute
Classification Method for Spare Parts Inventory Management.” Journal of
Quality in Maintenance Engineering.
Brailsford, S. C., P. R. Harper, B. Patel, and M. Pitt. 2009. “An Analysis of the
Academic Literature on Simulation and Modelling in Health Care.” Journal of
Simulation 3(3):130–40.
Brailsford, S. C., V. A. Lattimer, P. Tarnaras, and J. C. Turnbull. 2004. “Emergency
and On-Demand Health Care: Modelling a Large Complex System.” Journal of
the Operational Research Society.
Brailsford, Sally C., Tillal Eldabi, Martin Kunc, Navonil Mustafee, and Andres F.
Osorio. 2019. “Hybrid Simulation Modelling in Operational Research: A State-
of-the-Art Review.” European Journal of Operational Research.
Brailsford, Sc, and Na Hilton. 2001. “A Comparison of Discrete Event Simulation
LIST OF REFERENCES
299
and System Dynamics for Modelling Health Care Systems.” Proceedings from
ORAHS 2000.
Brans, J. P., Ph Vincke, and B. Mareschal. 1986. “How to Select and How to Rank
Projects: The Promethee Method.” European Journal of Operational Research.
Brans, Jean Pierre, and Bertrand Mareschal. 1994. “The PROMCALC & GAIA
Decision Support System for Multicriteria Decision Aid.” Decision Support
Systems.
Brans, JP, and P. Vincke. 1985. “A Preference Ranking Organization Method: The
PROMETHEE Method for MCDM.” Management Science.
Burns, Lawton R., and J. Andrew Lee. 2008. “Hospital Purchasing Alliances:
Utilization, Services, and Performance.” Health Care Management Review.
Callender, Carlos, and Scott E. Grasman. 2010. “Barriers and Best Practices for
Material Management in the Healthcare Sector.” EMJ - Engineering
Management Journal 22(4):11–19.
Camp, Margaret, Judith Pfister, Donna Reeves, and Julia Kneedler. 2014. “Effective
Operating Room Inventory Management.” Pfiedler Enterprises, 26.
Cardinal Health. 2015. 10 Barriers to Effective Inventory Management.
Cardoen, Brecht, Jeroen Beliën, and Mario Vanhoucke. 2015. “On the Design of
Custom Packs: Grouping of Medical Disposable Items for Surgeries.”
International Journal of Production Research.
Cardoen, Brecht, and Dirk De Ridder. 2019. Hospital of the Future.
Carlucci, Daniela. 2010. “Evaluating and Selecting Key Performance Indicators: An
ANP-Based Model.” Measuring Business Excellence.
Carroll, Roberta. 2014. Enterprise Risk Management: A Framework for Success.
Carrus, Pier Paolo, Fabiana Marras, and Roberta Pinna. 2015. “The Performance
Measurement of Changes in the Logistics of Health Goods: A Theoretical
Model.” Proceedings of the 18th Toulon-Verona International Conference 85–
100.
Chan, Felix T. S., and H. K. Chan. 2011. “Improving the Productivity of Order
Picking of a Manual-Pick and Multi-Level Rack Distribution Warehouse
through the Implementation of Class-Based Storage.” Expert Systems with
Applications.
Chatterjee, Debmallya, and Bani Mukherjee. 2013. “A Study on the Comparison of
AHP and Fuzzy AHP Evaluations of Private Technical Institutions in India.”
International Journal of Innovative Technology and Research 1(4):283–91.
Chen, Fangyu, Hongwei Wang, Chao Qi, and Yong Xie. 2013. “An Ant Colony

LIST OF REFERENCES
300
Optimization Routing Algorithm for Two Order Pickers with Congestion
Consideration.” Computers and Industrial Engineering.
Chopra, Sunil, and Peter Meindl. 2010. Supply Chain Management: Strategy,
Planning, and Operation.
Claes, Stephan, Daniel Berckmans, Liesbet Geris, Inez Myin-Germeys, Chantal Van
Audenhove, Ilse Van Diest, Chris Van Hoof, Ine Van Hoyweghen, Sabine Van
Huffel, and Elske Vrieze. 2019. Mobile Health Revolution in Healthcare: Are
We Ready.
Copenhaver, Martin S., Tynan H. Friend, Courtney Fitzgerald-Brown, Mario
Fernandez, Michael Addesa, James Cassidy, Mark Rosa, Jane Ouellette, Janice
Plunkett, Dale Spracklin, Patrice Osgood, Ana Cecilia Zenteno Langle, and
Wilton C. Levine. 2017. “Improving Operating Room and Surgical
Instrumentation Efficiency, Safety, and Communication via the
Implementation of Emergency Laparoscopic Cholecystectomy and
Appendectomy Conversion Case Carts.” Perioperative Care and Operating
Room Management.
Council of Supply Chain Management Professionals, CSCMP. 2016. “Definition of
Logistics Management.”
Creative Decisions Foundation. 2019. “Super Decisions.” Retrieved
(https://www.superdecisions.com/).
D’Hoore, Jasper. 2018. “Rode Cijfers Ziekenhuizen Gevaar Voor Zorg.” De Tijd.
Dağdeviren, Metin. 2008. “Decision Making in Equipment Selection: An Integrated
Approach with AHP and PROMETHEE.” Journal of Intelligent
Manufacturing.
Danas, Konstantinos, Abdul Roudsari, and Panayiotis H. Ketikidis. 2006. “The
Applicability of a Multi‐attribute Classification Framework in the Healthcare
Industry.” Journal of Manufacturing Technology Management 17(6):772–85.
Danner, Marion, J. Marjan Hummel, Fabian Volz, Jeannette G. Van Manen, Beate Wiegard, Charalabos Markos Dintsios, Hilda Bastian, Andreas Gerber, and
Maarten J. Ijzerman. 2011. “Integrating Patients’ Views into Health
Technology Assessment: Analytic Hierarchy Process (AHP) as a Method to
Elicit Patient Preferences.” International Journal of Technology Assessment in
Health Care.
Davenport, Thomas, and Ravi Kalakota. 2019. “The Potential for Artificial
Intelligence in Healthcare.” Future Healthcare Journal.
Dellaert, Nico, and Erik V. Van De Poel. 1996. “Global Inventory Control in an Academic Hospital.” International Journal of Production Economics 46–
47:277–84.

LIST OF REFERENCES
301
Deloitte. 2017. The Hospital of the Future: How Digital Technologies Can Change
Hospitals Globally.
Deloitte. 2018a. Giving Healthcare Providers a Digital Edge.
Deloitte. 2018b. Volume- to Value-Based Care: Physicians Are Willing to Manage
Costs but Lack Data and Tools.
Deloitte. 2019. Global Health Care Outlook: Shaping the Future.
Deloitte. 2020. 2020 Global Health Care Outlook.
Denton, Brian T. 2013. Handbook of Healthcare Operations Management. Methods
and Applications.
Devarajan, Divya, and M. S. Jayamohan. 2016. “Stock Control in a Chemical Firm:
Combined FSN and XYZ Analysis.” Procedia Technology.
Devis, Ben, and Jan Van Ooteghem. 2016. HIPS: Coordinating and Optimizing
Hospitals’ Patient, Medical Supply and Information Flows.
Devnani, M., A. Gupta, and R. Nigah. 2010. “ABC and VED Analysis of the
Pharmacy Store of a Tertiary Care Teaching, Research and Referral Healthcare
Institute of India.” Journal of Young Pharmacists.
DHL. 2017. The Future of Life Sciences and Healthcare Logistics.
Diaby, Vakaramoko, Kaitryn Campbell, and Ron Goeree. 2013. “Multi-Criteria
Decision Analysis (MCDA) in Health Care: A Bibliometric Analysis.”
Operations Research for Health Care 2(1–2):20–24.
Diaby, Vakaramoko, and Ron Goeree. 2014. “How to Use Multi-Criteria Decision
Analysis Methods for Reimbursement Decision-Making in Healthcare: A Step-
by-Step Guide.” Expert Review of Pharmacoeconomics and Outcomes
Research.
Diconsiglio, J. 2005. “A Crash Course in Standardization.” Materials Management in
Health Care 14(4):40.
Dimitropoulos, Panagiotis E. 2017. “Performance Management in Healthcare
Organizations: Concept and Practicum.” in Advances in Experimental
Medicine and Biology.
Dinh-Le, Catherine, Rachel Chuang, Sara Chokshi, and Devin Mann. 2019.
“Wearable Health Technology and Electronic Health Record Integration:
Scoping Review and Future Directions.” JMIR MHealth and UHealth.
Dobrea, Răzvan Cătalin, Gabriela Molănescu, and Cristian Busu. 2015. “Food
Sustainable Model Development: An ANP Approach to Prioritize Sustainable
Factors in the Romanian Natural Soft Drinks Industry Context.” Sustainability
(Switzerland).

LIST OF REFERENCES
302
Dobrzykowski, David, Vafa Saboori Deilami, Paul Hong, and Seung Chul Kim.
2014. “A Structured Analysis of Operations and Supply Chain Management
Research in Healthcare (1982-2011).” International Journal of Production
Economics 147(PART B).
Dooner, Robert. 2014. “How Supply Chain Management Can Help to Control
Health-Care Cost.” Supply Chain Quarterly.
Duan, Qinglin, and T. Warren Liao. 2013. “A New Age-Based Replenishment Policy
for Supply Chain Inventory Optimization of Highly Perishable Products.”
International Journal of Production Economics 145(2):658–71.
Dyer, James S. 2008. “Remarks on the Analytic Hierarchy Process.” Management
Science.
Dyer, Robert F., and Ernest H. Forman. 1992. “Group Decision Support with the
Analytic Hierarchy Process.” Decision Support Systems.
Eaidgah Torghabehi, Youness, Alireza Arab Maki, Kylie Kurczewski, and Amir
Abdekhodaee. 2016. “Visual Management, Performance Management and
Continuous Improvement: A Lean Manufacturing Approach.” International
Journal of Lean Six Sigma.
Ehrgott, Matthias, José Rui Figueira, and Salvatore Grego. 2010. “Trends in Multiple
Criteria Decision Analysis.” LIVRO.
Epstein, Richard H., and Franklin Dexter. 2000. “Economic Analysis of Linking Operating Room Scheduling and Hospital Material Management Information
Systems for Just-in-Time Inventory Control.” Anesthesia & Analgesia
91(2):337–43.
Essoussi, Imene Elhachfi, and Pierre Ladet. 2009. “Towards Resource Pooling in Cooperative Health Care Networks: Case Ofmedical Supply Centralization.”
2009 International Conference on Computers and Industrial Engineering, CIE
2009 600–605.
Etges, Ana Paula Beck Da Silva, Veronique Grenon, Ming Lu, Ricardo Bertoglio Cardoso, Joana Siqueira De Souza, Francisco José Kliemann Neto, and Elaine
Aparecida Felix. 2018. “Development of an Enterprise Risk Inventory for
Healthcare.” BMC Health Services Research.
Falzarano, Mary, and Genevieve Pinto Zipp. 2013. “Seeking Consensus through the Use of the Delphi Technique in Health Sciences Research.” Journal of Allied
Health.
Feibert, Diana Cordes. 2017. “Improving Healthcare Logistics Processes.” Danmarks
Tekniske Universitet.
Feibert, Diana Cordes, Bjørn Andersen, and Peter Jacobsen. 2017. “Benchmarking
Healthcare Logistics Processes – a Comparative Case Study of Danish and US

LIST OF REFERENCES
303
Hospitals.” Total Quality Management and Business Excellence 3363(June):1–
27.
Feibert, Diana Cordes, and Peter Jacobsen. 2015. “Measuring Process Performance
within Healthcare Logistics - a Decision Tool for Selecting Track and Trace
Technologies.” Academy of Strategic Management Journal.
Fixler, Tamas, and James G. Wright. 2013. “Identification and Use of Operating
Room Efficiency Indicators: The Problem of Definition.” Canadian Journal of
Surgery 56(4):224–26.
Flores, Benito E., David L. Olson, and V. K. Dorai. 1992. “Management of
Multicriteria Inventory Classification.” Mathematical and Computer
Modelling.
Flores, Benito E., and Clay D. Whybark. 2008. “Multiple Criteria ABC Analysis.”
International Journal of Operations & Production Management.
Fontenot, Philip A., and Ahmed M. Mansour. 2013. “Reporting Positive Surgical
Margins after Radical Prostatectomy: Time for Standardization.” BJU
International.
Fossati, Nicola, Ettore Di Trapani, Giorgio Gandaglia, Paolo Dell’Oglio, Paolo Umari, Nicolò Maria Buffi, Giorgio Guazzoni, Alexander Mottrie, Franco
Gaboardi, Francesco Montorsi, Alberto Briganti, and Nazareno Suardi. 2017.
“Assessing the Impact of Surgeon Experience on Urinary Continence Recovery
After Robot-Assisted Radical Prostatectomy: Results of Four High-Volume
Surgeons.” Journal of Endourology 31(9):end.2017.0085.
Freitas, Ângela, Paula Santana, Mónica D. Oliveira, Ricardo Almendra, João C. Bana
E Costa, and Carlos A. Bana E Costa. 2018. “Indicators for Evaluating
European Population Health: A Delphi Selection Process.” BMC Public
Health.
French, S., and B. Roy. 1997. “Multicriteria Methodology for Decision Aiding.” The
Journal of the Operational Research Society.
García-Melón, Mónica, Tomás Gómez-Navarro, and Silvia Acuña-Dutra. 2012. “A
Combined ANP-Delphi Approach to Evaluate Sustainable Tourism.”
Environmental Impact Assessment Review.
García-Melón, Mónica, Blanca Pérez-Gladish, Tomás Gómez-Navarro, and Paz Mendez-Rodriguez. 2016. “Assessing Mutual Funds’ Corporate Social
Responsibility: A Multistakeholder-AHP Based Methodology.” Annals of
Operations Research.
Gebicki, Marek, Ed Mooney, Shi Jie (Gary) Chen, and Lukasz M. Mazur. 2014. “Evaluation of Hospital Medication Inventory Policies.” Health Care
Management Science 17(3):215–29.

LIST OF REFERENCES
304
Gitelis, Matthew, Yalini Vigneswaran, Michael B. Ujiki, Woody Denham, Mark
Talamonti, Joseph P. Muldoon, and John G. Linn. 2015. “Educating Surgeons
on Intraoperative Disposable Supply Costs during Laparoscopic
Cholecystectomy: A Regional Health System’s Experience.” American Journal
of Surgery 209(3):488–92.
Goetghebeur, Mireille M., Monika Wagner, Hanane Khoury, Randy J. Levitt, Lonny
J. Erickson, and Donna Rindress. 2012. “Bridging Health Technology
Assessment (HTA) and Efficient Health Care Decision Making with
Multicriteria Decision Analysis (MCDA): Applying the Evidem Framework to
Medicines Appraisal.” Medical Decision Making.
Govindan, Kannan, Devika Kannan, and K. Madan Shankar. 2014. “Evaluating the
Drivers of Corporate Social Responsibility in the Mining Industry with Multi-
Criteria Approach: A Multi-Stakeholder Perspective.” Journal of Cleaner
Production.
Gowen, Charles R., and William J. Tallon. 2003. “Enhancing Supply Chain Practices
through Human Resource Management.” Journal of Management
Development.
Greenwood, Allen G., Pawel Pawlewski, and Grzegorz Bocewicz. 2013. “A
Conceptual Design Tool to Facilitate Simulation Model Development: Object
Flow Diagram.” in Proceedings of the 2013 Winter Simulation Conference -
Simulation: Making Decisions in a Complex World, WSC 2013.
GS1. 2018. “GS1 Healthcare Reference Book 2017-2018.” GS1 Healthcare
Reference Book 2017-2018.
Guerrero, W. J., T. G. Yeung, and C. Guéret. 2013. “Joint-Optimization of Inventory
Policies on a Multi-Product Multi-Echelon Pharmaceutical System with
Batching and Ordering Constraints.” European Journal of Operational
Research 231(1):98–108.
Guimarães, Alexandre Magno Castañon, José Eugenio Leal, and Paulo Mendes.
2018. “Discrete-Event Simulation Software Selection for Manufacturing Based
on the Maturity Model.” Computers in Industry.
Guimarâes, Cristina Machado, and José Crespo de Carvalho. 2011. “Outsourcing in
the Healthcare Sector-A State-of-the-Art Review.” Supply Chain Forum: An
International Journal.
Gumus, Selcuk. 2017. “An Evaluation of Stakeholder Perception Differences in
Forest Road Assessment Factors Using the Analytic Hierarchy Process
(AHP).” Forests.
Günal, M. M., and M. Pidd. 2010. “Discrete Event Simulation for Performance
Modelling in Health Care: A Review of the Literature.” Journal of Simulation.

LIST OF REFERENCES
305
Gunal, Murat M. 2012. “A Guide for Building Hospital Simulation Models.” Health
Systems 1(1):17–25.
Gupta, R., K. K. Gupta, B. R. Jain, and R. K. Garg. 2007. “ABC and VED Analysis
in Medical Stores Inventory Control.” Medical Journal Armed Forces India
63(4):325–27.
Guseva, Elena, Tatyana Varfolomeyeva, Irina Efimova, and Irina Movchan. 2018.
“Discrete Event Simulation Modelling of Patient Service Management with
Arena.” in Journal of Physics: Conference Series.
Hall, Randolph. 2012. Handbook of Healthcare System Scheduling.
Hans, Erwin W., Mark Van Houdenhoven, and Peter J. H. Hulshof. 2012. “A
Framework for Healthcare Planning and Control.” in International Series in
Operations Research and Management Science.
Hansen, Paul, and Franz Ombler. 2008. “A New Method for Scoring Additive Multi-Attribute Value Models Using Pairwise Rankings of Alternatives.” Journal of
Multi-Criteria Decision Analysis.
Hariharan, Seetharaman, Prasanta K. Dey, Harley S. L. Moseley, Areti Y. Kumar,
and Jagathi Gora. 2004. “A New Tool for Measurement of Process‐based Performance of Multispecialty Tertiary Care Hospitals.” International Journal
of Health Care Quality Assurance 17(6):302–12.
Harvey, Lara F. B., Katherine A. Smith, and Howard Curlin. 2017. “Physician Engagement in Improving Operative Supply Chain Efficiency Through Review
of Surgeon Preference Cards.” Journal of Minimally Invasive Gynecology.
Hoeksema, Janice. 2011. “Taking Steps to Control Costs in the OR.” AORN Journal
94(6 SUPPL.):S79–87.
Hoeur, Soriya, and Duangpun Kritchanchai. 2015. “Key Performance Indicator
Framework for Measuring Healthcare Logistics in ASEAN.” Toward
Sustailnable Opertions of Supply Chain and Logistics System.
Hogarth, Robin M. 1980. Judgement and Choice: The Psychology of Decision.
Chichester: Wiley.
Holm, Lene Berge, Hilde Lurås, and Fredrik A. Dahl. 2013. “Improving Hospital
Bed Utilisation through Simulation and Optimisation.” International Journal of
Medical Informatics 82(2):80–89.
Van Horenbeek, Adriaan, and Liliane Pintelon. 2014. “Development of a
Maintenance Performance Measurement Framework-Using the Analytic
Network Process (ANP) for Maintenance Performance Indicator Selection.”
Omega (United Kingdom) 42(1):33–46.
Horvat, Matic. 2012. “An Approach to Order Picking Optimization in Warehouses.”

LIST OF REFERENCES
306
University of Ljubljana.
Hu, Qiwei, John E. Boylan, Huijing Chen, and Ashraf Labib. 2018. “OR in Spare
Parts Management: A Review.” European Journal of Operational Research.
Hua, Zhongsheng, Bengang Gong, and Xiaoyan Xu. 2008. “A DS-AHP Approach
for Multi-Attribute Decision Making Problem with Incomplete Information.”
Expert Systems with Applications.
Huiskonen, Janne. 2001. “Maintenance Spare Parts Logistics: Special Characteristics
and Strategic Choices.” International Journal of Production Economics.
Hulshof, Peter J. H., Nikky Kortbeek, Richard J. Boucherie, Erwin W. Hans, and Piet J. M. Bakker. 2012. “Taxonomic Classification of Planning Decisions in
Health Care: A Structured Review of the State of the Art in OR/MS.” Health
Systems 1(2):129–75.
Hummel, J. Marjan, John F. P. Bridges, and Maarten J. IJzerman. 2014. “Group Decision Making with the Analytic Hierarchy Process in Benefit-Risk
Assessment: A Tutorial.” Patient.
Hummel, Marjan J. M., Fabian Volz, Jeannette G. Van Manen, Marion Danner,
Charalabos Markos Dintsios, Maarten J. Ijzerman, and Andreas Gerber. 2012. “Using the Analytic Hierarchy Process to Elicit Patient Preferences:
Prioritizing Multiple Outcome Measures of Antidepressant Drug Treatment.”
Patient.
Huntley, J., J. Howard, and J. Simpson. 2018. “Updating the Surgical Preference
List.” Cureus 10(7).
Iannone, Raffaele, Alfredo Lambiase, Salvatore Miranda, Stefano Riemma, and
Debora Sarno. 2013. “Modelling Hospital Materials Management Processes.”
International Journal of Engineering Business Management 5(1):1–12.
Iannone, Raffaele, Alfredo Lambiase, Salvatore Miranda, Stefano Riemma, and
Debora Sarno. 2014. “Pulling Drugs along the Supply Chain: Centralization of
Hospitals’ Inventory.” International Journal of Engineering Business
Management 6(1):1–11.
Institute of Medicine (IOM). 2001. Crossing the Quality Chasm: A New Health
System for the 21th Century.
Ishizaka, Alessio, and Ashraf Labib. 2011. “Review of the Main Developments in the
Analytic Hierarchy Process.” Expert Systems with Applications.
Janssen, Ron. 2001. “On the Use of Multi-Criteria Analysis in Environmental Impact
Assessment in the Netherlands.” Journal of Multi-Criteria Decision Analysis.
Jarek, Slawomir. 2016. “Removing Invonsistency in Pairwise Comparison Matrix in
the AHP.” Multiple Criteria Decision Making 11:63–76.
LIST OF REFERENCES
307
Jarrett, P. Gary. 1998. “Logistics in the Health Care Industry.” International Journal
of Physical Distribution & Logistics Management.
Jayaraman, Raja, Kamal Taha, Kun Soo Park, and Jaywon Lee. 2014. “Impacts and
Role of Group Purchasing Organization in Healthcare Supply Chain.” in IIE
Annual Conference and Expo 2014.
Jharkharia, Sanjay, and Ravi Shankar. 2007. “Selection of Logistics Service
Provider: An Analytic Network Process (ANP) Approach.” Omega.
Jorissen, Pieterjan. 2018. “Identification of Multi-Stakeholder Value in Prostate
Cancer Treatment by Application of Multi-Criteria Decision Making.” KU
Leuven.
Jun, J. B., S. H. Jacobson, and J. R. Swisher. 1999. “Application of Discrete-Event
Simulation in Health Care Clinics: A Survey.” Journal of the Operational
Research Society 50(2):109–23.
Kammoun, Amira, Taicir Loukil, and Wafik Hachicha. 2014. “The Use of Discrete
Event Simulation in Hospital Supply Chain Management.” in 2014
International Conference on Advanced Logistics and Transport, ICALT 2014.
Kapp, Julie M., Eduardo J. Simoes, Anne DeBiasi, and Steven J. Kravet. 2017. “A Conceptual Framework for a Systems Thinking Approach to US Population
Health.” Systems Research and Behavioral Science.
Karkera, Karishma. 2020. “Inventory Control Optimization for Operating Theatres.”
KU Leuven.
Karnon, Jonathan, James Stahl, Alan Brennan, J. Jaime Caro, Javier Mar, and Jörgen
Möller. 2012. “Modeling Using Discrete Event Simulation: A Report of the
ISPOR-SMDM Modeling Good Research Practices Task Force-4.” Medical
Decision Making.
Karpak, Birsen. 2017. “REFLECTIONS: MATHEMATICAL PRINCIPLES OF
DECISION MAKING.” International Journal of the Analytic Hierarchy
Process.
Katsaliaki, K., and N. Mustafee. 2011. “Applications of Simulation within the
Healthcare Context.” Journal of the Operational Research Society 62(8):1598–
1600.
KCE, Belgian Health Care Knowledge Center. 2015. Implementation of Hospital at
Home: Orientations for Belgium.
Kelle, Peter, John Woosley, and Helmut Schneider. 2012. “Pharmaceutical Supply
Chain Specifics and Inventory Solutions for a Hospital Case.” Operations
Research for Health Care 1(2–3):54–63.
Kelley, Thomas A. 2015. “International Consortium for Health Outcomes
LIST OF REFERENCES
308
Measurement (ICHOM).” Trials.
Kelton, W. D., R. P. Sadowski, and N. B. Zupick. 2015. Simulation with Arena. Sixth
edit. McGraw-Hill Education.
Key, Ryan, and Anurag Dasgupta. 2015. “Warehouse Pick Path Optimization
Algorithm Analysis.” International Conference on Foundations of Computer
Science.
Khodabandeh, Ehsan. 2016. “Order Picking Strategies for Healthcare Warehouses.”
University of Louisville.
Kim, G. C., and M. J. Schniederjans. 1993. “Empirical Comparison of Just-in-Time and Stockless Materiel Management Systems in the Health Care Industry.”
Hospital Materiel Management Quarterly.
Kochan, Gonul Cigdem, David R. Nowicki, Brian Sauser, and Wesley S. Randall.
2018. “Impact of Cloud-Based Information Sharing on Hospital Supply Chain Performance: A System Dynamics Framework.” International Journal of
Production Economics.
Komashie, Alexander, and Ali Mousavi. 2005. “Modeling Emergency Departments
Using Discrete Event Simulation Techniques.” Proceedings of the 37th
Conference on Winter Simulation 2681–85.
de Koster, René, Tho Le-Duc, and Kees Jan Roodbergen. 2007. “Design and Control
of Warehouse Order Picking: A Literature Review.” European Journal of
Operational Research.
Kotonen, Ulla, and Ullamari Tuominen. 2014. “COMPETENCE ASSESSMENT OF
HEALTHCARE LOGISTICIAN STUDENTS.” in EDULEARN14: 6TH
INTERNATIONAL CONFERENCE ON EDUCATION AND NEW LEARNING
TECHNOLOGIES.
Kotonen, Ulla, Ullamari Tuominen, Ann-Nina Maksimainen, and Miika Kuusisto.
2016. “Experiences from Healthcare Logistician Education.” Journal of
Modern Education Review.
Kouzmin, Alexander, Elke Löffler, Helmut Klages, and Nada Korac-Kakabadse.
1999. “Benchmarking and Performance Measurement in Public Sectors.
Towards Learning for Agency Effectiveness.” International Journal of Public
Sector Management.
Kritchanchai, Duangpun, Soriya Hoeur, and Per Engelseth. 2018. “Develop a
Strategy for Improving Healthcare Logistics Performance.” Supply Chain
Forum: An International Journal.
Kuljis, Jasna, Ray J. Paul, and Lampros K. Stergioulas. 2007. “Can Health Care
Benefit from Modeling and Simulation Methods in the Same Way as Business
and Manufacturing Has?” in Proceedings - Winter Simulation Conference.

LIST OF REFERENCES
309
Kumar, Arun, Linet Ozdamar, and Chun Ning Zhang. 2008. “Supply Chain Redesign
in the Healthcare Industry of Singapore.” Supply Chain Management: An
International Journal 13(2):95–103.
Kwon, Ik Whan G., Sung Ho Kim, and David G. Martin. 2016. “Healthcare Supply
Chain Management; Strategic Areas for Quality and Financial Improvement.”
Technological Forecasting and Social Change 113.
Lanckzweirt, Jan. 2010. “Een Analyse van de Materiaalstromen in Het
Operatiekwartier.”
Landry, Sylvain, and Martin Beaulieu. 2011. “La Logistique Hospitalière : Un
Remède Aux Maux Du Secteur de La Santé?” Gestion.
Landry, Sylvain, and Martin Beaulieu. 2013. “The Challenges of Hospital Supply
Chain Management, from Central Stores to Nursing Units.” Pp. 465–82 in
International Series in Operations Research and Management Science. Vol.
184.
Landry, Sylvain, Martin Beaulieu, and Jacques Roy. 2016. “Strategy Deployment in
Healthcare Services: A Case Study Approach.” Technological Forecasting and
Social Change.
Landry, Sylvain, and Richard Philippe. 2004. “How Logistics Can Service
Healthcare.” Supply Chain Forum: An International Journal.
Lapierre, Sophie D., and Angel B. Ruiz. 2007. “Scheduling Logistic Activities to Improve Hospital Supply Systems.” Computers and Operations Research
34(3):624–41.
Lauwers, Bram. 2019. “Optimization of a Two-Echelon Inventory System at the
Operating Theatre of a Large Hospital.” KU Leuven.
Le-Duc, T., and R. B. M. De Koster. 2005. “Travel Distance Estimation and Storage
Zone Optimization in a 2-Block Class-Based Storage Strategy Warehouse.”
International Journal of Production Research.
Lee, Ann Jarousse. 2011. “Strategic Supply Chain Management.” Hospitals &
Health Networks.
Lee, Ming-Chang. 2010. “The Analytic Hierarchy and the Network Process in
Multicriteria Decision Making: Performance Evaluation and Selecting Key
Performance Indicators Based on ANP Model.” P. 426 in Convergence and
Hybrid Information Technologies.
Lenin, Karthikeyan. 2014. “Science Journal of Business and Management.”
2(5):136–42.
Little, James, and Brian Coughlan. 2008. “Optimal Inventory Policy within Hospital
Space Constraints.” Health Care Management Science 11(2):177–83.

LIST OF REFERENCES
310
Litwin, Mark S., and Hung Jui Tan. 2017. “The Diagnosis and Treatment of Prostate
Cancer: A Review.” JAMA - Journal of the American Medical Association.
Loeb, Stacy. 2016. “Evidence-Based Versus Personalized Prostate Cancer Screening:
Using Baseline Prostate-Specific Antigen Measurements to Individualize
Screening.” Journal of Clinical Oncology.
Longaray, André, Leonardo Ensslin, Sandra Ensslin, Glaucia Alves, Ademar Dutra,
and Paulo Munhoz. 2018. “Using MCDA to Evaluate the Performance of the
Logistics Process in Public Hospitals: The Case of a Brazilian Teaching
Hospital.” International Transactions in Operational Research.
Lowery, Julie C. 1996. “Introduction to Simulation in Health Care.” Pp. 78–84 in
Proceedings of the 28th conference on Winter simulation - WSC ’96. New
York: ACM Press.
Machado Guimarães, Cristina, José Crespo de Carvalho, and Ana Maia. 2013.
“Vendor Managed Inventory (VMI): Evidences from Lean Deployment in
Healthcare.” Strategic Outsourcing: An International Journal 6(1):8–24.
Macharis, Cathy, Johan Springael, Klaas De Brucker, and Alain Verbeke. 2004.
“PROMETHEE and AHP: The Design of Operational Synergies in
Multicriteria Analysis - Strengthening PROMETHEE with Ideas of AHP.” in
European Journal of Operational Research.
Macharis, Cathy, Alain Verbeke, and Klaas De Brucker. 2004. “THE STRATEGIC
EVALUATION OF NEW TECHNOLOGIES THROUGH MULTICRITERIA
ANALYSIS: THE ADVISORS CASE.” Research in Transportation
Economics.
Macharis, Cathy, Astrid De Witte, and Jeroen Ampe. 2009. “The Multi-Actor, Multi-
Criteria Analysis Methodology (MAMCA) for the Evaluation of Transport
Projects: Theory and Practice.” Journal of Advanced Transportation.
Maestrini, Vieri, Davide Luzzini, Paolo Maccarrone, and Federico Caniato. 2017.
“Supply Chain Performance Measurement Systems: A Systematic Review and
Research Agenda.” International Journal of Production Economics.
Majid, Mazlina A., Mohammed Fakhreldin, and Kamal Z. Zuhairi. 2016.
“Comparing Discrete Event and Agent Based Simulation in Modelling Human
Behaviour at Airport Check-in Counter.” in Lecture Notes in Computer Science
(including subseries Lecture Notes in Artificial Intelligence and Lecture Notes
in Bioinformatics).
Marsh, K., M. Ijzerman, P. Thokala, R. Baltussen, M. Boysen, Z. Kaló, T. Lönngren,
F. Mussen, S. Peacock, J. Watkins, and N. Devlin. 2016. “Multiple Criteria
Decision Analysis for Health Care Decision Making - Emerging Good
Practices: Report 2 of the ISPOR MCDA Emerging Good Practices Task
Force.” Value in Health 19(2):125–37.

LIST OF REFERENCES
311
Marsh, Kevin, Mireille Goetghebeur, Praveen Thokala, and Rob Baltussen. 2017.
Multi-Criteria Decision Analysis to Support Healthcare Decisions.
Marsh, Kevin, Tereza Lanitis, David Neasham, Panagiotis Orfanos, and Jaime Caro.
2014a. “Assessing the Value of Healthcare Interventions Using Multi-Criteria
Decision Analysis: A Review of the Literature.” PharmacoEconomics
32(4):345–65.
Marsh, Kevin, Tereza Lanitis, David Neasham, Panagiotis Orfanos, and Jaime Caro.
2014b. “Assessing the Value of Healthcare Interventions Using Multi-Criteria
Decision Analysis: A Review of the Literature.” PharmacoEconomics.
Marshall, Deborah A., Lina Burgos-Liz, Maarten J. Ijzerman, William Crown,
William V. Padula, Peter K. Wong, Kalyan S. Pasupathy, Mitchell K. Higashi,
and Nathaniel D. Osgood. 2015. “Selecting a Dynamic Simulation Modeling
Method for Health Care Delivery Research - Part 2: Report of the ISPOR
Dynamic Simulation Modeling Emerging Good Practices Task Force.” Value
in Health.
Di Martinelly, C. 2008. “Proposition of a Framework to Reengineer and Evaluate the
Hospital Supply Chain.” Department of Management (May 2008):139.
Di Martinelly, Christine, Fouad Riane, and Alain Guinet. 2009. “A Porter-SCOR
Modelling Approach for the Hospital Supply Chain.” International Journal of
Logistics Systems and Management 5(3):436–56.
Mateo, José Ramón San Cristóbal. 2012. “Multi-Criteria Analysis in the Renewable
Energy Industry.” in Green Energy and Technology.
Mathew, Joseph, Joshin John, and Sushil Kumar. 2013. “New Trends in Healthcare
Supply Chain.” in Annual Confrence of the Production and Operations
Management.
McKone-Sweet, Kathleen E., Paul Hamilton, and Susan B. Willis. 2005. “The Ailing
Healthcare Supply Chain: A Prescription for Change.” Journal of Supply Chain
Management.
Melnyk, Steven A., Douglas M. Stewart, and Morgan Swink. 2004. “Metrics and
Performance Measurement in Operations Management: Dealing with the
Metrics Maze.” Journal of Operations Management.
Melo, T. 2012. “Technical Reports: A Note on Challenges and Opportunities for
Operations Research in Hospital Logistics.” 2(2):1–18.
Melson, L. M., and M. K. Schultz. 1989. “Overcoming Barriers to Operating Room
Inventory Control.” Healthcare Financial Management : Journal of the
Healthcare Financial Management Association.
Mettler, T., and P. Rohner. 2009. “Performance Management in Health Care: The
Past, the Present, and the Future.” in Proceedings of the 9th International

LIST OF REFERENCES
312
Conference on Business Informatics.
Mielczarek, B. 2016. “Review of Modelling Approaches for Healthcare Simulation.”
Operations Research and Decisions.
Mielczarek, Bożena, and Justyna Uziałko-Mydlikowska. 2012. “Application of
Computer Simulation Modeling in the Health Care Sector: A Survey.”
Simulation 88(2):197–216.
Mikhailov, Ludmil. 2004. “Group Prioritization in the AHP by Fuzzy Preference
Programming Method.” Computers and Operations Research.
Miller, Herman. 2009. Making a Case for Case Carts.
Min, Hokey. 2017. “Health Care Supply Chain Research: Where Are We Going?”
Logistics Research.
Modak, Mousumi, Kunal Kanti Ghosh, and Khanindra Pathak. 2018. “A BSC-ANP
Approach to Organizational Outsourcing Decision Support-A Case Study.”
Journal of Business Research.
El Mokrini, Asmae, Loubna Bennabbou, and Abdelaziz Berrado. 2018. “Multi-
Criteria Distribution Network Redesign - Case of the Public Sector
Pharmaceutical Supply Chain in Morocco.” Supply Chain Forum: An
International Journal 19(1):42–54.
Molenaers, An, Herman Baets, Liliane Pintelon, and Geert Waeyenbergh. 2012.
“Criticality Classification of Spare Parts: A Case Study.” International Journal
of Production Economics 140(2):570–78.
Monks, Thomas, Christine S. M. Currie, Bhakti Stephan Onggo, Stewart Robinson,
Martin Kunc, and Simon J. E. Taylor. 2019. “Strengthening the Reporting of
Empirical Simulation Studies: Introducing the STRESS Guidelines.” Journal
of Simulation.
Moons, Karen, Helena Berglund, Valerie De Langhe, Katrien Kimpe, Liliane
Pintelon, and Geert Waeyenbergh. 2016. “Optimization of Operations by
Simulation—A Case Study at the Red Cross Flanders.” American Journal of
Industrial and Business Management.
Moreno-Jiménez, José María, Manuel Salvador, Pilar Gargallo, and Alfredo
Altuzarra. 2016. “Systemic Decision Making in AHP: A Bayesian Approach.”
Annals of Operations Research.
Mukherjee, Avinandan. 2008. “Redefining Health Care: Creating Value-Based
Competition on Results.” International Journal of Pharmaceutical and
Healthcare Marketing.
Nachtmann, Heather, and Edward Pohl. 2009. “The State of Healthcare Logistics.”
Center for Innovation in Healthcare Logistics, University of Arkanas.

LIST OF REFERENCES
313
Nguyen, Vivi Thuy, Anita Friis Sommer, Kenn Steger-Jensen, and Hans Henrik
Hvolby. 2014. “The Misalignment between Hospital Planning Frameworks and
Their Planning Environment - A Conceptual Matching Approach.” in IFIP
Advances in Information and Communication Technology.
Nicholson, Lawrence, Asoo J. Vakharia, and S. Selcuk Erenguc. 2004. “Outsourcing
Inventory Management Decisions in Healthcare: Models and Application.”
European Journal of Operational Research.
Nilsson, Adam, and Daniel Elmar Merkle. 2018. “Technical Solutions for
Automation of Warehouse Operations and Their Implementation Challenges.”
Linnaeus University.
OECD. 2015. “Health at a Glance 2015: OECD Indicators.” OECD Publishing,Paris.
OECD. 2017. Health at a Glance 2017.
Oliveira, Mónica D., Inês Mataloto, and Panos Kanavos. 2019. “Multi-Criteria Decision Analysis for Health Technology Assessment: Addressing
Methodological Challenges to Improve the State of the Art.” European Journal
of Health Economics.
Ordoobadi, Sharon M. 2012. “Application of ANP Methodology in Evaluation of
Advanced Technologies.” Journal of Manufacturing Technology Management.
Orom, Heather, Caitlin Biddle, Willie Underwood, Gregory G. Homish, and Carl A.
Olsson. 2018. “Racial or Ethnic and Socioeconomic Disparities in Prostate
Cancer Survivors’ Prostate-Specific Quality of Life.” Urology.
Ozcan, Yasar A. 2014. Health Care Benchmarking and Performance Evaluation.
Vol. 210.
Papalexi, Marina, David Bamford, and Benjamin Dehe. 2016. “A Case Study of
Kanban Implementation within the Pharmaceutical Supply Chain.”
International Journal of Logistics Research and Applications.
Pereira, Valdecy, and Helder Gomes Costa. 2015. “Nonlinear Programming Applied
to the Reduction of Inconsistency in the AHP Method.” Annals of Operations
Research.
Pérez, Joaquín, José L. Jimeno, and Ethel Mokotoff. 2007. “Another Potential
Shortcoming of AHP.” Top.
Persson, J. Fredrik. 2002. “The Impact of Different Levels of Detail in
Manufacturing Systems Simulation Models.” in Robotics and Computer-
Integrated Manufacturing.
Pidd, Michael. 2004. Systems Modelling: Theory and Practice. John Wiley & Sons.
Di Pierro, Giovanni Battista, Johann Gregory Wirth, Matteo Ferrari, Hansjörg

LIST OF REFERENCES
314
Danuser, and Agostino Mattei. 2014. “Impact of a Single-Surgeon Learning
Curve on Complications, Positioning Injuries, and Renal Function in Patients
Undergoing Robot-Assisted Radical Prostatectomy and Extended Pelvic
Lymph Node Dissection.” Urology.
Pinna, Roberta, Pier Paolo Carrus, and Fabiana Marras. 2015. “Emerging Trends in
Healthcare Supply Chain Management - an Italian Experience.” in Applications
of Contemporary Management Approaches in Supply Chains.
Piratelli, Claudio, Luis, Mischel Belderrain, Azzolini Junior, Walther, and José Luís
Hermosilla. 2010. “Using the Analytic Network Process to Rank Performance
Indicators for a Undergraduate Course.” in XVI International Conference on
Industrial Engineering and Operations Management.
Pirdashti, Mohsen, Madjid Tavana, Mimi Haryani Hassim, Majid Behzadian, and I.
A. Karimi. 2011. “A Taxonomy and Review of the Multiple Criteria Decision-
Making Literature in Chemical Engineering.” International Journal of
Multicriteria Decision Making 1(4):407.
Podvezko, Valentinas. 2009. “Application of AHP Technique.” Journal of Business
Economics and Management.
Podvezko, Valentinas, and Askoldas Podviezko. 2010. “Dependence of Multi-
Criteria Evaluation Result on Choice of Preference Functions and Their
Parameters.” Technological and Economic Development of Economy.
Poh, Kim Leng, and Yiying Liang. 2017. “Multiple-Criteria Decision Support for a
Sustainable Supply Chain: Applications to the Fashion Industry.” Informatics.
Porter, Michael E. 2010. “What Is Value in Health Care?” The New England Journal
of Medicine.
Pouline, Etienne. 2003. “Benchmarking The Hospital Logistics Process.” CMA
Canada.
Rais, Abdur, Filipe Alvelos, João Figueiredo, and Ana Nobre. 2018. “Optimization
of Logistics Services in Hospitals.” International Transactions in Operational
Research 25(1).
Rakovska, Miroslava A., and Stilyana V. Stratieva. 2018. “A Taxonomy of
Healthcare Supply Chain Management Practices.” Supply Chain Forum.
Rammelmeier, D. T., D. S. Galka, and P. W. Gunthner. 2011. “Active Prevention of
Picking Errors by Employing Pick-by-Vision.” Pp. 79–83 in 4th International
Doctoral Students Workshop on Logistics.
Ranjan, Rajiv. 2014. “Modeling and Simulation in Performance Optimization of Big
Data Processing Frameworks.” IEEE Cloud Computing.
Rappold, James, Ben Van Roo, Christine Di Martinelly, and Fouad Riane. 2011. “An
LIST OF REFERENCES
315
Inventory Optimization Model To Support Operating Room Schedules.”
Supply Chain Forum: An International Journal 12(1):56–69.
Rego, Nazaré, and Jorge Pinho Sousa. 2009. “Supply Chain Coordination in
Hospitals.” in IFIP Advances in Information and Communication Technology.
Reyes, Juan José Rojas, Elyn Lizeth Solano-Charris, and Jairo Rafael Montoya-
Torres. 2019. “The Storage Location Assignment Problem: A Literature
Review.” International Journal of Industrial Engineering Computations.
Richman, Martin B., Ernest H. Forman, Yildirim Bayazit, Douglas B. Einstein,
Martin I. Resnick, and Mark D. Stovsky. 2005. “A Novel Computer Based
Expert Decision Making Model for Prostate Cancer Disease Management.”
Journal of Urology.
Rietkötter, Lea. 2014. “Ending the War in Multi-Criteria Decision Analysis: Taking
the Best from Two Worlds.” University of Twente.
Rivard‐Royer, Hugo, Sylvain Landry, and Martin Beaulieu. 2002. “Hybrid Stockless:
A Case Study.” International Journal of Operations & Production
Management 22(4):412–24.
Robben, Lien. 2019. “Analyse van de Efficiëntie van Ingrepenfiches in Het
Operatiekwartier.” KU Leuven.
Roberts, Stephen D. 2011. “Tutorial on the Simulation of Healthcare Systems.”
Proceedings - Winter Simulation Conference 1403–14.
Robinson, S. 2008a. “Conceptual Modelling for Simulation Part I: Definition and
Requirements.” Journal of the Operational Research Society 59(3):278–90.
Robinson, S. 2008b. “Conceptual Modelling for Simulation Part II: A Framework for
Conceptual Modelling.” Journal of the Operational Research Society.
Robinson, Stephen T., and Jeffrey R. Kirsch. 2015. “Lean Strategies in the Operating
Room.” Anesthesiology Clinics 33(4):713–30.
Robinson, Stewart. 2011. “Choosing the Right Model: Conceptual Modeling for
Simulation.” in Proceedings - Winter Simulation Conference.
Robinson, Stewart. 2013. “Conceptual Modeling for Simulation.” in Proceedings of
the 2013 Winter Simulation Conference - Simulation: Making Decisions in a
Complex World, WSC 2013.
Robinson, Stewart. 2018. “A Tutorial on Simulation Conceptual Modeling.” in
Proceedings - Winter Simulation Conference.
Rohleder, Thomas, Brian Bailey, Brian Crum, Timothy Faber, Brandon Johnson,
LeTesha Montgomery, and Rachel Pringnitz. 2013. “Improving a Patient
Appointment Call Center at Mayo Clinic.” International Journal of Health

LIST OF REFERENCES
316
Care Quality Assurance 26(8):714–28.
Rohleder, Thomas, David Cooke, Paul Rogers, and Jason Egginton. 2013.
“Coordinating Health Services: An Operations Management Perspective.” in
International Series in Operations Research and Management Science.
Rosales, Claudia R., Michael J. Magazine, and Uday S. Rao. 2019. “Dual Sourcing
and Joint Replenishment of Hospital Supplies.” IEEE Transactions on
Engineering Management.
Rosales, Claudia R., Michael Magazine, and Uday Rao. 2014. “Point-of-Use Hybrid
Inventory Policy for Hospitals.” Decision Sciences 45(5):913–37.
Rosales, Claudia R., Michael Magazine, and Uday Rao. 2015. “The 2Bin System for
Controlling Medical Supplies at Point-of-Use.” European Journal of
Operational Research 243(1):271–80.
Rossetti, Manuel D. 2008. Inventory Management Issues in Health Care Supply
Chains.
Rossetti, Manuel D., Nebil Buyurgan, and Edward Pohl. 2012. “Medical Supply
Logistics.” International Series in Operations Research and Management
Science 168(November):245–80.
Rossetti, Manuel D., and Francesco Selandari. 2001. “Multi-Objective Analysis of
Hospital Delivery Systems.” Computers and Industrial Engineering 41(3):309–
33.
Roth, AJ, MI Weinberger, and CJ Nelson. 2008. “Prostate Cancer: Quality of Life,
Psychosocial Implications and Treatment Choices.” Future Oncology.
Rothstein, David H., and Mehul V. Raval. 2018. “Operating Room Efficiency.”
Seminars in Pediatric Surgery.
Rytile, Jyrki S., and Karen M. Spens. 2006. “Using Simulation to Increase Efficiency
in Blood Supply Chains.” Management Research News.
Saaty, Thomas L. 1989. “Group Decision Making and the AHP.” in The Analytic
Hierarchy Process.
Saaty, Thomas L. 1990a. “How to Make a Decision: The Analytic Hierarchy
Process.” European Journal of Operational Research 48(1):9–26.
Saaty, Thomas L. 1990b. “How to Make a Decision: The Analytic Hierarchy
Process.” European Journal of Operational Research.
Saaty, Thomas L. 2006. “Decision Making — the Analytic Hierarchy and Network
Processes (AHP/ANP).” Journal of Systems Science and Systems Engineering.
Saaty, Thomas L. 2008. “Decision Making with the Analytic Hierarchy Process.”
International Journal of Services Sciences 1(1):83.

LIST OF REFERENCES
317
Saaty, Thomas L. 2010. Mathematical Principles of Decision Making. Pittsburgh,
PA.
Saaty, Thomas L. 2013. “The Modern Science of Multicriteria Decision Making and
Its Practical Applications: The AHP/ANP Approach.” Operations Research.
Saaty, Thomas L., and Luis G. Vargas. 2006. “Decision Making with the Analytic
Network Process.Economic, Political, Social and Technological Applications
with Benefits, Opportunities, Costs and Risks.” International Series in
Operations Research Management Science.
Saaty, TL. 1996. Decision Making with Dependence and Feedback: The Analytic
Network Process.
Sargent, R. G. 2013. “Verification and Validation of Simulation Models.” Journal of
Simulation 7(1):12–24.
Sarno, Debora. 2014. “A Holistic Approach to Hospital Material Management Process Reengineering by Means of the MRP Algorithm.” University of
Salerno.
Schneller, Eugene, R. Burns, Lawton, and Larry Smeltzer. 2006. Strategic
Management of the Health Care Supply Chain. San Francisco, CA: Jossey-
Bass.
Serrou, Driss, and Abdellah Abouabdellah. 2016. “Logistics in the Hospital:
Methodology for Measuring Performance.” ARPN Journal of Engineering and
Applied Sciences 11(5):2950–56.
Sikka, Rishi, Julianne M. Morath, and Lucian Leape. 2015. “The Quadruple Aim:
Care, Health, Cost and Meaning in Work.” BMJ Quality and Safety.
Simon, Kathleen L., Matthew J. Frelich, and Jon C. Gould. 2018. “Picking Apart
Surgical Pick Lists – Reducing Variation to Decrease Surgical Costs.”
American Journal of Surgery.
Smith, Kathryn N., Anita R. Vila-Parrish, Julie S. Ivy, and Steven R. Abel. 2017. “A
Simulation Approach for Evaluating Medication Supply Chain Structures.”
International Journal of Systems Science: Operations and Logistics.
Song, Yan, and Yao Hu. 2009. “Group Decision-Making Method in the Field of Coal
Mine Safety Management Based on AHP with Clustering.” 6th International
Conference on Information Systems for Crisis Response and Management
(ISCRAM 2009).
Supeekit, Tuangyot, Tuanjai Somboonwiwat, and Duangpun Kritchanchai. 2015.
“Industrial Engineering, Management Science and Applications 2015.”
349:927–38.
Supeekit, Tuangyot, Tuanjai Somboonwiwat, and Duangpun Kritchanchai. 2016.

LIST OF REFERENCES
318
“DEMATEL-Modified ANP to Evaluate Internal Hospital Supply Chain
Performance.” Computers and Industrial Engineering.
Tako, A. A., and S. Robinson. 2009. “Comparing Discrete-Event Simulation and
System Dynamics: Users’ Perceptions.” Journal of the Operational Research
Society.
Tako, Antuela A., and Stewart Robinson. 2012. “The Application of Discrete Event
Simulation and System Dynamics in the Logistics and Supply Chain Context.”
Decision Support Systems.
Tappia, Elena, Debjit Roy, Marco Melacini, and René De Koster. 2019. “Integrated
Storage-Order Picking Systems: Technology, Performance Models, and Design
Insights.” European Journal of Operational Research.
Tawalbeh, Lo’Ai A., Rashid Mehmood, Elhadj Benkhlifa, and Houbing Song. 2016.
“Mobile Cloud Computing Model and Big Data Analysis for Healthcare
Applications.” IEEE Access.
Thokala, Praveen, Nancy Devlin, Kevin Marsh, Rob Baltussen, Meindert Boysen,
Zoltan Kalo, Thomas Longrenn, Filip Mussen, Stuart Peacock, John Watkins,
and Maarten Ijzerman. 2016. “Multiple Criteria Decision Analysis for Health
Care Decision Making - An Introduction: Report 1 of the ISPOR MCDA
Emerging Good Practices Task Force.” Value in Health 19(1):1–13.
Thorwarth, Michael, and Amr Arisha. 2009. Application of Discrete-Event
Simulation in Health Care: A Review.
Tompkins, J. A., J. A. White, Y. A. Bozer, and J. M. A. Tanchoco. 2011. “Facilities
Planning – 4th Edition.” International Journal of Production Research.
Tseng, T. Y., S. W. Lin, C. L. Huang, and R. Lee. 2007. “Inconsistency Adjustment in the AHP Using the Complete Transitivity Convergence Algorithm.” in
Conference Proceedings - IEEE International Conference on Systems, Man
and Cybernetics.
Uhrmacher, Adelinde M., Sally Brailsford, Jason Liu, Markus Rabe, and Andreas Tolk. 2016. “Panel - Reproducible Research in Discrete Event Simulation -A
Must or Rather a Maybe ?” in Proceedings - Winter Simulation Conference.
UZ Leuven, Belgium. 2018. “UZ Leuven Operatiekwartier.” Retrieved
(https://www.uzleuven.be/operatiekwartier).
Vanpee, Goele. 2019. “An Insight View in the Logistics Processes of Materials
Management of Different Health Care Institutions: A Multi-Organizational,
Exploratory, Cross-Sectional Study.” KU Leuven.
Varela, Ivan Rozados, and Benny Tjahjono. 2014. “Big Data Analytics in Supply
Chain Management: Trends and Related Research.” 6th International
Conference on Operations and Supply Chain Management.

LIST OF REFERENCES
319
Varghese, V., M. Rossetti, E. Pohl, S. Apras, and D. Marek. 2012. “Applying Actual
Usage Inventory Management Best Practice in a Health Care Supply Chain.”
International Journal of Supply Chain Management 1(2):1–10.
Velasquez, Mark, and Patrick Hester. 2013. “An Analysis of Multi-Criteria Decision
Making Methods.” International Journal of Operations Research.
Verdecho, María José, Juan Jose Alfaro-Saiz, Raul Rodriguez-Rodriguez, and Angel
Ortiz-Bas. 2012. “A Multi-Criteria Approach for Managing Inter-Enterprise
Collaborative Relationships.” Omega.
Vieira, Ana C. L., Mónica D. Oliveira, and Carlos A. Bana e Costa. 2019.
“Enhancing Knowledge Construction Processes within Multicriteria Decision
Analysis: The Collaborative Value Modelling Framework.” Omega (United
Kingdom).
Vila-Parrish, Anita, and Julie Simmons. 2013. “Managing Supply Critical to Patient
Care: An Introduction to Hospital Inventory Management for
Pharmaceuticals.” in Handbook of Healthcare Operations Management.
Volland, Jonas, Andreas Fügener, Jan Schoenfelder, and Jens O. Brunner. 2017.
“Material Logistics in Hospitals: A Literature Review.” Omega (United
Kingdom) 69:82–101.
De Vries, Jan. 2011. “The Shaping of Inventory Systems in Health Services: A
Stakeholder Analysis.” International Journal of Production Economics
133(1):60–69.
De Vries, Jan, and Robbert Huijsman. 2011. “Supply Chain Management in Health
Services: An Overview.” Supply Chain Management: An International Journal
16(3):159–65.
Waeyenbergh, Geert, and Liliane Pintelon. 2009. “CIBOCOF: A Framework for
Industrial Maintenance Concept Development.” International Journal of
Production Economics.
Wang, Gang, Angappa Gunasekaran, Eric W. T. Ngai, and Thanos Papadopoulos. 2016. “Big Data Analytics in Logistics and Supply Chain Management:
Certain Investigations for Research and Applications.” International Journal of
Production Economics.
Wang, Jian Jun, and De Li Yang. 2007. “Using a Hybrid Multi-Criteria Decision Aid Method for Information Systems Outsourcing.” Computers and Operations
Research.
Wasserstein, Ronald L., and G. S. Fishman. 2006. “Monte Carlo: Concepts,
Algorithms, and Applications.” Technometrics.
Weiss, Anna, Hannah M. Hollandsworth, Adnan Alseidi, Lauren Scovel, Clare
French, Ellen L. Derrick, and Daniel Klaristenfeld. 2016. “Environmentalism
LIST OF REFERENCES
320
in Surgical Practice.” Current Problems in Surgery.
Whittington, John W., Kevin Nolan, Ninon Lewis, and Trissa Torres. 2015.
“Pursuing the Triple Aim: The First 7 Years.” Milbank Quarterly.
Who. 2010. “The World Health Report HEALTH SYSTEMS FINANCING The Path
to Iniversal Coverage.” The World Health Report.
Womack, James, Arthur P. Byrne, Orest J. Fiume, Gary S. Kaplan, and John
Toussaint. 2005. “Innovation Series: Going Lean in Health Care.” Institute for
Healthcare Improvement 21.
Yadav, Neetu, Sushil, and Mahim Sagar. 2013. “Performance Measurement and Management Frameworks: Research Trends of the Last Two Decades.”
Business Process Management Journal.
Yanamandra, Ramakrishna. 2018. “Development of an Integrated Healthcare Supply
Chain Model.” Supply Chain Forum.
Young, T. 2004. “Using Industrial Processes to Improve Patient Care.” BMJ.
Zardari, Noorul Hassan, Kamal Ahmed, Sharif Moniruzzaman Shirazi, and Zulkifli
Bin Yusop. 2015. “Weighting Methods and Their Effects on Multi-Criteria
Decision Making Model Outcomes in Water Resources Management.”
International Journal of Operations Research.
Zhang, Xiange. 2018. “Application of Discrete Event Simulation in Health Care: A
Systematic Review.” BMC Health Services Research.
Zhong, Xiang, Hyo Kyung Lee, and Jingshan Li. 2017. “From Production Systems to
Health Care Delivery Systems: A Retrospective Look on Similarities,
Difficulties and Opportunities.” International Journal of Production Research.
Zhou, Quan Spring, and Tava Lennon Olsen. 2018. “Rotating the Medical Supplies
for Emergency Response: A Simulation Based Approach.” International
Journal of Production Economics 196:1–11.
321
LIST OF PUBLICATIONS
Publications in international peer-reviewed journals
Moons, K., Pintelon, L., Waeyenbergh, G. (2016). Optimization of operations by
simulation – a case study at the Red Cross Flanders. American Journal of Industrial
and Business Management, 6(10), 1001-1017.
Moons, K., Waeyenbergh, G., Pintelon, L. (2019). Measuring the logistics
performance of internal hospital supply chains – a literature study. Omega, 82, 205-
217.
Moons, K., Waeyenbergh, G., Pintelon, L., Timmermans, P., De Ridder, D. (2019).
Performance indicator selection for operating room supply chains: an application of
ANP. Operations Research for Health Care. Vol 23, December 2019.
Moons, K., Pintelon, L., Jorissen, P., De Ridder, D., Everaerts, W. (2020).
Identification of multi-stakeholder value in medical decision-making. International
Journal of the Analytic Hierarchy Process, vol. 12 (1), 82-103.
Moons, K., Waeyenbergh, G., De Ridder, D., Pintelon, L. (2020). A Framework for
Operational Excellence in Hospital Logistics: Implementation Roadmap. Health Care
Management Science, Submitted.
Moons, K., Waeyenbergh, G., De Ridder, D., Pintelon, L. (2020). Future outlook:
Implications of digital trends in healthcare logistics. Health and Technology,
Submitted.
Conference proceedings (peer-reviewed)
Moons, K., Waeyenbergh, G., Timmermans, P., De Ridder, D., Pintelon, L. (2020).
Evaluating replenishment systems for disposable supplies at the operating theatre: a
simulation case study. Healthcare Systems Engineering. HCSE 2019. Springer
Proceedings in Mathematics & Statistics, vol. 316.
Moons, K., De Gang, W., Oor, A., Waeyenbergh, G., De Ridder, D., Pintelon, L.
(2020). Measuring the performance of different distribution strategies in the operating
theatre – A simulation case study. International Journal of Production Economics,
Submitted.

LIST OF PUBLICATIONS
322
Presentations/Posters at international conferences
Moons, K., Pintelon, L., Waeyenbergh, G. (2016). Optimization of operations by
simulation – a case study at the Red Cross Flanders. In: 19th International Working
Seminar on Production Economics, Innsbruck, 22-26 February, 2016.
Moons, K., Vandermeulen, E., Waeyenbergh, G., Timmermans, P., De Ridder, D.,
Pintelon, L. (2018). Operating room supply chain management: a simulation case
study. In: 20th International Working Seminar on Production Economics, vol. 1 (283-
294), Innsbruck, 19-23 February, 2018.
Moons, K., Pintelon, L. (2019). Healthcare Logistics research in the CIB research
group at KU Leuven. Séminaire ESSI en logistique hospitalière, 28th March 2019,
Paris-Sénart.
Jorissen, P., Moons, K., Pintelon, L., De Ridder D., Everaerts, W. (2019). PT378 –
Identification of multi-stakeholder value in prostate cancer treatment by application of
Multi-Criteria Decision-Making. European Urology Supplements, 18(1), e2184-
e2185.
Moons, K., De Gang, W., Oor, A., Waeyenbergh, G., De Ridder, D., Pintelon, L.
(2020). Measuring the performance of different distribution strategies in the operating
theatre – A simulation case study. In: 21th International Working Seminar on
Production Economics, vol. 3 (221-244), Innsbruck, 24-28 February, 2020.
Copyright © 2022 FDOKUMEN