A formal application of safety and risk assessment in software ...
422
Calhoun: The NPS Institutional Archive DSpace Repository Theses and Dissertations 1. Thesis and Dissertation Collection, all items 2004-09 A formal application of safety and risk assessment in software systems Williamson, Christopher Loyal Monterey, California. Naval Postgraduate School, 2004. http://hdl.handle.net/10945/9959 Downloaded from NPS Archive: Calhoun
-
Upload
khangminh22 -
Category
Documents
-
view
0 -
download
0
Transcript of A formal application of safety and risk assessment in software ...

Calhoun: The NPS Institutional Archive
DSpace Repository
Theses and Dissertations 1. Thesis and Dissertation Collection, all items
2004-09
A formal application of safety and risk
assessment in software systems
Williamson, Christopher Loyal
Monterey, California. Naval Postgraduate School, 2004.
http://hdl.handle.net/10945/9959
Downloaded from NPS Archive: Calhoun
NAVAL POSTGRADUATE
SCHOOL
MONTEREY, CALIFORNIA
DISSERTATION
Approved for public release; distribution is unlimited.
A FORMAL APPLICATION OF SAFETY AND RISK ASSESSMENT IN SOFTWARE SYSTEMS
by
Christopher Loyal Williamson
September 2004
Dissertation Supervisor: Luqi

THIS PAGE INTENTIONALLY LEFT BLANK

i
REPORT DOCUMENTATION PAGE Form Approved OMB No. 0704–0188
Public reporting burden for this collection of information is estimated to average 1 hour per response, including the time for reviewing instruction, searching existing data sources, gathering and maintaining the data needed, and completing and reviewing the collection of information. Send comments regarding this burden estimate or any other aspect of this collection of information, including suggestions for reducing this burden, to Washington headquarters Services, Directorate for Information Operations and Reports, 1215 Jefferson Davis Highway, Suite 1204, Arlington, VA 22202–4302, and to the Office of Management and Budget, Paperwork Reduction Project (0704–0188) Washington DC 20503.
1. AGENCY USE ONLY
2. REPORT DATE September 2004
3. REPORT TYPE AND DATES COVERED Ph.D. Dissertation
4. TITLE AND SUBTITLE: A Formal Application of Safety And Risk Assessment in Software Systems 6. AUTHOR(S) Williamson, Christopher L.
5. FUNDING NUMBERS
7. PERFORMING ORGANIZATION NAME(S) AND ADDRESS(ES) Naval Postgraduate School Monterey, CA 93943–5000
8. PERFORMING ORGANIZATION REPORT NUMBER
9. SPONSORING / MONITORING AGENCY NAME(S) AND ADDRESS(ES) N/A
10. SPONSORING / MONITORING AGENCY REPORT NUMBER
11. SUPPLEMENTARY NOTES The views expressed in this dissertation are those of the author and do not reflect the official policy or position of the Department of Defense or the U.S. Government. 12a. DISTRIBUTION / AVAILABILITY STATEMENT Approved for public release; distribution is unlimited.
12b. DISTRIBUTION CODE
13. ABSTRACT
The current state of the art techniques of Software Engineering lack a formal method and metric for measuring the safety index of a software system. The lack of such a methodology has resulted in a series of highly publicized and costly catastrophic failures of high–assurance software systems. This dissertation introduces a formal method for identifying and evaluating the weaknesses in a software system using a more precise metric, counter to traditional methods of development that have proven unreliable. This metric utilizes both a qualitative and quantitative approach employing principles of statistics and probability to determine the level of safety, likelihood of hazardous events, and the economic cost–benefit of correcting flaws through the lifecycle of a software system. This dissertation establishes benefits in the fields of Software Engineering of high–assurance systems, improvements in Software Safety and Software Reliability, and an expansion within the discipline of Software Economics and Management.
15. NUMBER OF PAGES
421
14. SUBJECT TERMS Software Safety, Software Failure, Software Engineering, Software Quality, High–Assurance System, Software Economics, Software Development, Reliability, Risk Assessment, Safety Management, Risk Management, Project Management, Formal Models, and Software Metrics.
16. PRICE CODE
17. SECURITY CLASSIFICATION OF REPORT Unclassified
18. SECURITY CLASSIFICATION OF THIS PAGE Unclassified
19. SECURITY CLASSIFICATION OF ABSTRACT Unclassified
20. LIMITATION OF ABSTRACT UL
NSN 7540–01–280–5500 Standard Form 298 (Rev. 2–89) Prescribed by ANSI Std. 239–18

ii
THIS PAGE INTENTIONALLY LEFT BLANK
iii
Approved for public release; distribution is unlimited
A FORMAL APPLICATION OF SAFETY AND RISK ASSESSMENT IN SOFTWARE SYSTEMS
Christopher Loyal Williamson
Lieutenant Commander, United States Navy B.S., United States Naval Academy, 1991
M.S., United States Naval Postgraduate School, 2000
Submitted in partial fulfillment of the requirements for the degree of
DOCTOR IN PHILOSOPHY IN SOFTWARE ENGINEERING
from the
NAVAL POSTGRADUATE SCHOOL
September 2004
Author: __________________________________________________ Christopher Loyal Williamson
Approved by:
______________________ _______________________ Luqi John Osmundson Professor of Computer Science Professor of Information Dissertation Supervisor and Chair Sciences ______________________ _______________________ Michael Brown William G. Kemple Professor of Computer Science Professor of Information Sciences ______________________ Mikhail Auguston Professor of Computer Science
Approved by: __________________________________________________ Peter Denning, Chairman, Department of Computer Science Approved by: __________________________________________________ Julie Filizetti, Associate Provost for Academic Affairs

iv
THIS PAGE INTENTIONALLY LEFT BLANK

v
ABSTRACT
The current state of the art techniques of Software Engineering lack a formal
method and metric for measuring the safety index of a software system. The lack of such
a methodology has resulted in a series of highly publicized and costly catastrophic failures
of high–assurance software systems. This dissertation introduces a formal method for
identifying and evaluating the weaknesses in a software system using a more precise
metric, counter to traditional methods of development that have proven unreliable. This
metric utilizes both a qualitative and quantitative approach employing principles of
statistics and probability to determine the level of safety, likelihood of hazardous events,
and the economic cost–benefit of correcting the flaws through the lifecycle of a software
system. This dissertation establishes benefits in the fields of Software Engineering of
high–assurance systems, improvements in Software Safety and Software Reliability, and
an expansion within the discipline of Software Economics and Management.

vi
THIS PAGE INTENTIONALLY LEFT BLANK

vii
TABLE OF CONTENTS
I. INTRODUCTION..................................................................................................1 A. PROBLEM AND RESULTS ....................................................................1 B. LEARNING AT THE EXPENSE OF FAILURE...................................2
1. Failure Due to a Factor of 4.45 .....................................................2 2. Premature Shutdown.....................................................................4
C. A HISTORICAL TREND OF FAILURE................................................5 D. QUESTIONING SOFTWARE SAFETY ................................................8
1. Software is Prone to Failure..........................................................8 2. How Can Software Be Determined Safe? ....................................9 3. What Can Be Done to Make Software Safer? ...........................11
E. GENERAL APPROACH ........................................................................12 F. THE FOCUS OF SOFTWARE SAFETY .............................................17 G. CONTRIBUTIONS..................................................................................19 H. ORGANIZATION OF DISSERTATION .............................................21 I. CHAPTER ENDNOTES.........................................................................23
1. Software Failure Cost ..................................................................23 2. NATO Software Engineering Definition....................................26
II. THEORETICAL FOUNDATION .....................................................................27 A. DEFINING SOFTWARE SAFETY.......................................................30 B. THE PHILOSOPHY OF SOFTWARE DEVELOPMENT.................33
1. Software as Intelligence...............................................................33 2. The Motivation to Build ..............................................................36
C. THE ANATOMY OF FAILURE ...........................................................39 1. Software Flaws .............................................................................42 2. Software Faults.............................................................................44
a. Reactionary Type Faults...................................................45 b. Handling Type Faults .......................................................46
3. Software Failure...........................................................................47 a. Resource Based Failures ..................................................48 b. Action Based Failures.......................................................49
4. Software Malfunctions.................................................................50 5. Software Hazards and Mishaps..................................................52 6. Controls of Unsafe Elements.......................................................54 7. Semantics Summary ....................................................................55
D. DEGREES OF FAILURE.......................................................................59 1. Failure Severity ............................................................................60
a. Failure Severity Definitions..............................................60 b. Failure Severity Summary ................................................65
E. STANDARDIZED FOUNDATION OF SOFTWARE SAFETY........67 1. Software Safety Standards ..........................................................67
a. AECL CE–1001–STD – Standard for Software Engineering of Safety Critical Software ..........................67

viii
b. NASA–STD–8719.13A – NASA Software Safety Technical Standard ............................................................................68
c. MOD 00–56 – The Procurement of Safety Critical Software in Defence Equipment Part 2: Requirements ..69
d. MIL–STD–882C/D – System Safety Program Requirements / Standard Practice for System Safety ......70
e. IEC 1508 – Functional Safety: Safety–Related Systems (Draft) ................................................................................71
f. Joint Software System Safety Handbook .........................71 g. Standards Conclusions .....................................................72
2. Traditional Methods to Determine Software Safety.................73 a. Coverage Testing...............................................................75 b. Requirements Based Testing (RBT) .................................76 c. Software Requirements Hazard Analysis (SRHA) ..........78 d. Software Design Hazard Analysis (SDHA) .....................79 e. Code–Level Software Hazard Analysis (CSHA)..............82 f. Software Change Hazard Analysis (SCHA) ....................83 g. Petri Nets ...........................................................................84 h. Software Fault Tree Analysis (SFTA)..............................87 i. Conclusions of the Estimation of Software Safety ..........90
F. CONCLUSIONS ......................................................................................93 G. CHAPTER ENDNOTES.........................................................................95
1. Comparisons of Safety Definitions .............................................95
III. COMMON TRENDS TOWARDS FAILURE ................................................101 A. INCOMPLETE AND INCOMPATIBLE SOFTWARE
REQUIREMENTS.................................................................................104 1. The Lack of System Requirements Understanding ................104 2. Completeness ..............................................................................105
B. SOFTWARE DEVELOPED INCORRECTLY..................................106 1. Political Pressure........................................................................106 2. The Lack of System Understanding .........................................108 3. The Inability to Develop ............................................................111 4. Failures in Leadership = Failures in Software........................112 5. Building With One Less Brick – Resources.............................114
C. IMPLEMENTATION INDUCED FAILURES ..................................116 1. Software Used Outside of Its Limits ........................................116 2. User Over–Reliance on the Software System ..........................121
D. SOFTWARE NOT PROPERLY TESTED .........................................123 1. Limited Testing Due to a Lack of Resources...........................123 2. Software Not Fully Tested Due to a Lack of Developmental
Knowledge ..................................................................................125 3. Software Not Tested and Assumed to Be Safe.........................127
E. CONCLUSIONS ....................................................................................129
IV. CONCEPTUAL FRAMEWORK AND DEVELOPMENT...........................131 A. SAFETY DEVELOPMENT GOAL.....................................................133 B. METRIC DEVELOPMENT.................................................................134

ix
1. System Size .................................................................................134 2. Time to Develop..........................................................................135 3. Effort to Develop........................................................................138 4. System Defects............................................................................139 5. System Complexity.....................................................................139
C. ASPECTS OF SOFTWARE SAFETY ................................................141 D. DEPICTING SAFETY ..........................................................................145 E. SUMMARY ............................................................................................145
V. DEVELOPING THE MODEL .........................................................................149 A. SAFETY REQUIREMENT FOUNDATION......................................151
1. Requirement Safety Assessments .............................................154 a. Level 1 Requirements......................................................155 b. Level 2 Requirements......................................................155 c. Level 3 Requirements......................................................156 d. Level 4 Requirements......................................................156
2. Requirement Safety Assessment Outcome ..............................157 3. Safety Requirement Reuse ........................................................159
B. THE INSTANTIATED ACTIVITY MODEL.....................................159 1. Formal Safety Assessment of the IAM.....................................166 2. Composite IAM ..........................................................................168
C. INITIAL IDENTIFICATION OF THE HAZARD ............................172 D. INITIAL SAFETY ASSESSMENT......................................................175 E. SOFTWARE DEVELOPMENT AND DECISION MAKING..........182
1. Process Flow Mapping...............................................................182 2. Initial Failure to Process Identification ...................................186 3. Assessing the System Process....................................................188
a. Failure Severity ...............................................................190 b. Application of Assessment ..............................................193
4. Decision Making.........................................................................207 a. Variables to Safety Decisions .........................................208 b. Hazard Controls ..............................................................211 c. Making the Difficult Decisions.......................................214
5. Development ...............................................................................218 6. Subjective Factors to Safety......................................................228
F. SUPERVISION OF SAFETY CHANGES ..........................................232 G. ASSESSMENT OF VALIDITY / EFFECTIVENESS OF THE
MODEL ..................................................................................................234 H. COMPARISON TO PREVIOUS WORKS.........................................238 I. CONCLUSIONS ....................................................................................238
VI. APPLICATION OF THE FORMAL METHOD FOR EVALUATION OF SOFTWARE SYSTEMS ............................................................................241 A. A SAFETY KIVIAT MODEL ..............................................................243 B. EFFECTIVENESS OF THE METHOD .............................................245 C. AUTOMATION .....................................................................................246 D. METRIC .................................................................................................249 E. MANAGEMENT ...................................................................................251

x
1. System Managers .......................................................................251 2. Metric Management...................................................................252
F. COMPLETENESS.................................................................................254 G. PERSPECTIVE CLIENTELE .............................................................256 H. CONCLUSIONS ....................................................................................258
VII. SOFTWARE DEVELOPMENT DECISIONS ...............................................261 A. SOFTWARE NEGLIGENCE ..............................................................261 B. SOFTWARE MALPRACTICE ...........................................................263 C. NEGLIGENT CERTIFICATION........................................................264 D. SAFETY ECONOMICS........................................................................265 E. CONCLUSION ......................................................................................268
VIII. SUMMARY AND CONCLUSIONS ................................................................269 A. CONTRIBUTIONS................................................................................271
1. Six Factors of Safety Failure.....................................................271 2. Definitions...................................................................................272 3. Metric ..........................................................................................273 4. Process Improvement ................................................................273 5. Contributing Benefits ................................................................274
B. CHANGES TO LEGAL PROTECTIONS..........................................275 C. MANAGEMENT ...................................................................................275 D. HANDLING FRAGILITY....................................................................276 E. SUGGESTIONS FOR FUTURE WORK............................................277
APPENDIX A. DEFINITION OF TERMS........................................................281
APPENDIX B. INCIDENTS AND MISHAPS ..................................................299 1. ARIANE 5 FLIGHT 501 FAILURE ....................................................299 2. THERAC–25 RADIATION EXPOSURE INCIDENT ......................300 3. TITAN–4 CENTAUR/MILSTAR FAILURE .....................................302 4. PATRIOT MISSILE FAILS TO ENGAGE SCUD MISSILES IN
DHAHRAN.............................................................................................304 5. USS YORKTOWN FAILURE..............................................................306 6. MV–22 OSPREY CRASH AND SOFTWARE FAILURE ................307 7. FAA – AIR TRAFFIC CONTROL FAILURE...................................308 8. WINDOWS 98 CRASH DURING THE COMDEX 1998
CONVENTION......................................................................................309 9. DENVER AIRPORT BAGGAGE SYSTEM ......................................310 10. THE LONDON AMBULANCE SERVICE ........................................312
APPENDIX C. ABBREVIATIONS AND ACRONYMS..................................317
APPENDIX D. DISSERTATION SUPPLEMENTS.........................................321 1. SOFTWARE SAFETY STANDARD TECHNIQUES REVIEW .....321 2. COVERAGE TESTING MEASURES ................................................324 3. DEFINITION OF SOFTWARE ENGINEERING.............................332
APPENDIX E. DISSERTATION METRIC......................................................333 1. INITIAL HAZARD IDENTIFICATION ............................................333

xi
2. INITIAL PROCESS IDENTIFICATION ...........................................336 3. INITIAL PROCESS MAP ....................................................................339 4. INITIAL FAILURE PROCESS MAP .................................................342 5. PROCESS ASSESSMENT....................................................................343 6. OBJECT EXECUTION PROBABILITY ...........................................345 7. OBJECT FAILURE PROBABILITY..................................................347 8. SYSTEM HAZARD FLOW AND PROBABILITY...........................350 9. PROBABILITY SUMMATION...........................................................377 10. SAFETY ASSESSMENT INDEX SUMMATION RESULTS ..........380 11. PROCESS PROCEDURES...................................................................389
INITIAL DISTRIBUTION LIST .................................................................................395

xii
THIS PAGE INTENTIONALLY LEFT BLANK

xiii
LIST OF FIGURES Figure 1 Mars Climate Orbiter Failure................................................................................. 4 Figure 2 Dual Impressions of Safety.................................................................................. 32 Figure 3 Software Failure Flow.......................................................................................... 39 Figure 4 Degrees of Failure................................................................................................ 66 Figure 5 Petri Net Example ................................................................................................ 85 Figure 6 Fault Tree Symbology.......................................................................................... 88 Figure 7 System Fault Tree Example ................................................................................. 89 Figure 8 Software Fault Tree Example .............................................................................. 89 Figure 9 The Composite Pallet of Software Engineering................................................. 111 Figure 10 Time to Develop vs. Complexity and Error Detection ...................................... 137 Figure 11 Safety in the Spiral Model ................................................................................. 144 Figure 12 Basic Instantiated Activity Model Example ...................................................... 160 Figure 13 Essential Graphic Elements for IPO Block........................................................ 162 Figure 14 IAM Safety Analyses Notation.......................................................................... 167 Figure 15 Composite IAM Representations....................................................................... 169 Figure 16 Conjunctive IAM split into Individual IAMs .................................................... 169 Figure 17 Firewall Control Example Figure ...................................................................... 221 Figure 18 Redundant Control Example Figure .................................................................. 222 Figure 19 Filter Control Example Figure ........................................................................... 223 Figure 20 Kiviat Depictions of Safety Related Elements................................................... 244 Figure 21 WACSS Initial Process Flow Depiction ............................................................ 339 Figure 22 WACSS Initial Failure Depiction ...................................................................... 342 Figure 23 WACSS Object Execution Probability Map...................................................... 345 Figure 24 WACSS M1 Malfunction Process Flow............................................................. 350 Figure 25 WACSS M2 Malfunction Process Flow............................................................. 353 Figure 26 WACSS M3 Malfunction Process Flow............................................................. 361 Figure 27 WACSS M4 Malfunction Process Flow............................................................. 366 Figure 28 WACSS M5 Malfunction Process Flow............................................................. 374

xiv
THIS PAGE INTENTIONALLY LEFT BLANK

xv
LIST OF TABLES
Table 1 Quantitative and Qualitative Factors of Safety.................................................... 17 Table 2 Code Complexity and Size Comparison. ............................................................. 34 Table 3 Failure Types List ................................................................................................ 40 Table 4 Software Failure Cause and Effects................................................................... 104 Table 5 IAM Safety System Objects............................................................................... 165 Table 6 IAM Basic Notation Definitions........................................................................ 166 Table 7 Basic Consequence Severity Categories............................................................ 178 Table 8 OPNAV Mishap Classification Matrix.............................................................. 179 Table 9 Failure Severity.................................................................................................. 191 Table 10 Example Probability Definition Table ............................................................... 195 Table 11 Example System Failure Definition Table......................................................... 204 Table 12 Example Probability vs. Severity Table............................................................. 205 Table 13 Example Hazard to Safety Table ....................................................................... 209 Table 14 Hazard Control Effect on System Safety ........................................................... 214 Table 15 Failure Control Properties.................................................................................. 227 Table 16 Developmental Effects to Safety ....................................................................... 229 Table 17 SEI's Taxonomy of Risks................................................................................... 231 Table 18 Quantitative and Qualitative Factors of Safety.................................................. 236 Table 19 Software Safety Standard Techniques Review.................................................. 323 Table 20 WACSS Initial Hazard Identification Table ...................................................... 333 Table 21 WACSS Consequence Severity Categories ....................................................... 334 Table 22 WACSS Initial Safety Assessment Table .......................................................... 335 Table 23 WACSS Initial Process Identification ............................................................... 336 Table 24 WACSS Initial Input Identification ................................................................... 337 Table 25 WACSS Initial Output Identification................................................................. 338 Table 26 WACSS Initial Limit Identification................................................................... 338 Table 27 WACSS Initial Failures to Malfunction Identification...................................... 340 Table 28 WACSS Execution Probability Definition Table .............................................. 343 Table 29 WACSS Object Failure Probability Definition Table ....................................... 344 Table 30 WACSS Failure Probability Table..................................................................... 347 Table 31 WACSS Conditional Failure Probability Table................................................. 349 Table 32 WACSS Probability Summation........................................................................ 377 Table 33 WACSS System Failure Definition Table ......................................................... 378 Table 34 WACSS Probability vs. Severity Table ............................................................. 379 Table 35 WACSS System Failure Probability Letter Designation. .................................. 380 Table 36 WACSS Malfunction to Safety Assessment...................................................... 388

xvi
THIS PAGE INTENTIONALLY LEFT BLANK

xvii
LIST OF EQUATIONS
Equation 1 System Safety..................................................................................................... 150 Equation 2 Loop Probability Equation................................................................................. 161 Equation 3 IAM Summation ................................................................................................ 171 Equation 4 Legal Definition of the Cost–Benefit Equation ................................................. 262

xviii
THIS PAGE INTENTIONALLY LEFT BLANK
xix
LIST OF EXAMPLES
Example 1 IAM Safety Analyses Mathematical Representation......................................... 167 Example 2 Malfunction Representation of the IAM Analyses ............................................ 167 Example 3 Conjunctive IAM Mathematical Representation ............................................... 170 Example 4 Failure within an Object..................................................................................... 201 Example 5 Failure of an Object with throughput to a Malfunction ..................................... 201 Example 6 Example Probability of Failure Equation .......................................................... 202 Example 7 Error Handler Example ...................................................................................... 226

xx
THIS PAGE INTENTIONALLY LEFT BLANK

xxi
ACKNOWLEDGMENT
I wish to express my sincere gratitude to the United States Navy for affording me
the opportunity to pursue this and other degrees while simultaneously serving an
operational tour in the Forward Deployed Naval Forces. In the days of dwindling budgets
and resources, opportunities to pursue advanced educational opportunities are rare. I am
gracious that the Navy and the Naval Postgraduate School have the foresight to offer this
degree program to those who are called to serve at the tip of the spear.
Additionally, I wish to express my gratitude to Dr. Luqi, my advisor, for sharing
her knowledge and experience with me. Despite the miles and continents that sometimes
separated us, she was still there to offer her insight and advice on this research. To her,
and to the many other members of the Software Engineering Department of the Naval
Postgraduate School, I owe a great debt; and to Mr. Michael L. Brown and Prof. Mikhail
Auguston who contributed greatly to the refinement of the dissertation through their
experience with System Safety.
This dissertation is dedicated to the airmen and seamen who served with me,
protected me, guided me, encouraged me to strive for greater things, and who gave me the
experience to write this dissertation; and finally to my wife who patiently waited for my
return from many a distant voyage. No man alone can accomplish such an endeavor.

xxii
THIS PAGE INTENTIONALLY LEFT BLANK

xxiii
EXECUTIVE SUMMARY
Despite significant efforts to improve the reliability and success of software
system development, there exists an inherent level of failure within all software based
systems. A decision to select one software system over another must be made considering
the level of failure and its consequences. Due to the proliferation in technological
requirements and control, government and private organizations increasingly require
high–assurance software development that cannot be satisfied by standard techniques. I
introduce in this dissertation a stepwise method for measuring and reporting the potential
safety of a software system, based on an assessment of the potential for event failure and
the corresponding potential for that failure to result in a hazardous event.
The lack of such a methodology and assessment has resulted in a series of
unforeseen, highly publicized, and costly catastrophic failures of high–assurance software
systems. This dissertation introduces a formal method for identifying and evaluating the
weaknesses in a software system using a more precise metric, counter to traditional
methods of development that have previously proven unreliable. This metric utilizes both
a qualitative and quantitative approach employing principles of statistics and probability
to determine the level of safety, likelihood of hazardous events, and the economic cost–
benefit of correcting flaws through the lifecycle of a software system.
From this dissertation, the state of the art of Software Safety and Software
Engineering benefits from a review of the faults and complexities of software
development, a formal model for assessing Software Safety through the development
process, the introduction of a common metric for evaluating and assessing the qualitative
and quantitative factors of a Software System, improvements and awareness of the facets
of Software Safety Economics, and a formal study of the state of the art of Software
Safety. This dissertation serves as a primer for future research and improvements to the
development process and to increase awareness in the field of Software Safety and
Software Engineering.

xxiv
THIS PAGE INTENTIONALLY LEFT BLANK

1
I. INTRODUCTION
“To err is human, but to really foul things up requires a computer”1
The Farmers’ Almanac for 1978
A. PROBLEM AND RESULTS
When the first modern computer based systems were deployed, just a mere fifty
years ago, they were designed to make simplistic calculations at a processing speed
greater then those possible by man and at a higher rate of reliability.2, 3 In their initial
stages, their operators would manually verify calculations and procedures to ensure
accuracy and compliance with established standards. Today, software based computer
systems are no longer used exclusively to simply make radiometric calculations – they
are developed to monitor, process, and control a wide variety of complex operations
whose failure could result in significant danger and damage to the operators, the general
public, and to the environment.
Despite significant efforts to improve the reliability of software system
development, there exists an inherent level of failure within all software based systems.
A decision to select one software system over another must be made considering the level
of failure and its consequences. The research of this dissertation has failed to identify a
viable measure of software safety in the current state of the art. It is the purpose of this
dissertation to establish a method for measuring and reporting the potential safety of a
software system, based on an assessment of the potential for event failure and the
corresponding potential for that failure to result in a hazardous event.
From this dissertation, the state of the art of Software Safety and Software
Engineering will benefit from a review of the faults and complexities of software
1 Capsules of Wisdom, The Farmers’ Almanac for 1978, Yankee Publishing; 1977. 2 Computer History Collection, The Smithsonian Institute; 2003. 3 War Department, Branch of Public Relations, Press Release, Ordnance Department Develops All-
Electronic Calculating Machine, War Department, United States Government; 16 February 1946.

2
development, a formal model for assessing Software Safety through the development
process, the introduction of a common metric for evaluating and assessing the qualitative
and quantitative factors of a Software System, the improvements and awareness of the
facets of Software Safety Economics, and a formal study of the state of the art of
Software Safety. It is the intent that this dissertation serves as a primer for future
research and improvements to the development process and to increase awareness in the
field of Software Safety and Software Engineering.
B. LEARNING AT THE EXPENSE OF FAILURE
1. Failure Due to a Factor of 4.454 On December 11, 1998 at 18:45:51 UTC5 (13:45:51 EST), the Mars Climate
Orbiter (MCO) departed the Cape Canaveral Air Force Station aboard a Delta II Launch
Vehicle on a six year mission to collect information on the Martian climate and serve as a
relay station for future Mars Missions.6 After nine months of interplanetary travel, the
MCO was scheduled for Mars orbital insertion on the morning of September 23, 1999.
At 09:00:46Z the MCO’s main engines commenced a preplanned 16 minute and 23
second aerobreaking maneuver to slow the craft prior to entry into the Martian
atmosphere. At the time of main engine burn, the vehicle was traveling at over 12,300
mph or 5.5 km/sec. Four minutes later, as the vehicle passed behind the Martian Planet,
signal reception from the MCO was lost. Signals were lost 49 seconds earlier than
predicted due to planetary occultation.7 After 09:04:52Z, no signal was regained. For 48
hours, NASA and JPL made exhaustive attempts to reacquire the signal and locate the
MCO. On September 25, 1999, the Mars Climate Orbiter was declared lost.
4 The figure 4.45 is analogous to the metric to pounds force conversion factor that was overlooked
during the mathematical processing of the Mars Climate Orbiter navigational algorithm, referenced later in this sub-chapter.
5 Also referred to as “Z” or “ZULU” Time Zone, Coordinated Universal Time, The Merriam-Webster’s Collegiate Dictionary, Tenth Edition, Merriam Webster, Incorporated; Springfield, Massachusetts; 1999.
6 Mars Climate Orbiter Mission Overview, Jet Propulsion Laboratory, Mission Overview, National Aeronautics and Space Administration and Jet Propulsion Laboratory; 1998 – 1999. http://mars.jpl.nasa.gov/msp98/orbiter/launch.html
7 Def: The phenomenon that occurs when a vehicle passes behind another celestial body, obscuring the vehicle from view and reducing its ability to communicate with other receivers in line of sight.
3
Investigations into the loss of the Mars Climate Orbiter revealed that the orbiter
was over 170 km below its planned entry altitude at the time of main engine firing. The
MCO Mishap Investigation Board found the cause of the mishap to be a failure to use
Metric (Newton) units in the coding of the ground software file of the trajectory models,
in direct contradiction of system development requirements.8 , 9 In contrast, thruster
performance data was reported and stored in the system’s database in English (pounds
force) units. The lack of a conversion factor placed the orbiter in too low a trajectory to
be sufficiently slowed prior to entry into the atmosphere. At its estimated rate of entry,
the Mars Climate Orbiter most likely burnt up on orbital insertion, skipped off the
atmosphere and reentered space with catastrophic damage, or impacted the Martian
surface and was destroyed (see Figure 1). None of the planned mission objectives were
achieved. Mission expenditures totaled $327.6 million with $193.1 million for spacecraft
development, $91.7 million for launch, and $42.8 million for mission operations. In
addition, future Mars missions were placed in jeopardy without a dedicated radio orbiter;
a mission that would have been filled by the MCO.
8 Mars Climate Obiter Mishap Investigation Board Report, Phase I Report, National Aeronautics and
Space Administration and Jet Propulsion Laboratory; 10 November 1999. 9 Note: English thrust units are in Pounds–Force – Second, while Metric thrust units are in Newton –
Second. The conversion factor is 1 Pound Force = 4.45 Newton.

4
Figure 1 Mars Climate Orbiter Failure
2. Premature Shutdown Just three months after the loss of the MCO, on the morning of December 3rd,
1999, the Mars Polar Lander, the second in a series of Mars Planetary Explorers,
experienced a premature shutdown of its main engines and deployment of its lander legs
during its terminal decent propulsion phase to the Martian Planet.10 The premature
shutdown and deployment was attributed to a loss of system telemetry data. The
premature shutdown resulted in the lander free–falling to the planet’s surface and
eventual destruction. Investigation revealed an inability in the software system’s base
logic to correct for the loss of telemetry data or execute a failsafe maneuver.
Mishap Investigation Boards determined the fault in both spacecraft mishaps to be
poor project management practices and oversight, improper development techniques, the
failure to completely test the control systems, the failure to properly detect potential
10 Mars Polar Lander Mishap Investigation Board Report, National Aeronautics and Space
Administration and Jet Propulsion Laboratory; Washington D.C.; 28 March 2000.
Earth
Sun
29 Hr Orbit
Anticipated Approach Trajectory
Actual Approach Trajectory
Burn Up, Surface Impact, or Atmospheric Skip
5
hazards and faults, and the failure to take precautions to prevent such catastrophic
mishaps. Both systems were developed under the NASA principle of “Better, Faster,
Cheaper.”11 The second failure resulted in the total loss of over half a billion dollars of
sophisticated space equipment and the failure to establish the deployed base
infrastructure for future Mars missions.
C. A HISTORICAL TREND OF FAILURE
At the end of the 20th Century, Software Failure has proven one of the greatest
detractors of public confidence in the technology.12 A 1995 study by the Standish Group
noted that over 31.1% of the projects sampled were cancelled before they were ever
completed.13 Of the remaining 68.9%, 52.7% exceeded projected costs by a staggering
189%. It was estimated that American companies and the Federal Government lost over
$81 billion to cancelled projects in a single year, and an additional $59 billion to software
systems that were delayed or were completed past their expected delivery time. It is
inappropriate to use the term “expense”, as was referred to in the study, but rather to the
term “lost”, as organizations received no additional reward or gain for additional money
spent.14 While the phrase may be a matter of semantics, it is essential that researchers
and evaluators of Software Safety do not attempt to soften or mitigate their vocabulary at
the cost of hiding the significant dangers that lurk within software system failures.
Through the end of the decade, the statistics failed to improve. A large sampling
of over 8,000 software systems revealed that over 40% of the Information Technology
(IT) projects end in failure. Of the remaining 60%, 33% were either over budget,
completed past their expected delivery date, or lacked primary features specified in
system requirements, or both. The total cost in lost productivity and material, lost
11 Goldin, Dan; Public remarks to JPL Employees, NASA Public Affairs, National Aeronautics and
Space Administration; Washington, D.C.; 28 May 1992. 12 Interagency Working Group (IWG) on Information Technology Research and Development (IT R&D),
Information Technology: The 21st Century Revolution, Overview, High Confidence Software and Systems, National Coordination Office for Information Technology Research and Development, www.ccic.gov/pubs/blue01/exec_summary.html.
13 Chaos, The Standish Group, The Standish Group International; West Yarmouth, Massachusetts; 1995. 14 See Chapter Endnote I.I.1. – Software Failure Cost

6
revenue, and legal compensatory damage due to failed or flawed software was beyond
computation. Some estimates put the total American loss well in excess of $150 billion
annually, 15 , 16 an amount greater then the GDP of Hong Kong, Greece, Israel, or
Ireland.17, 18 One of most disturbing consequences of Software Failure is the increasing
trend in deaths and human maiming.19
Despite over 50 years of software development, the discipline of Software
Engineering (SE) has failed to improve in cadence with the technology that it marches
alongside of. Statistically speaking, software development is a failing industry, buoyed
up only by the demand and requirement for systems to control the same technology that it
fails to keep pace with. Consumers have grown callous to the fact that the software they
have purchased will be flawed, require updates and service packs, and will crash at the
most inopportune moment. Businesses budget for and expect to pay for extended delays
and faults, take out insurance against the inevitable failure, and develop manual
contingency plans to continue operations in the event that automation fails. Due to the
complexity of some high–assurance systems, there is no manual contingency to fall back
upon in the event of a loss of automated control.
Software Engineering is often confused and misconstrued with the simplistic
discipline of software programming; where software programming is the basic process of
putting code to keyboard, Software Engineering is the complex process of developing
and implementing the logic and methodology behind the code. The Software
Engineering discipline encompasses the study of:
15 Note: It is estimated that the American public spent over $250 billion on application development in
1995, according to the 1995 Chaos study by The Standish Group – The Standish Group International; West Yarmouth, Massachusetts; 1995.
16 Neumann, Peter G.; Moderator, Risks – Forum Digest, Forum On Risks To The Public In Computers And Related Systems, ACM Committee on Computers and Public Policy, Published weekly, SRI Inc.
17 CIA World Factbook, 2000 Edition, United States Central Intelligence Agency (CIA); 2000. 18 Note: In addition to the countries listed, there are over 195 countries with GDPs less then $150
Billion, according to the CIA World Factbook, 2000 Edition. 19 Neumann, Peter G.; Moderator, Risks – Forum Digest, Forum On Risks To The Public In Computers
And Related Systems, ACM Committee on Computers and Public Policy, SRI Inc.

7
• Efficiency and practicability of code,
• Modernization techniques,
• Reusability,
• The compiling processes,
• Process assurance,
• Technological management of information,
• The applied psychology of the developers,
• The management and maturity of the design process,
• The ultimate integration of the software product into the final system.20
The IEEE Standard simply defines Software Engineering as “the application of a
systematic, disciplined, quantifiable approach to the development, operation, and
maintenance of software.” 21 , 22 What Software Engineering has not mastered is the
discipline of Software Safety.
Since the 1960, when the term was first coined, Software Engineers have
attempted to design and develop safe and reliable systems that are cost effective and
technologically advanced to control and manage sophisticated systems. Despite valiant
efforts, history has demonstrated that software fails to remain economical, efficient,
reliable, or safe, and that a vast number of projects fail to use systematic and disciplined
approaches to design. The results are evident by the growing number of failures and
faults that are recorded annually (see APPENDIX B – INCIDENTS AND MISHAPS).
20 Weinberg, Gerald; The Psychology of Computer Programming, Dorset House Publishing; 1999. 21 def: Software Engineering, IEEE Standard Glossary of Software Engineering Terminology, IEEE
Standard 610.12, Institute of Electrical and Electronics Engineers, Inc.; 1990, 1991. 22 See Chapter Endnotes I.I.2 – NATO Software Engineering Definition
8
D. QUESTIONING SOFTWARE SAFETY
1. Software is Prone to Failure Failure is an inevitability that must be anticipated, investigated, and compensated
for. The current state of the art of Software Development has failed to solve the problem
of quantifying Software Safety and reducing Software Failure. The statistics of Software
Failures are well documented in academic and industry literature, as well as in the public
press. Previous efforts have been made at quantifying the risks of software development
as well as identifying the procedures for dealing with these risks.23 While these efforts
have made great strides at categorizing development risks,24 they have failed to identify a
common criterion for development risk and system safety. Coincidental with the absence
of a common risk criterion is the lack of a common safety or quality assurance criterion.
Due to the proliferation in technological requirements and control, government
and private organizations increasingly require high–assurance software development that
cannot be satisfied by standard techniques. According to the Defense Advanced
Research Projects Agency's (DARPA) Joint Technology Office Operating System
Working Group, comprised of DARPA, NSA, and the Defense Information Systems
Agency (DISA), many critical government applications require a high–assurance for
safety, security, timeliness, and reliability.25 Examples of such applications include
nuclear power plant control systems, biomedical devices, avionics and flight control
systems, systems that protect classified information, and command, control, computers,
communications, and intelligence (C4I) systems.26 Due to rapidly changing development
techniques, little work has been done in the development and integration of high–
confidence systems. Currently, interactions and integrations are poorly understood and
23 See Chapter II.E – STANDARDIZED FOUNDATION OF SOFTWARE SAFETY 24 Nogueira de Leon, Juan Carlos; A Formal Model for Risk Assessment in Software Projects, Naval
Postgraduate School; Monterey, California; September 2000. 25 Bury, Lawrence; Software Engineering Tools, A Technology Forecast, NSA Office of INFOSEC
Research and Technology; February 1999, http://www.nsa.smil.mil/producer/forecast/reports/set/set.html.
26 Note: For this dissertation, Command, Control, Computers, Communications, and Intelligence (C4I) is analogous to Command and Control (C2); Command, Control, and Communications (C3); and Information Warfare (IW).

9
analytic tools for specifying and decomposing complex properties are flawed or non–
existent. Formal methods and specifications typically are used in developing high–
assurance type systems. Formal methods must also be integrated to include Software
Safety and assurance techniques.27 To enhance the process, the U.S. Government is
attempting the integration of “program understanding” tools.
A DARPA/NSA/DISA Joint Technology Office (JTO) working group has stated
that, “mission–critical systems are subject to a number of stringent design and operation
criteria, which have only recently begun to emerge as significant requirements of
commercial systems.” These criteria, which include dependability, security, real–time
performance and safety have traditionally been addressed by different communities
yielding solutions that, at best, fail to meet constraints imposed by other criteria and, at
worst, may interact to degrade the overall level of confidence that the system can fulfill
its mission. While little work has been done to integrate high–confidence systems, it has
become clear that these constraints are not orthogonal and cannot be jointly met through
simple layering or the composition of independently derived services. Interactions are
poorly understood and analytic tools for specifying and decomposing complex properties
are non–existent.
Software is prone to failure. While no system can ever be 100% safe and fool
proof, every effort should be made to identify and reduce the number or potential for
unsafe incidents.
2. How Can Software Be Determined Safe? Increasingly, the fields of military defense and commercial industry require
technologically complex software tools to maintain and manage their critical systems.
These critical systems have become far too intricate to be maintained by humans or by
simple and easily proven hardware. Historically, the failure of such systems has resulted
in the detrimental loss of essential military components, weakening our national defense;
27 Research Challenges in Operating System Security, DARPA/NSA/DISA Joint Technology Office
Operating System Security Working Group; August 1998.

10
of governmental support systems, sending our national data stores and operations into
chaos; and of manufacturing and fabrication units, directly affecting productivity and our
country’s gross national product. Far too many lives have been lost and far too many
resources have been wasted on untested and unproven software that failed at the most
critical and inopportune moments.
Presently, Software Safety and the development of critical software systems focus
on four principles of hazard control, namely:
• Eliminating the potential hazard from the software system.
• Prevent or minimize the occurrence of the hazard.
• Control the hazard if it occurs.
• If the hazard occurs, minimize the severity of the damage.
Despite the best efforts to manage system hazards, software cannot be developed
and referred to as safe unless the spark that resulted in the hazard can be identified and
isolated, and the system can be judged against an accepted criterion for safety.
QUESTION: Is it possible to develop a common assessment criterion that can
determine if software is safe?
The needed assessment criterion must be cost effective, efficient, and easy to
implement. This assessment criterion must be structured and well defined, and easily
integrated into the development process. This assessment criterion must include
techniques for evaluating potential safety flaws from the requirements level through the
implementation and use. The assessment criterion must identify the potential
catastrophic consequences of the Software Failure. Additionally, this assessment
criterion must include a safety investigation and determination process for regression
testing necessary after software requirement changes. While it is popular to simply rely
on a single assessment to determine the safety of a system, such an assessment is not cost
effective. A complete assessment requires analysis and test data that supports the
conclusion of the analysis.

11
Chapter II and III outline many of the failures in software testing and assessments
that are crucial to the success of a safety related software system. Chapter IV and V
describe the principle elements of successful assessment process and the data necessary
to certify the validity of the assessment.
3. What Can Be Done to Make Software Safer? In parallel with determining the safety of a software system, it is essential to
improve techniques for the continual development of safe software. The field of
Software Safety is no more in its infancy than the field of Software Engineering.
Software Engineering is based on general principles of logic, rooted in mathematics and
science. While the application of software to electronics is only half a century old, the
fundamental core of software operation is rooted in the timeless concepts of logic and
reasoning. Such concepts can be related or traced to early schools of philosophy and
applied psychology. 28 Due to the increasing rate in technological advancements in
computer science and Software Engineering, and the heavy reliance on automated
management systems, software failures have become increasingly costly and pronounced.
As automation reliance increased, the ability for existing safety measures to prevent an
accident has decreased. As technology advances and broadens its scope of control, the
numbers of catastrophic events that can be triggered from a single software failure
become near limitless.
The method must be applicable to traditional and new types of development
techniques. This method must be able to identify and prevent the new types of accidents
and failure modes that can arise with automated assurance systems. This method must be
capable of detecting, tracking, and indicating trends in unsafe programming and
development to prevent future mishaps through a change in procedures and environment.
This method must span the entire lifecycle of the development and integration, and
include using integrated systems, software, and human task models to analyze the safety
of the complete system. This method must review system–level requirements for
28 Young, Norman; Computer Software Cannot Be Engineered, Private papers; 1999,
http://the2ndcr.mg1.net/cscbe.html.

12
completeness and constraints control, including examining the ramifications of
automation and human task design decisions on overall system safety. This method
should devise design techniques and tools for performing integrated hazard analyses on
formal system, software, and operator task models. For the benefit of mishap reviews
and software forensics, this method must permit backward tracing of hazardous states to
determine what human errors and software behaviors are most critical with respect to
hazardous system states.
E. GENERAL APPROACH
Software or System Safety is traditionally defined as a system’s ability to operate
within the accepted and expected parameters of its requirements.29 Additionally, safety
includes a system’s ability to prevent an unacceptable act, hazardous condition, or mishap
from occurring. To the contrary, risk can be defined as the frequency or probability that
an unacceptable act or hazardous condition could occur; “How risky is the system?” Risk
can also be quantified with a measure of the consequences of the unfavorable action or
severity of the mishap, or as an expression of possible loss in terms of severity and
probability.30 “Is the system safe to use?” “What is the risk of something going wrong
with the system?” Each of these viewpoints contributes to the overall concept of
software system safety, despite their somewhat contradictory principles.
A thorough study and investigation of subject matter literature has revealed a
series of definitive factors that lead to degradations in Software Safety, including:
• Lack of experience in software development and assessments,
• Disjointed educational emphasis and training in the field of Software
Safety,
• Proprietary software development practices, definitions, requirements
towards Software Safety,
29 Nesi, P.; Computer Science Dictionary, Software Engineering Terms, CRC Press; 13 July 1999,
http://hpcn.dsi.unifi.it/~dictionary.

13
• A lack of understanding of the relationship between Software
Development and Software Safety,
• The over emphasis of quantifying failure while lacking appropriate
emphasis to qualifying failure.
We present a format to address or resolve these shortcomings through or by:
• Establishing a knowledge base of Software Safety and risk management,
as it applies to safety through the lifecycle of a system,
• The introduction of a generalized series of practices and definitions for
defining Software Safety,
• The presentation of metrics for determining the safety index of a software
system,
• The review of the relationship between developmental actions and
operational failures,
• Improving efforts and practices towards identifying potential failures of
Software Safety and methods for improvement,
• The study of the quantitative and qualitative factors of Software Safety,
• The development and introduction of the Instantiated Activity Model for
depicting failure logic flow to determine the potential for malfunction.
• The development and introduction of mathematical equations for
the computation of the probability of occurrence of a malfunction.
• The development and introduction of a computation of a software
system’s Safety Index.
• The discernment between developmental risk and software safety,
• The ability to depict software safety mechanics in a common graphical
format.
30 Draft Reference Guide for Operational Risk Management, Naval Safety Center, Department of the
Navy; 09 September 1999.
14
In current practices, Software Safety and Risk Management consists of a checklist
and metric–based practice that requires a formal detailed and documented process that
relies on human subject matter expertise and automated investigation systems.31, 32, 33, 34, 35
The goal of any measure would be to make it as intuitive as possible to eliminate any
variable or chance that the user would deviate from the measure’s practice and
procedures. It would be essential that measures be refined sufficiently to ensure that
users could objectively observe the variables of a system.
The following chapters present a foundation for establishing a knowledge base of
Software Safety and risk management, as it applies to safety through the lifecycle of a
system. Included are outlines and details for creating methods and metrics to determine
the safety index of a software system.
Investigation reveals the relationship between the development process and
Software Safety. A detailed investigation has been made on the methods of software risk
management and software development, to determine the commonality and conflicts
between the two as well as where refinements can be made to ultimately enhance
Software Safety. Efficiency and productivity dictate that Software Engineers must strike
a delicate balance between the needs to reduce development risk and increase product
safety, while inflicting as small as possible an impact on the engineering timeline and
expense of development.
Previous studies and efforts have concentrated on quantifying the risks associated
with software development,36 and the actual evaluation of the development process to
31 Cigital Solutions and Cigital Labs, Cigital, Inc, Dullas, Virginia; 2004 32 Kaner, Cem; Software Negligence and Testing Coverage, Software QA Quarterly, vol. 2, num. 2, pg.
18; 1995/1996. 33 Support Capabilities of the Software Engineering and Manprint Branch, Systems Performance and
Assessment Division, Materiel Test Directorate, White Sands Missile Range; September, 2000. 34 Newsletter: from Risknowlogy, Risknowlogy, Schinveld, The Netherlands; 14 January, 2004 35 Safety Hazard Analysis and Safety Assessment Analysis (Probabilistic Software), Reliability
Engineering at the University of Maryland, Department of Mechanical Engineering, College Park, Maryland.
36 Nogueira de Leon, Juan Carlos; A Formal Model for Risk Assessment in Software Projects, Naval Postgraduate School; Monterey, California; September 2000.

15
determine the optimal method for creating the software. While these previous methods
benefited the development process and worked to ensure the successful completion of the
project with minimal risk of exceeding planned budgets and schedules, they failed to
detail the hazards of operating the product or the events that could cause specific hazards,
either during the development or implementation process. These previous studies have
also failed to study the implications of unsafe incidents or hazards. Addressed within this
Dissertation are the development processes and risks to development, with the intent to
design a method to efficiently engineer software with the greatest assurance of success
and safety. Also included is a review and study of the software development process37,
concentrated on the identification of potential failures related to Software Safety and
probable methods for improving the overall safety of the system.38
Software Safety encompasses the study of the potential hazards of a software
system, the subsequent consequences of the hazard, and the prevention of these hazards
to ensure a safe product. Software Safety comprises all of the phases of a software
product’s lifecycle, from conception to implementation, re–composition, cross integration,
and eventual retirement. Software Safety is a subset of the greater System Safety concern
that includes all causes of failures that lead to an unsafe state such as:
• Hardware failures
• Software failures
• Failures due to electrical interference or due to human interaction
• Failures in the controlled object.
For the purpose of this dissertation, the study and methodology are restricted
solely to Software Safety. While many equate Risk Management to a quantifiable
science,39 Software Safety is both quantitative and qualitative. There are many intangible
aspects of Software Safety that are not found on a spreadsheet or checklist, but are
37 See Chapter III. 38 See Chapter V.E.4. 39 Nogueira de Leon, Juan Carlos; A Formal Model for Risk Assessment in Software Projects, Naval
Postgraduate School; Monterey, California; September 2000.

16
learned and mastered by understanding the principles of safety and fundamentals of
software design. This dissertation outlines, quantifies, and qualifies the factors of
Software Safety as they apply to high–assurance systems.
Software Safety can be pictorially and textually depicted in a rational fashion with
many logic based development methods including Fault Tree Analysis (FTA), Petri Nets,
Failure Modes Effect and Criticality Analysis (FMECA), HAZOP, Impact Analysis, and
Cigital's Safety Net Methodology based on a technique called Extended Propagation
Analysis.40 I have reviewed and included a study of applicable methods of hazard and
safety analysis and their relationship to Software Development and Safety. Where
necessary, I have modified common methods to specifically apply to the unique
characteristics of Software Engineering, Development, and Safety.
40 Software Safety, Resources – Definitions, Citigal Labs, Citigal; Dulles, Virginia; 2001.

17
Complexity Veritability of Inputs
Cleanliness of Inputs (Quality) Dependability / Reliability Factor of Inputs
Ability to Sanitize Inputs (Correction) Consequences of Sanitization
Ability to Filter Inputs (Prevention) Consequences of Filtering
Permeability of the Requirements Permeability of the Outputs Veritability of Outputs
Ability to Verify Outputs (Quality) System quality control
Ability to Sanitize Outputs (Correction) Consequences of Sanitization
Ability to Filter Outputs (Prevention) Consequences of Filtering
Probability of a Fault Consequence of Fault Probability of Failure Consequence of Failure Product Safety or Dependability Index.
Table 1 Quantitative and Qualitative Factors of Safety
The shortcomings of Software Safety can be improved upon by equating and
assessing of quantitative and qualitative point values.
Further chapters investigate and define the above factors of safety. These
quantitative values are demonstrated for independent, modular, and composite software
systems.
F. THE FOCUS OF SOFTWARE SAFETY
The field of Software Safety has been understudied and underrepresented in
literature until late due to the fact that, historically many of the previous software systems
were controlled and protected by mechanical firewalls and human intervention. Today’s
technology can no longer be controlled by yesterday’s antiquated system techniques. The
current rate of decision–making processes demands an automated system beyond the
capabilities of systems designed just a decade ago. The logic complexities of today’s
software systems overshadow the abilities of earlier languages and processor limitations.
18
The impacts of today’s Software Failures are magnified by the complexity and cost of the
systems for which they control. The primary focus of this study is on identifying factors
that create the unsafe conditions through all phases of the software’s lifecycle.
History has demonstrated that most mistakes and hazards are based on actions and
occurrences that could have been prevented if proper methods and procedures were
followed, or if well based and proven precautions and measures were implemented
through the lifecycle of a system. This study focuses on the methods and procedures that,
if followed, would increase Software Safety and in turn decrease the failure rate of high–
assurance systems. Additionally, this study identifies the measures and precautions that
historically have proven successful in improving system safety in other disciplines and
can be readily adapted to Software Engineering.
Once the methods and practices that create a safer software product are
understood, this dissertation outlines and describes a formal method for developing safe
software, through the expansion and refinement of existing development methods and
metrics. Safety is not something that occurs, it is something that is developed and
achieved – A system reaches a level of safety by preventing some factor of undesirable
actions and not by the absence of all hazards. Once there is an understanding of why
software fails and the potential hazards of that failure, a formal metric and methodology
can be designed that depicts the measure of that safety and appropriate procedures for
improving the measure through development. A product of this study includes a formal
metric and methodology for measuring Software Safety and the processes for potentially
improving the resulting product.
The success of Software Safety relies on solving the dilemma of hazard
avoidance through the entire lifecycle of the software system.
As previously stated, Software Safety is a subset of System Safety and the
associated failures and hazards. For the purpose of this dissertation, this research and
model are limited to and encompass the effects of Software Safety as it applies to the
overall system. This dissertation limits its research up to the point of software integration
19
into the complete software–hardware–human system. A brief discussion is included to
address hardware failures as they relate to software systems and the safety mechanisms
that should prevent harmful incidents from such failures. Included is an addressing of the
effects of human interaction and interference as part of the investigation of potential
software faults and failures.
Risk management is a fundamental aspect of software development. A significant
number of studies, dissertations, and articles have delineated the constructive properties
of risk management in the development process. The concept of a risk–based approach
to development has been proven to reduce or prevent procedure–based flaws and increase
software development efficiency.41 This study reviews the concepts of risk and risk
management as it applies to Software Engineering, and its applicability to Software
Safety.
G. CONTRIBUTIONS
The contribution of this dissertation and study to the state of the art of Software
Engineering include, but are not limited to:
• A review of the faults and complexities of software development resulting
in potential failures. These potential failures are then evaluated to
determine their contributory affect on hazard occurrence.
• A formal model for assessing Software Safety through the development
process to reduce or eliminate hazard occurrences.
• The introduction of a common metric for evaluating and assessing the
qualitative and quantitative factors of a Software System and development
process.
41 Hughes, Gordon; Reasonable Designs, The Journal of Information, Law and Technology (JILT),
Safety Systems Research Center, Computer Science Department, University of Bristol; Bristol, United Kingdom; 1999.

20
• Improvements and awareness of the facets of Software Safety Economics,
based on accepted practices and principles.
• A formal study of the state of the art of Software Safety.
The first contribution of this dissertation to the state of the art of Software
Engineering is the identification and classification of software events, faults, and
complexities in the development process, potentially resulting in a system failure.
Hazardous events can then be related the potential failures for determining cause and
effect. This dissertation outlines methods for controlling or mitigating the effect of
system failures to prevent hazardous events.
The second contribution of this dissertation to the state of the art of Software
Engineering is the formalization of a model to incorporate Software Safety into the
development process. This formal model directly impacts and improves the state of the
art by refining current methods of development to better identify unsafe practices and
methodologies through the software lifecycle that could lead to failure.
The third contribution of this dissertation is the introduction of a common metric
for evaluating software and the development process to qualitatively and quantitatively
determine a safety index of a particular software system. This value can then be
evaluated against potential hazards and faults to determine the cost–benefit ratio of
efforts to remedy or prevent the hazard.
A fourth contribution of this dissertation is an introduction and improvement of
Software Safety economics, based on accepted practices and principles of statistics and
probability. Software economics are directly affected by the cost and ability of a
software system to prevent or mitigate hazardous events. This study will address the
factors related to changes in the economic benefits of the system.
The overall contribution of this dissertation to the state of the art of Software
Engineering is the formal study and research in the under–represented field of Software
Safety. The success of this software development methodology is the increased

21
awareness of safety in high–assurance software systems, the reduction of risk through the
software lifecycle, with corresponding increases in efficiency, decreases in overall
software system costs, and a decrease in occurrence of hazards in a software system.
H. ORGANIZATION OF DISSERTATION
This dissertation is organized in eight chapters. The introduction is included in
the present chapter.
Chapter II develops the theoretical foundation of the dissertation by defining the
practice of Software Safety, and safety and risk as it applies to software development and
engineering; by summarizing relevant works, literature, and studies on the field of
Software Engineering. Chapter II includes a review of the current state of the art of
Software Safety Assurance, applicable standards, and safety assessment. Chapter II also
includes a refinement and introduction of definitions of Software Safety based on
personal observations and the consolidation of existing designations.
Chapter III characterizes the common flaws and faults of software development,
referencing examples of failed systems derived from observation and investigation. This
chapter includes failures related to implementation and developmental failures,
development requirements, testing methods, and assumptions. A review is made of
development requirements and testing methods as they pertain to Software Safety.
Specific examples are given for each of the failure method types as well as efforts
possible to amend the failure probabilities.
Chapter IV outlines the conceptual framework for the evaluation of a software
system and development of a safety assessment metric. The conceptual framework
includes the introduction of the goal of a safety development and metric development.
Chapter IV will introduce a discussion of the aspects of software safety, incorporating
definitions and potential techniques. Finally, the chapter will discuss the efforts
necessary to graphically and textually depict Software Safety and Hazard Probability.
22
Chapter V depicts the application of the framework as a formal method for
evaluating a software system. Introduced is a presentation of an Instantiated Activity
Model (IAM) that supports a formal approach for system safety analysis and risk
assessment (SARA).42 This chapter details the development and implementation of a
criterion that can be used to assess the stability and validity of a software system, as it
applies to Software Safety. The formal method for assessing software safety is
introduced and demonstrated against a notional software system. Through the
development of the assessment method, this chapter discusses factors and controls
capable of mitigating hazard probabilities.
Chapter VI discusses the applicability of the formal method towards advancing
Software Safety. Special effort is given towards outlining efforts and factors of
development automation, metric introduction, software management, and requirement
completeness. A discussion of perspective clientele for the safety assessment is
introduced, as well as the applicability of the software assessment towards other safety
engineering disciplines.
Chapter VII discusses the justification for Software Safety Assurance,
concentrating on legal responsibilities, certification, and economics. A portion of this
chapter’s concentration is on the legal, moral, and ethical requirements of software safety.
Additional emphasis is placed on the cost–benefit of Software Safety and the
applicability of the formal model to software development decisions.
42 Luqi; Liang, Xainzhong; Brown, Michael L.; Williamson, Christopher L.; Formal Approach for
Software Safety Analysis and Risk Assessment via an Instantiated Activity Model, Software Engineering Automation Center, Naval Postgraduate School; Monterey, California.

23
Chapter VIII presents the conclusions and recommendations for integration of the
model and metric into general practice. Specific contributions are addresses and
reviewed, including the factors of safety failures, definitions, metrics, and process
improvements. Suggestions for future work and perspective changes to legal protections
are concluded within this chapter. Finally, Chapter VIII presents a dissertation
conclusion to briefly summarize and complete the intent of this study.
Appendix A lists applicable definitions as they refer to Software Engineering and
Software Safety. Appendix B summarizes recent public and private software
development efforts that have failed, their associated consequences, and historical
background where applicable. Appendix C lists abbreviations referred to in this
dissertation. Appendix D provides supplemental material beneficial to understanding
Software Safety. Appendix E provides an example of code sizes contrasting against
various logic statements.
For the purpose of brevity, this dissertation omits or summarizes some topics that
are obvious to individuals familiar with the practices of software development and
Software Engineering.
I. CHAPTER ENDNOTES
The following endnotes are included as part of the research document, and may or
may not be included in the final dissertation submission.
1. Software Failure Cost The dissertation uses the term “Lost” when describing the expense of funds to
correct failures, software defects, management oversights, and compensatory costs. The
terms “Lost” or “Loss” directly contradict the commonly used term of “Expense” or
“Spend” used in various management documentations. A “Loss” is defined as the act of
failing to gain, win, or obtain something for a said effort; while “Lost” is the past

24
participle of “Loss.”43 An “Expense” is defined as something being expended to secure a
benefit. Simply stated, an expense implies that something of value was received in turn
for the transfer of some monetary unit. In the case of the additional cost of a software
failure, it is inappropriate to assume that something was gained by expending more
resources, because the resource expense was unplanned. The consumer gains no
additional return for the additional fee, but rather he received what he was originally
expecting to receive for an additional cost. Economically this is corrupt.
In the case of software development, a software system is contracted to be
developed for a specific price. That price should include all foreseen expenses,
developmental issues, and forecasted lifecycle costs. The recipient of the product should
be safe to assume that the product will be delivered at the agreed upon rate, on time, free
of defects, and with a reasonable level of assurance of the safety of the product. It
perpetuates a great disservice to the software industry when a customer accepts an
incomplete or defective product and then agrees to make compensatory compensation to
the developer to correct the developer’s flaw. Additionally, it robs the process when a
customer agrees to pay for the research and development of an unproven software
technique or methodology, or pays to train a developer to do his job. Such a practice
would rarely be tolerated in other fields of industry.
Could a patient imagine first paying to train a doctor to perform for a heart
surgery, then pay for the surgery, and then finally to have to pay an additional fee when
the doctor fails to do the surgery properly or in a timely manner? The patient should be
given the reasonable expectation that the doctor has been properly trained before being
presented with the case, and that the doctor would perform the case properly the first time.
Failure to properly perform such a case would result in the malpractice prosecution and
disbarment of the doctor from the practice. In the field of Software Engineering, such
practices are commonplace.
43 The Merriam-Webster’s Collegiate Dictionary, Tenth Edition, Merriam Webster, Incorporated;
Springfield, Massachusetts; 1999.
25
In the automotive industry, a defective vehicle is recalled and repaired at the
expense of the developing company. In 2000, over 39,424,696 vehicles and automotive
accessories in the United States were recalled for defective components or systems in
over 250 recalls.44, 45 The owner of the vehicle bears no responsibility for the defective
product, nor is he required to pay for the required repairs. This process is only made
possible by an aggressive legislative effort, government regulation and oversight, and
through the ability of the consumer to find alternative automobiles if the primary choice
has demonstrated a history of failure.
Historically, software customers have not had the luxury of a large selection of
software products to meet specific high–assurance needs. Many safety based software
products are developed real time to meet a specific need of the consumer and are not
easily re–marketed to other consumers without modification. The level of modification
constitutes the difference between properly defined COTS and non–COTS products.
There are few developers for a consumer to select from that have the specific subject
matter expertise required for specific projects.
An increase in Software Safety can only be accomplished through a three–fold
process of training, supply, and accountability. Software developers need to properly
train and educate themselves with the proper techniques and methods for high–assurance
software development. The market needs to be expanded to support more competition.
This may require governmental regulation to disestablish monopolistic practices or
through grants and benefits for new companies that demonstrate success. Finally, the
software developer needs to be held accountable for software failures. Customers need to
no longer bear the cost of software failures and poor development techniques. If a
software project fails, the developer has to be held liable for the failure.
44 Compilation of various National Highway Transportation Safety Administration Press Releases,
National Highway Transportation Safety Administration, Department of Transportation; 2000 – 2001. 45 Note: The sum reflects the total of all NHTSA Recall Bulletins. Some vehicles and accessories may
be counted twice if referenced in separate and unrelated recalls during the annual period. The actual number of vehicles and accessories may be lower.

26
2. NATO Software Engineering Definition In 1967, the NATO Science Committee referred to the state of the art of Software
Engineering as the discipline of “...promoting the establishment of theoretical
foundations and practical disciplines for software, similar to those found in the
established branches of engineering.”46 Two years later, NATO refined its definition of
Software Engineering as “the establishment and use of sound engineering principles in
order to obtain economically software that is reliable and works efficiently on real
machines.”47
46 Software Engineering, Report on a conference by the NATO Science Committee, NATO Science
Committee; 1967. 47 Naur, Peter; Randall, Brian; Editors; Software Engineering, Report on a conference by the NATO
Science Committee, NATO Science Committee; January 1969.
27
II. THEORETICAL FOUNDATION
“Every software error blamed on the computer can be traced to two faults: The first being the fact that blame was placed on the computer; and secondly the fact that a human
developed the error.”
– computer wisdom
Computers, and in turn – software, have unfairly been left to blame for an
assortment of failures and catastrophes over the last half–decade. Man depicts computers
as thinking and self–acting entities capable of taking deliberate or irresponsible actions.
Users portray computers as a manifestation that can make conscious thought with flaws,
imperfections, and an ability to disregard commands and exercise free will. One may
strike the screen or keyboard in the same way he would a disobedient dog with a rolled
newspaper with the veiled notion that he taught the computer a lesson. He might feel that
the computer would behave better with the next command, without regard to the fact that
the system will continue to act the same way given the same inputs. Yes, “to err is
human, but to really foul things up requires a computer,” developed by a human who was
unaware or incapable of comprehending the system that he has designed or is now
operating.
Recent history has illustrated that software is potentially unsafe when it is
assigned to control critical systems. Safety, or a level of “unsafety,” is primarily based
on probability of a system to prevent or experience a hazardous event, and secondarily
based on the severity of such an event. There is no system that can be considered
failsafe, as there continues to exist the minute probability of failure in all things. The
objective of safe software development is to reduce the probability of failure to a level
acceptable to the developer, client, and society. The United Kingdom has gone so far as
to define “safe” as to when the probability of failure has been reduced to a level “as low
as reasonably practicable.”48 The term reasonably practicable can be judged uniquely for
48 Ship Safety Management System’s Handbook, United Kingdom Ministry of Defense, JSP 430, United
Kingdom.

28
diverse users in unique circumstances, each circumstance dependent on a distinct series
of specific indicators, triggers, and consequences.
From a review of common practices and literature from governmental,
commercial, private, and academic institutions on the subject matter of Software Safety
and Software Failure, it can be concluded that there are six inhibiting factors restricting
the state of the art of software development and failure, including:
• A failure to realize that there is a problem with the current state of
Software Safety.
• A failure to recognize potentially unsafe circumstances in software
systems.
• A failure to identify the flaws of the Software Development Process.
• An inability to quantify flaws, faults, and failures into a measurable value.
• An inability to qualify the solutions to potential flaws for evaluation and
efficient rectification.
• A failure to comprehend the solution to Software Failure.
There exists a greater maturity within the small circle of safety experts, however
their practices are not commonly used in mainstream development. Such a decision is
based on economic, political, and educational factors that limit the spread and acceptance
of such practices. While such subject matter practices provide a strong improvement to
the state of the art of Software Engineering, their common incorporation is absent outside
of a small circle of safety experts. My study will focus its emphasis on the ability to
quantify and qualify the values of software development, failure, and success. These
values can then be expressed in manageable and meaningful units for evaluation of the
software life–cycle development process with the intent of reducing failure and
increasing safety.

29
To generate a foundation for the development of a Software Safety Metric, it is
essential to first define and organize a basis of understanding regarding Software Safety
and Failure. To generate this foundation and basis, this chapter is organized into the
following units:
1. Philosophy and Interaction: To best break down the impression that
software/hardware are self–aware entities and incapable of failure, this
chapter outlines a discussion on the philosophy of software development
and the “human” interaction within the development process.
2. Vocabulary–specific software failure and safety: Software
development is a semantics–rich discipline with a multitude of proprietary
based vocabularies. These vocabularies do not easily translate or transfer
to other dialects within engineering fields. Many international and
national agencies and standards differ on their interpretation of specific
phrases of development and safety. This chapter defines and clarifies the
vocabulary specific to Software Failure and Safety as it applies to this
dissertation.
3. Safety State Definitions: Software Safety, Failure, and Risk
Management are commonly misunderstood and misapplied concepts in
software development. This chapter defines and clarifies these three terms
as they directly apply to Software Safety of High Assurance Systems.
4. Failure and Hazard Flow: Software Faults, System Failures, and
Mishaps flow through a software system in a distinct manner. This
chapter outlines the flow and transition of faults and failures through a
system, as well as the measures that capture and arrest faults before they
propagate.
5. Relative Works to the State of the Art: To base the foundation for
Software Safety Improvement, this chapter makes a review of relevant

30
works in the field of Software Safety and Failure, giving an appraisal of
previous efforts and standards.
6. Metrics and Methodologies: Once this foundation has been introduced
and established, this chapter outlines the required metrics and
methodology necessary to manage, denote, and define Software Safety.
A. DEFINING SOFTWARE SAFETY
For the purpose of this dissertation, it should be understood that the term Software
Safety and Software Failure differs from Software Development Risk; Safety focuses on
the failures of the system as they relate to the occurrence of a hazardous event while
Software Development Risk primarily focuses on the risks to development and the
potential for a system to fail to meet development goals. In the past, the term Software
Risk and the associated study of Software Risk Management have focused primarily on
predicting the success of a software project’s development or the risk of the software
project failing to be completed within planned resource limits.49 Dr. Nogueira focused
his research on the computation of software risk using a new approach at assessing
system complexity and volatility. Additional research has focused on the potential for
system failures during various states of operation, once the product has been employed.50, 51
Within the development environment, software success is judged against a
comparison of planned and actual schedules, costs, and characteristics. Software Safety
is focused on the reduction of unsafe incidents throughout the lifecycle of the system (it
can be assumed that some systems are capable of hazardous events during development
should they fail during testing with hazardous elements, fail to meet critical deadlines
consequently failing to prevent a hazardous event, or fail to be developed at the
49 Nogueira de Leon, Juan Carlos; A Formal Model for Risk Assessment in Software Projects, Naval
Postgraduate School; Monterey, California; September 2000. 50 Murrah, Michael R.; Luqi; Johnson, Craig S.; Enhancements and Extensions of Formal Models for
Risk Assessment in Software Projects, Naval Postgraduate School; Monterey, California; 2001.
31
catastrophic loss of expended resources). Unsafe incidents may be the result of a failure
of the software system to meet design requirements, an error or shortsightedness in
system requirements to prevent such an incident, or the reality that such hazards are
unpreventable – merely manageable. A system can be determined “safe” when the
probability of occurrence of a hazardous event has been reduced to some defined
acceptable level.52 That acceptable level is dependent on the identification of potential
hazards; the requirements of the system; the necessity or importance of the product; and
the type, circumstance, and consequences of the failure.
Safety is not a Boolean value of purely safe or unsafe, but a continuous
variable that ranges from completely unsafe towards safe
Individual impressions may have it that a software system is either safe or unsafe,
depending on its requirements, design, and controls. In reality, a system progresses
through various levels of safety depending on its requirements, design, controls, methods
of operation, potential hazards, and time/state of execution, as well as countless other
stimuli that could affect the operation and safety of the system, as depicted in Figure 2. It
is when these stimuli are analyzed and measured, can an accurate appraisal of system
safety be made.
51 Musa, John D.; Iannino, Anthony; Okumoto, Kazuhire; Software Reliability, Measurement, Prediction,
Application, McGraw-Hill Book Company; New York, New York; 1987. 52 International Standard ISO/CD 8402-1, Quality Concepts and Terminology Part One: Generic Terms
and Definitions, International Organization for Standardization; December 1990.
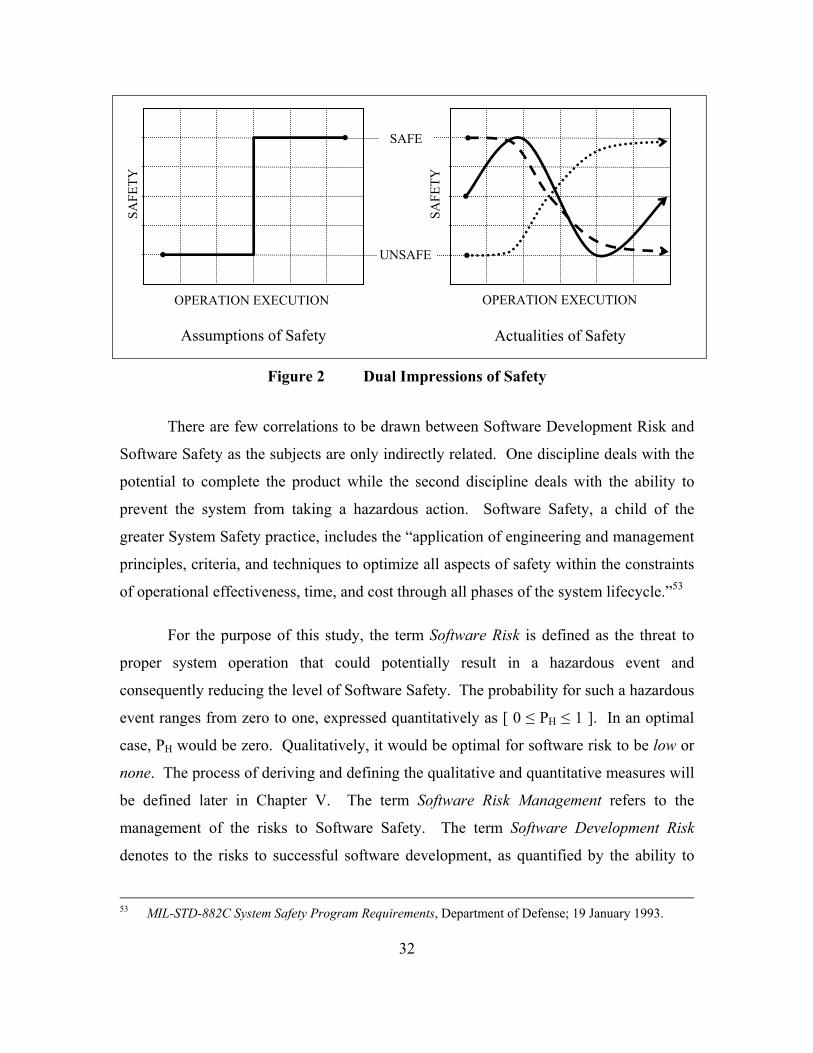
32
Figure 2 Dual Impressions of Safety
There are few correlations to be drawn between Software Development Risk and
Software Safety as the subjects are only indirectly related. One discipline deals with the
potential to complete the product while the second discipline deals with the ability to
prevent the system from taking a hazardous action. Software Safety, a child of the
greater System Safety practice, includes the “application of engineering and management
principles, criteria, and techniques to optimize all aspects of safety within the constraints
of operational effectiveness, time, and cost through all phases of the system lifecycle.”53
For the purpose of this study, the term Software Risk is defined as the threat to
proper system operation that could potentially result in a hazardous event and
consequently reducing the level of Software Safety. The probability for such a hazardous
event ranges from zero to one, expressed quantitatively as [ 0 ≤ PH ≤ 1 ]. In an optimal
case, PH would be zero. Qualitatively, it would be optimal for software risk to be low or
none. The process of deriving and defining the qualitative and quantitative measures will
be defined later in Chapter V. The term Software Risk Management refers to the
management of the risks to Software Safety. The term Software Development Risk
denotes to the risks to successful software development, as quantified by the ability to
53 MIL-STD-882C System Safety Program Requirements, Department of Defense; 19 January 1993.
SAFE
UNSAFE
Assumptions of Safety Actualities of Safety
SAFE
TY
SAFE
TY
OPERATION EXECUTION OPERATION EXECUTION
33
meet project requirements within acceptable limits regardless of the potential for or
incident of hazardous events during the operation of the software.
The use of automated systems have become essential to the control and safety of
critical applications such as nuclear power plants, medical devices, aircraft, chemical
plants, and national defense systems. The level of sophistication required to maintain
these systems is far beyond the capability of an unaided human. The processing speed
and logic control of today’s system enables a level of performance far beyond that of
manual systems. Logic control can guarantee some level of safety, depending on implied
reliability, system requirements, and design constraints. When applied, Software Safety
assures a systematic and logical approach to identifying, classifying, categorizing,
controlling safety, and the occurrence of hazardous events.
B. THE PHILOSOPHY OF SOFTWARE DEVELOPMENT
In 1851, in his historical writing of “Cellular Pathology,”54 Rudolf Virchow
noted that biological cells are neither good nor bad, yet that they merely carry out the role
for which they were anatomically designed.55 Software is characteristically like an
anatomical cell as it merely carries out the function for which it was programmed, even if
that function is flawed by design.
1. Software as Intelligence
Software is Stupid.
Before one can develop a safe software system, they must understand and admit,
“Software is Stupid.” They must also admit that software is obedient, to the point of
blind obedience to any task, order, or command that may be put upon it. A Software
System’s intellect originates from the developer himself. It is from the developer’s ideas
and logic that the system acquires its basis of operation. Software logic can be derived

34
from the adaptation of previous systems, failures, and successes. While this adaptation is
not always guaranteed, it can be assured that the system is based primarily on the present
representation of its developer.
The psychological personality of the developer, in harmony with the individual’s
discipline and professional knowledge, determines the true nature of the software system,
its logic, its flow, and its character. Every software system has a distinct personality, as
unique and as different as the fingerprints on a human being. This uniqueness has bred a
myriad of logic patterns and commands capable of accomplishing essentially identical
tasks, each set varying in complexity, size, and potential for failure. As noted in Table 2
below, it is possible to execute any one of three independent functions, each capable of
selecting an item from a given list. The size of the function (lines of code) is based on
the programming code language, the function chosen, and the number of selections in the
data list. The choice of which function to use depends greatly on the developer’s ability
to program, his interpretation of the development requirements, and personal preference
to one style over the next.
Function Complexity Lines of Code IF THEN ELSE
END Simple ((S * 2) + 2) Lines of Code
CASE SELECT Moderate (S + 3) Lines of Code ASSIGNED
ARRAY Complex 5 Lines of Code
Where as: S – as Number of Selections
Table 2 Code Complexity and Size Comparison.
Despite the notion that computers are intelligent, that impression delicately hinges
on the software system that controls it. The software system, and its corresponding level
of safety, is likewise delicate, reliant on the developers and methodologies that gave it
life.
54 Burke, James; The Pinball Effect, Little, Brown and Co; 1996. 55 Note: Rudolf Virchow is credited for originating the quote “Prevention is better than cure.”

35
The safety of software does not hinge solely on the software concept itself, but
on the individuals who wrote it and their own conception of design, logic, and
assurance.
Safety is reliant on the method and completeness of the development, the
comprehension and interpretation of the requirements, and the training and discipline of
the developers. Until such time as software reaches self–awareness and can think for
itself; until it becomes able to simply write code; not because it is commanded to, but
because it is aware of the rationale for doing so and can evaluate how well a design meets
that rationale, can we never forget that “Software is Stupid”.
It has been mentioned that if you gave a thousand monkeys each a piano,
eventually one will play Mozart; or each a typewriter, one will eventually write the
great American novel.
The problem is not that you will have to wait an eternity to hear sweet music or to
be moved by fine literature, it is that you will first have to listen in perpetuity to the
wretched sounds of a thousand monkeys banging on ivory, and sift through a mountain of
paper to find one discernible word. There are those who still utilize the Mongolian Horde
Technique56 to Software Development and have an army of “Monkeys” pounding code to
keyboard. Software cannot be developed in an assembly line fashion with individuals
simply banging code into place and expect it to be safe. Safety requires the development
of software with precision methods by trained individuals whose ultimate goal is to
design a product with an acceptable degree of defects or flaws. In high–assurance
systems, such failure is not tolerable and one cannot afford the quality of monkeys to
develop such a solution. Software Safety requires the discipline of development using
formal models and methods, the concentrated evaluation and scrutinization of the product
through its entire lifecycle, and the absolute adherence to accepted standards and doctrine.
56 Analogous to the Mongolian Horde technique of warfare in which the armies of Genghis Khan would
amass an overwhelming force of untrained warriors against a smaller enemy and conquer them through disproportional numbers.

36
Software is not capable of thinking for itself. It requires the thought of the
developer to direct its actions. Once directed, it will function as commanded, operating
within the designed parameters that were established at its inception and crashing where
the developer failed to prevent a fault. If it fails, it is because the developer did not
validate the functionality of the system. If it is unsafe, it is because the developer did not
assure the needed protections within the system.
2. The Motivation to Build Man has had a dream and obsession to create and mold something out of nothing.
It is something “God–Like” in nature with biblical reference to the Genesis of this world.
“In six days, the Lord created the Earth from the void of space and rested on the
seventh.”57 Christianity teaches its disciples that His creation was perfect and without
fault. Many individuals attempt to emulate this form of creation by developing a piece of
software without fault or intentional blemish from only a concept and idea. Companies
have self–proclaimed their divine ability to create with registered trademarks and names
such as Godlike58, Perfect59, Divine60, Immortal61, and Genesis62.
It is the software developer’s ego that demands that he create the greatest system,
in the same motivation that man strives to build the tallest building63, race the fastest car64,
57 Holy Bible, King James Version., Genesis Chapters 1, 2:1-3. 58 Godlike Technologies, Provider of system administration and MUD server development; Sunnyvale,
California; est. 1991.. 59 Perfect Commerce, Inc., Provider of strategic e-sourcing and decision support; Palo Alto, California;
est. 1999. 60 Divine, Inc., Provider of web-based software solutions and management applications; Chicago,
Illinois, est. 1999. 61 Immortal, Inc., Provider of dedicated server and backup resources to small and medium size
companies, Las Vegas, Nevada; est. 1997. 62 Genesis Computer Corporation, Provider of network and host based security and management
solutions; est. 1999. 63 The tallest structure is the CN Tower, Toronto, Canada, at a height of 1,815 ft 5 in. The second
largest buildings are the twin towers of Associates Petronas Towers I and II, Kuala Lumpur, Malaysia at 1,483 ft. Source, Guinness World Records Limited; London, England; 2001.
64 The fastest land vehicle is the Thrust SSC at 763.005 MPH, set by Andy Green on 15 October 1997 in the Black Rock Desert, Nevada, USA. Source, Guinness World Records Limited; London, England; 2001.

37
or dive to the deepest depth of the ocean65. The result of his success would put him on
the same level as a deity, while his failure might be blamed on the inadequacy of the
operating system rather then on his own inability. In this rush to create a system, many
developers overlook basic common sense approaches and methods for more untested and
unproven options. The engineer’s motivations become so wrapped up in ego gratification
and social power accumulation66 that he fails to heed the lessons of previous failures or
warnings of his co–workers.67 They ignore the basic philosophy of KISS (Keep It
Simple, Stupid) and attempt to create not only a new system, but also a revolutionary new
logic to empower that system. Many failures can be related to development with untested
and unproven “revolutionary new” tools that fail when delivered to the customer. In
reality, the ego of the developer would be better defined by the value his work provides
to customers; rather then how impressed he is with his own notion of cleverness.
Software serves as a mirror to the mind of the developers.
Software reflects the psychological perspective and philosophy of the engineers
who gave it life. It absorbs the personality, the flavor, and even the faults of the hands
that mold it. “The potter is the master over the clay pot. Yet the pot will never exceed
the capability of the potter.”68 This analogy applies equally of the potter as to the
Software Engineer. Essentially, the engineer cannot get more capability out of his system
then his own mentality permits, and in parallel, he cannot make the computer accomplish
what he first did not in himself conceive. His abilities and that of his system are limited
only by his own intellect. It is when he attempts to reach beyond the limits of that
intellect that he introduces faults. While he may have the greatest of logic, if his intellect
does not permit the thorough inspection of his efforts, he is bound to overlook even the
most blatant of faults and jeopardize his entire creation to catastrophe.
65 The deepest diving vehicle is the manned bathyscaphe Trieste, at a depth of 35,8000 ft, in the
Challenger Deep off the island of Guam, on 23 January 1960. Source, Naval History Center, Department of the Navy; 1999.
66 Weinberg, G.; The Psychology of Computer Programming, Von Nostrand Reinhold Co.; New York, New York; 1971.

38
Man will build, and in his folly, will attempt to reach for the stars without
comprehending that the star is nothing more then just a flaming ball of gas. Without
proper oversight and supervision, careless Software Engineers will corrupt even the most
reliable of programs by attempting to build their own Tower of Babel. Software
Engineers need to be motivated to design and build new systems, be given the freedom of
expression, the faculty to explore, and the benefit of credit and recognition. Along with
that freedom comes the understanding that his product progression must be controlled,
checked, supervised, and regulated to ensure that it complies with the actual requirements
and meets the standards of a high–assurance system. Presented, is a method for
permitting that freedom of expression while ensuring compliance with standards and
requirements.
67 Sawyer, S; Guian, P. J.; Software Development: Processes and Performance, IBM System Journal,
vol. 37, num. 4, IBM; 01 May 1998. 68 Wood, Larry; Personal writings on the Philosophy of Software; 30 August 1996.

39
C. THE ANATOMY OF FAILURE
Figure 3 Software Failure Flow
Software Failure, as with Software Development, has its own terms and
vocabulary to define the discipline. Software Failure can be depicted as a chain of events
and actions whose outcome could eventually lead to the destruction or functional loss of a
system. To understand how to break the chain of failure, it is first important to
understand the links that make up the chain, from the basic flaw to the culmination of the
actual failure. Figure 3 represents a personal depiction of a Software Failure Flow, based
on the dissertation’s definition of failure elements. The resultant depiction serves as a
contribution of the dissertation.
The definitions introduced in this study are a re–tailoring of existing popular
definitions with an emphasis on safety, as well as an introduction of new terms and
definitions designed to satisfy the existing absence in Software Safety Engineering.
These terms are intended to fulfill the unique language requirements placed on the
development of high–assurance system. The introduced terms are not all encompassing;
yet establish a foundation for the induction of further terms as necessary to meet the
semantic needs of software development.
Trigger
Handling Fault
Reactionary Fault
Trigger
Resource
Syst
em
Con
trol
System Malfunction
System Failure
Action Based Failure
Resource Based Failure
Undesired Action - Hazard
Flaws
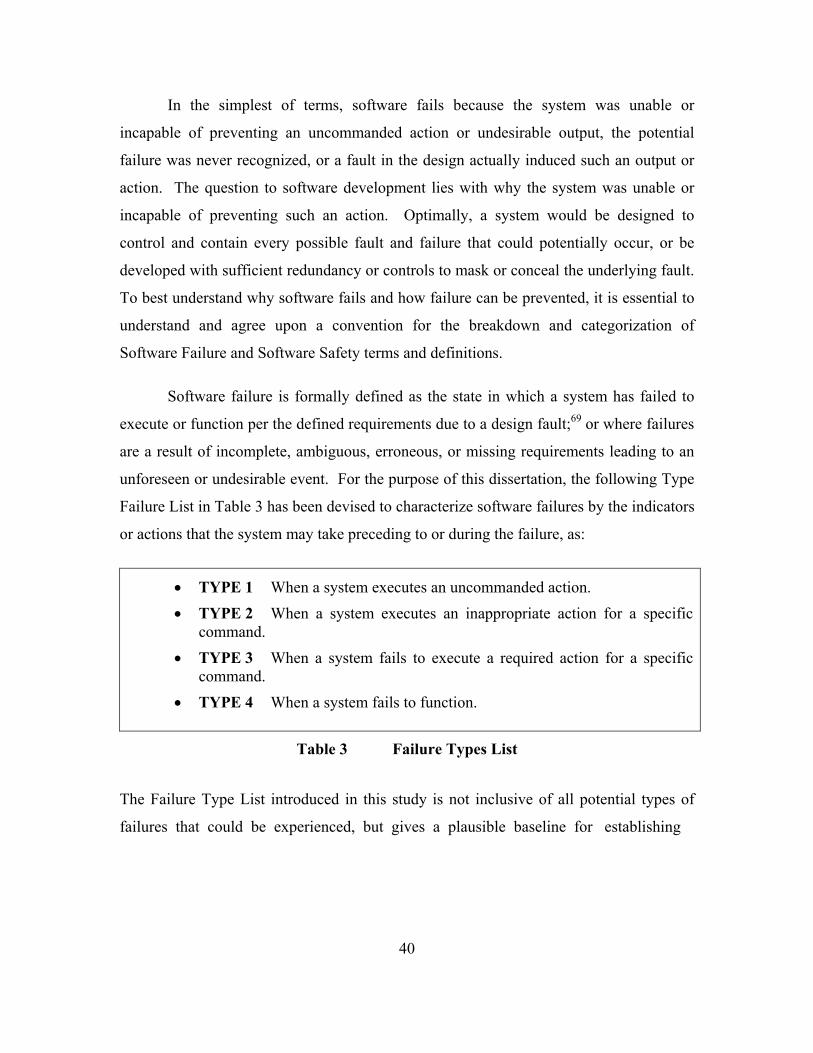
40
In the simplest of terms, software fails because the system was unable or
incapable of preventing an uncommanded action or undesirable output, the potential
failure was never recognized, or a fault in the design actually induced such an output or
action. The question to software development lies with why the system was unable or
incapable of preventing such an action. Optimally, a system would be designed to
control and contain every possible fault and failure that could potentially occur, or be
developed with sufficient redundancy or controls to mask or conceal the underlying fault.
To best understand why software fails and how failure can be prevented, it is essential to
understand and agree upon a convention for the breakdown and categorization of
Software Failure and Software Safety terms and definitions.
Software failure is formally defined as the state in which a system has failed to
execute or function per the defined requirements due to a design fault;69 or where failures
are a result of incomplete, ambiguous, erroneous, or missing requirements leading to an
unforeseen or undesirable event. For the purpose of this dissertation, the following Type
Failure List in Table 3 has been devised to characterize software failures by the indicators
or actions that the system may take preceding to or during the failure, as:
• TYPE 1 When a system executes an uncommanded action. • TYPE 2 When a system executes an inappropriate action for a specific
command. • TYPE 3 When a system fails to execute a required action for a specific
command. • TYPE 4 When a system fails to function.
Table 3 Failure Types List
The Failure Type List introduced in this study is not inclusive of all potential types of
failures that could be experienced, but gives a plausible baseline for establishing

41
failure types. Additional failure types could be appended to the current list (i.e., TYPE 5,
6, 7…) or included as a subordinate failure to an existing failure (i.e. TYPE 1A, 2A,
2B…)
The Failure Type Numeric is used for simplification and reference later in the
dissertation. A TYPE 1 Failure is characterized by the system executing an
uncommanded action while the system is in and out of operation. A TYPE 1 Failure is
the only type of failure that can occur when the system is not in operation, as it would be
expected that the system would not receive any commands when not in operation. The
absence of a command uniquely sets this type apart from other failures. This type of
failure is not related to any command or provocation, and occurs outside of the system
requirements. This failure may be triggered by the state of the system or by an input not
related to a command.
A TYPE 2 Failure is characterized by the system executing an inappropriate
action for a specific command during system operation. When a user or procedure
generates a command to the system, it should be expected that the system would respond
with a predetermined series of actions or responses. In the case of a TYPE 2 Failure, the
system executed a false response to a system command. It should be noted that the
system attempted to execute a response to the command, though be it incorrect. If the
system cannot execute any action for a command, the system may be experiencing a
TYPE 3 Failure.
In a TYPE 3 Failure, the system could not or did not execute an action for a given
command. A TYPE 3 Failure differs from a TYPE 2 Failure by the fact that no action
was taken for the command, instead of the system executing an inappropriate action. A
TYPE 4 Failure occurs when the system fails to respond or execute any action for all
commands, essentially with the system “locking–up”. A TYPE 4 Failure is a special case
69 Computer Science Dictionary, Software Engineering Terms, CRC Press; ver. 4.2; 13 July 1999.

42
of the TYPE 3 Failure, where in a TYPE 3 Failure concerns the inability to execute a
single command a TYPE 4 Failure concerns the inability to execute a preponderance of
the system’s commands.
Software failure does not always result in the complete shutdown of a system.
Rather, failure can range from the single undetected anomaly to a cascading failure and
eventual catastrophic collapse of a system’s functionality. This level of failure can
eventually, but not necessarily, lead to a system malfunction. Even an undetected
anomaly is still a form of a software malfunction as the system continues to operate with
a lingering failure in the background. Optimally these anomalies would work themselves
out and the system continues to function. The fact still exists that the system executed a
function, regardless of how perceptible, that was undesired and uncommanded.
To understand System Malfunctions, each must first be broken down into two
basic phases or subcategories – system faults and system failures. As depicted in Figure
3, a fault is categorized as an object within a system which, when acted upon or triggered,
can reduce a system’s ability to perform a required function, assuming the complete
availability of all necessary resources. A failure is the actual inability of a system to
perform a required function, or the departure of a system from its intended behavior as
specified in the requirements. A system can contain a fault that may eventually, but not
necessarily, lead to a failure. The failure will result in a malfunction of the system, which
in turn will create a corresponding hazard. Additional components of Figure 3 will be
addressed through this chapter of the dissertation.
1. Software Flaws Within the semantic chain that defines Software Failure, the bottom of that chain
is anchored by the term “flaw.” A flaw is simply defined as “a feature that mars the
perfection”70 or rather “an imperfection or weakness and especially one that detracts from
70 The Random House Dictionary of the English Language – The Unabridged Edition, Random House,
Inc.; New York, New York; 1980, 1998.
43
the whole or hinders effectiveness.”71 While attempting to define the terms of Software
Failure, this research has revealed an obvious lack of formal definitions for the discipline,
making it necessary to coalesce or combine existing definitions and usage phrases to
apply to Software Failure. For the purpose of this discipline, a “flaw” should be
understood as “a specific item that detracts from the operation or effectiveness of the
software system without necessarily resulting in a failure or loss of operability.” A flaw
may not affect the ability of the system to execute its required functions, but can cause a
noticeable deterioration in the system’s performance or aesthetic quality of the product.
Should a flaw ever reach the ability to cause a failure, it ceases to be referred to as a flaw
and becomes a fault.
Some documenting resources, editorials, and publications incorrectly relate a flaw
to the failure of a system. For example, a report from NASA was quoted as:
An in–depth review of NASA's Mars exploration program, released today, found significant flaws in formulation and execution led to the failures of recent missions, and provides recommendations for future exploration of Mars.72
It should be understood that a flaw does not lead to the failure of the system,
while a fault serves as the true basis for a failure.
A flaw should be understood as minor in nature and does not affect the overall
ability of the system to accomplish its requirements. Most flaws might cause discomfort,
inconvenience, or a reduction in efficiency, but not a reduction in efficiency below the
specified requirements of operation. In the case of a disk drive, an event might reduce
the speed of the data transfer rate, but as long as the data rate does not fall below the
specified required transfer rate, the error would be classified as a flaw. If the transfer rate
did fall below the required level, if even for a moment, then the event would be
categorized as a fault, which led to a failure of the system’s ability to meet requirements.
71 The Merriam-Webster Collegiate Dictionary, Merriam-Webster, Inc.; Springfield, Massachusetts;
2001.
44
In most cases, flaws are subtle, almost indiscernible elements in the operation of
the system, and their execution is accepted by users as a quirk or idiosyncrasy of normal
operation. This does not imply tolerance of a flaw or infer that some level of flaws
should be accepted in the normal development of a system. A flaw is still an
imperfection that should be investigated, combated, and controlled like any other system
irregularity. By definition, a flaw does not lead to a failure of the system. While a flaw
does not directly contribute to the failure of a system, its existence may serve as an
indicator of existing imperfections and faults within the system, those imperfections
eventually surfacing as a failure. Should an event once defined as a flaw lead to a failure
then the event would be redefined as a fault. If a lack of care caused the creation of flaws,
then the same lack of care might have produced the same proportion of faults. The same
discipline that should be used to counter a fatal error should be used to prevent even the
smallest of flaws, resource dependent. It is recognized that it is not economically feasible
to remove all flaws within a system, but that their presence may ultimately reduce the
perceived value of the product (Economics).
2. Software Faults Where Software Failure denotes an action performed by a system, Software
Faults denote the object that induces the action. Faults are the objects within the system
that contains an error in logic, that when triggered could induce a failure. Errors in logic
can be the result of errors in system requirements that fail to consider the proper
operation of the system, implementation errors in which the system is operated in a
manner for which it was unintended or controlled, or development faults in which the
system’s logic is erroneously programmed. The term “Fault” has been synonymously
used with the term “Bug” to define an error within a system.73 As stated previously, a
fault can reside in the system indefinitely without ever inducing a failure until initiated by
a trigger, in the same way that a firework can remain safe and stable until someone
72 Wilhide, Peggy; Mars Program Assessment Report Outlines Route To Success - Release: 00-46,
Headquarters, Washington, DC, 28 March 2000. 73 Nesi, P.; Computer Science Dictionary, Software Engineering Terms, CRC Press; 13 July 1999,
http://hpcn.dsi.unifi.it/~dictionary.
45
applies a spark to the fuse. Faults are exclusively related as Action Based Failures, as
they are logic based and internal to the system. System faults can be further broken down
into two subcategories:
• First, to faults related to the internal deficiencies of a system with
acceptable inputs, which shall be referred to as Reactionary Faults,
• Secondly, to a system’s inability to function with incorrect or erroneous
inputs, referred to as Handling Faults.
a. Reactionary Type Faults In an optimal system, an input would be received, processed, and executed
in compliance with the requirements of that particular module. For reactionary type
faults, it is assumed that that input was correctly formatted and within the acceptable
range for the given requirement. The system is expected to take action or react to the
input through a predefined set of responses, based on the value of the input. If the input
is within the proper tolerances and the system is unable to execute its requirements, then
it would be considered a Reactionary Type Fault. The term “Reactionary” comes from
the system’s design to react to commands and inputs. The fault is not in the input, but in
the design of the system and its inability to take appropriate action for the input. In the
case of such a fault, the trigger would be the actual input. The combination of the trigger
and fault then result in a failure within the particular module. These triggers and faults
could have their basis in requirement, implementation, and/or programming logic.
An example of a Reactionary Type Fault could be found within an
automobile cruise control system. Let the automobile be cruising at below the set cruise
speed. The system will attempt to accelerate the automobile towards the desired speed,
comparing its current velocity against the desired speed. As the speed of the automobile
reaches the desired speed, the cruise system should disengage the acceleration sequence.
If the system continues to accelerate past the desired speed with no change in its status,
has received the accurate speed signal of the vehicle, and is unable to process the fact that
the automobile has exceeded the required speed then the system would have experienced

46
a Reactionary Fault. In this particular case, the Reactionary Fault is characterized by the
inaction of the system to the acceptable input – a TYPE 3 failure74. If the automobile
would have reached the desired speed and then commenced to immediately decelerate,
then the Reactionary Fault would be characterized by the incorrect action of the system to
the acceptable input – a TYPE 2 failure.
b. Handling Type Faults Despite the best of system designs, it can never be assumed that a system
would be without erroneous entries or parameters out of the normal bounds of the system.
To effectively manage such a system, developers must design checks, filters, and controls
within the system to handle such entries. Optimally, these filters would catch erroneous
entries and execute a series of pre–specified procedures or functions based on the entry
value. When the system is unable to detect the erroneous entry, is incapable of executing
the applicable handling procedure, or the handling procedure itself experienced a fault
related to its execution, then the system would have experienced a Handling Type Fault.
If the system recognizes the erroneous entry and attempts to handle the error, and then
fails within this secondary execution, then such a fault would still be regarded as a
Handling Type Fault because it is isolated by the systems inability to “Handle” the error.
As with the Reactionary Type Fault, the fault is not in the input but in the design of the
system and its inability to take corrective action for the erroneous input. In the case of
such a fault, the trigger would be the erroneous input. The combination of the trigger and
fault then result a failure within the particular module.
An example of a Handling Type Fault could be found within an account
data entry system where the user would be required to make keyboard entries. Let the
account data entry system require the Account Balance Value of the current account, in
numeric format. Assume the user has the ability to make alpha–numeric–symbolic
entries from a keyboard. If the user attempts to make an alpha–symbolic entry for the
numeric requirement, the system should handle the action with an appropriate response,
74 See Table 3 Failure Types List
47
either by disregarding the entry, displaying an error prompt, or other appropriate action.
If the system does not handle the erroneous input and subsequently attempts to execute a
mathematical function, then the system would experience an incompatibility error and
halt, as the string value would be incompatible with the numeric requirement, hence a
Handling Type Fault. In this particular case, then the Handling Type Fault is
characterized by the system failing to handle the erroneous input by permitting the
mathematical function – a TYPE 3 failure. Depending on the design of the system, the
fact that each keystroke was accepted would be classified as a TYPE 2 failure. The fact
that the erroneous character was not filtered would constitute a TYPE 3 failure, where in
both cases it was inappropriate for the alpha–symbolic character to be permitted into the
system.
3. Software Failure Failure, in terms of Software and System Failures are defined as “the inability of a
system or component to perform its required functions within specified performance
requirements.”75 To further delineate failure types, this study introduces two additional
failure categories, based on the source of the initiator or fault:
• Resource Based Failures (RBF): Failures associated with the
uncommanded lack of external resources and assets. Resource Based
Failures are generally externally based to the logic of the system and may
or may not be software based.
• Action Based Failures (ABF): Failures associated with an internal fault
and associated triggering actions. Action Based Failures contain logic or
software–based faults that can remain dormant until initiated by a single or
series of triggering actions or events.
75 Software Engineering, IEEE Standard Glossary of Software Engineering Terminology, IEEE Standard
610.12, Institute of Electrical and Electronics Engineers, Inc.; 1990, 1991.
48
a. Resource Based Failures Resource Based Failures are usually associated with the hardware and
external resources required to support the system’s logic operation. System hardware
includes components directly connected to the unit to include the unit processor or CPU,
mass storage devices, monitor, or Graphical User Interface (GUI). External resources
include the electrical power supply, input and output resources and peripherals such as
printers and transmission mediums, memory partitions to support operation, and
manipulated control hardware directly controlled by the system such as robotic arms, and
mechanical drive systems. RBFs are usually triggered by the absence or failure of an
associated resource and are very difficult if not impossible to mask, as the resource
usually serves as the functional input or output to the system. In cases of memory failure
or overrun, secondary support logic may fail to properly partition and manage system
memory beyond the logic requirements of the primary system. In specific cases, error
handlers and controls can trap the absence of a resource and take pre–specified actions
such as reverting to a backup system, prompting the user for an alternative or redundant
resource, or by displaying a BIT (Built In Test) indication of the fault. In a worst case,
the absence of the resource would result in the complete failure of the system, such as the
loss of electrical power or destruction of the CPU with no redundant backup.
In High–Assurance Systems, RBFs are usually prevented by the inclusion
of redundant systems such as an Uninterrupted Power Supply (UPS) system for backup
power, or parallel lines of communication capable of providing continuous data transfer.
Factors such as cost, feasibility, or physical limitations can prevent the inclusion of
acceptable redundant or failsafe control systems. In the most catastrophic of failures,
redundant mechanisms may be destroyed or disabled along with the primary system. In
the case of space vehicles, the loss of a heat shield would reduce a vehicle’s ability to
withstand the temperature extremes of space flight or protect its sensitive components
during planetary reentry. As the vehicle passes through the atmosphere, vulnerable
telemetry sensing instruments could be damaged which would reduce the craft’s ability to
control its decent. Without a controlled descent, the vehicle and all redundant systems
would be destroyed during reentry or upon impact with the planetary surface.

49
Despite the best system development practices, the loss of a critical system
resource is extremely difficult to prevent. In the study of Software Failure, system
resources must be evaluated and measured for their vulnerabilities, potential hazardous
effects of the system, and the system’s ability to protect against the hazardous event. A
factor of Software Safety can then be based on the results of the measures and
evaluations.
b. Action Based Failures While Resource Based Failures are associated with the hardware and
external resources, Action Based Failures are exclusively associated with the software
side of the system. An ABF requires the combination of a fault and its associated trigger
to initiate the undesirable action. Faults can include a flaw in logic and code design, a
misinterpretation of system requirements, or a defect in the language compiler or code
generator. A fault can lie dormant for the entire life of the system and never surface
unless the specific trigger initiates the event. Triggers can include user inputs to the
system, incompatible outputs and communications from system modules, miscalculation
from one function or procedure to the next, or a propagated flaw compounded from one
action to the next. Error handlers and filters can be designed to trap or prevent most
erroneous inputs or records. In the case of ABF, a filter, control, or error handler is an
internal function designed to prevent a specific hazard or undesirable action. The
procedure is designed to prevent a known action, initiated by the trigger, handling the
error, and thereby preventing the failure.
In High–Assurance Systems, these controls, error handlers, or filters are
designed to capture a specific trigger or even a range of triggers, depending on their
design. Once captured, the error handler must take appropriate action by either
prompting the system for another input with the intention that the second input will pass
where the first had failed, or by halting the operation of the system in such a fashion as to
not induce a secondary failure. The primary purpose of a control, error handler, or filter
is to prevent the trigger from ever reaching the fault.
50
A common error handler might be one to prevent against a system
dividing by zero; without it the system would fall into an infinite mathematical loop, as
the division of anything by zero would resolve towards infinity. An error handler might
add a predetermined minute value to the zero to permit the division or it might simply
exit the procedure altogether, depending on the desired results and implications of each
action. A simplistic error handler is easy to write and can filter or capture many ABFs,
while it is extremely difficult to write an error handler that can prevent the creation of the
faulty input from its source. Such prevention can only be accomplished through an
output filter that conforms to a predetermined set of output requirements, including
content and format.
It is possible for a failure, based on its trigger and fault, to be categorized
as both an Action and Resource Based Failure. In the case of a Memory Overflow,
depending on the triggers and reactions of the system, such a failure can be classified as
either an Action Based or Resource Based Failure. Should the failure occur due to a lack
of physical memory, the failure could be assumed as a Resource Based failure of the
operating hardware platform. Should the failure occur due to a fault of logic control of
the physical memory, the failure could be assumed as an Action Based Failure. Memory
Overflows may exhibit characteristics of both Resource and Action Based Failures as
adding additional physical memory and revising the memory logic controls could
mitigate the fault.
4. Software Malfunctions The term Malfunction is derived from the French term mal, meaning “bad” or
“wrongful”; and the self–defined Latin word of function to create an item that “functions
imperfectly or badly, or fails to operate normally.” 76 Upon the software system
experiencing a failure, the system’s ability to operate and meet design requirements may
be degraded. The level to which the system is degraded will determine the type and
extent of the malfunction as well as the system’s ability to counter the malfunction to
76 The Merriam-Webster Collegiate Dictionary, Merriam-Webster, Inc.; Springfield, Massachusetts;
2001.

51
prevent a hazard. As the definition states, a malfunction is the condition wherein the
system functions imperfectly or fails to function at all. A malfunction is not defined by
the failure itself, but rather by the fact that the system now fails to operate. The term
malfunction is a very general term, referring to the operability of the entire system and
not to a specific component.
Optimally, a system would be developed that could sustain the failure of a
specific component, while not experiencing a system malfunction. This sustainability
could be accomplished by the use of redundant systems, overrides, or checks and
balances that could counter the effects of the failure. If the failure could be masked or
compensated for in some way that it does not affect the performance of the system, then
the system would not be considered to have suffered a malfunction. The severity of a
malfunction is primarily judged by the observation and perspective of the user and his
perceived inability to utilize the system. Many systems may experience a failure in
operation, but the failure is so minute in scale to be indiscernible to the user.
A Software Malfunction should be characterized in terms of what has failed to
function properly rather then in terms of the actual failure. One would not say that the
Mars Climate Orbiter experienced a Mathematical Malfunction because of the metric
conversion error, but rather that there was a fault in the mathematics logic of the
trajectory module. The format of database entries, triggered by the planetary entry
evolution, resulted in a failure to accurately report the vehicle’s position (See Chapter
I.A). The vehicle experienced a failure to compute its position properly, resulting in a
malfunction in the trajectory module. The trajectory module could not relate the
erroneous position data; the database entry formats were incompatible; and the system
logic was misinterpreted from development requirements. The combination of the three
failures resulted in the system malfunction.

52
5. Software Hazards and Mishaps Time and technology have ensured and encouraged software–based systems to
increase in complexity and reduce their reliance on human intervention for logic and
decision–making. This greater complexity and absence of human intervention has
increased the likelihood of hazardous actions. The increased proliferation of such
systems additionally increases the general number of hazardous incidents.
A Software Hazard is the potential occurrence of an undesirable action or event
that the software based system may execute due to a malfunction or instance of failure.
The next step in this logical progression is the Mishap – defined as the occurrence of
an unplanned event or series of events and action that results in death, injury, or
damage to or loss of functionality of equipment, property, or otherwise reducing the
worth of the system77.
A software system is required to execute a set of predetermined logic functions
and procedures based on the system’s inputs and interactions. When the system fails to
properly execute its functions, it has malfunctioned. Due to the external reliance upon
that malfunctioned system, there is a consequence for the failure. Hazards are judged or
measured by the cost of the action or event in terms of a tangible or intangible value, but
noting that most intangible values later relate to a tangible value. Tangible values include
the loss of real economic worth to the developer, monetary compensation to the consumer
or damaged person for the failure, the loss of human life, or the loss of physical property.
Intangible values such as trust, confidence, and reliability later affect the economic worth
to the developer or the customer who may rely on the system.
Hazards can be grouped into three categories, based on states of the system at the
times for which they occur, namely:
77 Attributed to NASA – STD – 8719.13A, Software Safety, NASA Technical Standard, National
Aeronautics and Space Administration; 15 September 1997.

53
• Hazards that occur when the system fails to function correctly.
• Hazards that occur when the system fails to function.
• Hazards that occur when the system functions correctly
Traditionally, we appreciate the fact that a hazard may occur when a safety–
critical system fails to function correctly, given that the system’s function was to control
or prevent the occurrence of a hazardous event. Additionally, it is recognized that a
hazard may occur when the system fails to function in its entirety since the lack of
functionality equates to a lack of hazard control. In safety–critical systems, the existence
of a potential hazardous event grants some probability that the event may occur despite
the operation of the system. In some cases, despite attempts by the system to prevent
such an event, it is possible that a hazardous event could occur during the normal course
of operation.
Software Safety is characterized by reducing the number or scope of hazardous
events or mishaps to a level that is economically, socially, and strategically acceptable. It
is economically infeasible to ensure that a high–assurance system will have no defects
and will equally have no failures. Some acceptable margin must exist and be agreed
upon as a goal towards system development. “Bean Counters” constantly measure the
economic implications of a failure, the probability of that failure, and the cost to reduce
or remove the likelihood of that failure. It is not economically justified to spend ten
million dollars to repair a fault that could damage the manufacture of a one–dollar profit
component on an assembly line, unless the sum of all of the damages and repercussions
might exceeded the total cost of the repair. If the likelihood was sufficiently low that a
failure would damage an equitable number of components, then production may continue
as scheduled.
Socially acceptable levels of Software Hazards are emotionally driven and
charged with debate and question. The failure of a fire control system may result in the
loss of human life or limb, or a flawed voting system might destroy the confidence of a

54
nation in the electoral process. The tolerable level of that hazard depends on the specific
circumstances of the time and situation. In wartime, the loss of human life may be
acceptable to a certain degree, as long as it can be countered by some greater degree of
success. Despite the burdens of war, our society continues to demonstrate a great
intolerance for the loss of human life and have condemned systems that have resulted in
such loss, even in cases where the system provided some level of benefit.78
Depending on the development environment, the demand for the product, and the
anticipated uses of the system, some level of Software Hazards are expected and
acceptable. In the case of the Patriot Missile Battery, the missile defense system had a
concealed fault that was not triggered in its intended configuration as an anti–aircraft
system. The fault was a rounding error that multiplied over time and was never revealed
as a factor against slower moving targets. When the Battery was reconfigured against
faster moving ballistic missiles, the rounding error became a greater factor and lowered
the system’s ability to accurately track and engage targets. Due to the strategic demands
of the system and the “fog of war,” a decision was made to utilize a software system that
was untested for its new configuration, with the manufactures and users aware that there
was questionable risk and potential hazards. To improve the level of success and reduce
the hazard of a missile getting through the battery’s screen, multiple layers of batteries
were set up in the theater of operation.
6. Controls of Unsafe Elements Software Systems, due to various external triggers and design factors, stand at risk
to experience a failure during various stages of their lifecycle. The ability to prevent,
handle, or mitigate this failure to prevent a malfunction is referred to as a control –
meaning to control the system’s functionality to within acceptable bounds should the
functionality deviate.
78 See APPENDIX B.4 –
PATRIOT MISSILE FAILS TO ENGAGE SCUD MISSILES IN DHAHRAN.
55
If devised properly, the control would permit the normal operation of the system,
reacting as necessary should the system depart from that operation. The software failure
control may consist of filters, redundant operators, or any of a number of other objects
that can decrease the potential for a system malfunction, should an error occur.
Optimally, the control object will prevent the occurrence of a malfunction and subsequent
hazardous event. Understanding the limitations of any design system and the potential
damage from significant malfunctions, the inclusion of a control object might not prevent
the occurrence of a hazardous event, instead only mitigate or lessen its effect. The
control object itself may be organic or independent of the system, depending on the
architecture of the system and control that is to be employed.
7. Semantics Summary
Software has been simplistically characterized as a set of logic instructions to
computer operations.
When those instructions fail to function properly or fail to control safety–critical
operations, the system will potentially execute a hazardous event. That event may
include the control of an electro–mechanical, hydraulic, or pneumatic system; or be the
control of a critical data system. The loss of control to either system could conceivably
constitute a hazardous event, depending on the potential consequence of the failure. A
safety–critical event does not require human interaction or input.
Research and investigation has revealed that the discipline of Software
Engineering has lacked a common definition for failure and the resulting consequences.
Other disciplines have spent considerable time and effort to define the practices and
characteristics of failure, as well as the measures to prevent them. Software Engineering,
while still in its infancy, is not exempt from fault or failure. Many software engineering
requirement and specification documents relate to Software Safety and Failure in the
broadest of terms, noting solely that efforts will be done to prevent failure and increase
safety.

56
NASA, in its Software Safety Standard referred to Faults as “preliminary
indications that a failure may have occurred,” 79 contrary to the Standard English
definition of the term Fault – as in imperfection, a weakness, or impairment.80 A fault
does not occur, it does not develop – it exists, timeless in state and nature, and reveals
itself only when triggered. It is not the number of faults in the system that should be the
concern; rather it is the effect that each fault may have should it be triggered. Optimally
that triggering would occur in controlled testing and not in use by the customer. Software
Safety has been defined as the “…discipline of Software Safety Engineering techniques
throughout the software lifecycle that ensures that the software takes positive measures to
enhance system safety and that errors that could reduce system safety have been
eliminated or controlled to an acceptable level of risk.”81 If Software Safety were as
simple as “Make the Software Safer,” then we would not be in the predicament that we
are today.
To better understand the discipline of Software Safety and Failure – the following
definitions are introduced:
Software Flaw: A specific item that detracts from the operation or effectiveness
of the software system without resulting in a failure or loss of operability. A software
flaw does not result in a failure. A flaw may reduce the aesthetic value of a product, but
does not reduce the system’s ability to meet development requirements.
Software Faults: An imperfection or impairment in the software system that,
when triggered, will result in a failure of the system to meet design requirements. A fault
is stationary and does not travel through the system.
79 NASA – STD – 8719.13A, Software Safety, NASA Technical Standard, National Aeronautics and
Space Administration; 15 September 1997. 80 The Merriam-Webster’s Collegiate Dictionary, Tenth Edition, Merriam Webster, Incorporated;
Springfield, Massachusetts; 1999. 81 NASA – STD – 8719.13A, Software Safety, NASA Technical Standard, National Aeronautics and
Space Administration; 15 September 1997.

57
Reactionary Type Faults: A fault characterized by an inability of the system’s
logic to react to acceptable values of inputs, as defined in the system requirements.
Handling Type Faults: A fault characterized by an inability of the system’s logic
to handle erroneous entries or parameters out of the normal bounds of the system.
Software Failure: The state in which a system has failed to execute or function
per the defined requirements due to a design fault.82 Failure is usually the result of an
inability to control the triggering of a system fault. Faults can be categorized in one or
more of four types, depending on the circumstances leading to the failure and the
resulting action. Failures can be further divided into one of two categories based on the
source of the failure. The occurrence of a failure may or may not be detected by the user
depending on the type of failure and the protections and interlocks of the system.
Resource Based Failures (RBF): Failures associated with the uncommanded
lack of external resources and assets. Resource Based Failures are predominantly
externally based to the logic of the system and may or may not be software based.
Action Based Failures (ABF): Failures associated with an internal fault and
associated triggering actions. Action Based Failures contain logic or software–based
faults that can remain dormant until initiated by a single or series of triggering actions or
events.
Software Malfunctions: The event within the system that creates a hazardous
event. A malfunction is not defined by the failure itself, but rather by the fact that the
system now fails to operate properly, operates improperly, or fails to operate at all,
resulting in a hazardous event. It may be possible for a system to experience a failure
without resulting in the occurrence of a malfunction. It may be possible for a system to
experience a malfunction without resulting in the occurrence of a hazardous event,
82 Computer Science Dictionary, Software Engineering Terms, CRC Press; ver. 4.2, 13 July 1999.

58
depending on the protections and interlocks of the system. The term malfunction is a
very general term, referring to the operability of the entire system and not to a specific
component.
Software Hazards: The potential occurrence of an undesirable action or event
that the software based system may execute due to a malfunction or instance of failure.
The hazard may be categorized by potential consequence and severity of its occurrence.
Software Mishap: The occurrence of a software hazard. Once a system fails, the
events may trigger a malfunction to execute, resulting in the occurrence of a hazardous
event – referred to as a Mishap. Formally, a mishap is defined as the occurrence of an
unplanned event or series of events and action that results in death, injury, or damage to
or loss of functionality of equipment, property, or otherwise reducing the worth of the
system.83
Control: The system object capable of preventing or mitigating the effects of a
system malfunction should a failure occur. Controls may consist of any of a number of
filters, redundant operators, or other hardware or software objects depending on the
architecture of the system and control that is to be employed. A control may be able to
filter unacceptable values and triggers from contacting a fault, preventing the occurrence
of a failure.
In a natural progression, a Software System might have a number of flaws that
exist and detract from the overall system but do not result in any failures or inability to
meet system requirements. In other parts of the system, there might exist faults that
linger in the background, awaiting a trigger to launch a failure. Once that trigger is
received by the fault, the fault generates a failure. Depending on the level of failure, the
ability of the system to contain the failure, and failure propagation, the system may
experience a malfunction. Investigation and planning could outline a number of potential
hazards that could occur if the system were to fail. The resulting malfunction could

59
trigger one of these hazards, ensuing in a mishap. If possible, that mishap may be averted
or mitigated through the use of control objects.
Due to the semantic rich nature of Software Engineering and Software Safety, it is
necessary to establish a basis of understanding for defining applicable terms within this
body of work. The use and definition of the terms flaws, faults, failures, malfunctions,
hazards, mishaps, and controls are widely contrasting and sometimes contradictory.
Definitions introduced in this study refine the use of these terms to better represent a
logical progression and flow from one term to another. Previous definitions referenced
throughout this chapter and in state of the art publications84, 85 refer to many of these
terms as isolated events without a method of evolution through the safety process. It is
intended that these refined terms create a better understating of vocabulary to represent
the fluid nature of safety within the field of Software Engineering.
D. DEGREES OF FAILURE86
Once a basis for defining faults and failures is understood, it becomes important
to define the degrees or levels of failure so that they can be categorized and referenced
within a metric that this dissertation defines. I introduce a new series of failure
definitions as well as complement existing definition series. The following definitions in
no way encompass all possible failure definitions, but serve to present a graduated series
of failure types for use in failure examinations. Failures are categorized based on the
following characteristics: their effect on the system, their propagation, and the “cost” that
they could inflict upon the system. “Cost,” in the case of failure, can be defined as both
the tangible and intangible value of resources lost as a consequence of the mishap. Again,
83 Attributed to NASA – STD – 8719.13A, Software Safety, NASA Technical Standard, National
Aeronautics and Space Administration; 15 September 1997. 84 Leveson, Nancy G.; Safeware, System Safety and Computers, University of Washington, Addison-
Wesley Publishing Company; April 1995. 85 Herrmann, Debra S.; Software Safety and Reliability, Techniques, Approaches, and Standards of Key
Industry Sectors, IEEE Computer Society, Institute of Electrical and Electronics Engineers, Inc.; Los Alamitos, California; 1999.
86 Nesi, P.; Computer Science Dictionary, Software Engineering Terms, CRC Press; 13 July 1999, http://hpcn.dsi.unifi.it/~dictionary.

60
the term “lost” is used to signify the unexpected or unplanned expense due to the failure
of operation in the system.
1. Failure Severity The loss of system operability from a software failure is not absolute but varying
from a subtle to a comprehensive failure. To develop a metric of Software Safety, it is
essential to understand and define a common set of resulting consequences of failure.
These definitions can then be applied to a metric and numerically ranked for a common
evaluation criterion for failure.
a. Failure Severity Definitions Failure Severity: The seriousness of the effect of a failure can be
measured on an ordinal scale (e.g., classification as major, minor or negligible) or on a
ratio scale (e.g., cost of recovery, length of down–time). This value may depend also on
the frequency of the error. The following definitions are a combination of successive
English terms, increasing in severity from the most benign of failures to the most critical.
Failures may be categorized as follows:
Invalid Failure: “A failure that is, but isn’t.” An apparent operation of
the primary system that appears as a failure or defect to the user but is actually an
intentional design that is not understood by the user. These types of defects or failures
are difficult to trace, as the user may not realize that they are actually intended features or
design limitations of the primary system. Invalid Failures may also exist when the
developer does not design the system to the expectations of the user. Such invalid
failures are commonly found when the user does not fully understand the functionalities
of the system that they are operating or the user attempts to combine seemingly similar
systems without understanding the bounds and limits of such a connection. Due to the
fluid design and rapidly changing environment of “MS Windows” based software, such
compatibility issues and invalid defects are prevalent in the Microsoft Windows OS:
The information contained in this document for each device is current as of the date first posted; however, since these products are subject to modification, revision, or replacement by individual manufacturers at any
61
time without notice, Microsoft cannot guarantee their continued compatibility with our operating systems.87
The term “Invalid Failure” is not synonymous and should not be confused
with current error prompts that warn the user of an invalid entry, and invalid operation, or
other invalid execution. The term implies that the actual fault or failure is invalid to the
current system and does not locally exist or exist at all.
Incorrectly stated for the purpose of this dissertation – TA00155 – Error Message ‘MSIMN causes an invalid fault in module MSOERT2.DLL at 017f: 79ef5358.’88
Key points of an Invalid Failure include the fact that:
1. The system conforms to the established requirements used by the
developers, not withstanding the fact that the requirements may not
meet the functional needs of the user. It is possible that the
misrepresentation or expectation of functionality could lead to the
occurrence of a hazardous event.
2. The user may attempt to operate the system in an environment for
which the system was not designed or certified to function. The
developer bears the burden of informing users of applicable
operating environments through proper documentation and training,
while it is the user’s obligation to ensure compliance with outlined
requirements. In an optimal design, the software system would
validate its environment at the commencement of operation, prior
to the execution of any critical functions.
Minor Flaw: A flaw does not cause a failure, does not impair usability,
and the desired requirements are easily obtained by working around the defect.
87 Microsoft Windows Hardware Compatibility List, Microsoft Corporation; Redmond, Washington;
2000. 88 Windows 98 Exception Errors Page, TechAdvice.Com; 2001.

62
We found a minor flaw in the 1.6.5 release. It was fixed and re–inserted in Polaris 1.6.5.tar.gz on the ftp site. If you download prior to March 7, 2000 at 11:13 am, you should download again to eliminate this bug.89
Latent Failure: A failure that has occurred and is present in a part of a
system but has not yet contributed to a system failure. Such a failure can remain hidden
in the background of the system, but does not surface to result in a malfunction or hazard.
A Latent Failure may be masked by the speed of the system, in which the processor
brushes past the failure and compensates for the error by starting a new procedure that
replaces the incorrect internal information with a corrected value before a system failure
occurs. The error may be so insignificant that it does not gain the attention of the
operating system or the user. A Latent Failure may surface later as part of a more severe
failure, but by its nature would not gain the attention of the system independently.
It is also important to note that, while all the latent failures we observed were transitory and were eventually detected and repaired, their durations were by no means always negligible. If the latent failure modes introduced by plant modifications tended to be short–lived, they would not necessarily be a major concern.90
Local Failure: A failure that is present in one part of the system but has
not yet contributed to a complete system failure. Such a failure is commonly interpreted
as a Latent Failure.
Applications and data are secured until the local failure is corrected, or the user goes to another WID connection to the same server. Upon logging in, the user’s application and data appear exactly as they were when the failure occurred without data loss, even if never saved to disk.91
Benign Failure: A failure whose severity is slight enough to be
outweighed by the advantages to be gained by normal use of the system. A Benign
89 Warning: Minor Bug Fix, Polaris Compiler Questions Forum, Polaris Research Group, University of
Illinois, Urbana – Champagne Campus; March 2000. 90 Bier, Vicki Prof.; Illusions of Safety, A White Paper on Safety at US Nuclear Power Plants,
Department of Engineering, University of Wisconsin, Madison, Wisconsin; 1989. 91 WID/Server Software, Unique Capabilities Further Reduce Cost and User Frustration, EIS, Bull
Communications, Versailles, France; 2001.

63
Failure assumes that a failure has occurred but its consequences are so slight as to be
overshadowed by the benefits gained by using the system. Such a judgment has to be
made taking into consideration the severity of potential hazards and likelihood of further
mishaps.
These turbo pumps are designed to be completely interchangeable with the existing Rocketdyne pumps, have more benign failure modes for greater safety, and will have only 4 welds compared to the present 297.92
Intermittent Failure: The failure of an item that persists for a limited
duration of time following which the system recovers its ability to perform a required
function without being subjected to any action of corrective maintenance. Such a failure
is often recurrent. An intermittent failure may or not lead to a malfunction or mishap, but
is observable by the system and user. The system may utilize redundant modules or error
handlers to compensate for the intermittent failure, which explains why the system was
capable of continuing operation. Intermittent Failures are easier to isolate and diagnose
then more severe failures because the system is capable of continuing its operation,
presenting the user with a controllable platform from which to trouble shoot.
Most insidious is the partial or intermittent failure of a cable. The symptoms of this kind of failure include partial data transmission, garbled data transmission, loss of Internet of network packets.93
Partial Failure: The failure of one or more modules of the system, or the
system’s inability to accomplish one or more system requirements while the rest of the
system remains operable. Such a failure is also referred to as a Degraded Failure in that
the system is degraded in its operation, but still remains capable of completing some
tasks. A Partial Failure does not reset or correct itself like an Intermittent Failure, but
rather reaches a constant state once it has occurred. The Partial Failure may continue to
propagate through the system and induce additional failures as time persists. A Partial
Failure may lead to a Malfunction and eventually a Mishap while other parts of the
92 Alternate Turbopump Development, Space Shuttle Evolution, Chapter 3, National Aeronautics and
Space Administration.
64
system remain unaffected. Such a Failure can be misleading in severity and the
continued operation of other components may convince the user to continue operation.
This continued operation could give the system the required time to generate a significant
Mishap which would have been averted had the system been halted at the start of the
Failure.
A business phone system may experience partial failure in some subset of its features. In most cases, a dial tone will still be available and the phone may seem to function normally. The problem may occur with the reports that detail the duration of each phone call. For organizations that use this information for billing and/or tracking, the erroneous reports may not be immediately recognized and automated billing systems may generate faulty invoices.94
Complete Failure: A failure that results in the system’s inability to
perform any required functions, also referred to in military and aviation circles as “Hard
Down.” Aviators and military members refer to a system that is completely broken and
requires extensive repair as “Hard Down,” while a working system is referred to as
“Up”:’Hard Down’ Aircraft are usually sent to the hanger deck and are replaced with
‘up’ aircraft from below.95
The term also applies to times when the system may be electively brought
down for maintenance, such as:
Both NOAA Orions also flew coordinated patterns with NASA aircraft. Tomorrow will be a no fly day and Friday a tentative hard down day.96
93 Input Devices, Cable Failures, Quinebaug Valley Community-Technical College; 03 February 2000. 94 Y2K FAQs, Examples of a Partial Breakdown, The Economic Times, Times Syndication Service, New
Delhi, India; 1999. 95 Pike, John; Military Analysis Network, CVN-72 Abraham Lincoln Departments and Divisions, Air
Department, Federation of American Scientists; 23 April 2000. 96 25 Aug 1998 Entry, CAMEX-3/TEFLUN-B Flight Activities, Hurricane George puts on a light show,
NASA Science News, Marshall Space Flight Center, National Aeronautics and Space Administration; 23 September 1998.
65
Because the size of this laser was not known in advance of the Fall IOP, it does not have FAA approval or an approved Standard Operations Procedures (SOP) at this time. Therefore, this laser is hard down until such approvals…97
Cataclysmic Failure: A sudden failure that results in a complete inability
to perform all required functions of an item. For the purpose of this definition, the use of
the term “Cataclysmic” refers both to the rate in which the system failed, and to the
severity degree of the Mishap that resulted from the failure. The word cataclysmic refers,
similar to its medical definition, to the fact that the system deadlocked or otherwise
ceased to function without notice. Users may not receive any warning that a system was
to fail, and consequently may not have had time or resources to take corrective action or
shift to alternate systems. Due to the processing speed of today’s systems, software is
particularly prone to sudden complete failure.
b. Failure Severity Summary It is essential to understand that failures come in a myriad of degrees, and
that a common set of terms must be established to define these failures and their effects
on the system. An Invalid Failure is the flawed design of the system, failing to meet the
user’s expected functionality while conforming to formal design requirements. Proper
system operation may be mistaken as a failure, or the operation of the system in
incompatible or uncertified environment. A Minor Flaw is inconsequential to the
operation of the product and does not affect the system’s ability to meet its operating
requirements. A Latent Failure existing in the background and does not affect the
outward functionality of the system. The logic of the system may compensate for the
failure or may bypass it as part of normal operation. A Local Failure is a failure that has
occurred and is isolated to one part of the system and does not contribute to the system’s
ability to meet its primary requirements. A Benign Failure is a failure whose severity is
slight enough to be outweighed by the advantages to be gained by normal use of the
system. An Intermittent Failure may only persist for a limited duration, after which the
97 Sisterson, Doug; Draft Fall 1997 Integrated IOP Operations Plan, Penn State Lidar, Atmospheric
Radiation Measurement Program (ARM); 18 September 1997.

66
system recovers its ability to perform. A Partial Failure disables one or more modules
of the system, or the system’s inability to accomplish one or more system requirements
while the remainder of the system remains operable. A Complete Failure results in the
system’s inability to perform any required functions. Finally, a Cataclysmic Failure
refers to the sudden and complete failure of a system, noted both in time and
Consequence Severity.
It is possible to examine system failures in a progressive linear format, as
noted by Figure 4. My study introduces a refined format for categorizing and defining
software system failures by using a progressive format to cover all extremes of software
failure. These formats and definitions benefit the state of the art of software development
and software system safety by introducing a more comprehensive terminology for
defining possible failures and their relationship within failure types. It is then possible to
classify and rate failures against an established scale to better acknowledge their severity,
prioritize resources for their correction, and establish possible goals for development.
Figure 4 Degrees of Failure
Inva
lid F
ailu
re
Min
or F
law
Late
nt F
ailu
re
Loca
l Fai
lure
Ben
ign
Failu
re
Inte
rmitt
ent F
ailu
re
Par
tial F
ailu
re
Com
plet
e Fa
ilure
Cat
acly
smic
Fai
lure
Full
Func
tiona
lity

67
E. STANDARDIZED FOUNDATION OF SOFTWARE SAFETY
1. Software Safety Standards98 A variety of technical standards have been introduced in the past decade that
delineate proprietary Software Safety philosophies and standards suited to specific
disciplines and practices, as well as a number of general standards that outline the basic
principles of Software Safety. The development of a metric for Software Safety requires
a review and understanding of existing standards as well as their application. This
section provides a brief survey of standards, their applicability to Software Safety, the
motivation of development, and scope of coverage. This survey is by no means all–
inclusive, as the complete list of safety standards is too large to be reviewed in this
dissertation. This section includes a review of six safety standards, selected for their
prominence and acceptance as valid safety standards, their mandated use in military and
governmental systems development, and their applicability as foundations to other
standards for the development of high–reliance systems.99, 100, 101 Additional standards
are referenced in APPENDIX D.1 of this dissertation.
a. AECL CE–1001–STD – Standard for Software Engineering of Safety Critical Software
CE–1001–STD was developed as a joint project by the Ontario
HydroPower Company and the Atomic Energy of Canada Limited (AECL) in 1990 and
later revised in 1995. 102 The standard was intended to foster code hazard and
requirements analysis for the engineering of real–time protection and safety–critical
98 IEEE SESC Software Safety Planning Group Action Plan, Institute of Electrical and Electronics
Engineers, Inc.; 15 October 1996. 99 Software System Safety Handbook, A Technical & Managerial Team Approach, Joint Software System
Safety Committee, Joint Services System Safety Panel; December 1999. 100 IR 5589, A Study on Hazard Analysis in High Integrity Software Standards and Guidelines, U.S.
Department of Commerce Technology Administration, National Institute of Standards and Technology, Computer Systems Laboratory; Gaithersburg, Maryland; January 1995.
101 IEEE SESC Software Safety Planning Group Action Plan, Institute of Electrical and Electronics Engineers, Inc.; 15 October 1996.
102 Standard for Software Engineering Safety Critical Software, Ontario Hydro and the Atomic Energy Canada Limited; Canada; 1990, 1995.
68
software in nuclear power generating stations. CE–1001–STD was designed to provide
methods and standards for the integration testing of independent modules into a larger
system.
CE–1001–STD demonstrates the intent of private corporations to generate
internal and proprietary standards to meet the specific needs of their organization. The
standard covered topics on software development, verification, support, and
documentation for nuclear power based software systems. While this standard contains
many of the principles of developing safety–critical systems, its format is tailored to the
nuclear industry and the specific needs of the Ontario Power Company.
b. NASA–STD–8719.13A – NASA Software Safety Technical Standard
STD–8719.13A was developed as a successor to previous Software Safety
standards to provide a methodology for activities required to design software for NASA’s
safety–critical systems.103 The standard mandates requirements for projects and project
managers to ensure compliance with the procedures and measures outlined to build high–
reliance systems.
The standard is broken down into project requirements for the lifecycle
phase and phase independent tasks, and for Software Safety analysis. Additional
emphasis is placed on quality assurance provisions and system safety definitions. The
weak point of the standard is that it only describes safety and the methods for its remedy
in great generalities, even to the point of stating “Software safety shall be an integral part
of the overall system safety and software development efforts.” The standard contains no
specific instructions, procedures, or numerical measures that must be taken to evaluate
and design a safe system. Rather the standard outlines general steps and references to
encourage safety.
103 Software Safety NASA Technical Standard, NASA-STD-8719.13A, National Aeronautics and Space
Administration; 15 September 1997.

69
c. MOD 00–56 – The Procurement of Safety Critical Software in Defence104 Equipment Part 2: Requirements
MOD 00–56 is part two of a two-part United Kingdom standard for
safety–critical software, specifically emphasizing the requirements for hazard analysis
and risk reduction, also referred to as “Requirements for Analysis of Safety Critical
Hazards”, approved in 1989.105 The standard was created as a requirement specification
for the development of defense software systems through the entire lifecycle, from
development to disposal. Major portions of the document include General Principles,
Management and Associated Documentation, Safety Requirements, System Safety
Analysis, Data Management, Test Program, and Work Program.
MOD 00–56 specifically outlines mandatory activities, accident severity
categories, probability ranges, risk class definitions, and safety–integrity levels for the
development. This clarity in requirement definition leaves no ambiguity to the
classification within a Software Safety Assessment. Many other specifications reviewed
fail to specify the exact quantifying criteria for determining the safety level of a software
system as well as the British model does. The specification outlines Hazard Analysis
Activities such as hazard identification, risk analysis, hazard analysis, software
classification, change hazard analysis, safety review, and documentation. Requirements
and hazards are processed and classified through the use of Fault Tree Analysis and
effects and criticality analysis. The MOD concludes with detailed checklists and
examples to identify and classify hazards and their safety remedies.
While there are fundamental flaws in the foundations and assumptions of
the UK model, the MOD 00–56 serves as a beneficial basis for developing a quantitative
and qualitative measure for Software Safety. My study and presentation expands on the
groundwork established by MOD 00–56 by formalizing the mathematical products that
can be derived from its checklists and taxonomies. MOD 00–56 limits its determination
of specific safety levels within the UK standard, leaving the final determination of such a
104 Note: “Defence” is the British variation of the American spelling of “Defense.”
70
level to the developer or individual making the safety analysis. Following chapters will
outline methods to formalize the determination of a software system’s safety level by
improving on methods for statistically computing Software Safety. These methods are
based on inspection and historical knowledge, similar to the inspection methods of MOD
00–56.
d. MIL–STD–882C/D – System Safety Program Requirements / Standard Practice for System Safety
Military Standard 882D is a broad–based defense standard, established to
define the requirement for safety engineering and management activities on all systems
within the U.S. DoD. This standard provides a uniform set of programmatic
requirements for the implementation of Software Safety within the context of the military
system safety program.106 Written in 1993 as MIL–STD–882C and later updated as
MIL–STD–882D in 2000,107 the standard is not exclusive to the Software Engineering
and Development discipline but rather to all disciplines of systems engineering
development, including mechanical, electrical, and aerospace engineering. It serves as a
“what–to–do” guide for software developers and engineers when designing System
Safety Programs. 882C can be tailored and modified to fit the specific needs of the
required field of development, while the 882D cannot be tailored.
MIL–STD–882D is an encompassing standard that covers every aspect
and activity of the system’s development and implementation lifecycle, including
research, technology development, design, test and evaluation, production, construction,
checkout/calibration, operation, maintenance and support, modification and disposal.
The standard is broken into varying levels of requirements including General
Requirements, Data Requirements, Safety Requirements, and Supplementary
Requirements. Additionally, the standard outlines tasks and procedures for assigning risk
and margins of safety to an engineering project. Appendix metrics are used to categorize
105 MOD 00-56, The Procurement of Safety Critical Software in Defence Equipment Part 2:
Requirements, Ministry of Defence; Glasgow, United Kingdom; 1989. 106 MIL STD 882C, System Safety Program Requirements, Software System Safety Handbook, U.S.
Department of Defense; 19 January 1993. 107 MIL STD 882D, Standard Practice for System Safety, U.S. Department of Defense; 20 February 2000.

71
and quantify system hazards by the severity of potential consequences and the probability
of the occurrence.
e. IEC 1508 – Functional Safety: Safety–Related Systems (Draft)108 Developed in 1995, by the International Electrotechnical Commission
SC65A, IEC 1508 serves as a generic outline for the requirements for the development of
safety–related systems. 109 Chapter II.E.1 specifically details the requirements for
software based control systems. While the draft 1508 document was later replaced by the
meta–standard IEC 61508, it continues to serve as a basis for international standards for
the development of high–reliance software and hardware–based systems.
IEC 1508 relies on the development of a safety plan for the description of
the safety lifecycle phases and the inter–dependencies between each of them. It is
recognized that safety is unique to each module of development, but also that safety is
intertwined through each of the subsystems of the product and through each stage of
development. While IEC 1508 notes that a safety based Software Architecture is the core
for a safety strategy of development, the standard fails to outline or define a specific
architecture for such development or to provide any useful guidance in selecting an
architecture. 1508 is broken up into a seven–part document to include general
development requirements, requirements for electrical/electronics/programmable
electronics systems, software requirements, definitions and abbreviations, guidelines for
the application of requirements in two parts, and a bibliography of techniques and
measures. The goal of 1508 is to ensure that systems are engineered and operated to the
standards appropriate to the associated risk.
f. Joint Software System Safety Handbook
Initially written in the fall of 1997 and later revised in December 1999, the
Software System Safety Handbook (SSSH / JSSSH) serves as a joint instruction for the
108 Note: IEC 1508 has later been ratified and published as IEC 61508, Functional Safety of
Electrical/Electronic/Programmable Electronic Safety-Related Systems - Parts 1-7, International Electrotechnical Commission, Geneva, Switzerland; 12 May 1997.

72
consolidation of the multitude of governmental and defense Software Safety standards.110
The SSSH includes “best practice” submissions from the U.S. Army, Navy. Air Force,
Coast Guard, Federal Aviation Administration, National Aeronautics and Space
Administration, defense industry contractors, and academia.
The handbook reviews current and antiquated software development
methods and safety standards including DoDD 5000.1, DoD 5000.2R, DoT and NASA
standards, as well as commercial and international standards of Software Safety
Assurance. Additionally, the standard contains an overview of the history of and
management responsibilities of Software Safety. The remainder of the text is broken
down into introductions of Risk Management and System Safety, Software Safety
Engineering, and an extensive set of reference appendices. Appendices include the
management of COTS systems in Safety Development, generic requirements and
guidelines for Safety Development, worksheets for safety analysis, sample contractual
documents, and lessons learned from previous safety mishaps and successes. The
standard is designed as a “how to” handbook for the general understanding and
implementation of software system safety into the development process. The specific
level of safety of a system is still left up to the measurements of the developer and levels
acceptable to the client.
g. Standards Conclusions The number and scope of Software Safety Standards is as varied as the
number of potential safety–related failures that can occur in a system. CE–1001–STD is
a specialized standard tailored to the Canadian nuclear power industry while NASA–
STD–8719.13A is an in–house standard for the National Space Agency. Both standards
are equally beneficial within there own scope of application and design, but are limited in
their relevance outside of the specific context for which they were developed. Both
standards rely on a framework of administrative protocols and procedures to ensure
109 IEC 1508, Functional Safety of Electrical / Electronic / Programmable Systems: Generic Aspects,
International Electrotechnical Commission; Geneva, Switzerland; 13 April 1998.

73
compliance. MOD 00–56 is a governmental Software Safety standard for the Ministry of
Defence of the United Kingdom, while MIL–STD–882D is a product of the Department
of Defense of the United States. Both standards improve on existing methods and
measures for creating a Software Safety Program while taking different approaches on
the determination of system’s level of safety. IEC 1508 is an international safety
standard that includes an extensive review of safety principles and contains a chapter
specifically dedicated to Software Safety. Using proprietary standards, national standards,
and finally international standard, the DoD has consolidated its efforts to create the Joint
Software Safety Standard Handbook. APPENDIX D.1 – Table 19 lists a compiled set of
standards and their techniques for identifying and handling Software Safety.
The development of any Software Safety Standard or Safety Metric
requires the review of available standards, to serve as a basis or foundation. These
standards are themselves based on previous standards, tailored to meet the specific needs
of the user agency or client. While these standards provide a basis for developing
Software Safety, they do not completely define the measurement of software’s level of
safety. Using the principles of these and other standards, as well as principles of statistics
and probability, this study outlines additional measures for determining the safety of a
software system.
2. Traditional Methods to Determine Software Safety As with Software Safety Standards, there are methods and algorithms that can be
used to determine the safety of a system or the probability of failure. Each method is
unique in its approach, its product, and in its interpretation of Software Safety as well as
many of the methods being proprietarily to specific standards. The key components of a
Software Safety Assessment are:
• The identification of hazards.
• The identification of the ability of the system to handle the specific hazard.
110 Software System Safety Handbook, A Technical & Managerial Team Approach, Joint Software System
Safety Committee, Joint Services System Safety Panel; December 1999.

74
• The measurement of probability of the system to prevent the hazard.
• The measurement of the consequence of the hazard.
Based on the defined criteria for a Software Safety Assessment, many existing
methods and standards are eliminated. The purpose of a Software Safety Assessment is
to evaluate the quantity and level of hazards that exist within the system and to determine
the level of mitigation or handling of each hazard's risk. A Software Safety Assessment
evaluates all software components capable of creating a hazard under normal operating
conditions as well as under extreme and abnormal operating conditions. A Software
Safety Assessment includes the testing of all components, modules, and interfaces of the
system including COTS / GOTS components incorporated into the system, regardless of
the previous success of the testing of the components. A system implies the
incorporation of multiple units to make a complete structure. Each component must be
evaluated independently, as well the incorporated results of those components.
A product of a Software Safety Assessment includes the identification of
corrective actions necessary to eliminate or mitigate the risk of hazards. Optimally
testing is conducted throughout the development process to determine the fragility of the
system and its increased robustness with each cycle of development. There is a distinct
difference between testing a Software System for functionality and testing a Software
System for Hazards and Safety. A system may function properly and within the proper
bounds it was developed for, but may still execute an action that results in a mishap.
With experience and proper reasoning, it would be possible to derive the
probability of failure if:
• The distribution of inputs are known,
• The hazardous situations are known,
• The program logic and code are known, and / or
• There are sufficient resources for making the assessment.

75
It would be difficult to emulate every possible state environment that the software system
could experience in relation to every potential input. As a start, bounding the inputs
would limit the field that must be searched. As a second, understanding the logic and
code of the system would open some potential for understanding vulnerabilities.
Unfortunately, these are only two of the many factors that contribute to an accurate
assessment. While it is very difficult to accomplish without adding excessive overhead to
the system, the control and bounding of potential system environments would be another
level of system design capable of increasing system safety.
The equations and assessment logic would be similar for both large and small
system, while the resources required to make the assessment may differ dramatically.
Depending on the nature of the system, measurements of runtime frequencies may
require an impracticable amount of time if failure frequencies are very low. A judgment
and limit must be made of the assessment method to ensure that resources are not grossly
expended. Note: The resources for assessment must be balanced against the benefit
gained from the assessment and consequential improvements.
a. Coverage Testing Software Coverage Testing (CT) is the testing of a series of cases and
fields with a pass/fail criterion.111 Coverage is measured by the level and extent of the
testing of each case from a scale of 0% to 100%. Examples of Coverage Test cases
include the testing of each line of code, the testing of data coverage, and error state
handling. APPENDIX D.2 lists over 100 different test cases that apply to software–based
systems. Much of CT is considered traditional “White Box Testing” in that the testing is
done from a viewpoint from inside the component itself vice from the end user’s
viewpoint of view. CT can become exponentially time consuming as the goal for a
coverage measure increases towards 100%. Many aspects of CT can be automated and
executed from compilers and third party software testing tools. CT is not a measure of
safety, as it does not regard the hazards of failure but rather the ability for a test to return
111 Kaner, Cam; Software Negligence & Testing Coverage, Software QA Quarterly, vol. 2, num. 2, pg.
18; 1995.

76
a pass or fail response for a given level of coverage. CT does serve as a measure of
functionality and process completeness, inferring an ability of the system to handle and
prevent specifically identified failures within the bounds of the testing.
Coverage Testing is widely used in software reliance testing for its ability
to certify a system’s completeness through the use of system inspection based on defined
development and operation points. A score can be given to the certification by summing
the number of tests that pass against those that may fail. Such summation scoring of
Coverage Testing fails to take into consideration the weight of particular test points or
consequence results. These points are addressed with potential correction in this
dissertation.
b. Requirements Based Testing (RBT) Requirements Based Testing is a function of systematically testing the
operation of a Software System for compliance within the bounds established by a given
set of project development requirements. Requirements can be measured or gauged by
their complexity or by the number of functional points generated. Optimally,
requirements are established early in the development of the system though they may be
revised and refined repeatedly through the development cycle. As requirements are
established, they can be verified, measured for complexity, weighted for their effect on
the system, and assigned a test case to validate the function of the system within the
bounds set by the requirement. The result of RBT is a pass/fail grade for each
Requirement or Function Point Test.
The proper function of the system dictates that requirements are well
written and validated for completeness as well as they are reasonable and practical to the
development of the system. Requirements must be written in such a manner that they
lead to the development of a test case and can be validated. If requirements are unclear,
incomplete, too general, or not testable they jeopardize the functionality of the system
and do not support a test case. NASA stated in its paper on requirements testing metrics
that, “There are no published or industry guidelines or standards for these testing
metrics—intuitive interpretations, based on experience and supported by project feedback,

77
are used….” 112 Many industry development standards specify unique requirements
documentation formats that are proprietary to the standard itself and may not lead directly
to test cases, based on their formats. Automated Requirements Management Tools must
be refined or developed for each System Requirement Specification (SRS) format or the
requirements must be converted to the tool.
Requirements and Function Points are measures that can be obtained early
in the development cycle. They provide a textual and mathematical value that can be
compared against previous development efforts. Function and Feature Points, coupled
with the COCOMO113 and Putnam114 methods of software evaluation can provide a
subjective estimated measure of the complexity, effort, and cost of the system as well the
probability of developmental failure (failure to complete the development), based on a
comparison method against known projects.115
RBT is not a complete method of Software Safety Testing, as its purpose
is to test for the ability to develop the system based on criteria and bounds established in
the requirements. RBT must be complimented by additional methods that validate the
requirement content for completeness, in conjunction with a comprehensive safety
program to provide oversight throughout the development process.
Requirements are function based, while hazards are the product of
the function.
Measurements such as the vagueness, imperativeness, continuance, or
weak phrases within a requirement’s specification do not imply a hazard but impinge
112 Rosenberg, Linda H., PhD; Hammer, Theodore F.; Huffman, Lenore L.; Requirements, Testing, &
Metrics, Software Assurance Technology Center, National Aeronautics and Space Administration; October 1998.
113 Boehm, Barry; Clark, Bradford; Horowitz, Ellis; Madachy, Ray; Shelby, Richard; Westland, Chris; Cost Models for Future Software Lifecycle Processes: COCOMO 2.0, Annals of Software Engineering; 1995.
114 Putnam, Lawrence H; Myers, Ware; Measures for Excellence. Reliable Software On Time Within Budget, Yourdon Press Computing Series; January 1992.
115 Nogueira de Leon, Juan Carlos; A Formal Model for Risk Assessment in Software Projects, Naval Postgraduate School; Monterey, California; September 2000.

78
upon the functionality of the system. Lines of text within the requirement are not a
measure of safety but of the complexity of the system and the requirements to build. A
system may function properly but may still induce a hazard simply by the fact that the
system executes a hazardous operation that may be specified by an unsafe set of
requirements.
RBT does not completely satisfy the needs of critical system development,
as its emphasizes tests of what is known of the system and not of what is unknown. I
have included a review of the software product from the point of view of the hazard that
the system is designed to prevent, and then work backwards to ensure that requirements
satisfy the prevention of their occurrence. Requirements may not consider the
consequence of hazard prevention, unless such prevention was the focus of the
requirement. Requirements Based Testing only ensures that the requirements were
satisfied, regardless of the hazard that may need to be prevented. An outlined method is
presented for reviewing the development of the system, through all stages of
development of development to ensure that hazards are prevented, to an acceptable level.
c. Software Requirements Hazard Analysis (SRHA) First introduced in MIL–STD–882B as a 301 Series Task,116 a Software
Requirements Hazard Analysis involves the review of system and software requirements
and design in order to identify potentially unsafe modes of operation. This review
ensures that system safety requirements have been properly defined against potential
hazards, and that safety requirements can be traced from the system requirements to the
software requirements; software design; testing specifications; and the operator, user, and
diagnostic manuals.117 Preceding this review must be a hazard analysis that identifies
missing, ambiguous, incomplete, or incoherent requirements that are safety related and
incorporate them into the system and software specification. The SRCA or SRHA
116 MIL-STD-882B, System Safety Program Requirements, Department of Defense; Washington, D.C.; 30
March 1984. 117 NISTIR 5589, A Study on Hazard Analysis in High Integrity Software Standards and Guidelines, U.S.
Department of Commerce Technology Administration, National Institute of Standards and Technology, Computer Systems Laboratory; Gaithersburg, Maryland; January 1995.

79
becomes the means of tracking them to resolution. The analysis starts in the system
requirements phase of the system lifecycle to include a review of system and software
requirements and documentation. Safety recommendations and design and test
requirements are incorporated into the development specifications, documentation, test
plan, configuration management plan, and project management plan.
Where the Preliminary Hazard Analysis is the first stage, the SRHA is the
second stage of system hazard analysis. Upon completion of the SRS a thorough review
of the requirements, specifications, and any previously known hazards are completed.
The product of this review becomes a part of the system requirement’s documentation
and is used in conjunction with further test plan development.
The SRHA is subjective in nature and requires an intuitive knowledge
of the system and subject matter being developed as well as the foresight to see
potential system hazards from the review of a textual product. There is no defined
format for the SRHA review report.
Primary values of the report would include known and potential hazards,
their triggers, related requirement(s), methods to mitigate the hazard, and test criteria.
This dissertation uses portions of the SRHA philosophy by reviewing the
hazards that could result as a consequence of specific requirements by assigning a
numeric value to the assessment of specific elements. While the SRHA may be
subjective in its review, I introduce methods for formalizing the review to ensure
standardizing practices and methodologies.
d. Software Design Hazard Analysis (SDHA) Design Hazard Analysis is the third in the evolutionary step of Hazard
Analysis, following Requirement Hazard Analysis. As with SRHA, SDHA was
formalized in MIL–STD–882B as a 302 Series Task. 118 Using the SRHA and its
118 MIL-STD-882B, System Safety Program Requirements, Department of Defense; Washington, D.C.; 30
March 1984.

80
resulting product as input, SDHA involves the identification of safety–critical software
components; assessing their degree of risk and relationship to other components,
establishing a design methodology, and developing a test plan for validating the
component’s safety. The SDHA identifies specific software components that relate to the
hazard. It also determines software failure modes that could lead to a hazard, identifies
the components associated with that failure mode, and finally designates respective
elements as safety critical. Based on the assignment of hazards to components, the
system can then be reviewed for independence, relationship, or reliance conditions that
could propagate the fault or hazard. The analysis starts after the software requirements
review and should be near completion before the start of software coding.
Most software, due to its lack of self–awareness, requires some form of
external interaction to launch its procedures or to receive its results. Hundreds of
interface devices have been developed and are currently being developed that permit
human interaction with the software system.119 Additional devices provide the ability for
animal, nature/climatic, or secondary system interaction with a software system. The
Design Analysis requires an extensive review of potential interface conflicts and hazards
that can be induced by the interaction of external users or systems including those
associated with failure modes of the interfacing devices.
Based on the assessment of the component design, changes are then made
to the software design document to eliminate and/or mitigate the risk of a hazard or
simply to raise the awareness of the programmers who will be designing the component.
The SDHA may suggest a unique method of development for different components as the
hazard probability and complexity of one component may differ from the next. The
assessment may result in a review of the system requirements or simply result in
recommendations for design and development.
119 Myers, Brad A.; A Brief History of Human Computer Interaction Technology, ACM interactions. vol.
5, num. 2, pg. 44-54; March 1998.

81
The SDHA is also subjective in nature as the software product is still
in theoretical form. Subject matter expertise on the product as well as on methods
of development is required to ensure a thorough analysis.
Where the Software Requirements Hazard Analysis focused on the safety–
related hazards of the requirements, the Software Design Hazards Analysis focuses on the
design and development of components to satisfy the requirements and avoid hazards.
The concepts of the Software Design Hazards Analysis are mirrored in the NASA Safety
Manual NPG 8715.3.120
There is no defined format for the SDHA review report, while it should
follow a similar format chosen for the SRHA. In complement to MIL–STD–882, the
DoD created DID DI–SAFT 80101B – System Safety Hazard Report Analysis121 (SHRA)
to describe the data items of a hazard analysis report. The report should include a
summary description of the system and its components, their capabilities, limitations, and
interdependence as they relate to safety. The analysis should include a listing of:
• Identified hazards,
• Hazard related components, modules, or units,
• Hazard failure mode(s) resulting in the hazard,
• System configuration, event, phase, and description of operation
resulting in the hazard,
• Hazard description,
• Hazard identification properties,
• Effects of the hazard,
• Recommended actions,
• Effects of the recommendations, and
120 NPG 8715.3, NASA Safety Manual, NASA Procedures and Guidelines, National Aeronautical and
Space Administration; 24 January 2000. 121 DI-SAFT-80101B, Data Item Description, System Safety Hazard Analysis Report, Department of
Defense; Washington, D.C.; 31 July 95.

82
• Notes, cautions, or warnings applicable to the operation of the
component and its related hazards.
This study relies heavily on the practices outlined in SDHA. These
methods and study improve on the practice by establishing a progression from SRHA to
SDHA, establishing a format for the review, and the use of a numerical / textual format
for assessing the findings of the SDHA.
e. Code–Level Software Hazard Analysis (CSHA) Code–level Software Hazard Analysis is a fluid analysis of the source and
or object code, the code writing process, and results, as it corresponds to Software Safety.
It is one of the most common forms of hazard analysis to test high–risk software or when
there exists test anomalies that are not the result of errors in test setup or procedures. The
CSHA is an analysis of the software code and system interfaces for events, faults, trends,
and conditions that could cause or contribute to a system hazard.122 The term fluid refers
to the fact that the software analysis is ongoing through the development of the software
code and into the testing phase of development. Most often, the product of code level
hazard evaluations result in modifications to the code to ensure the correct
implementation of requirements or to improve the ability of the code to handle specific
failure conditions. Additional changes may be made to the requirements specifications
and software test plan to ensure that the software meets the intended developer and
customer.
The Code–Level Safety Hazard Analysis differs from Requirements and
Design based analysis in that the Code–Level deals with a tangible product that can be
evaluated and manipulated real–time with the evaluation. Previous evaluations could
only be done through theoretical methodologies or using simulation tools that replicated
the function of the component or requirement. The CSHA examines the code for form,
structure, flow, and completeness not previously detected by system compilers. This
122 MIL-STD-882B, System Safety Program Requirements, Department of Defense; Washington, D.C.; 30
March 1984.

83
examination includes inspection for input–output timing, multiple and out–of–sequence
events, failure mode handling, and compliance with safety requirements. The evaluation
may be subjective as well as objective due to the tangible nature of the software code.
It should be clearly understood that “Lines of Code” is not a
measurement of Software Safety.
This dissertation makes only limited use of CSHA due to its narrow
application to Software Safety. CSHA is reviewed in this dissertation only due to its
popularity as a software development assessment tool, and to its applicability towards
Software Safety.
f. Software Change Hazard Analysis (SCHA) At the completion of a development cycle, software may be re–evaluated
for functionality and applicability to requirements and safety concerns. With each
change of the software system, new safety concerns are introduced that require
identification and evaluation. The Software Change Hazard Analysis is an evaluation of
changes, additions, and deletions to the software system and of their impact on safety.123
SCHA is performed on any changes made to any part of the system, including
documentation, to ensure that the change does not induce a new hazard or mitigate the
defense against an existing hazard. This hazard analysis is performed at the end of the
software development cycle before the commencement of new development.
British Defence Development Standards state that, “If the system,
application, or the operating conditions are changed, it cannot be directly inferred that the
system will be tolerably safe for use in the new situation. Any changes to the system, its
application or its operational environment must be reviewed for possible impact on safety
and appropriate steps must be taken to ensure tolerable safety is maintained.”124 It is
123 MIL-STD-882B, System Safety Program Requirements, Department of Defense; Washington, D.C.; 30
March 1984. 124 MOD 00-56, Safety Management Requirements for Defence Systems, Part 1/Issue 2: Requirements,
Ministry of Defence; Glasgow, United Kingdom; 1989.
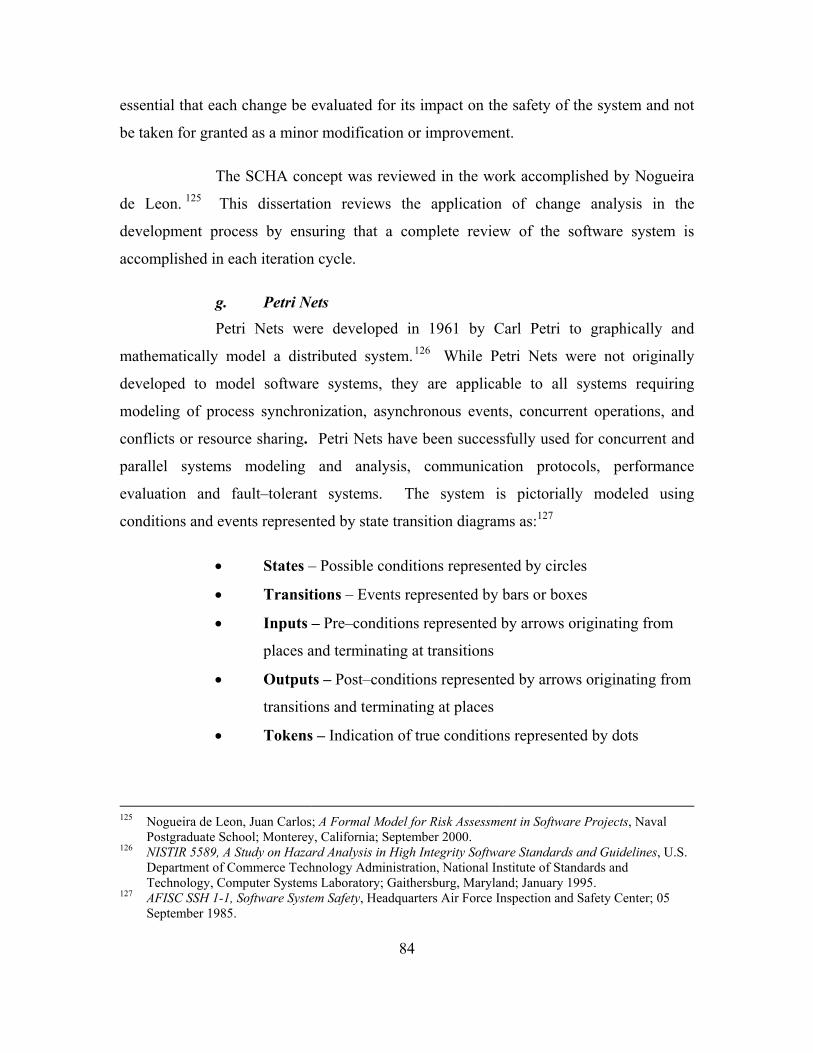
84
essential that each change be evaluated for its impact on the safety of the system and not
be taken for granted as a minor modification or improvement.
The SCHA concept was reviewed in the work accomplished by Nogueira
de Leon. 125 This dissertation reviews the application of change analysis in the
development process by ensuring that a complete review of the software system is
accomplished in each iteration cycle.
g. Petri Nets Petri Nets were developed in 1961 by Carl Petri to graphically and
mathematically model a distributed system.126 While Petri Nets were not originally
developed to model software systems, they are applicable to all systems requiring
modeling of process synchronization, asynchronous events, concurrent operations, and
conflicts or resource sharing. Petri Nets have been successfully used for concurrent and
parallel systems modeling and analysis, communication protocols, performance
evaluation and fault–tolerant systems. The system is pictorially modeled using
conditions and events represented by state transition diagrams as:127
• States – Possible conditions represented by circles
• Transitions – Events represented by bars or boxes
• Inputs – Pre–conditions represented by arrows originating from
places and terminating at transitions
• Outputs – Post–conditions represented by arrows originating from
transitions and terminating at places
• Tokens – Indication of true conditions represented by dots
125 Nogueira de Leon, Juan Carlos; A Formal Model for Risk Assessment in Software Projects, Naval
Postgraduate School; Monterey, California; September 2000. 126 NISTIR 5589, A Study on Hazard Analysis in High Integrity Software Standards and Guidelines, U.S.
Department of Commerce Technology Administration, National Institute of Standards and Technology, Computer Systems Laboratory; Gaithersburg, Maryland; January 1995.
127 AFISC SSH 1-1, Software System Safety, Headquarters Air Force Inspection and Safety Center; 05 September 1985.

85
Figure 5 Petri Net Example
As depicted in Figure 5, S1 is an unpopulated state, while S2 and S3 are
states with tokens. The tokens permit T2 to fire while T1 remains stagnant. The output of
S2 and S3 transitions through T2, passing their token on as an input to S5.
Developed to track the flow and states of a system, Petri Nets can be
"executed" to depict how the system will function and flow under certain conditions.
Assigning logic conditions to transition points and places permits higher–level modeling
and evaluation of the system. The Petri Nets can be used to determine all the states that a
system can reach, given an initial set of conditions. Due to the graphical nature of Petri
Nets and their ability to portray only a single state in each depiction, Petri Nets can
become too large to practically examine all possible states of a system. A Petri analysis
can be done for only those portions of the system that present the potential for a
hazardous event.128
Using mathematical logic statements, Petri Nets can be used to describe
structural transition relationships between potential cases via potential steps. 129 By
adding an initial state, the description can be modified to describe actual cases and steps.
Mathematically, Figure 5 would be depicted as:
128 Peterson, J. L.; Petri Net Theory and Modeling of Systems, Prentice Hall; 1981.
S1 S2 S3
T1 T2
S5S4

86
N = (S, T, F) S = {S1,…,S5} T = {T1, T2} F = {S1, T1}, {S2, T1}, {S2, T2}, {S3, T2}, {T1, S4}, {T2, S5} Where N is a Petri Net Where S are States Where T are Transitions Where F are Flows
This mathematical notation can be universally understood and applied to
any number of proofs and metrics. The notation can also be applied to automated testing
software that can dramatically increase the rate of software inspection for potential
hazards. The Petri Model can be created early in the development cycle and refined as
the program increases in scope and potential hazards are recognized.130
This dissertation expands on the benefits of Petri Nets in two ways:
1. By expanding on the benefit of a flow depiction diagram to show
the process flow and system interaction of the software system,
and
2. The use of a mathematical terminology and method for depicting
the process flow.
Each of these techniques is based in the Petri Net methodology, but must
be improved and developed to ensure the relationship with high–assurance systems.
129 Balbo, Gianfranco; Desel, Jorg; Jensen, Kurt; Reisig, Wolfgang; Rozenberg, Grzegorz; Silva, Manuel;
Introductory Tutorial Petri Nets, 21st International Conference on Application and Theory of Petri Nets, Aarhus, Denmark; 30 June 2000.
130 Leveson, Nancy G.; Janice L. Stolzy; Safety Analysis Using Petri Nets, IEEE Transactions on Software Engineering, vol. SE-13, num. 3, Institute of Electrical and Electronics Engineers, Inc.; March 1987.

87
h. Software Fault Tree Analysis (SFTA) 131, 132Fault Tree Analysis has proven extremely successful in identifying
faults in a variety of engineering design disciplines,133 including the fields of aeronautical,
electrical, mechanical, and Software Engineering. A Fault Tree Analysis is designed to
pictorially model contribution of faults or failures to the top-level event, concentrating on
aspects of the system that impact the top event. The Fault Tree depiction provides a flow
model through the system to facilitate the identification of points or methods possible to
eliminate or mitigate the hazardous event. A SFTA is created from the base or root of the
tree by listing all known hazards identified in previous analyses. Once an initial hazard
analysis has been completed and hazards identified and plotted, SFTA is worked
backwards to discover the possible causes of the hazard. The SFTA is expanded until
each branch concludes at its lowest level basic events, which cannot be further analyzed.
The purpose of a SFTA is to demonstrate that the software will not permit
a system to reach an unsafe state. It is not necessary to apply the SFTA to the entire
system but only to portions that present a risk to system operation or are considered
safety–critical. If properly designed, a Fault Tree can reveal when a correct state
becomes unsafe and can lead to a failure. The failure can then be traced as it propagates
through the system. The use and applicability of Fault Trees is readily understood within
the engineering field and easily related to Software Engineering. A SFTA may include
symbols such as:
131 Leveson, Nancy G; and Peter R. Harvey; Analyzing Software Safety, IEEE Transactions on Software
Engineering , vol. SE-9, num. 5, Institute of Electrical and Electronics Engineers, Inc.; September 1983.
132 Leveson, N.G.; Software Safety: Why, What, and How, Computing Surveys, vol. 18, num. 2, Association for Computing Machinery; June 1986.
133 PD-AP-1312, The Team Approach To Fault Tree Analysis, Preferred Reliability Practices, Marshall Space Flight Center (MSFC), National Aeronautical and Space Administration.
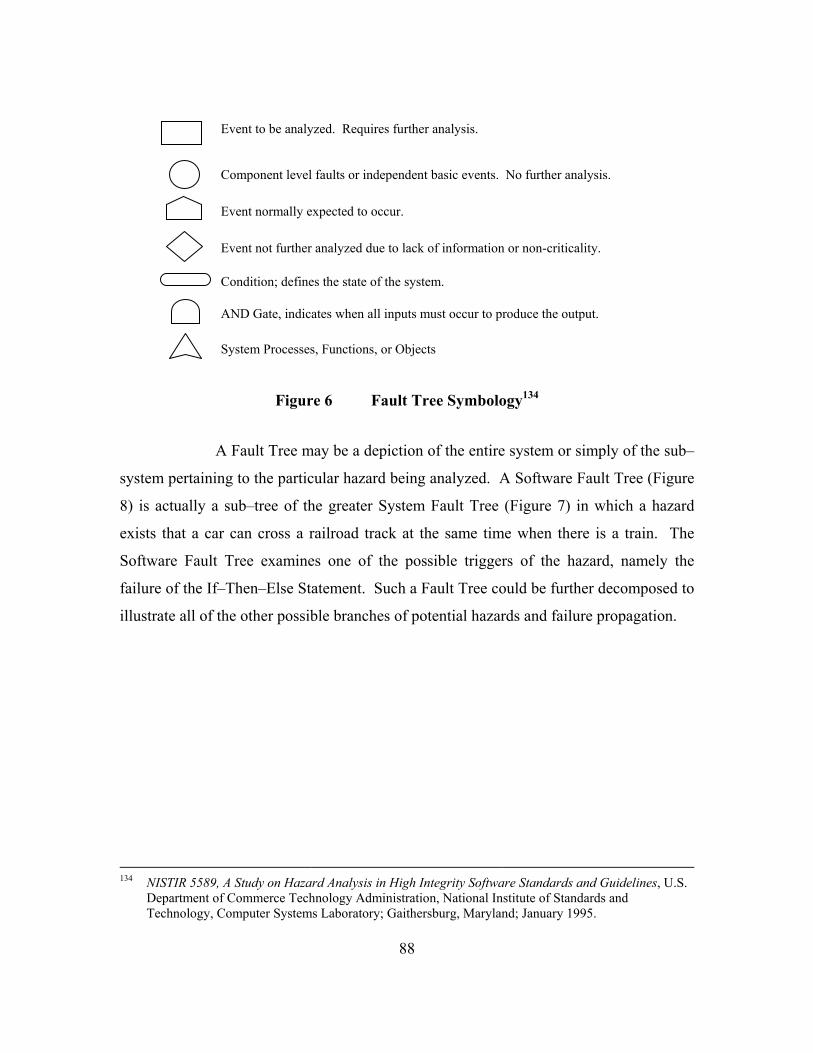
88
Figure 6 Fault Tree Symbology134
A Fault Tree may be a depiction of the entire system or simply of the sub–
system pertaining to the particular hazard being analyzed. A Software Fault Tree (Figure
8) is actually a sub–tree of the greater System Fault Tree (Figure 7) in which a hazard
exists that a car can cross a railroad track at the same time when there is a train. The
Software Fault Tree examines one of the possible triggers of the hazard, namely the
failure of the If–Then–Else Statement. Such a Fault Tree could be further decomposed to
illustrate all of the other possible branches of potential hazards and failure propagation.
134 NISTIR 5589, A Study on Hazard Analysis in High Integrity Software Standards and Guidelines, U.S.
Department of Commerce Technology Administration, National Institute of Standards and Technology, Computer Systems Laboratory; Gaithersburg, Maryland; January 1995.
Event to be analyzed. Requires further analysis.
Component level faults or independent basic events. No further analysis. Event normally expected to occur. Event not further analyzed due to lack of information or non-criticality. Condition; defines the state of the system. AND Gate, indicates when all inputs must occur to produce the output. System Processes, Functions, or Objects

89
Figure 7 System Fault Tree Example
Figure 8 Software Fault Tree Example
Event Tree Analysis, similar to Fault Tree Analysis, is designed using a
bottom up approach to model the system.135, 136 Each root item is an initiating event of
the system.137 Two or more lines are drawn from each root item to the next event to
make up the event tree. These lines depict the positive and negative consequences of the
event, as well as variable consequences that do not fall within the limits of Boolean
expression. The Event Tree is expanded for each subsequent consequence until all
135 IEC/TC65A WG9, IEC 65A (Secretariat) 94, 89/33006 DC -(DRAFT) Software for Computers in the
Application of Industrial Safety-Related Systems, British Standards Institution; November 1989. 136 IEC/TC65A WG10, 89/33005 DC - (DRAFT) Functional Safety of Programmable Electronic Systems,
British Standards Institution; November 1989. 137 Raheja, Dev G.; Assurance Technologies - Principles and Practices, McGraw-Hill, Inc.; 1991.
Software Does Not Turn On Lights
Assignment Causes Failure
If-Then-Else Causes Failure
Case Causes Failure
Loop CausesFailure
Then Part CausesFailure
Else Part CausesFailure
or
or
Car and Train on Same Track
Software does not Turn on Lights
Lights Burnt Out
or
Lights do not Operate
or
Driver Ignores Lights

90
consequences are considered. Each branch of the Event Trees can then be used to
calculate the probabilities of each consequence to generate a mathematical probability for
success or failure.138
Based on the analysis of the Fault or Event Tree, decisions can be made to
balance the efforts of development against the desired measure of safety. Changes can
then be made to the development process to take action to mitigate or eliminate the
hazards as desired. Tree Analysis is easy to construct and is aided by a significant
number of COTS systems available to developers. Depending on the system, such an
analysis may become extremely large and difficult to maintain without some form of
automation.139, 140
Fault and Event Tree Analysis is designed around depicting the decision
process of the system. Analyzing the decisions and directions that a system process flow
can make can assist in eventually isolating many system failures. Such isolation is based
on the limits and bounds that the system is to operate within. When the developer is able
to depict this decision process pictorially, in a standardized fashion, the developer can
more effortlessly identify points that require additional protections and controls.
i. Conclusions of the Estimation of Software Safety Software Safety can be described in two fashions:
1. As a Boolean expression of the software being safe or unsafe, or
2. As a numeric value representative of the probability of safety or
the probability of an unsafe action.
To quantify how safe software is or to determine if software is safe
requires the identification and analysis of the potential hazards of the system. This
138 NUREG-0942, Fault Tree Handbook, U.S. Nuclear Regulatory Commission; 1981. 139 Limnious, N; Jeannette, J.P.; Event Trees and their Treatment on PC Computers, Reliability
Engineering, vol. 18, num. 3; 1987. 140 Fussel, J.; Fault Tree Analysis - Concepts and Techniques, Generic Techniques in Reliability
Assessment, Noordhoff Publishing Co., Leyden, Holland; 1976.
91
portion of the dissertation outlines many of the popular methods and protocols for
evaluating the safety of a software system, and defining the differences between testing
for functionality and testing for safety. Methods such as Coverage Testing and
Requirements Based Testing only examine a system to ensure that it meets a broad list of
predetermined criteria. To test for safety requires the specific goal of the test or analysis
to identify potential hazards and the triggers that may produce those faults.
Measurements such as COCOMO and Putnam do not determine the safety
of a software system but rather determine the level of effort or complexity of a system.141,
142 Complexity is not a natural result of the COCOMO and Putnam measurements, but an
increased effort can infer an increased complexity. 143 , 144 Just because a system is
complex in its development does not necessarily mean that it will produce a hazard. A
system may function in accordance with its stated requirements, but may still execute an
action that results in a mishap.
Hazard Analysis is the only previously proposed method to identify
hazards through each phase of the development process. Examples include Requirements
Hazard, Software Design Hazard, Code–Level Hazard, and Change Hazard Analysis.
These hazard analysis methods may incorporate principles of Coverage and
Requirements Testing with the exception that their intent is to specifically identify
hazards and not functional irregularities. Their validity and applicability in software
development is still not completely accepted or integrated into all aspects of critical
systems development. Any decision as to which analysis technique would best apply
depends on the techniques and abilities of the developers and the system under
investigation.
141 Boehm, Barry; Clark, Bradford; Horowitz, Ellis; Madachy, Ray; Shelby, Richard; Westland, Chris;
Cost Models for Future Software Lifecycle Processes: COCOMO 2.0, Annals of Software Engineering; 1995.
142 Putnam, Lawrence H; Myers, Ware; Measures for Excellence. Reliable Software On Time Within Budget, Yourdon Press Computing Series; January 1992.
143 See Chapter II.E.2.b – Requirements Based Testing (RBT) 144 Nogueira de Leon, Juan Carlos; A Formal Model for Risk Assessment in Software Projects, Naval
Postgraduate School; Monterey, California; September 2000.

92
Once hazards are identified and analyzed, they can be pictorially displayed
using Petri Nets or Fault Tree Analysis methods. These methods give the developer the
ability to graphically depict a system, mapping its flow and logic patterns based on
variable system cases states, as well as portraying the system in mathematical form.
These methods provide the ability to assign weight to the branches of the system, thereby
providing a systematic way to estimate the probability of a specific occurrence. This
concept will be applied later in the dissertation to develop a metric for assessing and
assigning the level of safety of a system.
There are still no valid metrics for measuring the probability of failure in
software. Software processes do not fail in a statistically predictable manner (e.g., mean–
time–between–failures), they fail as a result of encountering an environment, either input
or internal state (or combination) that they are not designed to accommodate. Every time
the process encounters that environment, it will fail; therefore, the statistic is a measure of
the probability of encountering that environment. If we can predict the environments that
will cause the software to fail, we can also design the software to “handle” that
environment. Attempts at measuring software failure rates are generally aimed at the
entire program. Additional research needs to be done to quantify the probability of
failure of a single function, module, or thread through software. The only software
reliability metric that has any relationship to safety is reliability trend analysis. As we see
the reliability of software improving, it gives us additional confidence (but by no means
certainty) that the number of errors in the software have been substantially reduced.
However, we still do not know if the remaining errors are in safety–critical functions
within the software.
A key part of the Software Systems Safety process is the development of safety–design requirements for the safety–related functions. The purpose of these requirements is to ensure that the safety–related software will not fail as a result of encountering certain conditions, generally failure modes or human errors. We analyze the design of these requirements to ensure that they implement the intent of the requirements vice the letter of the requirements (i.e., we want to ensure that they aren’t misinterpreted). We will also develop tests throughout the process to verify that these requirements mitigate the risks we have identified. The purpose in this is to reduce the probability of a hazardous failure in the safety related
93
functions to as close to zero as possible. We may therefore specifically design the software to fail in a non–hazardous manner (there goes our reliability). While we can never assume that the probability of a hazardous failure is zero, we can, after careful application of the software systems safety process, justify an assumption that it is acceptably low. That is a qualitative estimate but it’s the best we can do due to the nature of software.145
F. CONCLUSIONS
As systems become further reliant on software to control their operation and
prevent hazardous events, the probability of software related mishaps increase. The most
complex of systems may have no probability of hazards, while the simplest of systems
may be responsible for preventing the greatest of catastrophes. Take for instance the
software that controls and regulates the control rods of a nuclear power plant. Using
nothing more then a series of If–Then Statements, the system manipulates the control
rods up and down to establish a stable medium within the reactor core. The concept is
simple but the repercussions are Earth changing. It is essential that a metric and protocol
be developed that can identify hazards, determine their probability of occurrence, and
establish the level of safety of a software system.
Current standards and metrics try to standardize the development process into a
canned evolution of documentation and reports followed by structured coding and testing.
Software is fluid in nature and but still follows the structured rules as other disciplines of
engineering. If a bridge is too weak, you can add more structural support but that support
will add to the weight of the bridge, thereby adding a new burden to the foundation.
While today’ software is modular in nature, adding one unit to the system will directly
affect the functionality of other dependent components. While a bridge is bounded by the
limits of structural engineering, software is only bounded by logic. A standard is
required that is fluid in nature and can capture the unique aspects of software and aid in
increasing the safety of the system.
145 Brown, Michael; Personal Communications related to LCDR Chris Williamson’s Research, Naval
Postgraduate School, Monterey, California, 16 March 2004.

94
Software Safety is not the burden of the software. It is the burden of the
developer to ensure that the software is developed in a manner capable of preventing
unsafe actions.
Software Safety is not based on the organization of the development group. It is
based on the development group’s ability to identify and prevent hazards.
Software Safety is not based on a new development method, but rather the
refinement and application of existing methods of development.
A structured flow of development is essential to ensure that hazard analyses and
Software Safety is part of the development process. Safety Analysis and Identification is
critical to the success of Software Safety. A hazard must be identified before the
designer can act to mitigate it or a safety analyst can assess the probability of the hazard
causing a mishap.
This dissertation proposes a method for identifying system hazards, depicting the
process flow of the system as it relates to Software Safety, and the establishment of a
method for mathematically depicting the results of the safety analysis. The current state
of the art does not define a numeric method for determining the safety of a software
system. This dissertation uses portions of the techniques noted in this chapter to develop
a method capable of identifying, depicting, and computing the elements of Software
Safety based on the established foundation of the current state of the art.

95
G. CHAPTER ENDNOTES
1. Comparisons of Safety Definitions
DISSERTATION DICTIONARY146 INDUSTRY
Software Flaw: A specific item that detracts from the operation or effectiveness of the software system without resulting in a failure or loss of operability. A software flaw does not result in a failure. A flaw may reduce the aesthetic value of a product, but does not reduce the system’s ability to meet development requirements.
Flaw: A physical, often concealed imperfection.
Flaw: An error of commission, omission, or oversight in an information system (IS) that may allow protection mechanisms to be bypassed.147
Software Faults: An imperfection or impairment in the software system that, when triggered, will result in a failure of the system to meet design requirements. A fault is stationary and does not travel through the system.
Fault: 1. A weakness: defect. 2. A mistake: error
Fault: 1. An accidental condition that causes a functional unit to fail to perform its required function. 2. A defect that causes a reproducible or catastrophic malfunction.148
Fault: The preliminary indications that a failure may have occurred.149
Reactionary Type Faults: A fault characterized by an inability of the system’s logic to react to acceptable values of inputs, as defined in the system requirements.
Reactionary: Marked by reaction.
Reaction: 1. Response to a stimulus. 2. The state resulting from such a response.
None
146 The Merriam-Webster’s Collegiate Dictionary, Tenth Edition, Merriam Webster, Incorporated;
Springfield, Massachusetts; 1999. 147 National Information Systems Security (INFOSEC) Glossary, Rev 1, NSTISSI num. 4009; January
1999. 148 T1.523-2001 American National Standard for Telecommunications - Telecom Glossary 2000, T1A1
Technical Subcommittee on Performance and Signal Processing; Washington, D.C.; 15 December 2000.
149 NASA – STD – 8719.13A, Software Safety, NASA Technical Standard, National Aeronautics and Space Administration; 15 September 1997.
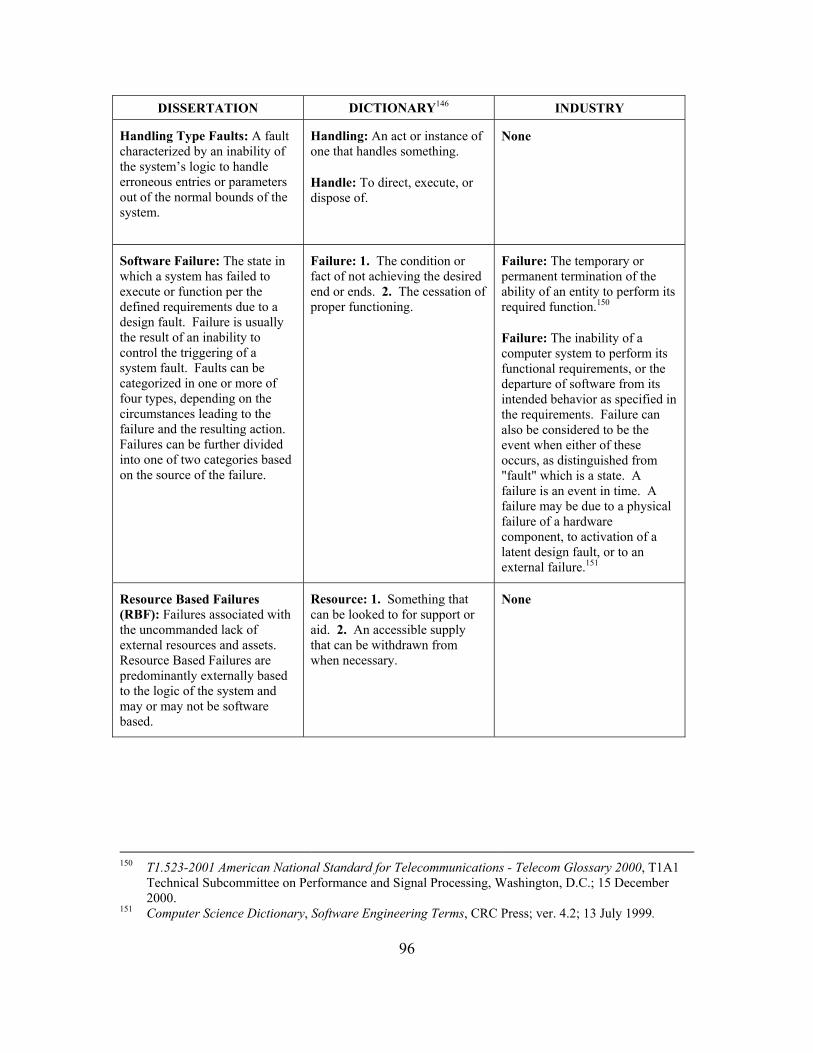
96
DISSERTATION DICTIONARY146 INDUSTRY
Handling Type Faults: A fault characterized by an inability of the system’s logic to handle erroneous entries or parameters out of the normal bounds of the system.
Handling: An act or instance of one that handles something.
Handle: To direct, execute, or dispose of.
None
Software Failure: The state in which a system has failed to execute or function per the defined requirements due to a design fault. Failure is usually the result of an inability to control the triggering of a system fault. Faults can be categorized in one or more of four types, depending on the circumstances leading to the failure and the resulting action. Failures can be further divided into one of two categories based on the source of the failure.
Failure: 1. The condition or fact of not achieving the desired end or ends. 2. The cessation of proper functioning.
Failure: The temporary or permanent termination of the ability of an entity to perform its required function.150
Failure: The inability of a computer system to perform its functional requirements, or the departure of software from its intended behavior as specified in the requirements. Failure can also be considered to be the event when either of these occurs, as distinguished from "fault" which is a state. A failure is an event in time. A failure may be due to a physical failure of a hardware component, to activation of a latent design fault, or to an external failure.151
Resource Based Failures (RBF): Failures associated with the uncommanded lack of external resources and assets. Resource Based Failures are predominantly externally based to the logic of the system and may or may not be software based.
Resource: 1. Something that can be looked to for support or aid. 2. An accessible supply that can be withdrawn from when necessary.
None
150 T1.523-2001 American National Standard for Telecommunications - Telecom Glossary 2000, T1A1
Technical Subcommittee on Performance and Signal Processing, Washington, D.C.; 15 December 2000.
151 Computer Science Dictionary, Software Engineering Terms, CRC Press; ver. 4.2; 13 July 1999.
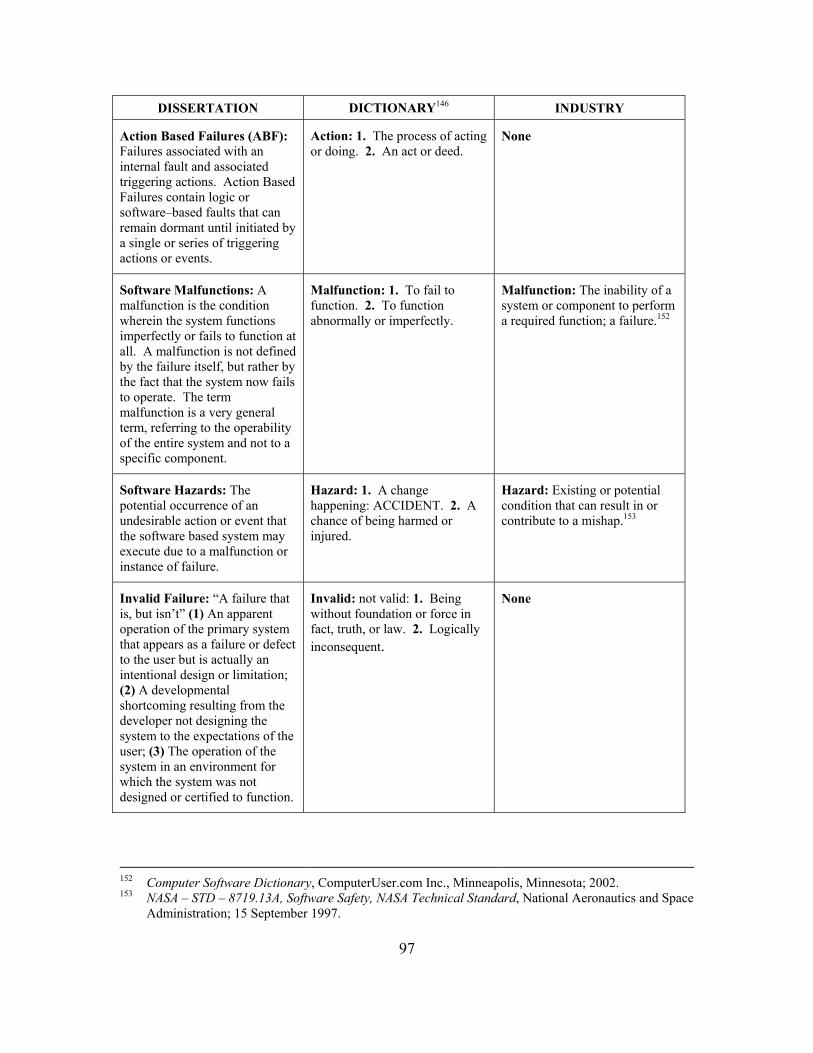
97
DISSERTATION DICTIONARY146 INDUSTRY
Action Based Failures (ABF): Failures associated with an internal fault and associated triggering actions. Action Based Failures contain logic or software–based faults that can remain dormant until initiated by a single or series of triggering actions or events.
Action: 1. The process of acting or doing. 2. An act or deed.
None
Software Malfunctions: A malfunction is the condition wherein the system functions imperfectly or fails to function at all. A malfunction is not defined by the failure itself, but rather by the fact that the system now fails to operate. The term malfunction is a very general term, referring to the operability of the entire system and not to a specific component.
Malfunction: 1. To fail to function. 2. To function abnormally or imperfectly.
Malfunction: The inability of a system or component to perform a required function; a failure.152
Software Hazards: The potential occurrence of an undesirable action or event that the software based system may execute due to a malfunction or instance of failure.
Hazard: 1. A change happening: ACCIDENT. 2. A chance of being harmed or injured.
Hazard: Existing or potential condition that can result in or contribute to a mishap.153
Invalid Failure: “A failure that is, but isn’t” (1) An apparent operation of the primary system that appears as a failure or defect to the user but is actually an intentional design or limitation; (2) A developmental shortcoming resulting from the developer not designing the system to the expectations of the user; (3) The operation of the system in an environment for which the system was not designed or certified to function.
Invalid: not valid: 1. Being without foundation or force in fact, truth, or law. 2. Logically inconsequent.
None
152 Computer Software Dictionary, ComputerUser.com Inc., Minneapolis, Minnesota; 2002. 153 NASA – STD – 8719.13A, Software Safety, NASA Technical Standard, National Aeronautics and Space
Administration; 15 September 1997.
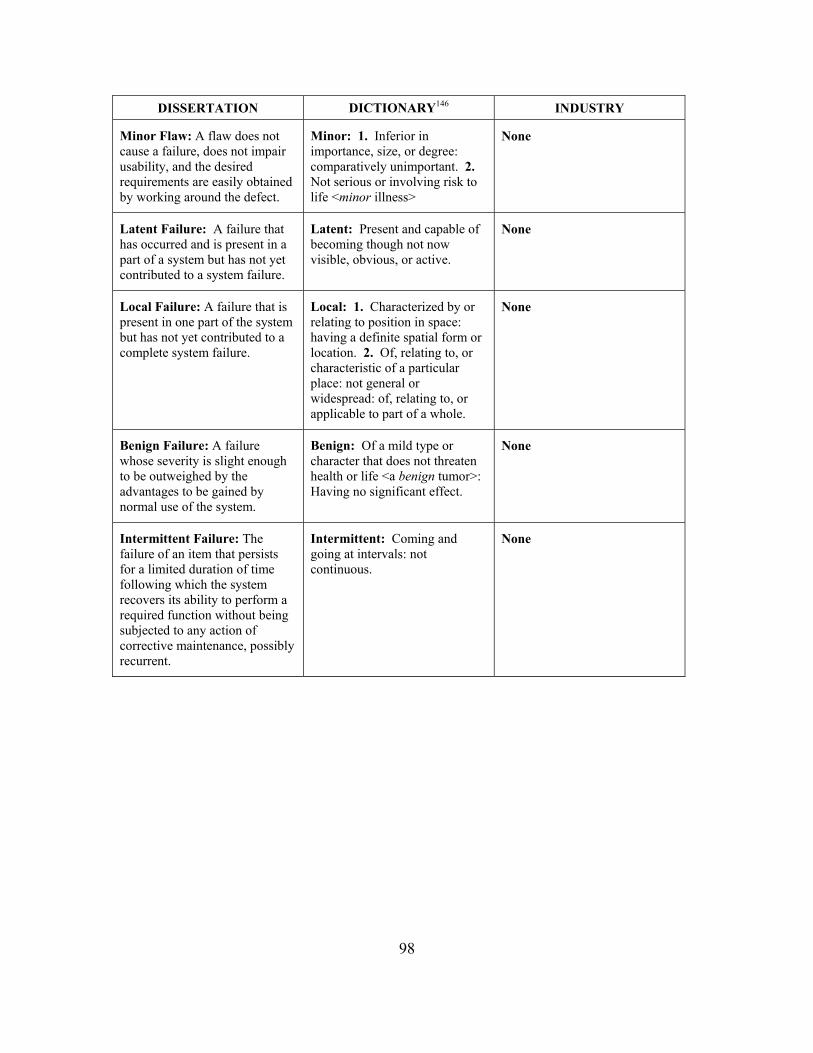
98
DISSERTATION DICTIONARY146 INDUSTRY
Minor Flaw: A flaw does not cause a failure, does not impair usability, and the desired requirements are easily obtained by working around the defect.
Minor: 1. Inferior in importance, size, or degree: comparatively unimportant. 2. Not serious or involving risk to life <minor illness>
None
Latent Failure: A failure that has occurred and is present in a part of a system but has not yet contributed to a system failure.
Latent: Present and capable of becoming though not now visible, obvious, or active.
None
Local Failure: A failure that is present in one part of the system but has not yet contributed to a complete system failure.
Local: 1. Characterized by or relating to position in space: having a definite spatial form or location. 2. Of, relating to, or characteristic of a particular place: not general or widespread: of, relating to, or applicable to part of a whole.
None
Benign Failure: A failure whose severity is slight enough to be outweighed by the advantages to be gained by normal use of the system.
Benign: Of a mild type or character that does not threaten health or life <a benign tumor>: Having no significant effect.
None
Intermittent Failure: The failure of an item that persists for a limited duration of time following which the system recovers its ability to perform a required function without being subjected to any action of corrective maintenance, possibly recurrent.
Intermittent: Coming and going at intervals: not continuous.
None

99
DISSERTATION DICTIONARY146 INDUSTRY
Partial Failure: The failure of one or more modules of the system, or the system’s inability to accomplish one or more system requirements while the rest of the system remains operable.
Partial: Of or relating to a part rather than the whole: not general or total.
None
Complete Failure: A failure that results in the system’s inability to perform any required functions, also referred to in military and aviation circles as “Hard Down.” Aviators and military members refer to a system that is completely broken and requires extensive repair as “Hard Down”, while a working system is referred to as “Up”:
Complete: 1. Brought to an end as concluded <a complete period of time> 2. Fully carried out as thorough or total and absolute <complete silence>
Complete failure: A failure that results in the inability of an item to perform all required functions.154
Cataclysmic Failure: A sudden failure that results in a complete inability to perform all required functions of an item, referring both to the rate in which the system failed, and to the severity degree of the Mishap that resulted from the failure.
Cataclysmic: A momentous and violent event marked by overwhelming upheaval and demolition; broadly: an event that brings great changes.
As Catastrophic failure: A sudden failure that results in a complete inability to perform all required functions of an item.155
154 Nesi, P.; Computer Science Dictionary, Software Engineering Terms, CRC Press; 13 July 1999,
http://hpcn.dsi.unifi.it/~dictionary. 155 Nesi, P.; Computer Science Dictionary, Software Engineering Terms, CRC Press; 13 July 1999,
http://hpcn.dsi.unifi.it/~dictionary.

100
THIS PAGE INTENTIONALLY LEFT BLANK
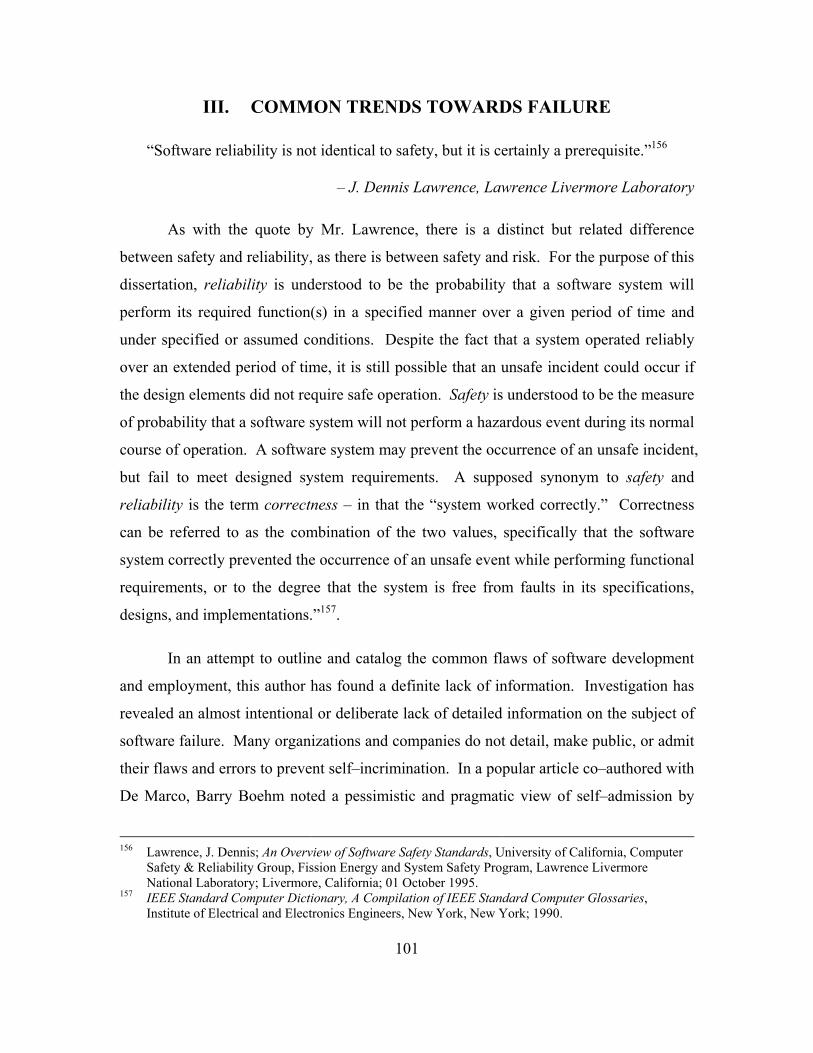
101
III. COMMON TRENDS TOWARDS FAILURE
“Software reliability is not identical to safety, but it is certainly a prerequisite.”156
– J. Dennis Lawrence, Lawrence Livermore Laboratory As with the quote by Mr. Lawrence, there is a distinct but related difference
between safety and reliability, as there is between safety and risk. For the purpose of this
dissertation, reliability is understood to be the probability that a software system will
perform its required function(s) in a specified manner over a given period of time and
under specified or assumed conditions. Despite the fact that a system operated reliably
over an extended period of time, it is still possible that an unsafe incident could occur if
the design elements did not require safe operation. Safety is understood to be the measure
of probability that a software system will not perform a hazardous event during its normal
course of operation. A software system may prevent the occurrence of an unsafe incident,
but fail to meet designed system requirements. A supposed synonym to safety and
reliability is the term correctness – in that the “system worked correctly.” Correctness
can be referred to as the combination of the two values, specifically that the software
system correctly prevented the occurrence of an unsafe event while performing functional
requirements, or to the degree that the system is free from faults in its specifications,
designs, and implementations.”157.
In an attempt to outline and catalog the common flaws of software development
and employment, this author has found a definite lack of information. Investigation has
revealed an almost intentional or deliberate lack of detailed information on the subject of
software failure. Many organizations and companies do not detail, make public, or admit
their flaws and errors to prevent self–incrimination. In a popular article co–authored with
De Marco, Barry Boehm noted a pessimistic and pragmatic view of self–admission by
156 Lawrence, J. Dennis; An Overview of Software Safety Standards, University of California, Computer
Safety & Reliability Group, Fission Energy and System Safety Program, Lawrence Livermore National Laboratory; Livermore, California; 01 October 1995.
157 IEEE Standard Computer Dictionary, A Compilation of IEEE Standard Computer Glossaries, Institute of Electrical and Electronics Engineers, New York, New York; 1990.

102
stating, "doing software risk management makes good sense, but talking about it can
expose you to legal liabilities. If a software product fails, the existence of a formal risk
plan that acknowledges the possibility of such a failure could complicate and even
compromise the producer's legal position."158
Previously, much of the information about software failure existed only as
investigative reports in the press or in technical reviews about high–profile failures.
Many of these reports critiqued and postulated based on the limited facts of the failures.
NASA, as a public entity, is required by its charter to report to the American public of its
success as well as its failures. In keeping with this charter, NASA recently has taken
advantage of the Internet to electronically post all of its proceedings regarding the recent
failure of the Mars Explorer Missions. This incident has made available a wealth of
knowledge regarding software failure and safety in the government sector. It should be
noted that most of the findings of private sector failures are based on second and third
party sources, with the exception of those facts directly revealed as legal testimony in a
judicial prosecution. This chapter will outline some of the key elements that lead to
Software Safety failure, based on the limited facts available.
The development of High Assurance Systems requires a dedicated System Safety
process. Software Safety is then compromised whenever the system is developed using
unrefined processes, without sufficient supervision, and without a dedicated test and
certification plan. Safety is further compromised when the technology lacks the ability to
control or prevent a hazardous event. A paper released over a decade ago critical of
Software Safety still applies, stating that, “Traditionally, Engineers have approached
software if it were an art form. Each programmer has been allowed to have his own style.
Criticisms of software structure, clarity, and documentation were dismissed as ‘matters of
taste.’ In the past, engineers were rarely asked to examine a software product and certify
that it would be trustworthy. Even in systems that were required to be trustworthy and
reliable, software was often regarded as an unimportant component, not requiring special
158 Boehm, B; De Marco, T; Software Risk Management, IEEE Software, Institute of Electrical and
Electronics Engineers, Inc.; May-June, 1997.

103
examination. In recent years, however, manufacturers of a wide variety of equipment
have been substituting computers controlled by software for a wide variety of more
conventional products. We can no longer treat software as if it were trivial and
unimportant. In the older areas of engineering, safety–critical components are inspected
and reviewed to assure the design is consistent with the safety requirements… In safety–
critical applications we must reject the 'software–as–art–form' approach.”159 Software
Safety is not benefited by aesthetic quality but rather by functionality, completeness, and
reliability.
After a review of available material, much of it sensitive, it is evident that there
are repetitive triggers that contribute to the failure of software systems and the production
of unsafe events. These triggers can occur in either or both of the design or
implementation stage of a software system’s lifecycle. The causes of Software Failure
can be generalized into three basic categories:
• That software fails because it is used outside of its developed limits as
established by system requirements,
• That software was developed incorrectly in violation of system
development requirements, or
• That system requirements were flawed and failed to prevent software
failures.
In many cases, system failures were left undiscovered because the software was
not sufficiently tested. Each of these categories can be further decomposed into
subcategories that detail the specific causes of software failure. In some cases, the
symptoms of failure cross over multiple categories and subcategories due to the
complexity of the system or failures in design. Software failure and safety violation
subcategories include:
159 Parnes, David Lorge; Education of Computing Professionals, IEEE Computer, vol. 23, num. 1, pg. 17-
22, Institute of Electrical and Electronics Engineers, Inc.; January 1990.

104
• Incomplete and Incompatible Software Requirements • The Lack of System Requirements Understanding • Completeness
• Software Developed Incorrectly • Effects of Political Pressure on Development • The Lack of System Understanding • The Inability to Develop • Failures in Leadership in Development • Development with a Lack of Resources
• Implementation Induced Failures • Software Used Outside of its Limits • Over Reliance on the Software System
• Software Not Properly Tested • Limited Testing Due to a Lack of Resources • Software Not Fully Tested Due to a Lack of Developmental
Knowledge • Software Not Tested and Assumed to be Safe
Table 4 Software Failure Cause and Effects
A. INCOMPLETE AND INCOMPATIBLE SOFTWARE REQUIREMENTS
Despite the best of intentions and highest standard of software development
practices, the existence of improper or incomplete system requirements creates as
fruitless a development environment as one that has incapable developers. The
development process is founded on the bedrock established by system requirements. Any
crack or fissure within that foundation could potentially result in the failure of the system
to prevent an unsafe event.
1. The Lack of System Requirements Understanding
When developers fail to understand the proper intended purpose of a system that
they are designing, it is possible that system requirements may become incomplete and
not provide critical functionality. It is essential that the requirements cover both the
obvious as well as obscure functional needs of the system. To ensure that even the most

105
obscure requirement receives proper consideration, the design team must clearly
understand all possible idiosyncrasies of the system.
The design of a system requires the thorough understanding of the developers to
the system’s intended functionality. If a developer might overlook requirements that the
user would intend to exist, then the lack of functionality would be tantamount to a
programming fault. Where the user might expect a specific reaction from the system in
response to an action, the loss of implied functionality might result in any of a series of
unanticipated results.
Software Safety is reliant on the system functioning within the bounds and
limitations established by the requirements, assuming that the requirements incorporate
adequate safety criteria and accurately depict the proper functioning of the system. It is
essential to ensure that requirements correctly reflect the needs of the system as well as
the anticipated functionality and bounds expected by the user. Chapter V.E.1 of this
dissertation will present a method for graphically depicting the process flow of the
system which can then be reviewed by users and developers to ensure that critical
functions are well understood and agreed upon early in the development process.
2. Completeness Software functional testing is usually based upon compliance with established
system development requirements. In cases where the requirements are incomplete or
have holes that could result in unknown functional events, then the reliability and safety
of the system is called into question. It should be possible to trace a software process
from start to finish; identifying each of the decisions, actions, and interrupts that the
process may encounter. It should also be possible to trace the requirements of a system
through the entire function of the system, from each expected action and reaction to meet
the functional requirements of the system. Failing to trace the functional requirements
and ensure validity and inclusiveness can result in a system that is incomplete and prone
to developmental failure.

106
As with a circle, each point on the curve is required to complete the figure,
looping a line back around onto itself – from start to finish. This dissertation presents a
pictorial process that permits the depiction and assessment of system requirements, as
they apply to system safety, to trace the system process from start to functional
completeness.
B. SOFTWARE DEVELOPED INCORRECTLY
Many software failures are directly related to the way in which the software
system is developed. The environment, methodology, and skill of the developer all factor
to determine the ability of the system to prevent failure and the occurrence of a hazardous
event. Additionally, the interaction between the developer and the user and between the
developer and the domain experts compliment the ability of the system to prevent failures
and hazardous events. It has been noted on countless occasions that it costs more to
develop a product that fails than it does to develop new theories, test them by experiment
and peer review, and then to develop designs based in these theories.160 The cost of
failed development includes the extra costs of redevelopment, repair, and compensation
for items damaged due to system failure.
1. Political Pressure While the Challenger Space Shuttle Disaster of January 28th, 1986 was initially
blamed on the design and use of the solid rocket boosters (SRB), further investigation
revealed a trail of software errors that failed to prevent the mishap. During pre–launch
workups, a decision was made to remove a key set of booster rocket sensors and replace
them with a less functional set due to their cost, time for development, and the
“importance of the mission”. It was later revealed "there was a decision along the way to
economize on the sensors and on their computer interpretation by removing the sensors
on the booster rockets. There is speculation that those sensors might have permitted
earlier detection of the booster–rocket failure, and possible early separation of the shuttle,
160 Hoare, C A R; Algebra and Models, SIGSOFT'93 Proc of the 1st ACM SIGSOFT Symposium on the
Foundations of Software Engineering; 1993.

107
consequently saving the astronauts. Other shortcuts were also taken so that the team
could adhere to an accelerated launch sequence."161 The Chicago Tribune later reported,
"…that poor organization of shuttle operations led to such chronic problems as crucial
mission software arrived just before shuttle launches and the constant cannibalization of
orbiters for spare parts." Political pressure, media relations, and NASA desire to
stimulate public confidence in the space agency resulted in NASA executives making
emotional judgments on critical decision points. The compressed launch window, public
affairs campaign, and attempt to put the first civilian into space (a schoolteacher)
distorted the decision making process and resulted in the modification and removal of
critical software components. While these sensors might not have prevented the breakup
of the SRB, they could have given the crew sufficient time to react to the failure and
prevent the loss of the Space Shuttle and lives of its seven astronauts.
Political pressuring, infighting, empire building, and self–agendas all jeopardize
the success of Software Development.
Engineering is not a science that can succeed through impulsive emotions or
through compelled deduction.
Engineering requires mental stimulation, bounded within the resources of
development, constrained by the ability to certify what is created. Software Development
is no different then any other field of engineering, in that it can be distorted by the
external pressures of those who portray a desire for success but actually are self–serving
in the outcome. External pressures add a component to the development process that
falls outside the confines of metrics by adding a variable of human emotion. This
variable results in a component that is not designed using acceptable methodologies, to a
realistic timeline, or resourced sufficiently; eventually resulting in a system devoid of
safety and a threat to the public.
161 Neumann, Peter G.; Computer Related Risks, Addison-Wesley Publishing; 1995.
108
The Navy’s first “Smart Ship” Yorktown has been a direct consequence of the ills
of political pressure. The highly publicized software failures of the ship have been
directly attributed to decisions and coercions made outside of the development effort.
Military leaders insisted that the ship deploy to meet specified timetables, regardless of
the objections of senior developers. The ship prematurely set sail with inadequate
operating systems and flawed program logic, both chosen and developed under immense
political pressure. After an embarrassing failure in which the Yorktown was rendered
dead in the water, the Deputy Technical Director of the Fleet Introduction Division of the
Aegis Program Executive Office, stated that, “Because of politics, some things are being
forced on us that without political pressure we might not do…”162, 163
2. The Lack of System Understanding Professionals have cynically written of the relationship between Software
Engineers and customers, stating that, "Either I have to learn enough about what the users
do to be able to tell them what they want, or they have to learn enough about computers
to tell me."164
Today’s software systems are required to be more advanced and sophisticated to
keep up with the demands and complexities of our modern society. These complexities
lead to a breed of software tailored around specialized requirements and unique logic.
Software systems have advanced from the basic single purpose systems to the seemingly
unbounded application of today’s systems. These advances have required new forms and
tools for development, new languages and compilers, and an increased knowledge of
system operation. When developers do not understand how a system is to function, how
the development tools are integrated or utilized, or understand the limits and logic of the
requirements, the system is destined for defect and failure. John Whitehouse was quoted,
regarding the certification of Software Engineers, that, “It is my contention that the vast
162 Slabodkin, Gregory, Software Glitches Leave Navy Smart Ship Dead In The Water, Government
Computer News, Government News; July 13, 1998. 163 See APPENDIX B.5 -
USS YORKTOWN FAILURE.

109
majority of software defects are the product of people who lack understanding of what
they are doing. These defects present a risk to the public..."165 A failure to understand the
system being designed is a direct hazard to Software Safety.
On March 28th, 1979, the Three Mile Island nuclear power plant experienced a
blockage in one of the feed pipes of the reactor cooling system. With the feed pipe
blocked, the fuel rods within the reactor core began to increase in temperature from their
normal operating limit of 600° to well over 4000°. The thermocouples used to measure
the reactor core temperature were limited to only 700°. Above that limit, the instruments
were programmed to return a string of question marks in place of the numerical value of
the temperature. The reactor system responded correctly by securing turbine operation
when the temperature rose above its assigned limit. The safety breakdown occurred
when controllers failed to realize the extent of the temperature gain and that it would
soon result in a melt down of the nuclear material if it were not controlled. The
developers did not realized nor plan for their thermocouples to track temperatures above
that 700° mark due to their lack of understanding of nuclear reactor cores and their
method of incorporation. The initial trigger of the incident was a human securing the
wrong valve. The mishap occurred when the safety system failed to protect the reactor
because the developer did not comprehend the system’s requirements.166
System requirements are not derived arbitrarily.167
They do not exist in a vacuum but rather in the open environment with an infinite
number of possible stimulations and limitations. “Software development usually begins
with an attempt to recognize and understand the user's requirements… Software
164 Williams, Marian G.; Begg, Vivienne; Translation between Software Designers & Users, Comm ACM,
vol. 36, num. 4, pg. 102-103; June 1993. 165 Whitehouse, John H.; Message regarding Certifying Software Professionals, ACM SIGSOFT SEN
vol. 16, num. 1, pg. 25; January 1991. 166 Neumann, Peter G.; Computer Related Risks, Addison-Wesley Publishing; 1995. 167 Berzins, Valdis; Luqi; Yehudai, Amiram; Using Transformations in Specification-Based Prototyping,
IEEE Transcript on Software Engineering, vol. 19, num 5, pg. 436-452, Institute of Electrical and Electronics Engineers, Inc.; May 1993..

110
developers are always forced to make assumptions about the user's requirements…”168
Often the user, and in many cases the developer, has an incomplete understanding of how
the system should function or how to develop that functionality. The safety of a software
system can be directly related to the level of understanding that the developer has of the
product being designed. His understanding of requirements and functionality apply to the
structure and completeness of the system. Failing to grasp such an understanding results
in a system with holes, flaws, and inherent weaknesses. When developers are
experienced with and knowledgeable about the technology to be developed, the potential
for hazard avoidance is significantly increased.
In November of 2000, Raytheon was forced to explain to the Department of
Defense why it was over a year behind schedule producing an upgraded radio
communications system for the Northrop Grumman B–2 Stealth Bomber.169 As the
number three U.S. defense contractor and renowned for its ability to produce high–
quality communications electronics, Raytheon was awarded a contract to outfit 21 Air
Force bombers with a new suite of radios. These radios would allow B–2 crews to
receive improved voice, imagery, and targeting data via un–jammable UHF and VHF
satellite links. The contract was awarded with the understanding that Raytheon would
produce the equipment with little development, instead only improving on the existing
system base. During the development, Raytheon made numerous changes to the software
design without completely understanding the ramifications and functions of the system or
reliant subsystems. Despite Raytheon’s previous success, the development process was
more difficult and time–consuming than they had forecast. Raytheon continued to
attempt to develop the replacement system, rescheduled for delivery by June 2001. Due
to the overrun and continued research and development, Raytheon will absorb over $11.2
million in cost overruns.
168 Tsai, Jeffrey J P; Weigert, Thomas; Jang, Hung-chin; A Hybrid Knowledge Representation as a Basis
of Requirement Specification and Specification Analysis, IEEE Transcript on Software Engineering, vol. 19, num. 12, pg. 1076-1100, Institute of Electrical and Electronics Engineers, Inc.; December 1992.
169 Capaccio, Tony; Raytheon Late, Over Cost in Delivering Radios for B-2, Bloomberg.com; 28 November 2000.

111
3. The Inability to Develop Safety-based software development is the combined function of applied
mathematics, logic and reasoning, resource management, science, artistry, aesthetics (See
Figure 9). In its nature, the true development of software is an engineering discipline.
That discipline is built upon a foundation of proven principles and methods that, when
properly applied, give some measure of protection and security to the development
process. No principle or method is infallible or guarantees perfection, but what they do
provide is guidance and structure compounded upon from previous experience. Today’s
software systems fail to benefit from historical experience when developers do not utilize,
or lack the ability to utilize, such proven methods.
Figure 9 The Composite Pallet of Software Engineering
Leveson & Turner wrote in their analysis and summary of the Therac–25
accidents that, “The mistakes that were made are not unique to this manufacturer but are,
unfortunately, fairly common in other safety–critical systems… It is still a common
belief that any good engineer can build software, regardless of whether he or she is
trained in state–of–the–art software–engineering procedures.”170 Developing software is
170 Leveson, Nancy G.; Turner, Clark S.; An Investigation of the Therac-25 Accidents, IEEE Computer
Magazine, vol. 26 num 7 pg. 18-41, Institute of Electrical and Electronics Engineers, Inc.; July 1993.
Applied Mathematics
Logic & Reasoning
Resource Management
Science
Artistry
Aesthetics
Software Engineering
112
not a cookie cutter process where one can go from concept, to keyboard, to code and
expect a product without the risk of failure.
Safety–critical software demands the developer to utilize methods and procedures
that are designed with hazard prevention in mind. Such methods were introduced and
reviewed in Chapter II.E of this dissertation. Due to the complexities and non–intuitive
nature of some methods, their incorporation may be beyond the level of novice
developers and are easily overlooked. Some methods were noted for their lack of
specific instruction on how to prevent unsafe events through development; rather, these
methods focused on the philosophy of prevention through development practices tailored
to specific systems. As noted in the review of predominant safety standards, many lacked
a specific methodology for determining the safety of the system, leaving the
determination and process to the discretion of the developer.
A system’s safety is directly related to the developer’s ability to influence his
design through the application of these safety philosophies. Historically, a predominant
number of software failures can be correlated to a procedural failure to follow accredited
methods. This dissertation introduces a method that is not only intuitive to the developer,
but is also simplistic and straight forward in its approach. While previous methods
expounded on the philosophy of Software Safety, this dissertation outlines a procedure
and process for improving Software Safety through standardized assessment and
identification of the system process and hazards.
4. Failures in Leadership = Failures in Software When a system begins to show signs of failure even before the development is
complete, the design team is forced to shift from Software Engineers to firefighters. An
organization that is “fire fighting” has no ability or resources to actually fix system
failures while continuing to maintain their original pace of development. It becomes
management’s responsibility to intervene and budget resources accordingly to prevent the
entire project from collapsing in upon itself. Each member of the development team
must have the ability to rely on centralized project leadership to ensure that control is
kept on the development of the system. This control is to guarantee that one member’s

113
success is not jeopardized by the failure of another member of the team. In the case of
“fire fighting,” members need to be able to rely on leadership to guide the project through
failure resolution and back into production. Leadership has to ensure compliance to the
philosophies of Software Safety.
Software Engineering is the delicate balance of numerous disciplines that
combine intangible ideas into a tangible product. It becomes the project leadership’s task
to find equilibrium between these disciplines to ensure that a gross amount of effort is not
put towards one theme at the cost of another. Evidence of such mismanagement can be
found in systems that have an aesthetically pleasing user interface, yet lack the logic to
control user inputs to generate an appropriate output.
Management is forced to make a number of difficult decisions through the process
of development. One of those decisions includes the release of a software system before
all of the bugs have been detected and corrected. Leadership must decide when enough
testing has been accomplished and that any remaining bugs that could be discovered are
not significant as to cause an unsafe event. Leadership can be swayed by misinformation
and pressure to release a product before it is complete. They may be worried that a
competitor will beat them to market, that they will be penalized for delivering a product
past deadline, or that other members of the team will be transferred, retired, or seek
employment on other projects before completion. When project leadership lacks the
tenacity or drive to direct system development, the software project will fail to reach
completeness in terms of functionality or safety.
Management can inspire, structure, and encourage great things from
developers.171 Management can not treat the development of software like the making of
a device on an assembly line172 rather it must be treated with the proper care required to
inspire intellectual thought. A poor manager may lack leadership skills and berate his
171 Brady, Sheila; DeMarco, Tom; Management Aided Software Engineering, IEEE Software Magazine,
vol. 11, num. 6, pg. 25-32, Institute of Electrical and Electronics Engineers, Inc.; November 1994. 172 Raccoon, L B S; The Complexity Gap, ACM SIGSOFT, Software Engineering Notes, vol. 20, num. 3,
pg. 37-44; July 95.

114
developers by accusing them with, “Problems? We do not have problems here. We do
not need principles or process or tools. All we need is for you to find a way to make your
people work harder and with more devotion to the company.” 173 At such point,
management becomes part of the problem – lacking leadership, lacking guidance, the
project founders, and eventually fails. If it is released at all, the effort required to correct
development errors brought on by such a period can potentially destroy all aspects of
profitability, without providing any of the necessary system safety assurance.
5. Building With One Less Brick – Resources Despite their differences in appearance, Software Engineering is not unlike other
engineering disciplines in their requirement for developmental and operational resources.
The requirement phase of development should outline required resources before actual
system production commences. Resources should include, but not be limited to: budget,
schedule, personnel, hardware, software, operating system, development and testing
tools, and a medium for employing the final product. System development and operation
falters or loses its momentum when resources are not adequately identified or provided.
This loss of momentum consequently jeopardizes system safety as resources are
reallocated from one process to the next in a desperate attempt to keep the system
productive. System operation crashes when operational resources are removed or limited
beyond the level required for functionality.
A recent Monterey Workshop emphasized the essential requirement for sufficient
resources, stating that, “The demand for software has grown far faster then the resources
we have to produce it. The result is that desperately needed software is not being
developed. Furthermore, the nation needs software that is far more stable, reliable, and
powerful then what is being produced today.”174 Today’s software systems stress greater
demands on system resources by their requirements for specialized operating systems,
memory access, and communication media. Resources are not static, but should be
173 Royce, Winston; Why Industry Often Says 'No Thanks' to Research, IEEE Software Magazine, vol. 9,
num. 6, pg. 97-99, Institute of Electrical and Electronics Engineers, Inc.; November 1992.

115
evaluated as dynamic in that they change and grow with the system, can be refined and
reduced as the system becomes more efficient, or expands as the system matures.
Software safety requires a sufficient reserve of system resources during development and
operation or will risk failure when the system surges. These resources must be available
through the entire lifecycle of the product, from concept to disposal.
NASA suffered a domino effect of failures during their attempts to visit the planet
Mars at the end of the Twentieth Century. The Mars Planetary Projects were some of the
first to be developed under the new “Faster, Better, Cheaper” format. Through the
postmortem investigation, the NASA Inspector General admitted that FBC lacked the
conventional safeguards and management process that protected previous systems. The
result was a series of software and hardware systems that were not developed or tested to
the level required for deep space flight, stating that, “...missions completed using FBC are
outside the strategic management and planning process, and progress toward achieving
FBC cannot be measured or reported... NASA has not adequately incorporated strategic
human resources management into the Agency's strategic or performance plans. Hence,
NASA has not determined the appropriate number of staff or competencies needed to
effectively carry out its strategic goals and objectives for its programs, most notably the
FBC Mars Program, and may lose core competencies.” 175 NASA had redirected
monetary and personnel resources from other projects to investigate and repair the Mars
program after the loss of the MSP and MCO, resulting in shortfalls in development of the
follow on and subsequent failure of the MPL.176 Reliability, and consequently safety,
cannot be assured when developers lack the resources required to produce and operate
safety–critical software systems.
174 Proceedings of the 2000 Monterey Workshop on Modeling Software System Structures in a Fast
Moving Scenario, Santa Margherita Ligure, Italy; June 2000. 175 NASA, Office of the Inspector General, Faster, Better, Cheaper: Policy, Strategic Planning, and
Human Resource Alignment Report Number IG-01-009, National Aeronautics and Space Administration; 13 March 2001.

116
C. IMPLEMENTATION INDUCED FAILURES
The most likely time that a Software System could result in an unsafe incident is
during its implementation or execution phase. While a Software System is in the
development phase, failures are contained and systems are rarely coupled with the
material required to cause a hazardous event. Once the system is taken out of the
production environment and distributed, it is then matched with the components and
substances that it is designed to control. The same failure that was a benign event in the
laboratory now becomes a critical event with direct exposure to the public.
1. Software Used Outside of Its Limits Many software systems are developed “near–flawless” in their initial release.
This initial release is likely based on a first generation set of requirements which may not
take into consideration all of the intricate facets of the potential software system. These
requirements, when satisfied, result in an initially “acceptable product”. As long as the
product is used in the same fashion for which it was initially developed and certified, it
should continue to function as per the system development requirements. It is when the
system is pushed beyond the intended functional envelope or incorporated into a
subsystem for which it was not designed; that the system begins to function improperly
with higher frequency and eventually fails.
When requirements are not fully investigated to cover all potential uses of the
system, when the system is not constrained to operate within the defined requirements, or
when the system is forced to operate outside of the intended scope of the design, no
certification can be given for the successful operation of the system. Users may make
general assumptions of the system’s operational limits on their experience with previous
systems.
176 Project Management in NASA by the Mars Climate Orbiter Mishap Investigation Board Report,
National Aeronautics and Space Administration and Jet Propulsion Laboratory; Washington D.C.; 28 March 2000.

117
Testing may not reveal all of the potential hazards of the system’s operational
scope as most testing methods are designed to ensure requirement satisfaction. Testing
must be conducted to the negative satisfaction of requirements, in that a system’s
operational test is conducted to determine what would happen should the software
function outside of its limits or if that limit is capable of being exceeded.
Such failures can be directly attributed to shortcomings in the software system’s
requirements. Had the requirements been developed to properly constrain the system the
potential for such a failure would be reduced. Documentation should include the proper
limits of system’s operation as well as the controls that ensure these limits. Should a
hazard result if a system were to be used outside of its limitations, documentation should
include the potential effects. Today’s systems may not include such dire predictions, as
the developer may fear such revelations might deter the marketing effort.
Take for example the Patriot Missile Defense Failure that left 28 U.S. military
members dead and another 98 wounded when the system failed to track and intercept an
incoming Iraqi Scud Missile.177 The Patriot Missile system was initially designed as a
Surface to Air Missile (SAM) intended to intercept and destroy sub and super–sonic
aircraft. In 1990–1991, during Operation Desert Storm, the U.S. military deployed the
Patriot as an Anti–Missile Defense shield to counter the ballistic missile threat of the
Iraqi Scud Missile. In addition to the Patriot being initially designed to track and destroy
targets within the profile of an aircraft, it was also intended to be online only
momentarily to engage such a target. During the Gulf War, the deployed Patriot Batteries
were left online continuously to be ready to strike at any incoming target.
Investigation later revealed that the speed of the incoming Scud missiles,
ballistically falling at over mach 6, compounded with a system induced mathematically
rounding error resulted in an inability for the Patriot to engage Scud targets. For each
moment the system was left online, the rounding error increased the system’s bias outside
177 See: APPENDIX B.4 –
PATRIOT MISSILE FAILS TO ENGAGE SCUD MISSILES IN DHAHRAN

118
the targeting tolerance. By the end of the Gulf War, the Patriot’s success rate was less
then 9%. On February 25th 1991, one such Iraqi Scud Missile penetrated the Patriot
Missile shield and detonated on a military barrack in Dhahran, Saudi Arabia resulting in
the greatest loss of human life from a single event during the conflict.
When the Patriot system was deployed as an Anti–Missile Defense shield, the
context of the deployment was different then that for which the system was tested and
certified. The set of potential hazards increased by the addition of new threats that the
system was to protect against, namely the protection of allied service members against a
missile threat. The consequence of the potential hazards ranged from minor damage from
falling debris to a direct missile strike. Previously identified anti–aircraft missile defense
threats can be included from previous assessments. The triggers that could induce a
system failure already existed in the system prior to its employment but went
undiscovered. In the new context for which the system was employed, the probability
that an existing trigger could induce a failure increased with each minute the system was
left on line.
During the system development requirement phase, a software system’s
requirements might include:
• Assumptions about the system’s environment,
• Functional capabilities required to control the system,
• Algorithms or mathematical logic required to control the system,
• Operating limitations or acceptable envelopes for operation,
• Internal software tests and checks,
• Error and interrupt handling,
• Fault detection, tolerance, and recovery characteristics,
• Safety requirements, and
• Timing and memory requirements.
When a system is pushed beyond the limits for which it was initially designed, its
reactions can become unpredictable, chaotic, and even dangerous. Algorithms and logic

119
that relied on predetermined baselines and limits are now faced with stimuli outside of
the bounds for which they were developed. System tests and checks may fail outright
and render the system inoperable, despite what the user may feel is a normal operating
regime. Error handlers may be bypassed and overridden. Memory may fail and safety
restraints may become ineffective.
On December 31, 1999, the world sat and waited for what may be called the
greatest computer-induced disaster in the world as clocks rolled over to the new
millennium. Hundreds of thousands of computer systems performed computations based
on a two–digit year format and were potentially unable to comprehend the change from
1999 to 2000 to equate to one year. Many systems were designed with the intent to
function for only a short number of years, expiring well before the end of the century.
Evidently these systems outlived their projected lives and now forced the user to either
test the system for the “Y2K Bug”, have faith that the system would not fail on New
Year’s Day, or purchase a new product that would be developed in a compatible format.
The Millennium Scare affected systems ranging from medical, to military, to public
infrastructure. On January 1st, 2000, after a worldwide testing and verification campaign,
only sporadic failures were recorded. Despite the small number of failures that were
recorded, the total losses directly attributed to the Y2K Bug ranged in the hundreds of
millions of dollars. The indirect costs are beyond computation.178
From a safety aspect, the potential for a serious hazardous event due to the Y2K
Bug was significantly increased due to the fact that:
• Obsolete software systems were used to manage safety–critical systems.
• There was no existing list of components or systems that were identified as
compliant of non–compliant at the time of development.
• Some software systems could not be tested without a risk to the critical
systems that they controlled.
178 Neumann, Peter G.; Moderator, Risks-List: Forum on Risks to the Public in Computers and Related
Systems, Risks-Forum Digest, ACM Committee on Computers and Public Policy; 2001.

120
• If a system was deemed non–compliant, present–day system developers were
no longer qualified or trained to work in early generation languages.
• Changes to the software system had the potential of introducing new faults
that may not be detected in time, due to the fixed deployment date.
• Software customers with limited budgets might be unable to afford the
expense of testing, repair, or replacement.
The symptoms that affected the software industry due to the Y2K Bug are
synonymous with any system that might be employed in a fashion that was never
intended. This includes systems utilized outside of their normal operating envelope or
systems that become so obsolete that existing operating envelope no longer applies.
To prevent the hazardous operation of a software system outside of its limits,
developers must include:
• Requirements with sufficient detail to specify proper system operational
limits,
• Direct controls capable of constraining system operation,
• Documentation specifying the proper operational limits of the system, and
• Documentation specifying the potential hazards of system operation
outside of specified limits.

121
2. User Over–Reliance on the Software System Most safety–critical software systems can be categorized as either active or
reactive systems:
• Active Software Safety System – Directly controls some hazardous
function or safety–critical system operation, to ensure that the operation of
that system remains within some acceptable bound.
• Reactive Software Safety System – Reacts to the operation of a hazardous
function or safety–critical system, to react when the operation falls outside
of some predetermined and acceptable bounds.
These two terms are introduced in this dissertation to classify Software Safety
systems by the method in which they handle or control hazardous operations.
The requirements of system operation directly affect the type for which the
system may be categorized into. One system reacts to prevent a hazardous event while
the other reacts to the occurrence of a hazardous event. It is important that system users
understand the difference between the two types as well as which type their particular
system is. When users do not understand the basic functionality of the system that they
operate, it becomes the system that runs the user instead of the user that runs the system.
When the user does not understand the operation of the system and removes himself as a
sanity check to its operation, he becomes an additional fault within the system should it
fail. Such is the same consequence when the user places too much reliance on the
operation of the system.
On March 23rd, 1989 the 986–foot long supertanker Exxon Valdez ran aground on
Bligh Reef, a charted natural obstruction, outside of its shipping lane in Alaska’s Prince
William Sound, resulting in the largest domestic oil spill in the United States’ history.
Investigation revealed a series of seamanship errors and lapses in judgment including the
intoxication of the captain, the fatigued deck crew, and the over reliance on a navigation
system. During the final moments of the Exxon Valdez’s passage from the Trans
Alaskan Pipeline into the Prince William Sound, the deck crew assumed the navigation

122
computer and autopilot would guide the vessel around any possible hazards and keep
them inline with rules of the road. As the supertanker failed to make its departure turn,
the exhausted helmsman made fruitless rudder corrections using the helm’s manual wheel.
The autopilot system did not disengage and consequently locked out the helmsman’s
inputs.179 Fatigue and a lack of systems comprehension led the crew to not understand
the limitations of the navigation computer or even how to disengage it when required.
System checks verified that the navigation system had performed as designed and had
followed the pre–programmed track. The Exxon Valdez spilt over 10.8 million gallons
of oil or approximately 1/5th of its cargo. The spill cost the Exxon Corporation over $1
billion in criminal pleas, restitution, and civil settlements, and an additional $2.1 billion
for cleanup and recovery.180, 181
Some software users have a tendency of becoming over reliant on their control
systems without understanding the limitations of these systems or the consequences of
their actions. The complexities of today’s operations require automation systems
controlled by countless microprocessors and software based logic systems. Their
operation is beyond the comprehension of most users. For example, many users do not
understand the intricate functions of today’s dishwasher with its multiple cycles,
temperature controls, filters, heaters, and water conservation mechanisms; but will
blindly put in dishes, silverware, and soap into the machine and expect everything to
come out spotless by simply pushing the START button. Many users do not even open
the operator’s manual to personal or workplace related operating systems, yet still expect
them to function intuitively.
179 Neumann, Peter G.; Computer Related Risks, Addison-Wesley Publishing; 1995. 180 The Exxon plea was broken down into a Criminal Plea Agreement of $150 million with $125 million
forgiven for cooperation, a Criminal Restitution of $100 million, and a Civil Settlement of $900 million.
181 The Exxon Valdez 10 Year Report, The Exxon Valdez Oil Spill Trustee Council, Anchorage, AK; 1999.

123
D. SOFTWARE NOT PROPERLY TESTED
Testing has the potential to demonstrate the inaccuracies and frailties in a system,
as far as testing is executed properly. Some tests evaluate the behavior of the system
(Functionality) while other tests evaluate the consequences of behavior (Safety). It is the
assertion of this dissertation, that the occurrence of software based hazardous events is
primarily a result of a failure in this testing. Depending on the method of testing, there is
no guarantee that there can be an accurate certification on the safety of the system.
Edsger Dijkstra is noted for stating that testing proves that a program is free of mistakes,
but cannot prove its correctness.182
Testing failures include systems that are either not sufficiently tested or testing
determined the probability of such hazards occurring were insignificant. If done properly,
despite its design, software can be inspected and given some level of functional assurance
during and at the completion of development. The dilemma is to determine the level of
testing to be done, the manner of testing, and when testing has been determined sufficient.
System testing is the final process in the development cycle that permits the recognition
and identification of system weaknesses and vulnerabilities. Each of those weaknesses
has the potential for an unplanned event. The significance and consequence of that event
determines how unsafe that action will be.
1. Limited Testing Due to a Lack of Resources Software Safety Testing requires the availability of specialized software,
hardware, and trained personnel who are equipped and able to diagnose critical systems.
These tools and techniques are neither inexpensive nor simplistic to master. Software
industry experts estimate that the United States government had budgeted over $30
billion for the testing and conversion of non–compliant Y2K systems. Further estimates
predicted that Fortune 500 corporations set aside between $20 million and $200 million
182 Attributed to Edsger Wybe Dijkstra, Ian Sommerville, Software Engineering (6th Ed.), Addison-
Wesley, University of Lancaster; United Kingdom; 2001.
124
for the same effort.183 For companies unable to afford such a price, software users risked
significant corporate losses, the threat of litigation, and even the risk to public safety by
not validating or turning over their software inventory. Software owners were
overburdened with determining which software and hardware would be affected. If
identified, a decision would have to be made to repair or replace the software. Either
decision would require a new series of testing and re–integration of the product to ensure
that new vulnerabilities were not introduced into the system. The cost in time, monetary,
and physical resources was prohibitive to many users and developers.
The lack of dedicated testing resources directly affects the economic and
personnel safety of the public at large. The extra expense of time, specialized software,
and trained personnel to test and validate software must be weighed against the potential
damage. Optimally, a system would be stress tested in an environment normally in
excess of its rated capacities, conceivably in excess of 150% of its required level.184 This
extra expense requires an outlay of resources beyond that which many organizations are
prepared to spend. In 1998, the Federation of American Scientists noted in their failure
study of the Theater High Altitude Area Defense System (THAAD) that the lack of
testing resources played a critical role in the failed development of the missile system.
Specifically noted was the lack of sufficient testing timelines, management practices, test
facilities, targets, and post production funding.185 The THAAD Development Team plans
for the first operational missile to be deployed in 2007 from the Lockheed Martin Missile
and Fire Control Plant in Pike County, Alabama. 186 The project currently has an
estimated cost of over $14.4 billion for 1422 missiles and support equipment.187
183 Kuharich, Mark; How I Stopped Worrying and Learned to Love The Year-2000 Bug, The Software
View, Amazon.com; 2000. 184 16 Critical Software Practices, Software Program Managers Network, Integrated Computer
Engineering, Inc.; 2001. 185 Report of the Panel on Reducing Risk in Ballistic Missile Defense Flight Test Programs, Federation of
American Scientist; 27 February 1998. 186 THAAD Manufacturing Site Detected, Anti-Missile Defense, Janes’ Missiles and Rockets, Janes’
Information Group; 01 March 2001. 187 Lockheed Martin Army Theater High Altitude Area Defense (THAAD) System, Static and Towed
Surface to Air Missile Systems, USA, Janes’ Information Group; 26 January 2000.
125
One of the most valuable resources in software development is time. Many
testing methods require a significant amount of time to investigate all of the potential
states for each requirement. As system complexity increases, the number of potential
states can increase exponentially. Testers have to make a reasonable threshold
assumption that they have tested “enough,” and then certify the effort complete. An
exhaustive testing of all possible states may be unfeasible, limited by time or technology.
This assumption of satisfactory testing could very well lead to a false impression of the
operation of the software system. The certification of software performance must take
into consideration the resources available for the test method, the formal process utilized,
and the potential impressions that could be given for the test. 188
2. Software Not Fully Tested Due to a Lack of Developmental Knowledge
NASA stated its development philosophy best to:
Know what you build. Test what you build. Test what you fly. Test like you fly.189
Testing is more then the plugging in of specified values to receive specific results.
It is the effort to find “bugs” within the system. Hazard avoidance requires finding the
important bugs – finding the bugs that will kill the system; the one–in–a–million instance
that is not in the requirements; the bug that will create an out of control event that will
kill or maim someone else. Finding that one–in–a–million bug requires more then an
understanding of software development but rather the understanding of the type of system
that is being built.
Developers, many times, are hired to build software systems based on their
history of project success. This decision though, may or not be based on their
188 Attributed to Edsger Wybe Dijkstra, Ian Sommerville, Software Engineering (6th Ed.), Addison-
Wesley, University of Lancaster; United Kingdom; 2001. 189 Report on Project Management in NASA by the Mars Climate Orbiter Mishap Investigation Board,
National Aeronautics and Space Administration; 13 March 2000.

126
understanding of the subject matter. To bolster an organization’s knowledge base,
developers hire subject matter experts who then may not be familiar with of software
development. Finally, developers employ a testing wing with a methodical approach to
analysis, but may lack experience in employing the application in its natural environment.
The result is the combination of three very talented groups of people who do not speak
the same language nor follow the same philosophy for development.
Engineering is the understanding of an initially unclear situation and selecting the
best process to accomplish it. 190 , 191 The result of this misunderstanding has been
reflected in the many Department of Defense system failures. Currently, the agency is
plagued by a lack of continuity between written requirement, developer’s interpretation,
tester’s assumption of functionality, the assurance of safety, and the reality of field
deployment. Many systems cannot be tested on deployed units. National security
requires these units to be available for critical tasking. Core users deployed worldwide
are not available for developmental testing and critique. Subject matter experts are only
as current as their last day of military service. When it comes time for system testing, the
knowledge breakdown and limitations result in a product that is never pushed to real–
world limits. We have proven in blood that the military battlefield is not the place to
conduct “field tests” of unproven equipment.
In the early 1980’s, Hitachi suffered from a pattern of failed projects and
declining revenue. In 1981, the company recorded over 1,000 product–related faults at
customer sites. Hitachi reviewed its development process and made a series of simplistic
changes including the review of its analysis, design, code, and test process;192 the training
of its consultants in basic Software Engineering principles; and refreshing its Software
Engineers on the fundamentals of existing system. Management believed that, "We learn
190 Dasgupta, Subrata; Design Theory and Computer Science: Processes and Methodology of Computer
Systems Design, Cambridge University Press; New York, New York; 1991. 191 Ramesh, Balasubramaniam; Dhar, Vasant; Supporting Systems Development by Capturing
Deliberations During Requirements Engineering, IEEE Transcripts of Software Engineering, pg. 498-510, Institute of Electrical and Electronics Engineers, Inc.; June 1992.

127
some things from success, but a lot more from failure," and that "If you detect too many
faults reconsider design regulations, procedures, and management policies." Using
hindsight, proven testing, and development methods, Hitachi made a dramatic 98%
reduction in its customer failure rate. Quality assurance was improved by pairing the
knowledge base with the product, resulting in a staff that knew what it was developing
and understand how to test it to the client’s requirements.
3. Software Not Tested and Assumed to Be Safe On June 4th, 1996, $500 Million of uninsured satellites were destroyed when their
delivery platform, an Ariane 5 Space Launch Vehicle, was command destructed soon
after leaving its launch platform.193 The Ariane 5 rocket was on its maiden launch as the
upgrade to the existing Ariane 4 Launch Vehicle. Moments after liftoff, a software based
navigation unit that was certified for flight on the original Ariane 4 version failed from its
incorporation with version 5. The legacy 16–bit Inertial Reference System (IRS) had
received an incompatible signal from an optimized 64–bit On–Board Computer (OBC),
resulting in an unexpected Operand Error Failure. The IRS had functioned flawlessly on
previous version 4 events, and was designed to secure its operation 40 seconds after
vehicle liftoff. Due to the increased liftoff velocity of version 5 and the upgraded
processing speed of the OBC, the IRS received mathematical bias values never before
experienced in version 4. Upon failure of the IRS, the rocket lost horizontal alignment
control and rolled out of control until it was destroyed. The 16–bit IRS was never tested
using simulated inputs from the 64–bit OBC in an after launch environment because it
was felt that the IRS’s success in version 4 met the functional requirements and quality
assurance for version 5.
Developers of the Ariane Rocket and others products have made costly
assumptions by presuming their systems were faultless and hazard free by:
192 Onoma, Akira K.; Yamaura, Tsuneo; Practical Steps Toward Quality Development, IEEE Software
Magazine, vol. 12, num. 5, pg. 68-77, Institute of Electrical and Electronics Engineers, Inc.; September 1995.
193 See APPENDIX B.1 – ARIANE 5 FLIGHT 501 FAILURE

128
• The environment and method in which they were designed in,
• The fact that the system functioned flawlessly in a previous environment,
and
• The fact that the system did not appear to be related to any critical
components.
The assumption or appearance of safety in no way outweighs the potential for
system risk. Operational failures typically are caused by poor design and implementation,
inadequate checkout discipline, and pressures to move on to the next step. Overlooking,
short cutting, or bypassing the testing process results in a system that is simply unsafe.
In 1995, the Intel Corporation distributed its Pentium II Processor with an
embedded division fault due to a production based software error. The division algorithm
was missing only 5 values from its 1066–point look up table, the result of a “FOR–DO
LOOP” error during loading. The look up table was never verified. Once the logic was
committed to silicon, the error could not be repaired. One software fault led to the
creation of another software fault encoded into hardware. This encoded fault would
inaccurately compute floating–point divisions to the 4th decimal point. While seemingly
insignificant, this fault would compound into in accurate mathematical products for some
spreadsheet, sciences, and control software systems that require results to a high degree
of accuracy. The microprocessors could not be reprogrammed and no acceptable
software patch could handle the error. Intel spent over $400 Million to repair or replace
its flawed Pentium II product line.
One cannot assume a system to be safe simply based on requirement satisfaction.
As previously discussed in the Section III.C.1 of this chapter, most systems are evaluated
based on methods of Requirements Based Testing. These tests are pass/fail conditions
designed to determine the system ability to meet defined requirements, assuming
complete requirements. Proper operation is assumed should the system satisfy
development requirements. This method of testing may not reveal all of the potential
hazards of the system’s operational scope, limited by the extent of the testing method.
Testing must be conducted to the negative satisfaction of requirements, in that a system’s
129
operational test is conducted to determine what would happen should the software
function outside of its limits or if that limit is capable of being exceeded.
E. CONCLUSIONS
Software Safety Assurance is a very fragile undertaking. It is not chaotic, but
structured.194 It requires discipline and compliance to accepted methods of development
and operation. Newspapers, technical journals, and field periodicals each note multiple
accounts of Software Safety failures, their faults, triggers, and hazardous results. The
majority of these failures in Software Safety can be defined within specific categories and
subsequent subcategories. It is less important to try to define a product within a category
then it is to attempt to prevent it from failing in the first place. By example, each of these
failures posed a direct threat to the health, safety, and economy of the public. Their
successes go unnoticed, while their failures become national headlines.
It is possible to measure the depth of each failure in terms of loss either
monetarily, time, or human life. The prevention of each of these incidents or the
reduction of any measure corresponds to an increase in safety. At present, the
measurement of safety is arbitrary and without scale. Would the Exxon Valdez accident
been twice as safe if it had spilt half as much oil? Would the Hitachi have been three
times as successful if it had reduced two–thirds of its customer–based failures? It is
important to base the measurement of safety on the success of a system and the ability to
reduce the likelihood of any hazardous event. This measurement should be based on the
lessons learned from the previous eleven subcategories and their examples. Software
Development is based on logic and patterns. If it is possible to identify those patterns and
modify them, then it is possible to develop safer software.
194 Nogueira de Leon, Juan Carlos; A Formal Model for Risk Assessment in Software Projects, Naval
Postgraduate School; Monterey, California; September 2000.

130
THIS PAGE INTENTIONALLY LEFT BLANK
131
IV. CONCEPTUAL FRAMEWORK AND DEVELOPMENT
"Computer programming has invigorated the study of formal systems, not just because a proper formalization is a prerequisite of any implementation, but because good
formalisms can be very effective in understanding and assisting the process of developing programs." 195
– Roland Backhouse
Virtually every activity in life involves some level or chance or risk. There is
little dispute that the chance of a flipped coin coming up “heads” is 50:50 or that the odds
of rolling a pair of sixes is 1:36.196 The odds of selecting the correct number on a
spinning roulette wheel are 1:38, while the payoff is only 36 times the placed bet, giving
the house a five percent advantage on each spin of the wheel. 197 Further, it is
mathematically possible to determine the likelihood of dealing a Royal Flush as
1:649,739 or 1.5391x10–6.198 The payoff or risk depends on the skill of the opponent and
the money played to the pot.
The world is filled with a multitude of events containing risks, probabilities, and
profits that can be computed, depicted, evaluated, and displayed. Measures, based on
mathematic principles of statistics and probability, can be used to derive the occurrence
value of even the most complex event. The occurrence of software–based events is no
more immune from mathematic measurement then any other logic based process. The
requirement is to determine which properties can be measured, what the resultant value
scale will measured against, and the ability to have an affect on the measure. When
casinos and crooked gamblers of the American Wild West wanted to increase their
winning margin, they used loaded dice, marked cards, and roulette brakes. By careful
195 Backhouse, Roland; Chisholm, Paul; Malcolm, Grant; Saaman, Erik; Do-it-yourself Type Theory,
Formal Aspects, Computer, vol. 1, num. 1, pg. 19-84; January - March 1989. 196 Assuming a single roll of two six-sided dice. 197 Assuming a 38-compartment roulette wheel numbered 1 to 36, plus additional slots of 0 and 00. 198 Assuming a 52-card deck, being dealt from poker, a royal flush of five cards: an ace, king, queen, jack,
and ten of the same suit. 4 / ( 52! / ((52-5)! * 5!) ) = 1/649,740. Packel, E. W.; The Mathematics of Games and Gambling, Mathematics Association of America; Washington, D.C.; 1981.
132
analysis and developmental management, it is possible to “load” a software program to
influence the corresponding probability of safety.
Software Safety Development and Assurance is the field of Software Engineering
that institutes methods of safety to produce a more stable product, capable of avoiding or
mitigating hazardous events. The philosophies of Software Safety Assurance can be
pictorially and mathematically depicted once a decomposition is made of the methods of
development, as they apply to safety. Chapter I presents an introduction to the
dissertation and delineated a set of variables that could be quantified and qualified
through Safety Development. Chapter II outlines the current discipline of Software
Safety Assurance including motivations for development, an anatomy of failure, and
current Safety Methods. Chapter III discusses the prime causes of failure and specific
examples of which will serve as a basis for triggers or objects in the Safety Metric.
Chapter IV outlines the conceptual framework for Software Safety Assurance, Safety
Metrics, and Safety Depiction.
Despite significant efforts, this dissertation’s literature search has failed to
discover a previously developed software metric that could define safety in a quantitative
or qualitative format. Subject matter literatures used in this dissertation topic are listed in
the reference sections of this dissertation. Additionally, the literature search has failed to
find an acceptable pictorial depiction that could demonstrate software functionality as it
applies to Software Safety. It is the goal of this dissertation to satisfy both of these
shortcomings, using the research previously noted in this study, combined with principles
of statistics and mathematical logic. It is essential to define a safety criterion to establish
a baseline for the assessment. This dissertation addresses the requirements for
establishing a safety criterion, developing the assessment, and implementing corrective
measures.
133
A. SAFETY DEVELOPMENT GOAL
The Goal of Software Safety Assurance is to:
• Measure the likelihood of a system to experience an unsafe action.
• Identify triggers that could cause the system to experience an unsafe
action.
• Reduce the likelihood of a system to experience an unsafe action through
proper development/redevelopment or inclusion of controls.
• Re–Measure the likelihood of a system to experience an unsafe action.
The Goal of the Software Safety Metric is to:
• Provide a method to catalog system objects and characteristics that can be
measured and evaluated to an established standard.
• Provide a method for measuring the system objects and characteristics into
quantitative values.
• Provide a method for evaluating the measures through mathematical, logic,
and analytical processes.
The Goal of a Safety Depiction is to:
• Pictorially depict the safety vulnerabilities of the software system.
• Pictorially depict the potential propagation of safety failures through the
system.
• Present an efficient and aesthetic presentation of system safety for
evaluation and development decision making.

134
B. METRIC DEVELOPMENT
Proper metric development requires the creation of a metric that is:199
• Robust – Capacity of being tolerant to variability of the inputs.
• Repeatable – Different observers arrive at the same measurement,
regardless of how many repetitions take place.
• Simple – Uses the least number of parameters sufficient to obtain an
accurate measurement.
• Easy to calculate – Does not require complex algorithms or processes.
• Automatically collected – It is possible to develop such that there is no
need for human intervention.
Metrics have the ability to remove emotion and bias from software development
decision–making. They are based on a standardized set of principles, agreed to at the
commencement of the evaluation. As a result, they present a standardized measure for
comparing, contrasting, and summarizing the quality and worth of system components
and methods. Putnam and Mah noted that any discussion of metrics has to start with a
foundation. “Over the years, a consensus has arisen to describe at least a core set of four
metrics. These are: size, time, effort, and defects.”200 A Software Safety Metric is based
on the foundation of these four principles, specialized by factors that directly affect safety.
It is relevant to include a fifth element of Software System Complexity to denote a depth
of convolution of the software element. As with any foundation, there is some chipping
away of the base to remove unwanted material and to smooth it for its proper purpose.
1. System Size Requirements, functions (function points), processes, scripts, frames, methods,
objects, classes, or lines of code are all possible measures of a system’s size. Specific
size does not necessarily cause a system to be safe or unsafe, rather size denotes the
199 Nogueira de Leon, Juan Carlos; A Formal Model for Risk Assessment in Software Projects, Naval
Postgraduate School; Monterey, California; September 2000. 200 Mah, Michael C; Putnam, Lawrence H. Sr.; Software by the Numbers: An Arial View of the Software
Metrics Landscape, American Programmer, vol. 10, num. 11; 1998.

135
volume of the system. If we assume that human error rates are constant, a ratio may be
developed that relates errors to size based on historical data. Such errors do not directly
result in a hazardous event unless the specific fault has control of a hazardous event.
Size does not necessarily infer a level of safety, nor does it infer a probability
of failure.
Size can exist as a related factor to system failure probability when it is assumed
that a fault may potentially exist for a specific measure of code. As the amount of code
increases, the potential for further faults to exist increases, assuming a standard
development practice, consistent system complexity, and the even distribution of faults.
The failure to maintain a balanced development environment negates the measure of
system size to safety. As the practices and methods used to develop the system change,
the relationship of fault to code size will change – either to the benefit or injury or the
system. Such a balance is required for a valid assessment of one system to another from
size to size. Typically, system size relates to the requirements of the system. An analysis
of stated requirements can be used to determine a prediction of system size, and generally
remains constant for a given system. Based on historical models, it is possible to suppose
that the number of faults may increase with system size, while though the increase is not
proportional to size.201 It cannot be assumed that requirements, or the compliance to such
requirements, will guarantee the avoidance of a hazardous event. In some cases, a
hazardous event may be unavoidable, leaving the requirements to attempt the control or
lessen the potential for such an occurrence.
2. Time to Develop Hours, months, and years are all possible measures of a system’s time to develop.
Time is a factor of the system’s size, complexity, method of development, and personnel
actually executing the development. While time does not directly apply to System Safety,
its sub–components do have an effect. Time affects safety when assessing personnel
201 Mah, Michael C; Putnam, Lawrence H. Sr.; Software by the Numbers: An Arial View of the Software
Metrics Landscape, American Programmer, vol. 10, num. 11; 1998.

136
turnover, system oversight and understanding of early generation against optimized
components, and in the context of time critical development projects where a delay could
fail to prevent a hazardous event (i.e., Y2K Bug).
Time to Develop can serve as a positive and negative factor in the potential for the
system failure development.202 When a development process is completed quickly, it can
be assumed that the system was of minor complexity and thereby had a smaller potential
for fault introduction. However, this minor complexity may have little to do with system
assumptions of safety criticality. To the converse, it could be assumed that the system
was completed quickly because critical procedures and requirements were overlooked
and not resolved. As additional time is spent on the development, the requirements may
risk the chance becoming obsolescent or irrelevant, as they no longer apply to the product
that they were intended to control. As development time increases, the resulting system
may not be completed in sufficient time to prevent a time critical hazardous event.
When a development process exceeds its expected development time, the process
may become safer as more time is spent to resolve errors, or there may be additional
errors introduced as development continues.203 History has demonstrated that:
• Additional errors are discovered as development time increases,
• Additional errors can be potentially introduced through the
redevelopment/correction of known errors,
• Continued improvement and requirement modification can potentially
introduce new errors that will require additional redevelopment.204
Figure 10 shows a hypothetical depiction of the effects of an increased time to
develop against complexity and error detection. Actual scale values are based on the
particular project and ability of the developers.
202 Nogueira de Leon, Juan Carlos; A Formal Model for Risk Assessment in Software Projects, Naval
Postgraduate School; Monterey, California; September 2000. 203 Chaos, The Standish Group International; West Yarmouth, Massachusetts; 1995. 204 Botting, Richard J. Dr.; Why we need to Analyze Software Development, California State University,
Santa Barbara; Santa Barbara, California; 1996.

137
Figure 10 Time to Develop vs. Complexity and Error Detection
The Time to Develop can be reduced by the use of proven COTS / GOTS
products, proficient developers, and efficient development techniques. COTS / GOTS
products only provide a benefit to the system when they have been proven free of faults
and can integrate seamlessly into the developing system without introducing additional
failures. Proving a COTS / GOTS product fault free is virtually impossible, as is proving
that the interaction between the COTS/GOTS product and the application is fault free.
An assumption of the degree of product correctness must be made and factored into the
decision to use a COTS / GOTS product. Decreasing system functionality with the intent
to reduce the time to develop will result in an inability to meet system requirements. A
failure to meet system requirements could potentially result in the system’s inability to
control hazardous events. A failure to provide sufficient time to develop will result in the
failure to develop the complete system, test, and identify potential faults.
The balance between increased safety and increased development time is a fragile
element that must be considered to improve software safety. An equilibrium must be
struck with sufficient flexibility to permit requirement completion in a judicious manner
without introducing new hazards to the system.
Complexity
Tim
e to
Dev
elop
Error Detection
Tim
e to
Dev
elop
138
3. Effort to Develop Man–hours, man–months, and processor–hours are all possible measures of a
system’s effort to develop. Effort is a factor of the time to develop versus verses the
number of persons/assets required for the development period, compounded by the
complexity of the system and aptitude of the resources. Safety is directly affected by the
complexity of the system and aptitude of the resources, and indirectly affected by the
time required to develop. You can not bake a 325° cake at 650° in half the time any more
then you can expect to reduce the time to develop by half when you double the number of
developers. Software Development as with cooking, requires a controlled development
process that measures the effort to develop based on existing assets, aptitudes, and
complexities.
Effort has historically been related to development risk and fault introduction. As
a system requires greater effort to be developed, the potential that the system will not be
completed increases, frequently due to the depletion of resources. As resources are
stretched and the developers become weary from process, some portions of the system
may fail to be developed. The partial development may result in a lack of some hazard
controls and the failure to identify potential faults. Effort may be related to the
complexity of the system, the abilities of the developers, and the size and scope of the
requirements. Various estimation methods, such as COCOMO or Putnam may be used to
determine a perspective value for system development effort for a given set of
requirements.205 While no direct measure exists to relate effort to safety, a correlation
can be established that effort can be reduced by:
• Refining the requirements, thereby making the system easier to develop,
• Employing a greater quality of personnel, or
• The use of more refined techniques and development tools.
205 Roetzheim, William; Estimating Software Costs, Software Development Magazine, vol. 8, num 9, pg.
66-68; October 2000.

139
While such a measure would benefit the state of the art of software engineering, the
development of such a measure would require significant research and the modeling and
would be beyond the scope of this dissertation.
4. System Defects Failures per hour, errors per line of code, and failures per execution are all valid
measures of system’s defects. Defects are generally measured over time or against a
measure of system size, referred to as frequency or rate. Defects are an essential
component of Software Safety, to the extent that the specific defect or fault has control
over a hazardous event. If the particular defect does not connect to a hazardous element
or system design mitigates the defect’s propagation or flow, then the element is
inconsequential to the measurement. Defects found during system development through
delivery can be referred to as quality, while defects discovered during the period of
service can be referred to as reliability.
5. System Complexity System Complexity may potentially detract from the safety of the system in cases
where the development team is incapable of designing a system at such a level of
intricacy. The more complex the system, the more difficult it will be to develop and the
greater the probability that a fault can then be coded into the system. Complexity can be
the result of two factors:
• The requirements of the system, and
• The desired method of development.
It is difficult to reduce the complexities of system requirements and continue to
meet system functionality. System complexities can be managed by the use of qualified
and proficient production team members experienced with the development of such
requirements. Additionally, it is possible to evaluate system development practices to
determine the most safety prone method for meeting such requirements. In some cases,
the method chosen by some developers may introduce faults by their inherent
complexities.
140
Many organizations and institutions have developed criteria (McCabe's
Cyclomatic Number, 206 Halstead's Software Science, 207 and Fan–In Fan–Out
Complexity208) for judging the complexity of a software system by evaluating the code
for size, structure, and format. While these measurements are beneficial to estimating the
complexity of software development, they are not measurements of Software Safety.
Many measurements of software complexity indicate the probability or risk of software
development failure and not the risk of a hazardous event.
In some cases, it may be necessary to introduce complexities to the system to
increase safety. In the case of the Boeing 777 Aircraft Data Bus, the system uses a nine–
fold redundancy composed of three asynchronous data channels, each channel made up
of three independent lanes that utilize dissimilar hardware and software. The
complexities and effort required to develop and manage such a system are staggering, but
the resultant safety product provides the coverage required to protect the aircraft from the
loss of control and possible crash.209
A Safety Metric is first derived from the four core Software Metrics including size,
time, effort, and defects plus system complexity. These measurements can be made early
in the development process and updated as the system development becomes more
mature. In addition to these core components, safety requires a measured evaluation of
specific hazards, degrees of hazards, protections and redundancies, stability, cost,
restoration, and repair. Each metric evaluates specific components of the software
system’s development and lifecycle as they apply to safety. From the combination of
these components and metrics, it is possible to derive a measure of Safety – which is the
ultimate goal of this dissertation, presented in a stepwise process in Chapter V.
206 McCabe, Thomas; Complexity Measure, IEEE Transactions on Software Engineering, vol. 2, num. 4,
pg. 308-320, Institute of Electrical and Electronics Engineers, Inc.; December 1976. 207 Halstead, Maurice H.; Elements of Software Science; New York, New York and Elsevier North-
Holland; 1977. 208 Sommerville, Ian; Software Engineering, Addison Wesley Publishing Company, Workingham,
England, 6th Edition; 07 August 2000. 209 Lawrence, J. Dennis; Workshop on Developing Safe Software: Final Report, Fission Energy and
Systems Safety Program, Lawrence Livermore National Laboratory; 30 November 1992.

141
C. ASPECTS OF SOFTWARE SAFETY
Software Safety and its Safety Management Concept can be divided into six
activities:
• Hazard Identification
• Software Safety Assessment
• Safety Decision Making and Development
• Implementation of Safety Controls
• Supervision of Safety Changes
• Verification
This concept is derived from the Naval Safety Center’s research and process of
Operational Risk Management.210 The process is based on the four Principles of ORM,
namely:
• Accept risk when benefits outweigh the cost. Develop effective safety
measures that balance the cost of safety against the benefit of hazard
avoidance.
• Accept no unnecessary risks. Tolerate no system below an acceptable
measure of safety.
• Anticipate and manage risk by planning. Investigate, anticipate, and
mitigate safety hazards through the entire lifecycle of the system.
• Make risk decisions at the right level. Develop an accountable process
to prevent hazardous events at all levels and stages of development.
Hazard Identification is the process of identifying potentially hazardous elements
and events in the system, flaws in development, protections, mitigations, and limitations.
Hazard Identification is one the most important phase of Software Safety Assurance, as
it forms the foundation for all subsequent events. This process may be accomplished

142
using energy barrier trace analysis, checklists, taxonomies, and subject matter expertise to
generate a list of system objects and process that contribute to safety.
A Software Safety Assessment is the qualitative and quantitative analysis of the
identified properties of development as they relate to safety. The assessment is
accomplished using applicable metrics that measure and assign worth to the system. The
assessment may rationalize the probability of an unsafe incident and the impact of such a
hazardous event, or to the contrary may suggest a level of safety and benefit to such
development.
Safety Decision Making and Development is the process of determining the
optimal process for development and its subsequent execution. Such decisions are made
taking into account the abilities of the development process, the equities of the
assessment, and the goal of the development. Christendom’s Lucifer Principle contends
that there is a degree of "evil" in all things. In that same vein, it is understood that there
is a level of hazard in all software systems. The dilemma is to determine the most
efficient development plan that can translate decisions into process, within the capabilities
of the developers. The decision process determines the level of effort or threshold that is
acceptable for development. A Software Safety Program supports critical decision
making at development milestone and transition points.
The Implementation of Safety Controls is the act of using proven processes that
ensure safety and reduce system hazards. Such controls include management practices,
error handlers, redundancies, safety–design requirements, and systems tests. Controls
correct and redirect the development process to ensure that safety is paramount through
the entire lifecycle of the system.
210 Naval Safety Center; Risk Assessment – Risk Management Controls, Naval Message DTG 231200Z
JUN 95 / MSGID / GENADMIN / COMNAVSAFECEN / 40-646 / JUN

143
Supervision of Safety Changes includes the re–assessment and re–evaluation of
safety metrics to ensure compliance with development goals. Supervision also includes
the monitoring of software development, the re–identification of any new hazards and
flaws that may have occurred due to development changes, and the communication and
feedback of safety and hazards for peer review.
A Software Safety Assurance process can readily be mapped to traditional Spiral
Developments Models. The Spiral Model, popularized by Barry Boehm, 211 is a
progressive cyclic version of a stage-wise development model, which begins each cycle
of the spiral by performing the next level of elaboration of the prospective system’s
requirements. Risk management within this stage-wise model contains many of the
concepts and ideals required for Software Safety, the difference being the fundamental
shift beyond project development to system hazard avoidance. To relate to the Boehm
Spiral Model, the Supervision of Safety Controls would occur in PHASE I of the Spiral,
with Hazard Identification occurring in PHASE II, the actual Software Safety Assessment
taking place in PHASE III, and the ultimate Software Decision Making and Development
process in PHASE IV.” Assessment and testing for System Safety only adds to the
robustness and functionality of the original system requirements. Safety Controls support
system development by instituting a second layer of validation and verification to each
process cycle. Rather than a shift in focus, Software Safety is accomplished in series
with existing development, resulting in a system that is developed safer, with greater
control and understanding of the capabilities and limitations of its operation.
211 Boehm, Barry; A Spiral Model of Software Development and Enhancement, Computer, pg. 61-72;
May 1998.

144
II III I IV
Figure 11 Safety in the Spiral Model
ENGINEERING - Program Development
ANALYSIS and ASSESSMENT – Evaluate alternatives, identify, resolve risks
OAC - Determine objectives, alternatives, constraints
PLANNING - Plan next phase
Cumulative Costs
REV
IEW
Commit
Partition
Risk Control
Risk Control
Risk Control
Risk Assessment
Risk Assessment
Risk Assessment
Requirements OAC
Abstract Specification OAC
Concrete Specification OAC
Requirements Plan
Abstract Specifications Plan
Concrete Specifications Plan
Software Development Plan
Requirements
Requirements Validation
Abstract Specification Validation
Abstract Specification Concrete
Specification
Concrete Specification Validation and Verification
Concept of Operations
EVALUATION - Validate Development
HAZARD IDENTIFICATION
SOFTWARE SAFETY ASSESSMENT
SOFTWARE DECISION MAKING AND DEVELOPMENT
SUPERVISION OF SAFETY CHANGES
IMPLEMENTATION OFSAFETY CONTROLS
CONTROL DEVELOPMENT

145
D. DEPICTING SAFETY
A pictorial depiction is essential to presenting a visual relationship between the
software functionality, failure, and hazard prevention of Software Safety. System
Development requires the decomposition of action into objective models that can be
easily observed, traced, and correlated. These models can be developed into visual
presentations that illustrate the potential propagation of software failures through the
system. This illustration is then used to portray system vulnerabilities and areas where
safety mitigation is capable of preventing a hazardous event. Various software
development models include the graphical depiction of the system for presenting an
efficient and aesthetic way of viewing functionality including Fault Tree, Class Diagrams,
Hypergraphs, PSDL (Prototype System Description Language), Fishbone, and Petri Nets.
A Software Safety Graphic would be based on a form of the Fault Tree model with its
ability to logically portray system flow and failure dependencies. 212 Examples of
potential graphical representation solutions were given in Chapter II.E.2 of this
dissertation, with a demonstrated solution in Chapter V, with specific concentration in
Chapter V.E.1.
E. SUMMARY
At present, the state of the art of software development lacks a viable metric for
quantifying the safety of a Software System. Various metrics mentioned in Chapters II.E
and IV.B of this dissertation are capable of predicting the rate of failure of a system
without taking into consideration the consequences of the failure. Not every failure may
result in an unsafe event. Correspondingly, there exists no model for effectively
depicting software process flow and functionality as it applies to failure and Software
Safety. Currently, software metrics exists to determine the complexity, effort, and or size
of a software system. These metrics, while beneficial for their intended purpose, do not
readily adapt to computing the propagation of failure or probability of a hazardous event.
Susan Sherer agreed that, “…software can never be guaranteed to be 100% reliable.
212 See Chapter V.E.1 – Process Flow Mapping; for complementary clarification.
146
Software systems are discrete–state systems that do not have repetitive structures. The
mathematical functions that describe the behavior of software systems are not continuous,
and traditional engineering mathematics does not help in their verification." 213 A
Software Safety Metric is atypical to other metrics in that safety requires a measurement
of probability and assumption of fact based on partial evidence, void of emotion. The
resulting measures of safety metrics include the balanced justification to risk human lives,
limbs, or economy.
While mean time to failure and other failure rate measures may be capable of
determining the probability that a system may experience a failure, in Chapter V, this
dissertation introduces a concept for refining that measure to take into account the
probability that an event will execute, the probability that the event will fail during its
execution, and finally the probability that the failure will result in a hazardous event. The
combination of the three measures, in conjunction with the severity of the consequence;
ultimately merge to represent the level of safety of the system.
Software Engineering is based on scientific and mathematical theory. 214
Investigation has revealed scores of disasters that occurred when engineers ignored the
most basic of principles of science and mathematics. Indeed one definition of Software
Engineering is, "the disciplined application of engineering, scientific, and mathematical
principles, methods, and tools to the economical production of quality software."215 In
keeping with the objective of Software Safety Assurance, the resulting metrics will
comprise the disciplined application of engineering, science, and mathematics in an
aesthetic and logical application to safety assessment.
Software Safety and the corresponding metrics are not reactions to a crisis. They
serve to prevent crisis by the early recognition of possible hazards and controls that
prevent such hazards. They will provide the opportunity to make system improvements
213 Sherer, Susan; Software Failure Risk – Measures and Management; Plenum Press; 1992. 214 Tichy, Walter F.; Habermann, Nico; Prechelt, Lutz; Summary of the Dagstuhl Workshop on Future
Directions in Software Engineering (February 1992), ACM SIGSOFT Software Engineering Notes, vol. 18, num. 1, pg. 35-48; January 1993.

147
to mitigate hazards and strengthen functionality. In cases where the additional effort is
not cost effective to solving hazards, the developers and clients (if warranted to inform)
have a greater understanding of the potential failures of the system for which they are
about to deploy. In such cases, a decision must be made of what is preferable: an
imperfect system, no system at all, or a more expensive but safer system. The cost of risk
to human lives is a sensitive and controversial issue, and “cost effectiveness” does not
have a universally accepted definition in such a context.
215 Humphrey, Watts S.; Managing the Software Process, Addison-Wesley; Massachusetts; 1989.

148
THIS PAGE INTENTIONALLY LEFT BLANK

149
V. DEVELOPING THE MODEL216
“Assessment of change, dynamics, and cause and effects are at the heart of thinking and explanation.”
– Attr. to Dr. Edward Tufte
Simplistically, a safety assessment would query a system that has failed as to:
1. What did it just do?
2. Why did it do that?
3. What will it do next?
4. How did it reach this state?
5. Is it possible to revert its process to a normal state?
6. Why will it not reach that state?
7. What caused it to reach that state?
8. What can be done to ensure that it does not occur again?
This assessment model attempts to answer some of these questions through a
stage-wise process. An assessment of Software Safety is based on computing the:
1. The probability that a hazardous event will occur and
2. The severity of that hazard – Consequence
Through the combination of these two elements, it is then possible to derive a
value of Safety for the system, mathematically defined as:
216 Luqi; Liang, Xainzhong; Brown, Michael L.; Williamson, Christopher L.; Formal Approach for
Software Safety Analysis and Risk Assessment via an Instantiated Activity Model, Proceedings from 21st International System Safety Conference, Ottawa, Ontario, Canada, September 2003

150
S = Σ P(H) * C(H) for all H
Where S = The safety of the Software System
P(H) = The probability that a Hazardous Event (H) will occur C(H) = The Consequence Severity of a Hazardous Event (H)
Equation 1 System Safety
In the most ideal circumstances, the equation is the summation of two specific
values to derive a specific result. In a perfect world, the values of a system’s properties
would be clearly defined and easily incorporated into a mathematical computation. In
reality, there are far too many variabilities in the dynamic nature of software development
to derive specific values for each software property. As a software system’s complexity,
size, and uncertainty increase, the ability to place finite values on system properties
decreases. In such cases, it may become necessary to assign range values to cover
specific states or conditions of the system. This chapter outlines methods for deriving
both precision and non-precision values for system properties
The value of P(H) can range numerically between zero and one ( 0 ≤ P(H) ≤ 1 ),
or be represented as a textual value rated within a series of numeric limits (see the
example in Table 10). The value of one depicts the probability that a hazardous event
will occur constantly, while the value of zero represents the probability that a hazardous
event will never occur. Textual values and limits are further defined in this chapter. The
procedures for determining the value of P(H) are defined in this chapter. It is the goal of
the development to reduce the probability of a hazardous event ( P(H) ) to as small a
value as possible.
The value of C(H) can range numerically between zero and one ( 0 ≤ C(H) ≤ 1 ),
or be represented as a textual value rated within a series of numeric limits (see the
example in Table 7). A C(H) value of zero represents a negligible severity consequence
while a C(H) value of one represents a catastrophic severity consequence. The
procedures for determining the value of C(H) are defined later in this chapter. It is the
151
goal of the development to reduce the consequence severity of a hazard ( C(H) ) to as
small a value as possible.
The value of Safety (S) of the Software System can be represented by a textual
value/definition determined by the grid intersection of P(H) and C(H) values (see the
example in Table 12) or as a numeric representation of safety. The procedure for
determining the value of S is defined in this chapter. It is the goal of the development to
drive the level of safety towards zero. The greater the Safety Index, the more unsafe a
system becomes.
The safety of a system is based on the combined safety of each component and
the ability for the system to control hazards as a whole. In the most general terms, it is
based on the probability that hazardous events will occur in combination with the severity
of their consequence. In the most detailed terms, it is an examination of each hazard,
consequence, and probability of execution that is expressed in the final equation. . The
interdependency that is frequently a part of complex systems can results in very complex
probability equations.
A. SAFETY REQUIREMENT FOUNDATION
Traditionally, developers would build a system, test it, and then refine it through a
series of improvements. This method, while successful, would require a significant
amount of unnecessary rework and testing that could have been avoided using proper
design and forethought. It is easier to design the software with safety in mind, planning
for the potential for hazardous events, implementing controls and mitigation tools, and
testing with the foresight to isolate environments and states that could lead to process
failure. Such prior planning is beneficial to the success of system development and
replies on the use of proper requirement specifications to set the foundation for design
and development.
Requirements can be divided into four distinct levels based on their degree of
specificity and application to system development. The accepted nomenclature for
requirements classification identifies Level 1 Requirements as the top most mission-level

152
requirements of the system. They are written in very broad terms and rarely change over
the course of development. Level 2 Requirements are referred to as Allocated
Requirements, derived from a decomposition of Level 1 Requirements. They are written
in greater detail than the previous requirement, introducing specifications necessary for
project development. Level 3 Requirements are Derived Requirements that can be traced
back as a subsystem to support Level 2 Requirements. There exists a bi-directional
relationship from one Level 2 Requirement to one or many Level 3 Requirements. Level
4 Requirements are the Detailed Requirements used to code and design the actual system,
based on the derived specifications from Level 3. There exists also a bi-directional
tracing between Level 3 and Level 4 requirements. System tests are designed to verify
the Level 4 Requirements while Acceptance Tests are used to verify Level 3
Requirements. Inspection and Observation is usually sufficient to certify Level 1 and
Level 2 Requirements.217
Lacking in the state of the art of requirement’s specification is an assignment
relationship between safety elements and the requirement level concept. Presently, there
exists little formal direction towards the proper inclusion of safety elements in any part of
the requirement specification document, other than recognizing the importance of their
inclusion. In the case of High Assurance Systems, it should be necessary to assign safety
elements to specific levels of requirement definitions, thereby increasing commonality
and conformity across diverse developers and user’s groups. Through this dissertation, I
introduce the following Safety to Requirement Level Assignments:
• Level 1 Requirements – Top Level: Hazard Introduction. All Potentially
Hazards Events that could occur during system operation are identified in the
requirements. This is to include hazardous events that could occur should the
system function normally or fail to operate.
217 Roseberg, Linda H. Ph.D.; Hammer, Teodore F.; Huffman, Lenore L.; Goddard Space Flight Center;
Requirements, Testing, and Metrics, Proceedings of the 16th Pacific Northwest Software Quality Conference, Utah; October 1998.

153
• Level 2 Requirements – Allocated Requirements: Hazard Amplification.
Hazardous Event definitions are amplified to include states of operation that
could lead to the event, potential process malfunctions that could trigger the
event, and consequences of the hazardous event. Consequences, costs, and
effort related to the Hazardous Event should be included to justify controls
later in the requirement documentation.
• Level 3 Requirements – Derived Requirements: Mitigation and Control of
the Hazard. Based on the identified hazard and related process malfunction,
mitigation and control elements and techniques should be identified to reduce
the severity or probability for occurrence of the hazardous event. Decisions
should be based on known cost-benefit factors including effort required to
control the event against the probability of occurrence of such an event.
Operational bounds and limits can defined at this level.
• Level 4 Requirements – Detailed Requirements: Mitigation and Control
Logic. Based on identified Mitigation and Control elements and techniques,
logic statements can be defined to isolate hazardous triggers and
environmental conditions required to control system operations. Operational
bounds and limits can be specifically defined to include their effect on the
system and the logic necessary to counter the impact on system operation,
should they occur.
Controlling the limits of the operating environment is crucial to developmental
success. That success can be dependent upon the ability of the requirement specifications
to isolate the acceptable bounds of operation for the system’s environment. Using proper
logic statements, it is possible to bracket or filter most operating environments to fall
within acceptable bounds. Should the environment stray, logic statements could be
devised and included in the requirement specifications to counter and correct the error.
The writing of requirements still demands a degree of subject matter expertise in
the field of specification authoring, software engineering, and the subject for which the

154
author is writing the requirement. It is impractical to assume that an individual can write
a viable safety related requirement specification document without proper education,
foundation, and experience from previous efforts. For this intent, the method introduced
in this dissertation provides a foundation for specification authors to base future products
upon. Optimally, specification authors should integrate the Safety to Requirement Level
Assignment concept into their development process as a template, making modifications
and improvements necessary to meet the specific needs of the project, the developers, and
the client.
1. Requirement Safety Assessments A significant effort has been made to quantify and qualify requirements using
automated analysis techniques. Many of these efforts have concentrated on nine
categories of quality indicators for requirement documentation and specification
statements, including:218
Independent Specification Based: • Imperatives • Continuances • Directives • Options • Weak Phrases
Requirement Document Based:
• Size • Specification Depth • Readability • Text Structure
While each of these elements provide some measure of requirement document
quality, they do not directly address the specific needs of the High Assurance System,
and in some cases contradict the process. To ensure that safety based requirements are
properly evaluated, it is necessary to amplify the assessment process to reflect the
218 Wilson, William M.; Rodenberg, Linda H., Ph.D.; Hyatt, Lawrence E.; Automated Quality Analysis Of
Natural Language Requirement Specifications, Goddard Space Flight Center, National Aeronautics and Space Administration, Greenbelt, Maryland.

155
introduction of the Safety to Requirement Level Assignments, presented earlier in this
dissertation. Based on techniques already established in the state of the art of Automated
Requirement Quality Analysis, it is possible to evaluate the requirements in regards to
safety as follows:
a. Level 1 Requirements Completeness: Level 1 Requirements shall be evaluated for their clarity
and specification in the requirement statement to address safety related hazardous events
in the system. It is essential to identify all potentially hazardous events that could occur
related to system operation. Identified hazards should be clearly stated to remove
ambiguity and confusion with like hazards not related to the system.
Depth: Level 1 Requirements shall be evaluated for sufficient linkage to
subordinate Level 2 Requirements that amplify safety related hazardous events through
system operation. This linkage is critical to hazard resolution and adds to requirement
specificity not normally expected in the top level requirement specification.
b. Level 2 Requirements Completeness: Level 2 Requirements shall be evaluated for their clarity
and specificity in the amplification of safety related hazardous events in program
functionality including operating states, conditions, and/or parameters that contribute to
the hazardous event. Specific hazard consequences, costs, and effort related to the
hazardous event shall be addressed.
Depth: Level 2 Requirements shall be evaluated for their relevance to and
satisfaction of safety related Level 1 Requirements, taking into consideration the
necessity for Level 2 requirements to implement the safety intent defined in Level 1
requirements. Additionally, they shall be evaluated for sufficient linkage to subordinate
Level 3 Requirements that identify and implement mitigating actions and controls of
safety related hazardous events in system operation.

156
c. Level 3 Requirements Completeness: Level 3 Requirements shall be evaluated for their clarity
and specificity to identify and implement mitigating actions and controls of safety related
hazardous events in system operation, taking into account identified states, conditions,
and/or parameters contributing to the hazardous event. Requirements shall address
considerations for the cost-benefits of techniques, identifying potential alternatives
should resources become limited. Specific operational bounds and limits are identified at
this level.
Depth: Level 3 Requirements shall be evaluated for their relevance to and
satisfaction of safety related Level 2 Requirements, taking into consideration the
necessity for Level 3 requirements to implement the safety intent of the Level 2
requirements. Additionally, they shall be evaluated for sufficient linkage to subordinate
Level 4 Requirements that specifies specific logic necessary to design, implement, and
monitor controls and mitigating elements of hazardous events.
d. Level 4 Requirements Completeness: Level 4 Requirements shall be evaluated for their clarity
and specificity to address logic necessary to design and integrate mitigation and control
elements to reduce the potential or severity of safety related hazardous events. Logic
statements shall be specific enough to be directly transferred into program functionality.
Specific operational bounds and limits shall be defined and amplified to include their
affect on the system.
Depth: Level 4 Requirements shall be evaluated for their relevance to and
satisfaction of safety related Level 3 Requirements, taking into consideration the
necessity for Level 4 requirements to implement the safety intent of the Level 3
requirements.

157
2. Requirement Safety Assessment Outcome One of the primary steps in the development of High Assurance Systems is to
define the safety criticality and criteria for the program. In Dr. Schneidwind’s research,
in which he discusses the process and benefits of implementing reliability, safety,
requirements, and metrics to a High Assurance System, he makes a distinct point of
defining the safety criteria in the system’s (Level 1) requirements.219 Numerous other
prominent members of the state of the art of Software Engineering emphasize the
importance of identifying hazards early in the development process and including them
within the requirement’s specification. 220 It is generally accepted that it is at least
fourteen times more costly to fix a problem discovered during testing then it is to fix it
during the initial requirement’s phase of development.221 Using this motivation, the
reliability modeling introduced by Dr. Schneidwind, and the requirement safety
assessment method introduced in this dissertation, it is possible to gauge a factor of safety
early in the development process. From this early assessment, it is possible to determine
if the initial requirement set is complete enough to justify project commencement.
Properly written requirement specifications have a natural linkage from higher to
lower level elements. An assessment of software safety must validate that the linkage is
intact and that hazardous events are satisfied across all levels of the requirement process.
Additionally, it is imperative that specifications be reviewed to ensure that they do not
impose contradictory or conflicting requirements against each other, essentially nulling
out the benefit of one control or element of the hazard prevention chain. Such an
assessment can be accomplished using traditional automated assessment techniques or
through the review of domain experts. Much of what is accomplished in the
requirement’s phase of development is based on judgment and experience. It is difficult
219 Schneidewind, Norman F, Introduction to Software Reliability, Safety, Requirements, and Metrics
with Space Shuttle Example, Naval Postgraduate School, Monterey, California; 27 July 2000. 220 Richter, Horst P. PhD, Accreditation Of Software Systems In The Safety Environment, Richter
Consultants; Scottsdale, Arizona, from the Proceedings of the 18th International System Safety Conference, Fort Worth, Texas; 11-16 September 2000.
221 Hammer, Theodore; Huffman, Lenore; Wilson, William; Rosenberg, Linda PhD; Hyatt, Lawrence; Requirement Metrics for Risk Identification, Goddard Space Flight Center, National Aeronautics and Space Administration, Greenbelt, Maryland.
158
to quantify such experience other then to balance the successes of previous efforts with
the education and talent gained through the maturation of the state of the art of software
engineering.
The assignment of Safety Elements to Requirement Levels would add little
additional effort to the requirement development phase. To its considerable benefit, it
would add a standardized requirement format that could be early integrated into the state
of the art of requirement development. When properly implemented, the requirement’s
specification document would drive the developer to consider hazard elements and
mitigation controls early in the development process; saving time, resources, and effort
through the remainder of the development (One of the key recommendations of the
JSSSH). 222 Such a safety to requirement designation would compliment the existing
requirement assessment methods; ensuring safety-based requirements are properly
reflected in the preliminary design of the system.
The traditional measure of completeness and quality (i.e., the complete and
accurate implementation of requirements) must be modified to properly capture the true
benefits of software safety within the requirement specifications. Traditionally, an
assessment might measure the ratio of requirements satisfied against the total number of
requirements. This plain ratio would overlook the significance or criticality of one or
more requirements’ relationship to a hazardous event, including consideration of the
mission criticality of requirements beyond their relationship to hazardous events. All
hazardous events must be evaluated independently as their outcomes hold unique
consequences for the program. It may be acceptable to have a low ratio of completed
requirements to control an inconsequential hazard while certification may demand a
higher ratio of completion to control a single catastrophic hazard. Software safety is only
concerned with the requirements that have been shown by their system-level analysis to
have an associated hazard. The metric desired for software safety is a safety
requirements resolution metric demonstrating requirement satisfaction concentrating
222 Software System Safety Handbook, A Technical & Managerial Team Approach, Joint Software System
Safety Committee, Joint Services System Safety Panel; December 1999.

159
alone on the safety-based elements. 223 Such criteria should be defined in the test
specifications of the system’s requirement documentation.
3. Safety Requirement Reuse Reuse benefits the state of the art of Software Engineering by incorporating
elements that already meet the stringent design, development, and testing regimes
necessary to ensure their success. Once validated, high-confidence safety related
requirements could be reused across similar projects of like-specifications. On the
surface level, the reuse of any proven safety related requirement specification would
provide some assumption of completeness and increased safety of the delivered product,
but would still require a level of scrutiny and examination of the component to ensure
that it will continue to function properly in the new environment and complete system.
As such, the level of scrutiny required is directly related to the potential consequence of
the associated hazardous events. The actual measure of safety would still require a
stringent level of verification and validation to ensure that the specified safety
requirements integrate effortlessly into the overall system. Such a successful integration
of reuse would reduce the level of effort to write new requirements, increase confidence
by the use of proven specifications, and increase commonality across multiple
specification documents. At the lowest level, the use of a safety-based requirement
template or “boilerplate” provides a fundamental starting point for specification authors
to integrate into the final document.
B. THE INSTANTIATED ACTIVITY MODEL224
An Instantiated Activity Model represents the depiction of a function or process
within a system during a specific state, based on the interaction of potential elements at a
specific instance of operation. While the potential environments may be near infinite, it
is possible to model the limits of that environment to examine the interaction of the
223 McKinlay, Arch; Software System Safety, Integrating Into A Project, Proceedings from the 10th
International System Safety Conference, Dallas, 1991.

160
elements of the IAM. The Instantiated Activity Model introduced in this dissertation is
designed to provide an assessment value at an instance of the system’s activity, based on
state and environment. Where software is highly reactive to its environment, it is
imperative to devise a model that can measure a system for each possible state instance.
The IAM, Instantiated Activity Model, is a typical IPO (Input–Process–Output)
block schema dealing with a set of related activities such as Input, Process, Output,
Failure, Malfunction, etc, as depicted in Figure 12. As shown, it is possible to associate a
potential failure with each activity of the system. For instance, Input I1 with potential
failure F1, through successive activities Process P1 and Output O1 would result in a
failure leading to a Malfunction M1. The IAM reveals the relationship between the
essential IPO activities, the potential failures, and the hazardous situation or malfunction.
Figure 12 Basic Instantiated Activity Model Example
The IAM representation in this dissertation assumes a direct flow from Input to
Output through a Process. In complex IPO cases where loops are part of the process flow,
then assessors must consider the simultaneous or selective natures of the loop input and
output and their influence on the final process. Should a failure occur in the loop process,
the assessment must consider the ability for the loop failure to migrate back into the
process flow and ultimately affect the occurrence of a hazardous event. Loops must be
evaluated for the number of repetitious events or iterations that they may execute during
the evaluation period as well as the probability that the execution will influence the
224 Luqi, Lynn Zhang, Documentation Driven Agile Development for Systems of Embedded Systems,
Published in the Monterey Workshop on Software Engineering for Embedded Systems: from Requirement to Implementation, Chicago, Illinois, 24-26 September 2003.
I1 P1 O1
F1
F2
F3
M1

161
process flow. Unique to loop cases is the fact that the probability of failure will increase
towards 100% as the process flow repetitively cycles for a given period as illustrated in
Equation 2.
Pperiod = 1 – (1 – Pevent)n Where: Pperiod is the Probability of an Event Occurrence over a defined period of
multiple cycles Pevent is the Probability of an Event Occurrence over a single cycle n is the number of cycles that occur during a defined period
Equation 2 Loop Probability Equation225
The failure of the Patriot Missile System in the 1991 Operation Desert Storm
conflict is a classic illustration of a catastrophic event related to a loop based failure.226
In the Patriot case, the fire control system’s clock experienced a minuscule rounding error
with each cycle. Over an extended period of time, the clock error compound to a
significant value, eventually reducing the integrity of the navigation solution and
degrading the ability of the missile system to engage a target. Each iteration of the
clock’s computation was flawed due to a design weakness that assumed the system’s
operational interval to be relatively short. Testing, had it taken into account the factor of
an extended operational period, would have revealed the compounded probability factor
to the failure. As the period cycle number ( n ) increases, then the effect of the event
probability ( Pevent ) has a greater influence on the total probability for that period (Pperiod).
The tragedy of the Patriot example is that the event could have been prevented and lives
saved had (1) the developers taken into consideration the potential for a loop based
failure over an extended period, or (2) the users employed the system for the limited
purpose for which it was designed for.
225 Walpole, R.E. and Meyers, R.H., Probability and Statistics for Engineers and Scientists, Prentice
Hall; 7th edition, Upper Saddle River, New Jersey; January 2002. 226 See APPENDIX B.4 –
PATRIOT MISSILE FAILS TO ENGAGE SCUD MISSILES IN DHAHRAN

162
Failures have the potential to lead to a range of actions from malfunctions to
mishaps. There can be many failures on inputs, processes, and outputs that do not lead to
a mishap, although they may lead to another system malfunction. It is more efficient to
assign resources to assess failure modes that have the potential to lead to a mishap vice
the blanket assessment of all failures. As the assessment process becomes more refined,
it will be possible to isolate and eliminate failure modes that have no effect on the final
safety of the system.
Additional process elements may be depicted using various symbols and graphics,
according to the needs and preference of the analysts. Invariants and post–conditions of
each process and of the system can be defined by activity limits, assuming the system
remains within operating parameters. Limits can be used as one of the possible indicators
for identifying potential failure. Depending on the system under investigation and the
consequence of a limit–type failure, an un–handled limit violation may result in a
hazardous event. Any graphic symbols used in the depiction should be referenced and
defined in the graph body. Examples of graphic symbols include, but are not limited to:
IPO Activities, Modifiers, and
Constraints Assessing Factors Composite IAM
Input Failure Events Conjunctive
Process Current Activity Selective
Output Dependent Activity {|DA|} Simultaneous
Limit Potential Malfunction
Filter Figure 13 Essential Graphic Elements for IPO Block
Input: The basic IAM IPO activity that transports data and system process flow into a Process activity for computation, manipulation, and/or execution. The Input activity does not change the data value, serving only as a transport mechanism.
In Fn
Pn An
On
MnLn
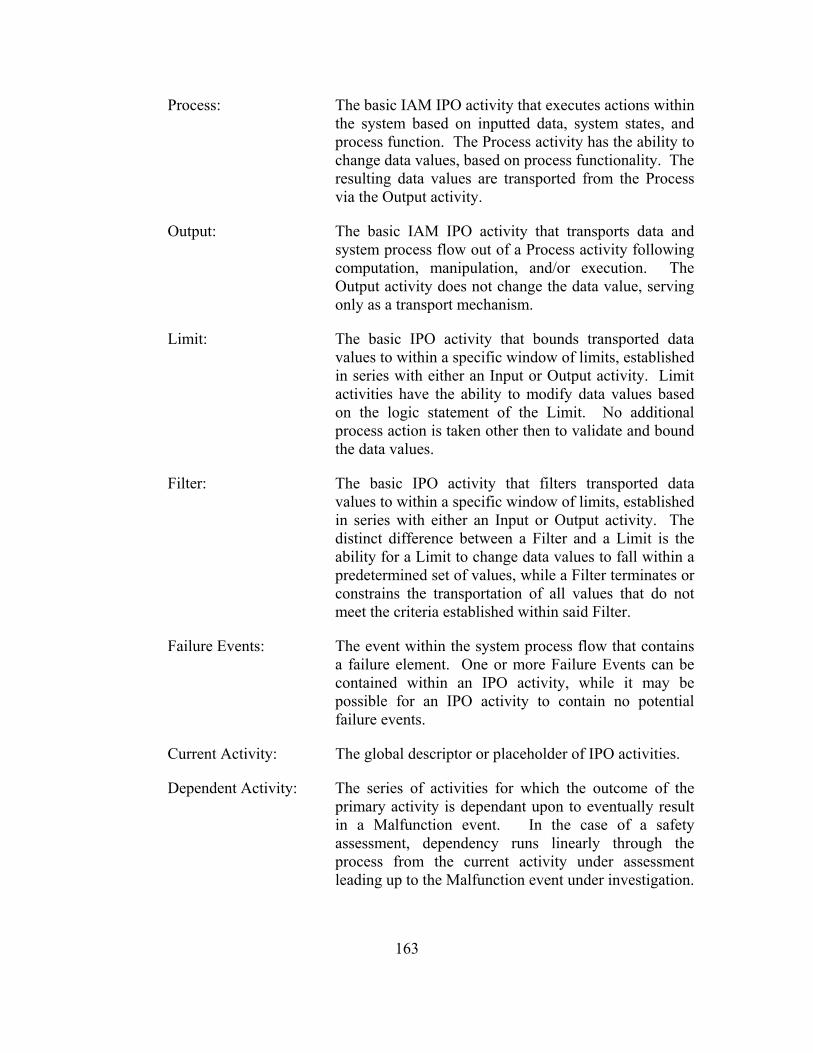
163
Process: The basic IAM IPO activity that executes actions within the system based on inputted data, system states, and process function. The Process activity has the ability to change data values, based on process functionality. The resulting data values are transported from the Process via the Output activity.
Output: The basic IAM IPO activity that transports data and system process flow out of a Process activity following computation, manipulation, and/or execution. The Output activity does not change the data value, serving only as a transport mechanism.
Limit: The basic IPO activity that bounds transported data values to within a specific window of limits, established in series with either an Input or Output activity. Limit activities have the ability to modify data values based on the logic statement of the Limit. No additional process action is taken other then to validate and bound the data values.
Filter: The basic IPO activity that filters transported data values to within a specific window of limits, established in series with either an Input or Output activity. The distinct difference between a Filter and a Limit is the ability for a Limit to change data values to fall within a predetermined set of values, while a Filter terminates or constrains the transportation of all values that do not meet the criteria established within said Filter.
Failure Events: The event within the system process flow that contains a failure element. One or more Failure Events can be contained within an IPO activity, while it may be possible for an IPO activity to contain no potential failure events.
Current Activity: The global descriptor or placeholder of IPO activities.
Dependent Activity: The series of activities for which the outcome of the primary activity is dependant upon to eventually result in a Malfunction event. In the case of a safety assessment, dependency runs linearly through the process from the current activity under assessment leading up to the Malfunction event under investigation.
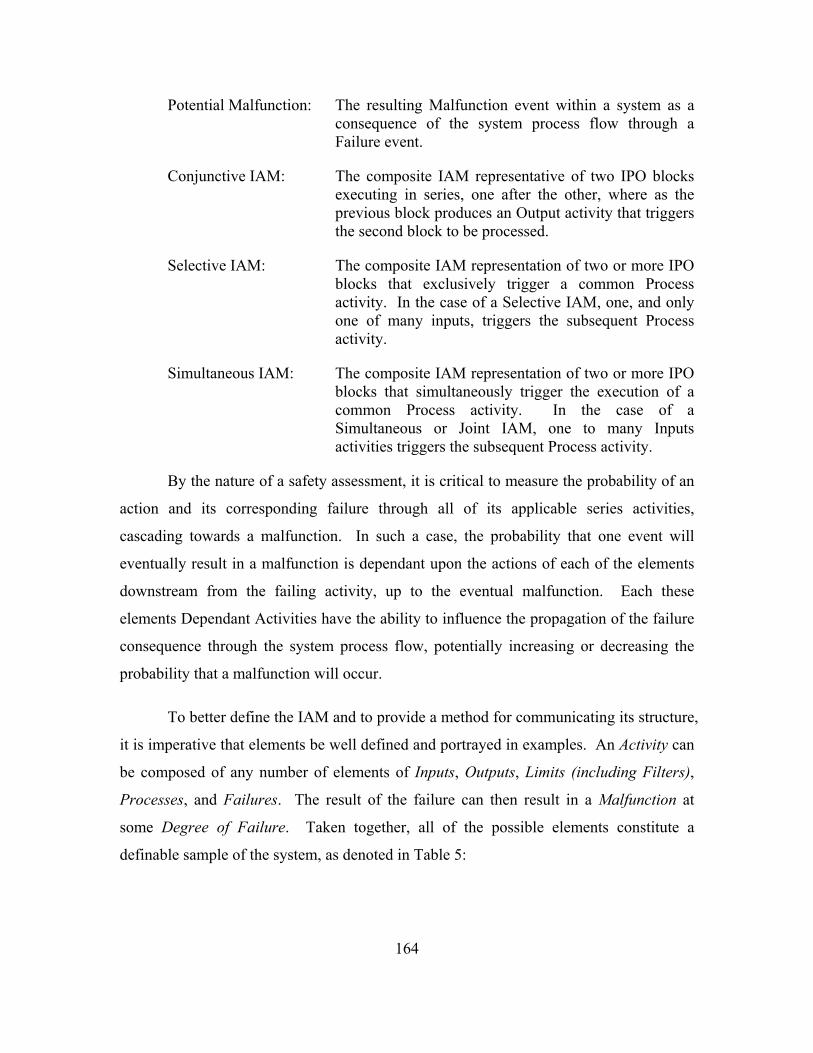
164
Potential Malfunction: The resulting Malfunction event within a system as a consequence of the system process flow through a Failure event.
Conjunctive IAM: The composite IAM representative of two IPO blocks executing in series, one after the other, where as the previous block produces an Output activity that triggers the second block to be processed.
Selective IAM: The composite IAM representation of two or more IPO blocks that exclusively trigger a common Process activity. In the case of a Selective IAM, one, and only one of many inputs, triggers the subsequent Process activity.
Simultaneous IAM: The composite IAM representation of two or more IPO blocks that simultaneously trigger the execution of a common Process activity. In the case of a Simultaneous or Joint IAM, one to many Inputs activities triggers the subsequent Process activity.
By the nature of a safety assessment, it is critical to measure the probability of an
action and its corresponding failure through all of its applicable series activities,
cascading towards a malfunction. In such a case, the probability that one event will
eventually result in a malfunction is dependant upon the actions of each of the elements
downstream from the failing activity, up to the eventual malfunction. Each these
elements Dependant Activities have the ability to influence the propagation of the failure
consequence through the system process flow, potentially increasing or decreasing the
probability that a malfunction will occur.
To better define the IAM and to provide a method for communicating its structure,
it is imperative that elements be well defined and portrayed in examples. An Activity can
be composed of any number of elements of Inputs, Outputs, Limits (including Filters),
Processes, and Failures. The result of the failure can then result in a Malfunction at
some Degree of Failure. Taken together, all of the possible elements constitute a
definable sample of the system, as denoted in Table 5:

165
I = I1 ∪ I2 … ∪ In is all sets of Input activities in the system, where I1 = {i11, i12, i13,
… , i1m} collects all of a specific Input activities for a given IPO block
P = P1 ∪ P2 … ∪ Pn is all sets of Process activities in the system, where P1 = {p11, p12, p13, … , p1m} collects all of a specific Process activities for a given IPO block
O = O1 ∪ O2 … ∪ On is all sets of Output activities in the system, where O1 = {o11, o12, o13, … , o1m} collects all of a specific Output activities for a given IPO block
A = I ∪ P ∪ O is the set of all activities in the systems
L = L1 ∪ L2 … ∪ Ln is all sets of Limit Constraints in the system, where L1 = {l11, l12, l13, … , l1m} collects all of a specific Limit Constraints on a specific system
F = F1 ∪ F2 … ∪ Fn is all sets of Failure Events in the system directly relating to specific IPO Activities on a specific system where F1 = {f11, f12, f13, … , f1m} collects all of a specific Failure events for a given activity element.
E = L ∪ A ∪ F is the set of Events in the system, where Failure, Activity, and Limits are all events in the system
M = M1 ∪ M2 … ∪ Mn is all sets of Malfunction states in the system. Due to the interrelationships between Malfunctions, it is possible for the occurrence of one malfunction to overlap the occurrence of a second malfunction, or for one malfunction to preclude the occurrence of another.
D = {intermittent, partial, complete, cataclysmic, et al}, the enumeration of all possible degrees of failures
Table 5 IAM Safety System Objects
Because no standard arithmetic notation could be found to denote IPO flow of a
software block through associated activities and failures, it becomes necessary to
establish a set of formal notations to describe concepts using a rigorous math language,
which is useful to quantitatively analyze safety and assess risk associated with the IAM.
Such a mathematical notation makes it easier to develop proofs and algorithms that can
be reused and reassessed, adding to the precision of the method under investigation. As
this dissertation adds the concept of the IAM to the IPO, together with the concept of
mathematically computing the safety of a software system, it is essential to establish an
arithmetic foundation for which to base the subsequent safety calculations upon.

166
(1). Pe (a) Execution Probability Operator that transforms a activities to probability, where a ∈ A
(2). Pf (f, d) Failure Probability Operator that transforms f failures at degree d to probability, where f ∈ F, d ∈ D
(3). f ^ a Failure f of Activity a that is, f is associated with a where f ∈ F, a ∈ A; to denote the appearance of a specific Failure f when performing Activity a.
(4). fi^ aj {[ak]} M1
M1 depends on (f1, f2,…fn, a1, a2, …an)
Failure Fi associated with Activity aj, through Dependent Activity ak, it can result in a failure leading to a hazardous situation and malfunction M, where Fi ∈ F, ak ∈ A, Ml ∈M
Table 6 IAM Basic Notation Definitions
The third notation in Table 6 refers to the Failure within a block, which is a
simplistic block with a single failure, while the fourth notation refers to the Failure of a
block with throughput to a Malfunction. The addition of the through block represents the
remainder of the process, including the malfunction. There may be several failure modes
within a computational block that may not lead to a malfunction. Depending upon
available resources, the assessment may need to concentrate on failure modes within the
block that lead to hazardous events, disregarding benign failures.
1. Formal Safety Assessment of the IAM The IAM example for a given IPO block deals with several aspects of failure
combined to form the potential malfunction M1, as illustrated in Figure 14.

167
Figure 14 IAM Safety Analyses Notation
This diagram shows three different possible causes for malfunction M1. The first
emphasis is on the Input I1 with the possible Failure F1. The failure of input activity
through dependent activities of process and output may result in a failure leading to a
hazardous situation. Similarly, the other two failure aspects are in the process P1 and
output O1, associated with possible failure F2, F3, respectively. Figure 14 illustrates the
concept of multiple of activities combining to form the Malfunction M1. Note that
Example 1 is depicted as the left side of Figure 14. Using Table 6, we can represent this
as:
(F1 ^ I1 {[P1, O1]} M1) or (F2 ^ P1 {[O1]} M1) or (F3 ^ O1 M1)
Example 1 IAM Safety Analyses Mathematical Representation
Further, all of these portions combined will result in a failure leading to
Malfunction M1. In this way, the potential malfunction for the IAM can be formulated as
follows:
M1 ≤ F1 ^ I1 {[P1, O1]} ∪ F2 ^ P1 {[O1]} ∪ F3 ^ O1
Example 2 Malfunction Representation of the IAM Analyses
The assessment of the elements of the IAM results in the final potential
occurrence of malfunction M1. It utilizes either a qualitative and quantitative approach
employing principles of statistics and probability to determine the level of safety risk,
I1 P1 O1
F1
F2
F3
M1
F1
F2
F3
I1
P1
O1
{P1, O1} M1
{O1} M1 Denotes:
M1

168
likelihood of hazardous events, and the economic cost–benefit of correcting the flaws
through the lifecycle of a software system. It also reveals that pre–identification of
potential hazards before the start of development balances the development against effect
and cost.
2. Composite IAM Beginning with the IAM for a given IPO block, we consider the more complex
scenarios of a composite IAM. Fundamentally, there are three composing methods:
Conjunctive, Selective, and Simultaneous composites, as shown in Figure 15. Other IAM
representations exist, but are more complex and are beyond the scope of the introduction
intended in this dissertation. The Conjunctive IAM represents two IPO blocks executing
in series, one after the other. The previous block produces output O1 that triggers the
second block to be processed. The Selective IAM represents three IOP blocks working
together (the ◊ representing selection). One of the two previous blocks produces output
O1 or O2 that exclusively triggers the P3 processing. The Simultaneous or Joint IAM
represents three IOP blocks working together (the ○ representing simultaneity), and both
previous blocks produce outputs O1 and O2 that jointly trigger the P3 block.

169
Figure 15 Composite IAM Representations
For the conjunctive IAM, Example 2 can be applied to get the intermediate
Malfunction Mx produced by the previous block. The output O1 of the previous block
will be treated as the input for the second block, as depicted in Figure 16 as:
Figure 16 Conjunctive IAM split into Individual IAMs
I2 O2
F2 P1
F1 F3
F5 P2
F4 F6
O2 F7 P3 1
F8
I1 O1
I2 O2
F2 P1
F1 F3
F5 P2
F4 F6
O2 F7 P3 M1
F8
(a) Conjunctive
(b) Selective
(c) Simultaneous
I2 F2 P1
O2F5 P2 M1
F6
F 2 P 1 Mx
F 5 P 2 M 1
I1 O1 I2 O2
F 1 F 3
F 6
F1 F3
I1 O1 F3 F6
I2 O2
F2 P1 F5 P2 M1
I1 O1
I1 O1
F1 F3

170
Mx = F1^ I1 {[P1, O1]}∪ F2 ^ P1 {[O1]}∪ F3 ^ O1
M1=Mx ^ I2 {[P2, O2]}∪ F5 ^ P2 {[O2]}∪ F6 ^ O2
Example 3 Conjunctive IAM Mathematical Representation
Therefore, the conjunctive IAM can be logically split into two individual IAMs.
Once the factors of the individual IPO blocks are determined, such as input, process, and
output and their associated failures, individual IAMs can be applied to analyze the safety,
shown as Figure 16.
For the selective IAM, shown as Figure 15.b, there are three IPO blocks (I1, P1,
O1), (I2, P2, O2), ([O1 ◊ O2], P3, O3), each of which can be treated as an individual IAM.
A new notation is introduced for the selective IAM: [O1 ◊ O2]; meaning that one and only
one of two inputs trigger the execution of process P3. Hereby the combined effect of [O1
◊ O2] as inputs on the third IPO block, as M1^O1 ∩ M2^O2, will produce the safety risk.
This can be interpreted as a potential lower boundary assessment for the safety
assessment. According to Example 2, the first two blocks may produce failures leading
to malfunctions M1 and M2, respectively, while selective inputs may produce failure
leading to M3.
Quantitatively, applying the definitions of Table 6, the probability of failure can
be formulated for the IAM. For the Basic IAM shown in Figure 12, the probability of
failure for various types (failure degree) is the sum of the probability of activity failure by
probability of activity, illustrated as follows:

171
A1
As M1 depends on (F1, I1, P1, F2, O1, F3) then Pf (Mi, d) ≤ Σ (Pf (Fi, d) * Pe (Ai) * Pe (Ai {DAi}))
Where: Pf (Fi, d) is Probability of Activity Failure, Pe (Ai) is Probability of Activity Execution, Pe (Ai {DAi}) is Probability of Series Dependant Activity Execution.
Pf (M1, A1) ≤ (Pf (F1, I1) + Pf (F2, P1) + Pf (F3, O1)) * Pe (A1)
Equation 3 IAM Summation
For the purpose of this dissertation, the Instantiated Activity Model is illustrated
in terms of a notional aircraft weapon arming and control software system (WACSS).
The weapons arming system is required to control the arming of specific weapons for
deployment, store weapon’s configurations and loadouts in a selectable menu, prevent
inadvertent weapons release, prevent intentional release outside of permitted envelopes,
and provide selectable fuse–arming delays to ensure sufficient separation of the weapon
from the delivery unit. The WACSS would function as a subsystem of a greater stores
controller and aircraft avionics system.227, 228 The WACSS has a high potential for a
hazardous event, as it controls explosive ordnance in a combat environment and
interfaces with the avionics system of a high–performance military aircraft. Both
ordnance and aircraft have the potential to cause significant property damage as well as
take the lives of persons within their destructive radius. The destructive radius of a
227 DRAFT Joint CAF and USN Operational Requirements Document for Joint Direct Attack Munitions
(JDAM) CAF 401-91-III-A, Office of the Undersecretary for Defense (Acquisition & Technology); 16 December 1998.
228 8th Fighter Wing Weapons Attack Guide, 8th Fighter Wing, U.S. Air Force; Kunsan Air Base, Korea; December 2000.
I1 P1 O1
F1
F2
F3
M1

172
military weapon can range from a few dozen yards to over a half mile, depending on the
specific weapon and method of employment.
We present an approach capable of improving the software process by increasing
software safety and reducing the probability of hazardous events. This approach is
compiled into a repetitive cycle of five phases, namely:
1. Hazard Identification
• System Task and Safety Requirement Analysis
• Investigation and Inspection
• Development of Consequence Severity Categories and Threshold
2. Software Safety Assessment
• Consequence Severity
3. Safety Decision Making and Development
• Process Flow Mapping
• Initial Failure Depiction
• Assessing Process
• Change Determination through Threshold Establishment
4. Implementation of Safety Controls
• Acceptance, Avoidance, Reduction, Spreading, and Transference
• Design and Development
5. Supervision of Safety Changes
• Implementation
• Assessments of Validity / Effectiveness
• Repeat
C. INITIAL IDENTIFICATION OF THE HAZARD
For each system, it must be determined whether hazards exist if the system were
to experience any failure to meet project requirements. Specific hazards that exist must
be identified and their consequences determined. Further analysis includes the review of
potential hazards that may occur during the normal operation of the system within the

173
parameters of system development requirements, and the review of potential hazards not
constrained by system requirements. Such a review could be potentially overwhelming
and devour precious resources if not well managed and constrained. The evaluation can
be derived using system requirements and historical precedents. Hazards beyond the
constraints of system requirements require a review of similar systems that may have
hazards not considered in the development of the primary system. A review of system
functionality should include the inspection for potential hazards that could be induced
due to failed or missing system requirements. The initial identification could be an ad–
hoc inspection at the system concept level to determine possible consequences of system
failure. A more in–depth identification of system hazards can be accomplished with each
progression in the development process, including revisions and supplements to the
system requirements. Hazards should be investigated for their occurrence over the three
possible states of the system:
• When the system fails to function properly – checking to see if an
improper functionality of the system will result in a hazard,
• When the system fails to function – checking to see if the system is
incapable of controlling them, and
• When the system functions properly – checking to see the existence of
inherent hazards within the system.
Using the Spiral Development Concept, the initial examination would be
strengthened and refined through each consecutive iteration of development and
inspection. Subsequent cycles permit a more detailed examination of the development
and potential consequences of failure.
Step 1. Action 1. - System Task / Safety Requirement Analysis – Identify the
primary safety requirements of the system through a review of concept level
requirements, including system objects, properties, tasks, and events. Identify system
safety requirements as they pertain to system state and operating environment.
Additional safety requirements may be identified using historical precedents and
rationalization from similar systems. System requirements should be inspected for

174
completeness and the inclusion of system safety logic controls and interlocks, where
applicable. Assessments should be made to evaluate size, time, effort, defects, and
system complexity.
Step 1. Action 2. - Hazard Identification – Perform a hazard identification of
the software system based on concept level system requirements, system tasks, and
historical precedents. Identification includes identifying the Hazards, Consequences,
and Malfunctions potentially occurring from the three states of hazard occurrence.
Hazards should be identified by their consequence, malfunction, system state, and
failure required to generate the consequence. The Initial Hazard Identification is critical
to system development as it establishes a foundation for the rest of the assessment. A
system may have multiple potential hazards, based on the system design and the objects it
controls. Likewise, each hazard may have multiple faults and triggers that set it in
motion. This cursory inspection permits early identification and prioritization of
potential hazards before the system begins to firmly take shape, as shown in the example
of APPENDIX E.1 of this dissertation. Fault and trigger229 controls and interlocks will
be discussed later in this chapter.
During the Initial Hazard Identification Phase, faults, triggers, and specific
failures may not be identified due to the infancy of the development process. The only
resources available at this stage for hazard inspection and identification may be the
System Concept Documents, Initial System Requirement Specifications, and other
preliminary documents. As demonstrated in Table 20 and Table 22, malfunctions,
hazards, and consequences may be grouped where similar in composition and content.
Note, that while some categories may permit items to be consolidated, their root causes
retain some value of independence. This root independence contributes to a unique series
of safety assessments and failure probabilities for each branch of the failure. In some
cases, multiple root failures may be set in motion by a single trigger. Each failure event
229 Note: See Chapter II.C of this Dissertation for discussion and definitions of faults, triggers, and
failures as they apply to software system safety.

175
may have its own distinct probability of occurrence before joining with other events
further down the process line.
The inspection and object identification should consist of both forward and back–
flow process inspections to determine all potential safety–related objects. The
accomplishment of various “what–if” and “why” scenarios permits a review of the
system from both ends of the process spectrum, from input to output. The actual testing
method used by the assessment team depends on the system being tested, the ability to
extract data from the tests, and the applicability of the tests to overall system safety.
Inspections should attempt to identify the location of a potential failure with respect to
the system flow, the degree of a failure and its potential propagation to other failures
(snowball), the times or instances for which the failure might occur, and the repetition
rate of the failure. Such properties make up what can be referred to as “failure
exposure.”230
Subsequent inspections will identify hazards and triggers to a greater detail, based
on the level of development of the system and its relationship to potentially hazardous
objects. The goal of making the IAM measurement on probability of failure is to identify
potential hazards before the start of development, thereby providing the opportunity to
balance development against effect. The degree of effort and detail in characterizing
potential causes of a hazard should be commensurate with the severity of resulting
consequences. The methods used to identify hazards and their causes, and to categorize
severity should be well documented.
D. INITIAL SAFETY ASSESSMENT
The Identification and Assessment phases rely on multiple sources of evidence
and contextual material to determine a level of safety for the system. Presenting these
relationships, while preserving the flow and readability of the process depiction, is
extremely difficult but essential to the success of the assessment. The more in depth an
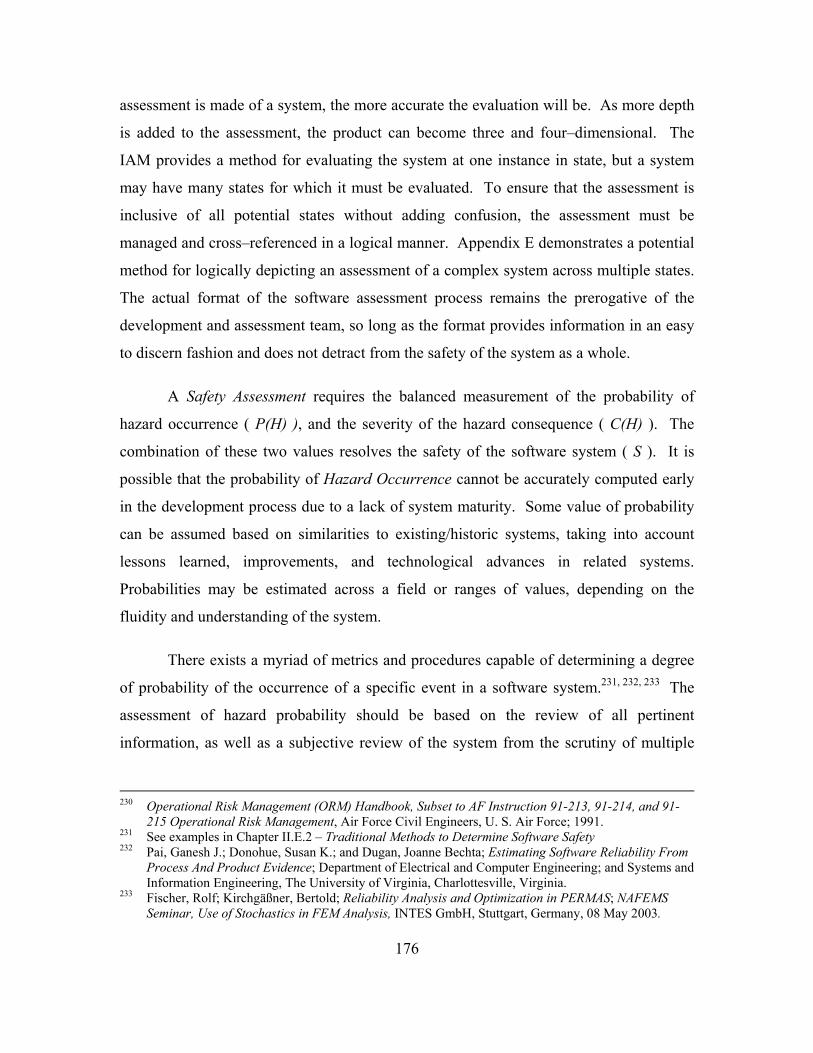
176
assessment is made of a system, the more accurate the evaluation will be. As more depth
is added to the assessment, the product can become three and four–dimensional. The
IAM provides a method for evaluating the system at one instance in state, but a system
may have many states for which it must be evaluated. To ensure that the assessment is
inclusive of all potential states without adding confusion, the assessment must be
managed and cross–referenced in a logical manner. Appendix E demonstrates a potential
method for logically depicting an assessment of a complex system across multiple states.
The actual format of the software assessment process remains the prerogative of the
development and assessment team, so long as the format provides information in an easy
to discern fashion and does not detract from the safety of the system as a whole.
A Safety Assessment requires the balanced measurement of the probability of
hazard occurrence ( P(H) ), and the severity of the hazard consequence ( C(H) ). The
combination of these two values resolves the safety of the software system ( S ). It is
possible that the probability of Hazard Occurrence cannot be accurately computed early
in the development process due to a lack of system maturity. Some value of probability
can be assumed based on similarities to existing/historic systems, taking into account
lessons learned, improvements, and technological advances in related systems.
Probabilities may be estimated across a field or ranges of values, depending on the
fluidity and understanding of the system.
There exists a myriad of metrics and procedures capable of determining a degree
of probability of the occurrence of a specific event in a software system.231, 232, 233 The
assessment of hazard probability should be based on the review of all pertinent
information, as well as a subjective review of the system from the scrutiny of multiple
230 Operational Risk Management (ORM) Handbook, Subset to AF Instruction 91-213, 91-214, and 91-
215 Operational Risk Management, Air Force Civil Engineers, U. S. Air Force; 1991. 231 See examples in Chapter II.E.2 – Traditional Methods to Determine Software Safety 232 Pai, Ganesh J.; Donohue, Susan K.; and Dugan, Joanne Bechta; Estimating Software Reliability From
Process And Product Evidence; Department of Electrical and Computer Engineering; and Systems and Information Engineering, The University of Virginia, Charlottesville, Virginia.
233 Fischer, Rolf; Kirchgäßner, Bertold; Reliability Analysis and Optimization in PERMAS; NAFEMS Seminar, Use of Stochastics in FEM Analysis, INTES GmbH, Stuttgart, Germany, 08 May 2003.
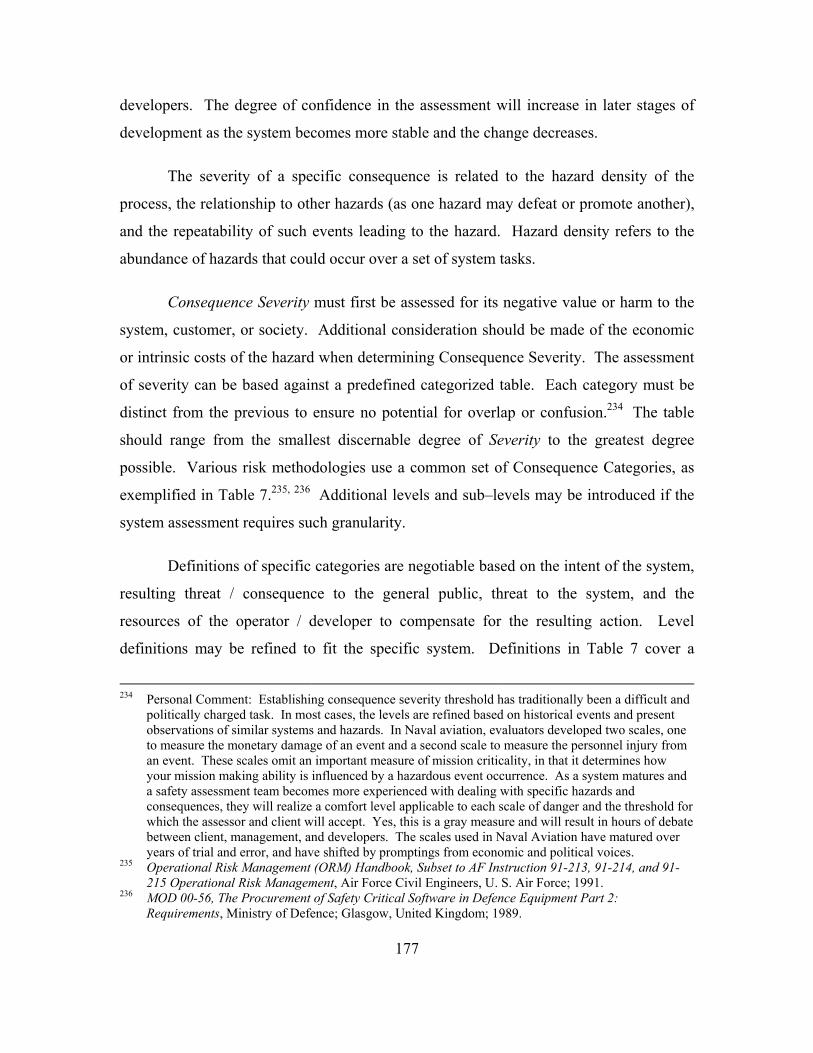
177
developers. The degree of confidence in the assessment will increase in later stages of
development as the system becomes more stable and the change decreases.
The severity of a specific consequence is related to the hazard density of the
process, the relationship to other hazards (as one hazard may defeat or promote another),
and the repeatability of such events leading to the hazard. Hazard density refers to the
abundance of hazards that could occur over a set of system tasks.
Consequence Severity must first be assessed for its negative value or harm to the
system, customer, or society. Additional consideration should be made of the economic
or intrinsic costs of the hazard when determining Consequence Severity. The assessment
of severity can be based against a predefined categorized table. Each category must be
distinct from the previous to ensure no potential for overlap or confusion.234 The table
should range from the smallest discernable degree of Severity to the greatest degree
possible. Various risk methodologies use a common set of Consequence Categories, as
exemplified in Table 7.235, 236 Additional levels and sub–levels may be introduced if the
system assessment requires such granularity.
Definitions of specific categories are negotiable based on the intent of the system,
resulting threat / consequence to the general public, threat to the system, and the
resources of the operator / developer to compensate for the resulting action. Level
definitions may be refined to fit the specific system. Definitions in Table 7 cover a
234 Personal Comment: Establishing consequence severity threshold has traditionally been a difficult and
politically charged task. In most cases, the levels are refined based on historical events and present observations of similar systems and hazards. In Naval aviation, evaluators developed two scales, one to measure the monetary damage of an event and a second scale to measure the personnel injury from an event. These scales omit an important measure of mission criticality, in that it determines how your mission making ability is influenced by a hazardous event occurrence. As a system matures and a safety assessment team becomes more experienced with dealing with specific hazards and consequences, they will realize a comfort level applicable to each scale of danger and the threshold for which the assessor and client will accept. Yes, this is a gray measure and will result in hours of debate between client, management, and developers. The scales used in Naval Aviation have matured over years of trial and error, and have shifted by promptings from economic and political voices.
235 Operational Risk Management (ORM) Handbook, Subset to AF Instruction 91-213, 91-214, and 91-215 Operational Risk Management, Air Force Civil Engineers, U. S. Air Force; 1991.
236 MOD 00-56, The Procurement of Safety Critical Software in Defence Equipment Part 2: Requirements, Ministry of Defence; Glasgow, United Kingdom; 1989.

178
system capable of physical injury and significant economical loss. Consequence Severity
definitions may be significantly different for unique systems that may not result in
physical injury or monetary loss, but may result in damage to the system or the
environment. It may be necessary to further characterize terms used in severity
definitions to eliminate confusion and provide distinct boundaries between severity levels.
For example, in Table 7, definitions or examples may be provided for major, minor, and
less then minor mission degradations, injuries, or system damages. Severity level ordinal
values are introduced for brevity reference later in the assessment process.
For determination of a Safety Index, the severity definition is matched with a
corresponding numeric value, ranging from 0 to 1.0. The severity value can then be used
to calculate the final value of safety.
LEVEL DEFINITION
1.0 I – CATASTROPHIC Complete mission failure, loss of life, or loss of the system.
0.6 II – CRITICAL Major mission degradation, severe injury or occupational illness, or major system damage
0.3 III – MARGINAL / MODERATE Minor mission degradation, minor injury or occupational illness, or minor system damage SE
VE
RIT
Y
0.0 IV – NEGLIGIBLE Less then minor mission degradation, injury, illness, or minor system damage.
Table 7 Basic Consequence Severity Categories
Step 2. Action 1. - Development of Consequence Severity Categories – Develop
a prioritized list of Consequence Severity Categories, ranging from the most severe to
the least severe possible consequence. Severity categories should be well defined to
eliminate confusion and provide distinct boundaries between.
Step 2. Action 2. - Initial Hazard Assessment – Perform an initial hazard
assessment of the system by classifying hazards according to Consequence Severity,
based on an agreed table of Consequence Severity Categories.

179
One military software system may consider a Catastrophic Consequence to be the
death of three or more service members in a single incident, while a Critical
Consequence might be the death of one or two service members. A commercial
refrigeration software control system might consider a Critical Consequence to be the
complete spoilage of a refrigerator’s contents, while a Catastrophic Consequence could
be the release of Freon refrigerant into the atmosphere and subsequent EPA fine. Naval
Aviation uses a classification matrix based on the amount of monetary damage, personnel
injury, disability, and death, as depicted in Table 8.
LEVEL DEFINITION
A Total damage cost if $1,000,000 or more and/or aircraft destroyed and/or fatal injury and/or permanent disability
B Total damage cost is $200,000 but less then $1,000,000 and/or permanent partial disability and/or hospitalization of three or more personnel.
SEV
ERIT
Y
C Total damage cost is $20,000 but less then $200,000 and/or five lost workdays.
Table 8 OPNAV Mishap Classification Matrix237
For the purpose of the WACSS example, Table 21 is included to demonstrate a
probable Consequence Severity depiction. Optimally, each consequence should be
evaluated, at a minimum, on:
• The importance / critically of the operation of the system to mission
accomplishment,
• The consequence’s effect on the continued operation of the system,
• The ability of the system to recover from the consequence,
237 OPNAV INSTRUCTION 3750.6R, Naval Aviation Safety Program, Chief of Naval Operations,
Department of the Navy; 01 March 2001.
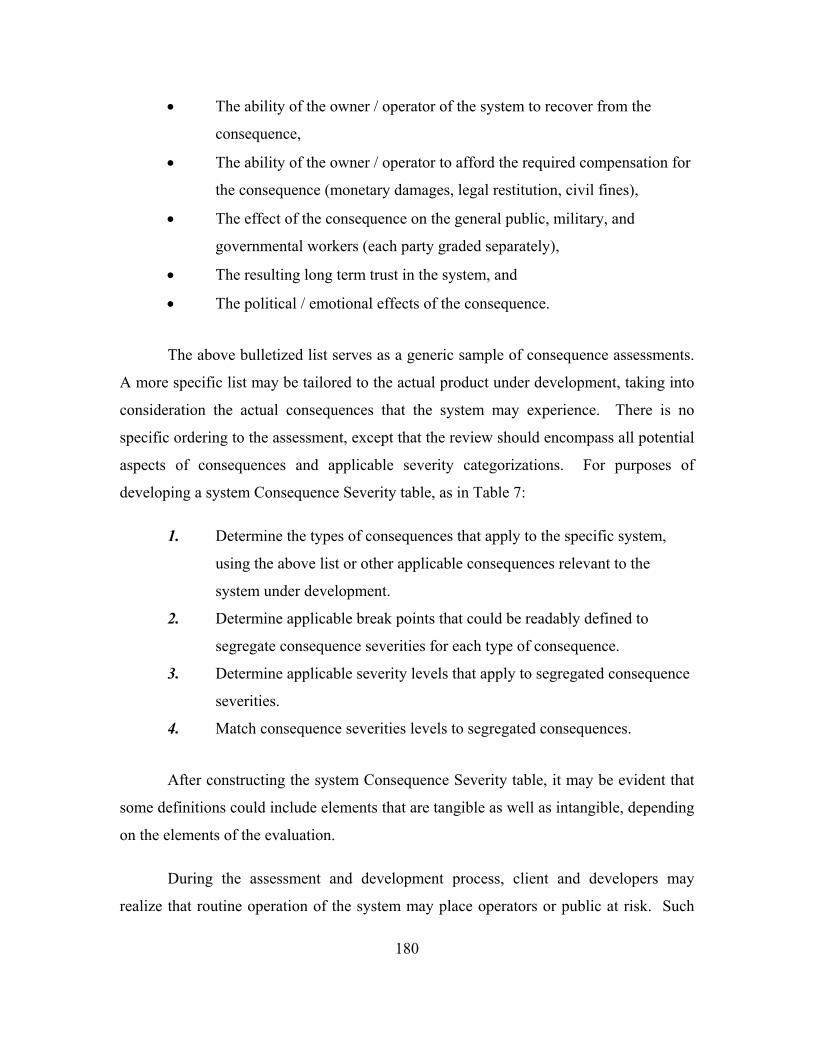
180
• The ability of the owner / operator of the system to recover from the
consequence,
• The ability of the owner / operator to afford the required compensation for
the consequence (monetary damages, legal restitution, civil fines),
• The effect of the consequence on the general public, military, and
governmental workers (each party graded separately),
• The resulting long term trust in the system, and
• The political / emotional effects of the consequence.
The above bulletized list serves as a generic sample of consequence assessments.
A more specific list may be tailored to the actual product under development, taking into
consideration the actual consequences that the system may experience. There is no
specific ordering to the assessment, except that the review should encompass all potential
aspects of consequences and applicable severity categorizations. For purposes of
developing a system Consequence Severity table, as in Table 7:
1. Determine the types of consequences that apply to the specific system,
using the above list or other applicable consequences relevant to the
system under development.
2. Determine applicable break points that could be readably defined to
segregate consequence severities for each type of consequence.
3. Determine applicable severity levels that apply to segregated consequence
severities.
4. Match consequence severities levels to segregated consequences.
After constructing the system Consequence Severity table, it may be evident that
some definitions could include elements that are tangible as well as intangible, depending
on the elements of the evaluation.
During the assessment and development process, client and developers may
realize that routine operation of the system may place operators or public at risk. Such

181
risks must be evaluated in the same manner as other hazardous events and be an integral
part of the final determination of the system’s overall safety. The ultimate decision to
continue production and employment of the system must judge if the risk and potential
harm outweighs the benefit received from the operation of the system.
Subsequent assessments will identify additional hazard exposures, frequency, and
probability based on the level of development and logic / functionality of the software
system. One goal of the initial hazard assessment is to determine acceptable levels of
failure based on hazard consequence severities. Potential results of the initial hazard
assessment may include:
• A review of the budget assessed for the development, including additional
budgetary requirements necessary to overcome, prevent, or mitigate
identified consequences,
• A review of the proposed development schedule for the refined effort
required to manage identified consequences,
• A review of system development requirements for applicability, taking
into consideration newly and categorized consequences,
• A review of the capabilities of assigned developers and their abilities to
overcome identified consequences using current methods, and
• The ultimate cost–benefit decision to continue or discontinue the
development process.
These assessments will be used to direct the effort of the development process,
optimally reducing the overall hazard potential through proper design. The methods used
to assess consequences should be agreed upon before identification and should be well
documented.

182
E. SOFTWARE DEVELOPMENT AND DECISION MAKING
Once hazards have been initially identified and assessed, it is then possible to
develop the system using goal-oriented methods. The goal of the development should be
to build a software system that produces as few hazards as possible, placing a greater
emphasis on hazards with the most significant consequences.
The IAM, Instantiated Activity Model, is a typical IPO (Input–Process–Output)
block schema dealing with a set of related activities such as Input, Process, Output,
Failure, Malfunction, etc, as depicted in Figure 12. A shown, it is possible to associate a
potential failure with each activity of the system. For instance, Input I1 with potential
failure F1, through successive activities Process P1 and Output O1 would result in a
failure leading to a Malfunction M1. The IAM reveals the relationship between the
essential IPO activities, the potential failures, and the hazardous situation or malfunction.
1. Process Flow Mapping Software Engineering has a virtual cornucopia of graphic models to depict
software logic process flow. Many of those models were previously reviewed in Chapter
II.E. Additional models include the Stimulus–Response Structure and Spec Syntax.238
Spec language is designed to define the environmental model of complex programs using
logic based notation and pictorial representations. Regardless of the model selected, it
must be capable of:
• Depicting the process flow of independent requirements
• Depicting the interdependencies of logic decisions
• Depicting the potential conflicts and recovery mechanisms of critical
components
• Depicting the relationship and flow of function failure to hazard execution
238 Berzins, Valdis Andris; Luqi; Software Engineering with Abstractions, Addison-Wesley Publishing;
1991.

183
After an investigation of available methods and models, it is determined that a
pseudo form of Fault Tree Analysis239 best suits the requirements of a Software Safety
Process Flow, using additional graph elements to depict both the fan–out and fan–in
characteristics of the process flow. Such a process graph analysis permits the depiction
of decision–making and process structure where, like a tree, the process can split and
branch from the trunk to cover all possible perturbations of the process, but include the
additional ability for processes to merge back together or even flow backwards as
feedback to preceding processes. Ideally, a software system would behave cyclically
with a constant set of controlled inputs. Realistically, software system can have a near
infinite set of possible inputs, depending on the declaration of the input variable. Process
graph models are well suited to portraying such variable input to output systems.
Step 3. Action 1. - Choose a Process Depiction Model – Determine the optimal
process depiction model to perform a safety assessment of the system. This process
model should be capable of depicting requirement process flow, logic decisions,
conflict and recovery, and the isolation of function failure to hazard execution.
The process flow mapping determines the initial set of blocks required to populate
the Instantiated Activity Model using the identified system requirements. Once activity
sets are identified, we populate sets with applicable high–level activity items and
properties. Items and properties include, but are not limited to, process inputs, outputs,
and connections. In accordance with the IAM and associated activities, we map the
system process to include all high–level system processes, inputs, outputs, and limits.
239 Hiller, Martin; Jhumka, Arshad; Suri Neeraj; An Approach to Analyzing the Propagation of Data
Errors in Software, (FTCS-31 and DCCA-9), The International Conference on Dependable Systems and Networks; 2001.
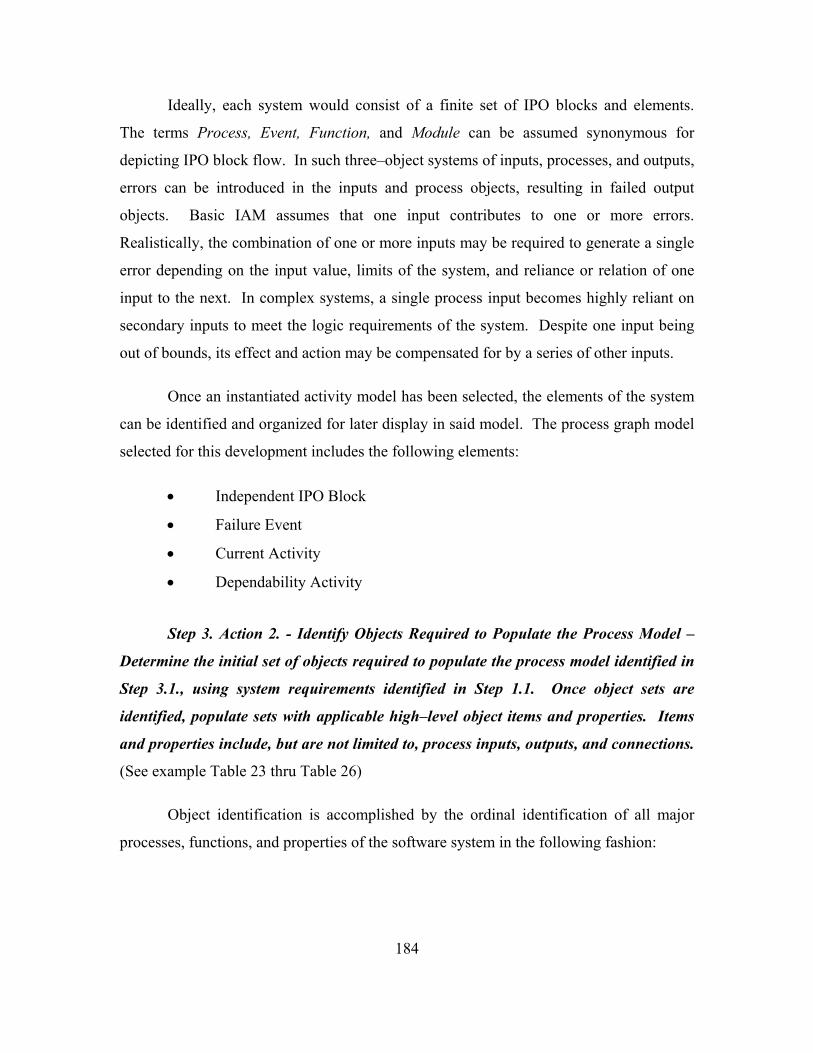
184
Ideally, each system would consist of a finite set of IPO blocks and elements.
The terms Process, Event, Function, and Module can be assumed synonymous for
depicting IPO block flow. In such three–object systems of inputs, processes, and outputs,
errors can be introduced in the inputs and process objects, resulting in failed output
objects. Basic IAM assumes that one input contributes to one or more errors.
Realistically, the combination of one or more inputs may be required to generate a single
error depending on the input value, limits of the system, and reliance or relation of one
input to the next. In complex systems, a single process input becomes highly reliant on
secondary inputs to meet the logic requirements of the system. Despite one input being
out of bounds, its effect and action may be compensated for by a series of other inputs.
Once an instantiated activity model has been selected, the elements of the system
can be identified and organized for later display in said model. The process graph model
selected for this development includes the following elements:
• Independent IPO Block
• Failure Event
• Current Activity
• Dependability Activity
Step 3. Action 2. - Identify Objects Required to Populate the Process Model –
Determine the initial set of objects required to populate the process model identified in
Step 3.1., using system requirements identified in Step 1.1. Once object sets are
identified, populate sets with applicable high–level object items and properties. Items
and properties include, but are not limited to, process inputs, outputs, and connections.
(See example Table 23 thru Table 26)
Object identification is accomplished by the ordinal identification of all major
processes, functions, and properties of the software system in the following fashion:
185
(1) Identify Software System Processes and Title (Table 23)
(2) Designate Process Object Numbers
(3) Detail Process Descriptions
(4) Identify Software System Inputs to each Process (Table 24)
(5) Designate Input Object Numbers
(6) Detail Input Descriptions
(7) Assign Relations from Inputs to Processes
(8) Identify Software System Outputs to each Process (Table 25)
(9) Designate Output Object Numbers
(10) Detail Output Descriptions
(11) Assign Relations from Outputs to Processes and Inputs
(12) Identify Software System Limits to each Input and Output (Table 26)
(13) Designate Limit Object Numbers
(14) Detail Limit Descriptions
(15) Assign Relations from Limits to Processes, Inputs, and Outputs
(16) Depict / Map the System of Processes, Inputs, Outputs, Limits, and their
Relations (Figure 21)
Steps 1 – 11 are similar to identifying the elements of a classic data flow diagram,
with the additional element of process flow. Limits are defined as the anticipated bounds
for which the system is expected to operate within, as per the development requirements.
It could be expected that operation outside of those bounds might result in a failure in the
system’s operation. The term “limits” does not infer that actual objects, limits, controls,
or interlocks exist that limit the inputs or outputs of the system to specific bounds, only
that the system should operate within those bounds. It is possible that rejected inputs
outside of acceptable limits will eliminate a safety–critical failure mode associated with
the software process. The identification of such limits should be included in system
development for the construction of applicable objects, limits, controls, and/or interlocks.
The identification of limits is not restricted to one process or data flow, but can relate to
multiple lines depending on the flow of the system.
186
Invariants and post–conditions of each process and of the system can be defined
by object limits, assuming the system remains within operating parameters. Limits can
be used as one of the possible indicators for identifying potential failure. Depending on
the system under investigation and the consequence of a limit–type failure, that un–
handled limit violation may result in a safety based hazardous event.
Step 3. Action 3. - Pictorially Map the System Process – In accordance with the
process model identified in Step 3.1., and process objects identified in Step 3.2., map
the system process, to include all high–level system processes, inputs, outputs, and
limits. (See example Figure 21)
2. Initial Failure to Process Identification The system process flow map relates system objects to potential failures and
system operating errors. Through the use of a process graph, it becomes possible to
identify the safety weaknesses within the system, matched with system processes, inputs,
outputs, and limits following the flow of system operation. Such a depiction permits the
observation of hypothetical process failure flow once a flaw is triggered. While
malfunctions, hazards, consequences, and severity are identified early in the assessment
process, a further assessment and assignment of failures to malfunctions and process
objects completes the cycle of system failure identification.
Hypothetical failures can be identified early in the analysis and development
process by reviewing the process flow graph, identifying the process line affected by
specific system operations, the particular points at which a process line may start, where
the process line may end, and which objects / relationships are required for performance
of the particular process line. A process line can be defined as a microelement of the
entire process graph with its own isolated branches and roots. A process line can include
specific inputs, outputs, and processes that are isolated for a particular event and action,
as depicted in Figure 24 thru Figure 28 (Pages 350 thru 374). Such branches and roots
are observed in the greater process graph.

187
While a system may be plagued with scores of potential failures, for the purpose
of a safety analysis, it is only essential to concentrate efforts on those failures that
eventually relate to system hazards. Other failures, or even flaws, may result in less then
optimal performance of the system, but do necessarily contribute to safety–related
hazards. Their identification and analysis are accomplished in other forms of software
development testing procedures not covered in this dissertation.
Step 4. Action 1. - Identify and Match corresponding Failures to Malfunctions.
– In accordance with the malfunctions identified in Step 1.2., and process objects
outlined in Step 3.2., identify the potential system failures that could eventually result
in identified safety–related malfunctions. If identified failures relate to malfunctions
not previously identified, return, and repeat the system assessment from Step 1, Action
2. Identified failures are then matched to specific process objects.
The identification of system failures and malfunctions should be composed in a
table similar to that of the Initial Safety Assessment Table Example of Table 20 and
further decomposed in Table 22 and Table 27. Failures, and their respective probabilities
of execution, may be derived from research, analysis, and evaluation of historical data
from similar systems. Once hypothetical failures have been identified and related to
system objects, they may then be injected into the system process map as depicted in
Figure 22. Failures can be identified by analyzing the malfunctions to determine which
process objects are susceptible to failure for a given malfunction. One failure may
propagate through the system as it follows the process flow. Such similar failures should
be grouped and sub–noted for easy identification in the process map.
While a malfunction may answer the question of “What negative action might the
system take if it was not to behave properly?”, a failure answers the cause and effect
question of “Which process and how must that process fail, to cause the system to take
such a negative action?” The initial evaluation is based completely on assumption and
examination of the hypothetical system and not on actual system’s operation, assuming a
worst–case scenario of system functionality.

188
Step 4. Action 2. - Add Identified Failures to the System Process Map – Using
the process map completed in Step 3.3., and failures identified in Step 4.1., add
identified failures to their corresponding locations on the process map using agreed
process graph symbology.
Failure to Process Identification assumes that an element of the system will fail
and result in a malfunction. The identification relies on the basic premise that the
development is imperfect and will include flaws. Once safety critical functions are
identified, additional emphasis can be placed on their development to reduce the
probability of errors in the design and development. The identification of specific
triggers and flaws is reserved for further investigation.
3. Assessing the System Process To this point in the Software Safety Process, the analysis and investigation of the
system has resulted in a series of products that both textually and graphically outline the
flow and hypothetical failure possibilities of the system. The Safety Assessment will
complete the initial investigation of the system by providing a numeric and textual result
of the investigation, as it pertains to the system’s safety and hazard avoidance. Once the
events of the system process have been mapped as they pertain to safety, it is possible to
determine the probability that a system event will occur, as well as the probability that
that event will fail to occur properly. Consideration must be taken to the conditions
mentioned in Chapter IV.B, namely the measured evaluation of specific hazards, degrees
of hazards, protections and redundancies, stability, cost, restoration, and repair.
Probability is the basic study of the relative likelihood that a particular event will
occur.240 In the analysis of the software system, an assessment of Software Safety can
only be made after determining the probability of execution of an event and if that event
will function properly. Previous steps in the investigation have identified the potential
hazardous outcome of such a failed event. In a safety assessment, each hazardous event
240 Lindeburg, Michael R., P.E.; Engineer in Training Reference Manual 7th Edition, Professional
Publications, Inc; Belmont, California; 1990.
189
has an independent probability of occurrence. The result of these calculations are use to
make the final assessment and assignment of the Safety Index. For this investigation and
assessment, this method will utilize principles in Joint, Complementary, and Conditional
Probability, as well as principles in Series and Parallel System Reliability.
Assessing system process deals with such aspects as joint probability,
complementary probability, conditional probability, failure severity, and so forth. Joint
Probability specifies the probability of a combination of events. An event can be defined
as the occurrence of objects (inputs, outputs, limits, processes, …) within the software
system. The population for the assessment consists of all events that occur in the system
that could potentially result in a hazardous event. Assuming that each failure could
potentially lead to a hazardous event and that each failure is matched to a specific object,
then it could be derived that the series of objects that contain a failure make up the
population for the assessment.
Through the application of Complementary Probability, due to the size and
complexity of some software systems, it may be more efficient to determine the
probability that an event does not occur than to determine when it does occur. Given that
P is the probability that an event will occur, 1 – P represents the probability that an event
will not occur, the complement equals one minus the probability of occurrence.
Conditional Probability can be defined as the probability that one event will occur,
given that another event would also occur. Such reliance permits the evaluation of one
series to execute (Pe), as well as the evaluation of that series to fail to function properly
(Pf), each series containing its own probability for occurrence. In a complete system, it
cannot be assumed that all processes will occur continuously, nor can it be assumed that
all events will occur flawlessly. Both probabilities must be evaluated, as Pf cannot occur
without the occurrence of Pe.

190
a. Failure Severity As reviewed previously in Chapter II.D, it was noted that failures have the
probability of occurring, resulting in varying degrees of consequence severity. One
object failure might occur undetected by the system as a whole, but the fact remains that
a failure did occur; while another failure might propagate uncontrollably through the
system, rendering the system incapable of further operation. An assessment of system
safety must review the probability of object failure at varying degrees to determine the
ultimate value of system safety.
Failures must be evaluated for their severity, probability of occurrence,
and potential of that occurrence generating a malfunction. These three variables combine
to determine the overall probability of the system failure. Table 9 lists probable Object
Failure Severities ranging from least to greatest severity, as well as definitions of
probable failure types. Additional types and definitions can be added at the prerogative
of developers as well as those conducting the analysis. It should be noted that some
failures may be so benign as to permit the system to continue operating; while a separate
failure may cause the system to cease functioning and resulting in a hazardous event. As
it is not necessary to conduct an analysis on object failures that do not result in a system
malfunction or hazardous event, it is not necessary to take those objects into
consideration. While, in many cases, failure severity may not directly contribute to the
level of the hazard, it does serve as a characterization of system’s ability to operate and
its inability to limit program functionality and protection, and the potential to lead to
additional hazards.

191
Failure Type Definition
Invalid Failure Disregarded
Intentional design or secondary defect in parallel system, not resulting in a general system failure
Minor Flaw Disregarded Flaw that does not cause a system failure or result in a malfunction
Latent Failure Disregarded
Failure that remains hidden in the background of the system, not resulting in a malfunction
Local Failure Disregarded Failure local to an object, not contributing to a general system failure
Benign Failure Disregarded
Failure that propagates to a system failure with slight or insignificant consequences
Intermittent Failure Failure that persists for a limited duration, followed by a system recovery, potentially, but not always resulting in a system malfunction
Partial Failure Failure that results in the system ability to accomplish some, but not all requirements, potentially resulting in a malfunction
Complete Failure Failure that results in the system’s inability to perform any functions, resulting in a malfunction
Cataclysmic Failure Sudden failure that results in a complete inability to perform any functions, resulting in a malfunction
Table 9 Failure Severity

192
Concretely, the assessment of the failure for various types can be
represented as follows:
Pf (M1, intermittent) ≤ Pf (F1, intermittent)*Pe (I1)*Pe (I1 {[P1, O1]}) + Pf (F2, intermittent)*Pe (P1)*Pe (P1 {[O1]}) + Pf (F3, intermittent)*Pe (O1) Pf (M1, partial) ≤ Pf (F1, partial)*Pe (I1)*Pe (I1 {[P1, O1]}) + Pf (F2, partial)*Pe (P1)*Pe (P1 {[O1]}) + Pf (F3, partial)*Pe (O1) Pf (M1, complete) ≤ Pf (F1, complete)*Pe (I1)*Pe (I1 {[P1, O1]}) + Pf (F2, complete)*Pe (P1)*Pe (P1 {[O1]}) + Pf (F3, complete)*Pe (O1) Pf (M1, cataclysmic) ≤ Pf (F1, cataclysmic)*Pe (I1)*Pe (I1 {[P1, O1]}) + Pf (F2, cataclysmic)*Pe (P1)*Pe (P1 {[O1]}) + Pf (F3, cataclysmic)*Pe (O1)
In complex systems, it may be necessary to combine equations to
represent composite failures with varying degrees of failure types; as if the system were
to experience an intermittent failure on the input and a partial failure on the process.
Step 5. Action 1. - Development of Failure Severity Categories – Develop
a prioritized list of Object Failure Severity Categories with applicable definitions.
Using Failure Modes, Effects, and Criticality Analysis (FMECA) 241 techniques,
severities shall define the types of failures that a specific object could potentially
experience, ranging from the benign to the catastrophic, and the potential effect of that
failure on the system as a whole. As the assessment is designed to evaluate system
safety, it is possible to disregard object failure types that do not relate or result in
hazardous events.
241 NASA/SP—2000–6110, Failure Modes and Effects Analysis (FMEA), A Bibliography, National
Aeronautics and Space Administration; July 2000.
193
b. Application of Assessment While the mathematical principles of a system assessment is
straightforward and rooted in accepted engineering statistical practices, the initial
determination of variable values requires some difficult assumptions based on historical
precedents, trained observations, and theoretical postulation. As reviewed through this
chapter, it is essential to determine:
1. The potential hazards of the system operation,
2. The process flow of the system,
3. The probability that the system will be executed as a whole,
4. The probability that an object within the system will be executed,
5. The probability that a failure related to an object will be executed,
6. The severity of that object failure, and
7. The probability that a failure will result in a hazardous event.
Potential system safety hazards have been identified using procedures in
Step 1 and Step 2 of this assessment process. The process flow of the system has been
reviewed and mapped in Step 3. The probability of system execution is based on an
evaluation of the system and its intended operation, in accordance with development
requirements. Such an evaluation should be based on the ratio of system operation to a
defined sample time. In a software system providing continuous operation, the Psystem
execution (se) = 1.0, while in a software system providing operation for only half of the time,
the Pse = .50. The sample time period may be a fixed period of time such as a 24–hour
period, or a conditional time period based on the execution of a specific event such as the
flight time of an aircraft. In the case of WACSS, the sample time period would consist of
the time from aircraft power up to aircraft power down, conditional to flights that would
employ a weapon. There is limited justification to conduct an analysis on flights where a
weapon would not be employed or loaded, or on the time period while the aircraft sits
194
idle on the flight line. Such a decision should be based on the intended function of the
system during idle and power–up phases countered by the fact that that failure during
these periods are only a small fraction of the total failures of the system.
The probability that an object will execute within the system depends,
again, on the requirements and modes of operation of the system being evaluated.
System objects can be evaluated independently or grouped as part of a process flow. The
method for determining the actual probability of object occurrence is left to the
prerogative of one making the analysis. It is not essential to determine the probability of
objects within paths that do not relate to failures as their execution is not related to the
safety assessment. To provide development continuity, it is beneficial to assign a
standardized set of definitions to identify and classify occurrence probability, as
previously constructed with the Consequence Severity example in Table 7. Such a
probability definition table would include probability levels, frequency key words, and
definitions, such as in Table 10. Other items may be included to add clarity to the
definition.

195
Frequency Definition Probability ALWAYS Events will occur through the entire life of the
system. 1.00
FREQUENT Events are expected to occur often through the life of the system. 0.90
LIKELY Events are expected to occur several times in the life of the system. 0.75
OCCASIONAL Events are expected to occur in the life of the system. 0.50
SELDOM Events are expected to occur seldom during the life of the system. 0.25
NEVER Events will never occur during the life of the system. 0.00
Table 10 Example Probability Definition Table242
Step 5. Action 2. - Development of Execution Probability Definition
Categories – Develop a prioritized list of Execution Probability Definition Categories
with applicable probability levels, frequency keywords, and definitions.
The Example WACSS Evaluation may require a more complex and
defined Probability Definition Table, as noted in Table 28.
Optimally, each event will occur within a given measure of probability.
Each occurrence can be matched to, or closely to, a defined probability level, based on
system inspection and the way in which the occurrence maps to the system process.
Probability levels can either be computed using accepted prediction methods, historical
precedents, process inspection, or other valid method of estimation. Such methods serve
better for testing random input values to existing systems than to the generation of
probability values. The more accurately system execution probability can be determined,
the more accurately the eventual safety result will be.
242 Note: The Example Probability Definition Table is intended for example purposes, and does not
reflect the values required for an actual assessment. Actual values are determined through investigation and historical subject matter expertise, and are specific to the specific system under assessment.

196
Step 5. Action 3. - Assign Execution Probabilities to System Objects –
Using the Process Map generated in Step 3.3., assign Execution Probabilities to all
system objects that relate to system failures identified in Steps 4.1. and 4.2.. Execution
Probabilities should be based on system inspection, historical precedents, and
examination.
System Execution Probability can be determined on either the macro or
micro level, from the execution of specific requirements or function to the entire system
operation. Figure 23 serves as an example of a macro–level examination of the WACSS
operation. The example depicts the operation of the WACSS units from aircraft launch
to landing, while a micro–level examination could concentrate on the time sample of the
actual launch sequence of the weapon. Hypothetically, on a 2.0 hour aircraft flight, the
actual configuring, targeting, and launching of a weapon against a target may encompass
less than 10 minutes of the entire flight. To generate a safety value for the system, it is
very important to understand the macro as well as the micro level of system execution.
The micro and macro level execution times will affect different mishaps and both are
likely to affect the same mishap. For example, the risk of inadvertent weapon release
(due to the WACSS malfunctioning) is present during the entire flight: therefore, there
are both macro and micro issues to address. Another malfunction is the premature
weapons release: this is likely affected only by the micro issues since the release of the
weapon while not in the 10 minute weapons launching preparation would be an
inadvertent release.
The process of Failure Probability Prediction is similar to the Object
Execution Prediction, with the exception that failures occurs only when the object
executes. Failure Probability is neither on the system macro or micro level as it directly
relates only to one specific object. The probability that an object or event will fail in its
execution depends on the manner in which the object was developed, its employment
within the system, the resilience of the object, the timing of its operation, and the
vulnerability of the object to failure. Failure instances are evaluated directly with the
object for which they are related. As with object execution, the method for determining

197
the probability of object failure is left to the analyzer. As with the Example Probability
Definition Table in Table 10, a standardized set of definitions serves to identify and
classify failures into comprehensible categories, as shown in Table 29. Failure
Probability levels can be computed using standard failure prediction methods 243 ,
historical precedents, process inspection, or other valid method of estimation including
the object failure severity.244
A great body of research has been completed in the field of Reliability
Modeling for Safety Critical Software Systems and the estimation of failure rates over
time and operational events. 245 Most of this research assumes that a system will
predictably fail to a set degree over a given period. While it is possible to mathematically
model this concept, the method makes some general assumptions that do not accurately
reflect the operation of a software system. Software does not behave in the same linear
fashion that physical objects do. Their modes of operation or failure are dynamically
related to the environment under which the system is placed. These states can change at
such a rapid rate that the user may be completely unaware of their occurrence and
imposition on the system’s operation until it is too late. The developers can control, to
some extent, the environment within the system but will have limited control on the
external environment that can influence the system. There is no guarantee that the
environment, internal or external to the system, will provide the same operational state
for which the system was originally designed.
It is possible to give a mathematical representation for system reliability
based on the evaluation of the system over time in a given environment, assuming that
the system will experience the same inputs and operate in the same environment once it is
deployed. In reality, every installation of the software system is unique. This uniqueness
243 See methods in Section II.E.2 – Traditional Methods to Determine Software Safety 244 Schneidewind, Norman F., Reliability Modeling for Safety Critical Software, IEEE Transactions on
Reliability, Vol. 46, No. 1; March 1997. 245 Schneidewind, Norman F., Reliability Modeling for Safety Critical Software, IEEE Transactions on
Reliability, Vol. 46, No. 1, Institute of Electrical and Electronics Engineers, Inc., March 1997.

198
requires the developers to include robust levels of mitigation and control elements246 to
ensure that the system can continue to operate within the desired bounds for which it was
designed. The derivation of any probability of operation, failure, or reliability should be
based on the operation of the system elements as independent units that can be combined
to generate a complete process assessment. Such an assessment and probability
determination may be a combination of traditional reliability measures of operation over
time, event, or states, the use of heuristic data gained from legacy systems of like design,
or the use of subject matter assessments by experienced personnel familiar with system
operation.
Any determination for probability of execution, failure, or operation
should be based on a set environmental window. Should the system operate outside of
that environmental criterion, then the assessment should be assumed void, necessitating a
re-evaluation. Few systems will ever operate in a vacuum. It is imperative that
requirements specify the controls and limits necessary to ensure that the system operates
within the bounds for which the system was tested and that the system has the flexibility
necessary to operate within the bounds required by the user. This delicate balance will
tax the abilities of the developers to provide a flexible system that can be certified “safe.”
Note: As failure probability may be relatively small for a given event, it
is possible to depict Failure Probability with a multiplier extension. Table 29 and Table
30 each have a multiplier extension of x10–5, i.e. a probability of 7.50 x10⁻⁵ means that
the object has a probability of failure of 0.000075 for each time it is executed.
Step 5. Action 4. - Development of Object Failure Probability Definition
Categories – Develop a prioritized list of Failure Probability Definition Categories with
applicable probability levels, frequency keywords, and definitions as they apply to
specific objects within the system.
246 See Section V.E.4.b - Hazard Controls

199
In a perfect development process, each software system object would
function flawlessly, much less without a failure (the difference previously discussed in
this dissertation). As no system is ever without the slightest potential for failure, it is
essential to measure when, how, and how frequently it will fail.
Step 5. Action 5. - Assign Failure Probabilities to System Objects –
Using the Process Map generated in Step 3.3., Failure Process Map from Step 4.2, and
Failure Severity Categories defined in Step 5.1., assign Failure Probabilities to all
system objects that relate to system failures identified in Steps 4.1. and 4.2. for each
severity of failure. Failure Probabilities should be based on system inspection,
historical precedents, and examination.
As with System Execution Probability, System Failure Probability is
determined on a variety of levels. The Initial Failure Probability Result is based on the
failure of a specific object each time it executes. System Failure Probability is computed
based on the results of the Object Failure Probability, Object Execution Probability, and
System Process Flow Analysis. As each system executes, there is a probability that an
internal object will execute, and then a probability that that object will fail in some degree
of severity in its execution. The next logical process is to determine what the probability
will be that a failure will be result in a system malfunction. Such a “what if” requires
developing a scenario of operation for analyzing the system from the process start to
malfunction. In the example WACSS, five primary malfunctions were identified with
eighteen potential failure groups. Each of these malfunctions can be transformed into a
potential failure scenario and process flow, as shown in Figure 24, Figure 25, Figure 26,
Figure 27, and Figure 28.
Step 5. Action 6. Determine Possible System Hazard Flow – Using the
Process Map generated in Step 3.3, the Failure Process Map from Step 4.2, and the
Failure to Malfunction Identification of Step 4.1, determine the possible System to
Hazard Process Flow. Such a Process Flow should include all system objects that
could potentially result in a malfunction and eventually a failure.

200
System process failure can be determined using any of a series of
probability summation methods. The selected method should be agreed upon by all
members of the assessment from the onset, taking into consideration the strengths and
weaknesses of each of the various summation methods. The summation process must be
capable of computing the probability of independent and dependent lines of system flow,
including applicable presuppositions and post functional actions that contribute to the
overall process probability of execution and failure. Previous steps in the Safety
Assessment provided values for object execution and failure probability. These values, in
conjunction with the Process Flow Map, provide the basic elements required to complete
the Initial Safety Assessment.
No standard arithmetic notation could be found to denote the process of
flow of a software system through associated objects and failures. To overcome this, the
following notation examples of Example 4 and Example 5 are given with supplemental
plain language definitions. Example 4 demonstrates a simplistic object with a single
failure. Notationally, the unit can be represented by its failure and object, separated by
bracketed character, as in the example – F17^P7 {[O12]} to denote Failure 17 of Process 7
through Output 12. In Example 5 the addition of Through Objects (objects which the
process passes through but not necessarily including a failure) are included to represent
the remainder of the process up to and including the Malfunction. Free formatted text
presents an acceptable format for describing the safety assessment as a supplement to
mathematical notation.247
247 Kelly, Timothy Patrick; Arguing Safety – A Systematic Approach to Managing Safety Cases, A
Dissertation, University of York, Department of Computer Science; September 1998.

201
F17^P7 Failure (F17) of Process 7(P7)
Example 4 Failure within an Object
F17^P7 {[O12]} ∪ F18^O12→ M5 Failure (F17) of Process (P7), through Output O12; with Failure (F18) of Output O12 Resulting in Malfunction (M5)
Example 5 Failure of an Object with throughput to a Malfunction
F17 P7
F18 O12 F17 P7 M5

202
M1 ≤ F1 ^ I1 {[P1, O1]} ∪ F2 ^ P1 {[O1]} ∪ F3 ^ O1 Example 2
Pf (Mi, d) ≤ Σ (Pf (Fi, d) * Pe (Ai) * Pe (Ai {DAi})) Equation 3
Where: Pf (Fi, d) is Probability of Activity Failure for type, Pe (Ai) is Probability of Activity Execution, Pe (Ai {DAi})) is Probability of Series Dependant Activity Execution.
A1
Assume:
Pe (I1) = 0.40
Pe (P1) = 0.40 Pe (O1) = 0.25 Pe (I1{[P1, O1]}) = 0.8145 Pe (P1{[O1]}) = 0.7500
Pf Intermittent F1 = 0.5000x10⁻⁵
Pf Intermittent F2 = 0.6000x10⁻⁵
Pf Intermittent F3 = 0.8200x10⁻⁵
Pf Intermittent M1 ≤ Pf (F1, intermittent)*Pe (I1)*Pe (I1 {[P1, O1]}) + Pf (F2, intermittent)*Pe (P1)*Pe (P1 {[O1]}) + Pf (F3, intermittent)*Pe (O1) Pf Intermittent M1 ≤ (((0.5000x10–5 * 0.40) * (0.8145)) + ((0.6000x10–5 * 0.40) * 0.7500) + (0.8200x10–5 * 0.25)) = 0.5479x10⁻⁵
Example 6 Example Probability of Failure Equation
Example 6 demonstrates one potential method for determining the
probability of failure for a given IAM. It can be assumed that each system may have a
myriad of different process flows that ultimately may result in a malfunction. In the case
of the above example, the process flow contains three Failure objects in series, with one
Through Object, ultimately resulting in a Malfunction. Singular failure probabilities F1–3
are determined using appropriate methods, as well as the determination of applicable
I1 P1 O1
F1
F2
F3
M1

203
process execution and related execution probabilities. Using probability methods
discussed in this dissertation, it is possible to equate these values to derive a finite failure
probability for the series. The summation of series probabilities can be combined to
derive a final expression of probability that the system will execute a malfunction, as
shown in Table 32.
Step 5. Action 7. - Determine the Probability for each Malfunction
Occurrence. – Using the Object Failure Probabilities from Step 5.5. and the Hazard
Flow generated in Step 5.6., determine the cause and effect failure probability of the
system. System Probability should include consideration of all reliant or dependent
objects to the system process.
Early in the Safety Assessment, it was possible to identify Malfunction
Severity as it related to Malfunction Hazards and Consequences. Malfunction Severity,
combined with the computed Probability of Malfunction Occurrence, can ultimately
derive the Safety of the Software System. Relating malfunctions to consequences, it is
possible to assign probabilities of occurrence to each consequence and finally a level of
Safety to the system. This assignment of Safety requires the macro definition of a
System Failure Probability Table, similar to the micro definition table generated in Step
5.4., and Table 29. The table should include plain language descriptions and definitions
of system failure with corresponding values of their frequency of occurrence, based on
system operation. The frequency of occurrence references the probability that an event
will occur for each operation of the system.
An operation of the system assumes the execution of any process series,
including those series of operations that do not contain a failure or malfunction object.
Based on the speed of some software system processors, it is possible for the system to
execute scores of process per second. Table 11 shows a possible system failure definition
table for a given system’s operation.

204
Frequency Definition Probability x10–5
ALWAYS The system will fail each time it is executed. > 100000.00
FREQUENT The system will most likely fail when executed. 5000.00
LIKELY The system will likely fail when executed. 250.00
PERIODICALLY The system will periodically fail when executed. 10.00
OCCASIONAL The system will occasionally fail when executed. 2.50
SELDOM The system will seldom fail when executed. 0.75
SPORADICALLY The system will fail sporadically when they are executed. 0.20
UNLIKELY The system is unlikely to fail when executed. 0.05
NEVER The system will never fail when executed. 0.00
Table 11 Example System Failure Definition Table248
Step 6. Action 1. - Development of System Failure Probability Definition
Categories – Develop a prioritized list of Failure Probability Definition Categories with
applicable probability levels, frequency keywords, and definitions as they apply to the
system as a whole.
A measure of safety can now be determined by tabulating the probability
of system failure against the criticality of a corresponding hazard. The probability versus
criticality table has been applied successfully in numerous engineering and management
safety assessments249 to determine a level of safety of a system. As shown in Table 12,250,
251, 252 it is possible to evaluate a system’s probability of failure against the system’s
hazard severity to determine a value of safety.
248 Note: The Example System Failure Definition Table is intended for example purposes only, and does
not reflect the values required for an actual assessment. Actual values are determined through investigation and historical subject matter expertise.
249 OPNAV INSTRUCTION 3750.6R, Naval Aviation Safety Program, Chief of Naval Operations, Department of the Navy; 01 March 2001.
250 Draft Reference Guide for Operational Risk Management, Naval Safety Center; 09 September 1999. 251 Operational Risk Management (ORM) Handbook, Subset to AF Instruction 91-213, 91-214, and 91-
215 Operational Risk Management, Air Force Civil Engineers, U. S. Air Force; 1991. 252 MIL-STD-882B, System Safety Program Requirements, Department of Defense; Washington, D.C.; 30
March 1984.

205
PROBABILITY ALWAYS LIKELY OCCASIONAL SELDOM UNLIKELY A B C D E
CATASTROPHIC I Extreme Extreme High High Medium CRITICAL II Extreme High High Medium Low
MODERATE III High Medium Medium Low Low
SEV
ERIT
Y
NEGLIGIBLE IV Medium Low Low Low Low
Table 12 Example Probability vs. Severity Table
The horizontal axis is comprised of probability types identified in the
System Failure Probability Definition Categories (or Malfunction Occurrence) of Step
6.1, while the vertical axis consists of the Severity Categories defined in Step 2.1. The
intersecting point of the two axes represents the safety of the system, or in the case of
Table 12, represents how unsafe the system is for a given malfunction and hazard.
Intersection values can be represented as either textual definitions or numeric values
ranging from the most safe to the completely unsafe. The actual cell values are again
based on historical analysis and rationalization from like systems, as well as the
motivation and political atmosphere surrounding the system.
Step 6. Action 2. - Development of the Probability vs. Severity Table –
Develop a two dimensional table representing System Failure Probability on the
Horizontal Axis and Hazard Criticality on the Vertical Axis. Assign applicable safety
values to table cell to represent the safety of the system based on each occurrence and
corresponding safety level for a given intersection scenario.
The corresponding cell value of the Probability vs. Severity Table can be
referred to as a Safety Assessment Index or SAI. Once the SAI has been calculated for a
given Malfunction / Hazard or for the entire system, it is possible to judge the safety of
the system in its current design, determine the necessary processes required for the next
stage of development, and prioritize necessary resources required to improve the SAI’s
level if warranted.

206
The criticality of one hazard may seem insignificant when compared to the
hazards of a separate system, as each system has its own potential set of consequences to
hazards. A military system may suffer a catastrophic hazard resulting in the death of
personnel while a food processing/grinding unit might suffer a catastrophic hazard
resulting in the loss of a batch of food. Both hazards are catastrophic in their own
measure, while comparatively one results in the loss of life and the other in the economic
loss of bulk ingredients. It is essential that the evaluation take into account the mission
and requirements of the system to determine appropriate levels of response to such SAI
levels.
For the example WACSS Safety Assessment, Table 32 lists the
mathematical summation of all probabilities of occurrence for each malfunction at each
level. Table 33 represents the System Failure Definitions, outlining the bounds of
applicable levels of failure. Using the results of these two tables, in conjunction with the
Probability vs. Severity Table generated in Step 6.2. (Table 34), it is possible to identify
probability letter designations, as shown in Table 35. This step, while not required, will
assist later in classifying System Failures to Probability Categories.
The resulting SAI Product can take a variety of forms, ranging from a
simple numeric value to denote the safety of the system to a textual description of the
safety of the system, outlining the malfunctions, failures, hazards, consequences, and
severities of the system with corresponding safety assessments. A summation safety
value can be given for the product, assuming worst case and best case for hazard severity
of the given system. The format of the product depends on the requirements of the
assessment team, the manner in which the product may be used, and the format for which
the team is most comfortable working with. Regardless of the ultimate format of the
product, the logic and methodology behind the assessment remains the same. An
example of a long form textual SAI result can be found in Section 0 of this dissertation.
Step 6. Action 3. - Determination of the Safety Assessment Index (SAI) –
Using the Probability vs. Severity Table developed in Step 6.1., and Failure
Summations from Step 5, determine the SAI for malfunctions and the summation of

207
the system by the intersection of event probability to hazard severity. SAI results
should then be displayed using the method most practicable to the evaluation
requirements.
4. Decision Making Steps 1 through 6 of the Software Safety Assessment are based on the initial
phases of the software development process, as depicted in Figure 11. As the software
project is still in a stage of infancy, it is flexible enough to permit a refinement,
remodeling, or redirection of efforts to improve the recently computed SAI value. The
SAI should specify the relative level of safety of the system, based on a predefined safety
index scale established during the evaluation. The limits of the scale may slide left or
right, or may expand within its bounds to best represent the safety of the actual system.
Once the SAI has been identified, it is essential to determine if the system’s safety level
meets the ultimate requirements of the system’s development.
Assume that a development requirement stated that, “no portion of the system
shall have a SAI level above Moderately Unsafe.” The term Moderately Unsafe has been
predefined to represent some level of safety in terms of malfunction/failure event
probability against hazard severity. The Moderately Unsafe development goal specifies
some quantitative level of safety that must be obtained prior to system release. This goal
grants a level of assurance to developers and users that the product will function within
some specified limit with a relative probability of a catastrophic event low enough to
permit open integration and deployment. In the case of the example WACSS system, few
events meet the hypothetical goal of a SAI no greater then Moderately Unsafe. A
developer may review the intended methods and techniques for subsequent stages in a
spiral development, to make necessary changes with the purpose to reduce the SAI to an
acceptable level. Based on available resources, a decision may be made to address all
unacceptable events, but prioritize resources so the Unsafe or Extremely Unsafe events
are controlled first. If resources are limited, the developer may choose to address only
those events whose SAI is Unsafe or Extremely Unsafe, and then reevaluate the software
system to determine the new SAI level. Each development process poses unique
208
scenarios and limiters that restrict the development and the ability to reduce the SAI
towards Safe, assuming Safe to represent a system for which no unsafe incident will
occur. Regardless of the limitations, the assessment permits a method that will help the
developers assess the Software Safety.
a. Variables to Safety Decisions The resulting safety assessment and SAI level in no way makes the system
safer or reduces the quantity of failing objects. The safety assessment only presents a
representation of the potential operation of the system, based on a review of system
objects judged against a predetermined criterion for safety. The assessment can only
benefit the system once decisions have been made on the proper course of action to
improve software system safety. The ability for developers to make accurate safety
decisions depends greatly on:
• The presentation of the safety assessment data,
• The resources available for the development/redevelopment, and
• The abilities and foresight of the developers.
The presentation of safety assessment data must be aesthetic in nature, as
to permit an efficient and telling view of the information. Developers should not become
tied up in the review and interoperation of the data but should be able to quickly discern
the critical points that could jeopardize the success of the project. The outline textual
format of safety assessment data (0) presents all of the required review information in a
top down fashion that can be quickly referenced with other subordinate data elements.
Pertinent safety–related system objects and their properties can be displayed as sub
categories to relevant headers and primary objects. This format gives the assessment and
development teams the ability to include or omit data elements that are not applicable to
the particular investigation and process.
Additional safety presentation formats include the creation of a Hazard to
Safety or Malfunction to Safety Table as depicted in Table 13. For ease of reference in
Table 13, the Severity and Probability axis reference codes from Table 12 are included.

209
Depending on the scope of the assessment and investigation, additional columns can be
inserted to add depth and clarity to the table. In the case of the example WACSS
assessment, an extended safety assessment table including columns representing object
failure, malfunctions, and multi–dimensional phases of safety can be used to represent the
depiction requirements, as shown in Table 36.
HAZARD SEVERITY PROBABILITY SAFETY
H1 CATASTROPHIC LIKELY I B – Extremely Unsafe
H2 CRITICAL OCCASIONAL II C – Significantly Unsafe
H3 MARGINAL / MODERATE SELDOM III D – Minor Unsafe
Issues
H4 CRITICAL LIKELY II B – Highly Unsafe
Table 13 Example Hazard to Safety Table
The Hazard to Safety Table can serve as a guide for future safety
improvement and decision–making. Based on the safety measure from the assessment,
the developers and project managers can prioritize hazards by safety levels, based on
predefined goals and objectives of the development and remaining resources available for
the improvements. A requirement of the project might be that no “Significantly Unsafe”
incidents or greater will be accepted in the development. From the assessment and
threshold evaluation, the developers can determine the most viable method of control or
mitigation for a particular hazard.
Once developers are able to review and evaluate the results of the safety
assessment, a decision can be made on the goals for improvement. The goals for
software system improvement are based on five principles of hazard control, namely:253
• Acceptance Accept the identified hazard and resulting consequence with no changes.
253 Operational Risk Management (ORM) Handbook, Subset to AF Instruction 91-213, 91-214, and 91-
215 Operational Risk Management, Air Force Civil Engineers, U. S. Air Force; 1991.

210
• Avoidance Avoid the Failure. Canceling or delaying
operations of the system that could potentially result in an object’s failure.
• Reduction Plan or design the system with minimized
potential for system failure using mitigation, prevention, and error handling.
• Spreading Increase the exposure of the system to positive
processes while reducing the exposure of the system to negative processes, consequently reducing the potential for object failure over time.
• Transference Shift the possible losses or cost of the failure to
other systems, or transfer vulnerable requirements to more reliable system.
The decision to implement any one of the five methods of process
improvement requires an understanding and review of the resources required to make the
required improvement. Even acceptance of a hazard requires the expense of some
amount of resources as the hazard has been investigated and assessed, documentation and
training is designed to inform others of the hazard, and the hazard is isolated to prevent
additional change. It is understood that some level of resources have been expended to
develop the system to its present level, even if the system is only in its conceptual phase.
Resources may include, but not be limited to, the time schedule of development, staff,
budget, facilities, personnel, software, and development and testing tools. Any changes
to the system may require some reallocation of resources beyond that already planned. In
the case of some changes, specifically Avoidance or Transference where system
operation is reduced to improve system reliability, the level of system development effort
might be correspondingly reduced. In a worst case, without proper management,
oversight, and functionality, such action could cause development efforts to increase.
Regardless of the method chosen to reduce the probability of a hazardous event, a
limiting factor of the method execution will be the resources available.
As referenced in Chapter III of this dissertation, many software systems
fail due to the limited abilities and lack of foresight of the developing team. When

211
developers are incapable of properly designing a system, errors will inevitably surface
during system’s inspection and operation. Despite the best of development practices, a
lack of safety foresight and ability to plan for potential failures will result in a failed
oversight to safe system operation. The decision process must evaluate the abilities of
the developers as well as the foresight for the developers to prevent the addition of
further errors.
Assuming that a maximum SAI level has been established in the
requirements of the development process, the software system can be reviewed to
determine which hazards must be controlled to comply with the established standard.
Once hazards are identified, resources and controls can be prioritized in an appropriate
fashion to improve system safety. Using the previously defined example of Table 36 and
the hypothetical SAI requirement for no object to result in greater then a Moderately
Unsafe action, objects and properties of Table 36 are shaded to indicate which require
improvement and control.
b. Hazard Controls Of the five classes of hazard control; Acceptance, Avoidance, Reduction,
Spreading, and Transference, each must be reviewed and understood for their impact on
system requirements, required resources, ability to implement, and potential benefit, as
shown in Table 14.
The decision of which control is appropriate depends greatly on the
circumstances the control is attempting to manipulate. Controls must be judged for their
ability and manner for which they eliminate hazards, the efficiency in execution,
overhead, expected improvement mission success, enhanced capabilities, and reduced
risks. It may be possible for more than one control type to prevent a failure, yet the
selection must be made on the level of effort required to implement the control and the
expectations gained from its inclusion.
Acceptance has absolutely no effect on software system safety hazards, but may be
optimal in cases where resources are limited, the probability of failure is small, and/or the

212
hazard consequence is minimal. Some resources may be required to isolate the hazard
from further development, and to documentation and training customers and developers
of the hazard.
The Avoidance or “elimination” control does not solve a failure but rather
removes the failure by removing system functionality essentially avoiding the triggers
that induce the failure. Such a control has a direct impact on the requirements of the
software system because it removes functionality that may be required by the system to
operate “completely.” A decision must be made on the functionality, necessity, or
aesthetic value of system operations that have been removed to avoid failures.
Avoidance must be done in conjunction with a critical review of system requirements for
the elimination of unnecessary overhead while conserving essential operations. Such a
removal of functionality requires a review of the importance of the specific process and
the impact and reliance issues generated by other objects. If such a function is trivial in
nature, then it can be removed with little impact on the primary operation of the system.
Few software–based functions related to system safety are trivial and can be removed to
improve a system’s SAI level. Some safety–related software systems are designed solely
to prevent a hazardous event; therefore, their avoidance or removal would decrease the
safety of the system and promote a hazardous event.
Spreading implies the act of spreading or diluting the exposure potential
of identified failure points out over the system terms of operating time or locality to other
failure points. Spreading does not necessarily reduce the number of failures, but
increases the number of non–failure points, thereby mathematically reducing the ratio of
failure to non–failure objects and the overall potential for failure for a given set. In
laymen’s speak, a tablespoon of poison will kill a rat, but if you diluted the poison in a
pool of water the rat will have to drink quite a bit of the solution to get the same result.
Spreading, while mathematically sound, is not always advantageous, as the rat may
drown from the water before he ever is affected by the poison, so will the software
system be affected by the introduction of superfluous objects and actions not intended in
the functional requirements. The act of spreading is more soundly integrated in non–
213
hazardous software systems where the act of hazard control is not one of the prime
requirements of system operation.
Optimally, failure or hazard Reduction is the most productive method of
safety trigger management, as it actually works to reduce the potential for a hazardous
event. Reduction stands as the foundation of contemporary Software Systems Safety
Efforts. Depending on established system requirements, the potential for a hazardous
event can be reduced by removing the flaw from the system before it could ever occur.
For the sake of terminology, not developing the flaw from the onset can be assumed the
same as removing a potential flaw from the concept. If a flaw cannot be removed and the
failure not prevented, failure mitigation can be used to lessen the severity of the failure or
even prevent the development of the action into a hazard. Mitigation can include the
transference of failed processes to other systems for redundant operation, the ability for
the system to recover and prevent subsequent failures, and the in–line addition of failure
preventers that can sense the hazardous event and control its propagation and
consequence to an acceptable level. Mitigation, while it does not remove the failure
directly, controls the probability of the hazardous event, thereby increasing safety. Error
handling is the ability to sense the fact that an error has occurred, react to it, and prevent
its continual propagation. An error handler might cease operation of the failed object
until it can reset itself and provide a positive output, might provide a supplemental output
that is within the bounds of system requirements, or might revert to a redundant system
object capable of providing a reliable output.
If the potential hazard cannot be reduced, spread out, or avoided, it may be
possible to transfer the effects of the failure to other portions of the system or transfer the
most vulnerable requirements to a more reliable or robust system. Transference can be
accomplished similar to error handling, as a reactionary process that transfers control of
the system and associated failure to another unit to prevent or control the occurrence of
the hazard. Transference also may imply a preventive measure by recommending the
transfer of potentially hazardous requirements and unstable objects to other systems to
isolate and better control their failed occurrence. Transference reduces the burden of the

214
system to handle failure by shifting the responsibility onto a secondary component. The
ultimate reduction is dependent upon the methods of transference and the effort required
to make this transition. In some cases, the overall gain to system burden could be
minimal. In cases of Transference, the failure does not disappear, but is simply moved to
a system better suited to react to its occurrence.
Effect on Hazardous Event Level of Effort Effect on System
Functionality Effect on System
Safety
Acceptance None Minimal None None
Avoidance Significant Medium Significant Minimal
Reduction Significant Significant Minimal Significant
Spreading Medium Medium Significant Minimal
Transference Significant Significant Significant Medium
Table 14 Hazard Control Effect on System Safety
c. Making the Difficult Decisions Given the five primary hazard controls previously referenced as well as
the introduction of variables to software improvement decisions, it is possible to make
specific goals and methods for the improvement of the identified software system. Using
the shaded example of Table 36 as a basis, thirteen hazards and nineteen consequences
(some duplicated for given malfunctions) were identified as beyond the acceptable SAI
limits established in the hypothetical system requirements. The optimal goal of the safety
decision process would be to develop/redevelop the system such that the summation of
SAI levels of each potentially failing object would result equal to or that required in the
specifications documents.
Reviewing the steps required to generate the assessment, it is only possible
to increase the SAI Safety Level of the system by:

215
1. Lowering the criteria for which the system is evaluated against,
2. Reducing the probability that a failure/hazardous event will occur,
or by
3. Reducing the consequence of the hazardous event.
Lowering the criteria for which the system is evaluated against would
produce an immediate and linear increase in the “safety” of the system in terms of the
quantitative value, but will not necessarily result in a reduction in the number of unsafe
incidents that may occur. Such an adjustment of the criteria must only be executed if the
criteria was flawed in its assumptions, a more accurate criterion was discovered, or the
criteria was refined to add granularity and clarity to the assessment. Special care should
be taken to preclude undue influence or pressure to adjust the criteria to a level that
would mask the actual failure and resulting hazard.
The consequence of some hazardous events is static for a given software
system. In a case where the software system completely fails to control a specific event,
the event will then occur in an unacceptable and hazardous manner. Further control of
the hazardous event must be accomplished by an external system, either a mechanical or
software system isolated from the original failure laden system. While the hazardous
consequence could not be controlled by the given system, its effect may be mitigated by
additional systems that can act upon it. In cases where the system retains some control of
the hazardous event and corresponding consequence, it may be possible to affect or
reduce the consequence of the failure. The ability to control the consequence of any
hazard must be based on the type of consequence, the remaining controls of a potentially
failing system and the redundant or parallel systems tasked with mitigating the potential
event.
The most plausible method of increasing the safety of the software system
is to reduce the probability that a hazardous event will occur at all. Procedurally stated,
reducing the probability of a hazardous event could be accomplished by removing the
existence of possible flaws, reducing the probability that the failure will occur, reducing
216
the likelihood that a failure could propagate through the system, and the reducing the
potential that a failure could result in a hazardous event. It is most advantageous to
destroy the chain of failure before it ever has a chance to root into the system. If not
possible to interrupt the chain, it may be possible to break the links of the chain once they
are identified by the safety assessment. Removing the existence of flaws can be
accomplished through the use of proper design techniques, requirements review,
development verification, and testing with the aspects of safety in mind.
The probability of failure can be reduced by:
• Methods of design,
• The ability of the system to control inputs, objects, and processes,
• The redundancy of the system to compensate for failed operation
(if redundancy is designed for safety), and
• Reducing the exposure of system to potential failure objects.
As previously stated, vulnerable objects may be required for the operation
of the system despite their potential for failure. In such cases, it may be possible to
isolate system operation through error handling, failure mitigation, or through the use of
secondary systems that can isolate the hazardous burden from the primary system. In
cases where a safety–related system hazard could not be eliminated from the system, the
next objective must be to minimize the occurrence and potential severity of the hazard.
Such controls can be inserted into the software to limit the probability of occurrence of
the hazard to some appreciable limit or permit the system to quickly recover, preventing a
further occurrence of the hazard. Beyond the software control system, it may be possible
to incorporate mechanical interlocks and safety breaks that can prevent a hazardous event
should the system fail.
Mitigation measures designed to improve the safety of a system could
quickly detract from mission effectiveness by limiting the operational environment,
responsiveness, reliability, or other desirable attributes, and overall lethality of the system.
Each decision will have trade offs that must be evaluated for their impact on the safety,

217
mission effectiveness, and operational capabilities of the system. In some systems, it
may be beneficial to operate on "the edge of criticality" to obtain optimal system
performance; understanding and accepting the potential for a hazardous event should the
system cross over that edge. In other cases, where the failure criticality of the system
would pose unacceptable risk should it fail, operating with sufficient control would be
essential. Striking that balance between operational risk and system safety risk is
essential to the successful deployment of the software in the system context.
Despite the method selected to decrease the SAI level of the system after a
safety assessment, it is imperative to identify the necessary changes and take appropriate
action as early in the development process as possible. It should be noted that the cost
and time for system repair and modification increases with each recurrent phase of
development. The increased expense of such modifications may serve to jeopardize
system safety as much as the act of a single system failure.
Using the SAI improvement goal as a guide, it is then possible to review
the failure, hazard, and consequence lists to determine which elements must be improved
to decrease the SAI value below an acceptable threshold. Elements can be evaluated for
their ease of developmental change and improvement, the degree for which they must be
improved to meet the system, and the methods and resources required to implement the
change. Additional consideration must be given to the effect that any change may have
on the system characteristics, their requirements, or functionality. Changes must be
documented, testable, and not contribute to additional failure probabilities. Some
changes may result in increased overhead, expense, or decreased system performance to
counter the threat of a potential hazard.
Step 7. Action 1. - Determine Required Improvements – Determine the
system improvements required to decrease independent and system SAI values to an
acceptable level, identifying appropriate controls of Avoidance, Reduction, Spreading,
and/or Transference to each element. Identify quantitative improvement goals for each
object that is to be improved, countered by required resources, and cost vs. benefits of
the actual improvement.
218
The format for any goal improvement depiction should include the object
to be improved, the selected control type(s), the control specifications of the
improvement, resources required, any measurable change goal expected in object failure
probability, and any severity change goal in respective hazard consequences. Where
possible, the anticipated change to object/system SAI levels for each object improvement
should be computed and noted. Finally, it would be beneficial to outline the anticipated
effects of the change improvements on system requirements, functionality, and
performance. System developers will require adequate justification for incorporating
additional design requirements into the system. The table should be formatted in the
expected order of object improvement execution, taking into account resources
required/available, effect, and complexity of the improvement. As resources may be
limited, it would be possible to budget improvements to get the maximum SAI change
level before resources are exhausted.
Using the improved Spiral Model example of Figure 11, working in the
lower right fourth quadrant of Software Decision Making and Development and
Validation, it is then possible to determine the best method for modifying requirements
specifications (if necessary), and for developing the actual project. Assuming this to be
the first iteration of development, safety changes and process improvements to the
software system may be nothing more than changes in requirement specifications,
anticipated process development methodologies, and resource reallocations. In
subsequent stages of development, improvements may include the costly decomposition
and redesign/development of software code. Dramatic software redesigns can be
prevented through prior planning and adherence to proper techniques. Where possible,
the safety assessment and decision process should be accomplished as early as possible to
benefit the system while minimizing the changes to completed portions of the system.
5. Development The development/redevelopment of a system using the new safety directed
improvements requires no significant changes to existing development practices.
Nonetheless, the safety improvements will require a greater adherence to the principles of
safety within those practices. The earlier that safety precautions can be executed in the

219
development process, the smaller the negative impacts the system will experience
(rework, lost resources, potential hazard execution), as well as the greater the positive
impact on software system safety. While requirements are in review, the demand for
safety controls should be incorporated into the software system documentation. To
ensure that system changes can be tracked and traced, once objects are in development,
changes and additions of controls should be documented in their respective fashion.
Step 7. Action 2. - Incorporate Safety Controls – Incorporate the Safety
Controls identified in Step 7.1. into the Software System. Changes should be well
documented in requirement specifications and code development specifications. Any
refinements and improvements should take into consideration their effect on present
objects as well as any related or reliant objects within the system.
Safety–Critical Software Systems can be highly fragile, depending on the
criticality of the hazardous event it is attempting to prevent. It is possible to strengthen
the fragility of a system by adding specific design features that are robust, proven, and
serve to mitigate, prevent, or reduce the potential occurrence a hazardous event,
sometimes referred to as “Defensive Programming”. Example design features can
include, but are not limited to:
• Firewalls that isolate safety–critical code from the rest of the system.
• Redundancy of critical systems, granting the ability to continue operation
with a secondary system should the primary fail.
• Screening and Filtering of system inputs to prevent triggering potential
failures.
• Timed Replacements of critical code and system operation to refresh
system functionality should it become unstable.
• Data Diversity to sequence various inputs to generate output results that
are either exactly the same or semantically equivalent in some way.
• Error Trapping to halt the propagation of system failures through the
system.
220
• Error Handling to correct system’s operation should the system fail to
function properly.
• Checkpoints to monitor system operation and take corrective action
should the system fail to pass checkpoint tests.
The use of proven System Object Modeling, CASE tools, and other system
prototyping design techniques assist in the pre–coding phases of system development and
provide an opportunity for integrating and testing of various features.
Firewalls provide isolation of critical components from the remainder of the
system. This isolation prevents the flow of potential failures out of critical components
into the rest of the system, as well as failure flow from the system back into the critical
component. Firewalls can also prevent the introduction of known triggers to failure
prone objects. The function of a safety firewall may be as a barrier, a filter, or as channel
to data and process transfer, controlling the dissemination of information through a
predetermined field of logic. In cases where the firewall may serve as a barrier, no
information or process flow will be transferred through to other components not critical
to the current process. Firewall filters will only permit the transfer of information or
process flow that meets a specific criterion, while a channel will permit the flow only
through a directed path, omitting flow to undesired portions of the system. Depending on
the logic within the firewall control, the flow of information or process may flow one
way or bi–directional, as shown in Figure 17. F1 represents the use of a barrier firewall,
preventing the flow of any information from the Alpha Process to Bravo. F2 represents a
filtering firewall that checks the flow of information between the two process flows using
a series of discriminators and proofs. F3 represents a channel that can logically redirect
or inhibit information through to various points within the Bravo Process. Improvements
to the SAI level are based on the type of failure that each firewall is designed to prevent,
as well as the functional resilience of the firewall.

221
Figure 17 Firewall Control Example Figure
Redundancy involves the integration of parallel components or processes to
backup the operation of critical processes. Redundancy can be accomplished using either
two or more identical components operating in parallel, or by the use of dissimilar system
capable of accomplishing like tasks, shown in Figure 18. In the case of identical
components, the system would be capable of reverting to a back up process in the event
that the primary process failed to operate. In cases where the environment causes a
failure of the system, a duplicate redundant system might also experience the same failure.
Redundant systems must be capable of robust operation in environments conversely that
of its “twin” or they fail to serve as viable alternatives. Additional dilemmas exist in
cases where the input to the primary process resulted in the failure of the primary
component. If no change is made to the input and it is subsequently rerouted to the
secondary process, the same failure will likely result. Identical components are useful in
cases where components are susceptible to failure from sources other than input values
such as operating resources (power failure, storage space, output devices, processor
failures…), or are susceptible to destruction during the course of operation (catastrophic
impact, frozen components, combat casualty…). As an alternative, it may be ideal to
develop dissimilar redundant components that are capable of providing a complementary
level of functionality using an alternative method of logic and resources. Dissimilarity
permits the flexibility to attempt continued operation using the same potentially flawed
input and generate a functional output. In cases of dissimilar component development,
P1A
P1B
I1
P2A
P2B
P3A
P3B
P4A
P4B
F2 F3 F1
O1
O2
Process A
Process B

222
additional resources must be allocated that would otherwise not be required in
redundantly similar systems. System SAI level improvement is based on the type of
redundant process implemented in the system. In redundantly similar systems, the
probability of failure will only improve to the degree that a failure from operational
resource or catastrophic casualties could be eliminated. In redundantly independent
systems, the system’s probability of failure is directly related to the multiplication of the
two components’ independent probability of failure254, i.e. F1 = 2.5x10⁻³, F2 = 4.3x10⁻³,
∴ F1, 2 = 1.075x10⁻⁵. Of note, such an example only applies to detectable failures in a
statistically independent process.
Figure 18 Redundant Control Example Figure
Screening and Filtering permits the trapping of process inputs and outputs to
ensure that only acceptable values are permitted to flow through the system. Filters are
designed to function in series with the system process flow and react according to the
limits of the data and screen type. Filters may continually function to prevent the flow of
unacceptable values – Active Filter; while other filter controls react to generate
alternative input / output values to ensure continuous operation – Reactive Filter. The
filter can be physically placed before the input of a component it is designed to protect, or
directly after the component whose output is suspect, as shown in Figure 19. In addition
254 Littlewood, Bev; The Impact of Diversity Upon Common Mode Failures, The Centre for Software
Reliability, City University, Northampton Square; London, England.
P1
P1A
Input P2 Output
Primary Process
Secondary Process

223
to the straight line Active Filter example, the Reactive Filter contains additional
processes (PR1 and PR2) that are triggered by filter logic to generate alternative data values
to support the primary process (P1). System SAI level improvement is based on the type
of filter used in series with the system, the strength of the filter, and the reactive logic to
flawed values.
Figure 19 Filter Control Example Figure
Timed Replacements involved the refreshing of system code, components, or
operational states to ensure compliance with some established standard. A timed
replacement does not prevent a failure, but rather prevents the continued operation of the
system in a failed state if:
P1
PR1
Input Output
Active Filtering Process
P1 Input
Reactive Filtering Process
F1
F1
F2
Output F2
PR2

224
1. The failure can be countered by the refreshing of the system,
2. The system can survive up to the timed replacement gate, and
3. The failure has not disabled the ability of the system to refresh itself.
The replacement is designed to trigger at regular intervals to ensure stability of
the system, but could be triggered to execute should a separate component of the system
so command. Timed Replacement does not reduce the failure probability of a system, but
may reduce the Consequence Severity by refreshing or restarting operation in a safe state.
The resulting reduction in Consequence Severity would potentially correspond to a
reduction in system SAI values.
Data Diversity serves to generate alternative input values for a process should the
initial input be outside some prescribed limit. 255 Supplemental values may be completely
dissimilar to the initial input, but should result in essentially the same or semantically
equivalent values. Diversity may be reactive or active in its execution, depending on the
nature of its design. Data Diversity is similar in nature to the Filtering Control with the
additional requirement to ensure that the final result is equal to the expected result while
using different input values. Such a control would benefit safety–critical software
systems where inputs may be generated from various external components in diverse
formats. The Data Diversity component may generate conversion values to convert data
formats or related values that generate near identical values. In the case of a division
function, a denominator value of zero would result in a “divide by zero” error. Such an
error could be resolved through Data Diversity by changing the input to a near infinitely
small value. A Filter may restrict values, while Data Diversity will change failed values.
Error Trapping halts the propagation of failures through the system by the use of
data and system status inspection. When values fall outside of prescribed limits, the error
trapping logic shuts down or isolates the active process flow to prevent the error from
255 Torres-Pomales, Wilfredo; NASA/TM-2000-210616, Software Fault Tolerance: A Tutorial, National
Aeronautics and Space Administration, Langley Research Center; Hampton, Virginia; October 2000.
225
infecting additional components. Error Trapping does not prevent a failure but rather
prevents the propagation of the failure down through the system and optimally to halting
a hazardous event. In come cases, the execution of an error trapping function may result
in additional hazards as system operation and control is halted to prevent propagation.
Error Handling builds on the concept of Error Trapping by halting the
propagation of failure once it is identified, with the additional act of error correction.
While Error Trapping halts the process flow on error detection, Error Handling attempts
to continue process flow with a subsequent correction. Similar to the Reactive Filtering
Control, as system functionality falls outside of predetermined limits, the control arrests
the process flow, inserts an accepted response, and then continues the operation. At the
system code level, Error Handling can be accomplished through the use of the ON
ERROR or other like syntax statement. Error Handling relies on the ability of the
program to
1. Sense the fact that an error has occurred,
2. Recognize of the type of error,
3. Recognize the failed input if required,
4. Have knowledge of a potential resolution,
5. Have the ability to take corrective action.
The below code example in Example 7 demonstrates a plausible Error Handler
using Data Diversity for a “divide by zero” error. The user has the ability to enter any
desired value for the Numerator and Denominator in lines 7 and 8. In the event that a
zero value is entered in the Denominator, the Error Handler will be triggered in line 9.
The error handler case statement logic would select error #6, which in turn would change
the Denominator variable to a value approaching near zero. Line 17 would restart the
system at the division statement with the new Denominator value for the given error,

226
giving nearly the same result. For other errors, the Error Handler would not be able to
come up with a respective solution and would halt system’s operation.
Error Number 6 is the case return value for Overflow or Divide by Zero errors. In the below code example, the procedure inquires of the operator for Numerator and Denominator values. If the division results in an Overflow or Divide by Zero error, then the procedure will execute its Error Handler. By select case, should the return error number = 6 then the procedure will handle the error by replacing the denominator with a near infinitely small value, thereby permitting the execution of the division. In all other error cases, the procedure will alert the user of the failure for further troubleshooting. 1 Private Sub Do_Division 2 Dim Dnum as Double ‘Double Variable Numerator 3 Dim Dden as Double ‘Double Variable Denominator 4 Dim Dres as Double ‘Double Variable Result 5 Dim Response as String 6 On Error Goto Error Handler ‘Define the Error Handler 7 Dnum = Val(InputBox(“Enter the Numerator”)) 8 Dden = Val(InputBox(“Enter the Denominator”)) 9 Dres = Dnum / Dden 10 Response = Msgbox(Dnum & “ divided by ” & Dden & “ = ” & Dres) 11 Exit Sub 12 13 Error Handler: 14 Select Case Err.Number 15 Case 6 ‘Overflow or Divide by Zero Error 16 Dden = 1.0e–32 ‘Make denominator near infinitely small 17 Resume 18 Case Else 19 Msg = "Error # " & Str(Err.Number) & " generated by " _ 20 & Err.Source & Chr(13) & Err.Description 21 MsgBox Msg, , "Error", Err.Helpfile, Err.HelpContext 22 Exit Sub 23 End Select 24 End Sub
MS Basic Example
Example 7 Error Handler Example
Checkpoints are designed to monitor system operation and status at various flow
points to ensure that a specific criterion is met. If the criterion were not met at the
Checkpoint, the system would take some effort to correct the status. Checkpoint controls
do not prevent an error, but attempt to prevent the propagation of an error past a specific
point of the system process. Checkpoints may function in kind with a replacement or
refreshing function that can either replace unacceptable values or refresh system code and
status during inspection. The success of the control, like the Timed Replacement,
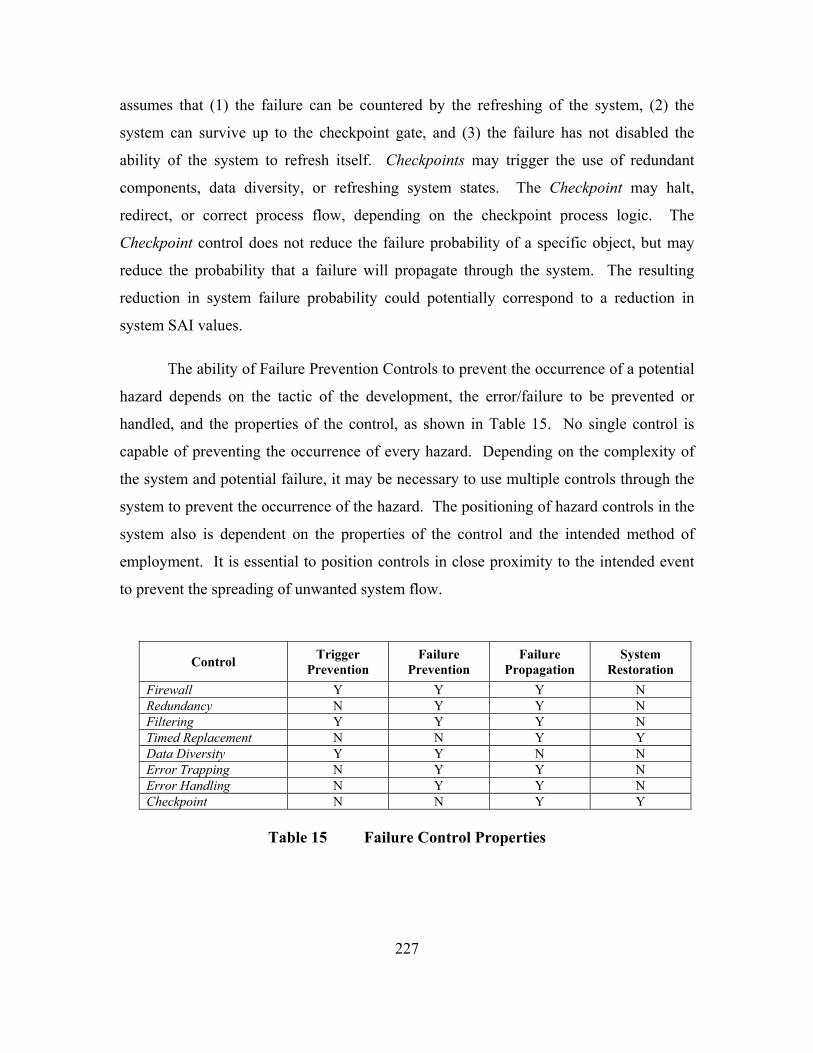
227
assumes that (1) the failure can be countered by the refreshing of the system, (2) the
system can survive up to the checkpoint gate, and (3) the failure has not disabled the
ability of the system to refresh itself. Checkpoints may trigger the use of redundant
components, data diversity, or refreshing system states. The Checkpoint may halt,
redirect, or correct process flow, depending on the checkpoint process logic. The
Checkpoint control does not reduce the failure probability of a specific object, but may
reduce the probability that a failure will propagate through the system. The resulting
reduction in system failure probability could potentially correspond to a reduction in
system SAI values.
The ability of Failure Prevention Controls to prevent the occurrence of a potential
hazard depends on the tactic of the development, the error/failure to be prevented or
handled, and the properties of the control, as shown in Table 15. No single control is
capable of preventing the occurrence of every hazard. Depending on the complexity of
the system and potential failure, it may be necessary to use multiple controls through the
system to prevent the occurrence of the hazard. The positioning of hazard controls in the
system also is dependent on the properties of the control and the intended method of
employment. It is essential to position controls in close proximity to the intended event
to prevent the spreading of unwanted system flow.
Control Trigger Prevention
Failure Prevention
Failure Propagation
System Restoration
Firewall Y Y Y N Redundancy N Y Y N Filtering Y Y Y N Timed Replacement N N Y Y Data Diversity Y Y N N Error Trapping N Y Y N Error Handling N Y Y N Checkpoint N N Y Y
Table 15 Failure Control Properties

228
6. Subjective Factors to Safety Putnam and Mah were quoted in Chapter IV.B of this dissertation, that the four
core measures of a software development include size, time, effort, and defects. In
Chapter III of this dissertation, a discussion was made of the potential developmental
factors that contribute to the safety or failure of a software system. It may be possible to
extrapolate that Software Safety would increase or decrease for the modified action of a
specific set of element variables, without providing a quantifiable result, as follows:

229
Development Element Developmental Action Effect on Safety
Core Components256
System Size Increase Size Decrease Safety
Time to Develop Increase Time Increase Safety / Decrease Safety
Effort to Develop Increase Effort Increase Safety / Decrease Safety
System Defects Increase Defects Decrease Safety
System Complexity Increase Complexity Decrease Safety
Implementation Induced Failures257
Software Used Outside of its Limits Increased use outside of Limits Decrease Safety
Over Reliance on the Software System Increased Reliance Decrease Safety
Software Developed Incorrectly258 Effects of Political Pressure on Development Increased Political Pressure Decrease Safety
The Lack of System Understanding Increased Lack of System Understanding Decrease Safety
The Inability to Develop Increased Inability to Develop Decrease Safety
Failures in Leadership in Development Increased Lack of Leadership Decrease Safety
Development with a Lack of Resources Increased lack of Resources Decrease Safety
Software Not Properly Tested259 Limited Testing Due to a Lack of Resources Increased Resource Limits to Testing Decrease Safety
Software Not Fully Tested Due to Developmental Knowledge
Increased Failure to Test due to Developmental Knowledge Decrease Safety
Software Not Tested and Assumed to be Safe
Increased Failure to Test due to Assumed Safety Decrease Safety
Table 16 Developmental Effects to Safety
The trend of safety effects in Table 16 can be logically derived through various
software subject matter sources, while the particular level of safety change may require a
significant effort and examination of the effect of a particular element to the action of
256 See Chapter IV.B – METRIC DEVELOPMENT. 257 See Chapter III.C – IMPLEMENTATION INDUCED FAILURES. 258 See Chapter III.B – SOFTWARE DEVELOPED INCORRECTLY. 259 See Chapter III.D –SOFTWARE NOT PROPERLY TESTED

230
system safety. Additional research and metric development may later be possible to
determine the quantitative effect of the element on safety. The level of element
application should be done with the full knowledge of its effect on the system and the
intended result on the action. The metric may consist of three or more element
dimensions against safety, or may be consist of an additional metric stage that can
provide some factor to the probability of a hazardous event. For example, the effect of
discovered system defects vs. the limited testing due to resources may generate a factor of
probability of a hazardous event, assuming that each defect could have potentially
resulted in a hazardous event and the limited resource was related to the discovery of a
possible defect. In other cases, the element may simply apply to a particular defect
resolution.
A detailed review of system requirements will identify and permit isolation of
many potentially hazardous events that may occur during system operation. Through an
analysis of the system requirements, it may be possible to identify and calculate the
complexity of the software system, based on historical precedents.
While no concrete measure may exist to determine subjective elemental effects on
system safety, each element should be reviewed and assessed for their effects in
successive iterations of development. The combined effect of some element actions may
be measured against the safety assessment during redevelopment by computing the delta
( ∆ ) of the safety index. Each of the elements should be evaluated before, during, and
after each cycle of development to determine if their action should be modified or
regulated to continue or prevent further changes to the safety index. Some acceptable
and measurable level of testing must be established at the onset of development, resulting
in a testing delta. The ability to link that testing delta to some potential safety hazard
depends on the testing not completed, the system being developed, and how the untested
portion may react to cause an unsafe event. Such a review can be accomplished through
the use of historical failure events and development decompositions, or through the use of
identified development taxonomies, as shown in Table 17.

231
1. Product engineering
1.1 Requirements (stability, completeness, clarity, validity, feasibility, precedent, and scale). 1.2 Design (functionality, interfaces, performance, testability, hardware constraints, and non–
developmental software). 1.3 Code and unit test (feasibility, testing, coding/implementation). 1.4 Integration and test (environment, product, system). 1.5 Engineering specialties (maintainability, reliability, safety, security, human factors, and
specifications).
2. Development environment 2.1 Development process (formality, suitability, process control, familiarity, and product control). 2.2 Development system (capacity, suitability, usability, familiarity, reliability, system support,
and deliverability). 2.3 Management process (planning, project organization, management experience, program
interfaces). 2.4 Management methods (monitoring, personnel management, quality assurance, and
configuration management). 2.5 Work environment (quality attitude, cooperation, communication, and morale).
3. Program constraints 3.1 Resources (schedule, staff, budget, and facilities). 3.2 Contract (type of contract, restrictions, and dependencies). 3.3 Program interfaces (customer, associate contractors, subcontractors, prime contractor,
corporate management, vendors, and politics).
Table 17 SEI's Taxonomy of Risks260
A taxonomy may take the form of a survey with Yes/No or scaled responses. The
subjective taxonomies may include some method of scoring or weighting the evaluated
elements to produce a score or scale of development safety. For example, a score a 0
through 10 or grade of “F” through “A+” could be given to evaluate the system
requirements, with sub–scores assessing the products of requirement stability,
completeness, clarity, and so on. Scores or grades could be determined by defined
criteria with an associated scale. The subjective measure could be used in tandem with
the SAI evaluation to generate a more complete picture of system safety.
Step 8. Action 1 – Determine the Subjective Elements to System Safety
Development. Determine the subjective elements to system development that relate to
260 Software Risk Management, Technical Report CMU / SEI-96-012, Software Engineering Institute;
June 1996.
232
safety and the prevention of a hazardous event. Determine applicable measures and
definitions to classify and assess elements for their potential effect to the system.
Step 8. Action 2. – Evaluate System Subjective Elements. Evaluate the software
system for elements identified in Step 8.1.. Assign a grade or measure to system
elements indicating their compliance to assigned definitions, derived from Step 2 Action
1 and Step 5, Actions 1 through 7. Summarize evaluated elements to determine the
overall effect of subjective elements on software system safety.
F. SUPERVISION OF SAFETY CHANGES
A Software Safety Assessment is not viable unless it can be measured,
implemented, redeveloped, and then re–measured. It is not realistic to imagine that
Software Safety techniques can have any effect without proper management and
supervision of their execution. Development without oversight is essentially hazardous
and significantly adds to developmental risk.
Safety development / redevelopment using the identified hazard controls and
safety elements and techniques serve no benefit unless they are integrated correctly,
monitored, and reassessed for their effect on the system SAI level. The monitoring of
development and change improvement require a consolidated effort of all members of the
development team as well the leadership to ensure that changes contribute to the system,
rather then harm. After the first iteration of development, it is necessary to review
subsequent stages to determine what level of improvement was gained versus the
intended SAI goal. The foundation and success of supervision requires:
• An understanding of the practices of Software Safety,
• Authority to make change decisions,
• The aptitude to identify potential change tactics,
• An understanding of the current system, requirements, and development
goals,
• An understanding of the intended change product,

233
• The aptitude to make interim safety assessments during development, and
• The leadership to control the development process and meet the required
SAI levels.
It is critical to safety development success to supervise and manage the
application of safety principles, to monitor for benefit, and intervene or prevent additional
hazard executions. Safety Supervision strongly relies on a knowledge base of trained
subject matter experts with experience in system development with an emphasis towards
safety. These experts may or may not have experience in the development of software,
but have an understanding of the principles of system safety and their managed
implementation. Supervision consists of:
• Determining a realistic safety index goal,
• Authoring the development plan to obtain the goal,
• Managing the development to meet the goal, and
• And measuring to determine if the goal is met.
The steps of safety supervision may not be completed in a single cycle, but across
a series of cycles, through the completion of development. The management technique
selected should be based on the proven methods and standards such as Software
Configuration Management (SCM) or Capability Maturity Model Management (CMM).
The supervision should be well documented and provide methods for assessment and
peer review. Various military and civil standards have been reviewed in Chapter II.E.1
of this dissertation that includes methods of supervision.
Step 9. – Supervise the Safety Development – Using accepted methods of
supervision and software management, supervise the development of the software
system to ensure compliance with the principles of safety development. Ensure
compliance with applicable development methods, system requirements, and safety
assessments. Ensure that system developmental failures are identified and remedied as
soon as possible in the current or next development cycle, or are acknowledged for
their fragility to customers. At the completion of the current developmental cycle,

234
commence where applicable, the next successive cycle and Step 1.1 of the Safety
Assessment.
G. ASSESSMENT OF VALIDITY / EFFECTIVENESS OF THE MODEL
It would be beyond the scope of this dissertation and model to create a metric
capable of measuring all aspects of the development process and system functionality,
and further capable of accurately generating an all–encompassing safety measure. The
number of elements that contribute to the safe development and execution of a software–
based system can reach near infinite. The validity of this model can be assured through
the establishment of realistic measured goals and objectives.
The primary goals of this model are to:
1. Determine a quantitative value for the number of failures during a period
of system operation, and
2. Determine a qualitative value for the safety of system operation. The
terms failure and safety have been previously defined, as they apply to this
dissertation study.
The number of failures that may occur during a system’s element operational
period can be identified through any of a series of previously discussed methods. Each of
these methods contains their own failure probability that can be affected by a variety of
triggers or external stimuli, potentially inhibiting the proper operation of the element.
Presented is a method for incorporating the success and failure of individual elements
into a combined system failure probability using accepted methods of probability and
statistics.
The quantitative product is validated through the use of existing failure rate
methods commonly used and accepted within the state of the art. Due to the limits of this
study, I make no attempt to justify one failure rate method over the next. The decision to
use a particular failure rate method is determined by the individual developer, based on
235
personal preference, appropriate relationship to the element/system being evaluated, and
amount of effort/resources required to determine the failure rate. The summation of
elemental failure rates is accomplished through the use of accepted mathematical
methods. The validation of any failure rate method can be justified or evaluated against
actual failure rates after project completion or during system testing. These validations
would compel the selection of specific measures during subsequent assessments.
The qualitative value of safety is more difficult to validate, as there lacks any
comparable form of determining a value for safety. Many of the existing safety
evaluation methods are subjective or qualitative in nature and are directly related to the
failure rate of a system, taking into consideration the effects of controls and filters, the
various operating conditions of the system, and the significance of potential hazards.
Other evaluation methodologies, such as those proposed in MIL-STD-882D, the JSSSSH,
the NASA Software Safety Standard, and IEC 61508, assume that the requirements are
imperfect (from a safety perspective). From that imperfection, the failure rate of a system
becomes a reliability issue that may or may not influence safety. Many mishaps can
potentially result from software functioning without a failure, but as the requirements
specified it to execute. Imperfect requirements may not bind the software sufficiently to
prevent a hazardous event. Most of the controls and filters are at the micro–level and are
designed to handle specific failure modes or other causal factors. Their beneficial effect
affects only the failure mode (causal factor) for the hazard being addressed. At the
system level, the system safety analysts address all hazards and their causal factors as
well as the mitigation built into the system to reduce the overall risk. The method
developed and presented in this dissertation use some subjective basis for determining
safety thresholds. These thresholds can be standardized for all similar systems within the
state of the art of high–assurance Software Engineering.
As there lacks any existing safety method for basing the dissertation against, it is
only possible to validate the process through which the method evolves. As previously
introduced in Chapter I.E of this dissertation, safety was determined through the
evaluation of the following factors in Table 18.

236
Complexity Veritability of Inputs
Cleanliness of Inputs (Quality) Dependability / Reliability Factor of Inputs
Ability to Sanitize Inputs (Correction) Consequences of Sanitization
Ability to Filter Inputs (Prevention) Consequences of Filtering
Permeability of the Requirements Permeability of the Outputs Veritability of Outputs
Ability to Verify Outputs (Quality) System quality control
Ability to Sanitize Outputs (Correction) Consequences of Sanitization
Ability to Filter Outputs (Prevention) Consequences of Filtering
Probability of a Fault Consequence of Fault Probability of Failure Consequence of Failure Product Safety or Dependability Index.
Table 18 Quantitative and Qualitative Factors of Safety
Chapters IV and V of this dissertation address the validation and computation of
each of these values independently. The evaluation of these results against a developed
threshold demonstrates the benefit of the presented method. I further define the methods
required to create acceptable threshold standards for the evaluation. The effectiveness of
the method can be judged by the following factors:
• By the level / extent for which a system must be evaluated to generate
quantitative values – increased investigation increases the probability that
weaknesses will be discovered and corrected, thereby improving safety.
• By the use of a repeatable method for determining the safety of a system –
increasing user proficiency through the repeated use of a standardized
procedure, thereby assuring a more stable performance in the evaluation
process.
237
• By the use of reusable safety threshold gates – increasing the depth of the
model by the use of standardized evaluation practices, thereby increasing
the acceptance of the safety evaluation method.
• By the use of customizable bounds, limits, and definitions that can be
tailored to meet the specific needs of the developers – increasing the
adaptability of the metric to the particular requirements and methodologies
necessary for efficient development.
• By the ability to catalog measured system element performance in various
systems – increasing the ability to compare and relate the system
performance and safety of one system against the historical performance
of a second associated system, increasing the ease of use and efficiency of
the system.
• By the incorporation of effective correction methods – increasing the
safety of the system by the inclusion of logical processes to strengthen and
protect the system, thereby increasing safety.
The primary function of this method is the ability to place a value of safety upon a
software–based system. The validity of that method is still based on the ability of the
evaluator to employ the principles of the metric, recognize the potential faults and
hazards from within the system, and to make the appropriate corrections required to
increase the safety level to an acceptable level.
238
H. COMPARISON TO PREVIOUS WORKS
Chapter II.E.1 of this dissertation outlined the state of the art of Software Safety
standards, while Chapter II.E.2 reviewed the state of the art of safety evaluation methods.
While evaluating the relatively small field of software based safety–related methods, it is
evident that there exists no safety evaluation method that can assist developers in
accurately determining a true value of a software system’s safety. Many of the observed
metrics detail methods for identifying faults and hazards within a system, while other
metrics detail how to make a system safer, some as simplistic as to imply that a system
safety is directly related to faults. APPENDIX D.1 of this dissertation consists of a
review of predominant Software Safety Standards and Techniques.
The method introduced in this study presents a unique approach to Software
Safety Assessments beyond that offered by existing methods. While the methods
investigated for this study provide some benefit to Software Safety through process
improvement, 261 the presented method introduces a complete lifecycle philosophy
towards the development and employment process of high–assurance systems with new
or refined definitions, a methodical assessment process, customizable thresholds,
methods for limiting failure severity, and process improvement. Due to the infant nature
of software development and the field of Software Safety, and the new methods
introduced within this dissertation, there exists little similarity to current works of the
same field.
I. CONCLUSIONS
Software development contains an inherent level of risk that could potentially
jeopardize the completion and success of a software system project. It may be possible to
develop a metric to measure the risks to software development using elements and
properties that assess the size, complexity, and fluidness of a system.262 The concept and
261 See Chapter II.E – STANDARDIZED FOUNDATION OF SOFTWARE SAFETY 262 Nogueira de Leon, Juan Carlos; A Formal Model for Risk Assessment in Software Projects, Naval
Postgraduate School; Monterey, California; September 2000.

239
rationale for determining Software Safety is well rooted in mathematics and procedural
methodologies, while the application of such an assessment remains to be completed.
This chapter has presented a plausible format for developing such a metric, based on
accepted and proven methods of system safety, tailored to configure to the demands of
software based systems. The ultimate goal of a safety assessment would be to solve for
[ S = Σ P(H) * C(H) ]. The stepwise process introduced in this chapter and demonstrated
in APPENDIX E offers a plausible method to determine the safety of the system. While
the study of Software Safety and Risk Management contains methods of preventing an
unsafe occurrence, the use of a mathematically based metric provides a tangible measure
for determining how safe a system may be.

240
THIS PAGE INTENTIONALLY LEFT BLANK
241
VI. APPLICATION OF THE FORMAL METHOD FOR EVALUATION OF SOFTWARE SYSTEMS
“Engineers should recognize that reducing risk is not an impossible task, even under financial and time constraints. All it takes in many cases is a
different perspective on the design problem.”
– Mike Martin and Roland Schinzinger, Ethics in Engineering263
While many disciplines of engineering rely on adherence to the laws of nature
(i.e., aerospace, civil, and mechanical engineering), Software Engineering relies on man
to determine the laws and bounds based on which the software system is constructed.
The independent developer is capable of determining and assigning new laws that bound
and controls the software system. This fluid structure grants great liberty to the
developer, while adding a significant degree of risk and failure probability to system
development and operation.
Software Safety Assurance requires the combination of various disciplines to
ensure a successful and acceptable264 development product, including:
• The ability to develop safer software,
• The ability to measure the development of the software system, as well as
system functionality, and
• The ability to take system measurements and apply them to generate a
measure of system safety.
The ability to develop safer software is well documented. The concepts and
practices of Software Safety Assurance range from the obvious “To make software safer,
prevent the occurrence of hazards”; to the more complex concepts of software
263 Martin, Mike; Schnizinger, Roland, Ethics in Engineering, McGraw-Hill Science/Engineering/Math
Division, 3rd edition; 01 February 1996. 264 Note: The term “acceptable” denotes the fact that no safety critical system can be considered
absolutely without the potential for a hazardous event. It is possible though, to determine a level of hazardous events that would be acceptable to system operation.

242
development management, methodology, and practices. Many of the current standards of
Software Safety Assurance are included in Chapter II.E of this dissertation. The
limitations and ability of a development team to actually create a system at some actual
or arbitrary265 level is reviewed in Chapter III. The ability to make a system under safe
conditions does not necessarily infer safety; it only implies that the system was designed
under such safe conditions. A sound assertion of safety can only be accomplished
through a measurement of the product by an accepted metric.
The capacity to measure the development of a software system is varied,
depending on the intended product of the measurement, the software system in question,
and the resources available to make such measurements. Lines of code266, complexity,
temperature267, volatility268, and required resources all provide some type of measurement
that can be used to determine the ability of a team to actually develop a software system.
Chapter II.E included a discussion of the potential measures that could contribute to an
assessment of the software development, while their applicability toward Software Safety
was reviewed throughout this study. Mean time to failure, hazard occurrence probability,
and Consequence Severity are all acceptable measures that contribute to determining the
safety of the software system. The more difficult task is to find a way to take the
resulting measurement and logically apply it towards some resulting Software Safety
value.
A Measure of System Safety is one the Holy Grails of Software Engineering.
Many organizations and private corporations have touted its existence, while its
foundation is based largely on hearsay and loose theoretical assumptions. Each safety–
critical software system may have one or more potentially hazardous events, each with
265 Note: The term “arbitrary” denotes the fact that many software professionals have no concept of how
safe they desire the system to be. Many developers and customers fail to understand the mechanics of software failure and thereby desire an absolute value of safety without perception of the consequence.
266 Note: Lines of code or any count of modules, function points, or other acceptable elements of the software system.
267 Saboe, Michael S.; Software Technology Transition, Entropy Based Engineering Model, Software Physics, Naval Postgraduate School; Monterey, California; March 2002.
268 Nogueira de Leon, Juan Carlos; A Formal Model for Risk Assessment in Software Projects, Naval Postgraduate School; Monterey, California; September 2000.

243
their own potential for occurrence and operation, and each with an independent measure
of acceptance. The statement that a system is safe must take into account each of the
independent elements of system operation and failure only in so much as they apply to
Software Safety. Any review of software system operation beyond those that could
potentially result in a hazardous event is not required.
A. A SAFETY KIVIAT MODEL
After all of the assessments and testing has been completed, it still falls upon the
developers and clients to determine if the system is actually safe enough for employment.
Multiple criterions have been established from the requirement’s specification documents
that spell out the thresholds for the system’s safety. In the end, the level of safety hinges
upon a series of factors that combine to generate a confidence, and ultimately, a level of
safety. Such factors would including, but not be limited to:
• Logic, including the use of Controls and Mitigators,
• Process and Methodologies,
• Experience of the Requirement’s Authors, Designers, Developers, and
Integration Teams,
• Reuse of Trusted Systems, and
• Testing and Assessment Methods
In the development process, as the performance, competence, or proficiency of
each of the elements – Logic, Process, Experience, Reuse, and Testing – increases, the
ultimate confidence in the system increases, directly resulting in an improvement in
Safety. Each of these elements has a direct relationship upon the other elements within
the group, essentially complimenting their performance. As Logic increases, the Effort
required to implement the Process and Methodologies decreases, increasing the level of
performance of the Process. As the Reuse of proven elements increases, then the effort
of Testing decreases, permitting greater resources to be expended on other critical testing
elements. Experience has a direct effect on the performance on all of the elements.

244
Using the Kiviat graph technique, it is possible to depict the levels of performance
of each of the elements as they relate to Software Safety Engineering to demonstrate a
measure of confidence for the development process. Figure 20 demonstrated a potential
method for depicting the elements with each gradient representing the level of
performance of the element. The center gradient would represent a non-existent level of
proficiency for the vector, increasing out the highest level of proficiency at the end of the
vector. Connecting each point on the vectors creates a bounded area representing the
total proficiency of the development process. The Kiviat graph can represent a visual
depiction of the development process when concentrating on Software Safety, vice the
traditional measurements of the software components. Encouraging a strong emphasis on
the system safety process during development, the greater the area, the greater the
confidence an engineer may gain in the system’s development, thereby implying greater
system safety.
Figure 20 Kiviat Depictions of Safety Related Elements
Through continued refinement, the ultimate Kiviat graph may contain any number
of elements that contribute to the safety of the system through development. Using the
Kiviat graphic, it is possible to visually depict the elements of the development process,
demonstrating balance within the apportionment of resources and tasking, relating a value
of confidence, and implying a level of effort necessary to complete the construction of
the system in the early stages of development. Rather then existing as a static product,
Best Q1 Good Low
Q2 Poor Q5 Non-existent
Q3 Q4
Where: Q1 = Logic Q2 = Process Q3 = Experience Q4 = Reuse Q5 = Testing
Q1
Q2 Q5
Q3 Q4
245
the resultant Kiviat graph would serve as a dynamic representation of safety elements
throughout the lifecycle of development. This depiction can be reassessed at periodic
stages of development and then compared at the end process for validity. Once refined,
such a model could be used to associate safety to each of the elements and to the
associated bounded area.
B. EFFECTIVENESS OF THE METHOD
The goal of the Software Safety Assessment is to determine a level of safety for
the software system. The effectiveness of the method is based on the evaluator’s ability
to investigate the system requirements; identify potential hazards, failures, and
malfunctions; and determine probabilities of event activities. From that assessment, it is
then possible to evaluate the system against established thresholds. System thresholds
are established based on criteria from the development requirements, historical
precedents, and subject matter expertise.
The effectiveness of the assessment can be judged by the comparison of identified
failures, malfunctions, and hazards; probabilities; and consequence severities against
actual results observed after system employment. It would be perilous and foolish to
leave known hazards in the software system to observe their result in a real–world
environment. Depending on the system and identified hazards, it might be possible to
simulate the real–world operating environment, but the simulation could mask events
otherwise occurring in an uncontrolled environment.
If it were possible to identify and control unacceptable hazards, the system could
be deployed and observed in the real–world environment. In this state, the system could
be evaluated and compared against the development assessment. The difference between
observed and predicted actions result in a measurement of the effectiveness of the
assessment.
In cases where it would be impracticable to permit the system to operate to its
failure; either due to limited resources (time, capital, testing mechanisms…), the
infrequency of unidentified failures, or desire to have a real time measure of assessment
246
effectiveness; it would be possible to compare the findings of the Software Safety
Assessment against the findings of similar system assessments. Such a comparison could
only be accomplished where there exists an archive of software systems and their safety
assessment results. Such a library would not be unlike that of today’s software code
libraries or COTS / GOTS repositories.
C. AUTOMATION
As stated in Chapter IV.B, the success of a Software Safety Metric relies on
robustness, repeatability, simplicity, ease of calculation, and the potential for automatic
collection. As previously presented, the Software Safety Metric meets all of the
requirements for metric acceptability, with the exception of automatic collection. The
concept of a mathematical approach to determining the safety of the system is very robust
to change, with the exception of the additional burden on the developer to assure that the
results are part of the new computation. The mathematical principles supporting the
computation do not change for each iteration of development and are actually stable from
project to project. Within a well defined system, the ability to independently repeat and
arrive at like conclusions should be assured, as long as each evaluator completely
understands the practices of software evaluation and probability computation. By the use
of standardized practices, the metric is intended to be simplistic and require little training
to perform. Through the use of accepted probability and statistics equations, and the
ability of developers to limit the metric to fit their specific requirements, the complexity
of calculation is greatly reduced.
While the use of such a metric standard may be possible to some degree, the
ultimate trial comes from the ability to automate the collection and computation process,
thereby ensuring compliance and standardization to the metric fundamentals. The results
of each assessment can then be archived and reevaluated for conformance of metric
predictions of safety levels to measured failure rated after the system has been
implemented. With the repeated appraisal of the assessment process and metric
computations, modifications and enhancements can be made to this research to continue
the improvement of the state of the art. Safety Assessment Automation would reduce or

247
eliminate the need for human intervention in the collection and evaluation process,
assuring repeatability and ease of use. Such automation must be unidirectional, from the
system to the automated metric, ensuring that the metric automation system does not
inadvertently introduce a potential flaw or failure to the system under investigation.
Currently, there exist numerous commercial code–level software test and
development tools that can evaluate and control the robustness of a system. Such
automated design level tools, like the Ada–based compiler Spark269, intend to prevent
software-induced failures during code development, while they lack the ability to prevent
design deficiencies in specifications and implementation. Test level tools, such as the
Ada–analysis tool AdaSTAT 270 , attempt to evaluate the finished product code for
completeness and violations of project–specific language restrictions. Pre–code level
design tools, fabricated to develop the elements of the system before coding commences
attempt to determine system elements and their operating parameters before the scripting
of actual code. Tools such as CAPS271 or PSDL automate the design process through
prototyping and object creation. Some prototype tools are capable of automated base
level code creation from the trial product. For example, CAPS is based on a prototyping
language with module specifications for modeling real-time systems and combining
reusable software. Such tools make it possible for prototypes to be designed quickly and
executed to validate requirements.272 The addition of an automated safety assessment
module to such a prototyping system would increase the efficiency of system
development by permitting near simultaneous development in conjunction with a safety
evaluation in the initial stages of development. It must be assumed that each system
development tool and compiler is free of defect and that the product that is produced
contains no logic based failures beyond those defined in development.
269 Barnes, John; High Integrity Ada, The SPARK Approach – Spark 1.00 for Windows, Addison-Wesley,
Praxis Critical System Limited; 1997. 270 AdaSTAT – Ada Static Analysis Tool, DCS IP, LLC; Alexandria, Virginia; 2002. 271 CAPS – Computer Aided Prototyping Systems, Naval Postgraduate School; Monterey, California. 272 Faculty Research Catalog of the Department of Computer Science, Naval Postgraduate School,
Monterey, California; April 2003.
248
Despite the abundance of code-related design tools, I have noted that flaws and
errors in code methodology are only one of a chain of potential elements that leads to
determining the safety of a software system. Invariably, the most likely source of safety–
related failures is in the requirements specification. They are generally incomplete,
inaccurate, ambiguous, and subject to interpretation. Ultimately, an automated tool must
include the tracking of software system development from requirements to the test
product with some integration to system operation. Currently, many developers rely on a
menagerie of different management tools including Microsoft Project273, DOORS274, or
other homegrown databases and documents. Within the flexibility of these tools, is the
ability to tailor the product to meet the explicit needs of the organization. Each of these
management tools, while highly flexible, detracts from standardization while adding
functionality.
It is possible to develop a software–based system on two levels:
• Capable of taking user inputs to manage the development of the software
system and generate a possible Software Safety Index, and
• Capable of taking user inputs, coupled with third party automated software
tools, to manage the development of the software system and generate a
possible Software Safety Index.
The development of the first system is highly plausible, assuming that a
standardized methodology of software management and documentation can be agreed
upon. It would be possible to gather and present system requirements, establish system
safety limit tables, manage system development and tasking, prompt user assessments at
the base level, and produce an automated SAI output. The development of the second
system, while increasing the level of assessment automation, would be more difficult as it
must rely on the functionality of third party development tool. The Software Safety tool
must assume the static development of the third party tool (no improvements), and the
273 Microsoft Project 2000, Microsoft Corporation; Redmond, Washington; 2001.

249
continuous use of the current software language and format (assuring use of the third
party tool). It would be more applicable to tie the concept of Software Safety Assurance
and management directly into the development of future software development tools.
The presentation format of assessed data can be as critical as the data itself.
Properly presented, the data can be easily translated and understood by members of the
development team. The data presentation format could be tailored to meet the needs and
preferences of the developers and the clientele. Various software development tools have
automated modules that can present assessed data in preformatted report formats
including Gantt charts, object flow charts, and stop light depictions.
Until such time that an automated safety development tool is created, the
Software Safety metric can be semi–automated using any of a number of spreadsheets,
database, or development management tools.
D. METRIC
The stepwise format of the Software Safety Assessment permits a structured flow
for implementing the metric. Despite lacking automation, the structure flow of the metric
could be manually blended into the existing development process by overlaying metric
procedures into accepted spiral development models. It is not essential that metric steps
be accomplished uninterrupted, rather efficiency dictates that steps be incorporated in
order throughout the development and implementation process to provide real–time
opportunities to alter and correct potentially unsafe processes.
274 DOORS, Telelogic AB; Malmö, Sweden; Irvine, California; 2001.

250
The success of the Software Safety Assessment metric depends on the following
factors:
• An understanding of the consequences of potential failures.275
• The ability to use hazard awareness and identification in a mitigation
process that reduces the potential for hazardous events.276
• The integrity to identify weaknesses in the software process without fear
of negative consequences or reprisals.277
• The repeated use of the metric to build confidence, proficiency, and
adaptability to the development process.278
• Access to industry and field library resources to gain broad–based
situational awareness to the state of the art of Software Engineering.279
• Standardization in the design and nomenclature of hazard and severity
tables tailored to the field of high–assurance systems.280
Despite any lack or availability of resources necessary to make safety changes discovered
in the assessment process, it is essential that individuals make the required assessments to
gain awareness of the potential for the system. Should the system fail in the future and
result in a hazardous event, it may be possible for the developer / owner of the system to
prepare reactionary processes to compensate or mitigate for the event.
275 See Chapter V.C. - INITIAL IDENTIFICATION OF THE HAZARD 276 See Chapter V.E.4. - Decision Making. 277 See Chapter III.B.1. - Political Pressure 278 See Chapter V.F. - SUPERVISION OF SAFETY CHANGES 279 See Chapter VI.C. - AUTOMATION 280 See Chapter II.G.1. - Comparisons of Safety Definitions

251
E. MANAGEMENT
1. System Managers The success of Software Safety relies on the management of and proper adherence
to the principles of software development and employment. Managers must be well
aware of the requirements of a Software Safety Assessment, as well as the tools, methods,
and practices required for such a development. The use of an automated tool would
greatly increase the efficiency of the Software Safety Assessment process, decreasing the
burden on the development manager. It is imperative that management discovers and
provides the tools and resources required for an efficient development process that
encourages complete development, compliance to accepted requirements, and the
reduction of potentially unsafe events.
Management is ultimately responsible for the successful integration of the
safety assessment into the Software Engineering process.
Managers must present an atmosphere that encourages a realistic assessment of
the product, does not discourage members for discovering faults, and rewards members
for the discovery of potentially unsafe faults that can be corrected. Management is not
deterred from punishing members who create a potentially unsafe element, as long as the
reprimand does not detract from the overall success of the engineering process.
The atmosphere that management presents to the development and
implementation process, and the emphasis for which they put on safety assessments,
directly affects the success or failure of a program. If a manager places little concern for
safety and project completeness, then engineers may potentially disregard required
process steps as burdensome and without merit. If a manager establishes accountability
and training towards a goal of increased Software Safety, then engineers will potentially
incorporate those traits into the software process. It becomes the manager’s duty to
discover a balance between efficient development of a high–assurance software system

252
(efficiency measures including the reduction of potentially unsafe events) and the over–
burdensome requirement of safety verification beyond that which would create a
diminishing return.
2. Metric Management It is my opinion that the success of any process relies on three basic principles:
(1) Its acceptance among the professional body for which it represents,
(2) Its ability to provide a usable product, and
(3) Its ability to adapt and be customized for changing environments and
improvements in the state of the art for which it represents.
The safety assessment process introduced presents a refreshing view to the field
of Software Development and Engineering. The introduction of these concepts and
methods to the body of Software Engineers should be accomplished in three distinct
phases:
(1) The introduction of safety, failure, and hazard definitions as they apply to
the field of Software Engineering,
(2) The introduction of hazard and severity tables, as demonstrated in this
dissertation, and
(3) The incorporation of the stepwise safety assessment process, utilizing
definitions and tables introduced in the first two phases.
The introduction of the dissertation subject matter would be accomplished
through its published incorporation in various professional journals and periodicals, as
well as at lectures and gatherings where new methods can be openly introduced,
discussed, and reviewed by contemporaries of the Software Engineering field.
Managing the extended life of the safety assessment process requires some
acceptance by the professional field of Software Engineers. The professional field is not
limited solely to organizations such as System Safety Society, the American Society of

253
Safety Engineers or IEEE281, but to include specialized organizations such as ASCE282,
ASME 283 , NSPE 284 , DISA 285 , DARPA 286 , NUREG 287 , and BSI 288 . Academic
organizations and symposiums, such as the Monterey Workshop, sponsored by the
Software Engineering Department of the Naval Postgraduate School, provides a valuable
opportunity for introducing the method of safety assessments to a wide body of Software
Engineers as well as governmental and private organizations interested in increasing the
safety of high–assurance systems.
The software assessment presented in this study is designed to provide two
products to the Software Engineer – The quantitative measurement of software failures
through the software lifecycle; and the qualitative measurement of Software Safety. The
ability to accomplish both goals requires some level of training and instruction to
industry professionals, to ensure proper implementation and compliance to the
established principles. Failure to provide such training could result in the breakdown of
the software assessment method and eventually its disregard as an industry tool. Training
could be easily accomplished through the use of periodical literature, published
instruction, and academic incorporation.
The process previously introduced in this study is still in its infancy; no more
mature then the field of Software Engineering itself. Such infancy encourages review
and improvements to approach maturity. The success of the assessment process demands
the continued maturity of the method to ensure that a usable product can be generated
across the widest variance of Software Engineering circumstances.
The ability to customize and adapt the safety assessment is essential to guarantee
the widest incorporation into the engineering field. The concept of a safety assessment is
281 Institute of Electrical and Electronic Engineers. 282 American Society of Civil Engineers. 283 American Society of Mechanical Engineers. 284 National Society of Professional Engineers. 285 Defense Information Systems Agency. 286 Defense Advanced Research Projects Agency. 287 U.S. Nuclear Regulatory Commission. 288 British Standards Institute.

254
not new to the engineering discipline, but additional emphasis is needed to incorporate
the process into the field of Software Engineering. Customization and adaptations can be
accomplished so long as they do not detract from the functionality and ability of the
assessment to provide a viable product. The use of safety/failure libraries and archives
would provide users with resources for generating usable thresholds and controls to better
manage the engineering process and ensure a usable result. Libraries could be exclusive
to private organizations that have a sufficiently large development base to ensure some
variety, or can be public in nature, fed by governmental, private, or academic entities
with a common interest in increasing Software Safety and reducing the risk of hazardous
events.
Each of these topics is a viable subject for additional research and discussion
beyond the scope of this dissertation.
F. COMPLETENESS
Completeness, in the form of a software assessment assumes that all of the
potential roots of the system have been investigated and evaluated. It is not necessarily
implied that each root will be free of a defect, but that each root has been assigned a
value of probability, and that probability and consequence are well understood. Previous
software development projects have revealed that poor granularity of metrics and
measures did not reveal problems until they had already occurred. A Software Safety
Assessment is fruitless if a failure occurs that was not previously discovered or
anticipated. Each assessment and investigation must be thorough enough to completely
discover every potential failure, in so much as resources permit.
When resources limit the investigation of potential failures, emphasis can be put
on roots of the system that hold the greatest consequence should a failure occur. Where
consequences are equal, emphasis can be put on roots where the probability of occurrence
cannot be mitigated by the use of some control. Completeness does not imply an
absolute investigative coverage of the entire system, but rather the assurance that the
system has been protected completely, as so far as resource and development permits. If

255
one black box element of the system can be controlled and isolated, should an unknown
error occur within its operation, and then isolation and control does not affect the
continuous operation of the system as a whole, then the element can be considered safe.
It should be cautioned that even a minor change to the system, especially the software,
could result in a change to the system context that invalidates that assessment.
Risks are not always identified or reported. Even when metrics and measures are
reported that showed risks, there may be no action by government or contractor to correct
incipient problems. The success of a Software Safety Assessment relies on a mechanism
for feedback that affects the system product, the development / redevelopment process,
and the extent to which system requirements were effected.
The safety development process must be evaluated for the economic requirement
and potential benefits of the application change. The safety development process must be
looked at as a change to the system, as it is designed to improve upon existing
requirements and development shortfalls. If the system requirements were correct and
complete (from a safety perspective) at the onset of development, then safety changes
would not be required. Various metrics and scales have been developed to measure the
required resources and effort necessary to make development changes. 289 Those
estimations can then be verified at the completion of development. Safety benefits are
hypothetically based on an assumption of system functionality that can only be verified at
the completion of an established goal, either in time or action.
Controls must be evaluated for their potential benefit to Software Safety and
failure prevention, as well as their effect on system performance and ability to meet
developmental requirements. The implementation of safety controls requires an
evaluation of potential resource economics, the level of effort required to include the
control, and the potential effect of the control upon the overall operation of the system.
289 Boehm, Barry; Clark, Bradford; Horowitz, Ellis; Madachy, Ray; Shelby, Richard; Westland, Chris;
Cost Models for Future Software Lifecycle Processes: COCOMO 2.0, Annals of Software Engineering; 1995.

256
Completeness of the system must consider the effects of specific elements upon single
requirements as well as upon the system as a whole.
G. PERSPECTIVE CLIENTELE
The safety assessment method introduced in this dissertation is applicable to a
variety of Software Engineering ventures. Primarily, the safety assessment would benefit
the development and implementation of high–assurance software systems. The extent of
the safety assessment is not solely limited to high–assurance systems, but can serve to
benefit the development of all systems that have the potential for a hazardous event.
Predominately, resources are expended for safety assessments only on systems that
require a high assumption of safety. This particular method of safety assessing can be
applied to any scale of Software Safety Engineering, from the most benign to the most
precarious. The potential client for such an assessment process spans a myriad of
distinctions from private, to educational, to governmental organizations.
The power generation field relies greatly upon high–assurance software systems
to manage, control, and provide power to the general public. The failure of a power
generating system can potentially result in any of a number of hazardous events external
to the power generator – to clients who rely on the power system. The inability to control
the power generating system could result in a catastrophic event internal to and external
to the power generator – such as in the control systems to a nuclear power facility.
Clients such as the public power generation field would greatly benefit from such a
method and its ability to provide:
• A valid safety assessment of the potential hazards of the system.
• The ability to identify weaknesses and cost of potential mitigation controls.
• The ability to inform and protect from potential hazards through the
inspection and identification of safety–related system operation.
257
The world’s military superpowers insist on highly effective and technologically
advanced weapons and defense systems capable of meeting the national objectives of
their respective leaders. The failure of such a technological weapon could result in the
inability to meet expected goals and combative milestones. The failure of a defensive
system could leave allied forces vulnerable to attack and eventually susceptible to
considerable troop losses. With the reliance on technologically complex weapons to
bring order and victory to the battlefield, it would be prudent for defense contractors and
developers to utilize such a safety assessment process. The results of such a process
would provide military commanders with a realistic expectation of the success or failure
of their weapons and defenses as well as the foresight to make compensatory alterations
to their battle plans.
The chemical industry has automated a considerable portion of their
manufacturing process, using various high–assurance systems to ensure a superior quality
of chemicals, biological agents, and pharmaceuticals. Should the production of these
chemicals fall outside of the delicate balance permitted in their nature, then the hazardous
event could have cataclysmic results with worldwide consequences. One could only
imagine the impact of an inadvertent release of a biological agent or the tragic result of a
chemical spill into a national waterway. Private industry has an economic and moral
interest in the success of their product. Such a safety assessment would permit industry
to protect, mitigate, and prepare for a hazardous event. The ability to assess and measure
the safety of a product gives industry the capacity best serve its clients and further
guarantee the continued viability of their organization.
Educational institutions serve as the bedrock for future development practices and
standards introduction. From this foundation, new engineers are instructed on the
techniques and talents that will provide tomorrow’s solutions. If the concept of Software
Safety Assessments is established early in the educational process of future Software
Engineers, then in the long term, the trend towards reviewing and measuring software for
its ability to prevent or participate in a hazardous event can be recognized. Formal
258
education is paramount towards the future success of Software Safety. Assessment and
measurement is the first in a series of process steps necessary for the security of software
evolution.
H. CONCLUSIONS
The application of a Software Safety Assessment has been justified by its ability:
• To support critical development and implementation decisions at
milestone or other decision points.
• To find the reasons for major problems such as cost overrun, schedule slip,
inability to meet development requirements, the inclusion of potential
faults, or a failure to pass a technical milestone such as testing.
• To baseline the program status, identify and prioritize risks, and plan for
improvements and risk management.
o This kind of assessment is not in reaction to a crisis. Its objective is to
prevent problems by early recognition of risks and to identify
opportunities to make improvements.
• To investigate specific technical issues or evaluate technical products for
their ability to control and prevent the occurrence of a hazardous event.
• To determine how well successive series of development are capable of
implementing a safe development.290
The assessment process introduced in this dissertation is capable of establishing a
basis for qualitative Software Safety. The application of this assessment process can be
accomplished with minimal overhead to existing spiral or repeating development
processes. The process does not limit itself to the development of a software system

259
alone, but includes the installation and employment processes as well. From its inception,
this stage-wise process was intended to meet each of the basis practices of a valid
assessment. As a first generation assessment process is will continue to grow and mature,
compounded upon and refined by additional research and application.
The use of this metric will require some changes to the methods for which
software is designed and implemented. These changes will include a greater obligation
by management to ensure compliance to the assessment requirements. Developers will
be required to pay greater attention to potential mitigation controls necessary to reduce
identified hazards. Product customers will need to pay greater attention to the potential
hazards of the product that they are about to implement and be prepared to take
responsibility for those hazards that cannot be mitigated. The burden for these
requirements to management, developers, and customers should be minimal when
compared effort required for the entire software system process.
The process can be readily incorporated into existing software development
projects or be adapted as necessary to be included into future ventures. Benefits from the
safety assessment can attained by both private, commercial, governmental and
educational users. Where possible; information, mechanics, and findings of the safety
assessment process can be shared by various users to establish a baseline of safety data,
ultimately improving the development and implementation of high–assurance systems.
290 Attributed to Clapp, Judith; The Best Practices - Forum on Independent Program Assessments, The
MITRE Corporation; Bedford, Massachusetts; 05 December 2000.

260
THIS PAGE INTENTIONALLY LEFT BLANK
261
VII. SOFTWARE DEVELOPMENT DECISIONS
A. SOFTWARE NEGLIGENCE
Software producers have an inherent responsibility to their customer to
provide a product that is, to a reasonable degree; safe, free of defects, and meets the
requirements agreed upon at the time of production.
Under negligence law, software developers must not release a product that poses
an unreasonable risk of personal injury or property damage to the customers or the
general public.291 Negligence is defined as the “failure to exercise the degree of care
expected of a person of ordinary prudence in like circumstances in protecting others from
a foreseeable and unreasonable risk of harm in a particular situation.”292 To a great
extent, most lawsuits over defective software are for breach of contract or fraud, partially
because they did not involve or were caught before they could result in personal injury or
property damage. In the most unfortunate of circumstances, software’s failure causes
such harm. Personal injury could run the gambit from actual to presumed harm, be it
physical or mental.
It is possible for a customer or member of the general public injured by a software
related event to sue a software provider or the developers for not taking reasonable
measures to ensure the product was safe. Reasonable measures are those actions that a
reasonable, cautious provider or developer would take to protect the safety of its
customers or the general public. The common approach to determining the financial
responsibility of the developer can be expressed legally by the cost–benefit equation
expressed in Equation 4, from the formula by Judge Learned Hand in the case of United
States v. Carroll Towing Co.293, 294
291 Kaner, C.; Software Negligence & Testing Coverage, Software QA Quarterly, Vol. 2, #2, p. 18; 1995. 292 Negligence, Merriam-Webster's Dictionary of Law, Merriam-Webster, Incorporated; 1996. 293 Federal Reporter, Second Series, vol. 159, pg. 169, United States Court of Appeals, 2nd Circuit; 1947. 294 Landes, W.; Posner, R.; The Economic Structure of Tort Law, Harvard University Press; 1987.

262
B = P x L
Where B = The Burden or Expense of preventing the hazardous event. L = The Severity of the Loss if the event were to occur. P = The Probability of the Occurrence of an event.
Equation 4 Legal Definition of the Cost–Benefit Equation
It would be considered unreasonable for a software producer to develop a
software product where the burden of production exceeds the severity and probability of
a hazardous event.295 In a recent and highly publicized case, GTE Corp. mistakenly
printed 40,000–50,000 unlisted residential phone numbers and addresses in 19 directories
that were leased to telemarketers in communities between Santa Barbara and Huntington
Beach. GTE blames the problem on a software failure. The company faced fines of up
to $1.5 billion, if found guilty of gross negligence. The case was resolved in 1998 in an
undisclosed settlement. 296 Such a settlement would question if it would have been
reasonable to expect GTE to pay $1.5 billion to compensate for such an incident,
considering the fact that the injury to customers was an invasion of privacy and that a
nuisance was created by telemarketers contacting their private phone numbers, or if it
would have been more economical (or possible) to afford a lesser sum to mitigate the
incident before it would have occurred through the development of a better software
system. In May of 2000, Pacific Bell published the names, numbers, and addresses of
more than 11,400 unlisted Cox Communications telephone subscribers in San Diego.
Cox Communications admits that it erroneously forwarded Pacific Bell the numbers,
citing a software error. Cox has since paid over $4.5 million to replace approximately
440,000 phone books, as well as an undisclosed expense for new unlisted numbers and
other compensation.297
295 Kaner, C; Quality Cost Analysis: Benefits and Risks, Software QA, vol. 3, num. 1, pg. 23; 1996. 296 X Telecom Digest, Volume 18, Issue 60; 27 April 1998. 297 Hammerman, Ted; Sparapani, Tim; “If I were them…”, Office.com; 26 July 2000.
263
The safety assessment method addressed in this dissertation would serve to
compute the possible burden for such a hazard, either by identifying the effort to mitigate
the hazard or the potential cost for such hazard to occur. It would be reasonably expected
that a prudent developer would make such an assessment to:
1. Determine / Identify the functionality of his system,
2. Identify the weaknesses within the operation of the system,
3. Determine the potential occurrences of hazardous events within the
system’s operation,
4. Justify the efforts required to mitigate such events,
5. Determine if additional efforts are required to meet product functional and
safety requirements, and
6. Legally protect the developer from potential suit should a hazardous event
arise by demonstrating sufficient precaution and investigation of system
operation.
Should an unexpected hazard occur, a properly executed safety assessment with
the appropriate documentation would protect the investment by demonstrating that
sufficient effort was expended to find all reasonable hazards.
B. SOFTWARE MALPRACTICE
Malpractice infers that an individual has provided a service below that which
would have been reasonably expected by a respective member of the professional
community, resulting in injury or loss.298 Article 2B of the Uniform Commercial Code
defines the requirements for malpractice within the software field.299, 300 The expectation
298 Malpractice, Merriam-Webster's Dictionary of Law, Merriam-Webster, Incorporated; 1996. 299 Uniform Commercial Code Article 2B Revision Home Page; http://www.law.uh.edu/ucc2b. 300 Kaner, C; Quality Cost Analysis: Benefits and Risks, Software QA, vol. 3, num. 1, pg. 23; 1996.

264
of quality of a production of software is no different than the threshold that may be held
for a medical device, legal service, or building construction. Instead of a hard medium of
production, the software industry generates a soft product that can still have catastrophic
results if improperly developed, employed, or terminated. Should a developer promise
working code and deliver garbage, the developer may be liable for breach of contract.
Should the developer convey that he is capable of delivering a specific type of application
but have no real experience, then the developer could be liable for misrepresentation.
In a malpractice case, the level of care provided would be compared against that
expected from a comparable professional software developer. Software developers may
be judged against a standard agreed upon within the contract, requirements, or by the
assumption given to the type of work under development. If the product does not meet
the requirements and it would be reasonably expected for a professional to follow
standards required to guarantee such results, then a measure of liability would be in force.
Software development does not have a general standard that covers the measurement and
assessment of high–assurance systems. Numerous safety standards exist which are
proprietary to specific companies, development groups, and governmental organizations.
Malpractice requires some level basis of standard to assess liability.
There currently exists no standardized format for reviewing, evaluating, and
rating a software system for its potential harm to society. Through this study, I introduce
a possible format for certifying a software product to some accepted threshold of safety,
based on an established criteria.301
C. NEGLIGENT CERTIFICATION
It is intended that the Software Safety Assessment process introduced in this
dissertation be used as a basis for the accreditation and certification of future high–
assurance systems. Should this or any safety assessment process be deemed as a viable
method to meet the demands of safety engineering, the chosen method may be legally
301 See Chapter V.E.3 – Assessing the System Process.

265
challenged and found potentially liable should an evaluated system fail. The general
public might expect that an assessment process would identify all potential failure
method and hazards, as well as provide alternatives for their mitigation and control. In
reality, the assessment process can only identify faults that fall within the scope of the
assessment and in particular, within the ability for the assessor to identify.
The assessment process in this dissertation does not imply endorsement to any
product, nor does it state absolutely that the product will not experience a hazardous
event. What the assessment process does is provide a method for developers and
managers to view a product with an eye towards potential failures, introducing methods
for their mitigation and control. The assessment process is designed to be straightforward
and as stepwise as possible, easily integrating into existing development practices. The
burden still remains with the developer to ensure that proper practices are in place to
ensure a viable assessment product and that assessment recommendations are acted upon.
An extensive search of legal papers and industry press releases have revealed no
history of filings against software developers for the violation or manipulation of
software certifications. Despite the fact, there remains the potential for future systems to
be challenged for misrepresenting their results against any such certification, or outright
pose a legal challenge against the certification method itself for failing to prevent any
hazardous event.
D. SAFETY ECONOMICS
As noted in Chapter I of this dissertation, over $250 Billion is spent on software
development annually. A sizeable percentage of that investment is lost due to failures in
software design, process engineering, and cancelled projects. There is no accurate value
for the amount of money lost due to software related failure but, again, experts put the
value into the billions of dollars annually. Many of the failures result in the mere “nickel
and dime” incidents, but the breadth of these failures results in a compounded sum that
should force others to take notice. News accounts publicize only the most spectacular
incidents that result in significant losses and dramatic effects. Tragically, the failure of

266
some systems results in the harm to, or loss of life of, another human being. It is the
combination of these three (Compounded sum of failures; Poor industry publicity of
software failures; The potential injury to or loss of human life) that must justify the
efforts of a Software Safety Assessment.
Customers are a highly impressionable public.
Customers are quickly affected by bad publicity and implied confidence. They
can be swayed by colorful advertisement, statistics, and personalized attention.
Customers will shy away from events or products that could place them in a bad light, be
labeled “politically incorrect,” or place them in a perceived jeopardy of offending their
own customer base. Should a software product or developer demonstrate a history or
pattern of failures over a given period of time or be related to a single high–profile failure
event, customers may withdraw their interest until such time as a stable product becomes
available. In the meantime, customers would turn to alternative in–house solutions, to a
third party provider, or discontinue the requirement for such product altogether. In some
cases, customers may turn to a competitor’s product with sufficient investment as to not
economically justify reverting back when a stable product is finally offered. Software
systems are optimally updated about every twelve to eighteen months, making the
window for change or reinvestment ripe for transition to alternative products. The failure
of any one system today could result in the loss of business tomorrow.
From a legal standpoint, should the cost of potential litigation, compensatory
damage, and punitive damage for a specific hazardous occurrence exceed the cost for
which it would take to fix the known failure, then it would be justified to resolve the
problem. The failure to sufficiently test the product could place the developer in
jeopardy of a negligence lawsuit for not reasonably testing the system. The failure to
repair an identified failure could place the developer in jeopardy of a negligence lawsuit
for not reasonably making the system safe. Should it not be cost effective (the potential
burden of a hazardous event is less that the cost of preventing the event) then the
developer may justify not mitigating a specific hazardous event. It should be emphasized,

267
that intentionally leaving a known hazard in the system could make the developer liable
under malicious circumstances, possibly compounding legal judgments.
From a moral standpoint, software developers have an ethical requirement to
provide the most reliable software product to the consumer with the least potential for a
hazardous event. Various software development standard bodies, such as IEEE, and the
British and Australian Computer Societies have agreed on independent sets of bylaws
outlying the moral and ethical requirements for software development, namely that:
• Members will approve software only if they have a well–founded belief
that it is safe, meets specifications, passes appropriate tests, and does not
diminish quality of life, diminish privacy, or harm the environment. The
ultimate effect of the work should be to the public good,302
• Members shall in their professional practice safeguard public health and
safety and have regard to protection of the environment,303 and
• Members must protect and promote the health and safety of those affected
by the product provided. 304
The adherence to and acceptance of these basic principles of ethics places a
potential economic burden upon the software provider. While this burden of training and
adherence may be significant, the potential rewards of producing a product that provides
for the “safety and welfare of the public” 305 could be the increased revenue from
additional contracts and devoted customer base.
302 Software Engineering Code of Ethics and Professional Practice, IEEE-CS/ACM Joint Task Force on
Software Engineering Ethics and Professional Practices, SEEPP Executive Committee; 1998. 303 British Computer Society Code of Conduct, The British Computer Society, London, England; 22 April
1992. 304 Australian Computer Society Code of Ethics, Australian Computer Society; 1999. 305 Software Engineering Code of Ethics and Professional Practice, IEEE-CS/ACM Joint Task Force on
Software Engineering Ethics and Professional Practices, SEEPP Executive Committee; 1998.
268
E. CONCLUSION
There can be little doubt that the hazardous failure of a software system would
result in an expensive penalty to the developer, the client, and potentially the general
public. The legal ramifications of a software failure could range from the civil penalty to
incarceration. It is imperative that software systems be designed with the consequential
understanding that failure could result in the downfall of the developers who were tasked
with the construction of the system. To this end, the inclusion of a Software Safety
Assessment demonstrates an additional level of competence and security, limiting the
potential for legal action in cases of negligence or malpractice in software development.
It is possible to estimate the cost of development through any of a myriad of
development assessment tools, while the incorporation of a Software Safety Assessment
would add an additional layer of change assessment, should change be warranted, or to
hazard cost, should a hazardous event be identified. The economic ramifications of such
an event could be determined throughout the development process, leading to the ability
to redirect assets and efforts to ensure beneficial product. The benefits of a Software
Safety Assessment can be measured in terms of the hazards for which it identifies or
prevents, or for the financial assets that it saves through the prevention of such events.

269
VIII. SUMMARY AND CONCLUSIONS
Software Safety is not based on a new development method, but rather the
refinement and application of existing methods of development.
As industry and governments increasingly place the management of critical
operations under the control of software–based systems, the potential and severity for a
hazardous event increases. Software based systems exercise a predominant automated
control over the United States military command and control network and defense
systems, as well the control and functionality of today’s sophisticated weaponry.
Software is used to control and manage civil utilities, public communications, industry
trading, and the commercial food supply. Medicine, transportation, and the public food
supply are all manipulated to some degree by software automation. The extensive
reliance upon such systems consequently results in an increased probability for
significant economic loss or physical injury to those in contact with the system should
they fail.
While it is difficult to render a software system completely devoid of any
potential failure, it is possible to identify, classify, and potentially mitigate failures and
hazardous events within a software system. From that effort, it is possible to establish a
safety index to gauge the safety of a system against unwanted events. Through this study,
I introduce a formal Software Safety Assessment method for deriving a quantitative and
qualitative safety value for system operation. This approach utilizes a series of accepted
development methods for determining equitable values of system’s operations and
management, combined to generate a unique perspective of high–assurance software
operation.
There currently exists no publicly accepted method for determining a safety index
of software systems. While a variety of private methods may exist, the proprietary and
specific nature of these methods makes them unacceptable for use as a general safety
assessment method. The method introduced in this dissertation builds upon the

270
philosophical foundation of legacy methods to establish a generalized method that can be
tailored to meet the specific need of each development scenario.
There is no “Silver Bullet” 306 to prevent the occurrence of all failures and
hazardous events within a software system, but the identification of the potential
occurrence increases system safety through awareness and recognition. The primary
benefit of this dissertation is the introduction of a method of system safety awareness
through operational analysis. Many systems sputter and hesitate under the burden of
excessive development review – essentially “Paralysis by Analysis.” Through the
presentation of this study, I provide a method for reviewing and assessing the operation
of the system with minimal encumbrance, essentially taking place in series with the
existing development process.
QUESTION: Is it possible to develop a common assessment criterion that
can determine if software is safe?
ANSWER: YES. Through the stepwise process introduced in this dissertation,307
it is possible to make an assessment of the developed product to determine the level of
safety of a software system.308 The stepwise process is broken down into incremental
stages that guide the evaluation through the establishment of safety thresholds, the
identification of malfunctions and hazards, and ultimately the assessment of the system.
From that assessment, it is possible to assign a safety measure to the software
development.
306 Brooks, Frederick P., Jr.; No Silver Bullet, Essence and Accidents of Software Engineering, Computer
Magazine; April 1987. 307 See Chapter 0 – 11. PROCESS PROCEDURES. 308 See Chapter V – DEVELOPING THE MODEL.

271
A. CONTRIBUTIONS
The primary contribution of this dissertation to the state of the art of Software
Engineering is the formalization of a method and metric to incorporate Software Safety
into the development process.309 A significant contribution of this dissertation is the
formal study and research in the under–represented field of Software Safety. This formal
model directly impacts and improves the state of the art by refining current methods of
development to better identify unsafe practices and methodologies through the software
lifecycle that could lead to failure. The success of this software development
methodology is the increased awareness of safety in high–assurance software systems,
the reduction of risk through the software lifecycle, with corresponding increases in
efficiency, decreases in overall software system costs, and a decrease in occurrence of
hazards in a software system. The introduced method builds upon the established
practices of the MOD 00–56 UK Safety Standard and MIL–STD–882D, combined with
the principles of risk / safety assessments, the principles of statistics and mathematics,
and the design flow aspects of the Boehm Spiral Method. Specific contributions within
this dissertation include safety definitions, the Software Safety metric, and additional
process improvements.
1. Six Factors of Safety Failure This study and dissertation is based on correcting the six inhibiting factors to
Software Safety success, introduced in Chapter II.C, namely:
• A failure to realize that there is a problem with the current state of
Software Safety,
• A failure to recognize potentially unsafe circumstances in software
systems,
• A failure to identify the flaws of the Software Development Process,
• An inability to quantify flaws, faults, and failures into a measurable value,
309 See Chapter V – DEVELOPING THE MODEL and Chapter VI - APPLICATION OF THE FORMAL
METHOD FOR EVALUATION OF SOFTWARE SYSTEMS.
272
• An inability to qualify the solutions to potential flaws for evaluation and
efficient rectification, and
• A failure to comprehend the solution to Software Failure.
These six factors are derived from a review of prominent and available literature
regarding the failures of past products and systems, as well as a commonsensical
approach to failure in general.
2. Definitions The current state of the art of software development is littered with proprietary
terminology that limits the establishment of an engineering standard. To provide a
benchmark for safety standards terminology which I have introduced:
• An improved series of definitions to delineate failure types,
• New definitions for degrees of software failure semantics, and
• New definitions to delineate the severity of failure.
These series of definitions describe the aspects of Software Engineering with an
emphasized view towards Software Safety and process improvement. A consolidated list
of applicable safety definitions are included in APPENDIX A of this dissertation,
including second and third party definitions related to this dissertation. Where possible
and appropriate, a comparison and contrast of existing definitions is included throughout
this dissertation to demonstrate the improvement process within this document over
existing state of the art definitions.310 This series is in no way complete and affords itself
to continued improvement and refinement in future research.
310 See Chapter II.G.1 – Comparisons of Safety Definitions.

273
3. Metric Key contributions of this dissertation to the state of the art of Software
Engineering are the introduction of a common metric for evaluating software and the
development process to qualitatively and quantitatively determine a safety index of a
particular software system. The ability of the developer to create a baseline scale to
judge the software system against permits a degree of flexibility and adaptability beyond
that found in legacy assessments. The resulting assessment value can then be evaluated
against potential hazards and faults to determine the cost–benefit ratio of efforts to
remedy or prevent the hazard. The introduced metric is defined and demonstrated
throughout Chapter V of this dissertation. A synopsis of the process procedures is
reviewed in 0 at the conclusion of this dissertation.
The introduction in this dissertation of the Safety Assessment Index (SAI)311
gives Software Engineers a snap shot result of a software system’s safety based on a
tailored assessment process. The ability to evaluate and relate system hazard probability
and hazard severity to system operation increases the capacity of software developers to
make decisions beneficial to system safety. No such index was discovered during the
investigation phase of this dissertation, and the inclusion of one such would markedly
increase development comprehension and efficiency.
4. Process Improvement The incorporation of the preceding Software Safety Assessment method results in
an improved efficiency to the software development process. This process improvement
includes a review of Software Safety economics and the cost / benefits of safety
development over existing methods. The introduction of a Safety Element to
Requirement Level Assignment provides a common foundation for software developers
to build a requirement specification upon. From this foundation, developers can produce
a system with safety as the intent, prepared for the incorporation of a cyclical safety
assessment. Proper safety assessments can reduce repetitive design and developments
through the early identification of hazardous and unwanted modules. Malicious portions

274
of the system can be removed or repaired to ensure an optimal operation of the system
through the use of limited resources and time. The safety assessment, designed to be
incorporated in parallel with the development process, can provide timely updates to the
development, tracking each change, empowering the developer with better decision
making abilities. The economic impact of the assessment is dependent on the level of
process improvement, the failures prevented and hazards averted, and the legal
protections received through the use of a standardized safety assessment process.
5. Contributing Benefits No assessment process will directly make a software system safer. That is not the
intention of an assessment process. An assessment process is designed to evaluate and
present a measure of a system’s operation and design based on established criteria for
further decision–making. It is with this data that the user can then determine if or what
actions he should take to meet respective goals for system safety. It is intended that, with
the assessment process, developers can evaluate a software system, identify potential
weaknesses, measure the required assets necessary to compensate for the weakness, and
then determine the potential benefit from the compensation. If the compensation is cost–
worthy, then the determination can be made to enact the change, thereby making the
system “safer.” A determination to make a system safe must be based on a sound
assessment of the system against an accepted threshold, a review of the costs and benefits,
and the ability to make the required changes.
This dissertation, its study, and introduced methods are intended to improve the
process of Software Engineering to provide a quantitative and qualitative assessment of a
software product’s operation. When applied, this software process has the potential of
increasing the efficiency of software development by eliminating repetitive development
efforts and flaws that can be identified early in the software process. Where possible, the
software assessment can increase productivity through the use of standardized processes
that can be related to existing methods and projects.
311 See Chapter V.B. – THE INSTANTIATED ACTIVITY MODEL
275
B. CHANGES TO LEGAL PROTECTIONS
As quoted earlier in this dissertation, “Doing software risk management makes
good sense, but talking about it can expose you to legal liabilities. If a software product
fails, the existence of a formal risk plan that acknowledges the possibility of such a
failure could complicate and even compromise the producer’s legal position.”312 The
atmosphere in which software is developed is ripe for legal challenges when events occur
that jeopardize public safety or economics. Software Engineers must feel protected
within their development to create a system that has the potential to cause a hazardous
event, but accredited to be safe through the use of an accepted assessment method. A
failure to protect software developers from legal challenges could result in the stifling of
creative knowledge. Developers need the freedom to develop with the assurance of some
level of protection, as long as they follow a standardized process, openly identify the
potential for hazardous events, and permit peer review of the final product. Should the
process and concepts brought forward in this dissertation be accepted as a standardized
process for assessing the safety of a software system, it would afford some level of
protection to developers against malpractice and negligence.
C. MANAGEMENT
Improvements to Software Safety require a definitive change to management and
business practices. The current state of development does not properly assure the
identification, assessment, and rectification of software hazards. The proprietary nature
of the art does not permit broad based acceptance of assessment results, nor does it permit
the transfer of lessons learned from Software Safety improvement methods. The success
of Software Safety requires management to create an atmosphere where safety is not an
end goal of development, but rather an integral part of the development and integration
process. Each phase of development must be tailored towards improving the system’s
performance with periodic assessments that can quickly identify hazards, propose
312 Boehm, B; De Marco, T; Software Risk Management, IEEE Software, Institute of Electrical and
Electronics Engineers, Inc.; May – June, 1997.
276
corrective measures and controls, and increase the understanding of system capabilities,
while not inhibiting the overall development process, possibly increasing the efficiency
of the development.
The methods proposed within this dissertation will directly impact the fashion in
which software is developed. Every practice must be scrutinized for completeness and
compliance with safe development practices. The concept of Software Safety Assurance
can be offensive to some, as it will criticize and critique previously accepted methods of
software development. Software development managers must be prepared to amend their
development philosophies to better integrate the principles of safety development.
D. HANDLING FRAGILITY
Software is fragile. Its logic is derived from a Boolean decision process in which
every event must be placed into a true or false statement. If a statement can be written
with sufficient detail, it becomes possible to articulate compound thought. As events
become more complex and the systems for which they control become unstable, the
possibility for failure increases. It is these measures of intricacy, instability, failure
probability, control, and mitigation that form a root of Software Safety. The
identification, control, and improvement of these values are paramount to improving the
quality of a software system. To assess these values developers and managers need a
standardized assessment process, tailored to meet the needs of specific needs of a varied
range of systems.
Software Safety is not the removal of all unsafe events within a system. It is not
the counting of code to determine safety verses length. Complexity is not an isolated
measure of safety, nor is change, nor is risk a measure of safety. Safety is the measure of
a system’s ability to prevent a hazardous event. Where a system is unable to prevent
such an event, it is the measure of the mitigation of that event.
The metric and methods in this dissertation and study are designed to improve the
state of the art of software development without imposing an overwhelming burden on
existing development efforts. Software, in its fragility necessitates an assessment process

277
capable of identifying, categorizing, measuring, and improving its operation and
establishing some factor of safety. That measure and vocabulary are the intention of this
dissertation.
E. SUGGESTIONS FOR FUTURE WORK
This dissertation serves as an introduction to a possible standardized method for
assessing the safety of a software system. The methods and procedures introduced in this
dissertation are based on the theoretical combination of existing methods and procedures,
tailored to meet the specific needs of software based systems. Examples presented in this
dissertation are theoretical applications of the method against a hypothetical system.
Future work could include the application of the assessment process against an actual
software system, judged for its ability to accurately depict the fragilities of a system, to
assist in the decision making process to correct identified events, and the potential
efficiency savings through the use of the assessment process.
Once an assessment has identified specific elements of a system that warrant
improvement, the developers must determine the methods that would most optimally
enhance the process. In this dissertation, I introduce a method for assessing the existing
development. Due to the scope of this dissertation, I have omitted specific methods for
modifying corresponding requirements, designs, and code to mitigate identified hazards.
Research and development into methods of process improvement would benefit the field
of Software Safety and Software Engineering.
One key to the success of the Software Safety Assessment is the ability to identify
potential hazards. Additional research is necessary to aid in the development of methods
for eliciting safety requirements and system safety constraints. Eliciting safety
requirements and constraints is predicated on being able to identify the potential hazards
and the related causal factors. The success of the assessment is found in the ability to
prevent a hazardous event, consequently saving valuable resources. If the assessment
relies on impractical or inefficient methods for identifying requirement and hazards, then
it could become uneconomical to investigate and identify extremely rare events.

278
Research should include methods for estimating reliability and boundaries of historical
events that might indicate the existence of unforeseen events not identified thorough
traditional methods.
In the perfect system, the Probability of Failure would be Zero (Pf = 0), to say that
the system would never fail. In a realistic system, there most likely exists some
probability that the system will fail in one form or another (0 ≤ Pf ≤ 1). Unanticipated
states frequently result in failures that the developers did not anticipate. A benefit to the
state of the art and the Software Engineering community would be the development of a
method for characterizing the distribution of expected inputs to the software and their
effect. The measure should be designed to encompass the bounds of each input and the
variations and potential states of the system.
The tradeoff between financial cost and human injury will always be controversial.
In its complexity, a software system has the potential to result in hazardous consequences
in terms of both economic and personal injury. The current process combines the two
factors into a single assessment. Future research and process improvement can foster
changes to the safety assessment to include a partially ordered two–dimensional scale for
consequences of a Hazard based on cost and injury.
It is essential that archived assessment results be compared against the actual
performance of deployed systems. Research and development should be accomplished to
foster an empirical measurement or comparison of predicted failure data to actual failures.
The comparison of predicted versus actual performance can be used to calibrate the
model and method to provide a more accurate future assessment. Based on these
performance and evaluation trends, it would also be possible to specify an expected loss
for a specific failure rate and safety index.
As the assessment process is refined and incorporated, it should be submitted for
critical review through field literature and accrediting organizations. The submission
process requires a significant degree of preparation and “suitcasing.” Future efforts can
be placed at validating the assessment process, refining it for submission, and then
279
putting forward a proposal for accreditation as a standard in national, international, and
governmental organizations.
Definitions proposed within this dissertation are intended as a guide for properly
understanding the intricate facets of software development and safety. Future efforts can
be concentrated at refining proposed definitions for submission as accepted
characterization of a Software Safety Assurance Process.
The ability to automate the software development process has greatly increased
Software Engineering efficiency and reduced the overall management burden. Future
efforts can be placed at developing an automated process that would integrate the
concepts of Software Safety, tailored measurement baselines, and assessments. Reports
and presentations could be standardized within the automated process using actual and
forecasted data.
This dissertation makes a brief approach at addressing safety design requirements
and their incorporation into the software development process. Specifically addressed
topics included Software Requirements Hazard Analysis in Chapter II.E.2.c and
Requirements Trends Toward Failure in Chapter III.C. There exists a need to conduct
greater research and formalization of safety design requirements and their incorporation
into the software development process. The incorporation of a standardized formal
language for specifying safety attributes would have an immediate impact on the state of
the art of Software Safety.
Briefly discussed in this dissertation are methods for determining the probability
of a specific action, be it the probability of execution or the probability of failure of an
event. Existing software reliability metrics do not provide a verifiable or consistent
means for quantifying the probability of failure of a specific process within a software
system. To this end, there exists a need to conduct greater research and formalization of
methods for determining the probability of software event failure. Such research should
be based on an analysis of elements as identified in Table 1 (Quantitative and Qualitative
Factors of Safety) of this dissertation.

280
THIS PAGE INTENTIONALLY LEFT BLANK
281
APPENDIX A. DEFINITION OF TERMS
Acceptable Level of Risk: (a) A judicious and carefully considered assessment by the appropriate authority that a computing activity or network meets the minimum requirements of applicable security directives. The assessment should take into account the value of assets; threats and vulnerabilities; counter measures and operational requirements. [DISA/D2, 1999], [AFSEC]
(b) As it applies to safety, threshold determination of exposure to the chance of injury or loss. It is a threshold of the function of the possible frequency of occurrence of the undesired event, of the potential severity of resulting consequences, and of the uncertainties associated with the frequency and severity. [NASA, 1996]
Action Based Failures: Failures associated with an internal fault and associated triggering actions. Action Based Failures contain logic or software–based faults that can remain dormant until initiated by a single or series of triggering actions or events. [Williamson – Page 49]
Active Software Safety System: A software system that directly controls some
hazardous function or safety–critical system operation, to ensure that the operation of that system remains within some acceptable bound. [Williamson – Page 121]
Benign Failure: A failure whose severity is slights enough to be outweighed by the
advantages to be gained by normal use of the system. [Nesi, 1999] Capability maturity model, CMM: A five–layer model against which an industry can
evaluate its organizational maturity with respect to software development. The levels are 1: Initial, 2: Repeatable, 3: Defined, 4: Managed and 5: Optimizing. [SEI-93-TR-24]
Cataclysmic Failure: A sudden failure that results in a complete inability to perform all
required functions of an item, referring both to the rate in which the system failed, and to the severity degree of the Mishap that resulted from the failure. [Williamson – Page 60]
Code and fix: A simple approach for program developing based on which of the
programmers write the code, test and fix the found errors without following a formalized development life–cycle. [Nesi, 1999]
Complete Failure: A failure that results in the system’s inability to perform any
required functions. [Williamson – Page 60], [Nesi, 1999] Complexity: A measure of how complicated an element (typically of code or design) is.
It represents how complex it is to understand (although this also involves cognitive features of the person doing the understanding) and/or how complex is to execute the
282
code (for instance, the computational complexity). The complexity evaluation can be performed by considering the computational complexity of the functional part of the system –– i.e., the dominant instructions in the most iterative parts of the system. The complexity may be also a measure of the amount of memory used or the time spent in execution an algorithm. [Nesi, 1999]
Compliance: The capability of the software product to adhere to standards, conventions
or regulations in laws, and similar prescriptions. It is a sub–feature of functionality. [Nesi, 1999]
Comprehensibility: Synonymous of understandability. The capability of a software
system to include a set of functionalities. [Nesi, 1999] Concept/Conceptual: The period of time in the software development cycle during
which the user needs are described and evaluated through documentation (for example, statement of needs, advance planning report, project initiation memo, feasibility studies, system definition, documentation, regulations, procedures, or policies relevant to the project). [IEEE 1991]
Consequence Severity: The magnitude of severity related to the consequence of a
hazardous event. Consequence Severity can be defined as a graduated list of terms and expressions, as an ordinal list of increasing magnitude, or as pure values representing the monetary cost of the hazard. [Williamson – Page 150]
Constructive Cost Model, COCOMO: A method for evaluating the cost of a software
package proposed by Dr. Barry Boehm. There are a number of different types: The Basic COCOMO Model estimates the effort required to develop software in three modes of development (Organic Mode, Semidetached Mode, or Embedded Mode). The Intermediate COCOMO Model an extension of the Basic COCOMO model. The Intermediate model uses an Effort Adjustment Factor (EAF) and slightly different coefficients for the effort equation than the Basic model. The Intermediate model also allows the system to be divided and estimated in components. The Detailed COCOMO Model differs from the Intermediate COCOMO model in that it uses effort multipliers for each phase of the project. [Nesi, 1999]
Continuous Improvement: The process of tuning the software development process in
order to achieve better results in the future versions. The improvement is based on the assessment of the systems development and in performing corresponding actions for correcting problems and improving the general process behavior. [Nesi, 1999]
Control: System objects capable of preventing or mitigating the effects of a system
malfunction should a failure occur. Controls may consist of any of a number of filters, redundant operators, or other hardware or software objects depending on the architecture of the system and control that is to be employed. A control may be able

283
to filter unacceptable values and triggers before contacting a fault, preventing the occurrence of a failure. [Williamson – Page 211]
Cost Estimation: In the early stages of a software project, some estimate of the total
cost, overall effort required and, hence, personnel requirement (and other resources) is needed. Cost estimation describes a suite of techniques that take early artifacts of the software development process and, from these, calculate a first estimate of overall cost. COCOMO and Function Points are two cost estimation models used in a traditional development. [Nesi, 1999]
Cost Of Failure: A measure of the severity of the consequences of failure. Depending
on the type of system, different scales may be used e.g., duration of down time, consequential cash loss, number of lives lost, etc. Cost of failure to user must be distinguished from cost of maintenance to vendor. [Nesi, 1999]
Cost/benefit analysis: The analysis of benefits and costs related to the implementation
of a product. [Nesi, 1999] Critical Design Review (CDR): A review conducted to verify that the detailed design of
one or more configuration items satisfy specified requirements; to establish the compatibility among configuration items and other items of equipment, facilities, software, and personnel; to assess risk areas for each configuration item; and, as applicable, to assess the results of the producibility analyses, review preliminary hardware product specifications, evaluate preliminary test planning, and evaluate the adequacy of preliminary operation and support documents. (IEEE Standard 610.12–1990) For Computer Software Configuration Items (CSCIs), this review will focus on the determination of the acceptability of the detailed design, performance, and test characteristics of the design solution, and on the adequacy of the operation and support documents. [IEEE 1991]
Critical Path: The set of activities that must be completed in sequence and on time to
have the entire project being completed on time. Related to PERT charts. [Nesi, 1999]
Critical Software: A software for which the safety is strongly relevant and its failure
could produce damages for the users. See real time system, critical task, and critical system. [Nesi, 1999]
Critical System: A system that possesses a critical (or safety–critical) mode of failure
that could have impact on safety or on economic aspects. For example, critical on–board avionics systems are defined as those that, if they fail, will prevent the continued safe flight and landing of the aircraft (e.g., those responsible for pitch control). [Nesi, 1999]

284
Criticality: Classification of the consequences, or likely consequences, of a failure mode, or classification of the importance of a component for the required service of an item. See severity. [Nesi, 1999]
Deadlock: A situation in which computer processing is suspended because two or more
devices or processes are each awaiting resources assigned to the other. (IEEE Standard 610.12–1990)
Decomposition: The process of creating a program in terms of its components by
starting from a high–level description and defining components and their relationships. The process start from the highest level to reach the definition of the smallest system components and their relationships, passing through several intermediate structural abstractions. [Nesi, 1999]
Defect: Non–fulfillment of an intended usage requirement, or reasonable expectation,
including one concerned with safety. A non–conformance between the input products and the output products of a system development phase. The main purpose of verification activities (e.g., inspection) is to detect defects so that they can be corrected before subsequent development phases. If not detected and corrected during development, defects may give rise to one or more faults in the delivered system, and hence to failure in operation. Some defects (e.g., inappropriate comments in source code) cannot give rise to faults, but may adversely affect maintainability or other quality characteristics. [Nesi, 1999]
Effort to Develop: A measure of the effort required to build the software system,
measured in man–hours, man–months, or processor–hours. Effort is a factor of the time to develop verses the number of persons/assets required for the development period, compounded by the complexity of the system and aptitude of the resources. Safety is directly affected by the complexity of the system and aptitude of the resources, and indirectly affected by the time required to develop. [Williamson – Page 138]
External Failure: An undesirable event in the environment that adversely affects the
operation of an item. [Nesi, 1999] Failsafe: An item is said failsafe when, following detection of a hazardous state, a
mishap can be avoided despite a possible loss of service. The possibility of designing an item to "failsafe" obviously depends on its having a safe mode of failure. [Nesi, 1999]
Fail Soft: The condition of a system that continue to provide main functionalities even
in the presence of some failure. [Nesi, 1999] Failure: (a) The inability of a computer system to perform its functional requirements,
or the departure of software from its intended behavior as specified in the

285
requirements. A failure is an event in time. A failure may be due to a physical failure of a hardware component, to activation of a latent design fault, or to an external failure. Following a failure, an item may recover and resume its required service after a break, partially recover and continue to provide some of its required functions (fail degraded) or it may remain down (complete failure) until repaired. [Nesi, 1999]
(b) The inability of a system or component to perform its required functions within specified performance requirements. (IEEE Standard 610.12–1990)
Failure Tolerance: The ability of a system or subsystem to perform its function(s) or
maintain control of a hazard in the presence of failures within its hardware, firmware, or software. [IEEE 1991]
Firmware: Computer programs and data loaded in a class of memory that cannot be
dynamically modified by the computer during processing. [IEEE 1991] Fault: A system object that contains an error in logic, that when triggered, could induce
a failure in system operation. A fault can potentially reside in the system indefinitely without ever inducing a failure, lacking the existence of an appropriate trigger. [Williamson – Page 44]
Fault Detection: A process that discovers or is designed to discover faults; the process
of determining that a fault has occurred. [IEEE 1991] Fault Isolation: The process of determining the location or source of a fault. [IEEE
1991] Fault Masking: A condition in which the occurrence of a fault is masked. [Nesi, 1999] Fault Recovery: A process of elimination of a fault without permanent reconfiguration.
[IEEE 1991] Fault Tolerance: The capability of the software product to maintain a specified level of
performance in cases of software faults or of infringement of its specified interface. The specified level of performance may include failsafe capability. This is often provided by the use of diverse redundant software modules. [Nesi, 1999]
Flaw: A specific item that detracts from the operation or effectiveness of the software
system without resulting in a failure or loss of operability. [Williamson – Page 42] Formal Method: A software specification and production method, based on a precise
mathematical syntax and semantics, that comprises: a collection of mathematical notations addressing the specification, design and development phases of software production; a well–founded logical inference system in which formal verification proofs and proofs of other properties can be formulated; and a methodological

286
framework within which software may be developed from the specification in a formally verifiable manner. Formal methods can be operational denotational or dual (hybrid). [Nesi, 1999]
Handling Type Fault: A fault characterized by an inability of the system’s logic to
handle erroneous entries or parameters out of the normal bounds of the system. [Williamson – Page 46]
Hazard Analysis: the evaluation and documentation of hazards and formulation of a
control mechanism that can affect a facility, system, subsystem, or component. [NHAG]
Hazard Probability: The likelihood, expressed in qualitative or quantitative terms, that
a hazardous event will occur as: • Frequent – likely to occur frequently • Probable – will occur several times in the life of an item • Occasional – likely to occur at sometime in the life of an item • Remote – unlikely but possible to occur in the life of an item • Improbable – so unlikely that it can be assumed occurrence may not be
experienced. [NHAG]
Hazard Severity Categories: A qualitative measurement of the worst potential
consequence resulting from personnel error, environmental conditions, design inadequacies, procedural deficiencies, and system, subsystem, and component failure or malfunction. These categories are as follows: • Catastrophic – a hazardous occurrence in which the worst–case effects will cause
death, disabling personnel injury, or facility or system loss • Critical – a hazardous occurrence in which the worst–case effects will cause
severe (non-disabling) personnel injury, severe occupational illness, or major property or system damage
• Marginal – a hazardous occurrence in which the worst–case effects could cause minor injury, minor occupational illness, or minor system damage
• Negligible – a hazardous occurrence in which the worst–case effects could cause less than minor injury, occupational illness, or system damage.
[NHAG] Independent Verification and Validation (IV&V): A process whereby the products of
the software development lifecycle phases are independently reviewed, verified, and validated by an organization that represents the acquirer of the software and is completely independent of the provider. [NASA, 1997]
Inhibit: A design feature that provides a physical interruption between an energy source
and a function (e.g., a relay or transistor between a battery and a pyrotechnic initiator, a latch valve between a propellant tank and a thruster, etc.). [IEEE 1991]

287
Interlock: Hardware or software function that prevents succeeding operations when
specific conditions exist. [IEEE 1991] Intermittent Failure: The failure of an item that persists for a limited duration of time
following which the system recovers its ability to perform a required function without being subjected to any action of corrective maintenance, possibly recurrent. [Williamson – Page 60], [Nesi, 1999]
Invalid Failure: “A failure that is, but isn’t”
(a) An apparent operation of the primary system that appears as a failure or defect to the user but is actually an intentional design or limitation.
(b) A developmental shortcoming resulting from the developer not designing the system to the expectations of the user.
(c) The operation of the system in an environment for which the system was not designed or certified to function. [Williamson – Page 60]
Latent Failure: A failure that has occurred and is present in a part of a system but has
not yet contributed to a system failure. [Williamson – Page 60] Lifecycle: The period that starts when a software product is conceived and ends when
the software is no longer available for use. The software lifecycle traditionally has eight phases: Concept and Initiation; Requirements; Architectural Design; Detailed Design; Implementation; Integration and Test; Acceptance and Delivery; and Sustaining Engineering and Operations. [IEEE 1991]
Life–Cycle Management (LCM): Life–cycle management means the management of
an item or system from inception/Pre–Milestone 0 through program termination. The term is also used in relation to Supply Management as management of an item from the time it first comes into the government inventory until it is disposed of at the end of its service life. The Services/Agencies have organizations to perform this level of management, but it can also be done under contract. LCM includes the procurement of initial and sustainment spare and repair parts; item management of those parts; oversight of the maintenance process (government or contractor); configuration control; planning for product improvements; the collection of failure and demand data, analysis and appropriate support process modification; and proper disposal action at the end of the lifecycle. [DISA/D4]
Lines–of–code metrics, LOC: A software metric that counts the lines of code of a
source, in order to evaluate its size. [Nesi, 1999]

288
Local Failure: A failure that is present in one part of the system but has not yet contributed to a complete system failure. [Williamson – Page 60]
Locking Up: The state in which a software system fails to respond or execute any action
for all commands, analogous to a Type 4 Failure. [Williamson – Page 40] Loss: An expression of the unrecoverable expenses related to correcting system failures,
software defects, management oversights, and other compensatory costs. [Williamson – Page 23]
Millennium problem: Y2K Bug; The problem due to the definition of the date in
software system by means of a couple of characters for storing the last two digit of the years. This causes problems when dates varying also for the hundreds of years are manipulated. It has been called millennium problem since it has been mainly highlighted around the year 2000. [Nesi, 1999]
Minor Flaw: A flaw does not cause a failure, does not impair usability, and the desired
requirements are easily obtained by working around the defect. [Williamson – Page 60], [Nesi, 1999]
Mishap: An accident; The occurrence of an unplanned event or series of events and
actions that results in death, injury, occupational illness, or damage to or loss of equipment, property, damage to the environment, or otherwise reducing the worth of the system; an accident. [IEEE 1991], [NASA, 1997], [NHAG]
Mongolian Horde Technique: Analogous to the Mongolian Horde technique of warfare
in which the armies of Genghis Khan would amass an overwhelming force of untrained warriors against a smaller enemy and conquer them through disproportional numbers. In the field of Software Engineering, the technique implies the use of an overwhelming number of intermediate level programmers and developers to generate an event that would be better managed using fewer and better skilled developers. [Williamson – Page 35]
Negative Testing: Software Safety Testing to ensure that the software will not go to a
hazardous state or generate outputs that will create a hazard in the system in response to out of bound or illegal inputs. [IEEE 1991]
No–Go Testing: Software Safety Testing to ensure that the software performs known
processing and will go to a known safe state in response to specific hazardous situations. [IEEE 1991]
Partial Failure: The failure of one or more modules of the system, or the system’s
inability to accomplish one or more system requirements while the rest of the system remains operable. [Williamson – Page 60]

289
Performance Requirements: Requirements imposing specific constraints on the final performance of the system. This is typical of real–time and critical systems. [Nesi, 1999]
Performance Specification: A document that specifies the performance that the final
system has to provide. This is typical of real–time and critical systems. [Nesi, 1999] Physical Failure: A failure that is solely due to physical causes, e.g., heat, chemical
corrosion, mechanical stress, etc. [Nesi, 1999] Preliminary Design Review (PDR): A review conducted to evaluate the progress,
technical adequacy, and risk resolution of the selected design approach for one or more configuration items; to determine each design's compatibility with the requirements for the configuration item; to evaluate the degree of definition and assess the technical risk associated with the selected manufacturing methods and processes; to establish the existence and compatibility of the physical and functional interfaces among the configuration items and other items of equipment, facilities, software, and personnel; and as appropriate, to evaluate the preliminary operation and support documents. For CSCIs, the review will focus on: (1) the evaluation of the progress, consistency, and technical adequacy of the selected architectural design and test approach, (2) compatibility between software requirements and architectural design, and (3) the preliminary version of the operation and support documents. [IEEE 1991]
Preliminary Hazard Analysis (PHA): Analysis performed at the system level to
identify safety–critical areas, to provide an initial assessment of hazards, and to identify requisite hazard controls and follow–on actions. [IEEE 1991]
Quality: The totality of features and characteristics of a product or service that bear on
its ability to satisfy stated or implied needs. Not to be exchanged with the "degree of excellence" or "fitness for use" that meet only partially the definition. Software quality is defined in the ISO 9126 norm series. Software quality includes: functionality, reliability, usability, efficiency, maintainability, and portability. The quality of a system is the evaluation of the extent to which the system meets the above mentioned features. The response of the system to these features is called the estimated quality profile. Quality should not be used as a single term to express a degree of excellence in a comparative sense nor should it be used in a quantitative sense for technical evaluations. To express these meanings, a qualifying adjective shall be used. For example, use can be made of the following terms: "relative quality" where entities are ranked on a relative basis in the "degree of excellence" or " comparative sense" (not to be confused with grade); "quality level" in a "quantitative sense" (as used in acceptance sampling) and "quality measure" where precise technical evaluations are carried out. [Nesi, 1999]

290
Quality Control: Operational techniques and activities that are used to fulfill requirements for quality. Quality control involves operational techniques and activities aimed at both monitoring a process and at eliminating causes of unsatisfactory performance at all stages of the quality loop in order to result in economic effectiveness. [Nesi, 1999]
Random Failure: Failures that result from a variety of degradation mechanisms in the
hardware. Unlike failures arising from systematic failures, system failure rates arising from random hardware failures can be quantified with reasonable accuracy. [Nesi, 1999]
Reactionary Type Fault: A fault characterized by an inability of the system’s logic to
react to acceptable values of inputs, as defined in the system requirements. [Williamson – Page 60]
Reactive Software Safety System: A software system that reacts to the operation of a
hazardous function or safety–critical system, to react when the operation falls outside of some predetermined and acceptable bounds. [Williamson – Page 121]
Reliability: The probability that a system will perform its required function(s) in a
specified manner over a given period of time and under specified or assumed conditions. [Hughes, 1999]
Resource Based Failures: Failures associated with the uncommanded lack of external
resources and assets. Resource Based Failures are generally externally based to the logic of the system and may or may not be software based. [Williamson – Page 60]
Risk: (a) Chance of hazard or bad consequences; exposure to chance of injury or loss.
Risk level is expressed in terms of hazard probability or severity. [CALL, 2000]
(b) As it applies to safety, exposure to the chance of injury or loss. It is a function of the possible frequency of occurrence of the undesired event, of the potential severity of resulting consequences, and of the uncertainties associated with the frequency and severity. [IEEE 1991]
Risk Management: (a) Risk management is divided into the following tasks: Risk
assessment, Risk identification, Risk analysis and prioritization, Risk control, Risk management planning, Risk resolution and monitoring. [Nesi, 1999]
(b) The process of detecting, assessing, and controlling risk arising from operational factors and making decisions that balance risk costs with mission benefits. Includes five steps: (identify the hazards; assess the hazards; develop controls and make risk decision; implement controls; and supervise and evaluate). [CALL, 2000]

291
Risk Prioritization: The assessment of the loss probability and loss magnitude for each identified risk item. Prioritization involves producing a ranked and relative ordering of the risk items identified and analyzed. [Nesi, 1999]
Robustness: The degree to which a system or component can function correctly in the
presence of invalid inputs or stressful environmental conditions. [Nesi, 1999] Safe: A magnitude of software success and reliability in which the probability of
hazardous events has been reduced to an acceptable predefined level. [Williamson – Page 30]
Safety: (a) The ability of a system to operate without unacceptable risk in accordance
with its requirements in a consistent and predictable manner for a given time in a given environment without mishap. For system safety, all causes of failures which lead to an unsafe state shall be included; hardware failures, Software Failures, failures due to electrical interference, due to human interaction and failures in the controlled object. The system safety also depends on many factors that cannot be quantified but can only be considered qualitatively. [Nesi, 1999]
(b) Freedom from the occurrence or risk of injury or loss; the quality of averting or not causing injury or loss. [RHCD, 1980].
Safety Analysis. A systematic and orderly process for the acquisition and evaluation of
specific information pertaining to the safety of a system. [IEEE 1991] Safety Architectural Design Analysis (SADA). Analysis performed on the high–level
design to verify the correct incorporation of safety requirements and to analyze the Safety Critical Computer Software Components (SCCSCs). [IEEE 1991]
Safety Assessment Index: The relationship derived from the probability of a hazardous
event or events against the severity of such events. A Safety Assessment Index can be defined as a graduated list of terms and expressions, or as an ordinal list of increasing magnitude. [Williamson]
Safety–Critical: (a) Those software operations that, if not performed, performed out–of
sequence, or performed incorrectly could result in improper control functions (or lack of control functions required for proper system operation) that could directly or indirectly cause or allow a hazardous condition to exist. [IEEE 1991]
(b) A system whose failure may cause injury or death to human beings, e.g., an aircraft or nuclear power station control system. Common tools used in the design of safety–critical systems are redundancy and formal methods. [Nesi, 1999]
Safety–Critical Computer Software Component (SCCSC): Those computer software
components (processes, modules, functions, values or computer program states)

292
whose errors (inadvertent or unauthorized occurrence, failure to occur when required, occurrence out of sequence, occurrence in combination with other functions, or erroneous value) can result in a potential hazard, or loss of predictability or control of a system. [MIL-STD-882B, 1986]
Safety–Critical Software: Software that: (1) Exercises direct command and control
over the condition or state of hardware components; and, if not performed, performed out–of–sequence, or performed incorrectly could result in improper control functions (or lack of control functions required for proper system operation), which could cause a hazard or allow a hazardous condition to exist. (2) Monitors the state of hardware components; and, if not performed, performed out–of–sequence, or performed incorrectly could provide data that results in erroneous decisions by human operators or companion systems that could cause a hazard or allow a hazardous condition to exist. (3) Exercises direct command and control over the condition or state of hardware components; and, if performed inadvertently, out–of–sequence, or if not performed, could, in conjunction with other human, hardware, or environmental failure, cause a hazard or allow a hazardous condition to exist. [MIL-STD-882B, 1986]
Safety Detailed Design Analysis (SDDA): Analysis performed on Safety–Critical
Computer Software Components to verify the correct incorporation of safety requirements and to identify additional hazardous conditions. [NASA – 1997]
Software Economics: The study of the economic effects of software development,
integration, management, and operation. In terms of Software Safety, Software Economics includes the study of the economic effects of software failure, hazardous operation, mitigation, and control integration. [Williamson – Page 265]
Software Engineering: (a) The discipline of promoting the establishment of theoretical
foundations and practical disciplines for software, similar to those found in the established branches of engineering. [NATO, 1967]
(b) The establishment and use of sound engineering principles in order to obtain economically software that is reliable and works efficiently on real machines. [NATO, 1969]
(c) The application of a systematic, disciplined, quantifiable approach to the development, operation, and maintenance of software. [IEEE, 1991]
Software Defect: A software defect is a perceived departure in a software product from
its intended properties, which if not rectified, would under certain conditions contribute to a software system failure (departure from required system behavior during operational use). [Nesi, 1999]

293
Software Development Risk: The risks to successful software development, as quantified by the ability to meet project requirements and goals within acceptable limits regardless of the potential for or incident of hazardous events during the operation of the software. [Nogueira, 2000]
Software Failure: (a) The inability of a system or component to perform its required
functions within specified performance requirements. [IEEE 610]
(b) The state in which a system has failed to execute or function per the defined requirements due to a design fault. Failure is usually the result of an inability to control the triggering of a system fault. Faults can be categorized in one or more of four types, depending on the circumstances leading to the failure and the resulting action. Failures can be further divided into one of two categories based on the source of the failure. [Williamson – Page 47]
Software Fault: (a) A design fault located in a software component. See fault. [Nesi,
1999]
(b) An imperfection or impairment in the software system that, when triggered, will result in a failure of the system to meet design requirements. A fault is stationary and does not travel through the system. [Williamson – Page 44]
Software Flaw: A specific item that detracts from the operation or effectiveness of the
software system without resulting in a failure or loss of operability. A software flaw does not result in a failure. A flaw may reduce the aesthetic value of a product, but does not reduce the system’s ability to meet development requirements. [Williamson – Page 42]
Software Hazards: The potential occurrence of an undesirable action or event that the
software based system may execute due to a malfunction or instance of failure. [Williamson – Page 52]
Software Malfunctions: A malfunction is the condition wherein the system functions
imperfectly or fails to function at all. A malfunction is not defined by the failure itself, but rather by the fact that the system now fails to operate. The term malfunction is a very general term, referring to the operability of the entire system and not to a specific component. [Williamson – Page 50]
Software Management: The act of managing software development, integration,
operation, and termination. Software Safety requires additional management emphasis in safety assessments, decision–making, economics, and development atmosphere. [Williamson – Page 251]
Software Requirements Review (SRR): A review of the requirements specified for one
or more software configuration items to evaluate their responsiveness to and

294
interpretation of system requirements and to determine whether they form a satisfactory basis for proceeding into a preliminary (architectural) design of configuration items. [IEEE Standard 610.12–1990]
Software Requirements Specification (SRS): Documentation of the essential
requirements (functions, performance, design constraints, and attributes) of the software and its external interfaces. [IEEE 1991]
Software Reliability: The ability of a software system to meet defined requirements
over a specified measure of time or through a defined set of events. Reliability can be defined as the ratio of the time of proper operation against total operation time, the ratio of proper operational events versus total operational events. [Williamson – Page 101]
Software Safety Requirements Analysis (SSRA): Analysis performed to examine
system and software requirements and the conceptual design in order to identify unsafe modes for resolution, such as out–of–sequence, wrong event, deadlocking, and failure–to–command modes. [IEEE 1991]
Software Safety: The application of the disciplines of system safety engineering
techniques throughout the software lifecycle to ensure that the software takes positive measures to enhance system safety and that errors that could reduce system safety have been eliminated or controlled to an acceptable level of risk. [IEEE 1991]
Specification Fault: A design fault of an item that results from its required function
having been incorrectly or incompletely defined. Specification faults often give rise to usability problems in operation, but can lead to other types of incident also. They can only be detected by validation, not verification. [Nesi, 1999]
System Safety: Application of engineering and management principles, criteria, and
techniques to optimize safety and reduce risks within the constraints of operational effectiveness, time, and cost throughout all phases of the system lifecycle. [IEEE 1991]
System Size: A measure of the requirements, functions (function points), processes,
scripts, frames, methods, objects, classes, or lines of code used to determine the size of the system. Specific size does not necessarily cause a system to be safe or unsafe, rather size denotes the volume of the system. [Williamson – Page 134]
System Task: The action requirements, goals, and objectives of the software system
specified in requirements documentation. [Williamson – Page 172] Test Readiness Review (TRR): A review conducted to evaluate preliminary test results
for one or more configuration items; to verify that the test procedures for each configuration item are complete, comply with test plans and descriptions, and satisfy
295
test requirements; and to verify that a project is prepared to proceed to formal test of the configuration items. [IEEE 1991]
Time to Develop: A measurement of the time to develop the software system in terms of
hours, months, or years. Time is a factor of the system’s size, complexity, method of development, and personnel actually executing the development. While time does not directly apply to System Safety, its sub–components do have an affect. Time affects minor safety when assessing personnel turnover, system oversight and understanding of early generation against optimized components, and in the context of time critical development projects where a delay could fail to prevent a hazardous event. [Williamson – Page 135]
Trap: Software feature that monitors program execution and critical signals to provide
additional checks over and above normal program logic. Traps provide protection against undetected software errors, hardware faults, and unexpected hazardous conditions. [IEEE 1991]
Trigger: An event, value, or system state that reacts with a system fault to initiate a
failure. The effects of a trigger can be controlled through the use of filters, controls, or error handlers. [Williamson – Page 39]
Type 1 Failure: One of the four subsets of the Type Failure List – A failure type that
occurs when a system executes an uncommanded action. This failure type can occur when the system is not in operation, as it would be expected that the system would not receive any commands when not in operation. This type of failure is not related to any command or provocation, and occurs outside of the system requirements. This failure may be triggered by the state of the system or by an input not related to a command. [Williamson – Page 40]
Type 2 Failure: One of the four subsets of the Type Failure List – A failure type that
occurs when a system executes an inappropriate action for a specific command during system operation. When a user or procedure generates a command to the system, it should be expected that the system would respond with a predetermined series of actions or responses. In the case of a Type 2 Failure, the system executed a false response to a system command. It should be noted that the system attempted to execute a response to the command, though be it incorrect. [Williamson – Page 40]
Type 3 Failure: One of the four subsets of the Type Failure List – A failure type that
occurs when a system fails to execute a required action for a specific command during system operation. [Williamson – Page 40]
Type 4 Failure: One of the four subsets of the Type Failure List – A failure type that
occurs when a system fails to respond or execute any action for all commands, essentially with the system “locking up.” [Williamson – Page 40]

296
Usability: The capability of the software product to be understood, learned, used and attractive to the user, when used under specified conditions. Some aspects of functionality, reliability and efficiency will also affect usability, but for the proposes of ISO/IEC 9126 they are not classified as usability. Usability should address all of the different user environments that the software may affect, which may include preparation for usage and evaluation of results. [Nesi, 1999]
User–friendly: The typical definition for user interface presenting a set of appealing
features that are perceived by users as easy systems to interact with. [Nesi, 1999] Validation: (1) An evaluation technique to support or corroborate safety requirements to
ensure necessary functions is complete and traceable. (2) The process of evaluating software at the end of the software development process to ensure compliance with software requirements. [IEEE 1991]
Verification: (1) The process of determining whether the products of a given phase of
the software development cycle fulfill the requirements established during the previous phase (see also validation). (2) Formal proof of program correctness. (3) The act of reviewing, inspecting, testing, checking, auditing, or otherwise establishing and documenting whether items, processes, services, or documents conform to specified requirements. [IEEE 1991]
WACSS: A factious weapons arming and control software system derived for
demonstration purposes within this dissertation. [Williamson – Page 171] Waiver: A variance that authorizes departure from a particular safety requirement where
alternate methods are employed to mitigate risk or where an increased level of risk has been accepted by management. [NASA, 1997]
Attributed to [AFSEC] Security Taxonomy and Glossary, Albuquerque Full-Scale Experimental
Complex, Sandia National Laboratories, Albuquerque, New Mexico; 1997. [CALL, 2000] CALL Dictionary and Thesaurus, Center for Army Lessons Learned, U.S.
Army; 23 May 2000, http://call.army.smil.mil/call/thesaur/index.htm [DISA/D2, 1999] Integrated Dictionary (AV–2), Defense Information Systems Agency,
D2 Division, Joint Chiefs of Staff J61; 29 Apr 1999, http://jcs61.js.smil.mil/gigsa/gloss000.htm
[Hughes, 1999] Hughes, George; Reasonable Design, The Journal of Information, Law and Technology (JILT); 30 June 1999.

297
[IEEE 1991] Software Engineering, IEEE Standard Glossary of Software Engineering Terminology, IEEE Standard 610.12–1990, 1991.
[MIL-STD-882B, 1986] MIL-STD-882B, Change 1, System Safety Program Requirements, Department of Defense; Washington, D.C.; 1986. [NASA, 1996] NASA–STD–1740.13 Software Safety Standard, National Aeronautics and
Space Administration; 12 February 1996. [NASA, 1997] NASA–STD–8719.13A Software Safety, NASA Technical Standard,
National Aeronautics and Space Administration; 15 September 1997. [NATO 1967] Software Engineering, Report on a conference by the NATO Science
Committee, NATO Science Committee, 1967. [NATO 1969] Naur, Peter; Randall, Brian; Editors; Software Engineering, Report on a
conference by the NATO Science Committee, NATO Science Committee, January 1969.
[Nesi, 1999] Nesi, P., Computer Science Dictionary, Software Engineering Terms, CRC
Press; 13 July 1999. [NHAG] NASA Hazard Analysis Guidelines.htm [Nogueira, 2000] Nogueira de Leon, Juan Carlos; A Formal Model for Risk Assessment
in Software Projects, Naval Postgraduate School, Monterey, California; September 2000.
[RHCD, 1980] Random House College Dictionary, Random House, Inc, New York,
New York, 1980. [SEI-93-TR-24] Paulk, Mark C.; Curtis, Bill; Chrissis, Mary Beth Chrissis, and Weber,
Charles, Capability Maturity Model for Software, Version 1.1, Technical Report CMU/SEI-93-TR-24, DTIC Number ADA263403, Software Engineering Institute; February 1993.
[Williamson] From Dissertation. A portion of the definitions introduced in this
dissertation may be widely accepted in the field of Software Engineering as slang or part of the common vernacular. The author takes no credit for the introduction of those terms but takes acknowledgment for refining the definitions as stated in this appendix.

298
THIS PAGE INTENTIONALLY LEFT BLANK

299
APPENDIX B. INCIDENTS AND MISHAPS313
1. ARIANE 5 FLIGHT 501 FAILURE
On the morning of 04 June 1996, on the maiden flight of the Ariane 5 launcher
and rocket, the launcher’s flight control system and the primary and secondary Inertial
Reference Systems failed 36.7 seconds after lift off. 314 The failure of the Inertial
Reference System (IRS) resulted in the instantaneous swiveling of the two solid rock
booster and Vulcain cryogenic engine nozzles to full deflection. As the craft passed an
altitude of 12,000 feet, the launcher veered from its flight path, broke up, and exploded.
The explosion was trigger by a system commanded self–destruct sequence responding to
the aerodynamic loading and breaking up of the solid rocket boosters from the main
vehicle.
The Ariane 5 was equipped with two IRSs operating in parallel, with identical
hardware and software. One IRS was active and the second was in "hot" stand–by, and if
the On–Board Computer (OBC) detected that the active IRS has failed it would have
immediately switches to the other second, provided that this unit was functioning
properly. The Ariane 5 was also equipped with two OBCs and other redundant flight
control systems. The supporting IRS software was nearly identical to the IRS software of
the Ariane 4 Launcher.
During the final seconds of the flight, the vehicle’s solid booster and Vulcain
main engine nozzles were commanded to full deflection by the OBC Software, based on
data transmitted from the active IRS. The IRS system had become corrupted, and was
transmitting a diagnostic bit pattern, mistaken by the OBC for flight data. The Primary
IRS system failed due to an internal IRS software exception caused by the conversion of
a larger 64–bit floating point value to a smaller 16–bit signed integer value. Simply, the
64–bit value was too large for the 16–bit value (limited at 32,768), resulting in an
313 Various syndicated news services and press wires. 314 Lions, J. L., Prof., Chairman; ARIANE 5 Flight 501 Failure, Report by the Inquiry Board, ESA; Paris,
France; 19 July 1996.

300
Operand Error Failure of the Primary IRS, and subsequent failure of the Secondary IRS
when it attempted the conversion 72 milliseconds prior. The Ada System Code was not
programmed to protect against an Operand Error within that particular portion of logic.
The specific logic module was designed to perform final alignment prior to lift off and
served no purpose once the vehicle left the launch pad. The alignment module was
designed to continue to operate for approximately 40 seconds after lift off, based on
requirements of the Ariane 4 vehicle, and was not required for the Ariane 5. The
Operand Error was a result of an extremely high Horizontal Bias related to the horizontal
velocity of the vehicle as it continued through its flight acceleration. The Horizontal Bias
was higher then expected by the alignment module because the Ariane 5 vehicle
accelerated faster then the Ariane 4. While the values were consistent with design
parameters for the Ariane 5, the IRS logic was not modified to compensate for the
difference.
A review of the recovered material, memory readouts, software code, and post
flight simulation and reconstruction showed to be consistent with a single failure scenario.
The mishap investigation board determined that the failure Ariane 501 was the result of
the complete loss of guidance and attitude information 37 seconds after start of the main
engine ignition sequence. This loss of information was due to specification and design
errors in the software of the inertial reference system resulting from an attempt to convert
a 64–bit floating point value into a 16–bit integer. Along with the loss of the Ariane
rocket, four uninsured satellites worth over $500 million were destroyed.
2. THERAC–25 RADIATION EXPOSURE INCIDENT
Between June 1985 and January 1987, the Therac–25 Computerized Radiation
Therapy Machine administered overdoses of radiation to six known patients, three of
them resulting in deaths.315
315 Leveson, Nancy, U. of Washington; Turner, Clark S., U of California, Irvine; An Investigation of the
Therac-25 Accidents, IEEE Computer, vol. 26, num. 7, pg. 18-41, Institute of Electrical and Electronics Engineers, Inc.; July 1993.

301
The Therac–25 was a medical–grade linear accelerator designed to accelerate
electrons to create high–energy beams that can destroy tumors with minimal impact on
the surrounding healthy tissue with energy similar to X–ray photons. The Therac–25 was
designed on the foundation of the Therac–20 and Therac–6, originally designed in
collaboration with the Canadian Governmental Company Atomic Energy Commission
Limited (AECL) and a French company called CGR. Subsequent to the falling out of
their joint relationship, AECL designed the Therac–25 unit as a solo venture. In
comparison to early version of the Therac unit, the Therac–25 was capable of producing
25 million electron volts (25–MeV) of X–ray energy through a more compact and
efficient double–pass accelerator technology developed by AECL. The Therac–25 was
more versatile and easier to use then its predecessors. The increased energy could be
better aimed at the target tumor, taking advantage of the phenomenon of "depth dose":
“As the energy increases, the depth in the body at which maximum dose buildup occurs
also increases, sparing the tissue above the target area.” Eleven Therac–25 units were
manufactured and distributed, five to the United States and six to Canada.
The Therac–25 was designed to control safety interlocks and system operations
through the use of software, to a greater extent then the Therac–20 and Therac–6 units.
The Therac–6 and Therac–20 were designed with mechanical interlocks to protect and
police the machine, as well as independent protective circuits for monitoring electron–
beam scanning. These functions were automated in the Therac–25. Post–mishap
investigation revealed that the Therac–6 and Therac–20 software package was used as a
baseline for the development of the Therac–25 code. Investigators and quality assurance
managers were previously unaware of the baseline code issue.
In six separate incidents, patients received excessively high doses of X–ray
energy, at times exceeding 20,000–rad (radiation absorbed dose). A typical single
therapeutic dose would be in the 200–rad range. It should be noted that doses of 1,000
rads could be fatal if delivered to the whole body, and that a 500 rads dose will cause
death in 50 percent of the population. Patients were administered doses as per the unit’s
procedures, but the system’s safety interlocks failed to prevent the excessive radiation. In

302
some cases, the machine administrated a lethal dose only to indicate that no dose had
been administered, prompting the technician to administer a second dose. In one
particular case, a patient was received five successive lethal doses because the unit fell
off line after administering each successive dose. The patient later died. Other patients
received such extreme doses of energy as to leave burn marks on the opposite side of
their torsos. The experience could be equated to cooking the body from the inside out,
only revealing surface damage when the underlying tissue was already destroyed.
Due to potential liability and legal issues, coupled with the fear of business losses,
it was difficult to immediately find out details behind the incidents. Post–mishap
investigation revealed that the unit had the potential for generating excessive doses of
radiation that would go undetected and prevented by the Software Safety Interlocks due
to race conditions in the data entry system. Many of the faults that caused the radiation
overdoses were also found in the Therac–20 software, but were never detected until after
the Therac–25 accidents because the Therac–20 included hardware mechanical safety
interlocks that prevented the excessive doses and subsequent injuries. Many of the
incidents went immediately unreported to the FDA due to a lack of understanding of the
incident, or even the realization that an incident had even happened. Additionally,
reporting regulations for medical device incidents at that time applied only to equipment
manufacturers and importers, and not users, and health–care professionals and institutions
were not required to report incidents to manufacturers. The law has since been amended.
3. TITAN–4 CENTAUR/MILSTAR FAILURE
On April 30, 1999, the United States Air Force was scheduled to launch a Titan–4
Centaur rocket from the Cape Canaveral Air Station on Florida’s East Coast.316 The
rocket’s mission was to place a MILSTAR Military Communication Satellite into a
22,300 mile Earth orbit. During the post launch flight, the rocket processed erroneous
flight data computed from the Centaur’s upper stage software system. The erroneous
316 MILSTAR Accident Board Releases Results, Air Force Press News (AFPN); Peterson Air Force Base,
Colorado; 22 July 1999.

303
flight data resulted in the Titan rocket repeatedly attempting to reorient itself, in
contradiction with opposing data to continue on its present flight path. The conflict
between flight data and erroneous computations resulted in the upper stage prematurely
depleting itself of all usable hydrazine fuel. Without sufficient fuel and a proper
navigation solution, the Titan rocket fell into a low Earth orbit, and deployed the
MILSTAR satellite in a useless position with respect to the rest of its constellation.
The MILSTAR Satellite was to be part of an array of the Joint MILSTAR
(Military Strategic Tactical and Relay) Satellite Communications System. Once
operational, the system would provide a worldwide, secure, jam resistant, strategic, and
tactical communications capability for Joint Military use.
The mishap investigation board found the primary cause of the mishap to be a
failure within the Centaur upper stage software, which failed to detect and correct a
human error made during manual entry of data values in the Centaur’s flight software file.
Loaded with the incorrect software values, the Centaur lost all attitude control, and
rendered itself incapable of flight. The mishap review specifically faulted the
development, testing and quality assurance process of the upper stage software module
for the mishap.
The Air Force Space Command attempted to salvage the MILSTAR Satellite with
no success. On May 4th, 1999, the Air Force declared the MILSTAR Satellite a complete
loss and permitted it to drift in low Earth orbit as space–junk. It has been estimated that
it would cost the U. S. Military over $1 billion to replace the failed satellite. Without it,
the existing $3.8 billion satellite network would be useless.

304
4. PATRIOT MISSILE FAILS TO ENGAGE SCUD MISSILES IN DHAHRAN
On the night of February 25, 1991, an Iraqi Scud Missile penetrated the Patriot
Missile Defense Shield surrounding Dhahran, Saudi Arabia, and struck a warehouse used
by U.S. Forces as a barracks, killing 28 and wounding 98 U.S. Army soldiers.317 U.S.
and Allied Soldiers were in Saudi Arabia as part of coalition forces in support of
Operation Desert Storm and Desert Watch to push Iraqi forces out of Kuwait. The Patriot
Missile Battery was setup to provide ballistic missile intercept protection for theater
forces, and prevent an escalation of provoked hostilities against Israel.
The Raytheon Company initially developed the Patriot Missile as a Surface to Air
Missile (SAM) intended to intercept and destroy sub and super–sonic aircraft. During the
Gulf War of 1991, the U.S. Army was in need of a high–altitude intercept weapon to
counter the ballistic missile threat of the Iraqi Scud Missile. The Patriot Missile was
reintroduced as a suitable COTS weapon to engage the threat. No modifications were
made to the weapon, despite the fact that the Scud missile was capable of flying at over
Mach 6, well above the design requirements for the Patriot Fire Control System.318
On the evening of February 25th, six Patriot batteries were located in the Al
Jubayl–Dhahran– Bahrain area. Two batteries were assigned to engage the Dhahran
bound missile. Of the two assigned batteries, one was out of commission for repair of a
radar receiver. The remaining battery was manned and operational, and capable of
engaging the incoming Scud missile. The assigned battery had been on–line
continuously for four days due to a high concentration of Scud activity in the local area.
During the four days of operation, due to software designed mathematical truncating and
rounding flaw, the fire control system’s clock had compounded a drift of .36 seconds.
The Patriot system was designed and tested for only 14 hours of continuous performance,
making the clock drift negligible against slower flying aircraft. Against a Mach 6 target,
317 Falatko, Frank; Report Issues on Scud Missile Attack, Memorandum for Correspondents, Department
of Defense News, Department of Defense; 05 June 1991.

305
a clock error of .36 seconds would equate to a missed firing control solution of 2407.68
feet, well outside the kill envelope of the Patriot Missile. All known procedures were
followed, and the weapon was employed as directed.
The post–mishap investigation concluded that the software generated clock drift
was the most likely explanation as to why the battery did not effectively detect or engage
the incoming Scud. The clock drift was not felt to be a significant problem when Patriot
was employed against slower flying aircraft and the system cycle times were kept to a
minimum. Against a highflying, fast moving, ballistic target, with long system cycle
times, the clock drift error was an unacceptable factor. Shutdown and reboots would
have reset the clock and removed any drift. That procedure was not released to the field
units. A similar error was noted on February 20th after the analysis of another failed Scud
engagement. The Raytheon Company had previously detected the error and had already
shipping a software update to field units. The software patch arrived on the morning after
the Scud impacted the barracks compound.
The Patriot was heralded as the hero of the Gulf War and was initially credited
with a 90% kill ration. The US General Accounting Office’s post war analysis
determined that the Patriot was only credited with killing less then 9% of its targets. The
Congressional Research Service revised its figures, stating that there was conclusive
proof of only one Scud warhead destroyed by the Patriot System. Israeli analysts reached
similar conclusions. The Patriot contract has since been transferred to the Lockheed–
Martin Corp.319, 320
318 Note: Mach 6 = Apx. 4,560 MPH, under standard conditions. Mach 1 = Apx. 760 MPH at sea level,
with an atmospheric pressure = 29.92 in Hg, and temperature of 70° F. 319 Farrell, John A., Globe Staff Writer; The Patriot Gulf Missile 'Didn't Work', Boston Globe, pg. 1, 13;
January 2001. 320 Rogers, David, Staff Reporter; Flaw In Patriot Missiles Leads the U.S. to Replace Hundreds, Wall
Street Journal; 23 March 2000.

306
5. USS YORKTOWN FAILURE
In an attempt to reduce manpower, workloads, maintenance and the costs of
operating future ships in the United States Navy, the Department of Defense attempted to
design and deploy a series of so–called “Smart Ships” equipped with the latest in COTS
software and hardware technology. On one particular voyage in September 1997, the
Aegis Guided Missile Cruiser U.S.S. Yorktown (CG–48) was left drifting dead in the
water due to a Software Failure as simplistic as a “division by zero” error.321
During maneuvers off the coast of Cape Charles, VA., a Yorktown crewmember
manually entered a test value into the ship’s computer system. Due to a failure to trap the
erroneous value or even to isolate and handle the potential error, the system went into an
infinite loop while it attempted to divide by zero, and subsequently brought the entire
ship to a halt. The ship’s control system was managed on a Windows NT architecture,
and the error occurred within a Microsoft NT provided application. The Navy confirms
that the ship remained adrift for about two hours and forty–five minutes before personnel
were able to restart the system and bring navigation and propulsion support back on–line.
Investigation has revealed that a previous loss of propulsion also occurred on May 2nd,
1997, directly related to the ship’s software. It should be noted that the cruisers Hue City
and Vicksburg also were sidelined by Windows designed bugs within their ship support
and control systems.322
Despite the numerous faults and errors, the Navy has considered the ship and its
program a success due to the amount of information and lessons learned from the
integration of Smart Technology with a deploying vessel. The potential consequences of
a vessel dead in the water could have been catastrophic, had there been a physical hazard
to avoid or enemy to combat. With a loss of ship’s systems, comes the potential loss of
weapons control, further jeopardizing the crew and those within the range of the
weapons.

307
6. MV–22 OSPREY CRASH AND SOFTWARE FAILURE
After an embarrassing and catastrophic flight history, plagued with accidents,
deaths, falsified maintenance records, and political pork–bellying the V–22 Osprey
program was put on infinite suspension following the December 11, 2000 accident that
killed four marines.323 The Osprey was noted for its ability to fly like a plane with its two
oversized propellers at speeds in excess of 300 knots, but could tilt its wings and
transition into a helicopter like mode for landing and hovering.
The V–22 was developed by Boeing’s to support the militaries desire to
incorporate a tilt–rotor type–wing in its future inventory. The U. S. Navy lost interest
early in the program due to mechanical problems and early system failures. The U. S.
Marines and U. S. Air Force remained dedicated the project, due to the need to replace its
existing fleet of aging transport and logistics aircraft. The recent series of accidents and
revelations about maintenance irregularities have cost the Boeing Company one of its
back–pocket supporters – the U.S. Air Force Special Operations Command, and resulting
in the scrapping of a 50 aircraft order by the USAF.
U. S. Senate Investigations discovered that the Marine V–22 Training Squadron,
VMMT–204, was falsifying maintenance records by the order of the squadron’s
commanding officer, LCOL O. Fred Leberman. The CO had ordered the doctoring of
maintenance data and operations reports to improve the aircraft’s poor reliability rate.
The information surfaced from an anonymous tip from a squadron mechanic.
On 11 December 2000, Crossbow–8 was on its final approach into Marine Corps
Air Station New River, N.C., about 7 mi. from the airfield, when the aircraft suffered a
leak in its No. 1 hydraulic system that drives flight–critical systems. At the time of the
hydraulic leak, the pilot was attempting to transition from forward flight fixed–wing
321 Slabodkin, Gregory; Software Glitches Leave Navy Smart Ship Dead In The Water, Government
Computer News; 13 July 1998. 322 Said, Carolyn; Floating Test Pad For High Tech, San Francisco Chronicle, pg. 1, 07 October 2000. 323 Wall, Robert; V-22 Support Fades Amid Accidents, Accusations, Probes, Aviation Week and Space
Technology, Washington, D.C., pg 28; 29 January 2001.

308
mode to helicopter mode. When the leak was detected by the onboard flight control
computers, a triple–redundant set of leak isolation and switching valves attempted to
isolate and contain the leak, while preserving flight control. Without hydraulic control,
the pilot was dead stick and no ability to manipulate any control surface. Due to a failure
within the software logic the leak was not isolated properly and the aircraft departed
controlled flight and impacted the ground, killing all four crewmembers.
The Crossbow–8 had logged less then 160 flight hours before its fatal mishap.
There have been three previous fatal mishaps with the V–22; one in 1991, killing four
persons, attributed to faulty wiring; a second in June 1992, killing seven persons aboard,
attributed to an oil leak and subsequent fire; and a third in April 2000, killing nineteen
crewmembers and passengers, attributed to vortex ring state.324 It should be noted that
the April 2000 mishap of Nighthawk–72 had suffered a navigational computer failure
earlier in the flight and was relying on its wingman’s computers for system navigation.
The computer failure was not “directly” attributed to the mishap. Additionally, prior to
the suspension of flight operations, the Marines had recorded no less then one dozen
uncommanded flight event in which the aircraft flew without command and control of the
pilot. Other faults have been detected in various software modules including the modules
controlling gyroscope systems. The actual cost of the V–22 aircraft is not disclosed, but
industry experts expect the price to be well in excess of the originally estimated $66
Million stated by Boeing Aircraft. There is no schedule to resume flight operations with
the remaining seven Osprey aircraft.
7. FAA – AIR TRAFFIC CONTROL FAILURE
During the fall of 2000, the Federal Aviation Administration (FAA) performed a
nationwide scheduled upgrade of its host software to its air traffic control system.325 This
system was designed to provide a visual representation of an aircraft's identity, altitude,
324 Richmond, Peter, Crash Of The Osprey, GQ, pg. 138; January 2001. 325 Lefevre, Greg; Richer, Susan; Afflerbach, Chuck; FAA Suspends Software Upgrades Following
California Computer Glitches, Cable News Network, San Francisco, California Bureau; 24 October 2000.

309
speed and direction to air traffic controllers from the FAA’s new high–speed computers.
The upgrade had been ongoing since the beginning of the year. During a period of five
days, two of the newly upgraded Air Route Traffic Control Stations, one in Freemont,
CA and a second in Los Angeles, CA completely shutdown, rendering the most of the
state of California and western Nevada essentially blind to air traffic. The shutdown
caused flight delays nationwide and overseas. The total losses in productivity, excess
manpower and expenses, and lost revenue range in the tens of millions of dollars. The
actual figure is still under debate.
Investigators attempted to isolate the failure to hardware, software, and/or human
error. After a detailed review, the FAA isolated the failure to the software upgrade
package and its inability to receive data from some incoming aircraft. Immediately, the
FAA ordered a moratorium on all Air Route Traffic Control Centers nationwide not to
install or test any more software upgrades until further notice. At that time, 18 of the 21
centers had received and installed the upgrade. Three centers had not received the
upgrade.
8. WINDOWS 98 CRASH DURING THE COMDEX 1998 CONVENTION
During a highly publicized demonstration of the newest Microsoft Operating
System (OS) at COMDEX Spring 1998, Microsoft Chairman Bill Gates was left standing
in front of blank screen after a full system crash.326 The public failure occurred while
Bill Gates was addressing some 85,000–computer professionals at the annual technology
conference. Mr. Gates was the features speaker for the annual conference.
The operating system crashed when a Microsoft technician attempted to plug an
external scanner into the demonstration computer. The demonstration moved to another
computer to complete the presentation. Mr. Gates smiled and noted that, "I guess we still
have some bugs to work out. That must be why we're not shipping Windows 98 yet."
Windows 98 was designed to replace the 150 million copies of Windows 95, and was
326 Various Cable News Network and Associated Press Wire Reports; 20 April 1998.

310
supposed to make computers easier to use and accept additional peripherals through the
use of plug and play technology. Mr. Gates noted that "while we're all very dependent on
technology, it doesn't always work.”
The product was supposed to be released on January 1st, 1998, but fell behind
deadlines due to numerous failures and bugs. The Windows 98 OS was further tested and
later distributed to the public in the summer of 1998. Windows 98 was later replaced by
Windows 2000, only after Microsoft was forced to issue numerous service packs and
system advisories to overcome publicly noted faults and failures.
9. DENVER AIRPORT BAGGAGE SYSTEM
An example of poor software design is the Denver International Airport luggage
controller. In this case, Jones says that the senior executives did not have a sufficient
background in software systems and as a result accepted "nonsensical software claims at
face value.” The airport boasted about its new "…automated baggage handling system,
with a contract price of $193 million, will be one of the largest and most sophisticated
systems of its type in the world. It was designed to provide the high–speed transfer of
baggage to and from aircraft, thereby facilitating quick turnaround times for aircraft and
improved services to passengers.” The baggage system, which came into operation in
October 1995, included "over 17 miles of track; 5.5 miles of conveyors; 4,000 telecarts;
5,000 electric motors; 2,700 photocells; 59 laser bar code reader arrays; 311 radio
frequency readers; and over 150 computers, workstations, and communication servers.
The automated luggage handling system (ALHS) was originally designed to carry up to
70 bags per minute to and from the baggage check–in."327
However there were fundamental flaws identified but not addressed in the
development and testing stage. ABC news later reported that “In tests, bags were being
misloaded, misrouted or fell out of telecarts, causing the system to jam.” The Dr. Dobbs
Journal (January 1997) also carried an article in which the author claims that his software
327 Jones, Carpers; Patterns of Software Systems Failure and Success; Thomson Computer Press; 1996
311
simulation of the automatic baggage handling system of the Denver airport mimicked the
real–life situation. He concluded that the consultants did perform a similar simulation
and, as a result, had recommended against the installation of the system. However, the
city overruled the consultant's report and gave the go–ahead (the contractors who were
building the system never saw the report).328
The report into the failure of the Denver ALHS says that the Federal Aviation
Authority had required the designers (BAE Automated Systems Incorporated) to properly
test the system before the opening date on 28th February 1995. Problems with the ALHS
had already caused the airport’s opening date to be postponed and no further delays could
be tolerated by the city. The report speculates that delays had already cost the airport
$360 million by February 1995.
The lack of testing inevitably led to problems with the ALHS. One problem
occurred when the photo eye at a particular location could not detect the pile of bags on
the belt and hence could not signal the system to stop. The baggage system loaded bags
into telecarts that were already full, resulting in some bags falling onto the tracks, again
causing the telecarts to jam. This problem caused another problem. This one occurred
because the system had lost track of which telecarts were loaded or unloaded during a
previous jam. When the system came back on–line, it failed to show that the telecars
were loaded. Also the timing between the conveyor belts and the moving telecarts were
not properly synchronized, causing bags to fall between the conveyor belt and the
telecarts. The bags then became wedged under the telecarts. This eventually caused so
many problems that there was a need for a major overhaul of the system.
The government report concluded that the ALHS at the new airport was afflicted
by "serious mechanical and software problems.” However, you cannot help thinking how
much the city was blamed for their part in a lack of demand for proper testing. Denver
International Airport had to install a $51 million alternative system to get around the
problem. However, United Airlines still continue to use the ALHS.
328 Dr. Dobbs Journal; January 1997.

312
Approved in 1989. Planned to be operational by end of 1993. 53 sq. miles. 5
runways, with possibly 12 in the future. 3 landings simultaneously in all weather
conditions. 20 major airlines. Cost $4.2B. Needed large–scale baggage handling system.
$193 million. 4000 telecars carry luggage across 21 miles of track. Laser scanners read
barcodes on luggage tags. Photocells tracked telecars movement. Controlled by 300
computers. Software bugs galore! Telecars were misrouted and crashed. Baggage was
lost and damaged. Without baggage handling, the airport could not open, costing $1.1M
per day. Airport opened in February 1995. Baggage system had extra $88M spent on it.
1 airline used it. Others used an alternative carbon–based neural network system. How
can the software be tested and validated before it is put in charge of a system of this
complexity?
10. THE LONDON AMBULANCE SERVICE
The failure of the London Ambulance Service (LAS) on Monday and Tuesday 26
and 27 November 1992, was, like all major failures, blamed on a number of factors.
These include inadequate training given to the operators, commercial pressures, no
backup procedure, no consideration was given to system overload, poor user interface,
not a proper fit between software and hardware and not enough system testing being
carried out before hand. Claims were later made in the press that up to 20–30 people
might have died as a result of ambulances arriving too late on the scene. According to
Flowers, "The major objective of the London Ambulance Service Computer Aided
Dispatch (LASCAD) project was to automate many of the human–intensive processes of
manual dispatch systems associated with ambulance services in the UK. Such a manual
system would typically consist of, among others, the following functions: Call taking.
Emergency calls are received by ambulance control. Control assistants write down
details of incidents on pre–printed forms."329
The LAS offered a contract for this system and wanted it to be up and running by
8th January 1992. All the contractors raised concerns about the short amount of time
329 Flowers, Stephen; Software Failure: Management Failure; Chichester: John Wiley and Sons; 1996.
313
available but the LAS said that this was non–negotiable. A consortium consisting of
Apricot, Systems Options and Datatrak won the contract. Questions were later asked
about why their contract was significantly cheaper than their competitors. (They asked
for £1.1 million to carry out the project while their competitors asked for somewhere in
the region of £8 million.)
The system was lightly loaded at start–up on 26 October 1992. Staff could
manually correct any problems, caused particularly by the communications systems such
as ambulance crews pressing the wrong buttons. However, as the number of calls
increased, a build up of emergencies accumulated. This had a knock–on effect in that the
system made incorrect allocations on the basis of the information it had. This led to more
than one ambulance being sent to the same incident, or the closest vehicle was not chosen
for the emergency. As a consequence, the system had fewer ambulance resources to use.
With so many problems, the LASCAD generated exception messages for those incidents
for which it had received incorrect status information. The number of exception
messages appears to have increased to such an extent the staff were not able to clear the
queues. Operators later said this was because the messages scrolled of the screen and
there was no way to scroll back through the list of calls to ensure that a vehicle had been
dispatched. This all resulted in a viscous circle with the waiting times for ambulances
increasing. The operators also became bogged down in calls from frustrated patients who
started to fill the lines. This led to the operators becoming frustrated, which in turn led to
an increased number of instances where crews failed to press the right buttons, or took a
different vehicle to an incident than that suggested by the system. Crew frustration also
seems to have contributed to a greater volume of voice radio traffic. This in turn
contributed to the rising radio communications bottleneck, which caused a general
slowing down in radio communications that, in turn, fed back into increasing crew
frustration. The system therefore appears to have been in a vicious circle of cause and
effect. One distraught ambulance driver was interviewed and recounted that the police
are saying "Nice of you to turn up" and other things. At 23:00 on October 28, the LAS
eventually instigated a backup procedure, after the death of at least 20 patients.

314
An inquiry was carried out into this disaster at the LAS and a report was released
in February 1993. Here is what the main summary of the report said: "What is clear from
the Inquiry Team's investigations is that neither the Computer Aided Dispatch (CAD)
system itself, nor its users, were ready for full implementation on 26 October 1992. The
CAD software was not complete, not properly tuned, and not fully tested. The resilience
of the hardware under a full load had not been tested. The fall back option to the second
file server had certainly not been tested. There were outstanding problems with data
transmission to and from the mobile data terminals. … Staff, both within Central
Ambulance Control (CAC) and ambulance crews, had no confidence in the system and
was not all fully trained and there was no paper backup. There had been no attempt to
foresee fully the effect of inaccurate or incomplete data available to the system (late
status reporting/vehicle locations etc.). These imperfections led to an increase in the
number of exception messages that would have to be dealt with and which in turn would
lead to more callbacks and enquiries. In particular the decision on that day to use only
the computer generated resource allocations (which were proven to be less than 100%
reliable) was a high–risk move."
In a 1994 report by Simpson, she claimed that the software for the system was
written in Visual Basic and was run in a Windows operating system. This decision itself
was a fundamental flaw in the design. "The result was an interface that was so slow in
operation that users attempted to speed up the system by opening every application they
would need at the start of their shift, and then using the Windows multi–tasking
environment to move between them as required. This highly memory–intensive method
of working would have had the effect of reducing system performance still further."330
The system was never tested properly and nor was their any feedback gathered
from the operators before hand. The report refers to the software as being incomplete and
unstable, with the back up system being totally untested. The report does say that there
was "functional and maximum load testing" throughout the project. However, it raised
330 Simpson, Moira; 999!: My Computers Stopped Breathing!; The Computer Law and Security Report,
pg. 76-81, March – April 1995.

315
doubts over the "completeness and quality of the systems testing.” It also questions the
suitability of the operating system chosen.
This along with the poor staff training was identified to be the main root of the
problem. The management staff was highly criticized in the report for their part in the
organization of staff training. The ambulance crew and the central control crew staff
were, among other things, trained in separate rooms, which did not lead to a proper
working relationship between the pair. Here is what the report said about staff training:
"Much of the training was carried out well in advance of the originally planned
implementation date and hence there was a significant "skills decay" between then and
when staff were eventually required to use the system. There were also doubts over the
quality of training provided, whether by Systems Options or by LAS's own Work Based
Trainers (WBTs). … This training was not always comprehensive and was often
inconsistent. The problems were exacerbated by the constant changes being made to the
system."331
331 Inquiry into the London Ambulance Service; February 1993.

316
THIS PAGE INTENTIONALLY LEFT BLANK

317
APPENDIX C. ABBREVIATIONS AND ACRONYMS
ABF Action Based Failure AECL Atomic Energy of Canada Limited Attr Attributed BIT Built–In Test BIT Built In Test BITE Built–In Test Equipment BSI British Standards Institute C(H) The Consequence Severity of a Hazardous Event C2 Command and Control C3 Command, Control, and Communications C4I Command, Control, Computers, Communications, and Intelligence CASE Computer Aided Software Engineering Tool CDR Critical Design Review CIA Central Intelligence Agency CMM Capability Maturity Model Management COTS Commercial Off The Shelf CPU Central Processing Unit CSA Code Safety Analysis CSCI Computer Software Configuration Item CSHA Code Level Software Hazard Analysis CT Coverage Testing DARPA Defense Advanced Research Projects Agency DID Data Item Description DISA Defense Information Systems Agency DoD Department of Defense DODD Department of Defense Directive DoT Department of Transportation E The set of all Events in the system, where the set of Events contains
Inputs, Outputs, Limits, and / or Processes. EPA Environmental Protection Agency EST Eastern Standard Time FBC Faster, Better, Cheaper FDIR Fault Detection, Isolation, and Recovery FMECA Failure Modes Effect and Criticality Analysis FTA Fault Tree Analysis GDP Gross Domestic Product GFE Government Furnished Equipment GMT Greenwich Mean Time, see also UTC GOTS Government Off The Shelf GUI Graphical User Interface (H) Hazardous Event HAZOP Hazardous Operation
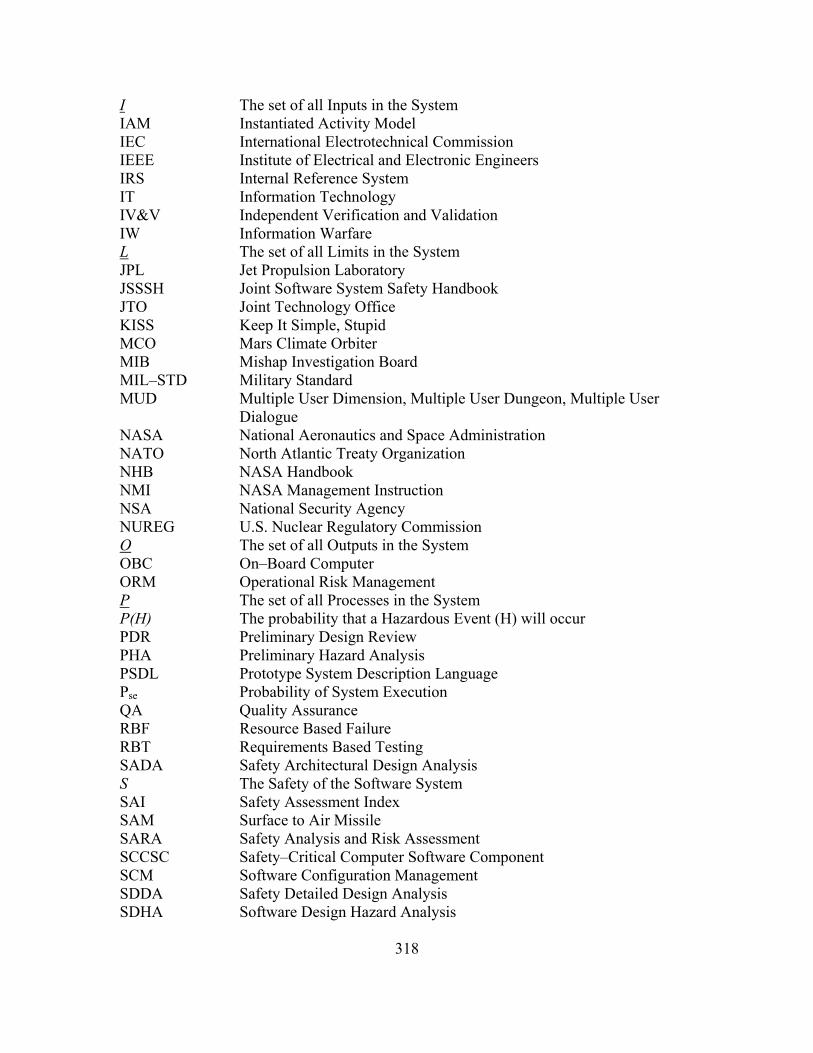
318
I The set of all Inputs in the System IAM Instantiated Activity Model IEC International Electrotechnical Commission IEEE Institute of Electrical and Electronic Engineers IRS Internal Reference System IT Information Technology IV&V Independent Verification and Validation IW Information Warfare L The set of all Limits in the System JPL Jet Propulsion Laboratory JSSSH Joint Software System Safety Handbook JTO Joint Technology Office KISS Keep It Simple, Stupid MCO Mars Climate Orbiter MIB Mishap Investigation Board MIL–STD Military Standard MUD Multiple User Dimension, Multiple User Dungeon, Multiple User
Dialogue NASA National Aeronautics and Space Administration NATO North Atlantic Treaty Organization NHB NASA Handbook NMI NASA Management Instruction NSA National Security Agency NUREG U.S. Nuclear Regulatory Commission O The set of all Outputs in the System OBC On–Board Computer ORM Operational Risk Management P The set of all Processes in the System P(H) The probability that a Hazardous Event (H) will occur PDR Preliminary Design Review PHA Preliminary Hazard Analysis PSDL Prototype System Description Language Pse Probability of System Execution QA Quality Assurance RBF Resource Based Failure RBT Requirements Based Testing SADA Safety Architectural Design Analysis S The Safety of the Software System SAI Safety Assessment Index SAM Surface to Air Missile SARA Safety Analysis and Risk Assessment SCCSC Safety–Critical Computer Software Component SCM Software Configuration Management SDDA Safety Detailed Design Analysis SDHA Software Design Hazard Analysis

319
SE Software Engineers, Software Engineering SFTA Software Fault Tree Analysis SRB Solid Rocket Booster SRHA Software Requirements Hazard Analysis SRR Software Requirements Review SRS Software Requirements Specification SSR Software Specification Review SSRA Software Safety Requirements Analysis SSSH Software System Safety Handbook STD Standard THAAS Theater High Altitude Area Defense System TRR Test Readiness Review UPS Uninterrupted Power Supply UTC Coordinated Universal Time, see also GMT WACSS Weapon Arming and Control Software System

320
THIS PAGE INTENTIONALLY LEFT BLANK

321
APPENDIX D. DISSERTATION SUPPLEMENTS
1. SOFTWARE SAFETY STANDARD TECHNIQUES REVIEW332
STANDARD TECHNIQUE(S)
AFISC – "Software System Safety"333
• Nuclear Safety Cross–Check Analysis • Petri Nets • Software Fault Tree (soft Tree) – Uses of Fault
Trees: Cutset, Quantitative, Common Cause Analysis
• Software Sneak Circuit Analysis (Desk Checking, Code Walk–Through, Structural Analysis, Proof of Correctness)
• Preliminary Software Hazard Analysis • Follow–on Software Hazard Analysis
FDA – (DRAFT) Reviewer Guidance for Computer–Controlled Devices334
• Code Walk–Through • Failure Mode, Effects, and Criticality Analysis • Fault Tree Analysis
FDA – "Reviewer Guidance for Computer–Controlled Medical Devices Undergoing 510(k) Review"335 • Failure Mode, Effects and Criticality Analysis
IECWG9 – "Software for Computers in the Application of Industrial Safety–Related Systems"336
• Cause Consequence Diagrams • Event Tree Analysis • Failure Mode, Effects, and Criticality Analysis • Fault Tree Analysis • Hazard and Operability Study • Monte–Carlo Simulation
332 NISTIR 5589, A Study on Hazard Analysis in High Integrity Software Standards and Guidelines, U.S.
Department of Commerce Technology Administration, National Institute of Standards and Technology, Computer Systems Laboratory, Gaithersburg, Maryland; January 1995.
333 AFISC SSH 1-1, Software System Safety, Headquarters Air Force Inspection and Safety Center; 05 September 1985.
334 (DRAFT) Reviewer Guidance for Computer-Controlled Devices, Medical Device Industry Computer Software Committee; January 1989.
335 Reviewer Guidance for Computer-Controlled Medical Devices Undergoing 510(k) Review, Office of Device Evaluation, Center for Devices and Radiological Health, Food and Drug Administration.
336 IEC/TC65A WG9, IEC 65A(Secretariat)122, Software for Computers in the Application of Industrial Safety-Related Systems, ver. 1.0, British Standards Institution; 26 September 1991.

322
IEEEP1228–C337, IEEEP1228–D338, IEEEP1228–E339
– "Draft Standard for Software safety Plans"340
• Event Tree Analysis • Failure Modes and Effects Analysis • Fault Tree Analysis • Petri Nets • Sneak Circuit Analysis • Software Safety Requirements Analysis • Software Safety Design Analysis • Software Safety Code Analysis • Software Safety Test Analysis • Software Safety Change Analysis
“Joint Software System Safety Handbook”341
• Joint Vision of Software Safety based Best Practices of DOD, USCG, FAA, NASA, Contractors, and Academia
• How–To Handbook for Implementation of Software System Safety.
• Review of Current and Antiquated Governmental, Commercial, and International Standards
• Introduction of Risk Management and System Safety, and Software Safety Engineering
• Management of COTS • Sample Documentation
JPL – "Software Systems Safety Handbook" 342
• Petri Nets • Software Fault Tree Analysis • Software Requirements Hazard Analysis • Software Top–Level and Detailed Design Hazard
Analysis • Code–Level Hazard Analysis • Interface Hazard Analysis • Software Change Hazard Analysis
337 IEEEP1228-C P1228, (DRAFT C) Draft Standard for Software Safety Plans, Institute of Electrical
and Electronics Engineers; 13 November 1990. 338 IEEEP1228-D P1228, (DRAFT D) Standard for Software Safety Plans, Institute of Electrical and
Electronics Engineers, Inc.; 06 March 1991. 339 IEEEP1228-E P1228, (DRAFT E) Standard for Software Safety Plans, Institute of Electrical and
Electronics Engineers, Inc.; 19 July 1991. 340 Note: The Draft IEEEP 1228 Series has recently been formalized as IEEE 1228-1994, IEEE Standard
for Software Safety Plans, Institute of Electrical and Electronics Engineers, Inc.; 2002. 341 Software System Safety Handbook, A Technical & Managerial Team Approach, Joint Software System
Safety Committee, Joint Services System Safety Panel; December 1999. 342 JPL D-10058, Software Systems Safety Handbook, prepared by the Jet Propulsion Laboratory for the
National Aeronautics and Space Administration; 10 May 1993.

323
MIL–STD–882B – " System Safety Program Requirements" 343
• Code Walk–Through • Cross Reference Listing Analysis • Design Walk–Through • Nuclear Safety Cross–Check Analysis • Petri Net Analysis • Software Fault Tree Analysis • Software/Hardware Integrated Critical Path
Analysis • Software Sneak Analysis • Software Requirements Hazard Analysis • Top–Level Design Hazard Analysis • Detailed Design Hazard Analysis • Code–Level Software Hazard Analysis • Software Safety Testing • Software/User Interface Analysis • Software Change Hazard Analysis
UK STAN 0055 – "Requirements For Safety Related Software In Defence Equipment"344
• Common Cause Failure Analysis • Event Tree Analysis • Software Hazard Analysis • Software Classification • Software Functional Analysis • Failure Modes and Effects Analysis • Fault Tree Analysis
Ontario Hydro – "Standard for Software Engineering of Safety Critical Software"345 • Code Hazards Analysis
NASA–I1740 – "(Interim) NASA Software Safety Standard" 346, 347
• Software Safety Requirements Analysis • Software Safety Architectural Design Analysis • Software Safety Detailed Design Analysis • Code Safety Analysis • Software Test Safety Analysis • Software Change Analysis
Table 19 Software Safety Standard Techniques Review
343 MIL-STD-882B, System Safety Program Requirements, Department of Defense; 30 March 1984. 344 Defence Standard 00-55, Requirements For Safety Related Software In Defence Equipment, Ministry
of Defence, United Kingdom; 01 August 1997. 345 Standard for Software Engineering of Safety Critical Software, Rev. 0, Ontario Hydro; Ontario,
Canada; December 1990. 346 NSS 1740.13, (Interim) NASA Software Safety Standard, National Aeronautics and Space
Administration; February 1996. 347 Note: NSS 1740.13 has been formalized as NASA-STD-8719.13A, NASA Technical Standard for
Software Safety, National Aeronautics and Space Administration; 15 September 1997.

324
2. COVERAGE TESTING MEASURES348
The following is a list of coverage testing measures for determining the
completeness and functionality of a Software System. The intent of coverage testing is to
find faults and triggers within the system or its independent modules. The level of
Coverage is measured by the amount of testing completed within each field of testing,
determined by the level of effort and completeness of each testing field. For example,
100% line coverage is not interpreted to mean that every line of code was executed, but
to mean that every line of code was tested for every possible fault and trigger that could
occur from the simple execution of a line of code.
1. Line coverage. Test every line of code (Or Statement coverage: test every statement).
2. Branch coverage. Test every line, and every branch on multi–branch lines.
3. N–length sub–path coverage. Test every sub–path through the program of length N. For example, in a 10,000 line program, test every possible 10–line sequence of execution.
4. Path coverage. Test every path through the program, from entry to exit. The number of paths may be exponentially large to test, compared to lines of code.
5. Multicondition or predicate coverage. Force every logical operand to take every possible value. Two different conditions within the same test may result in the same branch, and so branch coverage would only require the testing of one of them.
6. Trigger every assertion check in the program. Initiate and test the response of all triggers within a system using real and impossible data where able.
7. Loop coverage. Test the execution of all loops to detect bugs that exhibit themselves only when a loop is executed more than once.
8. Every module, object, component, tool, subsystem, etc. This includes the testing of COTS / GOTS systems with which the developer has no access to code level testing methods. The programming staff does not have the source code to these components, so measuring line coverage is impossible. At a minimum, testers
348 Kaner, Cem; Software Negligence and Testing Coverage, Software QA Quarterly, vol. 2, num. 2, pg.
18; 1995/1996.

325
need a list of all these components and test cases that exercise each one at least once.
9. Fuzzy decision coverage. If the program makes heuristically–based or similarity–based decisions, and uses comparison rules or data sets that evolve over time, check every rule several times over the course of training.
10. Relational coverage. Checks whether the subsystem has been exercised in a way that tends to detect off–by–one errors such as errors caused by using < instead of <=. This coverage includes:
• Every boundary on every input variable.
• Every boundary on every output variable.
• Every boundary on every variable used in intermediate calculations.
11. Data coverage. At least one test case for each data item / variable / field in the program.
12. Constraints among variables: (Reliance) Let X and Y be two variables in the program. X and Y constrain each other if the value of one restricts the values the other can take. For example, if X is a transaction date and Y is the transaction's confirmation date, Y cannot occur before X.
13. Each appearance of a variable. Suppose that you can enter a value for X on three different data entry screens, the value of X is displayed on another two screens, and it is printed in five reports. Change X at each data entry screen and check the effect everywhere else X appears.
14. Every type of data sent to every object. A key characteristic of object–oriented programming is that each object can handle any type of data (integer, real, string, etc.) that you pass to it. So, pass every conceivable type of data to every object.
15. Handling of every potential data conflict. Check for the entry of inconsistent or incompatible data from dissimilar points of the system to induce a conflict, testing for reaction and handling. For example, in an appointment–calendaring program, what happens if the user tries to schedule two appointments at the same date and time?
16. Handling of every error state. Verifying the ability of a program to handle induced errors, including all possible error states, effects on the stack, available memory, handling of keyboard input, etc.
17. Every complexity / maintainability metric against every module, object, subsystem, etc. Mathematical and logic checks for completeness and validity.
18. Conformity of every module, subsystem, etc. against every corporate coding standard. Several organizations believe that it is useful to measure characteristics
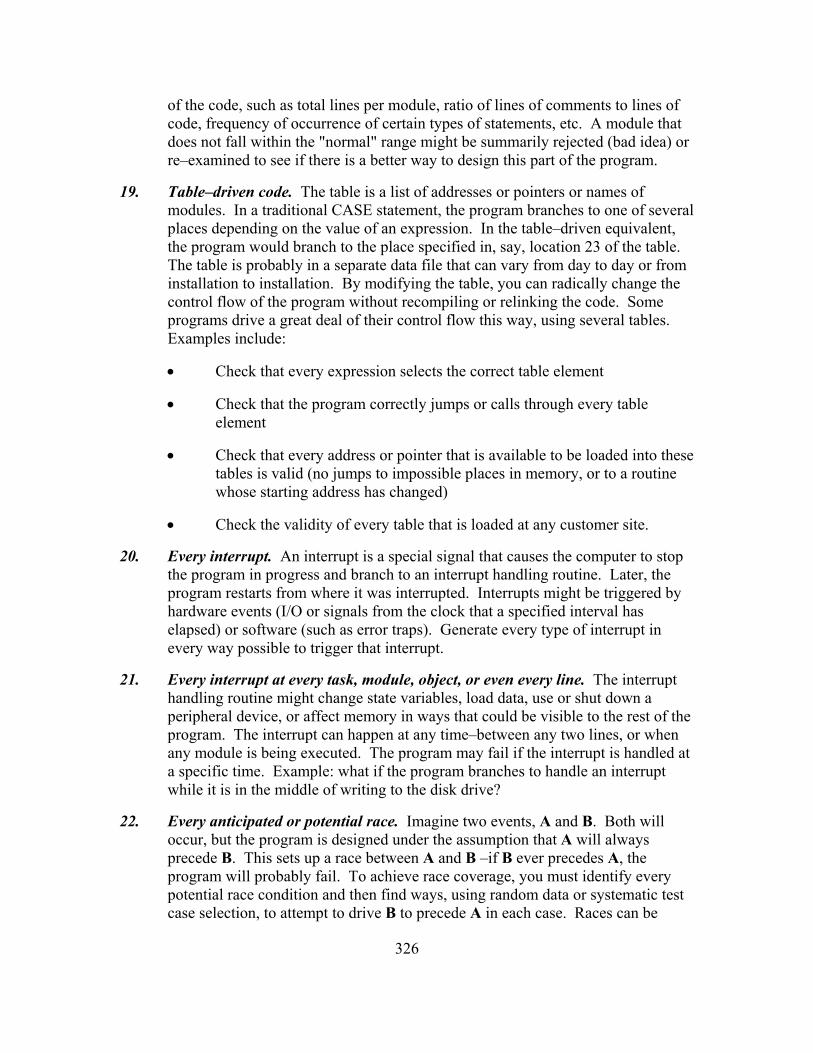
326
of the code, such as total lines per module, ratio of lines of comments to lines of code, frequency of occurrence of certain types of statements, etc. A module that does not fall within the "normal" range might be summarily rejected (bad idea) or re–examined to see if there is a better way to design this part of the program.
19. Table–driven code. The table is a list of addresses or pointers or names of modules. In a traditional CASE statement, the program branches to one of several places depending on the value of an expression. In the table–driven equivalent, the program would branch to the place specified in, say, location 23 of the table. The table is probably in a separate data file that can vary from day to day or from installation to installation. By modifying the table, you can radically change the control flow of the program without recompiling or relinking the code. Some programs drive a great deal of their control flow this way, using several tables. Examples include:
• Check that every expression selects the correct table element
• Check that the program correctly jumps or calls through every table element
• Check that every address or pointer that is available to be loaded into these tables is valid (no jumps to impossible places in memory, or to a routine whose starting address has changed)
• Check the validity of every table that is loaded at any customer site.
20. Every interrupt. An interrupt is a special signal that causes the computer to stop the program in progress and branch to an interrupt handling routine. Later, the program restarts from where it was interrupted. Interrupts might be triggered by hardware events (I/O or signals from the clock that a specified interval has elapsed) or software (such as error traps). Generate every type of interrupt in every way possible to trigger that interrupt.
21. Every interrupt at every task, module, object, or even every line. The interrupt handling routine might change state variables, load data, use or shut down a peripheral device, or affect memory in ways that could be visible to the rest of the program. The interrupt can happen at any time–between any two lines, or when any module is being executed. The program may fail if the interrupt is handled at a specific time. Example: what if the program branches to handle an interrupt while it is in the middle of writing to the disk drive?
22. Every anticipated or potential race. Imagine two events, A and B. Both will occur, but the program is designed under the assumption that A will always precede B. This sets up a race between A and B –if B ever precedes A, the program will probably fail. To achieve race coverage, you must identify every potential race condition and then find ways, using random data or systematic test case selection, to attempt to drive B to precede A in each case. Races can be
327
subtle. Suppose that you can enter a value for a data item on two different data entry screens. User 1 begins to edit a record, through the first screen. In the process, the program locks the record in Table 1. User 2 opens the second screen, which calls up a record in a different table, Table 2. The program is written to automatically update the corresponding record in the Table 1 when User 2 finishes data entry. Now, suppose that User 2 finishes before User 1. Table 2 has been updated, but the attempt to synchronize Table 1 and Table 2 fails. What happens at the time of failure, or later if the corresponding records in Table 1 and 2 stay out of synch?
23. Every time–slice setting. Users can control the grain of switching between tasks or processes. The size of the time quantum that is chosen can make race bugs, time–outs, interrupt–related problems, and other time–related problems more or less likely. Complete coverage is a difficult problem in this instance because testers are not just varying time–slice settings through every possible value. Testers also have to decide which tests to run under each setting. Given a planned set of test cases per setting, the coverage measure looks at the number of settings you have covered.
24. Varied levels of background activity. In a multiprocessing system, tie up the processor with competing, irrelevant background tasks. Look for effects on races and interrupt handling. Similar to time–slices, your coverage analysis must specify categories of levels of background activity (figure out something that makes sense) and all timing–sensitive testing opportunities (races, interrupts, etc.).
25. Each processor type and speed. Which processor chips do you test under? What tests do you run under each processor? Testers are looking for:
• Speed effects, like the ones you look for with background activity testing, and
• Consequences of processors' different memory management rules, and
• Floating point operations, and
• Any processor–version–dependent problems that you can learn about.
26. Every opportunity for file / record / field locking.
27. Every dependency on the locked (or unlocked) state of a file, record or field.
28. Every opportunity for contention for devices or resources.
29. Performance of every module / task / object. Test the performance of a module then retest it during the next cycle of testing. If the performance has changed significantly, you are either looking at the effect of a performance–significant redesign or at a symptom of a new bug.
328
30. Free memory / available resources / available stack space at every line or on entry into and exit out of every module or object.
31. Execute every line (branch, etc.) under the debug version of the operating system. This shows illegal or problematic calls to the operating system.
32. Vary the location of every file. What happens if the user installs or moves one of the program's components, controls, initialization, or data files to a different directory or drive or to another computer on the network?
33. Check the release disks for the presence of every file.
34. Every embedded string in the program. Use a utility to locate embedded strings. Then find a way to make the program display each string.
35. Operation of every function / feature / data handling operation under every program preference setting.
36. Operation of every function / feature / data handling operation under every character set, code page setting, or country code setting.
37. Operation of every function / feature / data handling operation under the presence of every memory resident utility (inits, TSRs).
38. Operation of every function / feature / data handling operation under each operating system version.
39. Operation of every function / feature / data handling operation under each distinct level of multi–user operation.
40. Operation of every function / feature / data handling operation under each network type and version.
41. Operation of every function / feature / data handling operation under each level of available RAM.
42. Operation of every function / feature / data handling operation under each type / setting of virtual memory management.
43. Compatibility with every previous version of the program.
44. Ability to read every type of data available in every readable input file format. If a file format is subject to subtle variations (e.g. CGM) or has several sub–types (e.g. TIFF) or versions (e.g. dBASE), test each one.
45. Write every type of data to every available output file format. Testing includes writing to every potential format as well as testing the readability of that format by appropriate secondary programs.

329
46. Every typeface supplied with the product. Check all characters in all sizes and styles. If your program adds typefaces to a collection of fonts that are available to several other programs, check compatibility with the other programs (nonstandard typefaces will crash some programs).
47. Every type of typeface compatible with the program. Testing includes the use of different TrueType and Postscript typefaces, and fixed–sized bitmap fonts.
48. Every piece of clip art in the product. Test each with this program. Test each with other programs that should be able to read this type of art.
49. Every sound / animation provided with the product. Play them all under different device (e.g. sound) drivers / devices. Check compatibility with other programs that should be able to play this clip–content.
50. Every supplied (or constructible) script to drive other machines / software (e.g. macros) / BBS's and information services (communications scripts).
51. All commands available in a supplied communications protocol.
52. Recognized characteristics. For example, every speaker's voice characteristics (for voice recognition software) or writer's handwriting characteristics (handwriting recognition software) or every typeface (OCR software).
53. Every type of keyboard and keyboard driver.
54. Every type of pointing device and driver at every resolution level and ballistic setting.
55. Every output feature with every sound card and associated drivers.
56. Every output feature with every type of printer and associated drivers at every resolution level.
57. Every output feature with every type of video card and associated drivers at every resolution level.
58. Every output feature with every type of terminal and associated protocols.
59. Every output feature with every type of video monitor and monitor–specific drivers at every resolution level.
60. Every color shade displayed or printed to every color output device (video card / monitor / printer / etc.) and associated drivers at every resolution level. In addition, check the conversion to grey scale or black and white.
61. Every color shade readable or scannable from each type of color input device at every resolution level.
330
62. Every possible feature interaction between video card type and resolution, pointing device type and resolution, printer type and resolution, and memory level.
63. Every type of CD–ROM drive connected to every type of port (serial / parallel / SCSI) and associated drivers.
64. Every type of writable disk drive / port / associated driver.
65. Compatibility with every type of disk compression software. Check error handling for every type of disk error, such as full disk.
66. Every voltage level from analog input devices.
67. Every voltage level to analog output devices.
68. Every type of modem and associated drivers.
69. Every FAX command (send and receive operations) for every type of FAX card under every protocol and driver.
70. Every type of connection of the computer to the telephone line (direct, via PBX, etc.; digital vs. analog connection and signaling); test every phone control command under every telephone control driver.
71. Tolerance of every type of telephone line noise and regional variation (including variations that are out of spec) in telephone signaling (intensity, frequency, timing, other characteristics of ring / busy / etc. tones).
72. Every variation in telephone dialing plans.
73. Every possible keyboard combination. Keyboard combinations include tester hotkeys designed by debugging tools. These hotkeys may crash a debuggerless program. Other times, these combinations may reveal an Easter Egg (an undocumented, probably unauthorized, and possibly embarrassing feature). The broader coverage measure is every possible keyboard combination at every error message and every data entry point.
74. Recovery from every potential type of equipment failure. Full coverage includes each type of equipment, each driver, and each error state. For example, test the program's ability to recover from full disk errors on writable disks. Include floppies, hard drives, cartridge drives, optical drives, etc. Include the various connections to the drive, such as IDE, SCSI, MFM, parallel port, and serial connections, because these will probably involve different drivers.
75. Function equivalence. For each mathematical function, check the output against a known good implementation of the function in a different program. Complete coverage involves equivalence testing of all testable functions across all possible input values.

331
76. Zero handling. For each mathematical function, test when every input value, intermediate variable, or output variable is zero or near zero. Look for severe rounding errors or divide–by–zero errors.
77. Accuracy of every graph, across the full range of graphable values. Include values that force shifts in the scale.
78. Accuracy of every report. Look at the correctness of every value, the formatting of every page, and the correctness of the selection of records used in each report.
79. Accuracy of every message.
80. Accuracy of every screen.
81. Accuracy of every word and illustration in the manual.
82. Accuracy of every fact or statement in every data file provided with the product.
83. Accuracy of every word and illustration in the on–line help.
84. Every jump, search term, or other means of navigation through the on–line help.
85. Check for every type of virus / worm that could ship with the program.
86. Every possible kind of security violation of the program, or of the system while using the program.
87. Check for copyright permissions for every statement, picture, sound clip, or other creation provided with the program.
88. Verification of the program against every program requirement and published specification.
89. Verification of the program against user scenarios. Use the program to do real tasks that are challenging and well specified. For example, create key reports, pictures, page layouts, or other documents events to match ones that have been featured by competitive programs as interesting output or applications.
90. Verification against every regulation (IRS, SEC, FDA, etc.) that applies to the data or procedures of the program.
91. Usability tests of every feature / function of the program.
92. Usability tests of every part of the manual.
93. Usability tests of every error message.
94. Usability tests of every on–line help topic.
95. Usability tests of every graph or report provided by the program.

332
96. Localizability / localization tests every string. Check program's ability to display and use this string if it is modified by changing the length, using high or low ASCII characters, different capitalization rules, etc.
97. Compatibility with text handling algorithms under other languages (sorting, spell checking, hyphenating, etc.)
98. Every date, number, and measure in the program.
99. Hardware and drivers, operating system versions, and memory–resident programs that are popular in other countries.
100. Every input format, import format, output format, or export format that would be commonly used in programs that are popular in other countries.
101. Cross–cultural appraisal of the meaning and propriety of every string and graphic shipped with the program.
3. DEFINITION OF SOFTWARE ENGINEERING
In 1967, the NATO Science Committee referred to the state of the art of Software
Engineering as the discipline of “...promoting the establishment of theoretical
foundations and practical disciplines for software, similar to those found in the
established branches of engineering.”349 Two years later, NATO refined its definition of
Software Engineering as “the establishment and use of sound engineering principles in
order to obtain economically software that is reliable and works efficiently on real
machines.” 350 The IEEE Standard simply defined Software Engineering as “the
application of a systematic, disciplined, quantifiable approach to the development,
operation, and maintenance of software.”351
349 Software Engineering, Report on a conference by the NATO Science Committee, NATO Science
Committee; 1967. 350 Naur, Peter; Randall, Brian; Editors, Software Engineering, Report on a conference by the NATO
Science Committee, NATO Science Committee, January 1969. 351 def: Software Engineering, IEEE Standard Glossary of Software Engineering Terminology, IEEE
Standard 610.12, Institute of Electrical and Electronics Engineers, Inc.; 1990, 1991.
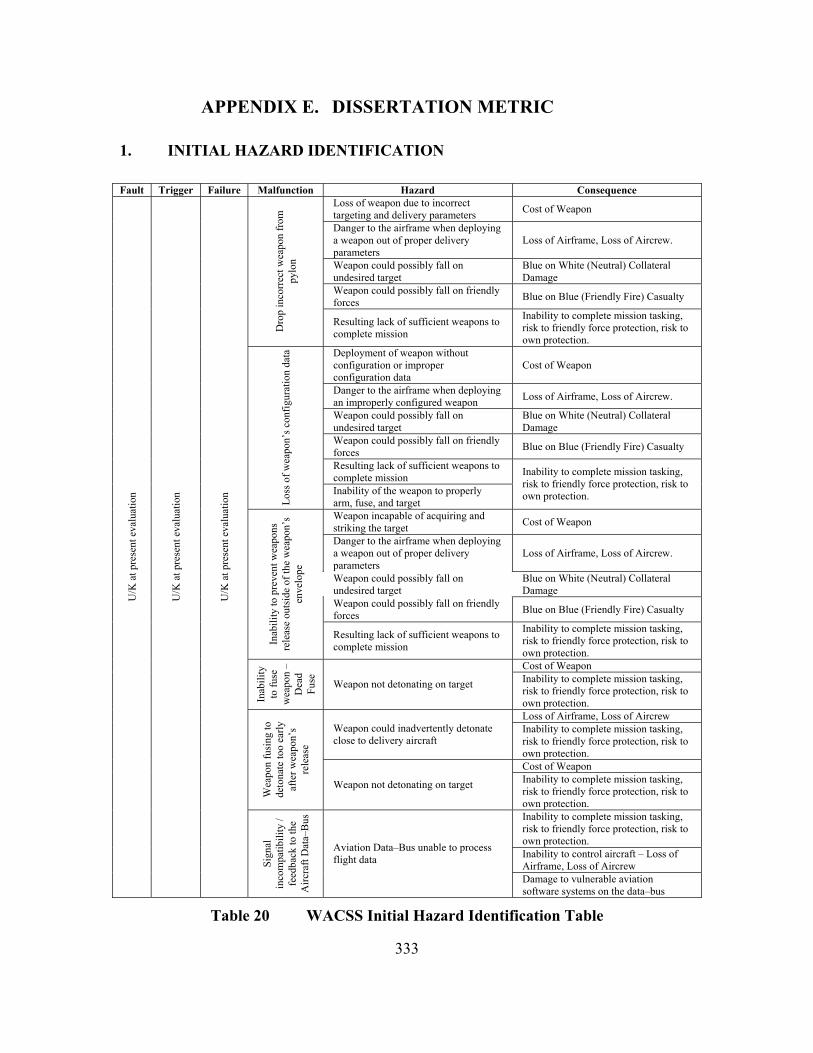
333
APPENDIX E. DISSERTATION METRIC
1. INITIAL HAZARD IDENTIFICATION
Fault Trigger Failure Malfunction Hazard Consequence Loss of weapon due to incorrect targeting and delivery parameters Cost of Weapon
Danger to the airframe when deploying a weapon out of proper delivery parameters
Loss of Airframe, Loss of Aircrew.
Weapon could possibly fall on undesired target
Blue on White (Neutral) Collateral Damage
Weapon could possibly fall on friendly forces Blue on Blue (Friendly Fire) Casualty
Dro
p in
corr
ect w
eapo
n fr
om
pylo
n
Resulting lack of sufficient weapons to complete mission
Inability to complete mission tasking, risk to friendly force protection, risk to own protection.
Deployment of weapon without configuration or improper configuration data
Cost of Weapon
Danger to the airframe when deploying an improperly configured weapon Loss of Airframe, Loss of Aircrew.
Weapon could possibly fall on undesired target
Blue on White (Neutral) Collateral Damage
Weapon could possibly fall on friendly forces Blue on Blue (Friendly Fire) Casualty
Resulting lack of sufficient weapons to complete mission
Loss
of w
eapo
n’s c
onfig
urat
ion
data
Inability of the weapon to properly arm, fuse, and target
Inability to complete mission tasking, risk to friendly force protection, risk to own protection.
Weapon incapable of acquiring and striking the target Cost of Weapon
Danger to the airframe when deploying a weapon out of proper delivery parameters
Loss of Airframe, Loss of Aircrew.
Weapon could possibly fall on undesired target
Blue on White (Neutral) Collateral Damage
Weapon could possibly fall on friendly forces Blue on Blue (Friendly Fire) Casualty
Inab
ility
to p
reve
nt w
eapo
ns
rele
ase
outs
ide
of th
e w
eapo
n’s
enve
lope
Resulting lack of sufficient weapons to complete mission
Inability to complete mission tasking, risk to friendly force protection, risk to own protection. Cost of Weapon
Inab
ility
to
fuse
w
eapo
n –
Dea
d Fu
se
Weapon not detonating on target Inability to complete mission tasking, risk to friendly force protection, risk to own protection. Loss of Airframe, Loss of Aircrew
Weapon could inadvertently detonate close to delivery aircraft
Inability to complete mission tasking, risk to friendly force protection, risk to own protection. Cost of Weapon
Wea
pon
fusi
ng to
de
tona
te to
o ea
rly
afte
r wea
pon’
s re
leas
e
Weapon not detonating on target Inability to complete mission tasking, risk to friendly force protection, risk to own protection. Inability to complete mission tasking, risk to friendly force protection, risk to own protection. Inability to control aircraft – Loss of Airframe, Loss of Aircrew
U/K
at p
rese
nt e
valu
atio
n
U/K
at p
rese
nt e
valu
atio
n
U/K
at p
rese
nt e
valu
atio
n
Sign
al
inco
mpa
tibili
ty /
feed
back
to th
e A
ircra
ft D
ata–
Bus
Aviation Data–Bus unable to process flight data
Damage to vulnerable aviation software systems on the data–bus
Table 20 WACSS Initial Hazard Identification Table

334
The example Initial Hazard Identification Table demonstrated in Table 20 serves
as an illustration to the dissertation model in Chapter V.E.2 and process Step 4. Action 1.
INITIAL SAFETY ASSESSMENT
For the purpose of the WACSS, the following Consequence Severity Categories
are agreed upon.
DEFINITION
I CATASTROPHIC Complete military mission failure, loss of Blue Force life, or loss of the aircraft.
II CRITICAL
Major military mission degradation, loss if White Force life, severe injury to Blue Force, significant damage to the aircraft, or complete system damage.
III MARGINAL / MODERATE
Minor military mission degradation, complete loss of the weapon, minor damage to the aircraft, or major system damage
SEV
ERIT
Y
IV NEGLIGIBLE Less then minor military mission degradation or minor system damage.
Table 21 WACSS Consequence Severity Categories
The example Consequence Severity Category Table demonstrated in Table 21
serves as an illustration to the dissertation model in Chapter V.D and process Steps 2.1
and 2.2.. The Example numeric definition can be derived from the dissertation example
in Table 7.
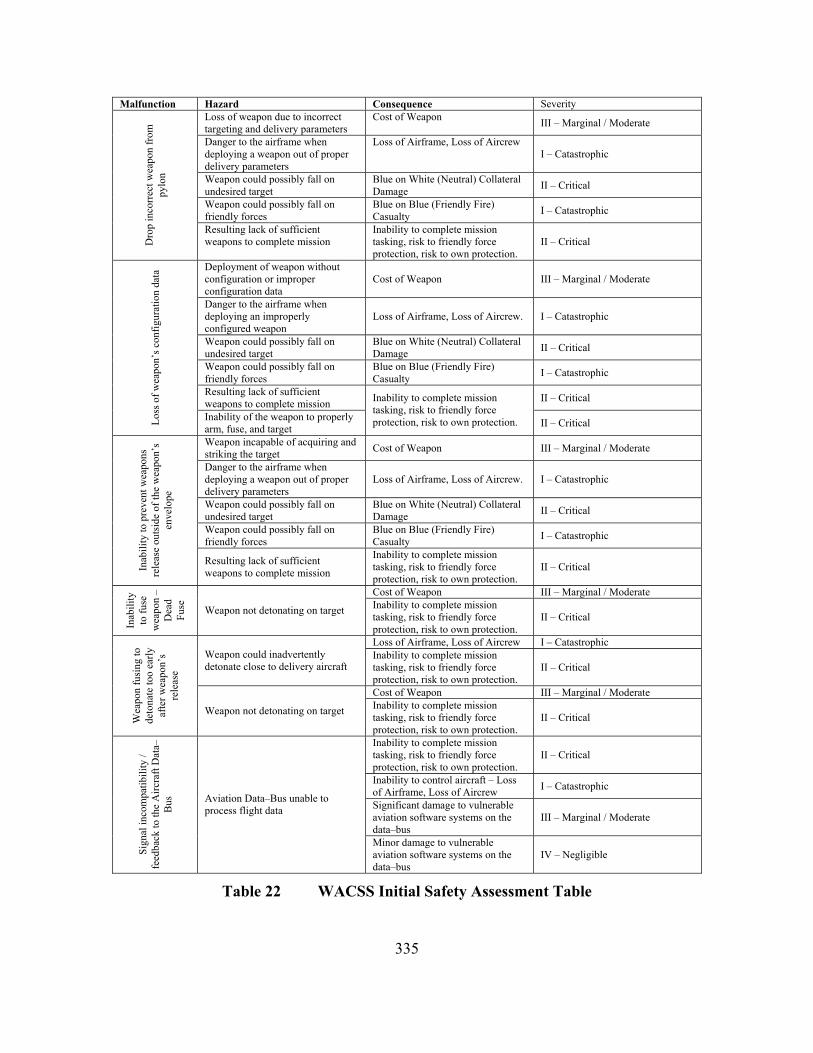
335
Malfunction Hazard Consequence Severity Loss of weapon due to incorrect targeting and delivery parameters
Cost of Weapon III – Marginal / Moderate
Danger to the airframe when deploying a weapon out of proper delivery parameters
Loss of Airframe, Loss of Aircrew I – Catastrophic
Weapon could possibly fall on undesired target
Blue on White (Neutral) Collateral Damage II – Critical
Weapon could possibly fall on friendly forces
Blue on Blue (Friendly Fire) Casualty I – Catastrophic
Dro
p in
corr
ect w
eapo
n fr
om
pylo
n
Resulting lack of sufficient weapons to complete mission
Inability to complete mission tasking, risk to friendly force protection, risk to own protection.
II – Critical
Deployment of weapon without configuration or improper configuration data
Cost of Weapon III – Marginal / Moderate
Danger to the airframe when deploying an improperly configured weapon
Loss of Airframe, Loss of Aircrew. I – Catastrophic
Weapon could possibly fall on undesired target
Blue on White (Neutral) Collateral Damage II – Critical
Weapon could possibly fall on friendly forces
Blue on Blue (Friendly Fire) Casualty I – Catastrophic
Resulting lack of sufficient weapons to complete mission II – Critical
Loss
of w
eapo
n’s c
onfig
urat
ion
data
Inability of the weapon to properly arm, fuse, and target
Inability to complete mission tasking, risk to friendly force protection, risk to own protection. II – Critical
Weapon incapable of acquiring and striking the target Cost of Weapon III – Marginal / Moderate
Danger to the airframe when deploying a weapon out of proper delivery parameters
Loss of Airframe, Loss of Aircrew. I – Catastrophic
Weapon could possibly fall on undesired target
Blue on White (Neutral) Collateral Damage II – Critical
Weapon could possibly fall on friendly forces
Blue on Blue (Friendly Fire) Casualty I – Catastrophic
Inab
ility
to p
reve
nt w
eapo
ns
rele
ase
outs
ide
of th
e w
eapo
n’s
enve
lope
Resulting lack of sufficient weapons to complete mission
Inability to complete mission tasking, risk to friendly force protection, risk to own protection.
II – Critical
Cost of Weapon III – Marginal / Moderate
Inab
ility
to
fuse
w
eapo
n –
Dea
d Fu
se
Weapon not detonating on target Inability to complete mission tasking, risk to friendly force protection, risk to own protection.
II – Critical
Loss of Airframe, Loss of Aircrew I – Catastrophic Weapon could inadvertently detonate close to delivery aircraft
Inability to complete mission tasking, risk to friendly force protection, risk to own protection.
II – Critical
Cost of Weapon III – Marginal / Moderate
Wea
pon
fusi
ng to
de
tona
te to
o ea
rly
afte
r wea
pon’
s re
leas
e
Weapon not detonating on target Inability to complete mission tasking, risk to friendly force protection, risk to own protection.
II – Critical
Inability to complete mission tasking, risk to friendly force protection, risk to own protection.
II – Critical
Inability to control aircraft – Loss of Airframe, Loss of Aircrew I – Catastrophic
Significant damage to vulnerable aviation software systems on the data–bus
III – Marginal / Moderate
Sign
al in
com
patib
ility
/ fe
edba
ck to
the
Airc
raft
Dat
a–B
us Aviation Data–Bus unable to
process flight data
Minor damage to vulnerable aviation software systems on the data–bus
IV – Negligible
Table 22 WACSS Initial Safety Assessment Table

336
The example Initial Safety Assessment Table demonstrated in Table 22 serves as
an illustration to the dissertation model in Chapter V.E.2 and process Step 4. Action 1.,
and refinement to Table 20.
2. INITIAL PROCESS IDENTIFICATION
ID Title Description Relations
P1 Weapon Data Processor Process of raw Weapons status and configuration data for use on the WACSS.
From I1, I2, I3; to O1,
P2 Aircraft Data Processor Process of Aircraft status and configuration data for use on the WACSS.
From I4, I5; to O2
P3 System Data Processor Process of refined aircraft / weapon status and configuration data for use on the WACSS and Aircraft Data–Bus.
From I6, I7, I10; to O3, O4
P4 User Input / System Feedback Processor
Process of user inputs for menu selection, configuration changes, and launch commands.
From I8, I9, I14; to O5, O6, O7, O8
P5 Weapon Configuration Change Processor
Process of Configuration Command Changes; verify that changes are in compliance and within limits of the weapon and aircraft
From I11; to O9, O10
P6 System Display Processor Process of data for display, as per user and system requests / requirements.
From I12; to O11
P7 Weapon Launch / Deployment Processor
Process of Launch Command; verify that weapon and aircraft are within parameters.
From I13; to O12, O13
Table 23 WACSS Initial Process Identification
The example Initial Process Identification Table demonstrated in Table 23 serves
as an illustration to the dissertation model in Chapter V.E.1 and process Step 3. Action 2.
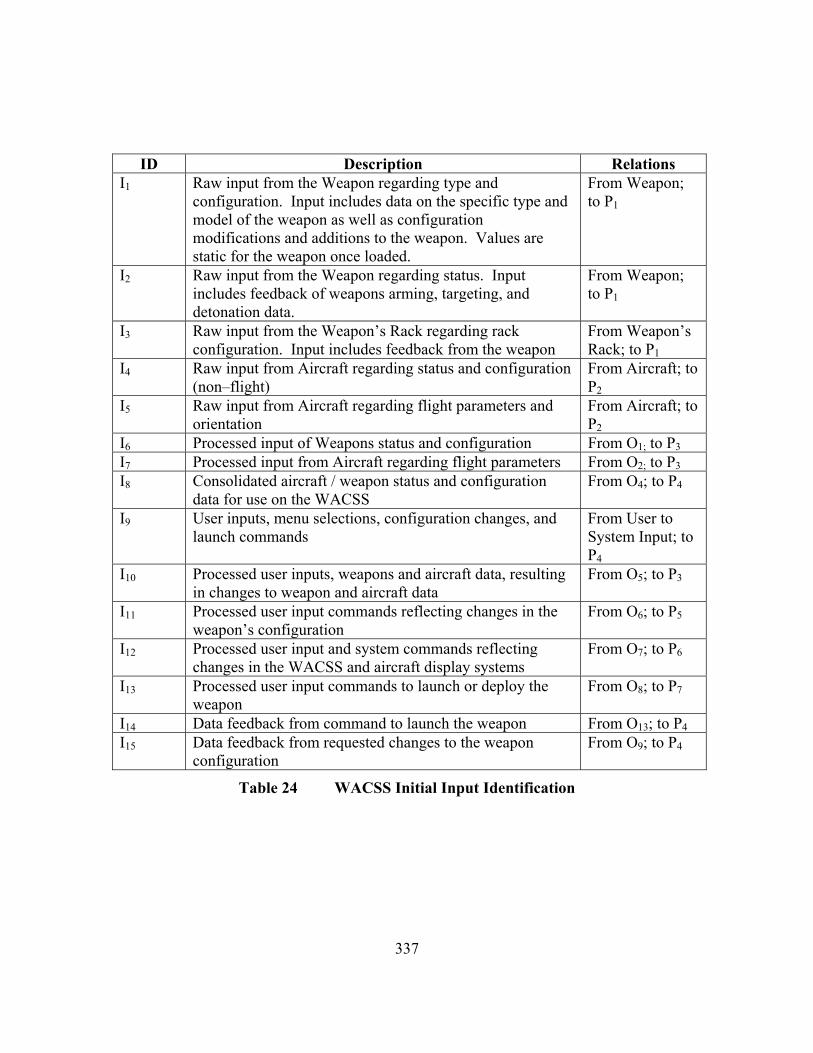
337
ID Description Relations I1 Raw input from the Weapon regarding type and
configuration. Input includes data on the specific type and model of the weapon as well as configuration modifications and additions to the weapon. Values are static for the weapon once loaded.
From Weapon; to P1
I2 Raw input from the Weapon regarding status. Input includes feedback of weapons arming, targeting, and detonation data.
From Weapon; to P1
I3 Raw input from the Weapon’s Rack regarding rack configuration. Input includes feedback from the weapon
From Weapon’s Rack; to P1
I4 Raw input from Aircraft regarding status and configuration (non–flight)
From Aircraft; to P2
I5 Raw input from Aircraft regarding flight parameters and orientation
From Aircraft; to P2
I6 Processed input of Weapons status and configuration From O1; to P3 I7 Processed input from Aircraft regarding flight parameters From O2; to P3 I8 Consolidated aircraft / weapon status and configuration
data for use on the WACSS From O4; to P4
I9 User inputs, menu selections, configuration changes, and launch commands
From User to System Input; to P4
I10 Processed user inputs, weapons and aircraft data, resulting in changes to weapon and aircraft data
From O5; to P3
I11 Processed user input commands reflecting changes in the weapon’s configuration
From O6; to P5
I12 Processed user input and system commands reflecting changes in the WACSS and aircraft display systems
From O7; to P6
I13 Processed user input commands to launch or deploy the weapon
From O8; to P7
I14 Data feedback from command to launch the weapon From O13; to P4 I15 Data feedback from requested changes to the weapon
configuration From O9; to P4
Table 24 WACSS Initial Input Identification

338
ID Description Relations O1 Processed output of Weapon’s status and configuration From P1; to I6 O2 Processed output of Aircraft’s status and configuration From P2; to I7 O3 Consolidated output of Aircraft / Weapon status and
configuration for the aircraft / weapon status and configuration data for use on the Aircraft Data–Bus.
From P3; to Aircraft Data–Bus
O4 Consolidated output of Aircraft / Weapon status and configuration for the aircraft / weapon status and configuration data for use on the WACSS.
From P3; to I8
O5 Processed user inputs, weapons and aircraft data, resulting in changes to weapon and aircraft data
From P4; to I10
O6 Processed user input commands reflecting changes in the weapon’s configuration
From P4; to I11
O7 Processed user input and system commands reflecting changes in the WACSS and aircraft display systems
From P4; to I12
O8 Processed user input commands to launch or deploy the weapon
From P4; to I13
O9 Data feedback from requested changes to the weapon configuration
From P5; to I15
O10 Weapon change configuration commands From P5; to Weapon
O11 Processed WACSS display commands From P6; to Display System
O12 Weapon launch or deployment commands From P7; to Command Launch
O13 Data feedback from weapon launch or deployment commands
From P7; to I14
Table 25 WACSS Initial Output Identification
ID Description Relations L1 Limit value to Open / Closed In line with I3
Table 26 WACSS Initial Limit Identification
The example Initial Input, Output, and Limit Identification Table demonstrated in
Table 24, Table 25, and Table 26 serve as an illustration to the dissertation model in
Chapter V.E.1 and process Step 3. Action 2.

339
3. INITIAL PROCESS MAP
Figure 21 WACSS Initial Process Flow Depiction
L 1
Airc
raft
Dat
a-B
us
I 2 I 3 I 1
O1
I 6
I 5 I 4 O
2
I 7
O3
I 8 O
4
I 9 O5
I 10
O6 O7 O8
I 11 I 12 I 13
O9
I 15
I 14
P 3
P 1
P 2
P 4
P 5
Wea
pon
and
Wea
pon’
s R
ack
Airc
raft
(non
-fli
ght a
nd fl
ight
da
ta)
Use
r to
Sy
stem
Inpu
t
Wea
pon
Dis
play
Com
man
d La
unch
P 7
P 6
Sys
tem
Pro
cess
es, F
unct
ions
, or O
bjec
ts
Inpu
t / O
utpu
t Lim
its
Dire
ctio
n of
Sys
tem
Pro
cess
Flo
w
I n –
Inpu
t L n
– L
imit
On –
Out
put
P n –
Pro
cess
O10
O11
O12
O13

340
The example WACSS Initial Process Flow Depiction demonstrated in Figure 21
serves as an illustration to the dissertation model in Chapter V.E.1 and process Step 3.
Action 3.
ID Failure ID Malfunction
F1 Failure in the Aircraft Data–Bus Output – O3
F2 Failure in the processing of system data in P3
M1 Signal incompatibility / feedback to the Aircraft Data–Bus
F3 Failure in weapon’s configuration change logic – P5f
F4 Failure in weapon’s signals regarding current status of the weapon – I2, P1, O1, I6, P3
F5 Failure in weapon’s signals regarding the configuration of the weapon – I1, P1, O1, I6, P3
F6 Failure in system data signals / transfer – O4, I8, P4, O6, I11
F7 Failure / incompatibility in Weapon’s configuration signals in O10
M2 Weapon fusing to detonate too early after weapon’s release
F8 Failure in weapon’s configuration change logic – P5
F9 Failure / incompatibility in Weapon’s configuration signals in O10
F10 Failure in launch logic to deploy weapon with fusing. – P7
F11 Failure in Weapon’s signal regarding weapon’s configuration and status – I1, I2, P1, O1, I6, P3
M3 Inability to fuse weapon – Dead Fuse
F12 Failure in Weapon’s data signal regarding weapon’s configuration and status – I1, I2, P1, O1, I6, P3
F13 Failure in Aircraft data signal regarding flight and non–flight data – I4, I5, P2, O2, I7, P3
F14 Failure in weapons launch / deployment logic to validate weapon’s envelope – P7
F15 Failure in the weapons launch signal – P7, O12
F16 Failure in system data signals / transfer – O4, I8, P4, O8, I13
M4 Inability to prevent weapons release outside of the weapon’s envelope
F17 Failure in weapons launch / deployment logic to select the proper weapon – P7
F18 Failure in the system to comprehend which weapon was selected – P4, I9, O8, I13, P7
M5 Drop incorrect weapon from pylon
Table 27 WACSS Initial Failures to Malfunction Identification

341
The example Initial Failure to Malfunction Identification Table demonstrated in
Table 27 serves as an illustration to the dissertation model in Chapter V.E.2 and process
Step 4. Action 1., and refinement to Table 20 and Table 22.

342
4. INITIAL FAILURE PROCESS MAP
Figure 22 WACSS Initial Failure Depiction
O9
O10
O11
O12
O13
Wea
pon
Com
man
d La
unch
Dis
play
F 7
F 9
F 15.
2
P6
F 8 F 3
F 15.
1 F 1
7
F 10
F 18.
5
F 14 P 5
O6
O7
I 11
I 12
I 13
I 14
I 15
F 6.4
F 6.5
F 16.
4 F 18.
3
F 16.
5 F 18.
4
Airc
raft
Dat
a-B
us
O1
I 6
O2
I 7
I 9 O5
I 10
Use
r to
Syst
em In
put
F 5.2
F 1
1.3
F 4.2
F 12.
3
F 13.
4
F 13.
5
F 5.3
F 11.
4 F 4
.3
F 12.
4
F 5.4
F 11.
5
F 4.4
F 12.
5
F 5.5
F 1
1.6
F 2
F 12.
6
F 4.5
F 13.
6
F 1
F 6.1
F 16.
1
F 6.2
F 16.
2
F 16.
3 F 6.3
F 18.
1
O3
P 3
P1
F13
.3
P2
Wea
pon
and
Wea
pon’
s R
ack
Airc
raft
(non
-fli
ght a
nd fl
ight
da
ta) S
yste
m P
roce
sses
, Fun
ctio
ns, o
r Obj
ects
Sy
stem
Fai
lure
s
Inpu
t / O
utpu
t Lim
its
Dire
ctio
n of
Sys
tem
Pro
cess
Flo
w
F n –
Fai
lure
I n
– In
put
L n –
Lim
it O
n – O
utpu
t P n
– P
roce
ss
I 2 I 3 I 1 I 5 I 4
F 11.
1 F 1
2.1
F 5.1
F 11.
2 F 1
2.2
F 4.1
F 13.
1
F 13.
2
L 1I 8
F 18.
2
O4
O8
P 7
P 4
F 6.6
F 6
.7

343
The example WACSS Initial Failure Depiction demonstrated in Figure 22 serves
as an illustration to the dissertation model in Chapter V.E.2 and process Step 4. Action 2.
5. PROCESS ASSESSMENT
Probability of System Execution Let Pse = 1.0 or 100%. The system will execute 100% of the time. Where:
• The time sample = the total flight time of the aircraft, from launch to land. • The flight mission consists of weapons employment
Frequency of Execution
Frequency Definition Probability ALWAYS Objects are executed constantly during
the sample time life of the system. 1.00
FREQUENT Objects are executed often in the sample time life of the system.
0.90
LIKELY Objects are executed several times in the sample time life of the system.
0.75
PERIODICALLY Objects are executed at regular intervals in the sample time life of the system.
0.66
OCCASIONAL Objects are executed in the sample time life of the system.
0.50
SELDOM Objects are executed seldom in the sample time life of the system.
0.25
SPORADICALLY Objects are executed infrequently or at scattered instances within the sample time life of the system.
0.15
UNLIKELY Objects are so unlikely to execute it can be assumed that it will not occur in the sample time life of the system.
0.05
NEVER Objects are assured never to execute during the sample time life of the system.
0.00
Table 28 WACSS Execution Probability Definition Table
The example Execution Probability Definitions demonstrated in Table 28 serves
as an illustration to the dissertation model in Chapter V.E.3.b and process Step 5. Action
2.

344
Frequency of Failure
Frequency Definition Probability x10–5
ALWAYS Objects will fail each time they are executed.
1.00
FREQUENT Objects will most likely fail when executed.
0.90
LIKELY Objects will likely fail when executed. 0.75 PERIODICALLY Objects will periodically fail when
executed. 0.66
OCCASIONAL Objects will occasionally fail when executed.
0.50
SELDOM Objects will seldom fail when executed. 0.25 SPORADICALLY Objects will fail sporadically when they
are executed. 0.15
UNLIKELY Objects are unlikely to fail when executed.
0.05
NEVER Objects will never fail when executed. 0.00
Table 29 WACSS Object Failure Probability Definition Table
The example Object Failure Probability Definition Table demonstrated in Table
29 serves as an illustration to the dissertation model in Chapter V.E.3.b and process Step
5. Action 4.

345
6. OBJECT EXECUTION PROBABILITY
Figure 23 WACSS Object Execution Probability Map
L 1
Airc
raft
Dat
a-B
us
I 2 I 3 I 1
O1
I 6
I 5 I 4 O
2
I 7
O3
I 8 O
4
I 9 O5
I 10
O6
O7
O8
I 11
I 12
I 13
O9
O10
O11
O12
O13
I 14
I 15
P 3
P 1
P 2
P 4
P5
Wea
pon
and
Wea
pon’
s R
ack
Airc
raft
(non
-fli
ght a
nd fl
ight
da
ta)
Use
r to
Sy
stem
Inpu
t
Wea
pon
Com
man
d La
unch
P 7
Dis
play
P 6
I n –
Inpu
t L n
– L
imit
On –
Out
put
P n –
Pro
cess
0.66
0.66
0.66
1.00
0.90
0.66
0.66
0.66
0.66
0.66
0.66
0.66
0.40
0.40
0.
40
0.25
0.25
0.
10
0.25
0.25
0.10
0.25
0.
10
0.10
0.07
n.nn
0.10
0.
10
Sys
tem
Pro
cess
es, F
unct
ions
, or O
bjec
ts
Inpu
t / O
utpu
t Lim
its
Dire
ctio
n of
Sys
tem
Pro
cess
Flo
w
Pro
babi
lity
of E
vent
Exe
cutio
n

346
The example Object Execution Probability Map demonstrated in Figure 23 serves
as an illustration to the dissertation model in Chapter V.E.3.b and process Step 5. Action
3.

347
7. OBJECT FAILURE PROBABILITY
Failure ID Intermittent
Failure Prob Pf x10–5
Partial Failure
Prob Pf x10–5
Complete Failure
Prob Pf x10–5
Cataclysmic Failure
Prob Pf x10–5
Object ID
Execution Prob Pe
Malfunction ID
F1 2.5000 1.2500 0.6250 0.3125 O3 0.40 M1F2 2.0000 1.0000 0.5000 0.2500 P3 0.66 M1F3 0.8000 0.4000 0.2000 0.1000 P5 0.25 M2F4.1 1.5000 0.7500 0.3750 0.1875 I2 0.66 M2F4.2 1.0000 0.5000 0.2500 0.1250 P1 0.66 M2F4.3 0.5000 0.2500 0.1250 0.0625 O1 0.66 M2F4.4 0.5000 0.2500 0.1250 0.0625 I6 0.25 M2F4.5 1.2000 0.6000 0.3000 0.1500 P3 0.66 M2F5.1 1.8000 0.9000 0.4500 0.2250 I1 0.66 M2F5.2 1.0000 0.5000 0.2500 0.1250 P1 0.66 M2F5.3 0.5000 0.2500 0.1250 0.0625 O1 0.66 M2F5.4 0.5000 0.2500 0.1250 0.0625 I6 0.25 M2F5.5 1.2000 0.6000 0.3000 0.1500 P3 0.66 M2F6.1 0.5000 0.2500 0.1250 0.0625 O4 0.40 M2F6.2 0.5000 0.2500 0.1250 0.0625 I8 0.40 M2F6.3 0.5000 0.2500 0.1250 0.0625 P4 0.25 M2F6.4 0.5000 0.2500 0.1250 0.0625 O6 0.25 M2F6.5 0.5000 0.2500 0.1250 0.0625 I11 0.25 M2F6.6 0.2000 0.1000 0.0500 0.0250 O5 0.10 M2F6.7 0.2000 0.1000 0.0500 0.0250 I10 0.10 M2F7 0.8000 0.4000 0.2000 0.1000 O10 0.10 M2F8 1.0000 0.5000 0.2500 0.1250 P5 0.25 M3F9 0.8000 0.4000 0.2000 0.1000 O10 0.10 M3F10 1.2000 0.6000 0.3000 0.1500 P7 0.10 M3F11.1 1.8000 0.9000 0.4500 0.2250 I1 0.66 M3F11.2 1.5000 0.7500 0.3750 0.1875 I2 0.66 M3F11.3 1.4000 0.7000 0.3500 0.1750 P1 0.66 M3F11.4 0.5000 0.2500 0.1250 0.0625 O1 0.66 M3F11.5 0.5000 0.2500 0.1250 0.0625 I6 0.66 M3F11.6 1.2000 0.6000 0.3000 0.1500 P3 0.66 M3F12.1 1.8000 0.9000 0.4500 0.2250 I1 0.66 M4F12.2 1.5000 0.7500 0.3750 0.1875 I2 0.66 M4F12.3 1.4000 0.7000 0.3500 0.1750 P1 0.66 M4F12.4 0.5000 0.2500 0.1250 0.0625 O1 0.66 M4F12.5 0.5000 0.2500 0.1250 0.0625 I6 0.66 M4F12.6 1.4000 0.7000 0.3500 0.1750 P3 0.66 M4F13.1 1.5000 0.7500 0.3750 0.1875 I4 0.90 M4F13.2 1.5000 0.7500 0.3750 0.1875 I5 0.90 M4F13.3 1.0000 0.5000 0.2500 0.1250 P2 0.66 M4F13.4 0.5000 0.2500 0.1250 0.0625 O2 0.66 M4F13.5 0.5000 0.2500 0.1250 0.0625 I7 0.66 M4F13.6 1.4000 0.7000 0.3500 0.1750 P3 0.66 M4F14 1.2000 0.6000 0.3000 0.1500 P7 0.10 M4F15.1 0.5000 0.2500 0.1250 0.0625 P7 0.10 M4F15.2 0.8000 0.4000 0.2000 0.1000 O12 0.07 M4F16.1 0.5000 0.2500 0.1250 0.0625 O4 0.40 M4F16.2 0.5000 0.2500 0.1250 0.0625 I8 0.40 M4F16.3 0.8000 0.4000 0.2000 0.1000 P4 0.25 M4F16.4 0.6000 0.3000 0.1500 0.0750 O8 0.10 M4F16.5 0.6000 0.3000 0.1500 0.0750 I13 0.10 M4F17 1.0000 0.5000 0.2500 0.1250 P7 0.10 M5F18.1 0.8000 0.4000 0.2000 0.1000 P4 0.25 M5F18.2 1.9000 0.9500 0.4750 0.2375 I9 0.25 M5F18.3 0.5000 0.2500 0.1250 0.0625 O8 0.10 M5F18.4 0.5000 0.2500 0.1250 0.0625 I13 0.10 M5F18.5 1.5000 0.7500 0.3750 0.1875 P7 0.10 M5
Table 30 WACSS Failure Probability Table

348
The example Failure Probability Table demonstrated in Table 30 serves as an
illustration to the dissertation model in Chapter V.E.3.b and process Step 5. Action 5.

349
Failure ID Object ID Execution Prob Pe
Conditional Intermittent
Failure Prob Pf x10–5
Conditional Partial Failure
Prob Pf x10–5
Conditional Complete Failure
Prob Pf x10–5
Conditional Cataclysmic
Failure Prob Pf x10–5
Malfunction ID
F1 O3 0.40 1.0000 0.5000 0.2500 0.1250 M1F2 P3 0.66 1.3200 0.6600 0.3300 0.1650 M1F3 P5 0.25 0.2000 0.1000 0.0500 0.0250 M2F4.1 I2 0.66 0.9900 0.4950 0.2475 0.1238 M2F4.2 P1 0.66 0.6600 0.3300 0.1650 0.0825 M2F4.3 O1 0.66 0.3300 0.1650 0.0825 0.0413 M2F4.4 I6 0.25 0.1250 0.0625 0.0313 0.0156 M2F4.5 P3 0.66 0.7920 0.3960 0.1980 0.0990 M2F5.1 I1 0.66 1.1880 0.5940 0.2970 0.1485 M2F5.2 P1 0.66 0.6600 0.3300 0.1650 0.0825 M2F5.3 O1 0.66 0.3300 0.1650 0.0825 0.0413 M2F5.4 I6 0.25 0.1250 0.0625 0.0313 0.0156 M2F5.5 P3 0.66 0.7920 0.3960 0.1980 0.0990 M2F6.1 O4 0.40 0.2000 0.1000 0.0500 0.0250 M2F6.2 I8 0.40 0.2000 0.1000 0.0500 0.0250 M2F6.3 P4 0.25 0.1250 0.0625 0.0313 0.0156 M2F6.4 O6 0.25 0.1250 0.0625 0.0313 0.0156 M2F6.5 I11 0.25 0.1250 0.0625 0.0313 0.0156 M2F6.6 O5 0.10 0.0500 0.0250 0.0125 0.0063 M2F6.7 I10 0.10 0.0500 0.0250 0.0125 0.0063 M2F7 O10 0.10 0.0800 0.0400 0.0200 0.0100 M2F8 P5 0.25 0.2500 0.1250 0.0625 0.0313 M3F9 O10 0.10 0.0800 0.0400 0.0200 0.0100 M3F10 P7 0.10 0.1200 0.0600 0.0300 0.0150 M3F11.1 I1 0.66 1.1880 0.5940 0.2970 0.1485 M3F11.2 I2 0.66 0.9900 0.4950 0.2475 0.1238 M3F11.3 P1 0.66 0.9240 0.4620 0.2310 0.1155 M3F11.4 O1 0.66 0.3300 0.1650 0.0825 0.0413 M3F11.5 I6 0.66 0.3300 0.1650 0.0825 0.0413 M3F11.6 P3 0.66 0.7920 0.3960 0.1980 0.0990 M3F12.1 I1 0.66 1.1880 0.5940 0.2970 0.1485 M4F12.2 I2 0.66 0.9900 0.4950 0.2475 0.1238 M4F12.3 P1 0.66 0.9240 0.4620 0.2310 0.1155 M4F12.4 O1 0.66 0.3300 0.1650 0.0825 0.0413 M4F12.5 I6 0.66 0.3300 0.1650 0.0825 0.0413 M4F12.6 P3 0.66 0.9240 0.4620 0.2310 0.1155 M4F13.1 I4 0.90 1.3500 0.6750 0.3375 0.1688 M4F13.2 I5 0.90 1.3500 0.6750 0.3375 0.1688 M4F13.3 P2 0.66 0.6600 0.3300 0.1650 0.0825 M4F13.4 O2 0.66 0.3300 0.1650 0.0825 0.0413 M4F13.5 I7 0.66 0.3300 0.1650 0.0825 0.0413 M4F13.6 P3 0.66 0.9240 0.4620 0.2310 0.1155 M4F14 P7 0.10 0.1200 0.0600 0.0300 0.0150 M4F15.1 P7 0.10 0.0500 0.0250 0.0125 0.0063 M4F15.2 O12 0.07 0.0560 0.0280 0.0140 0.0070 M4F16.1 O4 0.40 0.2000 0.1000 0.0500 0.0250 M4F16.2 I8 0.40 0.2000 0.1000 0.0500 0.0250 M4F16.3 P4 0.25 0.2000 0.1000 0.0500 0.0250 M4F16.4 O8 0.10 0.0600 0.0300 0.0150 0.0075 M4F16.5 I13 0.10 0.0600 0.0300 0.0150 0.0075 M4F17 P7 0.10 0.1000 0.0500 0.0250 0.0125 M5F18.1 P4 0.25 0.2000 0.1000 0.0500 0.0250 M5F18.2 I9 0.25 0.4750 0.2375 0.1188 0.0594 M5F18.3 O8 0.10 0.0500 0.0250 0.0125 0.0063 M5F18.4 I13 0.10 0.0500 0.0250 0.0125 0.0063 M5F18.5 P7 0.10 0.1500 0.0750 0.0375 0.0188 M5
Table 31 WACSS Conditional Failure Probability Table
The example Conditional Failure Probability demonstrated in Table 31 serves as
an illustration to the dissertation model in Chapter V.E.3.b and process Step 5. Action 4.

350
8. SYSTEM HAZARD FLOW AND PROBABILITY
Figure 24 WACSS M1 Malfunction Process Flow
F 11.
5
L 1
Airc
raft
Dat
a-B
us
I 2 I 3 I 1
O1
I 6
I 5 I 4 O
2 I 7
O3
I 8 O
4
I 9 O5
I 10
O6
O7
O8
I 11
I 12
I 13
O9
O10
O11
O12
O13
I 14
I 15
Wea
pon
and
Wea
pon’
s R
ack
Airc
raft
(non
-fli
ght a
nd fl
ight
da
ta)
Use
r to
Syst
em In
put
Wea
pon
Com
man
d La
unch
Dis
play
P 6
F n –
Fai
lure
I n
– In
put
L n –
Lim
it O
n – O
utpu
t P n
– P
roce
ss
F 11.
1 F 12.
1 F 5
.1
F 11.
2 F 12.
2 F 1
1.3
F 12.
3
F 13.
1 F 1
3.2
F 13.
3
F 13.
4 F 1
3.5
F 11.
4 F 12.
4 F 5
.4
F 4.4
F 12.
5
F 11.
6 F 1
2.6 F 1
3.6
F 1
F 16.
1 F 1
6.2 F 1
6.3 F 6
.3
F 18.
1
F 18.
2
F 6.4 F 6
.5
F 8 F 3
F 9
F 16.
4 F 18.
3
F 16.
5 F 18.
4 F 1
5.1 F
17
F 10
F 18.
5 F 14
F 15.
2
P 5 P 7
P 4
P 3
P 2
P 1
F 7
F 4.1
F 5.2 F 4
.2
F 5.3 F 4
.3
F 5.5
F 4.5 F 6
.1
F 6.2
F 2
Sys
tem
Pro
cess
es, F
unct
ions
, or O
bjec
ts
Syst
em F
ailu
res
Inpu
t / O
utpu
t Lim
its
Dire
ctio
n of
Sys
tem
Pro
cess
Flo
w
F 6.6
F 6
.7
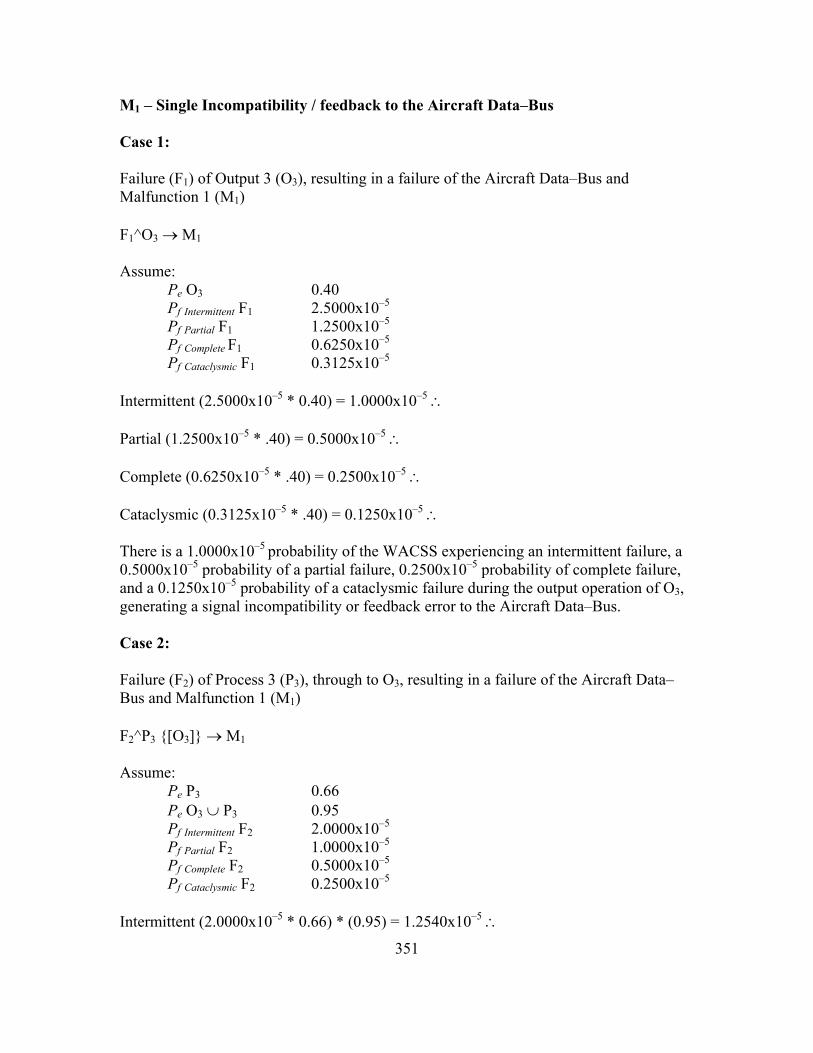
351
M1 – Single Incompatibility / feedback to the Aircraft Data–Bus Case 1: Failure (F1) of Output 3 (O3), resulting in a failure of the Aircraft Data–Bus and Malfunction 1 (M1) F1^O3 → M1
Assume:
Pe O3 0.40 Pf Intermittent F1 2.5000x10⁻⁵
Pf Partial F1 1.2500x10⁻⁵
Pf Complete F1 0.6250x10⁻⁵ Pf Cataclysmic F1 0.3125x10⁻⁵
Intermittent (2.5000x10–5 * 0.40) = 1.0000x10⁻⁵ ∴ Partial (1.2500x10–5 * .40) = 0.5000x10⁻⁵ ∴ Complete (0.6250x10–5 * .40) = 0.2500x10⁻⁵ ∴ Cataclysmic (0.3125x10–5 * .40) = 0.1250x10⁻⁵ ∴ There is a 1.0000x10⁻⁵ probability of the WACSS experiencing an intermittent failure, a 0.5000x10⁻⁵ probability of a partial failure, 0.2500x10⁻⁵ probability of complete failure, and a 0.1250x10⁻⁵ probability of a cataclysmic failure during the output operation of O3, generating a signal incompatibility or feedback error to the Aircraft Data–Bus. Case 2: Failure (F2) of Process 3 (P3), through to O3, resulting in a failure of the Aircraft Data–Bus and Malfunction 1 (M1) F2^P3 {[O3]} → M1 Assume:
Pe P3 0.66 Pe O3 ∪ P3 0.95 Pf Intermittent F2 2.0000x10⁻⁵
Pf Partial F2 1.0000x10⁻⁵
Pf Complete F2 0.5000x10⁻⁵ Pf Cataclysmic F2 0.2500x10⁻⁵
Intermittent (2.0000x10–5 * 0.66) * (0.95) = 1.2540x10⁻⁵ ∴
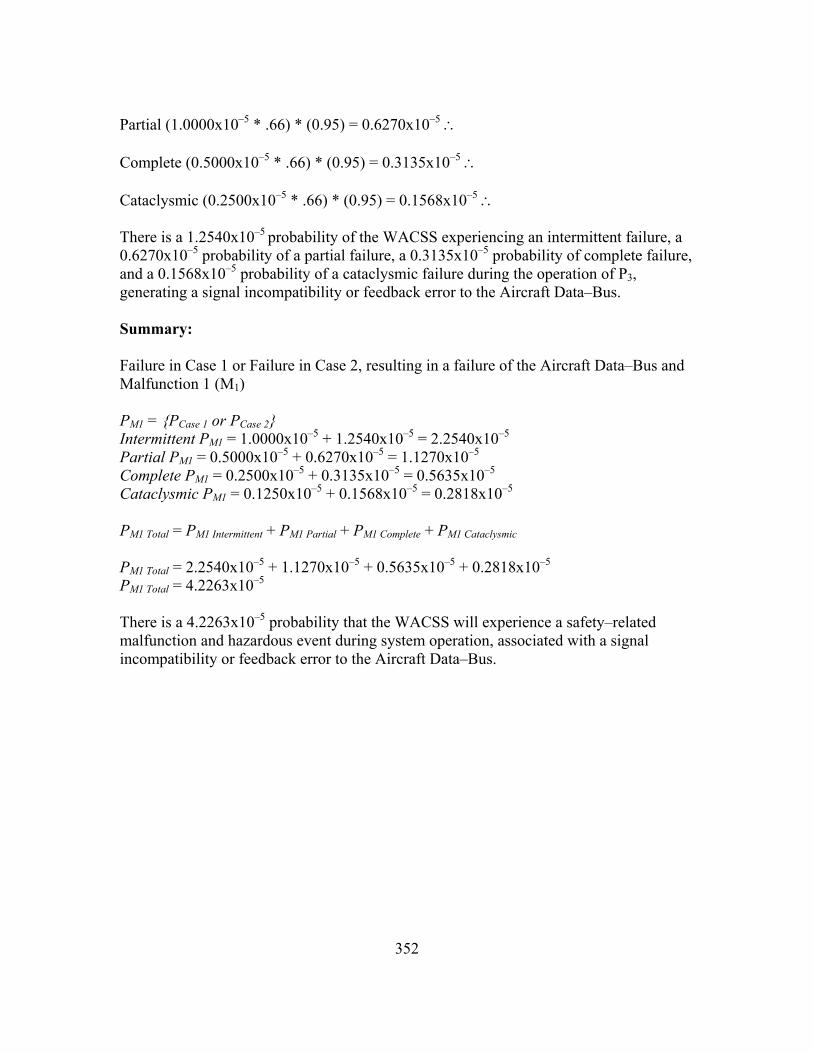
352
Partial (1.0000x10–5 * .66) * (0.95) = 0.6270x10⁻⁵ ∴ Complete (0.5000x10–5 * .66) * (0.95) = 0.3135x10⁻⁵ ∴ Cataclysmic (0.2500x10–5 * .66) * (0.95) = 0.1568x10⁻⁵ ∴ There is a 1.2540x10⁻⁵ probability of the WACSS experiencing an intermittent failure, a 0.6270x10⁻⁵ probability of a partial failure, a 0.3135x10⁻⁵ probability of complete failure, and a 0.1568x10⁻⁵ probability of a cataclysmic failure during the operation of P3, generating a signal incompatibility or feedback error to the Aircraft Data–Bus. Summary: Failure in Case 1 or Failure in Case 2, resulting in a failure of the Aircraft Data–Bus and Malfunction 1 (M1) PM1 = {PCase 1 or PCase 2} Intermittent PM1 = 1.0000x10⁻⁵ + 1.2540x10–5 = 2.2540x10⁻⁵ Partial PM1 = 0.5000x10⁻⁵ + 0.6270x10–5 = 1.1270x10⁻⁵ Complete PM1 = 0.2500x10⁻⁵ + 0.3135x10–5 = 0.5635x10⁻⁵ Cataclysmic PM1 = 0.1250x10⁻⁵ + 0.1568x10–5 = 0.2818x10⁻⁵ PM1 Total = PM1 Intermittent + PM1 Partial + PM1 Complete + PM1 Cataclysmic PM1 Total = 2.2540x10⁻⁵ + 1.1270x10⁻⁵ + 0.5635x10⁻⁵ + 0.2818x10⁻⁵ PM1 Total = 4.2263x10⁻⁵
There is a 4.2263x10⁻⁵ probability that the WACSS will experience a safety–related malfunction and hazardous event during system operation, associated with a signal incompatibility or feedback error to the Aircraft Data–Bus.

353
Figure 25 WACSS M2 Malfunction Process Flow
F 11.
5
L 1
Airc
raft
Dat
a-B
us
I 2 I 3 I 1
O1
I 6
I 5 I 4 O
2
I 7
O3
I 8 O
4
I 9 O5
I 10
O6
O7
O8
I 11
I 12
I 13
O9
O10
O11
O12
O13
I 14
I 15
Wea
pon
and
Wea
pon’
s R
ack
Airc
raft
(non
-fli
ght a
nd fl
ight
da
ta)
Use
r to
Syst
em In
put
Wea
pon
Com
man
d La
unch
Dis
play
P 6
F 11.
1 F 12.
1 F 5
.1
F 11.
2 F 12.
2 F 1
1.3
F 12.
3
F 13.
1 F 1
3.2
F 13.
3
F 13.
4 F 1
3.5
F 11.
4 F 12.
4 F 5
.4
F 4.4
F 12.
5
F 11.
6 F 1
2.6 F 1
3.6
F 1
F 16.
1 F 1
6.2 F 1
6.3 F 6
.3
F 18.
1
F 18.
2
F 6.4 F 6
.5
F 8 F 3
F 9
F 16.
4 F 18.
3
F 16.
5 F 18.
4 F 1
5.1 F
17
F 10
F 18.
5 F 14
F 15.
2
P 5 P 7
P 4
P 3
P 2
P 1
F 7
F 4.1
F 5.2 F 4
.2
F 5.3 F 4
.3
F 6.1
F 6.2
F 2 F
4.5
F 5.5
Sys
tem
Pro
cess
es, F
unct
ions
, or O
bjec
ts
Syst
em F
ailu
res
Inpu
t / O
utpu
t Lim
its
Dire
ctio
n of
Sys
tem
Pro
cess
Flo
w
F n –
Fai
lure
I n
– In
put
L n –
Lim
it O
n – O
utpu
t P n
– P
roce
ss
F 6.6
F 6
.7

354
M2 – Weapon fusing to detonate too early after weapon’s release Case 1: Failure (F3) of Process 5 (P5), through O10, resulting in a failure of weapon fusing and Malfunction 2 (M2) F3^P5 {[O10]} → M2 Assume:
Pe P5 0.25 Pe O10 ∪ P5 0.95 Pf Intermittent F3 0.8000x10⁻⁵
Pf Partial F3 0.4000x10⁻⁵
Pf Complete F3 0.2000x10⁻⁵ Pf Cataclysmic F3 0.1000x10⁻⁵
Intermittent (0.8000x10–5 * 0.25) * (0.95) = 0.1900x10⁻⁵ ∴ Partial (0.4000x10–5 * .25) * (0.95) = 0.0950x10⁻⁵ ∴ Complete (0.2000x10–5 * .25) * (0.95) = 0.0475x10⁻⁵ ∴ Cataclysmic (0.1000x10–5 * .25) * (0.95) = 0.0238x10⁻⁵ ∴ There is a 0.1900x10⁻⁵ probability of the WACSS experiencing an intermittent failure, a 0.0950x10⁻⁵ probability of a partial failure, 0.0475x10⁻⁵ probability of complete failure, and a 0.0238x10⁻⁵ probability of a cataclysmic failure during the output operation of P5 (The Weapon Configuration Change Processor), causing the weapon to fuse and detonate too early after weapon release Case 2: Failure (F4.1) of Input 2 (I2), and/or Failure (F4.2) of Process 1 (P1), and/or Failure (F4.3) of Output 1 (O1), and/or Failure (F4.4) of Input 6 (I6), and/or Failure (F4.5) of Process 3 (P3), through to O4, I8, P4, O6, I11, P5, and O10, resulting in a failure of weapon fusing and Malfunction 2 (M2) ( F4.1^I2 {[P1, O1, I6, P3]} or F4.2^P1 {[O1, I6, P3]} or F4.3^O1 {[I6, P3]} or F4.4^I6 {[P3]} or F4.5^P3 ) {[O4, I8, P4, O6, I11, P5, O10]} → M2

355
Assume: Pe I2 0.66 Pe P1 0.66 Pe O1 0.66 Pe I6 0.25 Pe P3 0.66 ∑Pe {O4, I8, P4, O6, I11, P5, O10} ∪ (I2, P1, O1, I6, P3) 0.6983 ∑Pe {P1, O1, I6, P3} ∪ I2 0.8145 ∑Pe {O1, I6, P3} ∪ P1 0.8574 ∑Pe {I6, P3} ∪ O1 0.9025 Pe P3 ∪ I6 0.95 Pf Intermittent F4.1 1.5000x10⁻⁵
Pf Partial F4.1 0.7500x10⁻⁵
Pf Complete F4.1 0.3750x10⁻⁵ Pf Cataclysmic F4.1 0.1875x10⁻⁵ Pf Intermittent F4.2 1.0000x10⁻⁵
Pf Partial F4.2 0.5000x10⁻⁵
Pf Complete F4.2 0.2500x10⁻⁵ Pf Cataclysmic F4.2 0.1250x10⁻⁵ Pf Intermittent F4.3 0.5000x10⁻⁵
Pf Partial F4.3 0.2500x10⁻⁵
Pf Complete F4.3 0.1250x10⁻⁵ Pf Cataclysmic F4.3 0.0625x10⁻⁵ Pf Intermittent F4.4 0.5000x10⁻⁵
Pf Partial F4.4 0.2500x10⁻⁵
Pf Complete F4.4 0.1250x10⁻⁵ Pf Cataclysmic F4.4 0.0625x10⁻⁵ Pf Intermittent F4.5 1.2000x10⁻⁵
Pf Partial F4.5 0.6000x10⁻⁵
Pf Complete F4.5 0.3000x10⁻⁵ Pf Cataclysmic F4.5 0.1500x10⁻⁵
Intermittent (((1.5000x10–5 * 0.66) * (0.8145)) + ((1.0000x10–5 * 0.66) * (0.8574)) + ((0.5000x10–5 * 0.66) * (0.9025)) + ((0.5000x10–5 * 0.25) * (0.95)) + (1.2000x10–5 * 0.66)) * (0.6983) = (0.8064x10⁻⁵ + 0.5659x10⁻⁵ + 0.2978x10⁻⁵ + 0.1188x10⁻⁵ + 0.7920x10–5) * (0.6983) = 1.8022x10⁻⁵ ∴ Partial (((0.7500x10–5 * 0.66) * (0.8145)) + ((0.5000x10–5 * 0.66) * (0.8574)) + ((0.2500x10–5 * 0.66) * (0.9025)) + ((0.2500x10–5 * 0.25) * (0.95)) + (0.6000x10–5 * 0.66)) * (0.6983) = (0.4032x10⁻⁵ + 0.2821x10⁻⁵ + 0.1489x10⁻⁵ + 0.0594x10⁻⁵ + 0.3960x10–5) * (0.6983) = 0.9005x10⁻⁵ ∴ Complete (((0.3750x10–5 * 0.66) * (0.8145)) + ((0.2500x10–5 * 0.66) * (0.8574)) + ((0.1250x10–5 * 0.66) * (0.9025)) + ((0.1250x10–5 * 0.25) * (0.95)) + (0.3000x10–5 * 0.66)) * (0.6983) = (0.2016x10⁻⁵ + 0.1415x10⁻⁵ + 0.0745x10⁻⁵ + 0.0297x10⁻⁵ + 0.1980x10–5) * (0.6983) = 0.4506x10⁻⁵ ∴ Cataclysmic (((0.1875x10–5 * 0.66) * (0.8145)) + ((0.1250x10–5 * 0.66) * (0.8574)) + ((0.0625x10–5 * 0.66) * (0.9025)) + ((0.0625x10–5 * 0.25) * (0.95)) + (0.1500x10–5 * 0.66)) * (0.6983) = (0.1008x10⁻⁵ + 0.0707x10⁻⁵ + 0.0372x10⁻⁵ + 0.0148x10⁻⁵ + 0.0990x10–5) * (0.6983) = 0.2252x10⁻⁵ ∴

356
There is a 1.8022x10⁻⁵ probability of the WACSS experiencing an intermittent failure, a 0.9005x10⁻⁵ probability of a partial failure, a 0.4506x10⁻⁵ probability of complete failure, and a 0.2252x10⁻⁵ probability of a cataclysmic failure during the operation of I2, P1, O1, I6, and/or P3 as a failure in the weapon’s signals regarding the current status of the weapon, causing the weapon to fuse and detonate too early after weapon release Case 3: Failure (F5.1) of Input 1 (I1), and/or Failure (F5.2) of Process 1 (P1), and/or Failure (F5.3) of Output 1 (O1), and/or Failure (F5.4) of Input 6 (I6), and/or Failure (F5.5) of Process 3 (P3), through to O4, I8, P4, O6, I11, P5, and O10, resulting in a failure of weapon fusing and Malfunction 2 (M2) ( F5.1^I1 {[P1, O1, I6, P3]} or F5.2^P1 {[O1, I6, P3]} or F5.3^O1 {[I6, P3]} or F5.4^I6 {[P3]} or F5.5^P3 ) {[O4, I8, P4, O6, I11, P5, O10]} → M2 Assume: Pe I1 0.66 Pe P1 0.66 Pe O1 0.66 Pe I6 0.25 Pe P3 0.66 ∑Pe {O4, I8, P4, O6, I11, P5, O10} ∪ (I1, P1,
O1, I6, P3) 0.6983 ∑Pe {P1, O1, I6, P3} ∪ I2 0.8145 ∑Pe {O1, I6, P3} ∪ P1 0.8574 ∑Pe {I6, P3} ∪ O1 0.9025 Pe P3 ∪ I6 0.95 Pf Intermittent F5.1 1.5000x10⁻⁵
Pf Partial F5.1 0.7500x10⁻⁵
Pf Complete F5.1 0.3750x10⁻⁵ Pf Cataclysmic F5.1 0.1875x10⁻⁵ Pf Intermittent F5.2 1.0000x10⁻⁵
Pf Partial F5.2 0.5000x10⁻⁵
Pf Complete F5.2 0.2500x10⁻⁵ Pf Cataclysmic F5.2 0.1250x10⁻⁵ Pf Intermittent F5.3 0.5000x10⁻⁵
Pf Partial F5.3 0.2500x10⁻⁵
Pf Complete F5.3 0.1250x10⁻⁵ Pf Cataclysmic F5.3 0.0625x10⁻⁵ Pf Intermittent F5.4 0.5000x10⁻⁵
Pf Partial F5.4 0.2500x10⁻⁵
Pf Complete F5.4 0.1250x10⁻⁵ Pf Cataclysmic F5.4 0.0625x10⁻⁵ Pf Intermittent F5.5 1.2000x10⁻⁵
Pf Partial F5.5 0.6000x10⁻⁵
Pf Complete F5.5 0.3000x10⁻⁵ Pf Cataclysmic F5.5 0.1500x10⁻⁵
Intermittent (((1.5000x10–5 * 0.66) * (0.8145)) + ((1.0000x10–5 * 0.66) * (0.8574)) + ((0.5000x10–5 * 0.66) * (0.9025)) + ((0.5000x10–5 * 0.25) * (0.95)) + (1.2000x10–5 * 0.66)) * (0.6983) = (0.8064x10⁻⁵ + 0.5659x10⁻⁵ + 0.2978x10⁻⁵ + 0.1188x10⁻⁵ + 0.7920x10–5) * (0.6983) = 1.8022x10⁻⁵ ∴ Partial (((0.7500x10–5 * 0.66) * (0.8145)) + ((0.5000x10–5 * 0.66) * (0.8574)) + ((0.2500x10–5 * 0.66) * (0.9025)) + ((0.2500x10–5 * 0.25) * (0.95)) + (0.6000x10–5 * 0.66)) * (0.6983) =

357
(0.4032x10⁻⁵ + 0.2821x10⁻⁵ + 0.1489x10⁻⁵ + 0.0594x10⁻⁵ + 0.3960x10–5) * (0.6983) = 0.9005x10⁻⁵ ∴ Complete (((0.3750x10–5 * 0.66) * (0.8145)) + ((0.2500x10–5 * 0.66) * (0.8574)) + ((0.1250x10–5 * 0.66) * (0.9025)) + ((0.1250x10–5 * 0.25) * (0.95)) + (0.3000x10–5 * 0.66)) * (0.6983) = (0.2016x10⁻⁵ + 0.1415x10⁻⁵ + 0.0745x10⁻⁵ + 0.0297x10⁻⁵ + 0.1980x10–5) * (0.6983) = 0.4506x10⁻⁵ ∴ Cataclysmic (((0.1875x10–5 * 0.66) * (0.8145)) + ((0.1250x10–5 * 0.66) * (0.8574)) + ((0.0625x10–5 * 0.66) * (0.9025)) + ((0.0625x10–5 * 0.25) * (0.95)) + (0.1500x10–5 * 0.66)) * (0.6983) = (0.1008x10⁻⁵ + 0.0707x10⁻⁵ + 0.0372x10⁻⁵ + 0.0148x10⁻⁵ + 0.0990x10–5) * (0.6983) = 0.2252x10⁻⁵ ∴ There is a 1.8022x10⁻⁵ probability of the WACSS experiencing an intermittent failure, a 0.9005x10⁻⁵ probability of a partial failure, a 0.4506x10⁻⁵ probability of complete failure, and a 0.2252x10⁻⁵ probability of a cataclysmic failure during the operation of I1, P1, O1, I6, and/or P3 as a failure in the weapon’s signals regarding the configuration of the weapon, causing the weapon to fuse and detonate too early after weapon release Case 4: Failure (F6.1) of Output 4 (O4), and/or Failure (F6.2) of Input 8 (I8), and/or Failure (F6.3) of Process 4 (P4), and/or Failure (F6.4) of Output 6 (O6), and/or Failure (F6.5) of Input 11 (I11), through to P5, and O10, resulting in a failure of weapon fusing and Malfunction 2 (M2) ( F6.1^O4 {[I8, P4, O6, I11]} or F6.2^I8 {[P4, O6, I11]} or F6.3^P4 {[O6, I11]} or F6.4^O6 {[I11]} or F6.5^I11 ) {[P5, O10]} → M2 Note P4 includes the Loop Process Flow from O5 through I10 and back into P3, triggered by failure type 6. For the purpose of this example, it shall be assumed that the loop cycle shall occur 100 times during the examination period.

358
Assume: Pe O4 0.40 Pe I8 0.40 Pe P4 0.25 Pe O6 0.25 Pe I11 0.25 ∑Pe {O5, I10} Loop Case 0.10 ∑Pe {P5, O10} ∪ (O4, I8, P4, O6, I11) 0.9025 ∑Pe {I8, P4, O6, I11} ∪ O4 0.8145 ∑Pe {P4, O6, I11} ∪ I8 0.8574 ∑Pe {O6, I11} ∪ P4 0.9025 Pe I11 ∪ O6 0.95 Pf Intermittent F6.1 0.5000x10⁻⁵
Pf Partial F6.1 0.2500x10⁻⁵
Pf Complete F6.1 0.1250x10⁻⁵ Pf Cataclysmic F6.1 0.0625x10⁻⁵ Pf Intermittent F6.2 0.5000x10⁻⁵
Pf Partial F6.2 0.2500x10⁻⁵
Pf Complete F6.2 0.1250x10⁻⁵ Pf Cataclysmic F6.2 0.0625x10⁻⁵
Pf Intermittent F6.3 0.5000x10⁻⁵
Pf Partial F6.3 0.2500x10⁻⁵
Pf Complete F6.3 0.1250x10⁻⁵
Pf Cataclysmic F6.3 0.0625x10⁻⁵ Pf Intermittent F6.4 0.5000x10⁻⁵
Pf Partial F6.4 0.2500x10⁻⁵
Pf Complete F6.4 0.1250x10⁻⁵ Pf Cataclysmic F6.4 0.0625x10⁻⁵ Pf Intermittent F6.5 0.5000x10⁻⁵
Pf Partial F6.5 0.2500x10⁻⁵
Pf Complete F6.5 0.1250x10⁻⁵ Pf Cataclysmic F6.5 0.0625x10⁻⁵
Pf Intermittent F6.6 0.5000x10⁻⁵
Pf Partial F6.6 0.2500x10⁻⁵
Pf Complete F6.6 0.1250x10⁻⁵ Pf Cataclysmic F6.6 0.0625x10⁻⁵
Pf Intermittent F6.7 0.5000x10⁻⁵
Pf Partial F6.7 0.2500x10⁻⁵
Pf Complete F6.7 0.1250x10⁻⁵ Pf Cataclysmic F6.7 0.0625x10⁻⁵
Loop Case Intermittent= 1 – (1 – ((0.5000x10–5 * 0.10) + (0.5000x10–5 * 0.10)))100 =
1.0000 x 10⁻⁵ Loop Case Partial = 1 – (1 – ((0.5000x10–5 * 0.10) + (0.5000x10–5 * 0.10)))100 =
0.5000 x 10⁻⁵ Loop Case Complete = 1 – (1 – ((0.5000x10–5 * 0.10) + (0.5000x10–5 * 0.10)))100 =
0.2500 x 10⁻⁵ Loop Case Cataclysmic = 1 – (1 – ((0.5000x10–5 * 0.10) + (0.5000x10–5 * 0.10)))100 =
0.1250 x 10⁻⁵ Intermittent (((0.5000x10–5 * 0.40) * (0.8145)) + ((0.5000x10–5 * 0.40) * (0.8574)) + ((0.5000x10–5 * 0.25) * (0.9025)) + ((0.5000x10–5 * 0.25) * (0.95)) + (0.5000x10–5 * 0.25)) * (0.9025) + 1.0000 x 10-5= (0.1629x10⁻⁵ + 0.1715x10⁻⁵ + 0.1128x10⁻⁵ + 0.1188x10⁻⁵ + 0.1250x10–5) * (0.9025) = 1.6236x10⁻⁵ ∴ Partial (((0.2500x10–5 * 0.40) * (0.8145)) + ((0.2500x10–5 * 0.40) * (0.8574)) + ((0.2500x10–5 * 0.25) * (0.9025)) + ((0.2500x10–5 * 0.25) * (0.95)) + (0.2500x10–5 * 0.25)) * (0.9025) + 0.5000 x 10-5=

359
(0.0815x10⁻⁵ + 0.0857x10⁻⁵ + 0.0564x10⁻⁵ + 0.0594x10⁻⁵ + 0.0625x10–5) * (0.9025) = 0.8118x10⁻⁵ ∴ Complete (((0.1250x10–5 * 0.40) * (0.8145)) + ((0.1250x10–5 * 0.40) * (0.8574)) + ((0.1250x10–5 * 0.25) * (0.9025)) + ((0.1250x10–5 * 0.25) * (0.95)) + (0.1250x10–5 * 0.25)) * (0.9025) + 0.2500 x 10-5= (0.0407x10⁻⁵ + 0.0429x10⁻⁵ + 0.0282x10⁻⁵ + 0.0297x10⁻⁵ + 0.0313x10–5) * (0.9025) = 0.4060x10⁻⁵ ∴ Cataclysmic (((0.0625x10–5 * 0.40) * (0.8145)) + ((0.0625x10–5 * 0.40) * (0.8574)) + ((0.0625x10–5 * 0.25) * (0.9025)) + ((0.0625x10–5 * 0.25) * (0.95)) + (0.0625x10–5 * 0.25)) * (0.9025) + 0.1250 x 10-5= (0.0204x10⁻⁵ + 0.0214x10⁻⁵ + 0.0141x10⁻⁵ + 0.0148x10⁻⁵ + 0.0156x10–5) * (0.9025) = 0.2029x10⁻⁵ ∴ There is a 1.6236x10⁻⁵ probability of the WACSS experiencing an intermittent failure, a 0.8118x10⁻⁵ probability of a partial failure, a 0.4060x10⁻⁵ probability of complete failure, and a 0.2029x10⁻⁵ probability of a cataclysmic failure during the operation of O4, I8, P4, O6, and/or I11 as a failure in system data signals transfer, causing the weapon to fuse and detonate too early after weapon release Case 5: Failure (F7) of Output 10 (O10) resulting in a failure of weapon fusing and Malfunction 2 (M2) F7^O10 → M2 Assume:
Pe O10 0.10 Pf Intermittent F7 0.8000x10⁻⁵
Pf Partial F7 0.4000x10⁻⁵
Pf Complete F7 0.2000x10⁻⁵ Pf Cataclysmic F7 0.1000x10⁻⁵
Intermittent (0.8000x10–5 * 0.10) = 0.0800x10⁻⁵ ∴ Partial (0.4000x10–5 * 0.10) = 0.0400x10⁻⁵ ∴ Complete (0.2000x10–5 * 0.10) = 0.0200x10⁻⁵ ∴ Cataclysmic (0.1000x10–5 * 0.10) = 0.0100x10⁻⁵ ∴

360
There is a 0.0800x10⁻⁵ probability of the WACSS experiencing an intermittent failure, a 0.0400x10⁻⁵ probability of a partial failure, a 0.0200x10⁻⁵ probability of complete failure, and a 0.0100x10⁻⁵ probability of a cataclysmic failure during the output operation of O10 as a failure / incompatibility in Weapon’s configuration signals, causing the weapon to fuse and detonate too early after weapon release Summary: Failure in Case 1, Case 2, Case 3, Case 4, or Case 5, resulting in the weapon fusing to detonate too early after weapon’s release and Malfunction 2 (M2) PM2 = {PCase 1 or PCase 2 or PCase 3 or PCase 4 or PCase 5} Intermittent PM2 = 0.1900x10⁻⁵ + 1.8022x10⁻⁵ + 1.8022x10⁻⁵ + 1.6236x10⁻⁵ 0.0800x10–5 = 5.4980x10⁻⁵ Partial PM2 = 0.0950x10⁻⁵ + 0.9055x10⁻⁵ + 0.9055x10⁻⁵ + 0.5118x10⁻⁵ + 0.0400x10–5 = 2.7578x10⁻⁵ Complete PM2 = 0.0475x10⁻⁵ + 0.4506x10⁻⁵ + 0.4506x10⁻⁵ + 0.4060x10⁻⁵ + 0.0200x10–5 = 1.3847x10⁻⁵ Cataclysmic PM2 = 0.0238x10⁻⁵ + 0.2252x10⁻⁵ + 0.2252x10⁻⁵ + 0.2029x10⁻⁵ + 0.0100x10–5 = 0.6871x10⁻⁵ PM2 Total = PM2 Intermittent + PM2 Partial + PM2 Complete + PM2 Cataclysmic PM2 Total = 5.4980x10⁻⁵ + 2.7578x10⁻⁵ + 1.3847x10⁻⁵ + 0.6871x10⁻⁵ PM2 Total = 10.3276x10⁻⁵
There is an 10.3276x10⁻⁵ probability that the WACSS will experience a safety–related malfunction and hazardous event during system operation, causing the weapon to fuse and detonate too early after weapon release

361
Figure 26 WACSS M3 Malfunction Process Flow
F 12.
2 F 1
2.1
F 12.
5 L 1
Airc
raft
Dat
a-B
us
I 2 I 3 I 1
O1
I 6
I 5 I 4 O
2
I 7
O3
I 8 O
4
I 9 O5
I 10
O6
O7
O8
I 11
I 12
I 13
O9
O10
O11
O12
O13
I 14
I 15
Wea
pon
and
Wea
pon’
s R
ack
Airc
raft
(non
-fli
ght a
nd fl
ight
da
ta)
Use
r to
Syst
em In
put
Wea
pon
Com
man
d La
unch
Dis
play
P 6
F n –
Fai
lure
I n
– In
put
L n –
Lim
it O
n – O
utpu
t P n
– P
roce
ss
F 5.1 F 1
3.1
F 13.
2 F 1
3.3
F 13.
4 F 1
3.5 F 5
.4
F 4.4
F 13.
6
F 1
F 16.
1 F 1
6.2 F 1
6.3 F 6
.3
F 18.
1
F 18.
2
F 6.4 F 6
.5
F 3
F 16.
4 F 18.
3
F 16.
5 F 18.
4 F 1
5.1 F
17
F 18.
5 F 14
F 15.
P 5 P 7
P 4
P 3
P 2
P 1
F 7
F 4.1
F 5.2 F 4
.2
F 5.3 F 4
.3
F 5.5
F 4.5 F 6
.1
F 6.2
F 2
F 8
F 9
F 10
F 11.
1 F 1
1.2
F 12.
3 F 1
1.5
F 11.
4 F 12.
4
F 12.
6 F 11.
6
F 11.
3
Sys
tem
Pro
cess
es, F
unct
ions
, or O
bjec
ts
Syst
em F
ailu
res
Inpu
t / O
utpu
t Lim
its
Dire
ctio
n of
Sys
tem
Pro
cess
Flo
w
F 6.6
F 6
.7

362
M3 – Inability to fuse weapon – Dead Fuse Case 1: Failure (F8) of Process 5 (P5), through O10, resulting in an inability to fuse the weapon – Dead Fuse, and Malfunction 3 (M3) F8^P5 {[O10]} → M3 Assume:
Pe P5 0.25 Pe O10 ∪ P5 0.95 Pf Intermittent F8 1.0000x10⁻⁵
Pf Partial F8 0.5000x10⁻⁵
Pf Complete F8 0.2500x10⁻⁵ Pf Cataclysmic F8 0.1250x10⁻⁵
Intermittent (1.0000x10–5 * 0.25) * (0.95) = 0.2375x10⁻⁵ ∴ Partial (0.5000x10–5 * .25) * (0.95) = 0.1188x10⁻⁵ ∴ Complete (0.2500x10–5 * .25) * (0.95) = 0.0594x10⁻⁵ ∴ Cataclysmic (0.1250x10–5 * .25) * (0.95) = 0.0297x10⁻⁵ ∴ There is a 0.2375x10⁻⁵ probability of the WACSS experiencing an intermittent failure, a 0.1188x10⁻⁵ probability of a partial failure, 0.0594x10⁻⁵ probability of complete failure, and a 0.0297x10⁻⁵ probability of a cataclysmic failure during the operation of P5 (The Weapon Configuration Change Processor), resulting in an inability to fuse the weapon – Dead Fuse Case 2: Failure (F9) of Output 10 (O10) resulting in an inability to fuse the weapon – Dead Fuse, and Malfunction 3 (M3) F9^O10 → M3 Assume:
Pe O10 0.10 Pf Intermittent F9 0.8000x10⁻⁵
Pf Partial F9 0.4000x10⁻⁵
Pf Complete F9 0.2000x10⁻⁵ Pf Cataclysmic F9 0.1000x10⁻⁵

363
Intermittent (0.8000x10–5 * 0.10) = 0.0800x10⁻⁵ ∴ Partial (0.4000x10–5 * .10) = 0.0400x10⁻⁵ ∴ Complete (0.2000x10–5 * .10) = 0.0200x10⁻⁵ ∴ Cataclysmic (0.1000x10–5 * .10) = 0.0100x10⁻⁵ ∴ There is a 0.0800x10⁻⁵ probability of the WACSS experiencing an intermittent failure, a 0.0400x10⁻⁵ probability of a partial failure, 0.0200x10⁻⁵ probability of complete failure, and a 0.0100x10⁻⁵ probability of a cataclysmic failure during the output operation of O10 , resulting in an inability to fuse the weapon – Dead Fuse Case 3: Failure (F10) of Process 7 (P7) resulting in an inability to fuse the weapon – Dead Fuse, and Malfunction 3 (M3) F10^P7 → M3 Assume:
Pe P7 0.10 Pf Intermittent F10 1.2000x10⁻⁵
Pf Partial F10 0.6000x10⁻⁵
Pf Complete F10 0.3000x10⁻⁵ Pf Cataclysmic F10 0.1500x10⁻⁵
Intermittent (1.2000x10–5 * 0.10) = 0.1200x10⁻⁵ ∴ Partial (0.6000x10–5 * .10) = 0.0600x10⁻⁵ ∴ Complete (0.3000x10–5 * .10) = 0.0300x10⁻⁵ ∴ Cataclysmic (0.1500x10–5 * .10) = 0.0150x10⁻⁵ ∴ There is a 0.1200x10⁻⁵ probability of the WACSS experiencing an intermittent failure, a 0.0600x10⁻⁵ probability of a partial failure, 0.0300x10⁻⁵ probability of complete failure, and a 0.0150x10⁻⁵ probability of a cataclysmic failure during the operation of P7, resulting in an inability to fuse the weapon – Dead Fuse Case 4: Failure (F11.1) of Input 1 (I1), and/or Failure (F11.2) of Input 2 (I2), and/or Failure (F11.3) of Process 1 (P1), and/or Failure (F11.4) of Output 1 (O1), and/or Failure (F11.5) of Input 6 (I6),

364
and/or Failure (F11.6) of Process 3 (P3), through O4, I8, P4, O6, I11, P5, and O10, resulting in an inability to fuse the weapon – Dead Fuse, and Malfunction 3 (M3) ( F11.1^I1 {[P1, O1, I6, P3]} or F11.2^I2 {[P1, O1, I6, P3]} or F11.3^P1 {[O1, I6, P3]} or F11.4^O1 {[I6, P3]} or F11.5^I6 {[P3]} or F11.6^P3) {[O4, I8, P4, O6, I11, P5, O10]} → M3 Assume: Pe I1 0.66 Pe I2 0.66 Pe P1 0.66 Pe O1 0.66 Pe I6 0.66 Pe P3 0.66 ∑Pe {O4, I8, P4, O6, I11, P5, O10} ∪ (I1, I2,
P1, O1, I6, P3) 0.6983 ∑Pe {P1, O1, I6, P3} ∪ I1 0.8145 ∑Pe {P1, O1, I6, P3} ∪ I2 0.8145 ∑Pe {O1, I6, P3} ∪ P1 0.8574 ∑Pe {I6, P3} ∪ O1 0.9025 Pe I6 ∪ P3 0.95 Pf Intermittent F11.1 1.8000x10⁻⁵
Pf Partial F11.1 0.9000x10⁻⁵
Pf Complete F11.1 0.4500x10⁻⁵ Pf Cataclysmic F11.1 0.2250x10⁻⁵ Pf Intermittent F11.2 1.5000x10⁻⁵
Pf Partial F11.2 0.7500x10⁻⁵
Pf Complete F11.2 0.3750x10⁻⁵ Pf Cataclysmic F11.2 0.1875x10⁻⁵ Pf Intermittent F11.3 1.4000x10⁻⁵
Pf Partial F11.3 0.7000x10⁻⁵
Pf Complete F11.3 0.3500x10⁻⁵
Pf Cataclysmic F11.3 0.1750x10⁻⁵ Pf Intermittent F11.4 0.5000x10⁻⁵
Pf Partial F11.4 0.2500x10⁻⁵
Pf Complete F11.4 0.1250x10⁻⁵ Pf Cataclysmic F11.4 0.0625x10⁻⁵ Pf Intermittent F11.5 0.5000x10⁻⁵
Pf Partial F11.5 0.2500x10⁻⁵
Pf Complete F11.5 0.1250x10⁻⁵ Pf Cataclysmic F11.5 0.0625x10⁻⁵
Pf Intermittent F11.6 1.2000x10⁻⁵
Pf Partial F11.6 0.6000x10⁻⁵
Pf Complete F11.6 0.3000x10⁻⁵ Pf Cataclysmic F11.6 0.1500x10⁻⁵
Intermittent (((1.8000x10–5 * 0.66) * (0.8145)) + ((1.5000x10–5 * 0.66) * (0.8145)) + ((1.4000x10–5 * 0.66) * (0.8574)) + ((0.5000x10–5 * 0.66) * (0.9025)) + (0.5000x10–5 * 0.66) * (0.95)) + (1.2000x10–5 * 0.66)) * (0.6983) = (0.9676x10⁻⁵ + 0.8064x10⁻⁵ + 0.7922x10⁻⁵ + 0.2978x10⁻⁵ + 0.3135x10⁻⁵ + 0.7920x10–5) * (0.6983) = 2.7719x10⁻⁵ ∴ Partial (((0.9000x10–5 * 0.66) * (0.8145)) + ((0.7500x10–5 * 0.66) * (0.8145)) + ((0.7000x10–5 * 0.66) * (0.8574)) + ((0.2500x10–5 * 0.66) * (0.9025)) + (0.2500x10–5 * 0.66) * (0.95)) + (0.6000x10–5 * 0.66)) * (0.6983) =
(0.4838x10⁻⁵ + 0.4032x10⁻⁵ + 0.3961x10⁻⁵ + 0.1489x10⁻⁵ + 0.1568x10⁻⁵ + 0.3960x10–5) * (0.6983) = 1.3860x10⁻⁵ ∴ Complete (((0.4500x10–5 * 0.66) * (0.8145)) + ((0.3750x10–5 * 0.66) * (0.8145)) + ((0.3500x10–5 * 0.66) * (0.8574)) + ((0.1250x10–5 * 0.66) * (0.9025)) + (0.1250x10–5 * 0.66) * (0.95)) + (0.3000x10–5 * 0.66)) * (0.6983) =

365
(0.2419x10⁻⁵ + 0.2016x10⁻⁵ + 0.1981x10⁻⁵ + 0.0745x10⁻⁵ + 0.0784x10⁻⁵ + 0.1980x10–5) * (0.6983) = 0.6930x10⁻⁵ ∴ Cataclysmic (((0.2250x10–5 * 0.66) * (0.8145)) + ((0.1875x10–5 * 0.66) * (0.8145)) + ((0.1750x10–5 * 0.66) * (0.8574)) + ((0.0625x10–5 * 0.66) * (0.9025)) + (0.0625x10–5 * 0.66) * (0.95)) + (0.1500x10–5 * 0.66)) * (0.6983) =
(0.1210x10⁻⁵ + 0.1008x10⁻⁵ + 0.0990x10⁻⁵ + 0.0372x10⁻⁵ + 0.0392x10⁻⁵ + 0.0990x10–5) * (0.6983) = 0.3465x10⁻⁵ ∴ There is a 2.7719x10⁻⁵ probability of the WACSS experiencing an intermittent failure, a 1.3860x10⁻⁵ probability of a partial failure, a 0.6930x10⁻⁵ probability of complete failure, and a 0.3465x10⁻⁵ probability of a cataclysmic failure during the operation of I1, I2, P1, O1, I6, and/or P3 as a failure in weapon’s signal regarding weapon’s configuration and status, resulting in an inability to fuse the weapon – Dead Fuse Summary: Failure in Case 1, Case 2, Case 3, or Case 4, resulting in the weapon fusing to detonate too early after weapon’s release and Malfunction 3 (M3) PM3 = {PCase 1 or PCase 2 or PCase 3 or PCase 4} Intermittent PM3 = 0.2375x10⁻⁵ + 0.0800x10⁻⁵ + 0.1200x10⁻⁵ + 2.7719x10–5 = 3.2094x10–
5 Partial PM3 = 0.1188x10⁻⁵ + 0.0400x10⁻⁵ + 0.0600x10⁻⁵ + 1.3860x10–5 = 1.6048x10⁻⁵ Complete PM3 = 0.0594x10⁻⁵ + 0.0200x10⁻⁵ + 0.0300x10⁻⁵ + 0.6930x10–5 = 0.8024x10⁻⁵ Cataclysmic PM3 = 0.0297x10⁻⁵ + 0.0100x10⁻⁵ + 0.0150x10⁻⁵ + 0.3465x10–5 = 0.4012x10⁻⁵ PM3 Total = PM3 Intermittent + PM3 Partial + PM3 Complete + PM3 Cataclysmic PM3 Total = 3.2094x10⁻⁵ + 1.6048x10⁻⁵ + 0.8024x10⁻⁵ + 0.4012x10⁻⁵ PM3 Total = 6.0178x10⁻⁵
There is a 6.0178x10⁻⁵ probability that the WACSS will experience a safety–related malfunction and hazardous event during system operation, resulting in an inability to fuse the weapon – Dead Fuse

366
Figure 27 WACSS M4 Malfunction Process Flow
F 11.
5
L 1
Airc
raft
Dat
a-B
us
I 2 I 3 I 1
O1
I 6
I 5 I 4 O
2
I 7
O3
I 8 O
4
I 9 O5
I 10
O6
O7
O8
I 11
I 12
I 13
O9
O10
O11
O12
O13
I 14
I 15
Wea
pon
and
Wea
pon’
s R
ack
Airc
raft
(non
-fli
ght a
nd
fligh
t dat
a)
Use
r to
Syst
em In
put
Wea
pon
Dis
play
P 6
Sys
tem
Pro
cess
es, F
unct
ions
, or O
bjec
ts
Syst
em F
ailu
res
Inpu
t / O
utpu
t Lim
its
Dire
ctio
n of
Sys
tem
Pro
cess
Flo
w
F n –
Fai
lure
I n
– In
put
L n –
Lim
it O
n – O
utpu
t P n
– P
roce
ss
F 11.
1 F 5.1
F 11.
2 F 1
1.3
F 13.
1 F 1
3.2
F 13.
3
F 13.
4 F 13.
5
F 11.
4 F 5
.4
F 4.4
F 11.
6
F 1
F 6.3
F 18.
1
F 18.
2
F 6.4 F 6
.5
F 8 F 3
F 9
F 18.
3 F 18.
4 F 1
7 F 1
0 F 1
8.5
F 15.
2
P 5 P 7
P 4
P 3
P 2
P 1
F 7
F 4.1
F 5.2 F 4
.2
F 5.3 F 4
.3
F 5.5
F 4.5 F 6
.1
F 6.2
F 2
F 12.
1 F 1
2.2
F 12.
3 F 1
2.4 F 1
2.5
F 12.
6 F 13.
6
F 16.
1 F 1
6.2 F 1
6.3
F 16.
4 F 16.
5 F 1
5.1
F 14
Com
man
d La
unch
F 6.6
F 6
.7
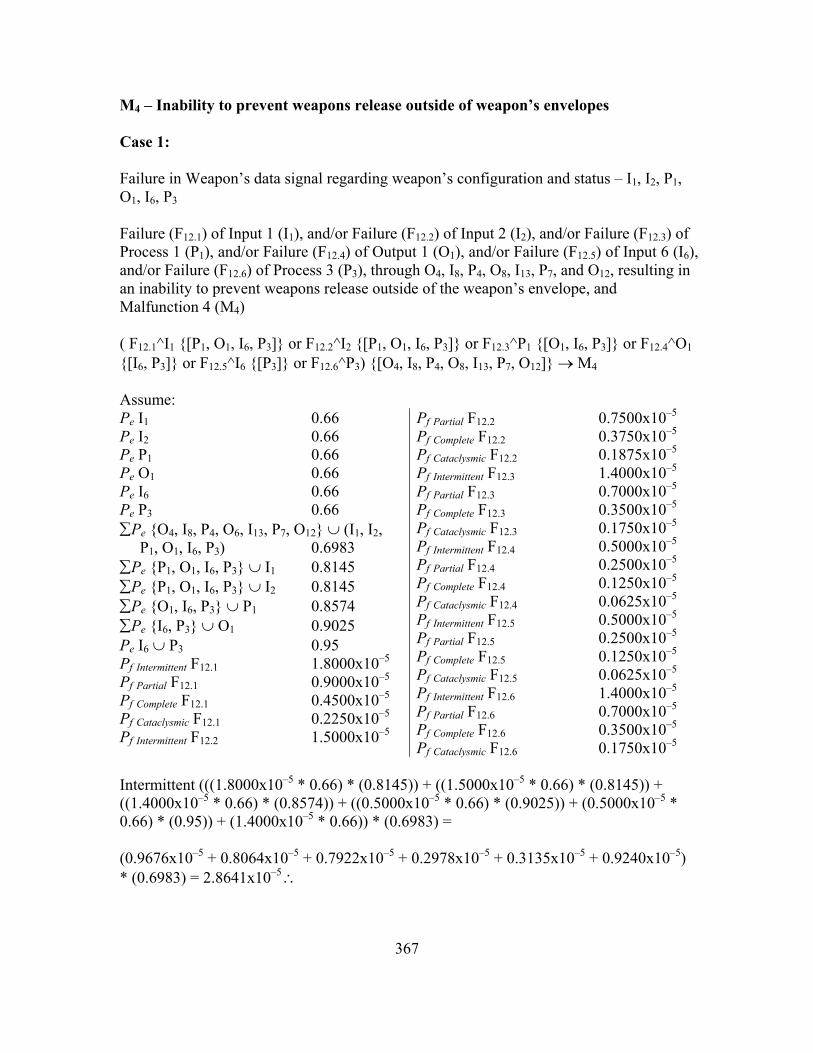
367
M4 – Inability to prevent weapons release outside of weapon’s envelopes Case 1: Failure in Weapon’s data signal regarding weapon’s configuration and status – I1, I2, P1, O1, I6, P3 Failure (F12.1) of Input 1 (I1), and/or Failure (F12.2) of Input 2 (I2), and/or Failure (F12.3) of Process 1 (P1), and/or Failure (F12.4) of Output 1 (O1), and/or Failure (F12.5) of Input 6 (I6), and/or Failure (F12.6) of Process 3 (P3), through O4, I8, P4, O8, I13, P7, and O12, resulting in an inability to prevent weapons release outside of the weapon’s envelope, and Malfunction 4 (M4) ( F12.1^I1 {[P1, O1, I6, P3]} or F12.2^I2 {[P1, O1, I6, P3]} or F12.3^P1 {[O1, I6, P3]} or F12.4^O1 {[I6, P3]} or F12.5^I6 {[P3]} or F12.6^P3) {[O4, I8, P4, O8, I13, P7, O12]} → M4 Assume: Pe I1 0.66 Pe I2 0.66 Pe P1 0.66 Pe O1 0.66 Pe I6 0.66 Pe P3 0.66 ∑Pe {O4, I8, P4, O6, I13, P7, O12} ∪ (I1, I2,
P1, O1, I6, P3) 0.6983 ∑Pe {P1, O1, I6, P3} ∪ I1 0.8145 ∑Pe {P1, O1, I6, P3} ∪ I2 0.8145 ∑Pe {O1, I6, P3} ∪ P1 0.8574 ∑Pe {I6, P3} ∪ O1 0.9025 Pe I6 ∪ P3 0.95 Pf Intermittent F12.1 1.8000x10⁻⁵
Pf Partial F12.1 0.9000x10⁻⁵
Pf Complete F12.1 0.4500x10⁻⁵ Pf Cataclysmic F12.1 0.2250x10⁻⁵ Pf Intermittent F12.2 1.5000x10⁻⁵
Pf Partial F12.2 0.7500x10⁻⁵
Pf Complete F12.2 0.3750x10⁻⁵ Pf Cataclysmic F12.2 0.1875x10⁻⁵ Pf Intermittent F12.3 1.4000x10⁻⁵
Pf Partial F12.3 0.7000x10⁻⁵
Pf Complete F12.3 0.3500x10⁻⁵
Pf Cataclysmic F12.3 0.1750x10⁻⁵ Pf Intermittent F12.4 0.5000x10⁻⁵
Pf Partial F12.4 0.2500x10⁻⁵
Pf Complete F12.4 0.1250x10⁻⁵ Pf Cataclysmic F12.4 0.0625x10⁻⁵ Pf Intermittent F12.5 0.5000x10⁻⁵
Pf Partial F12.5 0.2500x10⁻⁵
Pf Complete F12.5 0.1250x10⁻⁵ Pf Cataclysmic F12.5 0.0625x10⁻⁵
Pf Intermittent F12.6 1.4000x10⁻⁵
Pf Partial F12.6 0.7000x10⁻⁵
Pf Complete F12.6 0.3500x10⁻⁵ Pf Cataclysmic F12.6 0.1750x10⁻⁵
Intermittent (((1.8000x10–5 * 0.66) * (0.8145)) + ((1.5000x10–5 * 0.66) * (0.8145)) + ((1.4000x10–5 * 0.66) * (0.8574)) + ((0.5000x10–5 * 0.66) * (0.9025)) + (0.5000x10–5 * 0.66) * (0.95)) + (1.4000x10–5 * 0.66)) * (0.6983) = (0.9676x10⁻⁵ + 0.8064x10⁻⁵ + 0.7922x10⁻⁵ + 0.2978x10⁻⁵ + 0.3135x10⁻⁵ + 0.9240x10–5) * (0.6983) = 2.8641x10⁻⁵ ∴

368
Partial (((0.9000x10–5 * 0.66) * (0.8145)) + ((0.7500x10–5 * 0.66) * (0.8145)) + ((0.7000x10–5 * 0.66) * (0.8574)) + ((0.2500x10–5 * 0.66) * (0.9025)) + (0.2500x10–5 * 0.66) * (0.95)) + (0.7000x10–5 * 0.66)) * (0.6983) =
(0.4838x10⁻⁵ + 0.4032x10⁻⁵ + 0.3961x10⁻⁵ + 0.1489x10⁻⁵ + 0.1568x10⁻⁵ + 0.4620x10–5) * (0.6983) = 1.4321x10⁻⁵ ∴ Complete (((0.4500x10–5 * 0.66) * (0.8145)) + ((0.3750x10–5 * 0.66) * (0.8145)) + ((0.3500x10–5 * 0.66) * (0.8574)) + ((0.1250x10–5 * 0.66) * (0.9025)) + (0.1250x10–5 * 0.66) * (0.95)) + (0.3500x10–5 * 0.66)) * (0.6983) =
(0.2419x10⁻⁵ + 0.2016x10⁻⁵ + 0.1981x10⁻⁵ + 0.0745x10⁻⁵ + 0.0784x10⁻⁵ + 0.2310x10–5) * (0.6983) = 0.7161x10⁻⁵ ∴ Cataclysmic (((0.2250x10–5 * 0.66) * (0.8145)) + ((0.1875x10–5 * 0.66) * (0.8145)) + ((0.1750x10–5 * 0.66) * (0.8574)) + ((0.0625x10–5 * 0.66) * (0.9025)) + (0.0625x10–5 * 0.66) * (0.95)) + (0.1750x10–5 * 0.66)) * (0.6983) =
(0.1210x10⁻⁵ + 0.1008x10⁻⁵ + 0.0990x10⁻⁵ + 0.0372x10⁻⁵ + 0.0392x10⁻⁵ + 0.1155x10–5) * (0.6983) = 0.3580x10⁻⁵ ∴ There is a 2.8641x10⁻⁵ probability of the WACSS experiencing an intermittent failure, a 1.4321x10⁻⁵ probability of a partial failure, a 0.7161x10⁻⁵ probability of complete failure, and a 0.3580x10⁻⁵ probability of a cataclysmic failure during the operation of I1, I2, P1, O1, I6, and/or P3 as a resulting in an inability to prevent weapons release outside of the weapon’s envelope Case 2: Failure (F13.1) of Input 4 (I4), and/or Failure (F13.2) of Input 5 (I5), and/or Failure (F13.3) of Process 2 (P2), and/or Failure (F13.4) of Output 2 (O1), and/or Failure (F13.5) of Input 7 (I7), and/or Failure (F13.6) of Process 3 (P3), through O4, I8, P4, O8, I13, P7, and O12, resulting in an inability to prevent weapons release outside of the weapon’s envelope, and Malfunction 4 (M4) ( F13.1^I4 {[P2, O2, I7, P3]} or F13.2^I5 {[P2, O2, I7, P3]} or F13.3^P2 {[O2, I7, P3]} or F13.4^O2 {[I7, P3]} or F13.5^I7 {[P3]} or F13.6^P3) {[O4, I8, P4, O8, I13, P7, O12]} → M4

369
Assume: Pe I4 0.90 Pe I5 0.90 Pe P2 0.66 Pe O2 0.66 Pe I7 0.66 Pe P3 0.66 ∑Pe {O4, I8, P4, O6, I13, P7, O12} ∪ (I4, I5,
P2, O2, I7, P3) 0.6983 ∑Pe {P2, O2, I7, P3} ∪ I4 0.8145 ∑Pe {P2, O2, I7, P3} ∪ I5 0.8145 ∑Pe {O2, I7, P3} ∪ P2 0.8574 ∑Pe {I7, P3} ∪ O2 0.9025 Pe I7 ∪ P3 0.95 Pf Intermittent F13.1 1.5000x10⁻⁵
Pf Partial F13.1 0.7500x10⁻⁵
Pf Complete F13.1 0.3750x10⁻⁵ Pf Cataclysmic F13.1 0.1875x10⁻⁵ Pf Intermittent F13.2 1.5000x10⁻⁵
Pf Partial F13.2 0.7500x10⁻⁵
Pf Complete F13.2 0.3750x10⁻⁵ Pf Cataclysmic F13.2 0.1875x10⁻⁵ Pf Intermittent F13.3 1.0000x10⁻⁵
Pf Partial F13.3 0.5000x10⁻⁵
Pf Complete F13.3 0.2500x10⁻⁵
Pf Cataclysmic F13.3 0.1250x10⁻⁵ Pf Intermittent F13.4 0.5000x10⁻⁵
Pf Partial F13.4 0.2500x10⁻⁵
Pf Complete F13.4 0.1250x10⁻⁵ Pf Cataclysmic F13.4 0.0625x10⁻⁵ Pf Intermittent F13.5 0.5000x10⁻⁵
Pf Partial F13.5 0.2500x10⁻⁵
Pf Complete F13.5 0.1250x10⁻⁵ Pf Cataclysmic F13.5 0.0625x10⁻⁵
Pf Intermittent F13.6 1.4000x10⁻⁵
Pf Partial F13.6 0.7000x10⁻⁵
Pf Complete F13.6 0.3500x10⁻⁵ Pf Cataclysmic F13.6 0.1750x10⁻⁵
Intermittent (((1.5000x10–5 * 0.90) * (0.8145)) + ((1.5000x10–5 * 0.90) * (0.8145)) + ((1.0000x10–5 * 0.66) * (0.8574)) + ((0.5000x10–5 * 0.66) * (0.9025)) + (0.5000x10–5 * 0.66) * (0.95)) + (1.4000x10–5 * 0.66)) * (0.6983) = (1.0996x10⁻⁵ + 1.0996x10⁻⁵ + 0.5659x10⁻⁵ + 0.2978x10⁻⁵ + 0.3135x10⁻⁵ + 0.9240x10–5) * (0.6983) = 3.0030x10⁻⁵ ∴ Partial (((0.7500x10–5 * 0.90) * (0.8145)) + ((0.7500x10–5 * 0.90) * (0.8145)) + ((0.5000x10–5 * 0.66) * (0.8574)) + ((0.2500x10–5 * 0.66) * (0.9025)) + (0.2500x10–5 * 0.66) * (0.95)) + (0.7000x10–5 * 0.66)) * (0.6983) =
(0.5498x10⁻⁵ + 0.5498x10⁻⁵ + 0.2829x10⁻⁵ + 0.1489x10⁻⁵ + 0.1568x10⁻⁵ + 0.4620x10–5) * (0.6983) = 1.5015x10⁻⁵ ∴ Complete (((0.3750x10–5 * 0.90) * (0.8145)) + ((0.3750x10–5 * 0.90) * (0.8145)) + ((0.2500x10–5 * 0.66) * (0.8574)) + ((0.1250x10–5 * 0.66) * (0.9025)) + (0.1250x10–5 * 0.66) * (0.95)) + (0.3500x10–5 * 0.66)) * (0.6983) =
(0.2749x10⁻⁵ + 0.2749x10⁻⁵ + 0.1415x10⁻⁵ + 0.0745x10⁻⁵ + 0.0784x10⁻⁵ + 0.2310x10–5) * (0.6983) = 0.7508x10⁻⁵ ∴ Cataclysmic (((0.1875x10–5 * 0.90) * (0.8145)) + ((0.1875x10–5 * 0.90) * (0.8145)) + ((0.1250x10–5 * 0.66) * (0.8574)) + ((0.0625x10–5 * 0.66) * (0.9025)) + (0.0625x10–5 * 0.66) * (0.95)) + (0.1750x10–5 * 0.66)) * (0.6983) =

370
(0.1374x10⁻⁵ + 0.1374x10⁻⁵ + 0.0707x10⁻⁵ + 0.0372x10⁻⁵ + 0.0392x10⁻⁵ + 0.1155x10–5) * (0.6983) = 0.3753x10⁻⁵ ∴ There is a 3.0030x10⁻⁵ probability of the WACSS experiencing an intermittent failure, a 1.5015x10⁻⁵ probability of a partial failure, a 0.7508x10⁻⁵ probability of complete failure, and a 0.3753x10⁻⁵ probability of a cataclysmic failure during the operation of I1, I2, P1, O1, I6, and/or P3 resulting in an inability to prevent weapons release outside of the weapon’s envelope, and Malfunction 4 (M4) Case 3: Failure (F14) of Process 7 (P7), through O12 resulting in an inability to prevent weapons release outside of the weapon’s envelope, and Malfunction 4 (M4) F14^P7 {[O12]} → M2 Assume:
Pe P7 0.10 Pe O12 ∪ P7 0.95 Pf Intermittent F14 1.2000x10⁻⁵
Pf Partial F14 0.6000x10⁻⁵
Pf Complete F14 0.3000x10⁻⁵ Pf Cataclysmic F14 0.1500x10⁻⁵
Intermittent (1.2000x10–5 * 0.10) * 0.95 = 0.1140x10⁻⁵ ∴ Partial (0.6000x10–5 * 0.10) * 0.95 = 0.0570x10⁻⁵ ∴ Complete (0.3000x10–5 * 0.10) * 0.95 = 0.0285x10⁻⁵ ∴ Cataclysmic (0.1500x10–5 * 0.10) * 0.95 = 0.0142x10⁻⁵ ∴ There is a 0.1140x10⁻⁵ probability of the WACSS experiencing an intermittent failure, a 0.0570x10⁻⁵ probability of a partial failure, a 0.0285x10⁻⁵ probability of complete failure, and a 0.0143x10⁻⁵ probability of a cataclysmic failure during the operation of P7, resulting in an inability to prevent weapons release outside of the weapon’s envelope, and Malfunction 4 (M4) Case 4: Failure (F15.1) of Process 7 (P7), and/or Failure (F15.2) of Output 12 (O12), resulting in an inability to prevent weapons release outside of the weapon’s envelope, and Malfunction 4 (M4)

371
( F15.1^P7 {[O12]} or F15.2^O12 ) → M4 Assume: Pe P7 0.10 Pe O12 0.07 Pe P7 ∪ O12 0.95 Pf Intermittent F15.1 0.5000x10⁻⁵
Pf Partial F15.1 0.2500x10⁻⁵
Pf Complete F15.1 0.1250x10⁻⁵
Pf Cataclysmic F15.1 0.0625x10⁻⁵ Pf Intermittent F15.2 0.8000x10⁻⁵
Pf Partial F15.2 0.4000x10⁻⁵
Pf Complete F15.2 0.2000x10⁻⁵ Pf Cataclysmic F15.2 0.1000x10⁻⁵
Intermittent ((0.5000x10–5 * 0.10) * (0.95)) + (0.8000x10–5 * 0.07) = (0.0475x10⁻⁵ + 0.0560x10⁻⁵) = 0.1035x10⁻⁵ ∴ Partial ((0.2500x10–5 * 0.10) * (0.95)) + (0.4000x10–5 * 0.07) = (0.0238x10⁻⁵ + 0.0280x10⁻⁵) = 0.0518x10⁻⁵ ∴ Complete ((0.1250x10–5 * 0.10) * (0.95)) + (0.2000x10–5 * 0.07) = (0.0119x10⁻⁵ + 0.0140x10⁻⁵) = 0.0259x10⁻⁵ ∴ Cataclysmic ((0.0625x10–5 * 0.10) * (0.95)) + (0.1000x10–5 * 0.07) = (0.0059x10⁻⁵ + 0.0070x10⁻⁵) = 0.0129x10⁻⁵ ∴ There is a 0.1035x10⁻⁵ probability of the WACSS experiencing an intermittent failure, a 0.0518x10⁻⁵ probability of a partial failure, a 0.0259x10⁻⁵ probability of complete failure, and a 0.0129x10⁻⁵ probability of a cataclysmic failure during the operation of P7 and/or O12 resulting in an inability to prevent weapons release outside of the weapon’s envelope, and Malfunction 4 (M4) Case 5: Failure (F16.1) of Output 4 (O4), and/or Failure (F16.2) of Input 8 (I8), and/or Failure (F16.3) of Process 4 (P4), and/or Failure (F16.4) of Output 8 (O8), and/or Failure (F16.5) of Input 13 (I13), through P7 and O12, resulting in an inability to prevent weapons release outside of the weapon’s envelope, and Malfunction 4 (M4) ( F16.1^O4 {[I8, P4, O8, I13]} or F16.2^I8 {[P4, O8, I13]} or F16.3^P4 {[O8, I13]} or F16.4^O8 {[I13]} or F16.5^I13 ) {[P7, O12]} → M4

372
Assume: Pe O4 0.40 Pe I8 0.40 Pe P4 0.25 Pe O8 0.10 Pe I13 0.10 ∑Pe {P7, O12} ∪ (O4, I8, P4, O8, I13)
0.9025 ∑Pe {I8, P4, O8, I13} ∪ O4 0.8145 ∑Pe {P4, O8, I13} ∪ I8 0.8574 ∑Pe {O8, I13} ∪ P4 0.9025 Pe I13 ∪ O8 0.95 Pf Intermittent F16.1 0.5000x10⁻⁵
Pf Partial F16.1 0.2500x10⁻⁵
Pf Complete F16.1 0.1250x10⁻⁵ Pf Cataclysmic F16.1 0.0625x10⁻⁵ Pf Intermittent F16.2 0.5000x10⁻⁵
Pf Partial F16.2 0.2500x10⁻⁵
Pf Complete F16.2 0.1250x10⁻⁵ Pf Cataclysmic F16.2 0.0625x10⁻⁵ Pf Intermittent F16.3 0.8000x10⁻⁵
Pf Partial F16.3 0.4000x10⁻⁵
Pf Complete F16.3 0.2000x10⁻⁵
Pf Cataclysmic F16.3 0.1000x10⁻⁵ Pf Intermittent F16.4 0.6000x10⁻⁵
Pf Partial F16.4 0.3000x10⁻⁵
Pf Complete F16.4 0.1500x10⁻⁵ Pf Cataclysmic F16.4 0.0750x10⁻⁵ Pf Intermittent F16.5 0.6000x10⁻⁵
Pf Partial F16.5 0.3000x10⁻⁵
Pf Complete F16.5 0.1500x10⁻⁵ Pf Cataclysmic F16.5 0.0750x10⁻⁵
Intermittent (((0.5000x10–5 * 0.40) * (0.8145)) + ((0.5000x10–5 * 0.40) * (0.8574)) + ((0.8000x10–5 * 0.25) * (0.9025)) + ((0.6000x10–5 * 0.10) * (0.9500)) + (0.6000x10–5 * 0.10)) * (0.9025) = (0.1629x10⁻⁵ + 0.1715x10⁻⁵ + 0.1805x10⁻⁵ + 0.0570x10⁻⁵ + 0.0600x10–5) * (0.9025) = 0.5703x10⁻⁵ ∴ Partial (((0.2500x10–5 * 0.40) * (0.8145)) + ((0.2500x10–5 * 0.40) * (0.8574)) + ((0.4000x10–5 * 0.25) * (0.9025)) + ((0.3000x10–5 * 0.10) * (0.9500)) + (0.3000x10–5 * 0.10)) * (0.9025) = (0.0815x10⁻⁵ + 0.0857x10⁻⁵ + 0.0903x10⁻⁵ + 0.0285x10⁻⁵ + 0.0300x10–5) * (0.9025) = 0.2852x10⁻⁵ ∴ Complete (((0.1250x10–5 * 0.40) * (0.8145)) + ((0.1250x10–5 * 0.40) * (0.8574)) + ((0.2000x10–5 * 0.25) * (0.9025)) + ((0.1500x10–5 * 0.10) * (0.9500)) + (0.1500x10–5 * 0.10)) * (0.9025) = (0.0407x10⁻⁵ + 0.0429x10⁻⁵ + 0.0451x10⁻⁵ + 0.0143x10⁻⁵ + 0.0150x10–5) * (0.9025) = 0.1426x10⁻⁵ ∴ Cataclysmic (((0.0625x10–5 * 0.40) * (0.8145)) + ((0.0625x10–5 * 0.40) * (0.8574)) + ((0.1000x10–5 * 0.25) * (0.9025)) + ((0.0750x10–5 * 0.10) * (0.9500)) + (0.0750x10–5 * 0.10)) * (0.9025) = (0.0204x10⁻⁵ + 0.0214x10⁻⁵ + 0.0226x10⁻⁵ + 0.0071x10⁻⁵ + 0.0075x10–5) * (0.9025) = 0.0713x10⁻⁵ ∴

373
There is a 0.5703x10⁻⁵ probability of the WACSS experiencing an intermittent failure, a 0.2852x10⁻⁵ probability of a partial failure, a 0.1426x10⁻⁵ probability of complete failure, and a 0.0713x10⁻⁵ probability of a cataclysmic failure during the operation of O4, I8, P4, O8, and/or I13 resulting in an inability to prevent weapons release outside of the weapon’s envelope, and Malfunction 4 (M4) Summary: Failure in Case 1, Case 2, Case 3, Case 4, or Case 5, resulting in an inability to prevent weapon’s release outside of the weapon’s envelope, and Malfunction 4 (M4) PM4 = {PCase 1 or PCase 2 or PCase 3 or PCase 4 or PCase 5} Intermittent PM4 = 2.8641x10⁻⁵ + 3.0030x10⁻⁵ + 0.1140x10⁻⁵ + 0.1035x10⁻⁵ + 0.5703x10–5 = 6.6549x10⁻⁵ Partial PM4 = 1.4321x10⁻⁵ + 1.5015x10⁻⁵ + 0.0570x10⁻⁵ + 0.0518x10⁻⁵ + 0.2852x10–5 = 3.3276x10⁻⁵ Complete PM4 = 0.7161x10⁻⁵ + 0.7508x10⁻⁵ + 0.0285x10⁻⁵ + 0.0259x10⁻⁵ + 0.1426x10–5 = 1.6639x10⁻⁵ Cataclysmic PM4 = 0.3580x10⁻⁵ + 0.3753x10⁻⁵ + 0.0143x10⁻⁵ + 0.0129x10⁻⁵ + 0.0713x10–5 = 0.8318x10⁻⁵ PM4 Total = PM4 Intermittent + PM4 Partial + PM4 Complete + PM4 Cataclysmic PM4 Total = 6.6549x10⁻⁵ + 3.3276x10⁻⁵ + 1.6639x10⁻⁵ + 0.8318x10⁻⁵ PM4 Total = 12.4782x10⁻⁵
There is a 12.4782x10⁻⁵ probability that the WACSS will experience a safety–related malfunction and hazardous event during system operation, resulting in an inability to prevent weapons release outside of the weapon’s envelope

374
Figure 28 WACSS M5 Malfunction Process Flow
F 11.
5
L 1
Airc
raft
Dat
a-B
us
I 2 I 3 I 1
O1
I 6
I 5 I 4 O
2
I 7
O3
I 8 O
4
I 9 O5
I 10
O6
O7
O8
I 11
I 12
I 13
O9
O10
O11
O12
O13
I 14
I 15
Wea
pon
and
Wea
pon’
s R
ack
Airc
raft
(non
-fli
ght a
nd fl
ight
da
ta)
Use
r to
Syst
em In
put
Wea
pon
Com
man
d La
unch
Dis
play
P 6
F n –
Fai
lure
I n
– In
put
L n –
Lim
it O
n – O
utpu
t P n
– P
roce
ss
F 11.
1 F 5.1
F 11.
2 F 1
1.3
F 13.
1
F 13.
2 F 1
3.3
F 13.
4
F 13.
5
F 11.
4
F 5.4
F 4.4
F 11.
6
F 1
F 6.3
F 18.
2
F 6.4
F 6.5
F 8 F 3
F 9
F 10
F 15.
2
P 5 P 7
P 4
P 3
P 2
P 1
F 7
F 4.1
F 5
.2 F 4
.2
F 5.3
F 4.3
F 5.5
F 4.5
F 6.1
F 6
.2
F 2
F 12.
1
F 12.
2
F 12.
3
F 12.
4
F 12.
5
F 12.
6 F 1
3.6
F 16.
1 F 1
6.2
F 16.
3
F 16.
4 F 16.
5 F 1
5.1
F 14
F 18.
1
F 18.
3 F 18.
4
F 17
F 18.
5
Sys
tem
Pro
cess
es, F
unct
ions
, or O
bjec
ts
Syst
em F
ailu
res
Inpu
t / O
utpu
t Lim
its
Dire
ctio
n of
Sys
tem
Pro
cess
Flo
w
F 6.6
F 6
.7

375
M5 – Drop incorrect weapon from pylon Case 1: Failure in weapons launch / deployment logic to select the proper weapon – P7 Failure (F17) of Process 7 (P7), through O12, resulting in the drop of an incorrect weapon from pylon, and Malfunction 5 (M5) F17^P7 {[O12]} → M5 Assume:
Pe P7 0.10 Pe P7 ∪ O12 0.95 Pf Intermittent F17 1.0000x10⁻⁵
Pf Partial F17 0.5000x10⁻⁵
Pf Complete F17 0.2500x10⁻⁵ Pf Cataclysmic F17 0.1250x10⁻⁵
Intermittent (1.0000x10–5 * 0.10) * (0.9500) = 0.0950x10⁻⁵ ∴ Partial (0.5000x10–5 * 0.10) * (0.9500) = 0.0475x10⁻⁵ ∴ Complete (0.2500x10–5 * 0.10) * (0.9500) = 0.0238x10⁻⁵ ∴ Cataclysmic (0.1250x10–5 * 0.10) * (0.9500) = 0.0119x10⁻⁵ ∴ There is a 0.0950x10⁻⁵ probability of the WACSS experiencing an intermittent failure, a 0.0475x10⁻⁵ probability of a partial failure, a 0.0238x10⁻⁵ probability of complete failure, and a 0.0119x10⁻⁵ probability of a cataclysmic failure during the operation of P7 resulting in a failure in the weapon launch / deployment logic to select the proper weapon and Malfunction 5 (M5); the dropping of an incorrect weapon from a weapon’s pylon Case 2: Failure (F18.1) of Process 4 (P4), and/or Failure (F18.2) of Input 9 (I9), and/or Failure (F18.3) of Output 8 (O8), and/or Failure (F18.4) of Input 13 (I13), and/or Failure (F18.5) of Process 7 (P7), through O12, resulting in the drop of an incorrect weapon from pylon, and Malfunction 5 (M5) ( F18.1^P4 {[I9, O8, I13, P7]} or F18.2^I9 {[O8, I13, P7]} or F18.3^O8 {[I13, P7]} or F18.4^I13 {[P7]} or F18.5^P7 ) {[O12]} → M4

376
Assume: Pe P4 0.25 Pe I9 0.25 Pe O8 0.10 Pe I13 0.10 Pe P7 0.10 ∑Pe {O12} ∪ (P4, I9, O8, I13, P7)
0.9500 ∑Pe {I9, O8, I13, P7} ∪ P4 0.8145 ∑Pe {O8, I13, P7} ∪ I9 0.8574 ∑Pe {I13, P7} ∪ O8 0.9025 Pe I13 ∪ P7 0.95 Pf Intermittent F18.1 0.8000x10⁻⁵
Pf Partial F18.1 0.4000x10⁻⁵
Pf Complete F18.1 0.2000x10⁻⁵ Pf Cataclysmic F18.1 0.1000x10⁻⁵ Pf Intermittent F18.2 1.9000x10⁻⁵
Pf Partial F18.2 0.9500x10⁻⁵
Pf Complete F18.2 0.4750x10⁻⁵ Pf Cataclysmic F18.2 0.2375x10⁻⁵ Pf Intermittent F18.3 0.5000x10⁻⁵
Pf Partial F18.3 0.2500x10⁻⁵
Pf Complete F18.3 0.1250x10⁻⁵
Pf Cataclysmic F18.3 0.0625x10⁻⁵ Pf Intermittent F18.4 0.5000x10⁻⁵
Pf Partial F18.4 0.2500x10⁻⁵
Pf Complete F18.4 0.1250x10⁻⁵ Pf Cataclysmic F18.4 0.0625x10⁻⁵ Pf Intermittent F18.5 1.5000x10⁻⁵
Pf Partial F18.5 0.7500x10⁻⁵
Pf Complete F18.5 0.3750x10⁻⁵ Pf Cataclysmic F18.5 0.1875x10⁻⁵
Intermittent (((0.8000x10–5 * 0.25) * (0.8145)) + ((1.9000x10–5 * 0.25) * (0.8574)) + ((0.5000x10–5 * 0.10) * (0.9025)) + ((0.5000x10–5 * 0.10) * (0.9500)) + (1.5000x10–5 * 0.10)) * (0.9500) = (0.1629x10⁻⁵ + 0.4073x10⁻⁵ + 0.0451x10⁻⁵ + 0.0475x10⁻⁵ + 0.1500x10–5) * (0.9500) = 0.7722x10⁻⁵ ∴ Partial (((0.4000x10–5 * 0.25) * (0.8145)) + ((0.9500x10–5 * 0.25) * (0.8574)) + ((0.2500x10–5 * 0.10) * (0.9025)) + ((0.2500x10–5 * 0.10) * (0.9500)) + (0.7500x10–5 * 0.10)) * (0.9500) = (0.0815x10⁻⁵ + 0.2036x10⁻⁵ + 0.0226x10⁻⁵ + 0.0238x10⁻⁵ + 0.0750x10–5) * (0.9500) = 0.3862x10⁻⁵ ∴ Complete (((0.2000x10–5 * 0.25) * (0.8145)) + ((0.4750x10–5 * 0.25) * (0.8574)) + ((0.1250x10–5 * 0.10) * (0.9025)) + ((0.1250x10–5 * 0.10) * (0.9500)) + (0.3750x10–5 * 0.10)) * (0.9500) = (0.0407x10⁻⁵ + 0.1018x10⁻⁵ + 0.0113x10⁻⁵ + 0.0119x10⁻⁵ + 0.0375x10–5) * (0.9500) = 0.1930x10⁻⁵ ∴ Cataclysmic (((0.1000x10–5 * 0.25) * (0.8145)) + ((0.2375x10–5 * 0.25) * (0.8574)) + ((0.0625x10–5 * 0.10) * (0.9025)) + ((0.0625x10–5 * 0.10) * (0.9500)) + (0.1875x10–5 * 0.10)) * (0.9500) = (0.0204x10⁻⁵ + 0.0509x10⁻⁵ + 0.0056x10⁻⁵ + 0.0059x10⁻⁵ + 0.0188x10–5) * (0.9500) = 0.0965x10⁻⁵ ∴

377
There is a 0.7722x10⁻⁵ probability of the WACSS experiencing an intermittent failure, a 0.3862x10⁻⁵ probability of a partial failure, a 0.1930x10⁻⁵ probability of complete failure, and a 0.0965x10⁻⁵ probability of a cataclysmic failure during the operation of P4, I9, O8, I13, and/or P7 resulting in a failure in the system to comprehend which weapon was selected and Malfunction 5 (M5); the dropping of an incorrect weapon from a weapon’s pylon Summary: Failure in Case 1 or Case 2 resulting in the dropping of an incorrect weapon from a weapon’s pylon and Malfunction 5 (M5) PM5 = {PCase 1 or PCase 2} Intermittent PM5 = 0.0950x10⁻⁵ + 0.7722x10–5 = 0.8672x10⁻⁵ Partial PM5 = 0.0475x10⁻⁵ + 0.3862x10–5 = 0.4337x10⁻⁵ Complete PM5 = 0.0238x10⁻⁵ + 0.1930x10–5 = 0.2168x10⁻⁵ Cataclysmic PM5 = 0.0119x10⁻⁵ + 0.0965x10–5 = 0.1084x10⁻⁵ PM5 Total = PM5 Intermittent + PM5 Partial + PM5 Complete + PM5 Cataclysmic PM5 Total = 0.8672x10⁻⁵ + 0.4337x10⁻⁵ + 0.2168x10⁻⁵ + 0.1084x10⁻⁵ PM5 Total = 1.6261x10⁻⁵
There is a 1.6261x10⁻⁵ probability that the WACSS will experience a safety–related malfunction and hazardous event during system operation, resulting in the dropping of an incorrect weapon from a weapon’s pylon 9. PROBABILITY SUMMATION
Intermittent Partial Complete Cataclysmic Σ M1 2.2540x10⁻⁵ 1.1270x10⁻⁵ 0.5635x10⁻⁵ 0.2818x10⁻⁵ 4.2263x10⁻⁵
M2 5.4980x10⁻⁵ 2.7578x10⁻⁵ 1.3847x10⁻⁵ 0.6871x10⁻⁵ 10.3276x10⁻⁵
M3 3.2094x10⁻⁵ 1.6048x10⁻⁵ 0.8024x10⁻⁵ 0.4012x10⁻⁵ 6.0178x10⁻⁵
M4 6.6549x10⁻⁵ 3.3276x10⁻⁵ 1.6639x10⁻⁵ 0.8318x10⁻⁵ 12.4782x10⁻⁵
M5 0.8672x10⁻⁵ 0.4337x10⁻⁵ 0.2168x10⁻⁵ 0.1084x10⁻⁵ 1.6261x10⁻⁵
Σ 18.4835x10⁻⁵ 9.2509x10⁻⁵ 4.6313x10⁻⁵ 2.3103x10⁻⁵ 34.6760x10⁻⁵
Table 32 WACSS Probability Summation
The example Probability Summation demonstrated in Table 32 serves as an
illustration to the dissertation model in Chapter V.E.3.b and process Step 5. Action 7.

378
Frequency Definition Probability x10–5
ALWAYS The system will each time it is executed. > 50.00 FREQUENT The system will most likely fail when
executed. 50.00
LIKELY The system will likely fail when executed.
25.00
PERIODICALLY The system will periodically fail when executed.
10.00
OCCASIONAL The system will occasionally fail when executed.
2.50
SELDOM The system will seldom fail when executed.
0.75
SPORADICALLY The system will fail sporadically when they are executed.
0.20
UNLIKELY The system is unlikely to fail when executed.
0.05
NEVER The system will never fail when executed. 0.00
Table 33 WACSS System Failure Definition Table
The example System Failure Definition Table demonstrated in Table 33 serves as
an illustration to the dissertation model in Chapter V.E.3.b and process Steps 6.2 and 6.3.

379
NEV
ER
I
Safe
Safe
Safe
Safe
UN
LIK
ELY
H
Low
Low
Low
Low
SPO
RA
D–
ICA
LLY
G
Min
or
Min
or
Min
or
Min
or
SELD
OM
F
Mod
erat
ely
Mod
erat
ely
Min
or
Min
or
OC
CA
SIO
N–
ALL
Y
E
Sign
ifica
ntly
Sign
ifica
ntly
Mod
erat
ely
Min
or Table 34 WACSS Probability vs. Severity
Table
PER
IOD
IC–
ALL
Y
D
Hig
hly
Hig
hly
Sign
ifica
ntly
Mod
erat
ely
LIK
ELY
C
Extre
mel
y
Extre
mel
y
Hig
hly
Sign
ifica
ntly
The example Probability vs. Severity Table
demonstrated in Table 34 serves as an illustration to
the dissertation model in Chapter V.E.3.b and
process Steps 6.2 and 6.3
FREQ
UEN
T
B
Uns
afe
Extre
mel
y
Extre
mel
y
Hig
hly
PRO
BA
BIL
ITY
ALW
AY
S
A
Uns
afe
Uns
afe
Uns
afe
Uns
afe
I II
III
IV
CA
TAST
RO
PHIC
CR
ITIC
AL
MO
DER
ATE
NEG
LIG
IBLE
SEVERITY

380
Intermittent Partial Complete Cataclysmic Σ
M1 E F F F D M2 D E E F D M3 D E E F D M4 D D E E C M5 E F G G E Σ C D D E B
Table 35 WACSS System Failure Probability Letter Designation.
The example System Failure Probability Letter Designation demonstrated in
Table 35 serves as an illustration to the dissertation model in Chapter V.E.3.b and process
Steps 6.2 and 6.3
10. SAFETY ASSESSMENT INDEX SUMMATION RESULTS
M1 Signal incompatibility / feedback to the Aircraft Data–Bus P Intermittent E – Occasionally P Partial F – Seldom P Critical F – Seldom P Cataclysmic F – Seldom ΣP D – Periodically ΣF F1^O3, F2^P3 H1 Aviation Data–Bus unable to process flight data
C1 Inability to complete mission tasking, risk to friendly force protection, risk to own protection. V2 II – Critical S Intermittent Significantly Unsafe S Partial Moderately Unsafe S Critical Moderately Unsafe S Cataclysmic Moderately Unsafe ΣS Highly Unsafe
C2 Inability to control aircraft – Loss of Airframe, Loss of Aircrew V1 I – Catastrophic S Intermittent Significantly Unsafe S Partial Moderately Unsafe S Critical Moderately Unsafe S Cataclysmic Moderately Unsafe ΣP Highly Unsafe
C3 Significant damage to vulnerable aviation software systems on the data–bus V3 III – Marginal / Moderate

381
S Intermittent Moderately Unsafe S Partial Minor Unsafe Issues S Critical Minor Unsafe Issues S Cataclysmic Minor Unsafe Issues ΣP Significantly Unsafe
C4 Minor damage to vulnerable aviation software systems on the data–bus V4 IV – Negligible S Intermittent Minor Unsafe Issues S Partial Minor Unsafe Issues S Critical Minor Unsafe Issues S Cataclysmic Minor Unsafe Issues ΣP Moderately Unsafe
M2 Weapon fusing to detonate too early after weapon’s release P Intermittent D – Periodically P Partial E – Occasionally P Critical E – Occasionally P Cataclysmic F – Seldom ΣP D – Periodically ΣF F3^P5, F4^( I2, P1, O1, I6, P3 ), F5^( I1, P1, O1, I6, P3 ), F6^( O4, I8,
P4, O6, I11 ), F7^O10 H2 Weapon could inadvertently detonate close to delivery aircraft
C5 Loss of Airframe, Loss of Aircrew V1 I – Catastrophic S Intermittent Highly Unsafe S Partial Significantly Unsafe S Critical Significantly Unsafe S Cataclysmic Moderately Unsafe ΣS Highly Unsafe
C1 Inability to complete mission tasking, risk to friendly force protection, risk to own protection. V2 II – Critical S Intermittent Highly Unsafe S Partial Significantly Unsafe S Critical Significantly Unsafe S Cataclysmic Moderately Unsafe ΣS Highly Unsafe
H3 Weapon not detonating on target C6 Cost of Weapon
V3 III – Marginal / Moderate S Intermittent Significantly Unsafe S Partial Moderately Unsafe S Critical Moderately Unsafe S Cataclysmic Minor Unsafe Issues ΣS Significantly Unsafe

382
C1 Inability to complete mission tasking, risk to friendly force protection, risk to own protection. V2 II – Critical S Intermittent Highly Unsafe S Partial Significantly Unsafe S Critical Significantly Unsafe S Cataclysmic Moderately Unsafe ΣS Highly Unsafe
M3 Inability to fuse weapon – Dead Fuse P Intermittent D – Periodically P Partial E – Occasionally P Critical E – Occasionally P Cataclysmic F – Seldom ΣP D – Periodically ΣF F8^P5, F9^O10, F10^P7, F11^( I1, I2, P1, O1, I6, P3 ) H3 Weapon not detonating on target
C6 Cost of Weapon V3 III – Marginal / Moderate S Intermittent Significantly Unsafe S Partial Moderately Unsafe S Critical Moderately Unsafe S Cataclysmic Minor Unsafe Issues ΣS Significantly Unsafe
C1 Inability to complete mission tasking, risk to friendly force protection, risk to own protection V2 II – Critical S Intermittent Highly Unsafe S Partial Significantly Unsafe S Critical Significantly Unsafe S Cataclysmic Moderately Unsafe ΣS Highly Unsafe
M4 Inability to prevent weapons release outside of the weapon’s envelope P Intermittent D – Periodically P Partial D – Periodically P Critical E – Occasionally P Cataclysmic E – Occasionally ΣP C – Likely ΣF F12^( I1, I2, P1, O1, I6, P3 ), F13^( I4, I5, P2, O2, I7, P3 ), F14^P7,
F15^( P7, O12 ), F16^( O4, I8, P4, O8, I13 ) H4 Weapon incapable of acquiring and striking the target
C6 Cost of Weapon V3 III – Marginal / Moderate S Intermittent Significantly Unsafe S Partial Significantly Unsafe S Critical Moderately Unsafe

383
S Cataclysmic Moderately Unsafe ΣS Highly Unsafe
H5 Danger to the airframe when deploying a weapon out of proper delivery parameters C5 Loss of Airframe, Loss of Aircrew
V1 I – Catastrophic S Intermittent Highly Unsafe S Partial Highly Unsafe S Critical Significantly Unsafe S Cataclysmic Significantly Unsafe ΣS Extremely Unsafe
H6 Weapon could possibly fall on undesired target C7 Blue on White (Neutral) Collateral Damage
V2 II – Critical S Intermittent Highly Unsafe S Partial Highly Unsafe S Critical Significantly Unsafe S Cataclysmic Significantly Unsafe ΣS Extremely Unsafe
H7 Weapon could possibly fall on friendly forces C8 Blue on Blue (Friendly Fire) Casualty
V1 I – Catastrophic S Intermittent Highly Unsafe S Partial Highly Unsafe S Critical Significantly Unsafe S Cataclysmic Significantly Unsafe ΣS Extremely Unsafe
H8 Resulting lack of sufficient weapons to complete mission C1 Inability to complete mission tasking, risk to friendly force
protection, risk to own protection. V2 II – Critical S Intermittent Highly Unsafe S Partial Highly Unsafe S Critical Significantly Unsafe S Cataclysmic Significantly Unsafe ΣS Extremely Unsafe
M5 Drop incorrect weapon from pylon P Intermittent E – Occasionally P Partial F – Seldom P Critical G – Sporadically P Cataclysmic G – Sporadically ΣP E – Occasionally ΣF F17^P7, F18^( P4, I9, O8, I13, P7 ) H9 Loss of weapon due to incorrect targeting and delivery parameters
C6 Cost of Weapon
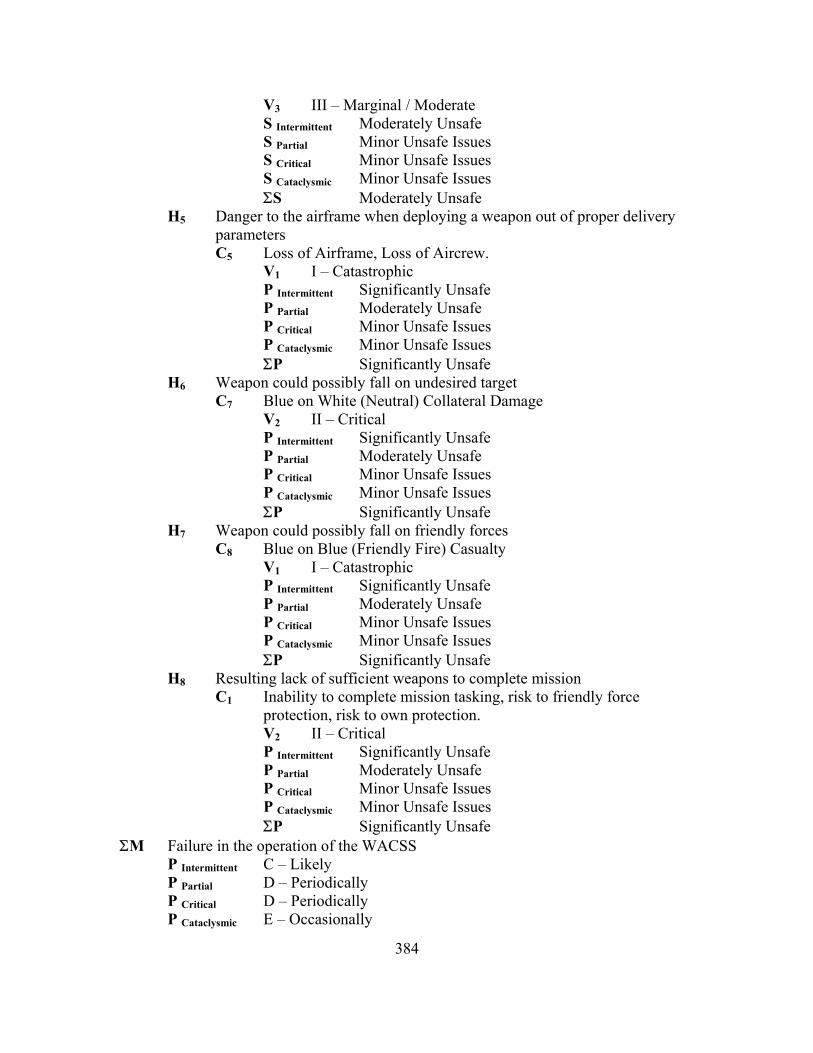
384
V3 III – Marginal / Moderate S Intermittent Moderately Unsafe S Partial Minor Unsafe Issues S Critical Minor Unsafe Issues S Cataclysmic Minor Unsafe Issues ΣS Moderately Unsafe
H5 Danger to the airframe when deploying a weapon out of proper delivery parameters C5 Loss of Airframe, Loss of Aircrew.
V1 I – Catastrophic P Intermittent Significantly Unsafe P Partial Moderately Unsafe P Critical Minor Unsafe Issues P Cataclysmic Minor Unsafe Issues ΣP Significantly Unsafe
H6 Weapon could possibly fall on undesired target C7 Blue on White (Neutral) Collateral Damage
V2 II – Critical P Intermittent Significantly Unsafe P Partial Moderately Unsafe P Critical Minor Unsafe Issues P Cataclysmic Minor Unsafe Issues ΣP Significantly Unsafe
H7 Weapon could possibly fall on friendly forces C8 Blue on Blue (Friendly Fire) Casualty
V1 I – Catastrophic P Intermittent Significantly Unsafe P Partial Moderately Unsafe P Critical Minor Unsafe Issues P Cataclysmic Minor Unsafe Issues ΣP Significantly Unsafe
H8 Resulting lack of sufficient weapons to complete mission C1 Inability to complete mission tasking, risk to friendly force
protection, risk to own protection. V2 II – Critical P Intermittent Significantly Unsafe P Partial Moderately Unsafe P Critical Minor Unsafe Issues P Cataclysmic Minor Unsafe Issues ΣP Significantly Unsafe
ΣM Failure in the operation of the WACSS P Intermittent C – Likely P Partial D – Periodically P Critical D – Periodically P Cataclysmic E – Occasionally
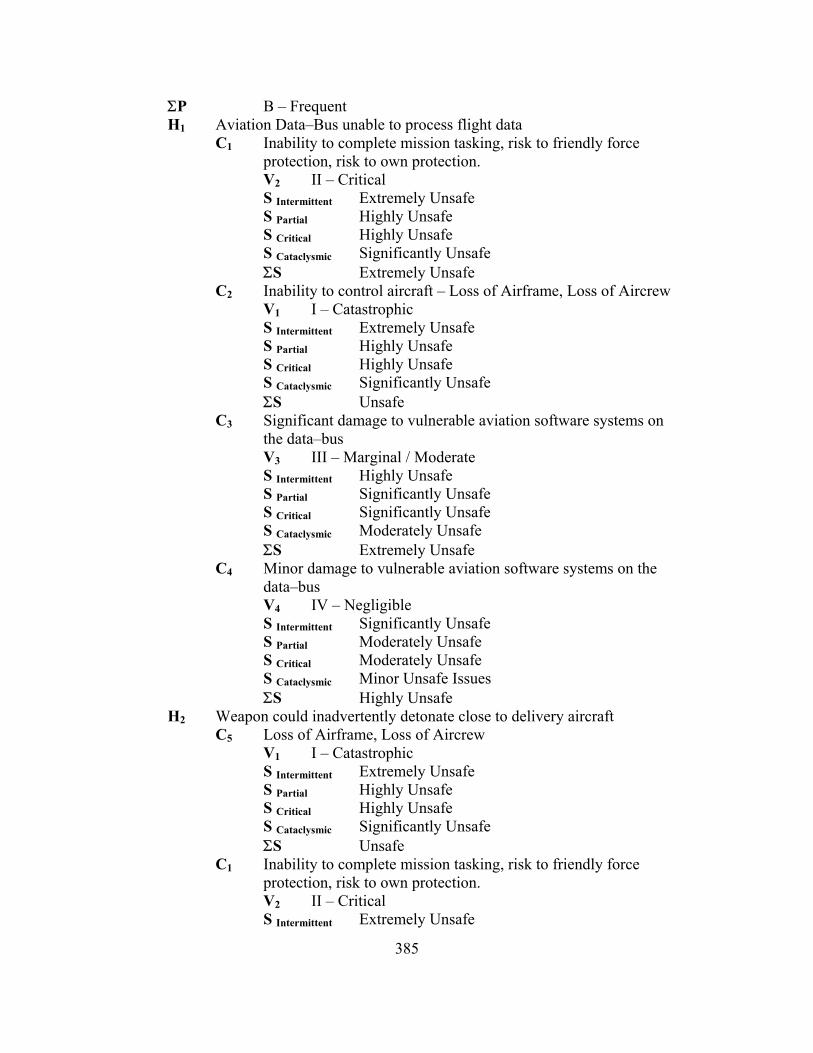
385
ΣP B – Frequent H1 Aviation Data–Bus unable to process flight data
C1 Inability to complete mission tasking, risk to friendly force protection, risk to own protection. V2 II – Critical S Intermittent Extremely Unsafe S Partial Highly Unsafe S Critical Highly Unsafe S Cataclysmic Significantly Unsafe ΣS Extremely Unsafe
C2 Inability to control aircraft – Loss of Airframe, Loss of Aircrew V1 I – Catastrophic S Intermittent Extremely Unsafe S Partial Highly Unsafe S Critical Highly Unsafe S Cataclysmic Significantly Unsafe ΣS Unsafe
C3 Significant damage to vulnerable aviation software systems on the data–bus V3 III – Marginal / Moderate S Intermittent Highly Unsafe S Partial Significantly Unsafe S Critical Significantly Unsafe S Cataclysmic Moderately Unsafe ΣS Extremely Unsafe
C4 Minor damage to vulnerable aviation software systems on the data–bus V4 IV – Negligible S Intermittent Significantly Unsafe S Partial Moderately Unsafe S Critical Moderately Unsafe S Cataclysmic Minor Unsafe Issues ΣS Highly Unsafe
H2 Weapon could inadvertently detonate close to delivery aircraft C5 Loss of Airframe, Loss of Aircrew
V1 I – Catastrophic S Intermittent Extremely Unsafe S Partial Highly Unsafe S Critical Highly Unsafe S Cataclysmic Significantly Unsafe ΣS Unsafe
C1 Inability to complete mission tasking, risk to friendly force protection, risk to own protection. V2 II – Critical S Intermittent Extremely Unsafe
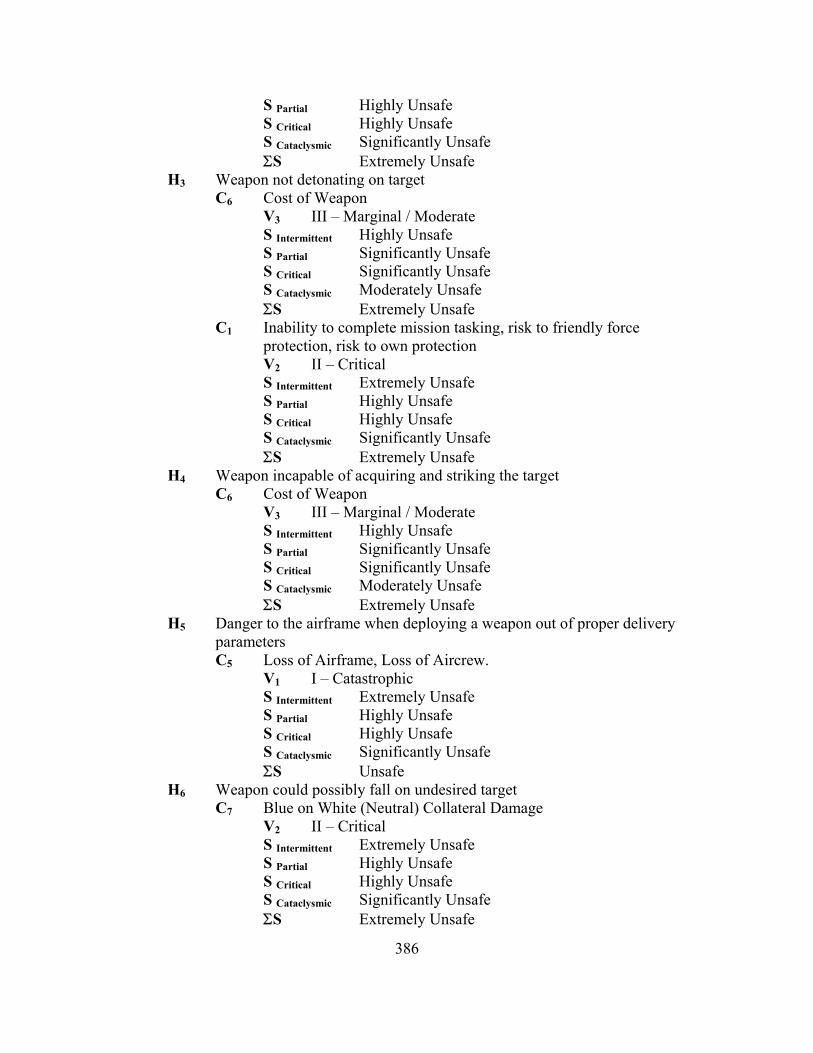
386
S Partial Highly Unsafe S Critical Highly Unsafe S Cataclysmic Significantly Unsafe ΣS Extremely Unsafe
H3 Weapon not detonating on target C6 Cost of Weapon
V3 III – Marginal / Moderate S Intermittent Highly Unsafe S Partial Significantly Unsafe S Critical Significantly Unsafe S Cataclysmic Moderately Unsafe ΣS Extremely Unsafe
C1 Inability to complete mission tasking, risk to friendly force protection, risk to own protection V2 II – Critical S Intermittent Extremely Unsafe S Partial Highly Unsafe S Critical Highly Unsafe S Cataclysmic Significantly Unsafe ΣS Extremely Unsafe
H4 Weapon incapable of acquiring and striking the target C6 Cost of Weapon
V3 III – Marginal / Moderate S Intermittent Highly Unsafe S Partial Significantly Unsafe S Critical Significantly Unsafe S Cataclysmic Moderately Unsafe ΣS Extremely Unsafe
H5 Danger to the airframe when deploying a weapon out of proper delivery parameters C5 Loss of Airframe, Loss of Aircrew.
V1 I – Catastrophic S Intermittent Extremely Unsafe S Partial Highly Unsafe S Critical Highly Unsafe S Cataclysmic Significantly Unsafe ΣS Unsafe
H6 Weapon could possibly fall on undesired target C7 Blue on White (Neutral) Collateral Damage
V2 II – Critical S Intermittent Extremely Unsafe S Partial Highly Unsafe S Critical Highly Unsafe S Cataclysmic Significantly Unsafe ΣS Extremely Unsafe
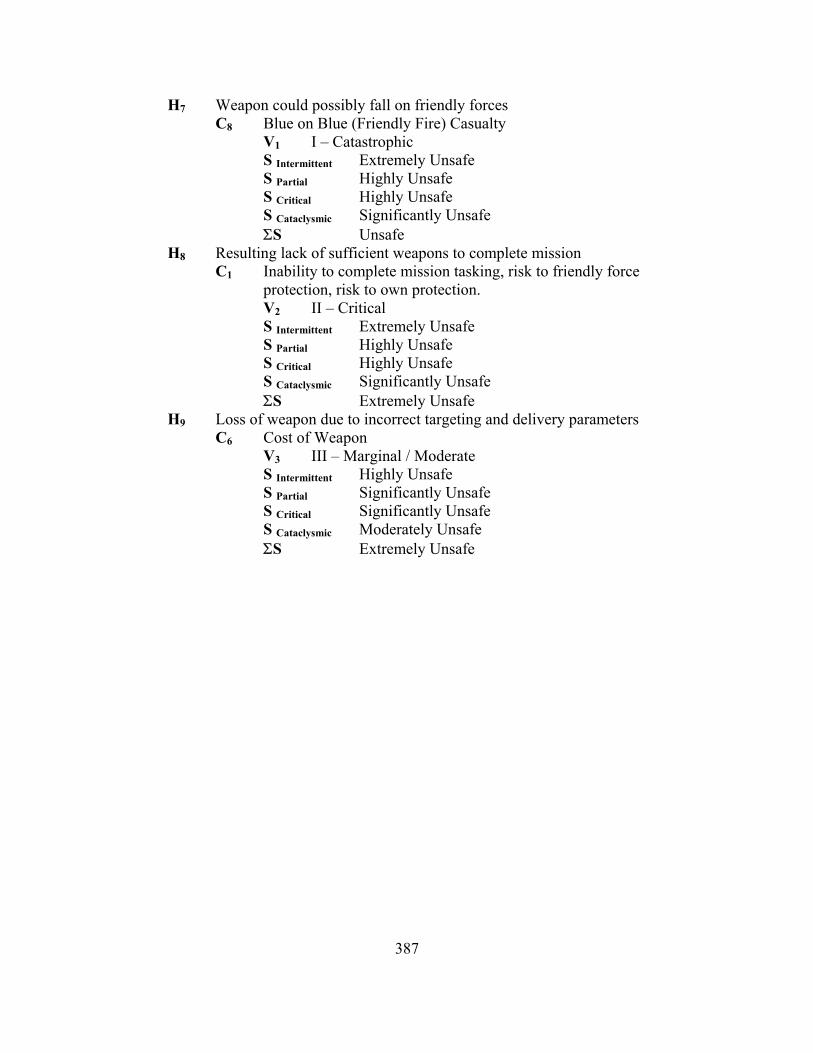
387
H7 Weapon could possibly fall on friendly forces C8 Blue on Blue (Friendly Fire) Casualty
V1 I – Catastrophic S Intermittent Extremely Unsafe S Partial Highly Unsafe S Critical Highly Unsafe S Cataclysmic Significantly Unsafe ΣS Unsafe
H8 Resulting lack of sufficient weapons to complete mission C1 Inability to complete mission tasking, risk to friendly force
protection, risk to own protection. V2 II – Critical S Intermittent Extremely Unsafe S Partial Highly Unsafe S Critical Highly Unsafe S Cataclysmic Significantly Unsafe ΣS Extremely Unsafe
H9 Loss of weapon due to incorrect targeting and delivery parameters C6 Cost of Weapon
V3 III – Marginal / Moderate S Intermittent Highly Unsafe S Partial Significantly Unsafe S Critical Significantly Unsafe S Cataclysmic Moderately Unsafe ΣS Extremely Unsafe

388
Syst
em
Obj
ects
Mal
func
tion
Haz
ard
Con
sequ
ence
S In
term
itten
t
S Pa
rtial
S C
ritic
al
S C
atac
lysm
ic
ΣS
C1 II E II F II F II F II D
C2 I E I F I F I F I D
C3 III E III F III F III F III D F1^O3, F2^P3 M1 H1
C4 IV E IV F IV F IV F IV D
C5 I D I E I E I F I D H2
C1 II D II E II E II F II D
C6 III D III E III E III F III D
F3^P5, F4^( I2, P1, O1, I6, P3 ), F5^( I1, P1, O1, I6, P3 ),
F6^( O4, I8, P4, O6, I11 ), F7^O10
M2
H3 C1 II D II E II E II F II D
C6 III D III E III E III F III D F8^P5, F9^O10, F10^P7,
F11^( I1, I2, P1, O1, I6, P3 ) M3 H3
C1 II D II E II E II F II D
H4 C6 III D III D III E III E III C
H5 C5 I D I D I E I E I C
H6 C7 II D II D II E II E II C
H7 C8 I D I D I E I E I C
F12^( I1, I2, P1, O1, I6, P3 ), F13^( I4, I5, P2, O2, I7, P3 ),
F14^P7, F15^( P7, O12 ), F16^( O4, I8, P4, O8, I13 )
M4
H8 C1 II D II D II E II E II C
H9 C6 III E III F III G III G III E
H5 C5 I E I F I G I G I E
H6 C7 II E II F II G II G II E
H7 C8 I E I F I G I G I E
F17^P7, F18^( P4, I9, O8, I13, P7 )
M5
H8 C1 II E II F II G II G II E
Table 36 WACSS Malfunction to Safety Assessment
The example Malfunction to Safety Assessment Table demonstrated in Table 36
serves as an illustration to the dissertation model in Chapter V.E.3.b and process Step 6.
Action 3. The Malfunction to Safety Assessment and the corresponding Hazard to
Consequence intersection is obtained through the relationship earlier introduced with the
concept of the Safety Assessment Index as [ S = Σ P(H) * C(H) ] in Equation 1. Using
the M1, Intermittent Case, for Consequence C3 as F1^O3 → M1:

389
Where:
Pe O3 0.40 Pf Intermittent F1 2.5000x10⁻⁵
Intermittent (2.5000x10–5 * 0.40) = 1.0000x10⁻⁵ ∴ With the resultant value entered into Table 33, to obtain to a Frequency of
“OCCASIONAL.” The Occasional value can be entered into the Probability axis of the
Probability vs. Severity values of Table 34 with a Severity axis value of “Moderate”,
corresponding to the severity of the applicable causality. The resulting intersection
derives a value of III E or “Moderate,” corresponds to the degree for which the system
is determined unsafe. The textual definition of “Moderate” can be then referenced back
to the Consequence Severity Categories defined in Table 21 of the example.
11. PROCESS PROCEDURES
Step 1. Action 1. – System Task / Safety Requirement Analysis – Identify the
primary safety requirements of the system through a review of concept level
requirements, including system objects, properties, tasks, and event. Identify system
safety requirements as they pertain to system state and operating environment.
Additional safety requirements may be identified using historical precedents and
rationalization from similar systems. System requirements should be inspected for
completeness and the inclusion of system safety logic controls and interlocks, where
applicable. Assessments should be made to evaluate size, time, effort, defects, and
system complexity.
Step 1. Action 2. – Hazard Identification – Perform a hazard identification of
the software system based on concept level system requirements, system tasks, and
historical precedents. Identification includes identifying the Hazards, Consequences,
and Malfunctions potentially occurring from the three states of hazard occurrence.
Step 2. Action 1. – Development of Consequence Severity Categories – Develop
a prioritized list of Consequence Severity Categories, ranging from the most severe to

390
the least severe possible consequence. Severity categories should be well defined to
eliminate confusion and provide distinct boundaries between.
Step 2. Action 2. – Initial Hazard Assessment – Perform an initial hazard
assessment of the system by classifying hazards according to Consequence Severity,
based on an agreed table of Consequence Severity Categories.
Step 3. Action 1. – Choose a Process Depiction Model – Determine the optimal
process depiction model to perform a safety assessment of the system. This process
model should be capable of depicting requirement process flow, logic decisions,
conflict and recovery, and the isolation of function failure to hazard execution.
Step 3. Action 2. – Identify Objects Required to Populate the Process Model –
Determine the initial set of objects required to populate the process model identified in
Step 3.1. using system requirements identified in Step 1.1. Once object sets are
identified, populate sets with applicable high–level object items and properties. Items
and properties include, but are not limited to, process inputs, outputs, and connections.
Step 3. Action 3. – Pictorially Map the System Process – In accordance with the
process model identified in Step 3.1., and process objects identified in Step 3.2., map
the system process, to include all high–level system processes, inputs, outputs, and
limits.
Step 4. Action 1. – Identify and Match corresponding Failures to Malfunctions.
– In accordance with the malfunctions identified in Step 1.2., and process objects
outlined in Step 3.2., identify the potential system failures that could eventually result
in identified safety–related malfunctions. If identified failures relate to malfunctions
not previously identified, return, and repeat the system assessment from Step 1, Action
2. Identified failures are then matched to specific process objects.
Step 4. Action 2. – Add Identified Failures to the System Process Map – Using
the process map completed in Step 3.3., and failures identified in Step 4.1., add
391
identified failures to their corresponding locations on the process map using agreed
process graph symbology.
Step 5. Action 1. – Development of Failure Severity Categories – Develop a
prioritized list of Object Failure Severity Categories with applicable definitions. Using
Failure Modes, Effects, and Criticality Analysis (FMECA)352 techniques, severities
shall define the types of failures that a specific object could potentially experience,
ranging from the benign to the catastrophic, and the potential effect of that failure on
the system as a whole. As the assessment is designed to evaluate system safety, it is
possible to disregard object failure types that do not relate or result in hazardous events.
Step 5. Action 2. – Development of Execution Probability Definition Categories
– Develop a prioritized list of Execution Probability Definition Categories with
applicable probability levels, frequency keywords, and definitions.
Step 5. Action 3. – Assign Execution Probabilities to System Objects – Using the
Process Map generated in Step 3.3., assign Execution Probabilities to all system objects
that relate to system failures identified in Steps 4.1. and 4.2. Execution Probabilities
should be based on system inspection, historical precedents, and examination.
Step 5. Action 4. – Development of Object Failure Probability Definition
Categories – Develop a prioritized list of Failure Probability Definition Categories with
applicable probability levels, frequency keywords, and definitions as they apply to
specific objects within the system.
Step 5. Action 5. – Assign Failure Probabilities to System Objects – Using the
Process Map generated in Step 3.3., the Failure Process Map from Step 4.2., and
Failure Severity Categories defined in Step 5.1., assign Failure Probabilities to all
system objects that relate to system failures identified in Steps 4.1. and 4.2. for each
352 NASA/SP—2000–6110, Failure Modes and Effects Analysis (FMEA), A Bibliography, National
Aeronautics and Space Administration; July 2000.

392
severity of failure. Failure Probabilities should be based on system inspection,
historical precedents, and examination.
Step 5. Action 6. – Determine Possible System Hazard Flow – Using the Process
Map generated in Step 3.3., the Failure Process Map from Step 4.2., and the Failure to
Malfunction Identification of Step 4.1., determine the possible System to Hazard
Process Flow. Such a Process Flow should include all system objects that could
potentially result in a malfunction and eventually a failure.
Step 5. Action 7. – Determine Failure Probability for each Malfunction – Using
the Object Failure Probabilities from Step 5.5. and the Hazard Flow generated in Step
5.6., determine the cause and effect failure probability of the system. System
Probability should include consideration of all reliant or dependent objects to the
system process.
Step 6. Action 1. – Development of System Failure Probability Definition
Categories – Develop a prioritized list of Failure Probability Definition Categories with
applicable probability levels, frequency keywords, and definitions as they apply to the
system as a whole.
Step 6. Action 2. – Development of the Probability vs. Severity Table – Develop
a two dimensional table representing System Failure Probability on the Horizontal
Axis and Hazard Criticality on the Vertical Axis. Assign applicable safety values to
table cells to represent the safety or un–safety of the system based on each occurrence
and corresponding safety level for a given intersection scenario.
Step 6. Action 3. – Determination of the Safety Assessment Index (SAI) – Using
the Probability vs. Severity Table developed in Step 6.1., and Failure Summations from
Step 5, determine the SAI for malfunctions and the summation of the system by the
intersection of event probability to hazard severity. SAI results should then be
displayed using the method most practicable to the evaluation requirements.
393
Step 7. Action 1. – Determine Required Improvements – Determine the system
improvements required to decrease independent and system SAI values to an
acceptable level, identifying appropriate controls of Avoidance, Reduction, Spreading,
and/or Transference to each element. Identify quantitative improvement goals for each
object that is to be improved, countered by required resources, and cost vs. benefits of
the actual improvement.
Step 7. Action 2. – Incorporate Safety Controls – Incorporate the Safety
Controls identified in Step 7.1. into the Software System. Changes should be well
documented in requirement specifications and code development specifications. Any
refinements and improvements should take into consideration their effect on present
objects as well as any related or reliant objects within the system.
Step 8. Action 1. – Determine the Subjective Elements to System Safety
Development. Determine the subjective elements to system development that relate to
safety and the prevention of a hazardous event. Determine applicable measures and
definitions to classify and assess elements for their potential effect to the system.
Step 8. Action 2. – Evaluate System Subjective Elements. Evaluate the software
system for elements identified in Step 8.1. Assign a grade or measure to system
elements indicating their compliance to assigned definitions, derived from Step 2
Action 1 and Step 5, Actions 1 through 7. Summarize evaluated elements to determine
the overall effect of subjective elements on software system safety.
Step 9. – Supervise the Safety Development – Using accepted methods of
supervision and software management, supervise the development of the software
system to ensure compliance with the principles of safety development. Ensure
compliance with applicable development methods, system requirements, and safety
assessments. Ensure that system developmental failures are identified and remedied as
soon as possible in the current or next development cycle, or are acknowledged for

394
their fragility to customers. At the completion of the current developmental cycle,
commence where applicable, the next successive cycle and Step 1.1 of the Safety
Assessment.

395
INITIAL DISTRIBUTION LIST
1. Defense Technical Information Center
Ft. Belvoir, Virginia
2. Dudley Knox Library Naval Postgraduate School Monterey, California
3. Prof Luqi Computer Science Department Naval Postgraduate School Monterey, California
4. Prof Auguston Mikhail Computer Science Department Naval Postgraduate School Monterey, California
5. Prof Valdis Berzins Computer Science Department Naval Postgraduate School Monterey, California