A financial history of the Metropolitan Railway, 1853–1933
110
A financial history of the Metropolitan Railway, 1853–1933 By Tony Sheward © Tony Sheward 2019
-
Upload
khangminh22 -
Category
Documents
-
view
0 -
download
0
Transcript of A financial history of the Metropolitan Railway, 1853–1933

A financial history of the Metropolitan Railway, 1853–1933
By
Tony Sheward
© Tony Sheward 2019

1
A FINANCIAL HISTORY OF THE METROPOLITAN RAILWAY
1853-1933
1. Introduction
Although the literature covering numerous aspects of the history of the Metropolitan
Railway (MR) is extensive, there is no one work which deals with the financial
performance of the company in a comprehensive way over its complete 80-year history.
This is not to denigrate what has been written. For instance, Alan Jacksoni gives many
financial statistics in the chapters of his book, including a two-page examination of the
financial history of the company. Similarly, Barker and Robbins two volume History of
London Transportii only includes a limited amount of financial information about the MR.
Nevertheless, these works have been invaluable sources for the historical background to
the figures. A History of the Metropolitan Railway & Metrolandiii published in 2018 by
Irene Hawkes does not contain any new material on financial matters. Mention should
also be made of Douglas Rose’s Diagrammatical Historyiv, which has been a useful
source of reference for the opening of the MR’s stations. This article takes as its basis the
annual reportsv of the MR and the Railway Returnsvi and attempts to chart the financial
history of the MR in a continuous way over its life starting with the act of incorporation
for the North Metropolitan Railway in August 1853 (name changed to the MR in 1854)
and ending with its absorption by the London Passenger Transport Board (LPTB) in July
1933.
The importance of presenting a financial history of the MR may not be readily apparent,
given the prominence of its other achievements. The original investors and those that
followed relied on the company to make regular reports indicating how capital works
were progressing and whether the resulting revenue stream was capable of adequately
rewarding the investors in its loans and shares. This was, of course, an ongoing process as
the company as the company expanded and new tranches of capital were required. The
confidence of the investors in the MR was key to its progress. The directors and managers
of the MR of course also needed a regular stream of financial information to fulfil their
roles.
Later on, the various booms and busts in railway development led the government to
move away from its normal laissez faire approach to commerce and industry and in the
Regulation of the Railways Act 1868 (the 1868 Act) specify the formats that railway
companies were to use in their reports to shareholders and to the Board of Trade. This
went considerably beyond the requirements for joint stock companies in general and
remained so for the rest of the MR’s existence, supplemented by the Railway Companies
(Accounts and Returns) Act 1911 (the 1911 Act) and the Railway Companies (Accounts
and Returns) Order 1928 (the 1928 Order). In the late Victorian period concern grew
about the level of railway charges and whether they were exploiting their monopoly
position in inland transport. The Railway Commission established by the Regulation of
the Railways Act 1873 to investigate complaints of malpractice and its later incarnations
were able to rely on the reporting formats specified by the above legislation as part of the
evidence for their work. By the same token, the company and the shareholders could

2
point to the accounts to refute accusations of excess profits. The accounts for 1913 were
to have an important role in calculating an adequate return for the railway companies
following takeover by the Railway Executive Committee in World War I and forming the
basis for rates and charges under the Railways Act 1921. Last but not least, the MR’s
accounts in the years before 1933 provided part of the justification for the compensation
to shareholders on the takeover by the LPTB.
Presenting the financial information in a consistent way is difficult, because of the
changes in financial reporting over the 80 years, as outlined by Tony Shewardvii. The
period 1868-1912 was governed by the 1868 Act and an attempt has been made to present
the figures for the years 1853-67 in a similar fashion. The period 1913-33 was governed
by the 1911 Act, with minor changes made the 1928 Order. Again, an attempt has been
made to provide some consistency between the pre and post 1913 periods. The period of
government control during and immediately after World War I saw some of the
information being withheld for security purposes. The published accounts of the MR
complied with the government regulations, but private and confidential accounts were
produced for the Board members, which contained a full set of schedules. Copies of
these, apart from 1921, are in TNA. Thus, there are gaps for 1921 in the graphs and tables
below.
To aid understanding of the figures, Appendix 1 gives an overview of capital financing
structure and Appendix 2 of running powers, leased lines and joint lines.
Although up to 1912, the annual reports were prepared in two half yearly tranches, the
information in this article is presented by calendar year for ease of understanding and
comparison.
Where possible, the narrative tries to provide explanations for the most significant
figures. However, the annual reports often do not make it clear what exactly has been
happening. The quality of financial information provided to shareholders has improved
radically since 1933, but the pace of change has accelerated considerably since the issue
of the first Statement of Standard Accounting Practice in 1971 and the formation of the
Financial Reporting Council in 1990. Even as late as the 1930s directors of limited
companies were very paternalistic in their attitude to shareholders and expected them to
have faith in their judgement and not question their decisions.
2. An Overview
Before looking in detail at the figures for the 80 years concerned, it is useful to take a
bird’s eye view of what happened to the MR during that period. The following graphs are
set out in Graphs A-F:
A. Total Receipts from Passenger and Freight Trains
B. Number of Passengers
C. Total Capital Receipts
D. Net Revenue before Interest on Debentures and Loans, and Dividends
E. Percentage Dividend on Ordinary Stock and Surplus Land Stock

3
F. Percentage Return on Capital versus Return on Government Long Term Debt and
Consumer Prices Index
In Graphs A and B, the figures for 1921 have been estimated, because the accounts for
that year are incomplete.
The monetary figures are as reported in the accounts, but of course inflation over the
period distorts the picture. The Bank of England’s inflation calculator gives some
indication of the impact that it has had. The figures below show the purchasing power of
£1 in 2018 pounds at ten-year intervals during the MR’s history and for 1932 its last full
year of operations:
Year Equivalent in 2018 Pounds
£
1863 123.42
1873 106.81
1883 119.44
1893 126.23
1903 119.44
1913 113.35
1923 59.40
1932 68.57
1933 70.30
Between 1863 and 1913, the overall impact of inflation was relatively modest with £1 in
1963 having purchasing power of £123.42 in 2018 pounds and £1 in 1913 £113.35. This
was not a smooth progression due to the economic booms and slumps during that period.
However, inflation was much more rapid during World War I and the years immediately
afterwards with £1 in 1923 having a purchasing power of £59.40 in 2018 pounds. By
1933, there had been some deflation as a result of the Great Depression and £1 in 1933
had purchasing power of £70.30 in 2018 pounds (£68.57 in 1932 the last full year of
operations).
As reported, the MR’s total receipts from passenger and freight trains rose from £102k in
1863 to £1.454m in 1932. Even if the two figures were converted to 2018 pounds using
the above inflation rates, this would still be a huge increase. There was not, of course, a
steady increase over the whole period, as explained below, and receipts peaked at
£1,950m in 1924, the year of the British Empire Exhibition at Wembley. The number of
passengers carried rose from 9.455m in 1863 to 119.664m in 1932, an increase of more
than 11½ times. As with receipts, the peak year was 1924 with 154.184m.
At the beginning of 1863, the money that had been received into the capital account
amounted to £1.342m and by 30 June 1933, the last day of the MR’s independent
existence, this had risen to £22.713m. As this money was received in numerous tranches
spread over the years concerned, it would be misleading to apply the above inflation rates
to these two amounts. In crude terms, it would have cost over £165m in 2018 pounds to

4
complete the opening stretch of line and conceivably several billions of pounds to
complete the network as it was in 1933.
The MR developed a good reputation for servicing the various components of its capital
and Graph D shows the money that was left after net revenue from operations, other
receipts and other expenditures for payments to these components. From 1887, this
includes the amount allocated by the Surplus Lands Committee for dividends on the
Surplus Land Stock (see explanation of this below in the section covering 1885-92). The
net revenue started as £72k in 1863 and rose to £875k in 1932, as with total receipts a
huge increase. Again, 1924 was the peak year at £980m. In terms of dividends on its
consolidated ordinary stock, the MR was always able to pay a dividend even in the most
difficult years. Even in the worst years, 1907-08, a dividend of ½ per cent was paid. The
highest payments of 7 per cent were paid in the years 1865-68 in special circumstances,
which are explained below. Thereafter, it was only possible to pay 5 per cent in good
years. Dividends on Surplus Land Stock were also paid in all years and, apart from small
fluctuations in individual years, rose gradually from 2½ per cent in 1887 to 3⅞ per cent in
1932. Graph E shows the percentage dividend paid on both categories of ordinary stock.
Graph E, the percentage return on capital (the net revenue in Graph D as a percentage of
the capital receipts in Graph C), gives a better indication of what sort of investment the
MR was for its stock holders. For much of its life, the return was above 4 per cent and
above 5 per cent in good years like 1924. Apart from the years 1919-20 in the post-World
War I boom, the MR’s return on capital was normally enough to provide protection
against inflation. Before 1913, the MR’s return on capital generally provided a small
margin above the return on long term government bonds. Thereafter, it was only in the
years 1923-25 and 1928-30 that the MR’s return on capital exceeded the return on long
term government bonds.
3. The Pre-Operational Period
The capital authorised and created for the initial 3¾ route miles was £1.533m consisting
of £1.150m in shares and £0.383m in loans, including adjustments to the original 1853
Act. By the end of 1861, a further £0.666m amount had been authorised and created for a
¾ mile extension to Moorgate, consisting of £0.5m in shares and £0.166m in loans. By
the time construction of the initial mileage had been completed at the end of 1862 some
£1.342m had been received into the capital account.
The MR opened to the public on 10 January 1963 and at that point £1.329m had been
spent, probably the bulk on the initial 3¾ mile route, as the Moorgate extension would not
be opened until late 1865. Construction had only taken about three years following the
award of the first contracts in December 1859. An analysis of this expenditure is shown
below:

5
Table 1
Analysis of Pre-Operational Capital Expenditure
Pre 1860 1860 1861 1862 Total
£ £ £ £ £
Land Purchase 13,125 215,550 170,565 213,309 612,549
Construction 136,840 234,703 276,100 647,643
Parliamentary Expenses 31,036 6,574 3,627 589 41,826
Interest 4,466 6,047 2,836 13,246 26,595
Sale of Surplus Materials (24,262) (24,262)
Other 13,293 5,290 6,256 106 24,945
Total 61,920 370,301 417,987 479,088 1,329,296
It was not until the end of 1859 that all the necessary support to finance the project was in
place. Not unnaturally, the bulk of the expenditure was related to the acts of parliament from
1853. The costs of constructing the permanent way and stations took nearly 49 per cent of the
total cost, but land purchase at just over 46 per cent took nearly as much. The New Road (the
current Marylebone Road, Euston Road and Pentonville Road) under which the railway ran
for much of its length then represented the effective northern boundary of the London built
up area and even then, property prices were expensive.
4. Operations Prior to the Chairmanship of Sir Edward Watkin 1863-72
Sir Edwin Watkin was voted in as chairman of the MR on 7 August 1872 and in October,
following the appointment of three directors from the Manchester area, was able to exercise
effective control over the board. Up to 1872, the MR had seen its role as a railway serving
central London and some of the then suburbs such as Hammersmith. Thereafter, the MR
began to see its role as wider player in the railway industry, in particular linking up with
Watkin’s interests in the Manchester Sheffield & Lincolnshire Railway (MSLR) and the
South Eastern Railway (SER) and in the process expanding its lines into areas outside
London such as Harrow, which was then a separate town surrounded by countryside. For
convenience, the whole of 1872 has been treated as part of the pre-Watkin period.
Operations in 1863 related purely to the initial route between Paddington and Farringdon, but
this was gradually to change as additional capital expenditure expanded the line. The projects
directly controlled by the MR with completion dates were:
Eastern extension Farringdon to Moorgate 1865
City widened lines Farringdon to Moorgate 1866
City widened lines Kings Cross to Farringdon 1868
Western extension Paddington to South Kensington 1868
Projects involving other companies that were completed during the period were:
Junction with the Great Northern Railway (GNR) at Kings Cross 1863

6
Connection with the Hammersmith & City Railway (H&CR), separate company with
MR participation, 1865
West facing junction with the London Chatham & Dover Railway (LCDR) at
Farringdon 1866
Baker Street to Swiss Cottage by the Metropolitan & St John’s Wood Railway
(M&SJWR), separate company with MR participation, 1868
Junction with the Midland Railway (MidR) at St Pancras 1868
Connection with the London & South Western Railway (LSWR) at Hammersmith
1870
East facing junction with the LCDR at Farringdon 1871
The increases in capital authorised and created and the amount received into the capital
account over the period were as follows:
31 December 1862 31 December 1872 Increase
£m £m £m
Capital Authorised & Created
Shares 1.650 5.950 4.300
Loans 0.549 1.867 1.318
Total 2.199 7.817 5.618
Amount Received into Capital Account
Shares 0.906 5.802 4.896
Loans 0.423 1.951 1.528
Miscellaneous 0.013 (13)
Total 1.342 7.753 6.411
Until the 1868 Act, railway companies were not required to distinguish between capital
expenditure on lines under construction and those open for traffic in their accounts and, even
then, there was no requirement to split the expenditure within these two categories into
individual projects. By the end of 1872 the total spent on capital account was £7.640m made
up of:
£m
Lines in the course of construction 0.632
Lines open for traffic 6.678
Working stock 0.269
Subscriptions to other railways 0.100
Other (0.039)
Total 7.640

7
The capital expenditure on the Moorgate to Aldgate extension and on the other extensions
and widening 1863-1872, including miscellaneous capital works on the lines already opened,
was made up as follows:

8
Table 2
Analysis of Capital Expenditure 1863-72
1863 1864 1865 1866 1867 1868 1869 1870 1871 1872 Total
£ £ £ £ £ £ £ £ £ £ £
Moorgate - Aldgate
Under Construction
Land Purchase 109,957 84,709 132,182 82,839 45,875 455,562
Construction of Way
& Stations
119,208 2,250 121,458
Law & Parliamentary 8,048 400 1,150 9,598
Interest 19,295 19,295
Miscellaneous 23,084 1,265 1,938 (51) 26,236
260,297 107,919 134,120 82,788 47,025 632,149
Lines Open for
Traffic
Land Purchase 233,165 490,878 720,538 641,156 495,419 234,377 131,083 202,715 79,435 94,445 3,323,211
Construction of Way
& Stations 55,019 144,319 313,953 492,371 440,745 165,708 171,394 19,874 81,646 21,468 1,906,497
Law & Parliamentary 6,734 3,071 42,467 1,278 8,145 5,686 4,754 117 3,388 75,640
Interest 14,558 6,493 14,543 15,264 25,687 24,487 101,032
Miscellaneous (42,600) (14,693) (57,293)
309,476 644,761 1,091,501 1,150,069 969,996 424,572 265,563 212,650 161,198 119,301 5,349,087
Working Stock 28,172 52,545 20,815 32,025 11,462 48,102 42,557 32,367 1,209 112 269,366
Subscriptions to
Other Railways
78,000 22,000 100,000
Credits from Surplus
Land
(66,421) (66,421)
Other 3,397 1,800 2,104 2,799 3,146 13,591 26,837
Total 341,045 699,106 1,114,420 1,184,893 1,062,604 754,971 429,630 379,137 245,195 100,017 6,311,018

9
When looking at the cost of the lines 1863-72, other than the Moorgate to Aldgate extension,
compared with that of the original section, it is noticeable that land purchase took up a much
larger proportion of the total, 62 per cent versus 46 per cent. Correspondingly, the cost of the
way and stations was 36 per cent compared to 49 per cent. Part of the reason was the
proximity of some of the work to the City of London, particularly the extension from
Farringdon to Moorgate and the City Widened Lines. The peak of expenditure in the years
1865-66 also relates to those projects. There was a flurry of expenditure on working stock in
the years 1863-64, as a result the breakdown of the initial arrangement with the Great
Western Railway (GWR) for the provision of stock for the initial 3¾ miles and to provide
extra, when the MR began to run its own trains on the line to Hammersmith, where new
stations were provided at Latimer Road, Royal Oak and Westbourne Park by the end of the
period. Expenditure on working stock peaked again in 1868, when trains began to use the
extension from Paddington to South Kensington. All the 44 locomotives purchased during the
period were of the A class. The total investment of £100k in the M&SJWR was made in the
years 1867-68. On the Moorgate to Aldgate extension land purchase rose to 72 per cent of the
total, with the cost of the way and stations falling to 19 per cent.
Presentation of the revenue account for the years 1863-68 is limited, because a standard
analysis of income and expenditure only came in with the implementation of the 1868 Act.
Although the new format was introduced for the accounts for the second half of 1868, those
for the first half were not reworked, so 1869 was the first complete year in the new format.
Table 3 below provides the detail that is available:
Table 3
Revenue Account 1863-68
1863 1864 1865 1866 1867 1868
£ £ £ £ £ £
Total Receipts 75,168 116,491 141,513 210,242 233,180 290,672
Expenditure
Maintenance of Way, Works
& Stations 1,663 5,489 8,633 12,298 10,584 10,702
Locomotive Power 6,237 11,079 18,717 31,497 33,441 29,655
General Charges 7,324 20,648 18,888 27,919 28,107 35,635
Compensation 3,395 2,348
Rates, Taxes & Government
Duty 3,407 8,498 9,266 12,845 14,145 23,369
Other 1 2 2 399 4,161
Sub Total 18,631 45,715 55,506 84,561 90,071 105,870
Revenue Balance 56,537 70,776 86,007 125,681 143,109 184,802
The year 1863 is not comparable with the other years, as the GWR operated the service on
behalf of the MR for part of the year. Both revenue and expenditure grew rapidly as the
system expanded. Table 4 gives the revenue account for the years 1869-72:

10
Table 4
Revenue Account 1869-72
1869 1870 1871 1872
£ £ £ £
Total Receipts
Passenger Trains 367,687 373,008 381,623 385,109
Freight Trains 6,395 12,363 14,444 16,281
Other 61,945 67,409 67,181 42,625
Sub Total 436,027 452,780 463,248 444,015
Expenditure
Maintenance of Way, Works &
Stations 15,723 19,973 18,273 20,075
Locomotive Power 53,567 57,628 54,234 42,207
Carriage & Wagon Repairs 8,295 9,185 9,526 9,381
Traffic Expenses 57,748 61,443 61,505 51,767
General Charges 15,359 16,308 15,463 18,385
Law Charges 2,117 2,709 2,535 15,624
Compensation 12,803 6,554 4,560 17,699
Rates, Taxes & Government Duty 30,480 30,111 28,309 26,015
Other 5,056 2,470 4,467 12,619
Sub Total 201,148 206,381 198,872 213,772
Allowance for Working Other Cos
Trains 36,568 52,891 48,684 21,495
Revenue Balance 271,447 299,290 313,060 251,738
Although sub totalling of traffic revenue by passenger and freight trains was not introduced
until the 1911 Act, for convenience, passenger train revenue is taken to include mails,
parcels, horses and carriages and goods train revenue to include merchandise, livestock and
minerals. It can be seen that even in 1872 freight train revenue was fairly insignificant
compared to passenger train revenue. The largest regular item in other revenue was rents for
such items as parts of stations, refreshment rooms, advertising and properties not considered
as surplus land. In 1869-71, there were also credits for the redemption of preference shares,
which should more properly have been dealt with in the net revenue account or appropriation
account.
As might be expected, the heaviest items of expenditure were associated with providing
locomotive power and the organisation of traffic. Compensation and law charges tended to be
variable, dependent on incidents causing loss or injury. The allowances for working other
companies’ trains were costs recoverable for running trains on behalf of other companies,
both on its own system and on other companies’ lines such as the H&CR and the
Metropolitan District Railway (MDR).
The net revenue & appropriation account 1863-72 is shown below:

11
Table 5
Net Revenue & Appropriation Account 1863-72
1863 1864 1865 1866 1867 1868 1869 1870 1871 1872
£ £ £ £ £ £ £ £ £ £
Receipts
B/Fwd Balance 1,312 7,778 1,709 7,999 6,999 4,167 2,043 98 2,065
Balance Revenue Account 56,537 70,776 86,007 125,681 143,109 184,802 271,447 299,290 313,060 251,738
Rents Received 5,191
Dividends Received 1,250 2,323 1,720 2,810 2,346
Bank & General Interest 2,241 22,793 39,917 10,526 5,600 2,880 981 1,487
Lands Committee 15,000
Other 12,635 15,976 8,368 24,215 72,535 125,131 26,728
71,413 110,857 142,070 162,131 229,243 321,062 304,665 303,053 316,949 277,827
Expenditure
Interest on Debentures & Loans 16,864 15,880 12,750 20,220 20,220 31,485 75,129 76,780 83,682 85,365
Other 125 28,558 21,629 20,267 28,601
16,864 15,880 12,750 20,220 20,220 31,610 103,687 98,409 103,949 113,966
Transfer to Special Account 18,830
Balance Available for Dividends 54,549 94,977 129,320 141,911 209,023 289,452 200,978 204,644 213,000 145,031
Preference Stocks 10,861 15,000 15,000 15,000 19,024 38,999 50,935 74,274 80,663 84,906
Extension/Preferred Ordinary Stocks 57,000 77,604 49,556 3,146 3,450 1,974
Consolidated Ordinary Stock 42,376 72,199 112,611 118,912 126,000 167,696 97,464 126,864 126,375 58,151
Deferred Ordinary Stock 986 980 262 447
53,237 87,199 127,611 133,912 202,024 285,285 198,935 204,546 210,935 145,031
Balance C/Fwd 1,312 7,778 1,709 7,999 6,999 4,167 2,043 98 2,065 0
% on Consolidated Ordinary Stock 5% 6% 7% 7% 7% 7% 4% 3¼% 3⅛% 1½%
12
As the accounts were prepared for half yearly periods, dividends were also declared for each
half year. The dividend percentage for each year has been calculated by taking a simple
average of the two percentages, ignoring any changes in ordinary share capital during the
year. Between 1865 and 1868 the holders of the consolidated ordinary stock had been paid a
regular dividend of 7%, despite the economic disruption which followed the Overend Gurney
bank failure in 1866. By 1868, shareholder unease began to grow about the management of
the Chairman, John Parson, and a court action was taken by a holder of Extension Preferred
Ordinary Shares, Frederick Bloxham, alleging that the proceeds of the share offering had not
been properly used for capital purposes. The case went against the company. A further court
case was started in 1869 by shareholder Enoch Salisbury alleging that the 7 per cent dividend
payment in 1868 had only been possible as a result of suspicious receipt of £42,600 from a
contractor, John Kelk. Restrained from including this credit, the Board tried to include an
interest credit in respect of unremunerative surplus lands, which resulted in a further court
case, where the Court of Chancery in 1870 found the directors guilty of breach of trust.
Moves to remove Parson and his fellow directors then began, leading to a Committee of
Investigation and an examination of the books by accountants, Price, Hoyland & Waterhouse.
Numerous errors and omissions were found, as well as misallocation between capital and
revenue. New accounting systems and annual audits were introduced.
The figures in Tables 4 and 5 are taken from the accounts as originally published, as there is
not a complete record of the revised versions. Because of problems described above,
meaningful analysis would be difficult. However, it should be mentioned that the interest and
dividends on debentures, loans and preference shares rose from £28k in 1863 to £170k in
1872, as a result of the capital raised to expand the MR network. This figure is important
because it is the burden of fixed charges, which needs to be satisfied before any payment to
the ordinary shareholders can be made.
5. The Early Years of Sir Edward Watkin’s Chairmanship 1873-77
As indicated above, the MR in 1872 had serious financial problems. Of necessity, the first
priority of Watkins chairmanship was to overcome these and put the company back in a
stable position. Despite his connections with the MSLR and the SER, any plans that he may
have had for the MR to co-operate with these railways had per force to be to be put on the
back burner. In any event, the previous management had obtained powers to extend the MR
beyond Moorgate to Bishopsgate (Liverpool Street) and ultimately under Watkin further
powers were obtained to extend to Aldgate. These extensions were to be the priority after
1872. In addition to this, there was pressure from the Metropolitan Board of Works and the
City of London authorities to complete the Inner Circle, which required some
accommodation with the MDR, which was not financially strong enough to extend its line
eastwards from Mansion House. Because the relations between Watkin and the MDR
chairman, James Forbes, were difficult, it would not be until 1879 that the two railways were
able to obtain parliamentary authority for a joint scheme to complete the Inner Circle. Two
years earlier, the MR had obtained powers to extend from Aldgate to Tower Hill. This section
looks at the MR’s financial performance 1873-77, before the final push to complete the Inner
Circle began. The year 1877 was a unique year for the MR in that there were no lines under
construction.

13
Operations between 1873 and 1877 remained as before, with the extensions to Liverpool
Street and Aldgate opening in 1875 and 1876 respectively. However. The MR did start a
service to Richmond from the beginning of 1877 via the H&CR and the LSWR.
The increases in capital authorised and created and the amount received into the capital
account over the period were as follows:
31 December 1872 31 December 1877 Increase
£m £m £m
Capital Authorised & Created
Shares 5.950 5.950
Loans 1.867 2.474 0.607
Total 7.817 8.424 0.607
Amount Received into Capital Account
Shares 5.802 5.835 0.033
Loans 1.951 2.400 0.449
Premiums 0.020 0.020
Total 7.753 8.255 0.501
The increase of capital authorised and created of £0.607m was primarily related to the
extension from Moorgate to Aldgate, although a small amount was for purchase of H&CR
debentures.
The total spent on capital account by the end of 1877 was £8.337m made up of:
£m
Lines open for traffic 7.859
Working stock 0.264
Subscriptions to other railways
- M&SJWR 0.200
- H&CR 0.018
Other (0.004)
Total 8.337
The capital expenditure 1873-77 was made up of the following:

14
Table 6
Analysis of Capital Expenditure 1873-77
1873 1874 1875 1876 1877 Total
£ £ £ £ £ £
Moorgate - Aldgate
Under Construction
Land Purchase 50,723 120,620 43,294 61,201 275,838
Construction of Way
& Stations 13,300 58,778 35,194 20,604 127,876
Law & Parliamentary 1,947 2,510 2,279 994 7,730
65,970 181,908 80,767 82,799 411,444
Lines Open for Traffic
Land Purchase 150,764 56,936 17,110 36,229 64,934 325,973
Construction of Way &
Stations 2,452 7,616 5,019 73,881 29,029 117,997
Law & Parliamentary 31,836 2,509 2,605 2,244 3,805 42,999
185,052 67,061 24,734 112,354 97,768 486,969
Sub Total Lines 251,022 248,969 105,501 195,153 97,768 898,413
Working Stock (4,818) (813) 884 (4,747)
Subscription
(M&SJWR)
99,335 665 100,000
Subscription (H&CR) 11,000 7,575 18,575
Credits Surplus Land (100,000) (121,555) (8,841) (61,701) (16,806) (308,903)
Other 40,000 40,000
Total 146,204 167,414 195,182 146,001 88,537 743,338

15
The Moorgate to Aldgate extension was completed during the period. The total cost was
£1.044m, including the £0.632m spent prior to 1873. As noted above in relation to the early
development of the MR, the high cost of land dwarfed the cost of constructing the railway
infrastructure. However, the benefit from the sale of surplus land did help to reduce the
overall capital spend, amounting to £0.309m in 1873-77. This had its origins in MR Acts of
1862 and 1868, which enabled the company to grant building leases of superfluous land and
to purchase and hold property not required for the construction of the railway. This was
further refined in the MR Act of 1873, which allowed the company to retain any
superfluous lands, whenever acquired, including those acquired in the future. To take
advantage of these powers, the company merely had to believe that such lands may be
hereafter necessary for the widening of the railway, stations or sidings.
As can also be seen, the MR began to take up shares and debentures in sister railways, the
M&SJWR and the H&CR. The £40k item of other expenditure in 1874 related to the bonus
payable on redemption of redeemable preference shares.
Table 7 gives the revenue account for the period 1873-77:

16
Table 7
Revenue Account 1873-1877
1873 1874 1875 1876 1877
£ £ £ £ £
Total Receipts
Passenger Trains 390,318 392,605 423,512 450,566 464,777
Freight Trains 18,065 18,945 24,852 25,226 26,050
Other 30,119 30,138 31,360 32,148 33,431
Sub Total 438,502 441,688 479,724 507,940 524,258
Total Expenditure Maintenance of Way, Works &
Stations 22,490 22,968 21,684 22,936 24,192
Locomotive Power 48,166 47,017 41,536 40,466 41,125
Carriage & Wagon Repairs 9,425 9,977 9,687 10,245 10,504
Traffic Expenses 48,464 51,542 54,852 58,604 60,202
General Charges 18,527 19,562 24,377 24,307 22,994
Law Charges 3,825 2,092 1,623 3,257 3,885
Compensation 4,223 1,461 786 6,676 2,418
Rates, Taxes & Government Duty 26,354 28,084 30,703 31,232 30,260
Other 18,747 14,354 12,155 11,098 10,904
Sub Total 200,221 197,057 197,403 208,821 206,484
Allowance for Working Other Cos
Trains 15,165 15,622 15,996 16,310 16,930
Revenue Balance 253,446 260,253 298,317 315,429 334,704
Whereas total receipts had tended to plateau in the years 1869-72, growth resumed in 1873
and those in 1877 were 18 per cent higher than in 1872. Although freight train revenues in
1877 still only accounted for 5 per cent of the total, that percentage had been rising slowly
during the period. Rents still accounted for the bulk of the other revenues. Compared to
revenues, total expenditure in 1877 was about £7k lower than in 1872, in part as a result of
the tighter financial controls exercised since the problems experienced up to 1872. Traffic
expenses increased proportionately more than the other categories, whereas locomotive
power costs tended to fall. The allowances for working other companies’ trains, which had
peaked at £53k in 1870, stabilised at around £16k per annum.
The Net Revenue & Appropriation Account 1873-77 is shown below:
17
Table 8
Net Revenue & Appropriation Account 1873-1877
1873 1874 1875 1876 1877
£ £ £ £ £
Receipts
B/Fwd Balance 313
Balance on Revenue Account 253,446 260,253 298,317 315,429 334,703
Rents Received 10,394 5,106
Dividends Received 1,000 1,750 2,375 3,125 2,750
Bank & General Interest 5,755 2,684 2,717 3,955 3,024
Lands Committee 25,000 37,063 47,276 47,054 53,124
Other 10,823
Sub Total 295,595 306,856 350,685 369,563 404,737
Expenditure
Interest on Debentures & Loans 84,725 88,720 98,703 101,242 98,692
Others 17,947 14,232 12,694 11,393 10,383
Sub Total 102,672 102,952 111,397 112,635 109,075
Transfer to Special Account/Reserves 11,110 1,349 3,882 5,000 13,858
Balance Available for Dividends 181,813 202,555 235,406 251,928 281,804
Dividends
Preference Stocks 91,625 92,325 80,082 80,082 80,082
Preferred Ordinary Stock 3,045 3,722 4,060 4,250 4,627
Consolidated Ordinary Stock 87,143 106,508 150,079 165,690 193,758
Deferred Ordinary Stock 1,185 1,593 2,699
Sub Total 181,813 202,555 235,406 251,615 281,166
Balance C/Fwd 0 0 0 313 638
Dividend Percentage on Consolidated
Ordinary Stock 2¼% 2¾% 3⅞% 4⅛% 4¾%
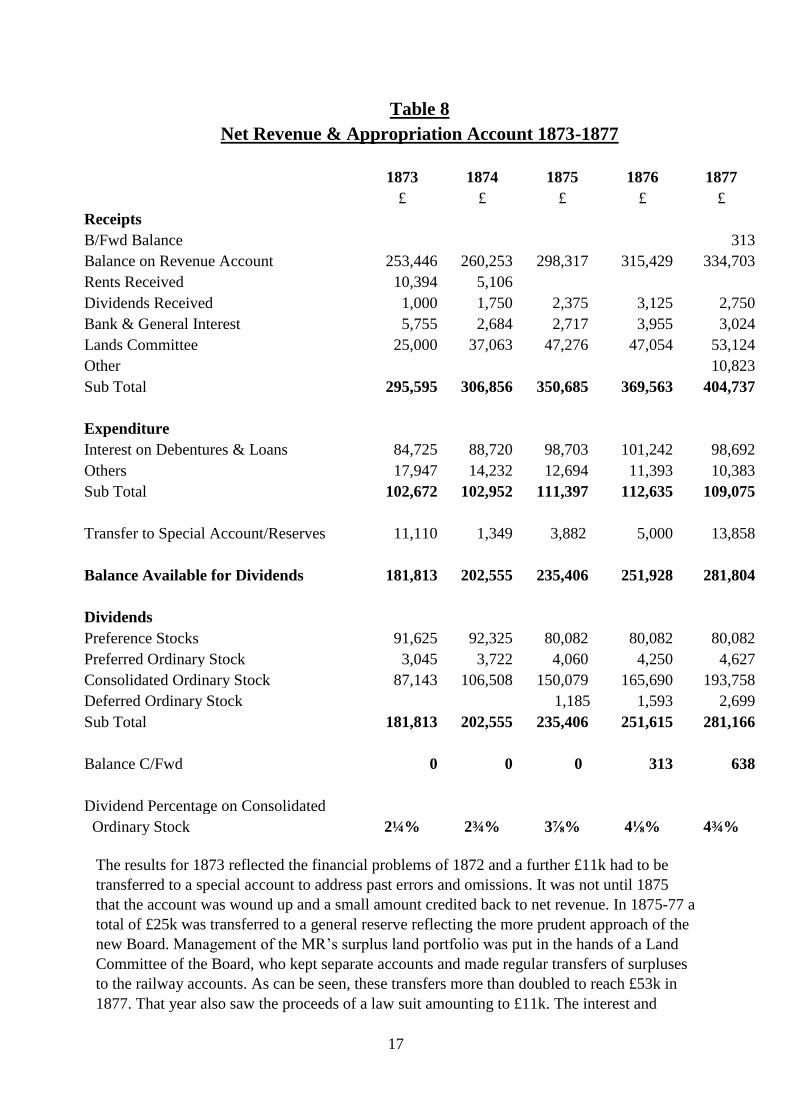
The results for 1873 reflected the financial problems of 1872 and a further £11k had to be
transferred to a special account to address past errors and omissions. It was not until 1875
that the account was wound up and a small amount credited back to net revenue. In 1875-77 a
total of £25k was transferred to a general reserve reflecting the more prudent approach of the
new Board. Management of the MR’s surplus land portfolio was put in the hands of a Land
Committee of the Board, who kept separate accounts and made regular transfers of surpluses
to the railway accounts. As can be seen, these transfers more than doubled to reach £53k in
1877. That year also saw the proceeds of a law suit amounting to £11k. The interest and

18
dividends on debentures, loans and preference shares rose from £170k in 1872 to £179k in
1877. The preferred ordinary shareholders received their 6 per cent during the period and it
was possible for the holders of consolidated ordinary stock see their dividends rise from a
low of 2¼ per cent in 1873 to 4¾ per cent in 1877. The deferred ordinary stock holders had
not received a dividend since 1871 and this was resumed at 1¾ per cent in 1875 rising to 3½
per cent in 1877.
6. Reaching Out Beyond the Inner Circle 1878-84
By 1877, the finances of the MR had been well stabilised by the Watkin regime. In the
following years, it became possible to consider extending the system both to the north west
and south east. To the north west, the MR had been involved with the M&SJWR since 1864
and by 1868 had invested £100k in the company’s preference stock. The 2¼ mile single line
to Swiss Cottage was completed in 1868 and was worked from the start by the MR. Although
the financial results of the line were not encouraging, as early as 1874 Watkin indicated his
desire to shareholders that the MR should connect with Northampton and Birmingham and
many other important townsviii. However, reaching a deal for the MR to take over the
M&SJWR proved tortuous and it was not until 1882 that the company was fully absorbed. In
the meantime powers had been granted to extend the line to Kingsbury (now Neasden) and
double the original section. A further extension from Kingsbury to Harrow was granted to the
MR and M&SJWR jointly. Watkin also had his eyes on a route to the north of Harrow and
had joined the board of the Aylesbury & Buckingham Railway (A&BR) in 1875. By Acts of
1880 and 1881, the MR obtained powers to extend firstly from Harrow to Rickmansworth
and then to Aylesbury and Chesham. From 1880, the MR was operating trains to Harrow and
by 1884 construction work to the north was under way.
To the south east, it was apparent that a link with the SER’s line at New Cross would need to
cross the Thames using the East London Railway (ELR), which had opened in 1876, and that
there would need to be a link off the Inner Circle to reach that railway. As mentioned above,
powers to complete the Inner Circle, including a link to the ELR, were not granted until 1879.
It would take until 1884 for all the work to be completed and MR trains were able to run
through to New Cross. An Act of 1882 modified the original powers to link the Inner Circle
to the ELR and set up a Joint Committee to run the latter consisting of the MR, MDR,
London Brighton & South Coast Railway (LBSCR), LCDR and SER.
The increases in capital authorised and created and the amount received into the capital
account over the period were as follows:

19
31 December 1877 31 December 1884 Increase
£m £m £m
Capital Authorised & Created
Shares 5.950 8.684 2.734
Loans 2.474 3.184 0.710
Total 8.424 11.868 3.444
Amount Received into Capital Account
Shares 5.835 7.883 2.048
Loans 2.400 3.036 0.636
Premiums/(Discounts) 0.020 (0.010) (0.030)
Total 8.255 10.909 2.654
The increase of £3.444m in capital authorised and created was related to the expansion
described above, including the acquisition of the M&SJWR. At the eastern end there was
direct expenditure on the Aldgate to Minories (Tower Hill) extension and the Aldgate North
Curve, as well as contributions to the City Lines & Extensions Joint Committee (CL&EJC).
The total amount spent on capital account by the end of 1884 was £10.915m made up of:
£m
Lines under construction 1.550
Lines open for traffic 8.956
Working stock 0.369
Subscriptions to other railways 0.040
Total 10.915
The capital expenditure 1878-84 was made up of the following:

20
Table 9 Part 1
Analysis of Capital Expenditure 1878-84
1878 1879 1880 1881 1882 1883 1884 Total
£ £ £ £ £ £ £ £
Lines Under
Construction
St John’s Wood -
Kingsbury
Land Purchase 210,667 15,332 22,564 9,410 257,973
Construction of Way
& Stations 21,341 122,482 32,709 44,612 221,144
232,008 137,814 55,273 54,022 479,117
Kingsbury -
Harrow
Land Purchase 32,358 15,015 7,821 55,094
Construction of Way
& Stations
37,500 54,844 4,355 96,699
69,758 69,859 12,176 151,793
Harrow-Aylesbury
Land Purchase 726 10,026 17,520 46,023 18,487 92,782
Construction of Way
& Stations
29,259 29,259
Law & Parliamentary 402 402
726 10,026 17,922 46,023 47,746 122,443
Neasden Depot 45,685 45,685
Hendon Extension 20,264 20,264
Sub Total North
West
232,008 207,572 125,858 121,909 17,922 46,023 68,010 819,302

21
Table 9 Part 2
Analysis of Capital Expenditure 1878-84
1878 1879 1880 1881 1882 1883 1884 Total
£ £ £ £ £ £ £ £
Lines Under
Construction
B/Fwd North West 232,008 207,572 125,858 121,909 17,922 46,023 68,010 819,302
Minories Extension
Land Purchase 34,338 40,822 43,004 110,981 132,745 1,407 363,297
Construction of Way
& Stations
19,620 102,499 2,520 124,639
34,338 40,822 43,004 130,601 235,244 3,927 487,936
Aldgate North
Curve
Land Purchase 58,297 58,297
Construction of Way
& Stations
44,196 12,500 56,696
44,196 70,797 114,993
City Lines &
Extensions
550 550
Sub Total
South East
34,338 41,372 43,004 130,601 235,244 48,123 70,797 603,479
Sub Total Under
Construction
266,346 248,944 168,862 252,510 253,166 94,146 138,807 1,422,781

22
Table 9 Part 3
Analysis of Capital Expenditure 1878-84
1878 1879 1880 1881 1882 1883 1884 Total
£ £ £ £ £ £ £ £
B/Fwd Lines Under
Construction 266,346 248,944 168,862 252,510 253,166 94,146 138,807 1,422,781
Lines Open for
Traffic
Land Purchase 17,920 9,013 7,418 1,099 108,039 7,130 5,418 156,037
Construction of Way
& Stations 2,548 629 176 3,556 92,162 19,618 10,390 129,079
Law & Parliamentary 1,983 1,573 1,725 2,454 2,307 2,565 4,052 16,659
Other 4,286 4,286
22,451 11,215 9,319 7,109 202,508 29,313 24,146 306,061
Sub Total Lines 288,797 260,159 178,181 259,619 455,674 123,459 162,953 1,728,842
Working Stock (72) 5,658 31,414 5,391 2,374 16,792 44,217 105,774
Purchase of
M&SJWR
133,170 141,822 274,992
Subscription H&CR 12,925 8,000 500 21,425
Subscription
CL&EJC
478,500 413,500 212,575 1,104,575
Credits Surplus Land (45,000) (6,729) (19,447) (12,007) (5,000) (19,000) (107,583)
Credits from City
Authorities
(300,000) (300,000)
Credit from MDR (250,000) (250,000)
Total 256,250 259,088 198,148 253,503 1,064,718 695,573 (149,255) 2,578,025

23
It is perhaps surprising that the expenditure on the Aldgate North curve, the Minories
extension and the CL&EJC was shown under lines under construction in the accounts for the
half year to 30 December 1884, when services had started from 6 October. However, the
transfer of the cost to lines open for traffic took place in the accounts for the following half
year. What stands out is the huge cost of completing the last few miles of the Inner Circle and
the extension to the ELR, particularly for the land, compared to the cost of extending the old
M&SJWR out to Harrow; for roughly two miles compared to seven miles. For the Minories
extension of less than a mile, land at £0.363m took up near three quarters of the cost, whereas
from Kingsbury to Harrow, about 3½ miles, the cost of the land at £55k was less than the cost
of construction and only made up 36 per cent of the total. Although the cost of the MR’s
contribution to the CL&EJC is shown as £1.105m, the net cost was actually £0.805m because
of a £0.300m contribution from the City Board of Works and Commissioner for Sewers for
improvements enabled by the construction of the railway. The MR also received £0.250m
from the MDR for its extension to Minories, which was to become part of the line controlled
by the CL&EJC, but this was credited separately from the cost.
Included in other works under construction was £20k for a projected extension from West
Hampstead to Hendon that was never to be built. Credits from sales of surplus land of
£0.108m during the period helped to offset the cost of the capital projects. Working stock
increased by £0.106m over the period 1878-84 to total £0.369m at the end of 1884. The
increase took place in two main tranches, one around 1880 when the extension to Harrow was
completed and another around 1884 for the new ELR and Inner Circle services, and included
22 class B locomotives. In 1882, the MR finally acquired the M&SJWR and had to pay a
further £0.275m over and above its cumulative investment of £0.200m. The MR’s investment
in the H&CR more than doubled in the period to £40k.
Table 10 gives the revenue account for the period 1878-84:

24
Table 10
Revenue Account 1878-1884
1878 1879 1880 1881 1882 1883 1884
£ £ £ £ £ £ £
Total Receipts
Passenger Trains 467,561 478,189 497,126 520,762 527,294 573,350 572,596
Freight Trains 27,311 28,015 29,087 31,015 29,705 30,418 31,155
Other 33,381 33,079 33,167 35,331 35,347 36,073 35,851
Sub Total 528,253 539,283 559,380 587,108 592,346 639,841 639,602
Total Expenditure Maintenance of Way, Works
& Stations 24,309 23,771 25,635 25,727 25,899 27,407 26,336
Locomotive Power 44,497 44,712 49,844 53,628 55,551 58,084 66,794
Carriage & Wagon Repairs 11,088 12,139 12,892 14,063 19,081 20,868 22,567
Traffic Expenses 59,990 62,055 65,316 68,262 63,025 67,170 70,624
General Charges 23,575 23,296 23,753 23,197 25,862 24,956 25,192
Law Charges 3,221 2,392 2,086 2,803 6,513 4,260 5,461
Compensation 2,156 1,574 1,040 2,885 1,041 303 1,762
Rates, Taxes & Government
Duty 29,994 31,694 31,841 38,661 40,848 41,358 36,920
Other 9,670 9,385 10,840 13,179 10,350 10,494 11,551
Sub Total 208,500 211,018 223,247 242,405 248,170 254,900 267,207
Allowance for Working
Other Cos Trains 22,158 21,709 23,374 23,561 23,838 14,333 16,374
Revenue Balance 341,911 349,974 359,507 368,264 368,014 399,274 388,769
25
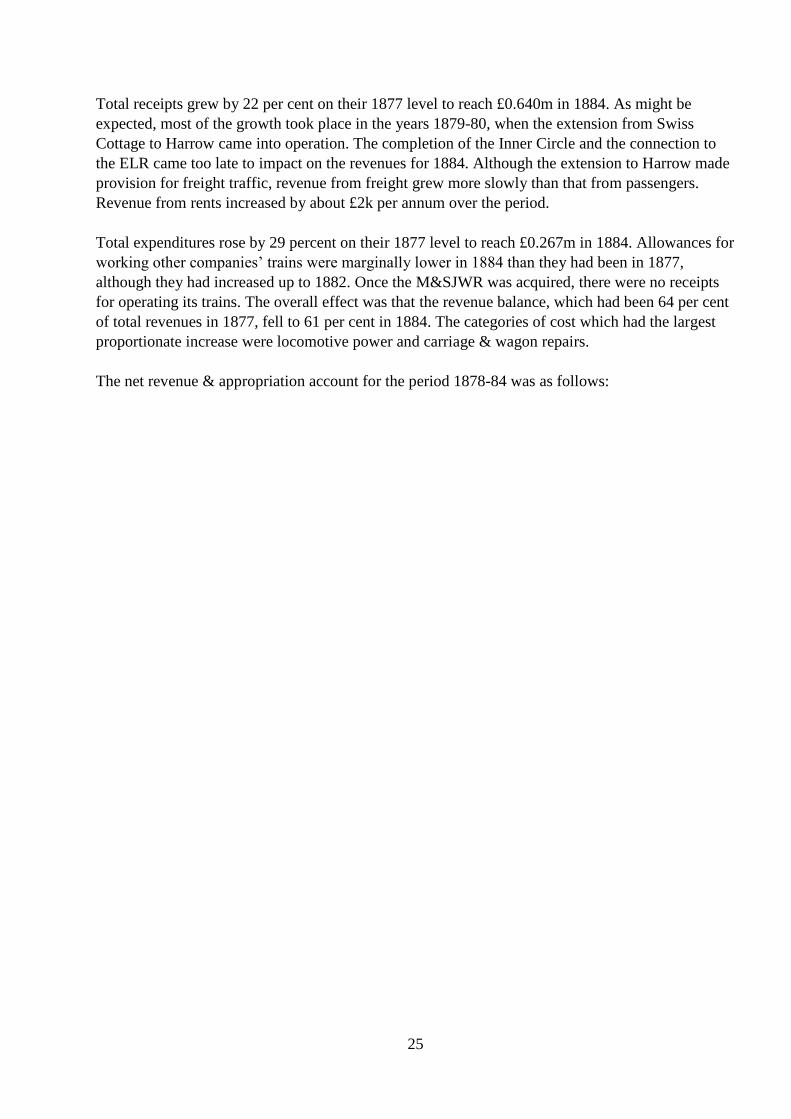
Total receipts grew by 22 per cent on their 1877 level to reach £0.640m in 1884. As might be
expected, most of the growth took place in the years 1879-80, when the extension from Swiss
Cottage to Harrow came into operation. The completion of the Inner Circle and the connection to
the ELR came too late to impact on the revenues for 1884. Although the extension to Harrow made
provision for freight traffic, revenue from freight grew more slowly than that from passengers.
Revenue from rents increased by about £2k per annum over the period.
Total expenditures rose by 29 percent on their 1877 level to reach £0.267m in 1884. Allowances for
working other companies’ trains were marginally lower in 1884 than they had been in 1877,
although they had increased up to 1882. Once the M&SJWR was acquired, there were no receipts
for operating its trains. The overall effect was that the revenue balance, which had been 64 per cent
of total revenues in 1877, fell to 61 per cent in 1884. The categories of cost which had the largest
proportionate increase were locomotive power and carriage & wagon repairs.
The net revenue & appropriation account for the period 1878-84 was as follows:

26
Table 11
Net Revenue & Appropriation Account 1878-84
1878 1879 1880 1881 1882 1883 1884
£ £ £ £ £ £ £
Receipts
B/Fwd Balance 638 502 5,949 4,155 1,217 717 2,019
Balance Revenue Account 341,911 349,974 359,507 368,264 368,014 399,274 388,769
Dividends Received 3,000 2,750 2,750 2,750 3,758
Bank & General Interest 90 1,260 1,510 4,031 1,600 1,600 4,509
Lands Committee 56,625 60,137 63,505 63,121 65,297 67,591 67,284
Other 1,171 6,500 5,461
403,435 414,623 433,221 442,321 446,386 469,182 468,042
Expenditure
Interest on Debentures & Loans 99,641 103,521 104,361 103,692 106,116 115,322 120,900
Other 10,042 9,903 12,955 11,463 9,146 13,513 8,932
109,683 113,424 117,316 115,155 115,262 128,835 129,832
Transfer to/(from) Reserve 1,500 3,500 15,000 24,199 (23,566)
Balance Available for Dividends 292,252 297,699 300,905 302,967 331,124 340,347 361,776
Preference Stocks 80,082 80,082 80,082 80,082 96,738 103,408 108,408
Preferred Ordinary Stocks 4,628 4,628 4,778 4,984 4,996 4,996 4,996
Consolidated Ordinary Stock 203,956 203,956 208,706 213,342 225,342 226,592 235,967
Deferred Ordinary Stock 3,084 3,084 3,184 3,342 3,331 3,332 3,330
291,750 291,750 296,750 301,750 330,407 338,328 352,701
Balance C/Fwd 502 5,949 4,155 1,217 717 2,019 9,075
% on Consolidated Ordinary Stock 5% 5% 5% 5% 5% 5% 5%

27
As can be seen, revenue from the Lands Committee continued to make an important contribution to
the funds available to pay interest charges and dividends. The annual total rose from £53k in 1877
to £67k in 1884. Other receipts included a profit related to the sale of electric telegraph equipment
in 1882 and the first share of profits from the CL&EJC in 1884. The interest and dividends on
debentures, loans and preference shares rose from about £179k in 1877 to nearly £229k in 1884,
reflecting the additional capital raised for the various extensions. A reorganisation of preference
stocks took place in 1881, when all previous issues at 5 per cent were replaced by 4 per cent
perpetual preference stock. Throughout the period, the dividends on preferred ordinary stock,
consolidated ordinary stock and deferred ordinary stock were maintained at 6 per cent, 5 per cent
and 4 per cent respectively. Whereas transfers to the general reserves totalling £44k were made in
the years 1878-81, none were made in the following two years and a transfer of £24k was made
from the reserves in 1884.
7. The Drive to the North West Reaches its Zenith 1885-1892
In 1884 the MR had already begun work to extend beyond Harrow to Aylesbury. The first seven
miles to Rickmansworth had been authorised by parliament first and were opened to traffic in 1887.
Although Aylesbury was the principal target, the line from Rickmansworth was ultimately to be
built in two stages. The first stage was to Chesham, which was not in the original powers and
required a further act in 1885. A double track of 5 miles was to be laid to Chalfont &Latimer with
the intention of going on to Aylesbury and a further 2½ miles of single-track branch to Chesham.
Watkin looked upon the latter as a possible route to join the LNWR at Tring. The line between
Rickmansworth and Chesham was completed in 1889. The final 16¼ miles to Aylesbury was
completed in 1892. In parallel with this extension, the MR had obtained powers under an act of
1890 to acquire the A&BR, which were exercised in 1891. The existing A&BR single line between
Aylesbury and Verney Junction would give the MR just over 50 route miles from Baker Street.
However, the MR initially could only operate as far as a temporary station in Aylesbury, until a
dispute with the GWR about powers to use the joint station in the town had been settled. It would
not be until 1894 that refurbishment of the joint station was completed, and the MR could run
through trains to Verney Junction. Nevertheless, by 1892 the MR had largely fulfilled the role that
Watkin had envisaged for it to the north west of London. Although it still had improvement works
to carry out after 1892, the focus would shift to what would become the Great Central Railway
(GCR) London Extension.
By contrast, the eastern end of the MR system had reached a stable position. It was able to run
through trains to connect with the SER at New Cross and use the station at Whitechapel as a
terminus. It would be the MDRix in conjunction with the independent Whitechapel & Bow Railway
and London Tilbury & Southend Railway (LT&SR) that would drive further eastern expansion.
An important development during this period was a further reorganisation of the MR’s management
of its surplus lands. Watkin had been uneasy for some time that profits from the surplus lands had
been unduly inflating the results of its railway operations and complicating its competitive position
vis a vis other railways. By an act of 1885, the ordinary stock of the company was split into two
portions. New surplus land shares with a value of £2.641m were issued to stock holders at a rate of
£1 for every £2 of consolidated ordinary stock. The effect on the net revenue account and the

28
appropriation account is covered below. At the same time, there was a reorganisation of capital,
which extinguished both the existing preferred and deferred ordinary shares.
The increases in capital authorised and created and the amount received into the capital account
over the period were as follows:
31 December 1884 31 December 1892 Increase
£m £m £m
Capital Authorised & Created
Shares 8.684 9.292 0.608
Loans 3.184 3.383 0.199
Total 11.868 12.675 0.807
Amount Received into Capital Account
Shares 7.883 8.100 0.217
Loans 3.036 3.310 0.274
Premiums/(Discounts) (0.010) (0.005) 0.005
Total 10.909 11.405 0.496
The increase in capital authorised and created of £807m was related to the expansion described
above, including the acquisition of the A&BR. The total amount spent on capital account by the end
of 1892 was £11.438m made up of:
£m
Lines open for traffic 8.338
Working stock 0.419
Subscriptions to other railways 0.040
Surplus Land Stock 2.641
Total 11.438
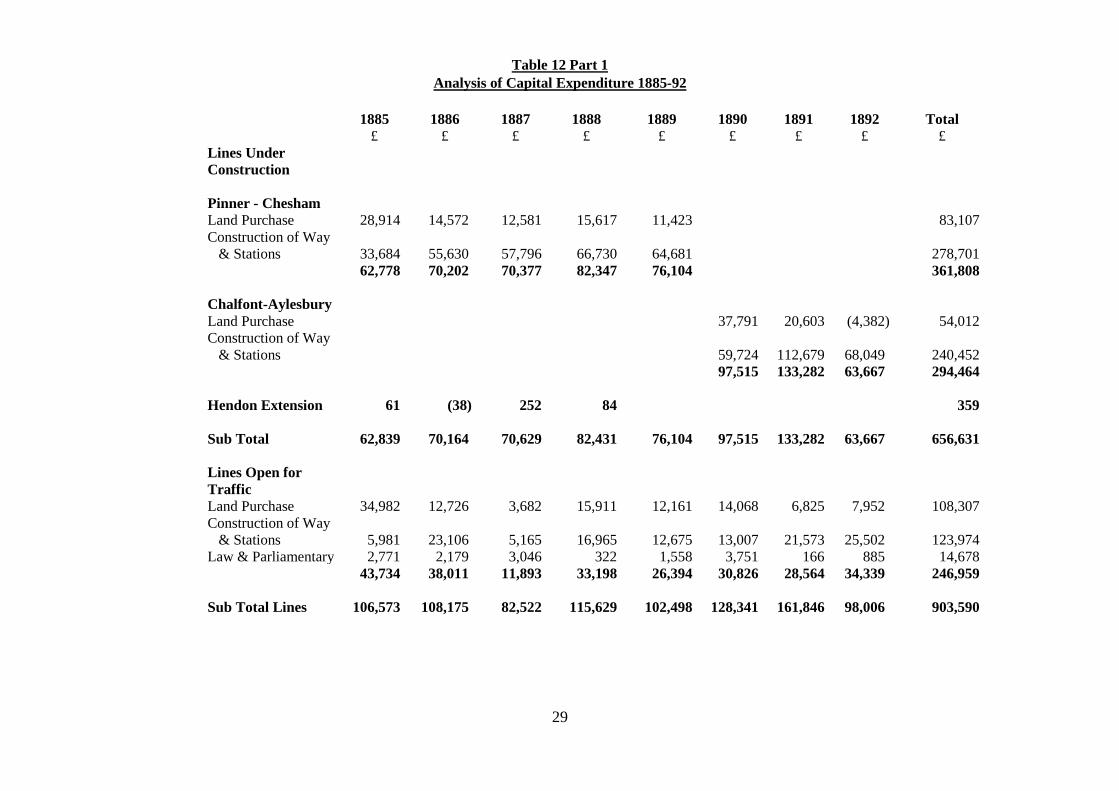
The capital expenditure 1885-92 was made up of the following:
29
Table 12 Part 1
Analysis of Capital Expenditure 1885-92
1885 1886 1887 1888 1889 1890 1891 1892 Total
£ £ £ £ £ £ £ £ £
Lines Under
Construction
Pinner - Chesham
Land Purchase 28,914 14,572 12,581 15,617 11,423 83,107
Construction of Way
& Stations 33,684 55,630 57,796 66,730 64,681 278,701
62,778 70,202 70,377 82,347 76,104 361,808
Chalfont-Aylesbury
Land Purchase 37,791 20,603 (4,382) 54,012
Construction of Way
& Stations
59,724 112,679 68,049 240,452
97,515 133,282 63,667 294,464
Hendon Extension 61 (38) 252 84 359
Sub Total 62,839 70,164 70,629 82,431 76,104 97,515 133,282 63,667 656,631
Lines Open for
Traffic
Land Purchase 34,982 12,726 3,682 15,911 12,161 14,068 6,825 7,952 108,307
Construction of Way
& Stations 5,981 23,106 5,165 16,965 12,675 13,007 21,573 25,502 123,974
Law & Parliamentary 2,771 2,179 3,046 322 1,558 3,751 166 885 14,678
43,734 38,011 11,893 33,198 26,394 30,826 28,564 34,339 246,959
Sub Total Lines 106,573 108,175 82,522 115,629 102,498 128,341 161,846 98,006 903,590

30
Table 12 Part 2
Analysis of Capital Expenditure 1885-92
1885 1886 1887 1888 1889 1890 1891 1892 Total
£ £ £ £ £ £ £ £ £
Sub Total Lines
B/Fwd
106,573 108,175 82,522 115,629 102,498 128,341 161,846 98,006 903,590
Working Stock 4,890 824 3,316 130 8,950 1,232 12,530 17,476 49,348
Subscription CL&EJC 22,143 (7,285) 12,837 (97,626) (23,980) 1,590 4,201 (13,725) (101,845)
Purchase of A&BR 100,663 100,663
Credits Surplus Land (71,594) (913) (9,000) (81,507)
Transfer of Aylesbury
& Rickmansworth
line to the A&RR
(347,714) (347,714)
Total 62,012 100,801 98,675 18,133 78,468 131,163 178,577 (145,294) 522,535

31
As mentioned above, the Minories Extension and the Aldgate North Curve schemes, which had
been completed by 1884, were transferred to lines open for traffic in 1885. Apart from a small
amount spent on the Hendon Extension, before it was finally abandoned in 1889, the only line
under construction was that from Harrow to Aylesbury, including the Chesham branch. In total, this
28¾ mile route cost £778k, including £122k spent before 1885, of which only 30 per cent related to
the cost of the land. The line from Rickmansworth to Aylesbury and Chesham was authorised by
two Acts in 1885. One covered only the Chesham branch and was an exclusively MR project. The
other provided for a separate Aylesbury & Rickmansworth Railway (A&RR), which was to be built
for it by the MR. An amount of £348k spent by the MR on the Aylesbury & Rickmansworth line
was transferred to the A&RR in 1892. This included the amount designated in the accounts for
work on the Chalfont to Aylesbury section plus part of that for work on Pinner to Chesham section.
Also, in 1892, the MR acquired the A&BR at a cost of £101k and its proprietors were paid in the
form of MR 3 per cent preference shares at a lower rate than the 4 per cent preference shares
already in existence and indicating the weak financial state of the A&BR.
The MR had regular capital transactions with the CL&EJC during the period. There were several
large credits particularly in 1888, 1889 and 1892, which mainly related to surplus lands being sold.
In fact, over the years 1885-92 the MR received a net amount of £102k from the CL&EJC. The MR
also had receipts from the sale of surplus lands on its own account during the period amounting to
£82k, particularly in 1885, when the work at the eastern end of the system had been completed. The
MR’s investment in the H&CR remained static at £40k. Working stock increased by £49k during
the period to a total of £419k, as the various stages of the route to Aylesbury were opened. This
included four class C locomotives and “Jubilee” stock carriages.
Table 13 gives the revenue account for the period 1885-92:

32
Table 13
Revenue Account 1885-1892
1885 1886 1887 1888 1889 1890 1891 1892
£ £ £ £ £ £ £ £
Total Receipts
Passenger Trains 561,244 584,953 558,650 575,908 590,394 601,895 628,214 633,954
Freight Trains 30,737 31,316 31,012 33,857 36,702 40,393 42,080 43,135
Other 36,458 37,281 37,767 38,204 39,610 38,561 38,729 38,778
Sub Total 628,439 653,550 627,429 647,969 666,706 680,849 709,023 715,867
Total Expenditure Maintenance of Way, Works &
Stations 25,467 27,451 27,667 28,653 30,824 29,256 29,951 31,470
Locomotive Power 76,051 75,906 77,910 79,240 84,667 85,680 85,606 87,215
Carriage & Wagon Repairs 25,599 25,828 25,471 26,034 26,980 25,769 26,789 27,394
Traffic Expenses 71,198 72,433 72,771 73,737 77,352 79,042 81,468 86,718
General Charges 26,389 27,769 29,165 28,165 29,302 28,770 28,676 29,443
Law Charges 5,253 4,704 3,025 3,047 2,930 2,959 4,337 5,682
Compensation 1,390 3,091 690 2,596 394 947 3,094 1,130
Rates, Taxes & Government Duty 37,971 40,168 40,826 38,485 41,771 42,872 46,818 45,187
Other 10,935 12,898 11,534 11,787 12,089 11,700 12,219 12,028
Sub Total 280,253 290,248 289,059 291,744 306,309 306,995 318,958 326,267
Allowance for Working Other Cos
Trains 21,032 23,519 26,000 24,756 22,142 21,303 21,727 22,374
Revenue Balance 369,218 386,821 364,370 380,981 382,539 395,157 411,792 411,974

33
Total receipts grew by 12 per cent on their 1884 level to reach £0.716m in 1892. Most of the
increase took place from 1889 onwards, when the extension from Rickmansworth to Chesham was
opened. Revenue from freight traffic grew by 38 per cent from its 1884 level at last reflecting the
impact of the facilities, which the MR had built for it from Finchley Road northwards. Revenue
from rents increased by about £3k per annum over the period.
Total expenditures rose by 22 per cent on their 1884 level to reach £0.326m in 1892. Allowances
from for working other companies trains rose from £16k in 1884 to £22k in 1892, although they
had reached £26k in 1887. The increases were the result of the reorganisation of services following
the completion of the Inner Circle and the introduction of through services to the ELR. The
proportions of the various expenditure categories making up the total remained largely similar
between 1884 and 1892. Locomotive power showed the largest relative increase and other (mainly
charges from other companies working MR trains) the largest relative decrease.
The net revenue & appropriation account for the period 1885-92 was as follows:

34
Table 14
Net Revenue & Appropriation Account 1885-92
1885 1886 1887 1888 1889 1890 1891 1892
£ £ £ £ £ £ £ £
Receipts
B/Fwd Balance 9,075 14,909 52,527 21,228 21,811 14,012 9,592 10,943
Balance Revenue Account 369,218 386,821 364,370 380,981 382,539 395,157 411,792 411,974
Bank & General Interest 7,217 3,199 7,873 8,908 6,493 5,914 9,139 6,723
Railway Estates Revenue 70,528 70,839 39,339 6,891 7,027 8,610 8,310 9,154
CL&EJC 27,274 15,096 18,438 17,395 16,886 14,755 17,784 15,849
Other 36,381
Sub Total 483,312 527,245 482,547 435,403 434,756 438,448 456,617 454,643
Expenditure
Interest on Debentures & Loans 121,875 121,822 123,481 128,059 128,044 129,333 131,458 131,544
Other 15,185 14,743 14,762 13,879 14,443 14,664 15,652 13,728
Sub Total 137,060 136,565 138,243 141,938 142,487 143,997 147,110 145,272
Transfer to/(from) Reserve
Balance Available for Dividends 346,252 390,680 344,304 293,465 292,269 294,451 309,507 309,371
Preference Stocks 113,408 113,408 118,405 126,404 126,404 126,404 126,904 127,904
Preferred Ordinary Stocks 4,996 4,996
Consolidated Ordinary Stock 211,273 217,876 204,671 145,250 151,853 158,455 171,660 171,660
Deferred Ordinary Stock 1,666 1,873
Sub Total 331,343 338,153 323,076 271,654 278,257 284,859 298,564 299,564
Balance C/Fwd 14,909 52,527 21,228 21,811 14,012 9,592 10,943 9,807
% on Consolidated Ordinary
Stock
4% 4¼% 3⅞% 2¾% 2⅞% 3% 3¼% 3¼%
Surplus Lands Dividend 33,011 66,022 66,022 66,022 66,022 69,324
% on Surplus Lands Stock 2½% 2½% 2½%
2½%
2½%
2⅝%

35
The change involving the issue of Surplus Land Stock took place in the second half of 1887.
Whereas prior to that time the net revenue account had received transfers from the Lands
Committee of tens of thousands of pounds per annum reaching £71k in 1886, thereafter the Surplus
Lands Committee kept separate accounts for the properties represented by the Surplus Lands Stock.
At the end of each accounting period the Committee made an allocation of its net revenue to
provide a dividend on this stock. The MR still had land transactions relating to properties required
for railway purposes, but by 1892 the revenue income from these was below £10k in each year.
Revenue income from the CL&EJC was £27k in 1885, its first full year but settled down thereafter
to a range of £15k to £18k per annum. The interest and dividends on debentures, loans and
preference shares rose from £229k in 1884 to £259k in 1892, as additions to capital were made for
the extension to Aylesbury and to acquire the A&BR. In 1886, the last full year before the new
Surplus Land Stock was issued, a dividend of 4¼ per cent was paid on the consolidated ordinary
stock. Thereafter, the rate fell to a low of 2¾ per cent in 1888 but recovered to 3¼ per cent in 1891-
92. However, the Surplus Land Stock paid a regular dividend of 2½ per cent in 1887-91 with 2⅝
per cent in 1892. There were no transfers to/from the reserves in the period 1885-92.
8. The Coming of the Great Central 1893-1900
One of Watkin’s motives in becoming Chairman of the MR was to facilitate the development of the
MSLR (name changed to the GCR in 1897) and enable it to serve London. When the MSLR
obtained parliamentary authority for its London extension in 1893, the scheme approved, including
amendments approved in 1896, comprised the following:
- a wholly owned line from Annesley near Nottingham to a junction with the MR just
north of Quainton Road on its Aylesbury-Verney Junction line
- joint use of the MR’s line from Quainton Road to Harrow South junction
- exclusive use of a pair of tracks to built by the MR from Harrow South junction to
Canfield Place near Finchley Road alongside its existing tracks
- a wholly owned line from Canfield Place to a new terminus at Marylebone
Much of the MR’s activity in the period 1893-1900 was related to bringing these plans into effect
and, although the GCR started through running to Marylebone in 1899, the last section of the new
tracks just south of Harrow was not completed until 1900. Watkin was not able to steer the plans
through as Chairman, as ill health caused him to step down in 1894 and John Bell, already General
Manager, took over the chairmanship role as well. One offshoot of the MR’s work in preparing for
the GCR was that it agreed to lease the 6½ mile Brill Tramway, which ran west from Quainton
Road station.
It might have been expected that Bell would not have the close relationship with the GCR that had
been possible because of Watkins’s involvement with both companies. In fact, Bell’s relationship
with William Pollitt, the GCR’s general manager, was particularly combative, because they had
rivals when both working for the MSLR. The matter of most importance was the GCR’s concern
about the suitability of the route that Watkin had devised between Quainton Road and Harrow. The
MR had originally engineered it for local stopping and freight services, not for express passenger
services. The gradients and curves in places were not suitable for high speeds and there was no
provision for additional platforms and freight loops to enable overtaking. During this period, Pollitt

36
started negotiations with the GWR to use their Birmingham cut off line between Northolt and
Ashenden, which would enable GCR trains to approach Marylebone via a short link between
Northolt and Neasden. Powers for this were granted by parliament in 1898. This left the MR with a
sizeable grievance about the traffic from the GCR which would be lost. A settlement of this dispute
would not be resolved until 1904.
The increases in capital authorised and created and the amount received into the capital account
over the period were as follows:
31 December 1892 31 December 1900 Increase
£m £m £m
Capital Authorised & Created
Shares 9.292 9.492 0.200
Loans 3.383 3.566 0.183
Total 12.675 13.058 0.383
Amount Received into Capital Account
Shares 8.100 9.050 0.950
Loans 3.310 3.310 -
Premiums/(Discounts) (0.005) 0.004 0.009
Total 11.405 12.364 0.959
The increase since the end of 1892 in capital authorised and created of £383m was primarily related
to the works needed to accommodate the GCR. The total amount spent on capital account by the
end of 1900 was £12.731m made up of:
£m
Lines under construction 0.041
Lines open for traffic 9.466
Working stock 0.543
Subscriptions to other railways 0.040
Surplus Land Stock 2.641
Total 12.731
The capital expenditure 1893-1900 was made up of the following:

37
Table 15 Part 1
Analysis of Capital Expenditure 1893-1900
1893 1894 1895 1896 1897 1898 1899 1900 Total
£ £ £ £ £ £ £ £ £
Lines Under
Construction
Finchley Road -
Harrow Widening
Land Purchase 4,240 67,558 18,899 11,789 209 102,695
Construction of Way
& Stations 750 28,471 97,865 85,946 15,525 14,162 242,719
Law & Parliamentary 1,423 135 1,558
6,413 96,164 116,764 97,735 15,734 14,162 346,972
Lines Open for Traffic
Land Purchase 6,088 8,119 11,082 6,966 4,203 (635) 407 17,030 53,260
Construction of Way
& Stations 33,266 17,855 90,749 52,673 14,760 50,347 67,464 51,628 378,742
Law & Parliamentary 37 2,182 2,120 2,932 (1) 531 7,801
39,354 25,974 101,868 61,821 21,083 52,644 67,870 69,189
439,803
Sub Total Lines 39,354 25,974 108,281 157,985 137,847 150,379 83,604 83,351 786,775
Working Stock 10,380 2,998 11,329 12,451 8,553 29,990 6,544 42,069 124,314
Subscriptions to
CL&EJC 1,025 (125) 7,550 1,000 8,233 (500) 17,183
Purchase of the A&RR 365,051
365,051
Total 415,810 28,847 127,160 170,436 147,400 188,602 89,648 125,420 1,293,323

38
Table 15 Part 2
Analysis of Capital Expenditure 1893-1900
1893 1894 1895 1896 1897 1898 1899 1900 Total
£ £ £ £ £ £ £ £ £
Included in Lines Open
for Traffic
Aylesbury – Verney Jct
Widening
Land Purchase 4,756 7,754 1,817 2,804 17,131
Construction of Way &
Stations
698 71,520 41,558 5,322 119,098
5,454 79,274 43,375 8,126 136,229
39
The widening between Finchley Road and Harrow was shown under lines under construction,
because it was a completely new a pair of tracks alongside the original. A new station was opened
at Wembley Park in 1894. The original concept in the MSLR’s 1895 Act was that the company
would have exclusive use of two tracks between Canfield Place and Wembley Park. However, the
MR decided to extend the quadrupling through to Harrow on its own initiative and by an Act of
1896 the MSLR was granted exclusive use of two tracks on this additional stretch. The total cost of
the Finchley Road to Harrow widening was £347k of which 30 per cent was for the land. By the
end of 1900, the GCR was able to run trains over the whole length of the new pair of tracks, but the
part of the bridge over the LNWR main line at Northwick Park being rebuilt for the MR’s existing
tracks was not completed until 1901 and the MR had to share the new tracks for a short period. It
was thus that the expenditure on the new pair of tracks was classified as lines under construction at
the end of the period.
The doubling of the original single track between Aylesbury and Verney Junction, which included a
new station at Waddesdon, was treated as part of work on lines open for traffic and is shown as a
memo total at the foot of the table. A total of £136k was spent on the doubling between Aylesbury
and Verney Junction, with only 13 per cent for the additional land.
The £124k spent on working stock during the period included six D class locomotives and most of
the six E class locomotives, as well as new bogie passenger stock made by Ashbury Railway
Carriage & Iron Co. Some of these Ashbury carriages remained in service on the Chesham branch
until electrification in 1960. This new equipment was primarily required for the MR’s expanding
traffic north of Harrow, including freight. Similarly, the expenditure on lines open for traffic
included additional freight facilities at a number of stations. A further £17k was advanced to the
CL&EC during the period. The A&RR was purchased by the MR in 1893 for a sum of £365k in
1893.
Table 16 gives the revenue account for the period 1893-1900:

40
Table 16
Revenue Account 1893-1900
1893 1894 1895 1896 1897 1898 1899 1900
£ £ £ £ £ £ £ £
Total Receipts
Passenger Trains 626,629 637,777 644,783 666,027 694,843 689,219 718,496 705,419
Freight Trains 41,433 51,072 55,184 67,728 83,871 100,167 98,843 117,884
Other 38,945 43,070 43,799 44,072 44,647 43,148 43,376 43,721
Sub Total 707,007 731,919 743,766 777,827 823,361 832,534 860,715 867,024
Total Expenditure
Maintenance of Way, Works &
Stations 34,884 38,464 37,669 37,535 41,070 42,206 51,834 58,055
Locomotive Power 88,060 80,540 82,600 85,278 96,423 103,515 105,761 121,622
Carriage & Wagon Repairs 28,162 26,884 26,704 28,405 28,994 29,645 31,112 33,075
Traffic Expenses 81,631 81,024 84,456 85,755 91,810 95,626 100,253 97,072
General Charges 29,612 28,835 27,606 28,203 29,933 31,230 33,430 33,571
Law Charges 3,817 3,395 3,319 4,394 3,883 5,373 4,070 4,237
Compensation 740 1,237 1,036 454 495 545 950 574
Rates, Taxes & Government Duty 46,028 47,539 49,617 51,437 50,934 47,904 50,067 52,495
Other 12,761 13,209 13,322 14,005 16,036 15,433 16,038 15,862
Sub Total 325,695 321,127 326,329 335,466 359,578 371,477 393,515 416,563
Allowance for Working Other Cos
Trains 23,334 5,568 4,165 3,467 3,792 2,944 5,494 3,014
Revenue Balance 404,646 416,360 421,602 445,828 467,575 464,001 472,694 453,475

41
The opening of the Aylesbury Extension had quite a positive effect on total receipts, which
increased by 21 per cent on their 1892 level to reach £0.867m in 1900. The extent of the increase is
partially disguised by the opening of the Central London Railway (CLR) to the public at the end of
July 1900. The MR and the MDR, its fellow operator of the Inner Circle, no longer had a monopoly
of under-ground rail traffic in the capital and now had a rival which used cleaner electric traction.
Taking receipts from passengers only i e excluding other items carried by passenger trains such as
parcels and horses, the 1899 total of £0.702m fell to £0.629m in 1901, a reduction of 10 per cent.
Fortunately, the MR’s efforts to stimulate freight traffic had begun to bear fruit and total receipts
from freight trains rose from £43k in 1892 to £118k in 1900, by nearly one and three quarters.
Other receipts, mainly rents, rose modestly from £39k to £44k.
Total expenditures rose by 28 per cent from their 1892 level to reach £0.417m in 1900. Allowances
for working other companies’ trains, which had reached a peak in of £23k in 1893 fell substantially
thereafter and did not exceed £6k per annum for the rest of the period. This was principally because
of a change in the operating arrangements for the H&CR. Previously the MR had provided almost
all of the trains, but the GWR now started to provide its half of the services. The proportions of the
various expenditure categories making up the total did show a significant movement between 1892
and 1900, with locomotive power and maintenance of the infrastructure increasing from 26.7 to
29.2 per cent and 9.6 to 13.9 per cent respectively. By contrast, traffic expenses fell from 26.6 to
23.3 per cent. The longer route mileage and the wider spacing of stations at the outer end probably
help to explain these movements.
The net revenue & appropriation account for the period 1893-1900 was as follows:

42
Table 17
Net Revenue & Appropriation Account 1893-1900
1893 1894 1895 1896 1897 1898 1899 1900
£ £ £ £ £ £ £ £
Receipts
B/Fwd Balance 9,807 1,493 10,787 12,145 14,130 17,133 17,281 18,341
Balance Revenue Account 404,646 416,360 421,602 445,828 467,575 466,001 472,694 453,475
Bank & General Interest 5,551 3,857 3,794 4,245 6,323 6,143 3,759 1,600
Railway Estates Revenue 8,874 8,739 9,182 9,777 9,171 10,741 11,361 11,483
CL&EJC 14,276 15,998 15,516 13,899 14,105 15,192 14,898 15,065
Other 8,438 13,549
Sub Total 443,154 446,447 460,881 485,894 511,304 523,648 533,642 499,964
Expenditure
Interest on Debentures & Loans 131,544 131,544 131,544 131,544 131,544 131,544 131,544 131,544
Other 14,485 14,586 15,134 15,729 15,029 15,786 15,702 19,138
Sub Total 146,029 146,130 146,678 147,273 146,573 147,330 147,246 150,682
Transfer to/(from) Reserve 3,000
Balance Available for Dividends 297,125 300,317 314,203 338,621 364,731 373,318 386,396 349,282
Preference Stocks 143,779 144,280 146,905 149,530 149,530 149,531 149,529 149,529
Consolidated Ordinary Stock 151,853 145,250 155,153 174,961 198,068 206,506 218,526 179,120
Sub Total 295,632 289,530 302,058 324,491 347,598 356,037 368,055 328,649
Balance C/Fwd 1,493 10,787 12,145 14,130 17,133 17,281 18,341 20,633
% on Consolidated Ordinary
Stock
2⅞%
2¾% 215/16% 35/16% 3¾% 3¾% 313/16% 3⅛%
Surplus Lands Dividend 69,324 69,324 69,324 69,324 72,626 70,975 72,626 70,975
% on Surplus Land Stock 2⅝% 2⅝% 2⅝% 2⅝% 2¾% 211/16% 2¾% 211/16%

43
Railway Estates revenue, which had reached £9k in 1892 rose gradually during the period to over
£11k in 1900. Revenue from the CL&EJC, which had nearly reached £16k in 1892, never exceeded
that level during the period and fell below £14k in 1896. In 1898-99 £22k in interest was credited in
respect of the widening works for the GCR. The interest and dividends on debentures, loans and
preference shares rose from £259k in 1892 to £281k in 1900, as capital was raised for the work to
prepare for the GCR. Dividends on the consolidated ordinary stock reached a low of 2¾ per cent in
1894 but rose gradually to reach 313/16 per cent in 1899. This fell to 3⅛ per cent in 1900, as the
competition from the CLR took effect. Dividends from the Surplus Land Stock remained at 2⅝ per
cent until 1896. Thereafter, they were in the range 211/16 to 2¾ per cent. The only transfer to the
reserves during the period was £3k in 1898 for workmen’s compensation liabilities.
9. The Coming of Electrification and West to Uxbridge 1901-06
Although it would take until 1904 for modus vivendi to be reached with the GCR, in the meantime
the MR had other priorities. Bell’s relationship with Forbes of the MDR proved to be no more
cordial than Watkin’s had been. This was particularly important, as pressure increased on both the
MR and the MDR to replace their steam trains on the Inner Circle with electric ones and to reach
agreement on a form of electrification to achieve this. The opening of the CLR intensified this
pressure. The situation changed again in 1901, when Abraham Ellis replaced Bell as general
manager at the MR and the American group led by Charles Yerkes took over the MDR. Both
companies were then able to agree to put the form of electrification to arbitration, which at the end
of 1901 ruled in favour of the low voltage direct current system already operation in the US. Both
companies then pushed forward with the electrification of their parts of the Inner Circle, which led
to full electric working of it by late 1905. The MR also undertook the electrification of remainder of
its system in Central London and its main line out to Harrow, apart from the ELR, which was left
by the MR and MDR to be steam operated by the main line railway companies until finally
electrified in 1913.
As early as the 1880s both the MR and the MDR had shown some interest in serving the town of
Uxbridge, but little progress was made until the end of the century when the MDR made an
agreement to work the separate Ealing & South Harrow Railway, which was largely completed by
1899 but not opened for regular services until 1903. Local commercial interests in Uxbridge formed
a Harrow & Uxbridge Railway company (H&UR) and paid court to both the MR and the MDR. As
the MDR’s financial position was not strong, it was the MR, which took a major interest in this
company. The MDR’s interest were catered for by a branch from Rayners Lane to South Harrow
and running powers through to Uxbridge. An Act authorising the line was passed in 1899 and
construction was sufficiently advanced for a public opening in June 1904. The line was not fully
completed at this stage, as it had been decided in 1903 that it would be built as an electrified line.
The original capital was not sufficient to complete the work and the MR took over the H&UR in
mid-1905 by which time the first electric trains had started to run. By the end of 1906, the MR had
completed the electrification of its system in Central London. The Uxbridge branch initially only
had one intermediate station at Ruislip, which was supplemented by halts opened at Rayners Lane,
Eastcote and Ickenham in 1905-06. Even so the branch only attracted light loadings in its early
years.

44
The MR completed the spur from Rayners Lane to South Harrow required by the MDR in 1904, but
the MDR did not provide the connection to its tracks at that time. It was not until 1910 that the
MDR carried out this work and started its through services to Uxbridge. It was also in this year that
the MR completed sidings off the spur to serve the Gas Light & Coke Company’s South Harrow
works and began running coal trains to the works.
The increases in capital authorised and created and the amount received into the capital account
over the period were as follows:
31 December 1900 31 December 1906 Increase
£m £m £m
Capital Authorised & Created
Shares 9.492 12.504 3.012
Loans 3.566 5.167 1.601
Total 13.058 17.671 4.613
Amount Received into Capital Account
Shares 9.050 10.750 1.700
Loans 3.310 4.277 0.967
Premiums/(Discounts) 0.004 (0.514) (0.518)
Total 12.364 14.513 2.149
The increase in capital authorised and created since the end of 1900 of £4.613m was, of course,
primarily due to electrification, including new working stock, and the construction of the Uxbridge
line. The deterioration in the financial results from 1900 meant that discounts had to be offered on
the share issues. The total amount spent on capital account by the end of 1906 was £14.783m made
up of:
£m
Lines open for traffic 11.021
Working stock 1.065
Subscriptions to other railways 0.056
Surplus Land Stock 2.641
Total 14.783
The capital expenditure 1901-06 was made up of the following:
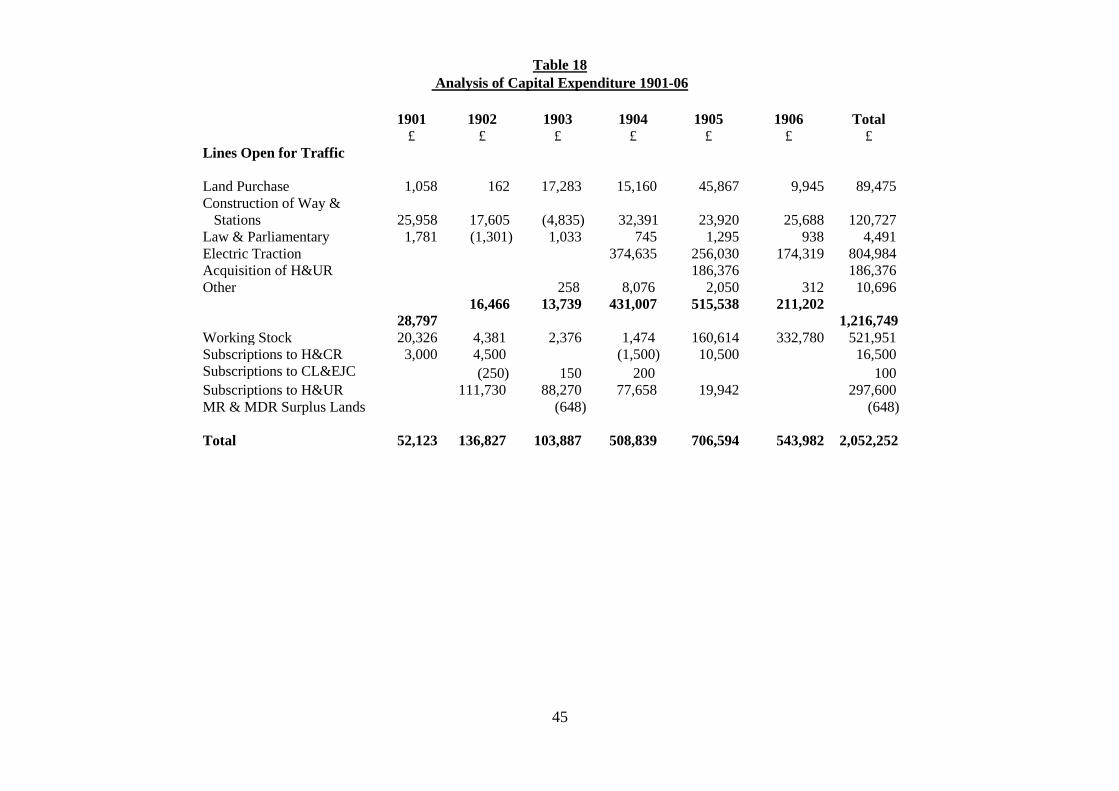
45
Table 18
Analysis of Capital Expenditure 1901-06
1901 1902 1903 1904 1905 1906 Total
£ £ £ £ £ £ £
Lines Open for Traffic
Land Purchase 1,058 162 17,283 15,160 45,867 9,945 89,475
Construction of Way &
Stations 25,958 17,605 (4,835) 32,391 23,920 25,688 120,727
Law & Parliamentary 1,781 (1,301) 1,033 745 1,295 938 4,491
Electric Traction 374,635 256,030 174,319 804,984
Acquisition of H&UR 186,376 186,376
Other 258 8,076 2,050 312 10,696
28,797
16,466 13,739 431,007 515,538 211,202
1,216,749
Working Stock 20,326 4,381 2,376 1,474 160,614 332,780 521,951
Subscriptions to H&CR 3,000 4,500 (1,500) 10,500 16,500
Subscriptions to CL&EJC (250) 150 200 100
Subscriptions to H&UR 111,730 88,270 77,658 19,942 297,600
MR & MDR Surplus Lands (648) (648)
Total 52,123 136,827 103,887 508,839 706,594 543,982 2,052,252

46
In the period, £805k was spent on the infrastructure to enable the running of electric trains on the
lines listed above. However, this was not the complete cost and further expenditures were to be
made post 1906. Of the £522k expenditure on working stock during the period £493k was for
electric locomotives for hauling compartment stock, the “camelbacks”, and electric motor cars and
trailers of the saloon type, net of disposals of redundant stock. Purchases also included four F class
locomotives. Most of the £17k paid to the H&CR related to their electrification scheme.
Up to the acquisition of the H&UR in 1905, £298k was advanced to the company for the
construction works and a further £186k was spent after acquisition, before the line was opened,
making a total of £484k. It is not clear what proportion of this sum related to electrification of the
line. There was also £4k spent on the line in 1906, after it opened.
Table 19 gives the revenue account for the period 1901-06:

47
Table 19
Revenue Account 1901-06
1901 1902 1903 1904 1905 1906
£ £ £ £ £ £
Total Receipts
Passenger Trains 656,998 660,268 669,806 678,323 684,933 598,032
Freight Trains 118,451 131,774 142,879 152,899 147,102 83,236
Other 45,382 47,241 50,440 51,833 52,639 51,622
Sub Total 820,831 839,283 863,125 883,055 884,674 732,890
Total Expenditure
Maintenance of Way, Works & Stations 58,810 59,561 60,940 64,607 63,925 53,682
Locomotive Power 121,244 116,578 115,801 115,146 118,363 139,183
Carriage & Wagon Repairs 35,102 35,484 34,336 32,640 31,966 33,657
Traffic Expenses 96,726 96,740 96,183 100,148 101,655 96,775
General Charges 33,157 33,620 31,913 34,801 35,218 34,486
Law Charges 5,248 4,717 4,492 1,216 2,328 1,957
Compensation 1,296 1,614 2,769 1,314 1,826 811
Rates, Taxes & Government Duty 54,146 56,980 56,559 56,906 60,943 59,951
Other 15,645 15,963 20,172 18,748 16,654 14,409
Sub Total 421,374 421,257 423,165 425,526 432,878 434,911
Allowance for Working Other Cos Trains 3,934 4,784 4,134 3,555 1,240 24,005
Revenue Balance 403,391 422,810 444,094 461,084 453,036 321,984

48
Before looking at the trends for the period, it is important to explain two events, which took full
effect in 1906. Firstly, the GCR completed its line between Neasden and Northolt Junction and
began to route some of its traffic to the north via the joint line with the GWR to Grendon
Underwood thus undermining the revenue accruing to the MR. In conjunction with this, the
agreement with MR came into force. The main aspects were:
- the GCR leased two of the tracks between Canfield Place and Harrow
- a joint committee was formed by the two companies to run the MR’s line from
Harrow to Verney Junction, including the branches to Chesham and Brill and the GCR
guaranteed a minimum level of traffic over the joint line
- a formula was agreed by which the GCR would ensure that the MR’s receipts on the
joint line at least remained at their 1904 level and how receipts above that level would
be shared
Because of the method of accounting specified in the 1868 Act, part of the MR’s revenue
expenditure relating to the joint line dropped out of its own revenue account. This was replaced by
a net revenue contribution from the MR&GCR Joint Committee (MR&GCRJC) which was credited
in the net revenue account. Also, in the net revenue account were the rents that the MR received on
the leased lines. The revenue balance in the revenue account fell as a result of these changes and the
difference was replaced by credits in the net revenue account.
The competition brought about by the opening of the CLR in 1900 continued to bite and eventually
the MR was forced to cuts to its fares in 1903-05. The H&CR had cut its fares earlier in 1902. A
contributory factor to these fare reductions was also the spread of electric trams, particularly by
London United Tramways, which were a low-cost alternative to the railways.
Total receipts only rose by 2 per cent from their 1900 level to reach £0.885m in 1905. Following
the implementation of the agreement with the GCR, they fell to £0.733m in 1906. Freight train
receipts were particularly hit, as most of the MR’s freight business was on the part of the route
subject to the agreement. On the other hand, rents within other receipts were little affected, as they
were mainly derived from Central London and in fact other receipts rose from £44k in 1900 to £52k
in 1906.
Total expenditures rose by 4 per cent from their 1900 level to reach £0.433m in 1905. They were
only slightly higher in 1906, as the agreement with the GCR only covered sharing of capital costs
not running expenses. Allowances for working other companies’ trains, which had not reached £5k
per annum 1901-05 increased to £24k in 1906, mainly reflecting increased electric Inner Circle
workings on behalf of the MDR. The proportions of the various expenditure categories making up
the total showed some movement, with locomotive power and rates, taxes and government duty
increasing from 29.2 per cent to 32.0 per cent and 12.6 per cent to 13.8 per cent respectively.
The net revenue & appropriation account for the period 1901-06 was as follows:

49
Table 20
Net Revenue & Appropriation Account 1901-06
1901 1902 1903 1904 1905 1906
£ £ £ £ £ £
Receipts
B/Fwd Balance 20,633 19,251 21,637 21,294 11,286 11,448
Balance Revenue Account 403,389 422,810 444,094 461,084 453,036 321,984
Bank & General Interest 1,694 5,249 12,341 14,374 18,034 6,342
Railway Estates Revenue 12,502 12,417 12,023 12,597 14,072 13,404
CL&EJC 14,603 18,980 24,974 25,315 23,935 26,742
MR&GCRJC 6,033
Rent of Leased Lines 49,548
Sub Total 452,821 478,707 515,069 534,664 520,363 435,501
Expenditure
Interest on Debentures & Loans 131,544 134,321 138,739 139,778 140,481 145,200
Other 20,320 20,124 17,518 24,803 25,497 18,137
Sub Total 151,864 154,445 156,257 164,581 165,978 163,337
Transfer to/(from) Reserve 10,000 16,000 11,020
Balance Available for Dividends 300,957 314,262 342,812 359,063 354,385 272,164
Preference Stocks 152,740 156,494 163,893 175,819 206,800 209,022
Consolidated Ordinary Stock 128,966 136,131 157,625 171,958 136,137 57,320
Sub Total 281,706 292,625 321,518 347,777 342,937 266,342
Balance C/Fwd 19,251 21,637 21,294 11,286 11,448 5,822
% Dividend on Consolidated
Ordinary Stock
2¼% 2⅜% 2¾% 3% 2⅜% 1%
Surplus Land Dividend 72,626 72,626 72,626 72,626 69,324 72,626
% on Surplus Land Stock 2¾% 2¾% 2¾% 2¾% 2⅝% 2¾%

50
Railway Estates revenue, which had reached £11k in 1900 rose gradually to reach £13k in 1906.
Revenue from the CL&EJC, which had reached £15k in 1900 rose significantly to reach £27k in
1906. The first revenue from the MR&GCRJC amounted to £6k in 1906. Similarly, the first
revenue from the leased lines totalled £50k in that year. The interest and dividends on debentures,
loans and preference shares rose from £281k in 1900 to £354k in 1906 as a result of the capital
required to finance electrification and build the Uxbridge branch. Dividends on the consolidated
ordinary stock fell below the 3⅛ per cent recorded in 1900 to a low of 2¼ per cent in 1901. There
was a recovery to 3 per cent in 1904, but a further fall to 1 per cent in 1906 as a result of the
problems described above. Dividends on the Surplus Land Stock were 2¾ per cent per annum apart
from 2⅝ per cent in 1905. In 1902-04 a further £23k was transferred to the reserves.
10. The Difficult Pre-World War I Years 1907-13
The government control of the railways under the Regulation of the Forces Act 1871 on 5 August
1914 saw a new phase of the MR’s history both during the war years and up to August 1921, when
the future structure of the railways was set out in the Railways Act 1921 and the government finally
relinquished control. The year 1913 was thus the last year, when the MR’s management was fully
in control for the whole year. The electrification of the MR’s lines south of Harrow and the
construction of the Uxbridge branch had left the company financially weakened and the years 1907-
13 proved to be a difficult period of consolidation, with increased competition from buses, trams
and tubes, and the dilution of GCR traffic via the joint line with the GWR. It was necessary to offer
further fare reductions to take on the competition. Added to this was increased labour unrest, which
resulted in a national rail strike in 1911 and a coal strike in 1912. This was partly countered by the
appointment of Abraham Selbie to succeed Ellis as general manager in 1908, who put renewed
vigour into growing revenue.
Initially, there was no further expansion of the MR’s network, but by 1913 the company felt able to
acquire the separate Great Northern & City Railway (GN&CR), with its 3½ mile line from
Finsbury Park to Moorgate. In the same year, the MR took over operational control of the H&CR
under an agreement with the GWR. Improvements to the existing network began to gather pace
towards the end of the period. Of particular importance, were improvements at Baker Street and the
junction with the Inner Circle, and the quadrupling of the track between Finchley Road and
Wembley i.e. excluding the two tracks leased to the GCR, to reduce congestion. The MR also was
to benefit from the electrification of the ELR, which was completed in March 1913.
Before looking at the figures for 1907-13, it should be remembered as mentioned at the beginning
that 1913 was the first year in which the financial reporting changes set out in the 1911 Act came
into effect. To complete the picture for the pre-World War I period, the figures for 1913 have been
simplified and presented in a similar manner to those for the preceding years. This has thrown up
some anomalies.
The increases in capital authorised and created and the amount received into the capital account
over the period were as follows:
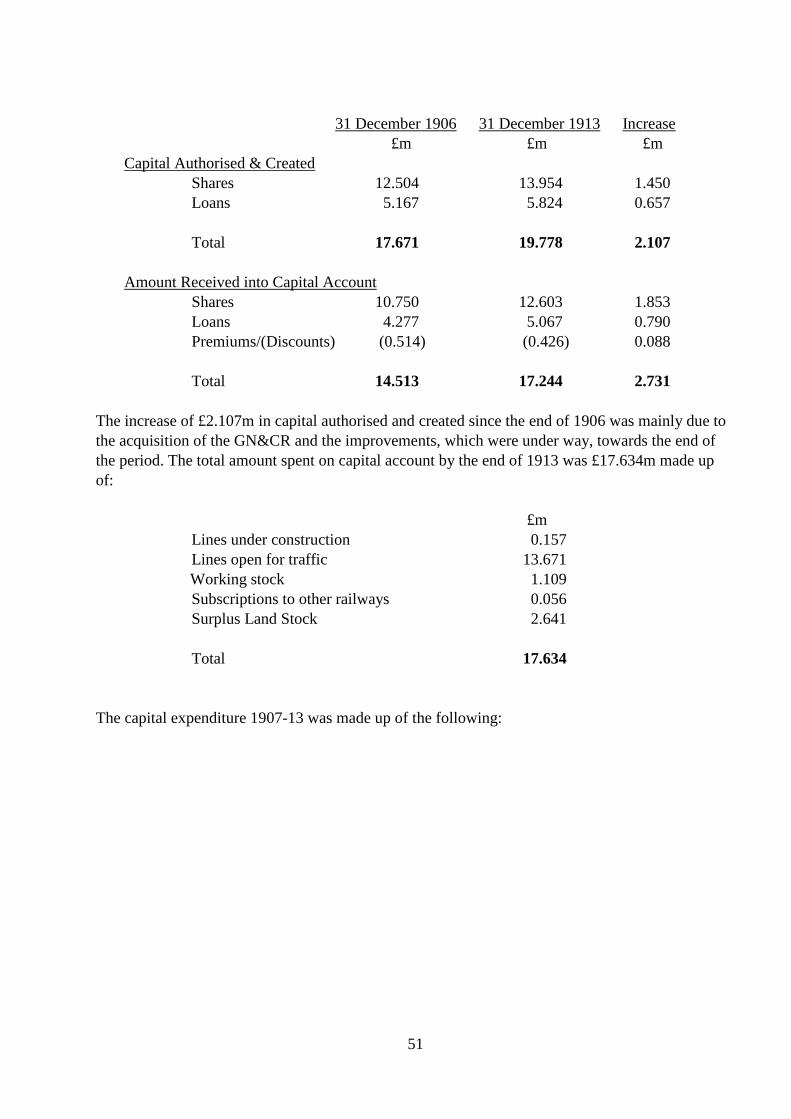
51
31 December 1906 31 December 1913 Increase
£m £m £m
Capital Authorised & Created
Shares 12.504 13.954 1.450
Loans 5.167 5.824 0.657
Total 17.671 19.778 2.107
Amount Received into Capital Account
Shares 10.750 12.603 1.853
Loans 4.277 5.067 0.790
Premiums/(Discounts) (0.514) (0.426) 0.088
Total 14.513 17.244 2.731
The increase of £2.107m in capital authorised and created since the end of 1906 was mainly due to
the acquisition of the GN&CR and the improvements, which were under way, towards the end of
the period. The total amount spent on capital account by the end of 1913 was £17.634m made up
of:
£m
Lines under construction 0.157
Lines open for traffic 13.671
Working stock 1.109
Subscriptions to other railways 0.056
Surplus Land Stock 2.641
Total 17.634
The capital expenditure 1907-13 was made up of the following:

52
Table 21
Analysis of Capital Expenditure 1907-13 Part 1
1907 1908 1909 1910 1911 1912 1913 Total
£ £ £ £ £ £ £ £
Lines Under Construction
Finchley Road – Wembley
Widening
Land Purchase 21,059 21,059
Construction of Way &
Stations 18,717 112,091 130,808
Law & Parliamentary 1,721 1,721
18,717 134,871 153,558
Moorgate- Lothbury 3,370 3,370
Sub Total 18,717 138,241 156,958
Lines Open for Traffic
Land Purchase 8,115 11,917 1,171 15,106 52,771 13,689 6,816 109,585
Construction of Way &
Stations 13,969 12,577 23,849 38,817 65,455 106,152 78,493 343,512
Law & Parliamentary 415 144 736 389 4,659 428 6,771
Electric Traction 217,342 41,002 19,595 16,787 35,379 30,675 96,802 457,582
Other 156 623 1,000 55,249 57,028
Sub Total 239,997 66,119 44,759 71,446 153,994 156,175 237,788 974,478
Total Lines 239,997 66,119 44,759 71,446 153,994 174,892 376,029 1,131,436

53
Table 21
Analysis of Capital Expenditure 1907-13 Part 2
1907 1908 1909 1910 1911 1912 1913 Total
£ £ £ £ £ £ £ £
Total Lines 239,997 66,119 44,759 71,446 153,994 174,892 376,029 1,131,436
Working Stock (60,872) 5,067 (2,835) 9,300 (22,382) 51,821 77,541 57,640
Subscriptions to H&CR 9,245 1,076 (497) 6,359 5,655 20,138
Subscriptions to CL&EJC 2,500 4,500 1,500 1,170 7,170
Subscriptions to
MR&GCRJC 7,500 12,000 7,114 26,614
Acquisition of GN&CR 1,607,399 1,607,399
Total
179,125 90,431 55,000 84,749 139,471 227,883 2,073,738 2,850,397
54
The largest amount of expenditure during the period was £1.607m used to acquire the GN&CR.
The Finchley Road to Wembley widening had begun in 1912, with £154k spent by the end of 1913,
although it was not to be completed until 1915. A small amount was spent on a possible extension
from Moorgate (GN&CR) to Lothbury near Bank, but this was never followed through. Some
£281k of the expenditure on lines already open was for the improvements at Baker Street. The
years 1907-13 saw the opening of a variety of new stations at Shoreditch on the ELL, at Goldhawk
Road and White City (Wood Lane) on the H&CR and at Dollis Hill, Preston Road, West Harrow,
Ruislip Manor and Moor Park on the main line and Uxbridge branch. Spending on the
infrastructure for electrification continued after 1906 and a further £458k was spent 1907-13.
Between 1907-11 there was a net reduction in working stock of £72k as locomotives and carriages
rendered surplus as a result of electrification were sold, but acquisitions included further electric
locomotives for hauling compartment stock. Acquisitions began again in 1912 and the 1913
acquisitions of £78k included stock for the GN&CR. It was during this period that the first trains of
a new design of compartment stock suitable for both electric and steam haulage on the main line
were delivered. Their sturdy design earned them the name of Dreadnoughts after the new
battleships currently being built for the navy and were to survive until electrification in 1960.
Further sums were also advanced to the Joint Committees for the H&CR, MR&GCR and the
CL&E.
Table 22 gives the revenue account for the period 1907-13:

55
Table 22
Revenue Account 1907-13
1907 1908 1909 1910 1911 1912 1913
£ £ £ £ £ £ £
Total Receipts
Passenger Trains 576,910 618,570 634,935 651,124 649,825 642,055 688,690
Freight Trains 63,928 61,787 61,945 66,965 70,920 70,184 81,051
Other 52,332 52,717 73,363 76,568 76,971 81,746 87,364
Sub Total 693,170 733,074 770,243 794,657 797,716 793,985 857,105
Total Expenditure
Maintenance of Way, Works & Stations 46,383 46,677 51,019 49,227 52,104 49,293 46,453
Locomotive Power 141,386 149,923 131,443 132,093 135,892 133,645 127,064
Carriage & Wagon Repairs 31,750 31,666 32,812 38,245 38,526 36,590 69,955
Traffic Expenses 95,471 99,489 98,026 97,041 95,950 96,529 131,790
General Charges 35,665 41,012 36,038 37,170 37,073 37,475 41,394
Law Charges 1,383 1,409 2,674 1,795 3,409 2,379 2,811
Compensation 1,168 505 536 1,080 281 1,053 3,874
Rates, Taxes & Government Duty 54,195 52,599 51,793 53,188 39,081 39,779 39,057
Other 14,388 15,495 16,832 18,185 16,658 17,358 5,404
Sub Total 421,789 438,775 421,173 428,024 418,974 414,101 467,802
Allowance for Working Other Cos Trains 36,469 36,950 22,276 33,857 27,518 28,089 34,328
Revenue Balance 307,850 331,249 371,346 400,490 406,260 407,973 423,631

56
Total receipts, which had reached £733k in 1906, fell to £693k in 1907. There was a steady
improvement to £797k in 1911, but the strikes in 1911-12 caused growth to stall. Growth resumed
in 1913 reaching £857k, some 17 per cent higher than in 1906. Revenue from freight trains was
disappointing, with the 1913 total of £81k slightly lower than in 1906. A change in presentation
affecting other receipts took place in 1909. The railway estates revenue, which had previously been
shown separately in the net revenue account, was transferred to other receipts in the revenue
account, accounting for a £15k rise in the latter. At the same time, Selbie, who had taken over as
general manager in 1908, took steps to increase revenue and other receipts reached £87k in 1913.
Total expenditure only rose by 8 per cent between 1906 and 1913, but apart from 1908 and 1913
was actually lower than in 1906, particularly in the strike years of 1911-12. Allowances for running
other companies’ trains increased from £24k in 1906 to peak at £37k in 1908. Thereafter, the
amount fluctuated, ending at £34k in 1913. The proportions of the various expenditure categories
making up the total showed a variety of movements, but the new method of reporting in 1913 did
have some effect on the form of analysis e g charges for superannuation and pensions previously
shown separately were moved to general charges. Employers’ National Insurance contributions
appeared for the first time in 1912 following the Liberal Government’s social security legislation.
Local authority rates and taxes fell significantly after 1910, reflecting Selbie’s efforts to secure
fairer charges for the company.
The net revenue & appropriation account for the period 1907-13 was as follows:

57
Table 23
Net Revenue & Appropriation Account 1907-13 Part 1
1907 1908 1909 1910 1911 1912 1913
£ £ £ £ £ £ £
Receipts
B/Fwd Balance 5,822 5,516 8,694 5,927 9,499 9,218 9,497
Balance Revenue Account 307,850 331,249 371,346 400,490 406,260 407,973 423,631
Bank & General Interest 2,260 9,863 3,073 3,581 3,040 8,906
Railway Estates Revenue 13,356 14,595
CL&EJC 29,786 29,947 30,054 30,956 31,927 32,876 12,516
MR&GCRJC 10,563 7,037 7,390 13,212 16,239 15,465 36,888
Rent of Leased Lines 64,000 64,000 64,000 64,000 64,000 64,000 64,000
Other 638 4,179
Sub Total 433,637 462,845 484,557 518,166 530,965 538,438 550,711
Expenditure
Interest on Debentures & Loans 154,130 171,042 171,760 171,760 171,760 171,760 182,719
ELRJC 5,849 6,123 5,460 4,256 3,906
H&CRJC 4,451 8,028 6,015 6,080 5,780
Other 30,309 18,127 16,377 17,595 17,228 16,010 35,717
Sub Total 184,439 199,469 202,288 200,830 199,324 197,456 218,436
Transfer to/(from) Reserve 6,000 17,000 10,000 20,000 4,340 15,000 7,500
Balance Available for Dividends 243,198 246,376 272,269 297,336 327,301 325,982 324,775
Preference Stocks 209,022 209,022 209,022 209,022 210,606 211,482 211,482
Consolidated Ordinary Stock 28,660 28,660 57,320 78,815 107,477 105,003 105,035
Sub Total 237,682 237,682 266,342 287,837 318,083 316,485 316,517
Balance C/Fwd 5,516 8,694 5,927 9,499 9,218 9,497 8,258
% Dividend on Consolidated
Ordinary Stock
½% ½% 1% 1⅜% 1⅞% 1⅝% 1⅝%

58
Table 23
Net Revenue & Appropriation Account 1907-13 Part 2
1907 1908 1909 1910 1911 1912 1913
£ £ £ £ £ £ £
Surplus Land Dividend 72,626 75,927 72,626 72,626 75,927 72,626 72,626
% on Surplus Land Stock 2¾% 2⅞% 2¾% 2¾% 2⅞% 2¾% 2¾%

59
Apart from the problems of adjusting the 1913 figures to be consistent with the preceding years,
there were other changes during the period, including that to railway estates revenue mentioned
above. Up to 1912 the revenue from the CL&EJC and the MR&GCRJC was fairly consistent. The
former produced around £30k per annum with a rising trend. The revenue from the latter also saw a
rising trend to reach £16k in 1911. The figures for 1913 are derived from Schedule J in the 1911
Act format and are markedly different in both cases. It may be that the MR had previously
amalgamated some of their own revenues and costs relating to the two operations with the those
derived from the two committees. The contrast in the figures relating the two committees compared
with their respective track mileages is striking, but it should be noted that the cost and revenue
sharing arrangements for the two were different.
From 1908 onwards, a change was also made to show charges from the ELRJC and the H&CRJC
separately. Together these amounted to between £9-14k per annum. In the 1913 format these were
not shown separately but included in the amount for other expenditures (estimated at £10k in 1913).
Interest and dividends on debentures, loans and preference shares rose from £354k in 1906 to
£394k in 1913, as a result of the additional capital raised to purchase the GN&CR and fund the
various improvements mentioned above. A concerted effort was made to bolster the company’s
reserves during the period with total transfers of nearly £80k. Dividends on the consolidated
ordinary stock, which had fallen to 1 per cent in 1906, languished at ½ per cent for the years 1907-
08. There was a recovery during the following two years to reach 2 per cent in the first half of 1911.
The industrial relations problems caused a reduction and the rate for 1913 was 1⅝ per cent. The
Surplus Land Stock produced a steady 2¾ per cent during the period, with increases to 2⅞ per cent
in two years.
11. The Years of World War I and Government Control 1914-21
As mentioned above, the MR along with 129 other railway companies was under the control of the
government’s Railway Executive Committee from 5 August 1914 to 15 August 1921. The financial
results of the company for 1914-21 were affected by the way that this control was exercised. In
some of these years, the Board of Trade gave the railway companies a dispensation not to produce
all the schedules required under the 1911 Act. During the war years, the MR, along with the other
railway companies, was obliged to carry all government traffic free of charge, but in return was
guaranteed net revenue equal to that in 1913. The nature of the MR’s services was such that it was
less affected by military traffic than many of the other companies. However, there were heavily
used sections such as the City Widened Lines. Shortages of manpower and materials meant that
work on most capital projects ceased and maintenance tended to be restricted to essentials only.
Direct damage from the war was limited to the German bombing campaign of 1917-18. The
government had acknowledged that it had an obligation to compensate the railway companies for
the degrading of their assets during the war and a settlement was only agreed in 1921.
The MR and the UERL were initially involved in the government’s grouping proposals for the
railways post World War I. Sir Eric Geddes, the Transport Minister, suggested a London Group
(Local Lines) in his 1920 white paper. The MR, while ready to consider some form of combination
or amalgamation with the MDR, strongly resisted any amalgamation with the UERL and eventually
this London proposal was dropped from the Railways Act 1921. The MR thus started 1922 as an
60
independent railway company as it was before 1914. The rationalisation of transport services in the
capital was still a political issue and would come to a head in 1929.
The financial figures from 1914 onwards presented below broadly use the formats from the 1911
Act, with the order of some items transposed to provide continuity with the figures in earlier years.
As mentioned above, the figures for 1921 are incomplete with the main omission being the revenue
account for 1921.
The increases in capital authorised and created and the amount received into the capital account
over the period were as follows:
31 December 1913 31 December 1921 Increase
£m £m £m
Capital Authorised & Created
Shares 13.954 14.704 0.750
Loans 5.824 6.074 0.250
Total 19.778 20.778 1.000
Amount Received into Capital Account
Shares 12.603 13.103 0.500
Loans 5.067 5.201 0.134
Premiums/(Discounts) (0.426) (0.470) (0.044)
Total 17.244 17.834 0.590
The whole of the £1m increase in capital authorised and created took place in 1914, before war was
declared and was intended for the improvements, which had started before 1914. The amount spent
on capital account by the end of 1921 was £18.844m made up of:
£m
Owned
Lines open for traffic 11.448
Lines Jointly Owned
- H&CRJC 0.132
- CL&EJC 0.908
- MR&GCRJC Watford Branch 0.031
Lines Jointly Leased
- MR&GCRJC 0.020
Rolling stock 1.704
Manufacturing/repairing works & plant 0.125
Sub Total Railways 14.368

61
Horses 0.004
Road vehicles 0.004
Electric power stations 0.960
Land & property not part of railway 0.867
Transferred to Surplus Lands Committee 2.641
Total 18.844
As can readily be seen the analysis of capital expenditure required under the 1911 Act is not readily
comparable with what was published before, when so many items, such as electric power stations
were hidden within the totality of lines open for traffic. Also, the treatment of jointly owned and
leased lines was made clearer.
The capital expenditure 1914-21 was made up of the following:

62
Table 24
Analysis of Capital Expenditure 1914-21 Part 1
1914 1915 1916 1917 1918 1919 1920 1921 Total
£ £ £ £ £ £ £ £ £
Lines Owned
Under Construction
Moorgate- Lothbury 79 79
Open for Traffic
Land Purchase 8,343 30,885 (87,821) (10,951) (1,386) 7 (60,923)
Construction of Way &
Stations 157,074 18,912 19,193 2,846 34,903 2,020 735 (6,719) 228,964
Law & Parliamentary 11,504 2,396 (2,769) 21 317 11 (275) 50 11,255
Sub Total 176,921 52,193 (71,397) 2,867 24,269 645 460 (6,662) 179,296
Sub Total Lines Owned 177,000 52,193 (71,397) 2,867 24,269 645 460 (6,662) 179,375
Lines Jointly Owned
H&CRJC 8,906 (898) 131 4 3 8,146
CL&EJC 600 (41) (57) (108) (5,423) (5,029)
MR&GCRJC Watford Branch 1,639 3,000 500 16,000 21,139
Sub Total Lines Jointly
Owned 11,145 2,061 631 15,943 (108) 4 (5,420) 24,256
Sub Total Lines 188,145 54,254 (70,766) 18,810 24,161 645 464 (12,082) 203,631

63
Table 24
Analysis of Capital Expenditure 1914-21 Part 2
1914 1915 1916 1917 1918 1919 1920 1921 Total
£ £ £ £ £ £ £ £ £
Lines B/Fwd 188,145 54,254 (70,766) 18,810 24,161 645 464 (12,082) 203,631
Rolling Stock 57,908 31,070 29,060 (405) 7 238,389 239,892 595,921
Works & Plant 348 862 536 25 45 4,507 11,188 5,194 22,705
Sub Total Railway 246,401 86,186 (41,170) 18,430 24,213 5,152 250,041 233,004 822,257
Horses 2,205 (159) 1,568 2,154 (1,152) (320) 4,296
Road Vehicles 250 179 70 545 2,271 190 3,505
Hotels 21,523 10,589 4,750 1,599 2,431 12,293 (53,700) (515)
Electric Power Stations 32,376 1,135 8,736 (63,452) 3,937 20,477 18,290 161,832 183,331
Land & Property
- New General Offices 5,962 2,007 2,065 (37,165) (27,131)
- Other 35,102 25,486 87,434 16,667 8,289 (10,785) 55,044 7,038 224,275
Sub Total Non-Railway 95,213 39,396 105,260 (45,345) (20,940) 24,684 20,753 168,740 387,761
Total 341,614 125,582 64,090 (26,915) 3,273 29,836 270,794 401,744 1,210,018

64
It can be seen that annual capital spending, which was £466k in 1913, excluding the purchase of the
GN&CR, tailed off in 1914-15 and only picked up again in 1920-21. The only major project
completed in the period was the widening between Finchley Road and Wembley Park, which was
fully open by the end of May 1915. As the widening was brought into use in three stages starting at
the end of 1913, the expenditure in 1914-16 was included in lines open for use. In addition to the
£154 spent up to the end of 1913 a further £319k was spent in 1914-16, giving a total of £473k. A
new station was opened at North Harrow in 1915. As regards the jointly owned lines, the MR had
obtained powers to build a branch to Watford by its Act of 1912 and formed a joint committee with
the GCR to carry out the work. Although some land was purchased in the years up to 1917, the war
prevented any further progress and it would not be until 1923 that work on the project began.
Purchase of rolling stock, mainly electric motor cars and trailers but also including four G class
steam locomotives, wound down in the years 1914-16. After 1920 spending on the fleet began to
accelerate, with £478k spent in 1920-21. This included both electric stock and eight H class steam
locomotives.
From 1916 onwards, horses appeared within capital spending with over £4k spent by 1921. There
was only limited spending on road vehicles during the period. In 1913, a plan was agreed with
Strand Hotel Ltd to build a hotel on the Marylebone Road frontage of Baker Street station. Site
clearance and some preparatory works were completed, until war forced a halt in 1917. Eventually,
the scheme was abandoned and in 1920 the accumulated cost of £54k was transferred to property
not forming part of the railway for other use. The new general offices at Baker Street were largely
complete before war broke out and eventually in 1918 the cost of £37k was transferred to lines
open for traffic.
Table 25 gives the revenue account for the period 1914-21:

65
Table 25
Revenue Account 1914-21 Part 1
1914 1915 1916 1917 1918 1919 1920 1921
£ £ £ £ £
£ £ £
Total Receipts
Passenger Trains 692,591 695,293 731,907 851,535 1,003,010 1,189,003 1,418,547
Freight Trains 48,538 7,556 9,072 10,543 16,452 11,557 27,686
Sub Total Traffic 741,129 702,849 740,979 862,078 1,019,462 1,200,560 1,446,233
Mileage, Demurrage & Wagon Hire
2 3
Interest on New Works 20,000 20,000 27,000 28,000 30,000
Government Receipts 104,431 232,628 243,102 174,133 171,237 345,623 432,707
Joint Lines Traffic Receipts 118,243 90,976 91,639 102,992 109,766 124,677 171,113
Other 6,179 6,703 6,627 7,211 8,782 13,831 29,954
Total 969,982 1,033,156 1,102,347 1,166,414 1,336,247 1,712,693 2,110,010
Total Expenditure
Maintenance of Way, Works & Stations 57,776 72,475 61,611 53,877 86,901 132,700 185,731
Maintenance & Repair of Rolling Stock 72,045 91,899 110,187 119,962 151,672 225,678 262,235
Locomotive Running Costs 128,212 153,618 175,726 199,696 228,655 339,713 427,234
Traffic Expenses 133,499 138,303 149,170 197,529 243,662 344,198 461,479
General Charges 47,542 51,826 56,398 55,263 63,312 78,010 99,262
Law Charges & Parliamentary Charges 4,814 3,015 3,661 2,756 2,031 3,132 4,790
Compensation 3,724 3,046 3,696 5,417 5,576 5,198 5,655
Rates, Taxes & Government Duty 51,093 47,116 45,781 43,821 46,742 54,448 72,685
National Insurance 2,031 2,011 2,021 2,014 1,979 2,444 3,503
Running Powers (22,211) 1,690 (233) (29) 2,333
Sub Total Traffic 478,525 564,999 608,018 680,306 830,530 1,185,521 1,524,907

66
Table 25
Revenue Account 1914-21 Part 2
1914 1915 1916 1917 1918 1919 1920 1921
£ £ £ £ £
£ £ £
Sub Total Traffic 478,525 564,999 608,018 680,306 830,530 1,185,521 1,524,907
Mileage, Demurrage & Wagon Hire 861 27 4 (11)
Joint Lines Traffic Expenses 67,691 41,322 42,554 53,979 60,775 75,652 122,103
War Related Costs 3,288 16,538 27,982 6,768 8,667 9,496 3,677
Other 2,834 3,581 3,755 4,875 6,604 8,146 7,828
Total 553,199 626,467 682,313 745,928 906,565 1,278,815 1,658,515
Net Receipts 416,783 406,689 420,034 420,486 429,682 433,878 451,495 509,076

67
Interpretation of the results for the years of government control is difficult. The government’s
guarantee to maintain net revenue at its 1913 level in itself created an artificial situation and the
payments received from the government are shown in the table. On the expenditure side, there were
costs which were specific to the war and its aftermath and these are also shown as war related costs
in the table. Such costs included payments to reservists, the company’s share of the bonus
conciliation scheme, preparation of statistics for the Ministry of Transport and the peace day
allowance. The rail strike in 1919 also led to one-off costs. The government’s guarantee also made
an allowance for interest on the cost of new capital works completed during the reference period,
again shown in the table. There were also adverse movements in charges and costs during the war.
In 1921 freight rates were double their 1913 level and passenger fares 75 per cent higher, but staff
wages, coal prices and steel prices were around between 125 per cent and 160 per cent up on their
1913 levelsx. Reflecting the impact of these various factors, net receipts for the war years of 1914-
18 were within a comparatively narrow range with a low of £407k and a high of £430k. In the
immediate post war years of 1919-21, inflation became more pronounced and net receipts in 1921
had risen to £509k.
The net revenue & appropriation account for the period 1914-21 was as follows:

68
Table 26
Net Revenue & Appropriation Account 1914-21 Part 1
1914 1915 1916 1917 1918 1919 1920 1921
£ £ £ £ £ £ £ £
Receipts
B/Fwd Balance 8,258 11,459 13,041 14,492 16,101 19,211 19,864 15,416
Balance Revenue Account 416,783 406,689 420,034 420,486 429,682 433,878 451,495 509,076
Rents from Property 35,366 39,121 37,022 37,204 38,463 38,749 38,965 50,928
Other Rents 52,409 51,497 47,465 48,882 54,329 60,606 78,545 87,635
Rent of Leased Lines 64,000 64,000 64,000 64,000 64,000 64,000 64,000 64,000
Joint Lines Non-Traffic 29,327 29,811 31,249 30,112 30,628 30,755 31,660 25,800
Other 401 4,557 9,356 9,998 6,841 9,340 9,843 13,507
Sub Total 606,544 607,134 622,167 625,174 640,044 656,539 694,372 766,362
Expenditure
Interest on Debentures 198,548 198,740 198,740 198,740 198,740 198,740 198,740 198,740
Rents, Wayleaves etc 22,810 22,809 22,811 22,812 22,812 22,812 22,812 22,812
Rents & Guaranteed Interest on
Leased Lines 19,445 20,348 20,373 20,381 20,383 20,387 20,387 20,386
Joint Lines Non-Traffic 26,872 26,757 27,242 26,927 27,032 26,890 26,602 24,854
Interest on Lloyd Bonds & Other 21,526 14,894 14,975 15,367 10,856 6,836 8,617 24,174
Other 1,087 1,087 1,087 1,087 1,087 1,087 1,087 1,087
Sub Total 290,288 284,635 285,228 285,314 280,910 276,752 278,245 292,053
Transfer to Renewals Fund 12,500 15,000 20,000 20,000 20,000 40,000 50,000 50,000
Balance Available for Dividends 303,756 307,499 316,939 319,860 339,134 339,787 366,127 424,309

69
Table 26
Net Revenue & Appropriation Account 1914-21 Part 2
1914 1915 1916 1917 1918 1919 1920 1921
£ £ £ £ £ £ £ £
Balance Available for Dividends 303,756 307,499 316,939 319,860 339,134 339,787 366,127 424,309
Dividends
Preference Stocks 211,482 229,806 237,795 239,107 239,107 239,107 239,107 239,107
Consolidated Ordinary Stock 80,815 64,652 64,652 64,652 80,816 80,816 111,604 167,405
Sub Total 292,297 294,458 302,447 303,759 319,923 319,923 350,711 406,512
B/Fwd Balance 11,459 13,041 14,492 16,101 19,211 19,864 15,416 17,797
% Dividend on Consolidated
Ordinary Stock 1¼% 1% 1% 1% 1¼% 1¼% 1½% 2¼%
Surplus Land Dividend 72,625 72,625 72,625 72,625 72,625 72,625 75,926 79,227
% on Surplus Land Stock 2¾% 2¾% 2¾% 2¾% 2¾% 2¾% 2⅞% 3%

70
Income from activities other than railway operations remained fairly stable for the war years 1914-
18 but rents, other than from the lines leased to the GCR, tended to accelerate in the three following
years. Expenditures for non-operational purposes tended to be relatively stable for the whole period
with a low of £277k in 1919 and a high of £292k in 1921. Rents and guaranteed interest on the
leased lines began to be shown separately as per the 1911 Act. Regular transfers were made to the
renewals fund throughout the period, starting with £12.5k in 1914 and rising to £50k in 1920-21, in
recognition of the fact that the years of government control had interrupted the normal cycle of
regular maintenance and renewal of assets.
Some of the capital created prior to the war was used to issue preference shares in 1914, but these
required an interest rate of 5 per cent compared to 3½ per cent previously. More consolidated
ordinary stock was also issued at that time. The interest and dividends on debentures, loans and
preference shares rose from £394k in 1913 to £438k in 1921. The 1913 dividend on the
consolidated ordinary stock of 1⅝ per cent was not exceeded until 1921 (2¼ per cent) and for three
years 1915-17 only 1 per cent was paid. However, the Surplus Land Stock produced a regular
dividend of 2¾ per cent for the years 1914-19, then rising to 3 per cent in 1921.
12. Post World War I Development 1922-29
The year 1922 was the first full year that Selbie and his team at the MR were free of government
control. They thus began to apply themselves to development work that had been planned before
the war. Much of the work was focused on electrification of the line north of Harrow as far as
Rickmansworth and the construction of a 2½ mile electrified branch to Watford including a north
curve to Rickmansworth. As the line north of Harrow was leased to the MR&CGRJC, which
retained that name after the GCR became part of the LNER after grouping in 1923, the MR had to
overcome the LNER’s reluctance to make further commitments, particularly if increased traffic
north of Harrow interfered with its main line trains. Eventually an agreement was reached whereby
the MR would electrify the line to Rickmansworth and Watford with automatic signalling. In
addition, the MR would build a fly-under for its Uxbridge branch at Harrow North junction and pay
55 per cent of that part of the works as opposed to 50 per cent for the remainder. The Watford
branch was outside the MR&GCRJC agreement and jointly owned by the MR and the LNER.
There were also schemes affecting the MR’s lines in Inner London. A new agreement was reached
with the GWR covering the H&CR in 1923. The MR purchased the GWR’s 50 per cent share of the
rolling stock, leased the car sheds at Hammersmith and was paid a charge for operating the line.
Congestion on the Inner Circle between Baker Street and the City terminus stations, particularly in
the morning peak, had been experienced prior to World War I and consideration began of some
form of quadrupling. Eventually a scaled down scheme along these lines was approved by the board
in 1923 using spare capacity on the City Widened Lines. A connection was made between the up
MR line and the up Widened Line using a redundant tunnel at St Pancras and the latter electrified to
Moorgate. The down Widened Line was only electrified between Moorgate and Farringdon. The
more serious congestion problem between Baker Street and Finchley Road was also addressed
during the period, but no final solution had not been agreed by the end of 1929 or Selbie’s death in
1930. The MR had, however, obtained powers in an Act of 1926 to build a large size tube line
between Edgware Road and Willesden Green to bypass the bottleneck. Financial difficulties in the

71
aftermath of the 1926 coal and general strikes, as well as determined opposition from the UERL,
led to reconsideration and delay.
The increases in capital authorised and created and the amount received into the capital account
over the period were as follows:
31 December 1921 31 December 1929 Increase
£m £m £m
Capital Authorised & Created
Shares 14.704 14.658 (0.046)
Loans 6.074 7.421 1.347
Total 20.778 22.079 1.301
Amount Received into Capital Account
Shares 13.103 13.703 0.600
Loans 5.201 6.951 1.750
Premiums/(Discounts) (0.470) (1.111) (0.641)
Total 17.834 19.543 1.709
The bulk of the £1.301m increase in capital authorised and created took place in 1928, as the MR
began to recover from the troubles of 1926. Further discounts had to be offered to raise the capital.
The amount spent on capital account by the end of 1929 was £21.675m made up of:
72
£m
Owned
Lines not open for traffic 0.016
Lines open for traffic 12.001
Lines Jointly Owned
- H&CRJC 0.057
- CL&EJC 0.908
- MR&LNERJC Watford Branch 0.188
Lines Jointly Leased
- MR&GCRJC 0.091
Rolling stock 2.452
Manufacturing/repairing works & plant 0.133
Sub Total Railways 15.846
Garages & stables 0.004
Horses 0.003
Road vehicles 0.017
Electric power stations 1.481
Land & property not part of railway 1.681
Transferred to Surplus Lands Committee 2.641
Stamp duty on capital 0.002
Total 21.675
The capital expenditure 1922-29 was made up of the following:

73
Table 27
Analysis of Capital Expenditure 1922-29 Part 1
1922 1923 1924 1925 1926 1927 1928 1929 Total
£ £ £ £ £ £ £ £ £
Lines Owned
New Lines
Willesden Green- Edgware
Road
7,890
7,890
Widenings
Wembley Park – Harrow 4,533 4,533
Open for Traffic
Land Purchase 1,228 (211) 2,277 3,308 1,853 3,669 (6,203) 5,921
Construction of Way &
Stations 3,309 30,754 197,134 128,001 82,737 171,057 269,137 (355,654) 526,475
Law & Parliamentary 37 699 1,280 322 131 891 118 (1,008) 2,470
Sub Total 4,574 31,453 198,203 130,600 86,176 173,801 272,924 (362,865) 534,866
Sub Total Lines Owned 4,574 31,453 198,203 130,600 94,066 173,801 272,924 (358,332) 547,289
Lines Jointly Owned
H&CRJC 102 1,335 1,437
CL&EJC 200 434 20 (18) (212) 424
MR&LNERJC Watford
Branch (2) 40,000 60,000 55,000 10,502 (8,000)
157,500
Sub Total Lines Jointly
Owned 198 40,000 60,434 55,020 10,604 (6,683) (212) 159,361
Lines Jointly Leased
MR&GCRJC 50,907 13,131 4,458 3,004 71,500
Sub Total Lines 4,772 71,453 258,637 185,620 155,577 180,249 277,170 (355,328) 778,150

74
Table 27
Analysis of Capital Expenditure 1922-29 Part 2
1922 1923 1924 1925 1926 1927 1928 1929 Total
£ £ £ £ £ £ £ £ £
Sub Total Lines 4,772 71,453 258,637 185,620 155,577 180,249 277,170 (355,328) 778,150
Rolling Stock 259,308 40,517 145,100 12,502 23,560 82,865 4,435 178,906 747,093
Works & Plant (5,500) 1,245 (283) 6,301 809 1,808 4,038 8,418
Sub Total Railway 258,580 113,115 403,454 204,423 179,137 263,923 283,413 (172,384) 1,533,661
Garages & Stables (3,070) 145 (2,925)
Horses 172 (254) (160) (109) (237) (306) (131) (491) (1,516)
Road Vehicles - Goods 1,201 2,237 1,029 682 1,100 1,113 1,851 2,751 11,964
Road Vehicles - Passengers 4,328 (4,328) 0
Electric Power Stations 97,957 83,076 132,118 42,307 60,275 1,019 59,054 12,302 488,108
Land & Property not for
railway use
(19,123) 1,874 1,402 5,541 35,442 (42,705) 2,164 816,195 800,790
Stamp Duty on Capital 938 938
Sub Total Non-Railway 80,207 86,933 134,389 48,421 97,518 (36,551) 59,868 826,574 1,297,359
Total 338,787 200,048 537,843 252,844 276,655 227,372 343,281 654,190 2,831,020

75
By the time that the MR & LNER jointly owned branch to Watford had opened in late 1925, the
MR’s share of the expenditure had increased from £31k at the end of 1921 to £186k at the end of
1925 and to £188k at the end of 1927. The MR’s investment in MR&GCRJC for the main line
north of Harrow increased by £72k during the period. The extension of the electrified lines to
Rickmansworth and Watford and increased traffic on the existing electrified lines required a regular
programme of upgrading Neasden power station, the supporting sub stations and the related
cabling. A sum of £488k was spent on these items during the period. New stations were opened at
Northwick Park and Hillingdon in 1923. Small amounts were also spent on the projected new tube
from Willesden Green to Edgware Road and a future quadrupling between Wembley Park and
Harrow.
Refurbishment of stations was seen as part of the drive to drive up revenues and during the mid-
1920s schemes were carried out at Aldgate, Edgware Road, Farringdon, Moorgate (GN&CR), St
John’s Wood and Willesden Green.
Elsewhere, the largest item of expenditure was the redevelopment of the Baker Street site, which
had been left in abeyance since the hotel project was abandoned. A sum of £673k was spent in the
years 1927-29 in creating a new frontage both along Baker Street north of Marylebone Road and
along the latter in an easterly direction. The development included the iconic Chiltern Court flats
and restaurant. Occupation started in the autumn of 1929. This expenditure was initially shown
within lines open for traffic and then transferred to land and property not for railway use in 1929.
The new junction with the Widened Lines cost £20k.
Rolling stock expenditure, mainly on electric stock but also including six K class steam locos,
amounted to £747k during the period. The electric stock included the 20 Metropolitan Vickers
electric locos delivered between 1921-23 for hauling trains of compartment stock out to the frontier
for steam, initially Harrow and then Rickmansworth from 1925, and in 1927 the first batch of
electric compartment stock, which was later to be called T stock by London Transport. Both the
electric locos and the T stock continued in service until 1960. Orders also included further trains of
Dreadnaught compartment stock.
Table 28 gives the revenue account for the period 1922-29:
76
Table 28
Revenue Account 1922-29 Part 1
1922 1923 1924 1925 1926 1927 1928 1929
£ £ £ £ £
£ £ £
Total Receipts
Passenger Trains 1,518,370 1,436,337 1,793,713 1,547,686 1,317,699 1,365,118 1,442,172 1,454,656
Freight Trains 138,716 138,212 155,929 145,863 105,778 151,780 143,883 152,314
Sub Total Traffic 1,657,086 1,574,549 1,949,642 1,693,549 1,423,477 1,516,898 1,586,055 1,606,970
Mileage, Demurrage & Wagon Hire 10,058 14,095 10,544 12,690 12,426
18,331 13,741 20,423
Joint Lines Traffic Receipts 297,390 281,060 290,071 280,540 255,313 278,759 280,529 284,270
Other 11,932 11,743 13,783 12,200 10,613 12,123 12,777 13,198
Total 1,976,466 1,881,447 2,264,040 1,998,979 1,701,829 1,826,111 1,893,102 1,924,861
Total Expenditure
Maintenance of Way, Works & Stations 169,364 132,989 157,027 117,698 110,373 128,693 150,198 138,432
Maintenance & Repair of Rolling Stock 211,320 207,945 278,654 198,356 179,369 196,145 211,787 199,702
Locomotive Running Costs 324,504 301,535 333,069 331,768 343,744 293,686 302,217 309,137
Traffic Expenses 338,792 320,592 350,761 336,488 318,095 317,775 332,356 325,670
General Charges 86,340 88,122 114,301 107,257 108,903 98,741 85,045 84,534
Law Charges & Parliamentary Charges 5,034 4,042 4,587 5,289 5,485 4,728 10,910 2,044
Compensation 3,703 3,686 3,996 4,073 4,249 4,068 3,813 3,851
Rates, Taxes & Government Duty 80,631 70,790 67,431 67,059 68,487 70,163 68,271 53,122
Railway Freight Rebate Fund – Rate
Relief 11,824
National Insurance 6,265 6,475 6,560 6,383 8,389 8,395 7,630 7,598
Running Powers (46,432) (46,655) (51,133) (50,396) (48,281) (59,146) (62,239) (61,519)
Sub Total Traffic 1,179,521 1,089,521 1,265,253 1,123,975 1,098,813 1,063,248 1,109,988 1,074,395

77
Table 28
Revenue Account 1922-29 Part 2
1922 1923 1924 1925 1926 1927 1928 1929
£ £ £ £ £
£ £ £
Sub Total Traffic 1,179,521 1,089,521 1,265,253 1,123,975 1,098,813 1,063,248 1,109,988 1,074,395
Joint Lines Traffic Expenses 212,558 195,375 199,997 196,505 188,016 194,250 194,333 196,603
Other 5,154 5,100 5,055 4,683 4,277 4,155
Total 1,397,233 1,289,996 1,470,305 1,325,163 1,291,106 1,261,653 1,305,321 1,270,998
Net Receipts 579,233 591,451 793,735 673,816 410,723 564,458 587,781 653,863
78
One effect of the 1928 Order was to change the way in which the results of the joint lines were
presented. To provide consistency, the results for the joint lines for 1928-33 have been adjusted to
reflect the treatment up to 1927.
The period 1922-29 was a period of mixed fortunes for the MR. Overall, the British economy began
to grow in these years, apart from a dip caused by the coal strike and national strike in 1926.
However, rail transport began to experience increasing competition from road transport as the
internal combustion engine began to be improved and used more extensively for freight and
passenger road vehicles. Buses, like the trams before them, began to take an increasing share of the
MR’s short distance rail traffic, although this was offset by the company’s promotion of commuter
traffic from the outer suburbs and beyond. As the MR’s freight traffic involved many short haul
journeys, it was vulnerable to competition from lorries.
One piece of good fortune was to benefit the MR, particularly in 1924-25. The choice of the
Watkin’s Folly site at Wembleyxi for the British Empire Exhibition was to lead to a considerable
boost to passenger numbers in those years, as Wembley Park station was the most convenient
access point for the Exhibition. It would also benefit from subsequent events at the stadium
thereafter.
Comparisons with 1921 are not possible because the revenue account data is not available. Total
receipts from passenger trains rose from £1.518m in 1922 to £1,794m in 1924, an increase of 18 per
cent. In 1925, when the Exhibition closed they were still £1.548m. In 1926, the year of the strikes,
total receipts from passenger trains had fallen to £1.318m, 13 per cent lower than in 1922. Growth
resumed in the following year, but receipts had only reached £1.455m in 1929. Total receipts from
freight trains benefitted to lesser extent from the Exhibition but rose 12 per cent between 1922 and
1924. The impact of the strikes in 1926 on the MR’s freight train receipts was severe, where the
total of £106k was 24 per cent lower than 1922’s £139k. The recovery in the years 1927-29 was
more marked than with passenger train receipts and the total of £152k for 1929 was 9 per cent up
on 1922. Traffic receipts from the joint lines followed a similar pattern, but without the Wembley
effect. The receipts in 1929 at £284k were 4 per cent below 1922.
Expenditures rose less markedly than receipts in the years 1922-24 and the net receipts for 1924 at
£794k were 37 per cent up on 1922’s £579k and in 1925 had only fallen to £674k. By contrast, in
1926, it was not possible to reduce costs proportionately to the loss of receipts. Net receipts in that
year at £411k were 29 per cent lower than the £579k in 1922. Recovery in the years 1927-29 meant
that net receipts in 1929 at £654k were 13 per cent up on 1922. Similarly, net receipts from the joint
lines in 1929 were slightly up on 1922.
There were tax changes in 1929 affecting the railways. Railway passenger duty on first class fares
was abolished, saving the MR about £2k per annum. An element of rates relief was also introduced
for the railways to help their competitive position vis a vis road transport. However, the amount
rebated had to be spent by the railways on approved purposes and £12k was rebated for the MR in
1929.
The net revenue & appropriation account for the period 1922-29 was as follows:

79
Table 29
Net Revenue & Appropriation Account 1922-29 Part 1
1922 1923 1924 1925 1926 1927 1928 1929
£ £ £ £ £ £ £ £
Receipts
B/Fwd Balance 17,797 33,137 35,250 53,873 51,658 22,211 26,464 23,888
Balance Revenue Account - Railway 579,233 591,451 793,735 673,816 410,723 564,458 587,781 653,863
Balance Revenue Account - Other (276) (12,043) (10,245)
Rents from Property 51,359 60,599 65,734 60,444 66,556 68,298 76,708 78,741
Other Rents 94,219 97,934 105,451 101,003 100,606 98,964 98,919 103,141
Rent of Leased Lines 64,000 64,000 64,000 64,000 64,000 64,000 64,000 64,000
Joint Lines Non-Traffic 12,891 17,611 16,610 22,412 23,322 19,551 18,117 14,231
Other 38,346 47,844 60,565 58,248 49,322 23,867 16,331 10,157
Sub Total 857,845 912,576 1,141,345 1,033,796 766,187 861,073 876,277 937,776
Expenditure
Interest on Debentures 198,740 198,740 232,302 233,740 258,912 259,990 259,990 259,990
Rents, Wayleaves etc 6,119 6,130 6,132 6,158 6,205 6,206 6,252 6,250
Rents & Guaranteed Interest on Leased
Lines 37,739 40,063 40,522 40,243 39,356 39,363 38,513 38,727
Joint Lines Non-Traffic 23,118 23,118 23,118 23,119 23,117 23,116 23,118 23,118
Interest on Lloyd Bonds 25,798 26,183 30,000 31,951 23,175 3,049
Income Tax (Railways Act 1921) 89,399 (50,000)
Other 1,328 1,373 1,322 1,270 1,332 1,262 1,318 1,279
Sub Total 292,842 295,607 422,795 336,481 302,097 332,986 329,191 329,364
Transfer to Reserve Fund 15,000 15,000 25,000 (50,000) 10,000 800 10,000
Balance Available for Dividends 550,003 601,969 693,550 697,315 514,090 518,087 546,286 598,412

80
Table 29
Net Revenue & Appropriation Account 1922-29 Part 2
1922 1923 1924 1925 1926 1927 1928 1929
£ £ £ £ £ £ £ £
Balance Available for Dividends 550,003 601,969 693,550 697,315 514,090 518,087 546,286 598,412
Profit on Investments 7,118 1,014
Dividends
Preference Stocks 256,456 269,098 267,132 264,429 264,263 264,263 264,263 264,263
Consolidated Ordinary Stock 260,410 297,621 372,545 381,228 227,616 227,360 265,253 303,146
Sub Total 516,866 566,719 639,677 645,657 491,879 491,623 529,516 567,409
B/Fwd Balance 33,137 35,250 53,873 51,658 22,211 26,464 23,888 32,017
% Dividend on Consolidated
Ordinary Stock 3½% 4% 5% 5% 3% 3% 3½% 4%
Surplus Land Dividend 82,529 85,830 89,131 92,432 93,733 95,733 99,034 102,335
% on Surplus Land Stock 3⅛% 3¼% 3⅜% 3½% 3⅝% 3⅝% 3¾% 3⅞%
81
The changes to the accounting formats made by the 1928 Order led to the revenue balance for non-
railway operations being shown separately. In the case of the MR, this only covered road transport,
which made small loss of £12k in 1928. Apart from a brief trial of passenger carrying vehicles in
1927-29, this was for parcels and merchandise. While the rent for the leased lines remained
constant at £64k per annum, rents from property and other sources both rose during the period.
Property rents, which amounted to £51k in 1921 had risen to £79k in 1929, by 55 per cent. Other
rents rose from £88k in 1921 to £103k in 1929, by 17 per cent. Non-traffic revenue from the joint
lines fell sharply from the £26k in 1921 and had only recovered to £14k in 1929. Other non-
specified receipts appear have reached their peak in the years of the Exhibition at Wembley.
Expenditures for non-operational purposes, which had reached £292k in 1921 rose to £329k in
1929 mainly arising from the interest on two tranches of debentures issued in 1924 and 1926. Rents
and guaranteed interest on the leased lines remained fairly constant over the period in the range
£38k to £41k. Non-traffic expenditures in respect of the joint lines was a regular £23k. Regular
transfers to the reserves were made in most years, except for 1926, when £50k had to be transferred
out of the reserves to support the dividend payment. In 1924 a provision of £89k was made for
income tax, which the company felt could arise from the Railways Act 1921. However, £50k of this
was reversed in 1926, again to support the dividend payment.
A further issue of preference shares rated at 5 per cent was made in 1922. The interest and
dividends on debentures, loans and preference shares rose from £438k in 1921 to £524k in 1929.
Economic recovery and the fortunate circumstances of 1924-25 made it possible for the dividend on
the consolidated ordinary stock to rise from the 2¼ per cent in 1921 to a peak of 5 per cent in 1924-
25. This fell back sharply to 3 per cent in 1926 but had recovered to 4 per cent in 1929. The Surplus
Land Stock had a successful period with the dividend rising gradually from 3 per cent in 1921 to
3⅞ per cent in 1929.
13. Depression and the Demise of the MR 1930-33
In the autumn of 1929, a stock market collapse in the US led to a recession there, which spread to
the UK and elsewhere in the world. The resulting depression, the Great Depression 1929-33, was
the most severe in living memory and affected the MR’s operations for the rest of its existence. In
parallel with these adverse trading conditions, the minority Labour government elected in June
1929 announced its intention to introduce a bill to bring about a form of passenger transport co-
ordination for London. Although the bill did not emerge until March 1931, it was fairly clear that
the MR would be amalgamated in some form with the UERL and so it proved. The 1931 London
Passenger Transport Bill had sufficiently wide political support to survive the change to the
National Government in October 1931 and the terms of the bill were passed substantially unaltered
in April 1933. The vesting date was 1 July 1933 and the MR became part of the new LPTB on that
date. From late 1931, the MR board had to accept that the case for continued independence had
been lost and concentrate on obtaining the best deal for its shareholders. This task fell mainly on
John Sloane Anderson, Selbie’s successor as general manager.
Despite the effects of the Great Depression and the adverse political situation, the MR was far from
inactive in its final years. One piece of government legislation, the 1929 Development (Loans
Guarantees & Grants) Act, made it possible for railway companies to apply for Treasury assistance

82
for capital development work, particularly where helping to relieve unemployment. The Act
enabled the MR to construct a four-mile branch from north of Wembley Park to Stanmore, which
was completed just before the end of 1932. In addition, it was able to proceed with the quadrupling
of the line between Wembley Park and Harrow, which was completed in April 1932.
Over the period to the last day of the MR’s independent existence, 30 June 1933, the increases in
capital authorised and created and the amount received into the capital account over the period were
as follows:
31 December 1929 30 June 1933 Increase
£m £m £m
Capital Authorised & Created
Shares 14.658 14.658 -
Loans 7.421 11,371 3.950
Total 22.079 26.029 3.950
Amount Received into Capital Account
Shares 13.703 13.703 -
Loans 6.951 10.901 3.950
Premiums/(Discounts) (1.111) (1.891) (0.780)
Total 19.543 22.713 3.170
Some £2m of the increase of £3.950m in capital authorised and created, all loans, took place in
1930 to finance the construction of the Stanmore branch and the Wembley Park to Harrow
widening, with the remainder in 1932 as the MR prepared for the takeover.
Under the terms of the LPTB Act, the debenture and preference shareholders were to receive LPTB
securities, which had an equivalent return. The holders of consolidated ordinary stock were to have
the option of receiving:
i. C Transport Stock at the rate of £67.50 for every £100.00 held. The new stock could earn a
return of up to 6 per cent, but this was not guaranteed but dependent on the financial
results for the year.
ii. Metropolitan Assented Stock at the rate of £100.00 for every £100.00 held. The new stock
was guaranteed a 3¼ per cent return for 15 years and 3 per cent per annum for a further 10
years. After 25 years, the new stock had to be converted into C Transport Stock on the
terms in i above.
In the event, those taking up option ii) were to fare better, as a short economic recovery in the years
1935-37 was followed by recession and then World War II.
The amount spent on capital account by 30 June 1933 was £23.376m made up of:

83
£m
Owned
Lines open for traffic 12.790
Lines Jointly Owned
- H&CRJC 0.057
- CL&EJC 0.908
- MR&LNERJC – Watford Branch 0.188
Lines Jointly Leased
- MR&GCRJC 0.100
Rolling stock 2.808
Manufacturing/repairing works & plant 0.134
Sub Total Railways 16.985
Garages & stables 0.004
Horses 0.003
Road vehicles 0.016
Electric power stations 1.882
Land & property not part of railway 1.798
Transferred to Surplus Lands Committee 2.641
Stamp duty on capital 0.047
Total 23.376
The capital expenditure 1930-33 was made up of the following:

84
Table 30
Analysis of Capital Expenditure 1930-33 Part 1
1930 1931 1932 1933 Total
£ £ £ £ £
Lines Owned
New Lines
Stanmore Branch
Land Purchase 43,632 100,792 (144,424)
Construction of Way &
Stations 1,587 73,556 (75,143)
Law & Parliamentary 2,841 3,793 (6,634)
Sub Total 48,060 178,141 (226,201)
Widenings
Wembley Park – Harrow 23,826 136,085 (164,443) (4,532)
Open for Traffic
Land Purchase 813 18,774 147,746 2,066 169,399
Construction of Way &
Stations 44,566 47,101 463,599 53,211 608,477
Law & Parliamentary 118 871 (1,431) 389 (53)
Sub Total 45,497 66,746 609,914 55,666 777,823
Sub Total Lines Owned 117,383 380,972 219,270 55,666 773,291
Lines Jointly Owned
CL&EJC 38 111 149
Lines Jointly Leased
MR&GCRJC 704 22 8,272 8,998
Sub Total Lines 118,125 380,994 227,653 55,666 782,438
Rolling Stock 130,735 11,460 101,553 113,176 356,924
Works & Plant 104 55 159
Sub Total Railway 248,964 392,509 329,206 168,842 1,139,521

85
Table 30
Analysis of Capital Expenditure 1930-33 Part 2
1930 1931 1932 1933 Total
£ £ £ £ £
Sub Total Railway 248,964 392,509 329,206 168,842 1,139,521
Horses (82) (47) (28) (59) (216)
Road Vehicles - Goods (31) (825) (856)
Electric Power Stations 213,309 18,029 127,795 41,345 400,478
Land & Property not for railway
use 107,236 34,791 (27,520) 2,401 116,908
Stamp Duty on Capital 2,500 42,500 45,000
Sub Total Non-Railway 322,932 52,773 141,922 43,687 561,314
Total 571,896 445,282 471,128 212,529 1,700,835

86
By the time the Stanmore branch opened in late 1932, a total of £395k had been spent, including the
£226k spent in 1930-31. A further £29k was reported as being spent within lines open in 1933.
When the Wembley Park to Harrow widening was completed in mid-1932, a total of £164k had
been spent, including the small amount spent prior to 1930. A further £1k was reported as being
spent within lines open in 1933. Both projects required further work on the electrification
infrastructure and £400k was spent on this 1930-33. In particular, some new rotary transformers
had to be purchased and others transferred to uprate existing substations. A new station was built at
Northwood Hills and refurbishment completed at Euston Square and Great Portland Street during
the period. A programme of lengthening platforms between Aldgate and Uxbridge to take eight car
trains was carried out during the period. The £11k spent on the aborted Moorgate to Lothbury and
Willesden Green to Edgware Road schemes ceased to be shown as new lines in 1931.
A further £357k was spent on new rolling stock. The bulk of this was for further batches of electric
compartment stock (T stock).
Although the Baker Street development had begun to be occupied in 1929, expenditure continued
in 1930 and to a lesser extent after. This took the 1929 total of £637k up to £739k, excluding a
small element transferred to railway purposes. The whole of the Baker Street site became part of
the LPTB in 1933, although assets managed by the Surplus Lands Committee and the
corresponding shares issued in 1887 were transferred to a separate independent company. Since
1919 the MR had indirectly controlled a company called Metropolitan Railway Country Estates
Ltd, which had acquired land and promoted housing development in the vicinity of the MR’s lines.
This company also was to remain independent outside the LPTB control.
One of the changes brought about to financial reporting by the 1928 Order was to show stamp duty
paid on new capital as a separate item of capital expenditure and £45k was recorded for 1930-33.
Table 31 gives the revenue account for the period 1930-33:

87
Table 31
Revenue Account 1930-33
1930 1931 1932 1933
£ £ £ £
Total Receipts
Passenger Trains 1,467,153 1,399,428 1,320,281 637,876
Freight Trains 157,643 149,583 134,042 72,598
Sub Total Traffic 1,624,796 1,549,011 1,454,323 710,474
Mileage, Demurrage & Wagon Hire 20,070 23,978 24,271 13,559
Joint Lines Traffic Receipts 285,367 262,273 241,854 130,377
Other 13,468 15,800 14,411 3,657
Total 1,943,701 1,851,062 1,734,859 858,067
Total Expenditure
Maintenance of Way, Works & Stations 159,043 141,230 140,308 65,042
Maintenance & Repair of Rolling Stock 212,290 206,603 204,082 99,999
Locomotive Running Costs 316,799 315,284 316,195 132,483
Traffic Expenses 332,715 320,337 321,224 157,955
General Charges 83,592 79,618 78,265 40,758
Law Charges & Parliamentary Charges 2,907 3,977 4,942 2,557
Compensation 2,552 2,575 2,521 1,269
Rates & Taxes 18,440 17,409 16,867 8,233
Railway Freight Rebate Fund – Rate Relief 46,979 46,873 44,920 21,583
National Insurance 7,720 7,978 8,284 4,131
Running Powers (61,210) (57,229) (47,562) (27,568)
Sub Total Traffic 1,121,827 1,084,655 1,090,046 506,442
Joint Lines Traffic Expenses 200,366 182,299 174,058 87,913
Total 1,322,193 1,266,954 1,264,104 594,355
Net Receipts 621,508 584,108 470,755 263,712

88
As has been seen, the onset of the Great Depression in late 1929 did not significantly affect the
MR’s results for that year. However, the years 1930-32 saw an on-going deterioration in
performance. The six months results for the first half of 1933 should be viewed with caution, as
there is some seasonality in railway company trading, but viewed overall do not show any major
signs of an upturn. Total passenger train receipts fell from £1.455m in 1929 to £1.320m in 1932, a
fall of 9 per cent. Freight train receipts, which had reached £152k in 1929, fell to £134k in 1932, a
larger fall of 12 per cent.
Traffic receipts from the joint lines fell from £284k in 1929 to £242k in 1932, a reduction of 15 per
cent, in part reflecting the fall in freight traffic north of Harrow.
It proved difficult to reduce expenditures in line with the reducing revenues and in fact there was
slight increase from £1.074m in 1929 to £1.090m in 1932. As a result, net receipts fell from £654k
in 1929 to £471k in 1932, a reduction of 28 per cent. The amount rebated in respect of rate relief
settled down in the range £45-47k for 1930-32. Net receipts from the joint lines fell from £88k in
1929 to £68k in 1932, a fall of 23 per cent.
The net revenue & appropriation account for the period 1930-33 was as follows:

89
Table 32
Net Revenue & Appropriation Account 1930-33 Part 1
1930 1931 1932 1933
£ £ £ £
Receipts
B/Fwd Balance 32,017 33,546 41,482 36,967
Balance Revenue Account - Railway 621,508 584,108 470,755 263,712
Balance Revenue Account - Other (9,506) (9,776) (9,168) (1,943)
Rents from Property 98,114 109,938 118,953 57,791
Other Rents 101,981 101,228 97,160 44,130
Rent of Leased Lines 64,000 64,000 64,000 32,000
Joint Lines Non-Traffic 13,671 15,547 18,030 10,002
Grants 1929 Development Act 660 3,462 11,326 10,338
Other 6,884 (3,623) 26,260 12,202
Sub Total 929,329 898,430 838,798 465,199
Expenditure
Interest on Debentures 302,854 329,990 389,714 214,921
Rents, Wayleaves etc 6,250 6,242 6,283 3,182
Rents & Guaranteed Interest on Leased
Lines 38,600 38,065 38,293 18,674
Joint Lines Non-Traffic 23,118 23,118 23,118 11,556
Other 1,346 1,328 4,384 2,199
Sub Total 372,168 398,743 461,792 250,532
Transfer to Reserve Fund 9,288 2,719 16,360
Balance Available for Dividends 557,161
490,399 374,287 198,307

90
Table 32
Net Revenue & Appropriation Account 1930-33 Part 2
1930 1931 1932 1933
£ £ £ £
Balance Available for Dividends 557,161
490,399 374,287 198,307 Profit on Investments 5,901 4,813 50,096
Dividends
Preference Stocks 264,263 264,263 264,263 131,740
Consolidated Ordinary Stock 265,253 189,467 123,153 33,021
Sub Total 529,516 453,730 387,416 164,761
B/Fwd Balance 33,546 41,482 36,967 33,546
% Dividend on Consolidated
Ordinary Stock 3½% 2½% 1⅝% 0.4344%
Surplus Land Dividend 105,637 108,938 102,335
% on Surplus Land Stock 4% 4⅛% 3⅞%
91
The small annual loss on road transport operations remained at around £10k in the years 1930-32.
Despite the economic situation, rents from property helped by the completion of the redevelopment
at Baker Street rose from £79k in 1929 to £119k in 1932, up 50 per cent. Other rents showed only a
small reduction from £103k in 1929 to £97k in 1932. Non-traffic revenue from the joint lines rose
from £14k to £18k during the period. Other interest earnings showed a sharp increase in 1932, as
the cash from the additional debentures came in.
Expenditures for non-operational purposes rose from £329k in 1929 to £462 in 1932 up 40 per cent,
particularly in respect of the interest on the issue of debentures in 1932. Rents and guaranteed
interest on the leased lines remained constant at around £38k per annum during the period. Non-
traffic expenditures in respect of the joint lines remained at a regular £23k per annum. The Board
made special transfers of £14k to a reserve to make the MR’s case regarding the LPTB Bill in the
years 1931-33. Also, in 1933 the MR was obliged to make special transfer to the reserves of £14k
as per section 82 (8) of the LPTB Act.
Since the 1928 Order, the profit on the sale of investments was shown separately in the
appropriation account and in 1932 a profit of £50k arose mainly on the sale of government
securities held for working capital purposes, when the bank rate was reduced from 6 per cent in
1931 to 2 per cent in 1932. The interest and dividends on debentures, loans and preference shares
rose from £524k in 1929 to £654k in 1932. The deterioration in trading conditions made it
inevitable that dividend on the consolidated ordinary stock would fall from the 4 per cent paid in
1929. By 1932, this had fallen to 1⅝ per cent. In 1933, the odd dividend percentage of 0.4344 was
specified in section 82 of the LPTB Act. The Surplus Land Stock fared much better and paid the
same 3⅞ per cent in 1932 as they had in 1929, with rises above this in the two intervening years.
14. An Assessment
Published sources have already covered very adequately the MR’s achievements during its 80 years
of in dependent existence. Its unique feature was of course that it was the first underground urban
railway of its type not only in the UK, but in the world, serving the heart of London’s commercial
district and carrying both passengers and freight. It succeeded along with its rival the MDR in
extending the original line to create an Inner Circle serving a much wider range of interests in
Central London and starting feeder lines to bring the inhabitants in and out of the centre, as London
expanded.
The MR’s long independent life of just under 80 years from 1853 to 1933 was also unique, albeit
that it was fortunate that the future organisation of public transport in London was not covered by
the 1921 Act, adding an additional ten years of existence, which was not available to most of the
main line railway companies. By comparison, the LSWR had an independent existence of 89 years
from 1834 to 1922, the GWR 88 years from 1835 to 1922 and the Taff Valley Railway 87 years
from 1836 to 1922. The MidR and the LNWR had independent lives of just under 80 years.
The MR also acquired something of a celebrity status through the naming of Metroland and its later
promotion by the poet John Betjeman. Underlying this was some good fortune in the way the MR
was able to manage its property affairs. Its enabling act and subsequent acts gave it the power to
acquire surplus land ostensibly with future railway use in mind. During the Parson chairmanship,

92
these powers were exploited to the full, sometimes with doubtful legality. Watkin realised the
dangers of cross subsidising the main railway operations with profits from land deals and was
instrumental in bringing about the settlement of 1887 whereby the ordinary stock of the company
was split into two portions with £2.641m of Surplus Land Stock issued at the rate of £1 for every £2
of existing stock. The MR established a Surplus Lands Committee to manage the properties and
produce separate accounts for them. Surpluses on these land transactions were used for
reinvestment and to pay dividends on the Surplus Land Stock. In reality, the MR was able to
exercise control through its Surplus Lands Committee and ensure that its activities were conducted
for the railway’s benefit at Willesden, Wembley and then further down the lines to Aylesbury and
Uxbridge. The term Metroland was first used in 1915 in connection with annual guides for the areas
served by the MR. The formation of the nominally independent Metropolitan Country Estates Ltd
in 1919 reinforced the activities being carried out by the Surplus Lands Committee.
These unique attributes described above only take one so far in trying to assess the performance of
the MR from a financial point of view. It is also necessary to try as far as possible to compare the
company with its peers. At the end of its life in 1933, there was no company with which it could be
validly compared. The Big Four were so radically different in composition and geographical
coverage that any comparison with them would be meaningless. Although UERL contained the
MR’s old rival the MDR, the predominant balance of tube railways plus its road transport interests
made it a significantly different animal. However, it is useful to compare the MR and the MDR in
1900, the last year of the latter as an independent company. Of the main line railway companies,
which disappeared at Grouping and before, one that was similar to the MR in several ways was the
London Tilbury & Southend Railway (LT&SR) taken over by the Midland Railway in 1912 and it
is useful to compare the two in 1911.
The following are comparisons between the MDR and the MR for the year 1900:
Track miles owned, jointly owned and leased
MDR MR
15 miles 11 chains 69 miles 72 chains
In both cases, the figures exclude lines over which they had running powers such as each other’s
part of the Inner Circle, Putney Bridge to Wimbledon and the Brill Tramway.
Amounts received into the capital account
MDR MR
£8.377m £12.364m
Total No of Passengers
MDR MR
46.714m 93.333m

93
The passenger numbers for the MR are taken from their annual report, but the method for
converting season tickets to passengers is not stated. In the case of the MDR, the passengers using
ordinary tickets is taken from their annual report and the number of season ticket holders from the
same source has been factored up to passenger journeys by 600, the method used in the Board of
Trade London Traffic Branch Report.
Total Receipts from Passenger & Freight Trains
MDR MR
£399k £823k
Surplus on the Revenue Account
MDR MR
£199k £453k
Net Profit Before Interest on Debentures & Loans and Dividends
MDR MR
£122k £534k
Return on Capital Receipts
MDR MR
1.5% 4.3%
Dividends on Ordinary Stock
MDR MR
0% 3.125%
Although the two companies were formed at roughly the same time, it is evident that on all the
above measures the MR had made considerably more progress than its rival by 1900. The MR was
earning a much superior return on capital, 4.3 per cent versus 1.5 per cent. In 1900 the yield on
government long term bondsxii was 2.53 per cent and the rate of inflationxiii 1.5 per cent. The MR
was thus earning a risk premium over the return on government debt whereas the MDR’s return
was well below. The MR was also providing better protection against inflation. Not only was the
MDR unable to pay a dividend on its ordinary stock in 1900, but it only paid a dividend on the
stock in five years during its whole existence, with a maximum of 1⅛ per cent in 1880. Because of
financial problems earlier in its life, the MDR was burdened by a large tranche of 6 per cent
debentures and by a similar tranche of 5 per cent preference shares. By contrast the MR had for the
most part paid dividends of 3 per cent or more from 1863. The majority of its debentures and
preference shares were rated at 4 per cent.
The following are comparisons between the LT&SR and the MR for the year 1911:

94
Track miles owned, jointly owned and leased
LT&SR MR
87 miles 29 chains 84 miles 44 chains
In both cases, the figures exclude lines over which they had running powers.
Amounts received into the capital account
LT&SR MR
£5.780m £15.069m
Total No of Passengers
LT&SR MR
49.581m 101.621m
The passenger numbers for the MR are taken from their annual report, but the method for
converting season tickets to passengers is not stated. In the case of the LT&SR, the passengers
using ordinary tickets is taken from their annual report and the number of season ticket holders
from the same source has been factored up to passenger journeys as above.
Total Receipts from Passenger & Freight Trains
LT&SR MR
£664k £721k
Surplus on the Revenue Account
LT&SR MR
£261k £406k
Net Profit Before Interest on Debentures & Loans and Dividends
LT&SR MR
£265k £566k
Return on Capital Receipts
LT&SR MR
4.6% 3.8%
Dividends on Ordinary Stock
LT&SR MR
6% 1.875%

95
The LT&SR had slightly longer existence than the MR, with its first section of line opening in
1854, although by 1911 they had networks of similar length. The LT&SR had a greater volume of
freight traffic owing to its proximity to the various docks along the River Thames. As a smaller
proportion of the LT&SR’s mileage was built in the Central London area with its expensive land
prices, particularly because it was able to use the London & Blackwall Railway’s terminus at
Fenchurch Street and its first few miles of track to Gas Factory Junctionxiv, the capital invested in
the company was only 38 per cent of that invested in the MR. Superficially, the MR appears to have
been considerably more profitable, with its surplus on the revenue account 56 per cent higher than
that of the LT&SR and its net profit before interest and dividends over twice as high. However,
with its considerably smaller capital base, the LT&SR was earning a much superior return on
capital, 4.6 per cent versus 3.8 per cent. In 1911, the yield on long term government bonds was 3.15
per cent and the rate of inflation 1.56 per cent. Although both companies were earning a risk
premium over the return on government debt, the LT&SR’s was much superior. Both companies
were providing protection against inflation, again with the LT&SR having the better margin. The
LT&SR’s dividends on its ordinary stock were also well in excess of the MR’s. It is perhaps not
surprising that the MidR found the LT&SR an attractive candidate for acquisition.
One of the changes introduced by the 1911 Act was to separate the revenue account for the railway
business from the other businesses (canals, ferries, docks, hotels etc) and show an operating ratio
for the railway business. As 1913 was the last “normal” year before grouping, it is useful to
compare the MR’s ratio of 55.9 per cent with that of other companies. A study of the financial state
of Britain’s railways in 1913xv gave the operating ratios for 20 of the leading companies. The MR
would have been second in that table to the Great North of Scotland Railway with 54.0 per cent.
Companies with large London commuter networks were all much higher; LBSCR (61.3 per cent),
South Eastern & Chatham Railways Joint Committee (62.0 per cent) and Great Eastern Railway
(67.8 per cent). In 1932 in the depths of the Great Depression, the MR’s operating ratio had
increased to 72.6 per cent, but this was better than all the Big Four which were in the range 81.4 per
cent to 84 per cent.
All of the above seems to reinforce the view that the MR was unique railway, with which it was
difficult to make meaningful comparisons. Certainly by 1900, when the MDR was absorbed into
the UERL, it had shown that it was possible to make a commercial success by expending into the
outer London suburbs and surrounding countryside and attracting relatively affluent commuters to
offset the fierce competition from buses, tubes and trams nearer to the centre. However, its attempts
to become a main line railway were less successful as evidenced by the comparisons with the
LT&SR in 1911. Once Watkin was dead, the management of the GCR were less interested in
helping the MR to become a more credible main line railway using the GCR network than to
establish a London terminus at reasonable cost, as their subsequent dealings with the GWR to set
up the alternative Northolt to Ashendon route showed. In retrospect, the acquisition of the A&BR
and the Brill Tramway proved to be routes to nowhere. The rapid closure of these lines north of
Aylesbury by the LPTB was a recognition that commuter traffic into London from north of
Aylesbury was not viable. Similarly, Verney Junction was not a suitable location for main line
services to anywhere in the Midlands and the GCR did nothing to encourage the MR to run such
services via its extension line to Annersley near Nottingham. By contrast, the LT&SR was focused
on its riverside routes to Southend.

96
The emperor Napoleon famously said I would rather have lucky generals than good ones. In some
ways this applies to the MR. In terms of its exploitation of property assets, it was fortunate that the
early legislation relating to its development gave it considerable latitude in property matters. It was
also lucky to escape Grouping in 1923 and had ten more years of life than virtually all the smaller
railway companies. Later on, the choice of the site of the failed Watkin’s Tower Company project
as the venue for the British Empire Exhibition proved to be a considerable boost to the MR’s results
in 1924-25. Traffic for later events at the stadium was an added bonus.
Jackson headed one section of his overall assessment of the MR A Friend to Shareholders and the
Graph E tends to support this. Even in challenging times such as 1907-08, when the competition
from buses, tubes and trams was compounded by the heavy costs of building the Uxbridge branch
and completing the electrification of its Central London network, the MR was still able to pay its
debenture and preference stock holders in full and pay a small dividend to the ordinary
shareholders. Similarly, in the depth of the Great Depression in 1932, it was able to do the same
and pay a 1⅝ per cent dividend to its ordinary shareholders. By comparison, two of the Big Four,
the LMSR and the LNER, were unable to pay an ordinary dividend in that year and the SR was
only able to pay 1 per cent. The GWR paid 3 per cent but this was only possible by drawing
substantially on its reserves. As a postscript, the MR was reasonably successful in negotiating terms
for its shareholders, when the takeover by the LPTB took place. The Guaranteed Assented Stock
option was to prove a valuable guarantee of future income in uncertain times.
A more objective approach is to look at the MR’s percentage return on capital and to relate it to the
return on risk free investments, such as long-term government bonds, and the level of inflation. For
the years up to 1904 the MR was mostly earning a return on capital of over 4 per cent. Thereafter,
the return was above 3 per cent until 1921 and then above 4 per cent apart from 1932. From 1881 to
1909 the return on long term government bonds was below 3 per cent. From 1916 to 1931 the
return on long term government bonds remained above 4 per cent, peaking at 5.32 per cent in 1920.
During that period, it was only in 1923-25, that the MR’s return exceeded the return long term
government bonds. The position in 1932, its last full year of independence, was a MR return on
capital of 3.8 per cent and a return on long term government bonds of 3.76 per cent. It should be
added that the Big Four were in a worse position at that time.
To sum up, the MR was indeed a unique railway, which combined a “metro” style network in
Central London, a commuter railway in the inner and outer suburbs, a freight operation, some
elements of a mainline railway and investment in a successful property operation. It was also in
some respects a lucky railway, which rode and exploited its luck. To the extent that comparisons
with other railway companies are applicable, the MR compared very favourably with its “unlucky”
neighbour the MDR, before the latter was absorbed by UERL. The comparison with the LT&SR is
more interesting, because that railway had some luck of its own and was able to focus on a
narrower scope of operations than the MR. In its final year before accepting the MidR’s takeover
terms, the LT&SR was producing more favourable financial results. There was, however, some
downside to the above. As Graph F shows, from the turn of the twentieth century, the MR, like
most of the UK railway companies, was not a particularly attractive investment in relative terms.
Although its ordinary shareholders still received a dividend, even in troubled year like 1926, the
returns were not attractive compared to alternative forms of investment. The MR, like the Big Four,

97
was facing economic forces, which were largely outside their control. Even in their own transport
sector of the economy, there was a limit to what the MR and the Big Four could do to meet the
increasing competition from motorised road transport. There were certain traffics that were more
suitable to road transport and eventually needed to be surrendered. The control of fares and freight
rates established by the 1921 Act limited their room for manoeuvre. The acts of 1928, which
allowed the Big Four some participation in road transport, excluded the MR. The MR, despite
reaching the zenith of its financial performance before World War I continued to perform creditably
and at the end in 1933 was not in a markedly different financial state to the Big Four.

98
Appendix 1
CAPITAL FINANCING STRUCTURE
The enabling Acts for the MR, as with the other railway companies formed at the same time,
specified the amount of capital that was to be raised split into shares, sometimes referred to as
stocks, and loans. These two categories were frequently subdivided as follows:
1. Shares
a) Preference Shares
These shares were entitled to a first call on any profits after the interest on all loans
was paid. The dividend to which they were entitled was expressed as percentage on
the face value of the share certificate. Sometimes it was not possible to pay the full
amount due in an accounting period. If the shares were issued as cumulative
preference shares, any deficit arising in one period could be recouped in future
periods, if profits allowed.
b) Ordinary Shares
These shares were entitled to a dividend out of profits remaining after interest on
loans and dividends on preference shares had been paid in full. Not all of the
residual profits would be paid as dividends to the ordinary shareholders, as some
cash might need to be retained e.g. for future capital expenditure or as a reserve.
Ordinary shares were often subdivided as follows:
i. Preferred Ordinary Shares
These ordinary shares were entitled to a fixed percentage of the profits
available to the ordinary shareholders, before any payment was made to the
other ordinary shareholders.
ii. Ordinary Shares
These ordinary shares were entitled to a dividend out of any residual profits
after the payment of dividends in full to the preferred ordinary shareholders.
Where there were deferred ordinary shares, see below, the dividends could
be limited to a percentage ceiling.
iii. Deferred Ordinary Shares
These ordinary shares had the final call on any profits available after
payment of dividends to the other ordinary shareholders.

99
2. Loans
a) Unsecured Loans
These loans were not frequently used by railway companies, because the lenders,
having no security, required a high rate of interest. They were useful in the initial
stage of a railway company, before there were assets which could be used as
security.
b) Debentures
Debentures were loans with some security based on the assets of the company.
Where secured on specific properties, they were sometimes called mortgage
debentures. The loan interest was expressed as a percentage on the face value of the
loan certificate. Debentures could vary considerably e.g. in some cases having
preference for interest payment over other debentures or in others having conversion
rights into ordinary shares.
3. Premiums and Discounts
Premiums and discounts often arose in connection with the issue of shares and debentures. If a
company’s financial position was considered attractive, people subscribing for shares and
debentures could be asked to pay a premium in excess of the face value of the security.
Similarly, weaker companies had to offer a discount on the face value of the security.
4. Gearing
The term gearing relates to the ratio of capital financing, which has a fixed return, such as
debentures and preference shares, to the ordinary shares and deferred ordinary shares, which
have no ceiling on the level of return or the guarantee of any. The advantage of a high level of
gearing i.e. a large percentage of the total capital in the form of debentures and preference shares
is that the rewards to the ordinary and deferred ordinary shareholders escalate rapidly as the
company becomes more profitable. The downside is that when the financial results deteriorate
those rewards can fall rapidly and eventually be eliminated. The enabling Acts for the MR for
the most part set the authorised capital at 25 per cent loans and 75 per cent shares. However, the
company had discretion as to the proportion of preference shares it could issue within the shares’
percentage.
5. Capital Deficits
The amount spent on capital account always differed from the amount received from
shareholders and those making loans. If less, this was because there was normally a lag between
receiving and spending the money. As railways developed, capital spending often exceeded the
amount received on capital account. This was possible, at least in the short term, because the net
current assets in the business (cash, debtors and stock less creditors) could provide funding.
Fresh capital would normally be needed if the capital deficit grew too large.

100
6. Payment of Dividends out of Capital Receipts
The enabling acts for railways made it clear that the capital monies raised were to be used for the
railway infrastructure specified in them. This did not prevent unscrupulous directors from
manipulating the accounts, so that capital receipts were used to fund larger dividend payments
than would be justified from operating profits. The effect of this was to boost share prices
enabling such directors to sell shares and realise capital gains. Although George Hudson is
normally cited as indulging in such practices, John Parson of the MR was also accused of the
same thing.

101
Appendix 2
RUNNING POWERS, LEASED LINES AND JOINT LINES
The MR in common with the majority of railway companies did not exclusively operate its own
trains on its own tracks. The following types of operation tended to arise:
1. Running Powers over Other Companies’ Lines
Running powers enabled railway companies to run through trains to or from destinations
outside their own track network. The simplest form of arrangement for running powers
involved the payment of a “rental” by the company running the trains to the company
owning the track. This was often expressed as a percentage of the receipts earned by the
company operating the trains.
The MR had arrangements both ways. For example, it had running powers over lines owned
by the MDR and received payments from a number of companies with running rights over
its City Widened Lines.
2. Leased Lines
In some cases, the company owning a line did not run trains itself but leased the operation to
another company. Payment frequently took the form of a percentage of the receipts earned
by the company operating the line. The MR had this type of arrangement with the
MR&SJWR, before it acquired the company. Later it leased the Brill Tramway, where the
payment was a fixed sum per annum. The MR was also the leasing company for the joint
line with the GCR and for the two tracks built for the GCR from Harrow South Junction to
Canfield Place.
3. Joint Lines
Joint lines were ones where the ownership was shared by two or more companies. The
agreement between the parties would specify what the arrangements were for sharing capital
and running costs and for operating the line. Where one of the companies had originally
built the line, there would also be a leasing agreement with that company. The MR was a
major participant in the following joint lines:
• The H&CR with the GWR (Westbourne Park to Hammersmith)
• The CL&ER with the MDR (Mansion House to Aldgate & junction with the ELR)
• The MR&GCR with the GCR (Harrow South Junction to Verney Junction and
Chesham)
4. Joint Line Committees
The enabling Acts for joint lines invariably specified the formation of a joint committee to
administer the arrangements between the companies. Under the 1868 Act no provision was

102
made within the accounting statements for the reporting of transactions relating to joint
lines. Most companies tended to merge the costs and revenues relating to their joint lines
with those relating to their wholly owned lines. The 1911 Act made specific provision for
companies to report the transactions relating to the joint committees, where they had major
interest, separately from the rest of their operations. The joint committees themselves were
also required to report in a compatible form. It was only from 1913, the year that the 1911
Act took effect, that the results of the MR’s joint committees began to be reported in a
clearer form as Abstract J in their annual accounts. One oddity is that the MR’s Abstract J
from 1913 did not include the H&CRJC. This seems to be because of the agreement signed
with the GWR in 1912 whereby the MR assumed practical control of the services,
maintenance and works. In 1923, the MR also acquired the GWR’s 50 per cent of the
electric stock used to operate the line.

103
Graph A
Metropolitan Railway Total Receipts from Passenger and Freight Trains
-
500
1,000
1,500
2,000
2,500G
ross
Rec
eip
ts £
00
0
Year

104
Graph B
Metropolitan Railway Total Number of Passengers
-
20,000
40,000
60,000
80,000
100,000
120,000
140,000
160,000
180,000
Nu
mb
er '0
00
s
Year

105
Graph C
Metropolitan Railway Total Capital Receipts
-
5,000
10,000
15,000
20,000
25,000
18
54
18
56
18
58
18
60
18
62
18
64
18
66
18
68
18
70
18
72
18
74
18
76
18
78
18
80
18
82
18
84
18
86
18
88
18
90
18
92
18
94
18
96
18
98
19
00
19
02
19
04
19
06
19
08
19
10
19
12
19
14
19
16
19
18
19
20
19
22
19
24
19
26
19
28
19
30
19
32
Tota
l Cap
ital
Rec
eip
ts £
00
0
Year

106
Graph D
Metropolitan Railway Net Revenue before Interest on Debentures and Loans, and Dividends
-
200
400
600
800
1,000
1,200
Net
Rev
enu
e b
efo
re In
tere
st &
Div
iden
ds
£0
00
Year

107
Graph E
Metropolitan Railway Percentage Dividends on Ordinary Stock and Surplus Land Stock
-
1.000
2.000
3.000
4.000
5.000
6.000
7.000
8.000P
erce
nta
ge
Year
Ordinary Stock % Surplus Land Stock %

108
Graph F
Metropolitan Railway Percentage Return on Capital versus Return on Government Long Term Debt and Consumer Prices Index
0.0
1.0
2.0
3.0
4.0
5.0
6.0
18641866186818701872187418761878188018821884188618881890189218941896189819001902190419061908191019121914191619181920192219241926192819301932
Per
cen
tage
Year
Percentage Return % Return on Long Term Government Bonds % Consumer Prices Index %

109
References
i Jackson , A. A. (1986), London’s Metropolitan Railway, David & Charles.
ii Barker T. C. & Robbins M. (1975), A History of London Transport Volume 1 The Nineteenth
Century & Volume II The Twentieth Century, George Allen & Unwin.
iii Hawkes, I. (2018), A History of the Metropolitan Railway & Metro-Land, Crecy Publishing Ltd.
iv Rose, D. (1980), The London Underground, A Diagrammatical History, Douglas Rose.
v The annual reports of the MR for the years 1853-1933 can be found in The National
Archives (TNA) RAIL 1110/317-18.
vi The Railway Returns for the years in question can be found in TNA, RAIL 1053.
vii Sheward, T. (2014), The Development of Railway Financial Statements 1827-1948,
Gostwick Press.
viii Lee, C. E. (1972), The Metropolitan Line, London Transport.
ix Lee, C. E. (1988), The Metropolitan District Railway, The Oakwood Press. x Aldcroft, D. H. (1968), British Railways in Transition; the economic problems of Britain’s
railways since 1914, Macmillan.
xi Edwards, D. & Pigram, R. (1977), Metroland Memories, Midas Books.
xii Janssen, N., Nolan, C. and Thomas R. (2002), Money, Debt and Prices in the United Kingdom
1705-1996, Economica, vol 69 no 275, pp 461-479.
xiii O’Donoghue, J., Golding, I. and Allen, G. (2004), Consumer Price Inflation since 1750,
(London: Office for National Statistics), (ONS Economic Trends 604). xiv Welch, H. D. (1963), The London Tilbury & Southend Railway, The Oakwood Press.
xv Sheward, T. (2016), The Financial Sate of Britain’s Railways in 1913, Journal of the Railway &
Canal Historical Society Vol 38 Part 7 No 225 March 2016.