A Decade of Climate Scenarios - The Ouranos Consortium Modus Operandi
8
The first 10 years of the Ouranos Consortium are reviewed with a focus on the creation and delivery of climate scenarios for a wide range of users. A DECADE OF CLIMATE SCENARIOS The Ouranos Consortium Modus Operandi DAVID HUARD, DIANE CHAUMONT, T RAVIS LOGAN, MARIE-FRANCE SOTTILE, ROSS D. BROWN, BLAISE GAUVIN ST-DENIS, P ATRICK GRENIER, AND MARCO BRAUN AFFILIATIONS: HUARD, CHAUMONT, LOGAN, SOTTILE, ST-DENIS, GRENIER, AND BRAUN—Ouranos Consortium, Montréal, Québec, Canada; BROWN—Climate Research Division. Environment Canada, Montréal, Québec, Canada CORRESPONDING AUTHOR: Diane Chaumont, Ouranos, 550 Sherbrooke West, 19th floor, Montréal QC H3A 1B9, Canada E-mail: [email protected] The abstract for this article can be found in this issue, following the table of contents. I:10.1175/BAMS-D-12-00163.1 In final form 9 December 2013 ©2014 American Meteorological Society I n October 2011, the first International Conference on Climate Services (Vaughan 2011) was held in New York City “to initiate a dialogue between expe- rienced climate information providers and those who currently use or wish to use such information.” This kind of dialogue is a core component of the Global Framework for Climate Services initiative, launched through the World Meteorological Organization (WMO) in 2009 by 150 countries dedicated to provide timely climate services to their population. Climate services aim to provide actionable science—that is, data, analysis, and forecasts that are sufficiently predic- tive, accepted, and understandable to support decision making (Kerr 2011), or as Bruce Hewitson, University of Cape Town climatologist, puts it: “science that sci- entists are willing to bet their own money on.” According to WMO (2011), climate services “include the provision of data, data summaries and statistical analyses and predictions as well as tailored information products, scientific studies and expert advice delivered with ongoing support and user engagement.” In the United States this role is played by regional climate centers created in the 1990s under the purview of the National Oceanic and Atmospheric Administration (NOAA; www .noaa.gov/ ) to provide, in tandem with Regional Integrated Sciences and Assessments (Pulwarty et al. 2009), climate services to the public, industries, and governments (DeGaetano et al. 2010). In 2002, the government of the province of Québec in Canada partnered with universities and Hydro-Québec 1 to launch the Ouranos consortium with the objective of providing climate information and expertise in support of adaptation to climate change. Ouranos differs from most other climate service centers by merging operational climate modeling expertise, impacts, and adaptation expertise and climate analysis services under one roof. Ten years into this experiment in compulsory multidisciplinary scientific cohabitation, we felt that it was time to 1 Hydro-Québec is Québec’s publicly owned electricity utility. 1 AUGUST 2014 AMERICAN METEOROLOGICAL SOCIETY |
Transcript of A Decade of Climate Scenarios - The Ouranos Consortium Modus Operandi
The first 10 years of the Ouranos Consortium are reviewed with a focus on the creation and
delivery of climate scenarios for a wide range of users.
A DECADE OF CLIMATE SCENARIOS
The Ouranos Consortium Modus Operandi
DaviD HuarD, Diane CHaumont, travis Logan, marie-FranCe sottiLe, ross D. Brown, BLaise gauvin st-Denis, PatriCk grenier, anD marCo Braun
AFFILIATIONS: HuarD, CHaumont, Logan, sottiLe, st-Denis, grenier, anD Braun—Ouranos Consortium, Montréal, Québec, Canada; Brown—Climate Research Division. Environment Canada, Montréal, Québec, CanadaCORRESPONDING AUTHOR: Diane Chaumont, Ouranos, 550 Sherbrooke West, 19th floor, Montréal QC H3A 1B9, CanadaE-mail: [email protected]
The abstract for this article can be found in this issue, following the table of contents.I :10.1175/BAMS-D-12-00163.1
In final form 9 December 2013©2014 American Meteorological Society
I n October 2011, the first International Conference on Climate Services (Vaughan 2011) was held in New York City “to initiate a dialogue between expe-
rienced climate information providers and those who currently use or wish to use such information.” This kind of dialogue is a core component of the Global Framework for Climate Services initiative, launched through the World Meteorological Organization (WMO) in 2009 by 150 countries dedicated to provide timely climate services to their population. Climate services aim to provide actionable science—that is, data, analysis, and forecasts that are sufficiently predic-tive, accepted, and understandable to support decision making (Kerr 2011), or as Bruce Hewitson, University
of Cape Town climatologist, puts it: “science that sci-entists are willing to bet their own money on.”
According to WMO (2011), climate services “include the provision of data, data summaries and statistical analyses and predictions as well as tailored information products, scientific studies and expert advice delivered with ongoing support and user engagement.” In the United States this role is played by regional climate centers created in the 1990s under the purview of the National Oceanic and Atmospheric Administration (NOAA; www .noaa.gov/) to provide, in tandem with Regional Integrated Sciences and Assessments (Pulwarty et al. 2009), climate services to the public, industries, and governments (DeGaetano et al. 2010). In 2002, the government of the province of Québec in Canada partnered with universities and Hydro-Québec1 to launch the Ouranos consortium with the objective of providing climate information and expertise in support of adaptation to climate change.
Ouranos differs from most other climate service centers by merging operational climate modeling expertise, impacts, and adaptation expertise and climate analysis services under one roof. Ten years into this experiment in compulsory multidisciplinary scientific cohabitation, we felt that it was time to
1 Hydro-Québec is Québec’s publicly owned electricity utility.
1AUGUST 2014AMERICAN METEOROLOGICAL SOCIETY |
reflect on the path taken during these years and take a critical look at some of our successes and failures. This paper’s focus is on the creation and evolution of a dedicated scenario group—a team specifically created to handle user requests for general climate information and climate change scenarios. The expe-rience of Ouranos with and without a scenario group suggests that dedicated scenario professionals are a key ingredient to deliver effective climate services and maintain long-term healthy relationships between users and climate scientists.
THE CREATION AND ORGANIZATION OF OURANOS. The devastating 1996 Saguenay flood and the 1998 ice storm over Québec, Ontario, and New England caused billions in damage and
left public security officials wondering what would come next. These events, along with concerns about the exceptionally low levels of hydroelectric reser-voirs due to a series of dry years, raised the profile of meteorological threats. This new national security concern called for an institution that could deliver adequate information. At the same time, support for a team of young research scientists working on the Canadian Regional Climate Model (CRCM; see Caya and Laprise 1999) at Université du Québec à Montréal was threatened by changes in funding rules. In a ser-endipitous unfolding of events, these scientists were recruited to form the core of what would, in 2002, officially become the climate simulation group of the Ouranos Consortium.
Launched in Montréal with an annual budget of Can$4.6 million, Ouranos first mandate was to provide Canada with a regional climate projec-tions program. The funds were deployed to create the operational environment required for the task—namely, staff, hardware, software and digital storage—as well as to promote research efforts, both internal and uni-versity based. Over the first few years, the operational version of the Canadian Regional Climate Model was developed and a cli-mate projections database was created. The next step was to pro-vide data and expertise regarding climate change to support impact and adaptation studies carried out by its founding members. These members (Québec govern-ment departments, Environment Canada, Hydro-Québec, and four universities) contributed employees to Ouranos in a win–win arrangement that increased the manpower of Ouranos while at the same time facilitating the transfer of knowledge between organizations.
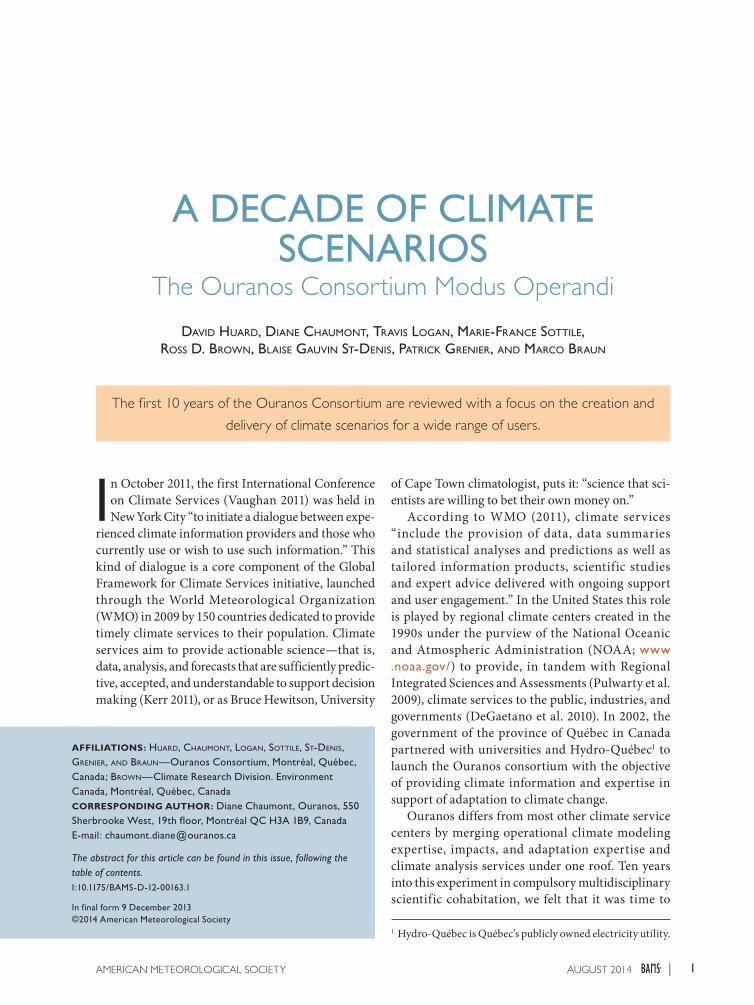
Following the Intergovern-mental Panel on Climate Change (IPCC) working groups’ struc-ture, Ouranos is divided into two entities: “Climate Science” and “Vulnerability, Impacts, and Adaptation” (Fig. 1). The
Vulnerability, Impacts, and Adapta-tion (VIA) group relies on a highly multidisciplinary staff, as well as experts from its network of mem-ber organizations, to coordinate a set of research and development (R&D) programs that span a variety of themes (see www.ouranos.ca/): agriculture, forests, water resources, health, biodiversity, energy, infra-structure, and tourism, including crosscutting issues across these themes. The VIA staff acts as network hubs and liaison officers in addition to participating in and/or ensuring proper oversight of the projects developed within these programs. Their work involves identify-ing priority research needs by working with poten-tial stakeholders through a variety of mechanisms (program committees, workshops with stakeholders, etc.). These stakeholders are mainly within govern-ment and academia but also include some industry sectors.2 The projects that they develop typically assess climate-change-related vulnerabilities and op-portunities and aim to identify and assess adaptation options. More generally, each project strives to bring together scientists, experts, and end users in a bid to narrow the interaction gap between science and decision making. The ideas underlying this knowl-edge transfer and examples of how this is carried out in practice are laid out in Vescovi et al. (2009) and Bourque et al. (2009).
Climate Science is divided in two groups: “Simu-lations and Analyses” and “Scenarios and Services.” Simulations and Analyses is responsible for pro-ducing and analyzing regional climate projections. This paper discusses the experience of the Scenarios and Services group, whose purpose is to serve the climate needs of VIA projects. These needs include the acquisition of global and regional climate model outputs and observations, data processing to produce climate scenarios based on known methodologies or novel approaches, and transferring the information to end users. The modus operandi for scenario build-ing goes as follows: 1) Based on the project’s topic, designate a Scenario staffer that will support the VIA project. 2) Meet with users to understand what the project is about, the objectives, the time horizon of interest, the kind of climate information needed, and what resources are available to incorporate this climate information into the project. This is usually
an iterative process as new users have often unreal-istic expectations regarding the breadth of details that can be provided by climate science. Requests for detailed future land wind patterns, fog conditions, or hail events cannot be met accurately with the current generation of models. A substantial part of our work involves discussions with users to identify a middle ground between information needs and climate science capabilities. 3) Based on the project’s needs and resources, provide general climate expertise or custom climate scenarios using methods of varying complexity tailored to each problem. The size of the ensemble, whether simulations are regional or global, the downscaling method, the type of statistical analy-sis, and the observations against which simulations are compared are all parameters that vary according to projects. 4) Support users in incorporating these scenarios into their own research or analysis, taking care to properly account for leading sources of uncer-tainty. Uncertainty analyses are embedded in every project and monopolize a substantial fraction of the collective brainpower. They systematically include intermodel comparisons, and when required, assess-ments of natural variability, allowing users to evaluate consensus and significance of projected changes. 5) Report on the work done and the methods used for internal peer review.
The scenario group was initially composed of a geographer and a mathematician but grew to include scientists with backgrounds in atmospheric sciences, hydrology, physics, biology, and geomatics. Each VIA project is coordinated and supervised by a VIA professional and supported by the Scenario special-ist whose training and interests best matches the project requirements. Regular meetings, cafeteria discussions, and impromptu chats in corridors take care of information flowing freely across VIA, Scenario, and Simulation groups.
Fig. 1. Ouranos organization chart
2 Industrial members may sponsor specific projects targeting their needs besides their annual contribution to the base funding of the consortium.
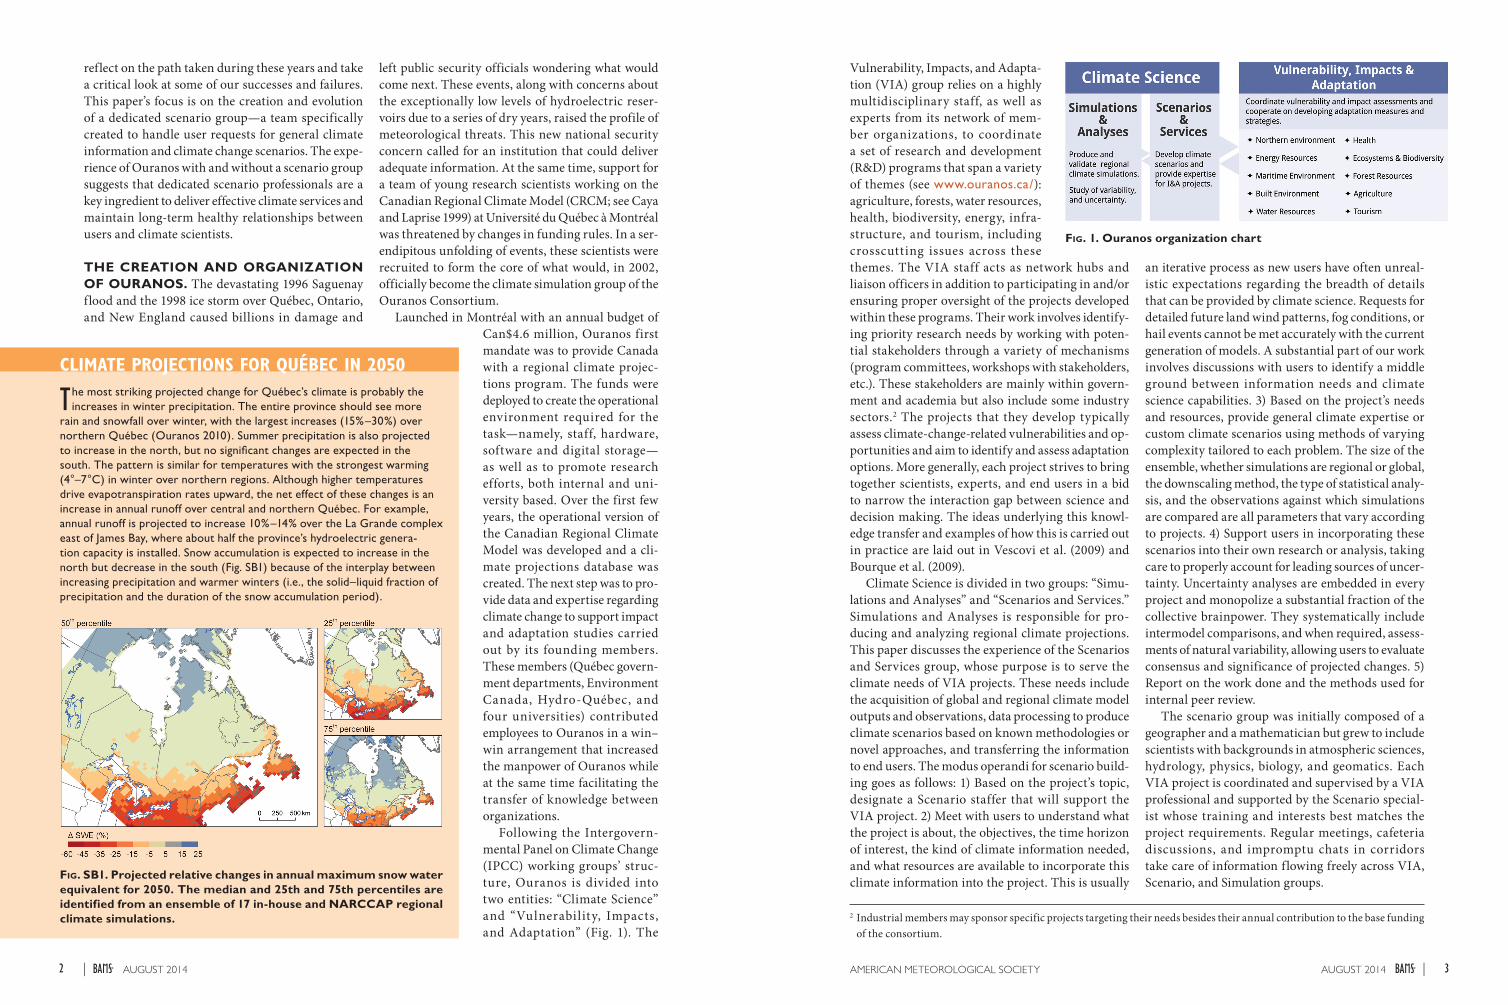
The most striking projected change for Québec’s climate is probably the increases in winter precipitation. The entire province should see more
rain and snowfall over winter, with the largest increases (15%–30%) over northern Québec (Ouranos 2010). Summer precipitation is also projected to increase in the north, but no significant changes are expected in the south. The pattern is similar for temperatures with the strongest warming (4°–7°C) in winter over northern regions. Although higher temperatures drive evapotranspiration rates upward, the net effect of these changes is an increase in annual runoff over central and northern Québec. For example, annual runoff is projected to increase 10%–14% over the La Grande complex east of James Bay, where about half the province’s hydroelectric genera-tion capacity is installed. Snow accumulation is expected to increase in the north but decrease in the south (Fig. SB1) because of the interplay between increasing precipitation and warmer winters (i.e., the solid–liquid fraction of precipitation and the duration of the snow accumulation period).
CLIMATE PROJECTIONS FOR QUÉBEC IN 2050
Fig. SB1. Projected relative changes in annual maximum snow water equivalent for 2050. The median and 25th and 75th percentiles are identified from an ensemble of 17 in-house and NARCCAP regional climate simulations.
3AUGUST 2014AMERICAN METEOROLOGICAL SOCIETY |2 AUGUST 2014|
CLIMATE SCENARIOS FOR VIA PROJECTS. The 2001 IPCC report includes a chapter on “climate scenario development” (Mearns et al. 2001), in which a climate scenario is defined as a “plausible represen-tation of future climate that has been constructed for explicit use in investigating the potential impacts of anthropogenic climate change.” The IPCC chapter discusses the most common questions that arise when constructing climate scenarios to investigate climate change impacts and has been the starting point for our work at Ouranos.
The first climate scenario produced by Ouranos dates back to 2004 in response to a request from Hydro-Québec concerning the electricity demand for residential heating and cooling (see sidebar on “Climate projections for electric demand”). Looking back, the methodology seems rather naive—for example, assuming that the climate had been station-ary until 2000 and relying on a small ensemble of simulations from only one global climate model. The
study was updated in 2007 with new Coupled Model Intercomparison Project III (CMIP3) simulations and considerably more experience in the development of climatic scenarios.
The year 2006 saw a f lurry of demands for scenarios on a variety of subjects: heat waves, pollens, drought, and forest fires, as well as energy efficiency norms. Before 2007, studies used from three to seven global climate models (GCMs) from CMIP2. The selection of models was initially based on objective criteria outlined by Parry (2002), as well as requirements for spatial resolutions better than 4° and multilevel land surface schemes. Some of these criteria were eventually relaxed to include more models, ref lecting an evolution of our grasp of model uncertainty. We now tend to drive impact models by as many climate models as possible to provide a more robust multimodel mean (Gleckler et al. 2008) and ensemble spread, the latter being an evaluation of model uncertainty. Almost all studies
from 2006 and 2007 used the delta3 method to drive impact models.
The first end-user scenarios based on regional simulations from the CRCM appeared in 2006 (Plummer et al. 2006), mixed with scenarios from established GCMs. One year earlier, CRCM had switched from version 3 to version 4, replacing the old bucket-type land surface scheme with the more real-istic Canadian Land Surface Scheme (Verseghy 2012). This evolution considerably improved evaporation and precipitation fields and increased our confidence in CRCM outputs.
Evolution of methodologies. The year 2007 saw the first applications of the CMIP3 generation of models. With considerably more sophisticated models and a larger ensemble to choose from, the level of confidence in climatic projections was raised, although broad conclusions did not change significantly. At the same time, simulations from the CRCM started to become a standard component of climate scenarios. Typically, a few simulations from the CRCM would accompany an ensemble of GCM simulations, providing some insights on the advantages (e.g., higher spatial detail, more realistic precipitation) and disadvantages of regional ensembles (e.g., additional sources of uncertainty, numerically more inten-sive, smaller subset of driving CGMs4). With more simulations in our archives with each passing year and collaborations with other regional modeling centers, some projects were able to rely entirely on regional simulation ensembles. Larger ensembles allowed analysis of the sensitivity of results to model choice over selected domains such as North America. This would have been impossible to achieve without collaborations such as the North American Regional Climate Change Assessment Program (NARCCAP; see Mearns et al. 2012)—a coordinated modeling effort pooling simulations from six regional modeling centers to assess uncertainty in regional projections and support impact studies.
However, because of their smaller size and diversity, the range of responses from regional model ensembles still remains smaller than full CMIP GCM ensembles, implying a tradeoff between the increased spatial resolution and the range of climate futures explored. Also, better resolution is not a guarantee of
added value, as the finescale variability of the climate change signal is often small compared to its large scale component, already captured by GCMs (di Luca et al. 2013). Moreover, regional models react to their GCM pilot in nonintuitive ways, further complicat-ing the interpretation of results (Mearns et al. 2012). Another tradeoff was the fact that Ouranos decided early on to focus its efforts to the greenhouse gas (GHG) scenario A2 in order to keep the number of simulations in check. Because the sensitivity of cli-mate change to GHG scenarios is small before 2050, the time horizon that interests most of our users, this choice was justified. For the second half of the twenty-first century, using only the A2 scenario results in an underestimation of uncertainty (Hawkins and Sutton 2009).
Selecting an ensemble of simulations. The availability of CMIP3 and in-house CRCM runs meant that more simulations were accessible, but raised a number of questions and discussions regarding the choice of models and the contribution of natural climate variability to uncertainty (Mote et al. 2011). Another key issue was that the number of simulations that we wished to include in the construction of scenarios became, in fact, limited by user’s capabilities. Not all users are able or interested in running experiments with hundreds of simulations. With finite resources, users need to strike a balance between the time devoted to climate impacts versus other factors likely to influence adaptation choices. For example, popu-lation growth and fluctuations in commodity prices may have larger impacts and introduce considerably more uncertainty in forecasts than climate change.
A common approach to reduce the number of model simulations is the selection of scenarios at the low and high end of expected changes to key climatic variables. Such a strategy is appropriate for sensitivity experiments, where we are interested in knowing the range of conditions likely to be encountered. This approach however dismisses information about the likelihood of those scenarios—that is, what the major-ity of models project for the future. An approach we are now using regularly is the selection of simulations by cluster analysis (N. Casajus et al. 2012, unpub-lished manuscript). The idea is to first define a list of climatic indices relevant to the problem at hand. For
CLIMATE PROJECTIONS FOR ELECTRIC DEMAND
Hydro-Québec counts 4 million residential customers, 76% of whom heat their homes using electricity as the main
source of energy (Publications Éconergie 2007). Winter temperatures along the St. Lawrence River valley average around –10°C and peak demand occurs in January when temperatures can plummet to –30°C, posing a considerable challenge because 95% of the electricity is generated by hydraulic turbines fed by dams largely filled during spring melt. In other words, demand occurs before water becomes available; electricity provision thus requires large reservoirs and tight water management.
Hydro-Québec’s forecast system for electricity demand initially relied on climate normals computed over the previous 30 years. However, this method did not take account of the warming climate and resulted in overesti-mation of winter demand and excess storage in upstream reservoirs. The inclusion of a warming trend in decision making could allow for better load forecasts, more efficient water resource management, and greater potential to take advantage of export markets.
In 2004, the utility tasked Ouranos to provide an estimate of monthly decadal temperature trends using the latest infor-mation from climate models. Using Hadley Centre Coupled Model, version 3 (HadCM3) simulations, we estimated a trend of +0.5°C decade–1 for January—a figure Hydro-Québec used to modify its operational rules. Such a change to the utility’s procedures required the approval of the Régie de l’Énergie—an institution regulating the electricity market. The position of Ouranos as an independent nonprofit organization with strong academic credentials considerably strengthened Hydro-Québec’s request to update its forecasting rules.
Hydro-Québec asked Ouranos back in 2007 to update the warming scenarios being used to foresee the electricity
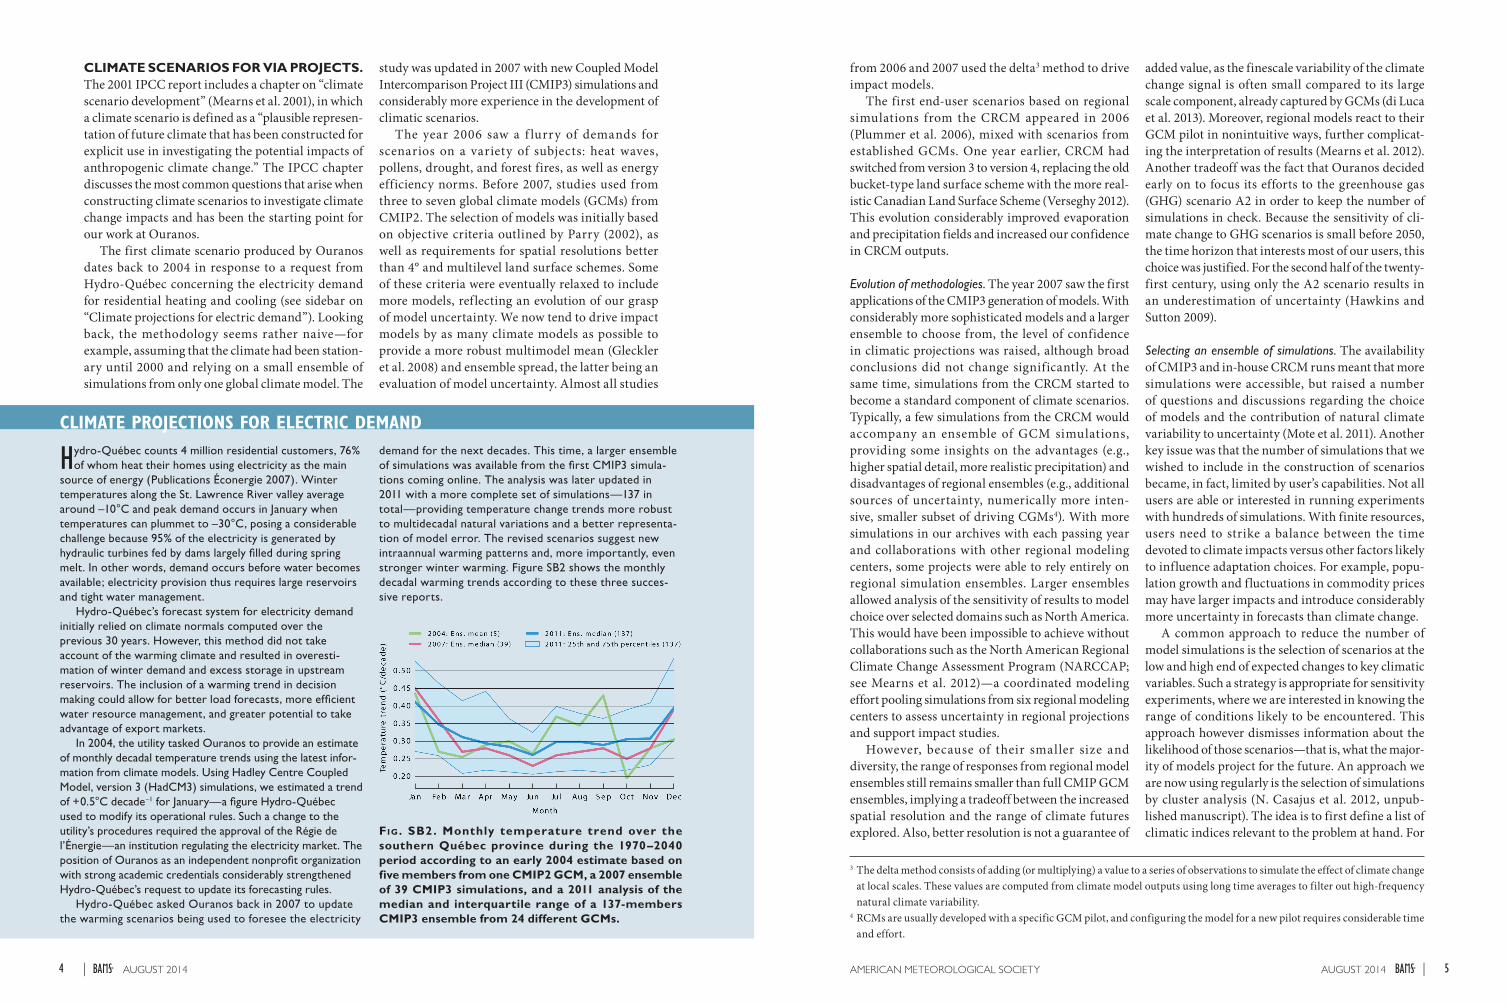
demand for the next decades. This time, a larger ensemble of simulations was available from the first CMIP3 simula-tions coming online. The analysis was later updated in 2011 with a more complete set of simulations—137 in total—providing temperature change trends more robust to multidecadal natural variations and a better representa-tion of model error. The revised scenarios suggest new intraannual warming patterns and, more importantly, even stronger winter warming. Figure SB2 shows the monthly decadal warming trends according to these three succes-sive reports.
3 The delta method consists of adding (or multiplying) a value to a series of observations to simulate the effect of climate change at local scales. These values are computed from climate model outputs using long time averages to filter out high-frequency natural climate variability.
4 RCMs are usually developed with a specific GCM pilot, and configuring the model for a new pilot requires considerable time and effort.
Fig. SB2. Monthly temperature trend over the southern Québec province during the 1970–2040 period according to an early 2004 estimate based on five members from one CMIP2 GCM, a 2007 ensemble of 39 CMIP3 simulations, and a 2011 analysis of the median and interquartile range of a 137-members CMIP3 ensemble from 24 different GCMs.
5AUGUST 2014AMERICAN METEOROLOGICAL SOCIETY |4 AUGUST 2014|
CHANGING CLIMATIC NICHES
As climatic conditions change, tree, plant, and animal species either adapt, migrate, or go extinct. The most
common response to both past and current warming is to migrate either toward the poles or to higher and colder elevations (Berteaux et al. 2010). For individual species, biologists often define climatic niches—areas where the climatological conditions will allow a species to persist. Inevitably, the mapping of these niches and the actual species distribution is not perfect, and results can be limited by the fact that they are correlative models that assume a state of quasi equilibrium between species presence and current climate and ignore important processes such as dispersal and competition (Berteaux et al. 2010). Despite these limita-tions, niche model projections (such as those shown in Fig. SB3) have been employed to provide useful information on the magnitude of potential future species shifts (Thuiller et al. 2011; Lawler et al. 2009; Parker-Allie et al. 2009).
Ouranos participated in a project led by scientists at the Université du Québec à Rimouski (UQÀR), McGill University, Université de Montréal, and in partnership with different minis-tries and conservation authorities to estimate the future climatic niches of about 1,000 species of trees, plants, amphibians, reptiles, birds, and mammals (see http://cc-bio.uqar.ca). The climatic niche model was driven using a set of cli-mate model scenarios to assess the effect of modeling uncertainty on the species distribution. In a fine example of successful collaboration between disciplines, project biolo-gists provided expertise on cluster analysis—a method biologists use to group species with similar characteristics. This method was applied to climate scenarios to cluster those that share similar
climate change patterns and reduce the number of simula-tions to run through the climatic niche model, solving an important bottleneck.
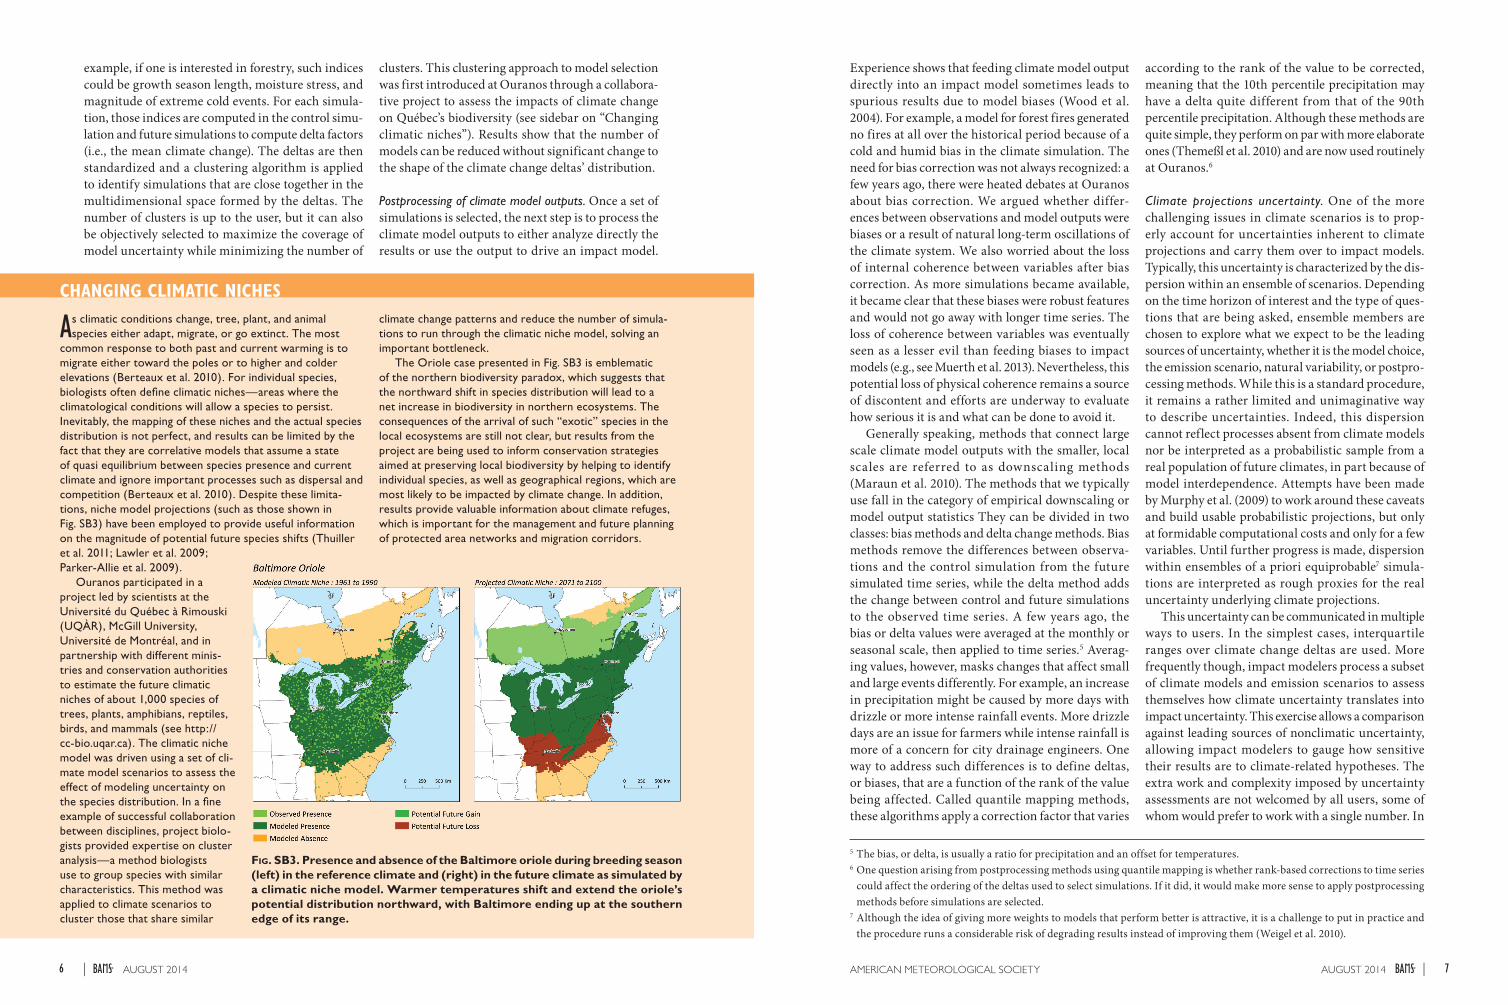
The Oriole case presented in Fig. SB3 is emblematic of the northern biodiversity paradox, which suggests that the northward shift in species distribution will lead to a net increase in biodiversity in northern ecosystems. The consequences of the arrival of such “exotic” species in the local ecosystems are still not clear, but results from the project are being used to inform conservation strategies aimed at preserving local biodiversity by helping to identify individual species, as well as geographical regions, which are most likely to be impacted by climate change. In addition, results provide valuable information about climate refuges, which is important for the management and future planning of protected area networks and migration corridors.
example, if one is interested in forestry, such indices could be growth season length, moisture stress, and magnitude of extreme cold events. For each simula-tion, those indices are computed in the control simu-lation and future simulations to compute delta factors (i.e., the mean climate change). The deltas are then standardized and a clustering algorithm is applied to identify simulations that are close together in the multidimensional space formed by the deltas. The number of clusters is up to the user, but it can also be objectively selected to maximize the coverage of model uncertainty while minimizing the number of
clusters. This clustering approach to model selection was first introduced at Ouranos through a collabora-tive project to assess the impacts of climate change on Québec’s biodiversity (see sidebar on “Changing climatic niches”). Results show that the number of models can be reduced without significant change to the shape of the climate change deltas’ distribution.
Postprocessing of climate model outputs. Once a set of simulations is selected, the next step is to process the climate model outputs to either analyze directly the results or use the output to drive an impact model.
Experience shows that feeding climate model output directly into an impact model sometimes leads to spurious results due to model biases (Wood et al. 2004). For example, a model for forest fires generated no fires at all over the historical period because of a cold and humid bias in the climate simulation. The need for bias correction was not always recognized: a few years ago, there were heated debates at Ouranos about bias correction. We argued whether differ-ences between observations and model outputs were biases or a result of natural long-term oscillations of the climate system. We also worried about the loss of internal coherence between variables after bias correction. As more simulations became available, it became clear that these biases were robust features and would not go away with longer time series. The loss of coherence between variables was eventually seen as a lesser evil than feeding biases to impact models (e.g., see Muerth et al. 2013). Nevertheless, this potential loss of physical coherence remains a source of discontent and efforts are underway to evaluate how serious it is and what can be done to avoid it.
Generally speaking, methods that connect large scale climate model outputs with the smaller, local scales are referred to as downscaling methods (Maraun et al. 2010). The methods that we typically use fall in the category of empirical downscaling or model output statistics They can be divided in two classes: bias methods and delta change methods. Bias methods remove the differences between observa-tions and the control simulation from the future simulated time series, while the delta method adds the change between control and future simulations to the observed time series. A few years ago, the bias or delta values were averaged at the monthly or seasonal scale, then applied to time series.5 Averag-ing values, however, masks changes that affect small and large events differently. For example, an increase in precipitation might be caused by more days with drizzle or more intense rainfall events. More drizzle days are an issue for farmers while intense rainfall is more of a concern for city drainage engineers. One way to address such differences is to define deltas, or biases, that are a function of the rank of the value being affected. Called quantile mapping methods, these algorithms apply a correction factor that varies
according to the rank of the value to be corrected, meaning that the 10th percentile precipitation may have a delta quite different from that of the 90th percentile precipitation. Although these methods are quite simple, they perform on par with more elaborate ones (Themeßl et al. 2010) and are now used routinely at Ouranos.6
Climate projections uncertainty. One of the more challenging issues in climate scenarios is to prop-erly account for uncertainties inherent to climate projections and carry them over to impact models. Typically, this uncertainty is characterized by the dis-persion within an ensemble of scenarios. Depending on the time horizon of interest and the type of ques-tions that are being asked, ensemble members are chosen to explore what we expect to be the leading sources of uncertainty, whether it is the model choice, the emission scenario, natural variability, or postpro-cessing methods. While this is a standard procedure, it remains a rather limited and unimaginative way to describe uncertainties. Indeed, this dispersion cannot reflect processes absent from climate models nor be interpreted as a probabilistic sample from a real population of future climates, in part because of model interdependence. Attempts have been made by Murphy et al. (2009) to work around these caveats and build usable probabilistic projections, but only at formidable computational costs and only for a few variables. Until further progress is made, dispersion within ensembles of a priori equiprobable7 simula-tions are interpreted as rough proxies for the real uncertainty underlying climate projections.
This uncertainty can be communicated in multiple ways to users. In the simplest cases, interquartile ranges over climate change deltas are used. More frequently though, impact modelers process a subset of climate models and emission scenarios to assess themselves how climate uncertainty translates into impact uncertainty. This exercise allows a comparison against leading sources of nonclimatic uncertainty, allowing impact modelers to gauge how sensitive their results are to climate-related hypotheses. The extra work and complexity imposed by uncertainty assessments are not welcomed by all users, some of whom would prefer to work with a single number. In
5 The bias, or delta, is usually a ratio for precipitation and an offset for temperatures.6 One question arising from postprocessing methods using quantile mapping is whether rank-based corrections to time series
could affect the ordering of the deltas used to select simulations. If it did, it would make more sense to apply postprocessing methods before simulations are selected.
7 Although the idea of giving more weights to models that perform better is attractive, it is a challenge to put in practice and the procedure runs a considerable risk of degrading results instead of improving them (Weigel et al. 2010).
Fig. SB3. Presence and absence of the Baltimore oriole during breeding season (left) in the reference climate and (right) in the future climate as simulated by a climatic niche model. Warmer temperatures shift and extend the oriole’s potential distribution northward, with Baltimore ending up at the southern edge of its range.
7AUGUST 2014AMERICAN METEOROLOGICAL SOCIETY |6 AUGUST 2014|

those cases, we take the time to explain where this uncertainty stems from: gaps in our understanding and capability to model processes, but also unpredict-able human choices and the irreducible chaotic nature of the climate system. As words go, “irreducible” is pretty effective in saying “better get used to it.”
A side issue in this quest to capture model-ing uncertainty is to ensure continuity between each generation of models. For example, CMIP5 simulations have replaced the Special Report on Emissions Scenarios (SRES) (A1B, A2, and B1) users are now familiar with by radiative concentration pathways (RCPs). Since no direct correspondence exists between SRES scenarios and RCPs, CMIP3 and CMIP5 ensembles cannot be mixed without answering compatibility questions first. Users will also inquire whether there are significant advantages to upgrade to the newer suite of simulations; that is, have projections significantly changed? Work by Markovic et al. (2013) indicates that users that have invested heavily in CMIP3 scenarios may not find the slight improvements from CMIP5 worth the transition efforts.
Although model selection, postprocessing methods, and uncertainty assessments are central to the construction of climate scenarios, the 2007 IPCC Fourth Assessment Report was modest on technical details related to that subject. Special reports have been published since then addressing some of these subjects (Knutti et al. 2010), but they do not provide the profile or breadth of an IPCC chapter. There is a real need to strengthen the science of scenario construction, scenario interpretation, and, more generally, help climate service organizations learn from each other.
USER INTERACTION AND ACCOUNT-ABILITY. According to Cash and Clark (2001), three qualities are key to the effectiveness of scientific assessments: salience, the perceived relevance of the information to stakeholders; credibility, the perceived authoritativeness or believability of its technical dimensions; and legitimacy, the perceived fairness of the assessment process. These components are not independent and sometimes reinforce or compete with each other. Nevertheless, all three are essential to the translation of climate information into real-world action (Meinke et al. 2006). Our experience shows that close and sustained user interaction is crucial to achieve not only salience, but also credibility and legitimacy.
Scientific assessments are credible when they are understandable, and climate science proves to be
challenging in this regard since it is far from intuitive. Indeed, many scientists work with models where the input data largely determine the model outcome. In climate models, imposed changes in GHG forcing are small compared to diurnal and annual solar radiation variations and do not directly influence individual weather events. The occurrence of a single cold or warm year, a hurricane, or a drought follows from the dynamics of the climate system and cannot be predicted far in the future. On the other hand, given changes in GHG concentrations, climate models have some skill predicting bulk properties of the system, such as 30-yr temperature trends or changes in average precipitation over large areas. This com-bination of predictability at multidecadal time scales and stochasticity at annual time scales seems to be a typical cause of confusion. Without sustained user interaction, such misinterpretations may undermine the credibility of climate information.
A tool that we use to improve transparency and legitimacy was inspired by Kloprogge et al. (2007). It consists of a document, handed out to users at the end of each project that synthesizes the methodological choices that are made in the course of scenario con-struction, such as number of simulations, number of GHG scenarios, and spatial resolution. These figures are placed within a range of possible values so users unfamiliar with climate science can get a feeling of where their scenarios stand in the grand scheme of things. For example, if the scenario includes five regional simulations with three different models, then the document lets users know that such an ensemble would be considered small compared to typical GCM ensembles but medium compared to typical regional climate model (RCM) ensembles. This comparison thus conveys the idea that, by using a regional ensemble, the user has sacrificed model uncertainty coverage for increased spatial resolution. By outlining these tradeoffs in a formal document given to end users, we hope to reduce the risks of misunderstandings and dispel unrealistic expectations.
With increasing experience, resources, and fund-ing at our disposal, the number of projects served by the Scenario group has grown steadily, from 2 in 2004 to 20 in 2011. Table 1 gives a sense of the wide variety of disciplines involved in some of these projects, along with the methods used and the main deliverables. Projects are mostly geared for planning or research purposes, but some of them have already reached day-to-day operational status. The projects have also tended to become more complex over time in response to increasing knowledge of users, an
Table 1. Nonexhaustive list of projects for which Ouranos provided climate scenarios. The usage made of the climatic information provided includes: operational (O), planning (P), and research (R). The climate scenario users are shown at the far right [public agency (A), university (U), government (G), and parapublic (P)]. The numbers in the GCM and RCM columns refer to the total number of global and regional simulations considered in each project; end products may include the full ensemble, a selected subset, or ensemble statistics.
Usage Year Topic Product GCM RCM Horizon Users
En
erg
y
O 2004 Prevision of energy demand Monthly temperature trend 6 — 2001–40 P
O 2007 Prevision of energy demand (v.2) Monthly temperature trend 39 — 1971–2040 P
R 2004 Streamflow projection—Pilot study Daily time series 16 — 2050 P
R 2007 Streamflow projection—Uncertainty Daily time series 36 — 2050 P
P, O 2011 Dam infrastructure Climatological runoff 81 — 2050 P
Wat
er
R 2005 River sedimentation dynamics Daily time series 6 — 2050 U
R 2007 Aquifer recharge Daily time series — 1 2050 U
R 2010 Probable maximum flood Simulated extreme runoff — 4 2020, 2050 P, G, U
R, P 2010 Dam management Daily time series — 12 2050 A
P 2011 Water conservation policies Spatial analog maps — 9 2050 U
Hea
lth
R 2006 Ragweed pollen Deltas 10 — 2020, 2050, 2080 U
P 2006 Heat waves Statistical downscaling 2 — 2020, 2050, 2080 A
R 2008 Urban heat islands Deltas 9 2 2050 U
Bu
ilt
envi
ron
men
t O 2006 Stormwater management Precipitation extremes — 1 2050 U
P 2008 Vulnerability of cities water intakes Simulated runoff 23 — 1900–2100 U
R 2008 Infrastructure vulnerability Deltas on custom indicators — 2 2020, 2050, 2080 P
P 2010 Municipalities adaptation guide Climatic portrait 130 17 1970–2085 P
Cro
ps
P 2009 Outlook for the apple industry Temperature extremes and variability
— 5 2050 G
P 2011 Phytosanitary risks Spatial analog maps — 9 2050 G
O 2011 Agroclimatic atlas Maps of deltas 19 10 2050 P
Fo
rest
ry
R 2006 Forest fires Canadian Drought Code 10 — 2050 U
R 2009 Maple syrup production Syrup yield projections 77 — 2050, 2090 G
R 2010 Soil conditions Surface scheme model output 80 2 2050, 2080 G
Bio
div
ersi
ty R 2009 Species migration Climatic normals 70 — 2050, 2080 U
R 2010 Protected areas Climatic portrait 71 — 2050, 2090 G, U
R 2011 Salmonids riverine thermal refuges Daily streamflow 3 2 2050 UN
ort
h
R, P 2008 Permafrost stability in Saluit Time series 100 — 2020, 2050, 2080 U
P 2010 Airport permafrost Climatic portrait — 6 1961–2070 U
P 2013 Coastal risks Storm tracks 4 4 2050 G
9AUGUST 2014AMERICAN METEOROLOGICAL SOCIETY |8 AUGUST 2014|
increase in the number of model simulations, and more refined analysis and scenario construction methods. That being said, the methods used to create scenarios still remain relatively simple, with most scenarios relying on simple delta factors or quantile-corrected time series. More elaborate approaches are developed as needed to handle nonstandard scenarios such as precipitation or temperature extremes, whose skewed distributions are badly handled by correction factors (Casati et al. 2013).
For nontechnical users, spatial analogs have been found to be an effective tool to communicate climate change impacts. Spatial analogs are nearby regions or cities where the current climate is similar to the future climate of the region of interest (Grenier et al. 2013). Studying how these neighboring regions handle climate issues is a shortcut to identify adaptation solutions, as well as an effective communication tool. It is important to keep in mind that the uncertainty introduced by different approaches to create scenarios remains small compared with other sources of uncer-tainty such as the choice of climate model—a strong incentive to keep our analytical methods simple and straightforward, and avoid methodological excesses.
One limitation of CMIP-based scenarios is that they do not feature dramatic events such as the sudden release of methane from permafrost or a shut-down of the thermohaline circulation. While these events certainly capture the imagination, their likeli-hood appears too low at the moment to justify their inclusion in VIA studies (Lenton et al. 2008). On the other hand, many decision makers are understand-ably curious or concerned about these low-probability high-impact events or geoengineering initiatives and we are considering how to position these extraordi-nary scenarios within the CMIP model ensemble.
LESSONS LEARNED. At the beginning of Ouranos, there was no Scenario group—modelers in the Simulation group would run the regional model, then scientists in an Analysis group would postpro-cess simulations to produce custom scenarios for VIA projects. The Analysis group was initially created from participating academics interested in statistical analysis of occurrences and recurrences of weather events. Their work was supposed to bridge the gap between climate modelers and VIA specialists, but this initial setup turned out to be unsatisfactory for a number of reasons.
While the collaboration between VIA and Climate Science might have looked good on paper, teams ended up working in parallel with few fruitful interactions. Differences in language and scientific backgrounds
between the climate modelers, academics, and VIA professionals limited exchanges and communications. VIA specialists were left to themselves to try to put in practice climate simulations that modelers thought too immature to be used in real-life applications. These VIA studies were carried out nonetheless and then criticized by the modelers—a recurrent pattern that widened the gap between the two groups. Bound by the requirements of academic careers, members of the Analysis group concentrated more on methodologi-cal improvements than direct end-user support—a pattern described by Averyt (2010). The situation changed with the creation of a Scenario group dedi-cated to serve VIA projects. Acting as an intermedi-ary between modelers and users, the Scenario staff focused on meeting climate information demands stemming from VIA projects.
The initially small scenario group grew to become a pivotal component of Ouranos. It has widened the user base by creating products adapted to individual needs and constraints and thus closer to decision-making requirements. The proximity to users also has the advantage of helping us identify the needs for cli-mate information and anticipate requests; but this is something that we only realized after a few missteps.
Indeed, one mistake made early on was not prop-erly guiding users to clearly identify their climate information needs. For example, in a joint project with civil engineers, we provided a set of climate change deltas for an extensive set of climatic variables. Because these variables were previously identified by the engineers working on the project, we assumed they would know how to incorporate the results in their decision-making framework. This assumption turned out to be f lawed and the climate scenarios were barely considered. Our mistake was to miss the fact that most engineers rarely compute the climate variables that they use in their day-to-day work from raw climate values, but rather rely on official values produced in specific formats by governmental organizations. For climatic scenarios to be incorpo-rated in practice, they must be ready to use, precisely tailored to be drop-in replacements for the usual data entering the decision-making process. This additional level of user customization is now a central pillar of the development of climate scenarios at Ouranos.
Another early oversight was to fail to anticipate user requests. Some users needed climate products that required methodologies we had no prior experience with. The “learn as we go” approach might be appropriate for academic work but is riskier in projects supporting decision making. While after-the-fact checking confirmed our methodological
choices, these experiences stress the importance of giving staff time to experiment with new methods to widen the experience pool and to test the robust-ness of the prospective methodologies. To this end, Ouranos employees may spend up to 20% of their time on research and exploration of new ideas. In practice, Ouranos being a service-oriented organization, end-user requests and projects must take precedence over exploration. Still, some of these projects evolve into scientific publications to which Ouranos employees are encouraged to contribute. A balance between exploration and services is also maintained by hiring personnel with diverse interests and training.
Finally, a challenge that still confronts us is to avoid passing on to users our methodological burden. Scenario construction requires a number of hypoth-eses, and the impact of each one of these hypotheses could in principle be evaluated to understand its impact on the final results. In other words, we can provide users different scenarios using different methods and let them check whether or not it makes a difference to their analysis. However, this approach imposes additional and unexpected work to end users, who are often unable to assess the possible benefits. The challenge is to understand well enough the end-user problem to transfer only the methodological choices that have the potential to significantly impact results. Doing so requires a multidisciplinary team with enough experience in a wide range of disciplines to accurately gauge the relevance of each one of those methodological choices.
CONCLUSIONS. In 2001, the IPCC chapter on scenario development could be found in the first working group report The Physical Science Basis. In 2007, this topic was addressed in Working Group II “Impacts, Adaptation and Vulnerability,” with more emphasis on stakeholder interactions and less on how scenarios are actually generated (Carter et al. 2007). Of course, scenario construction belongs neither to one or the other, but to both subjects—the essential gateway from climate science to VIA. Getting this step right is critical to ensure that climate information is tailored to user needs and that it is used adequately and constructively.
After 10 years working at bringing climate science to end users, we now sense that climate scenarios and climate services are reaching a new level of maturity. Countries and nongovernmental organizations are now institutionalizing climate services (WMO 2009), intent on reaping the benefits of climate-smart development. Our experience suggests that offering climate services is not as simple as putting climate
scientists and impact modelers in the same building. Scenario specialists play a key role in bridging disciplines and accurately translating up-to-date scientific information into custom climate products. At Ouranos, we feel privileged to be in such a strategic position at such an interesting time.
ACKNOWLEDGMENTS. The material and ideas presented in this paper represent the product of work of numerous past and present members of the Ouranos staff. The authors would like to recognize Georges-Étienne Desrochers and Line Bourdages for their contribution to the Scenario group. Special thanks also go to René Roy, Alain Bourque, Ramón de Elía, Anne Frigon, Caroline Larrivée, and Daniel Caya, as well as all other interviewees for their insights and contribution to this paper.
This work was supported by the Ouranos’ Fonds de Recherche en Sciences du Climat d’Ouranos (FRSCO) program.
REFERENCESAveryt, K., 2010: Are we successfully adapting science
to climate change? Bull. Amer. Meteor. Soc., 91, 723–726, doi:10.1175/2010BAMS2906.1.
Berteaux, D., and Coauthors, 2010: The CC-Bio Project: Studying the effects of climate change on Quebec biodiversity. Diversity, 2, 1181–1204, doi:10.3390 /d2111181.
Bourque, A., A. Musy, and C. Larrivée, 2009: Ouranos: Un modèle original pour le développement de con-naissances menant à l’adaptation aux changements climatiques. Liaison Énerg. Francophonie, 85, 61–66.
Carter, T. R., and Coauthors, 2007: New assessment methods and the characterisation of future condi-tions. Climate Change 2007: Impacts, Adaptation and Vulnerability, M. L. Parry et al., Eds., Cambridge University Press, 133–171.
Casati, B., A. Yagouti, and D. Chaumont, 2013: Re-gional climate projections of extreme heat events in nine pilot Canadian communities for public health planning. J. Appl. Meteor. Climatol., 52, 2669–2698, doi:10.1175/JAMC-D-12-0341.1.
Cash, D., and W. Clark, 2001: From science to policy: Assessing the assessment process. John F. Kennedy School of Government Faculty Research Working Papers Series RWP01-045, 21 pp.
Caya, D., and R. Laprise, 1999: A semi-implicit semi-Lagrangian regional climate model: The Canadian RCM. Mon. Wea. Rev., 127, 341–362, doi:10.1175/1520-0493(1999)1272.0.CO;2.
DeGaetano, A. T., T. J. Brown, S. D. Hilberg, K. Redmond, K. Robbins, P. Robinson, M. Shulski,
11AUGUST 2014AMERICAN METEOROLOGICAL SOCIETY |10 AUGUST 2014|
and M. McGuirk, 2010: Toward regional climate services: The role of NOAA’s Regional Climate Centers. Bull. Amer. Meteor. Soc., 91, 1633–1644, doi:10.1175/2010BAMS2936.1.
di Luca, A., R. de Elia, and R. Laprise, 2013: Potential for small scale added value of RCM’s downscaled climate change signal. Climate Dyn., 40, 601–618, doi:10.1007/s00382-012-1415-z.
Gleckler, P. J., K. E. Taylor, and C. Doutriaux, 2008: Performance metrics for climate models. J. Geophys. Res., 113, D06104, doi:10.1029/2007JD008972.
Grenier, P., A.-C. Parent, D. Huard, F. Anctil, and D. Chaumont, 2013: Assessment of six dissimilarity met-rics for climate analogues. J. Appl. Meteor. Climatol., 52, 733–752, doi:10.1175/JAMC-D-12-0170.1.
Hawkins, E., and R. Sutton, 2009: The potential to narrow uncertainty in regional climate predic-tions. Bull. Amer. Meteor. Soc., 90, 1095–1107, doi:10.1175/2009BAMS2607.1.
Kerr, R. A., 2011: Time to adapt to a warming world, but where’s the science? Science, 334, 1052–1053, doi:10.1126/science.334.6059.1052.
Kloprogge, P., J. V. D. Sluijs, and A. Wardeckker, 2007: Uncertainty communication issues and good prac-tice. Copernicus Institute for Sustainable Develop-ment and Innovation Rep. NWS-E-2007-199, 60 pp. [Available online at www.nusap.net/downloads /reports/uncertainty_communication.pdf.]
Knutti, R., G. Abramowitz, M. Collins, V. Eyring, P. J. Gleckler, B. Hewitson, and L. Mearns, 2010: Good practice guidance paper on assessing and combin-ing multi model climate projections. IPCC expert meeting on assessing and combining multi model cli-mate projections, IPCC Working Group I Technical Support Unit Meeting Rep., 1–13.
Lawler, J. J., S. L. Shafer, D. White, P. Kareiva, E. P. Maurer, A. R. Blaustein, and P. J. Bartlein, 2009: Projected climate-induced faunal change in the Western Hemi-sphere. Ecology, 90, 588–597, doi:10.1890/08-0823.1.
Lenton, T. M., H. Held, E. Kriegler, J. W. Hall, W. Lucht, S. Rahmstorf, and H. J. Schellnhuber, 2008: Tipping elements in the Earth’s climate system. Proc. Natl. Acad. Sci. USA, 105, 1786–1793, doi:10.1073 /pnas.0705414105.
Maraun, D., and Coauthors, 2010: Precipitation downscaling under climate change: Recent de-velopments to bridge the gap between dynamical models and the end user. Rev. Geophys., 48, RG3003, doi:10.1029/2009RG000314.
Markovic, M., R. de Elía, A. Frigon, and H. D. Matthews, 2013: A transition from CMIP3 to CMIP5 for cli-mate information providers: The case of surface temperature over eastern North America. Climatic
Change, 120 (1–2), 197–210, doi:10.1007/s10584-013 -0782-8.
Mearns, L. O., M. Hulme, T. R. Carter, R. Leemans, M. Lal, and P. Whetton, 2001: Climate scenario devel-opment. Climate Change 2001: The Scientific Basis, J. T. Houghton et al., Eds., Cambridge University Press, 739–768.
—, and Coauthors, 2012: The North American Regional Climate Change Assessment Program: Overview of phase I results. Bull. Amer. Meteor. Soc., 93, 1337–1362, doi:10.1175/BAMS-D-11-00223.1.
Meinke, H., R. Nelson, P. Kokic, and R. Stone, 2006: Actionable climate knowledge: From analysis to synthesis. Climate Res., 33, 101–110, doi:10.3354 /cr033101.
Mote, P., L. Brekke, P. Duffy, and E. Maurer, 2011: Guidelines for constructing climate scenarios. Eos, Trans. Amer. Geophys. Union, 92, 257–264, doi:10.1029/2011EO310001.
Muerth, M. J., and Coauthors, 2013: On the need for bias correction in regional climate scenarios to assess cli-mate change impacts on river runoff. Hydrol. Earth Syst. Sci., 17, 1189–1204.
Murphy, J. M., and Coauthors, 2009: Climate change projections. UK Climate Projections Science Rep., Met Office Hadley Centre, 192 pp.
Ouranos, 2010: Learning to adapt to climate change. Doc. from Ouranos, 550 Sherbrooke West, West Tower, 19th f loor, Montreal, Quebec, H3A 1B9, Canada, 128 pp.
Parker-Allie, F., C. F. Musil, and W. Thuiller, 2009: Effects of climate warming on the distributions of invasive Eurasian annual grasses: A South African perspective. Climatic Change, 94, 87–103, doi:10.1007/s10584-009-9549-7.
Parry, M., 2002: Scenarios for climate impact and ad-aptation assessment. Global Environ. Change, 12, 149–153, doi:10.1016/S0959-3780(02)00038-9.
Plummer, D. A., and Coauthors, 2006: Climate and climate change over North America as simulated by the Canadian RCM. J. Climate, 19, 3112–3132, doi:10.1175/JCLI3769.1.
Publications Éconergie, 2007: Enquête sur l’utilisation de l’énergie par les ménages. Ressources Naturelles Canada, 243 pp. [Available online at http://oee .nrcan.gc.ca/publications/statistiques/euem07/pdf /euem07.pdf.]
Pulwarty, R. S., C. Simpson and C.R. Nierenberg, 2009: The Regional Integrated Sciences and Assessments (RISA) Program: Crafting effective assessments for the long haul. Integrated Regional Assessment: Challenges and Case Studies, C. G. Knight and J. Jäger, Eds., Cambridge University Press, 367–393.
Themeßl, M. J., A. Gobiet, and A. Leuprecht, 2010: Em-pirical-statistical downscaling and error correction of daily precipitation from regional climate models. Int. J. Climatol., 31, 1530–1544, doi:10.1002/joc.2168.
Thuiller, W., S. Lavergne, C. Roquet, I. Boulangeat, B. Lafourcade, and M. B. Araújo, 2011: Consequences of climate change on the tree of life in Europe. Nature, 470, 531–534, doi:10.1038/nature09705.
Vaughan, C., 2011: International Conference on Climate Services: Conference report. IRI Tech. Rep. 11-05, 72 pp. [Available online at http://iccs.iri.columbia.edu /reports/ICCS-Conference-Report.pdf.]
Verseghy, D., 2012: CLASS—The Canadian Land Surface Scheme (version 3.6). Environment Canada Science and Technology Branch Tech. Rep., 176 pp.
Vescovi, L., A. Bourque, G. Simonet, and A. Musy, 2009: Transfer of climate knowledge via a regional
climate-change management body to support vulner-ability, impact assessments and adaptation measures. Climate Res., 40, 163–173, doi:10.3354/cr00787.
Weigel, A. P., R. Knutti, M. A. Liniger, and C. Appenzeller, 2010: Risks of model weighting in multimodel climate projections. J. Climate, 23, 4175–4191, doi:10.1175/2010JCLI3594.1.
WMO, 2009: Climate Sense. Tudor Rose, 288 pp.—, 2011: Climate knowledge for action: A global
framework of climate services—Empowering the most vulnerable. World Meteorological Organization Tech. Rep. WMO/TD-1065, 248 pp.
Wood, A. W., L. R. Leung, V. Sridhar, and D. P. Lettenmaier, 2004: Hydrologic implications of dy-namical and statistical approaches to downscaling climate model outputs. Climatic Change, 62, 189–216, doi:10.1023/B:CLIM.0000013685.99609.9e.
13AUGUST 2014AMERICAN METEOROLOGICAL SOCIETY |12 AUGUST 2014|
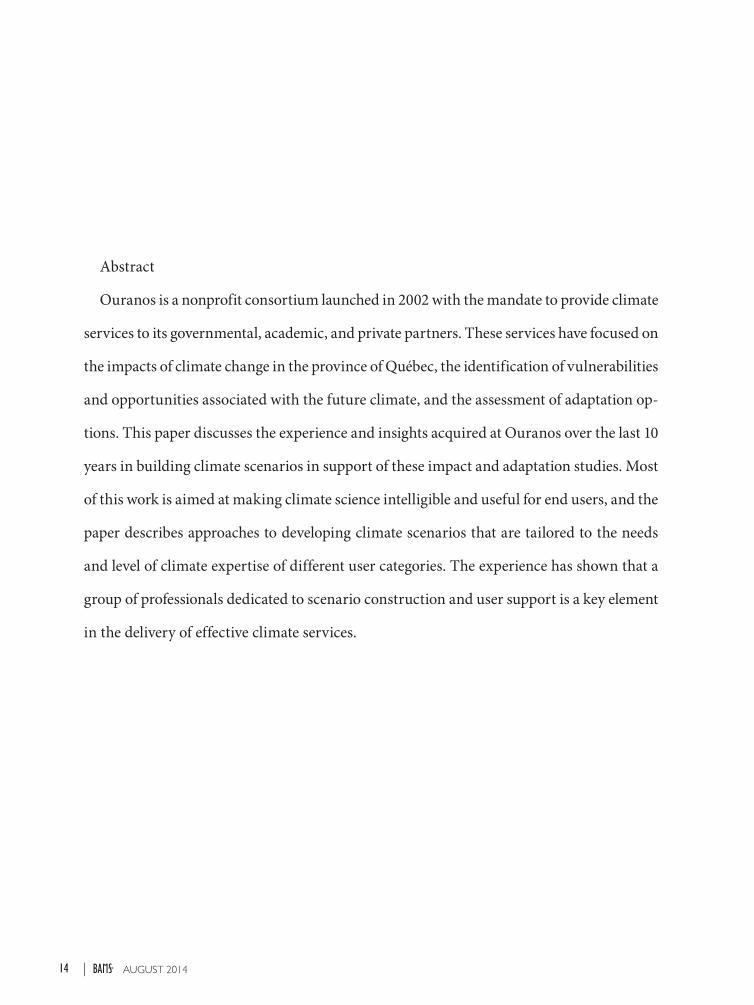
Abstract
Ouranos is a nonprofit consortium launched in 2002 with the mandate to provide climate
services to its governmental, academic, and private partners. These services have focused on
the impacts of climate change in the province of Québec, the identification of vulnerabilities
and opportunities associated with the future climate, and the assessment of adaptation op-
tions. This paper discusses the experience and insights acquired at Ouranos over the last 10
years in building climate scenarios in support of these impact and adaptation studies. Most
of this work is aimed at making climate science intelligible and useful for end users, and the
paper describes approaches to developing climate scenarios that are tailored to the needs
and level of climate expertise of different user categories. The experience has shown that a
group of professionals dedicated to scenario construction and user support is a key element
in the delivery of effective climate services.
14 AUGUST 2014|