A Conceptual DFT Approach Towards Developing New QSTR Models
29
1 A Conceptual DFT Approach Towards Developing New QSTR Models † P. K. Chattaraj a,* , D. R. Roy a , S. Giri a , S. Mukherjee a , V. Subramanian b,* , P. Bultinck c,* and S. Van Damme c a Department of Chemistry, Indian Institute of Technology, Kharagpur 721 302, India b Chemical Laboratory, Central Leather Research Institute, Adyar, Chennai 600 020, India c Department of Inorganic and Physical Chemistry, Ghent University, Krijgslaan 281, B- 9000 Gent, Belgium Abstract Quantitative-structure-toxicity-relationship (QSTR) models are developed for predicting the toxicity (pIGC 50 ) of 252 aliphatic compounds on Tetrahymena pyriformis. The single parameter models with a simple molecular descriptor, the number of atoms in the molecule, provide unbelievable results. Better QSTR models with two parameters result when global electrophilicity is used as the second descriptor. In order to tackle both charge- and frontier-controlled reactions the importance of the local electro (nucleo) philicities and atomic charges is also analyzed. Best possible three parameter QSTR models are prescribed. Keywords Atom Counting, QSTR, Electrophilicity, Conceptual DFT, Tetrahymena pyriformis † This paper is dedicated to Professor Robert G. Parr, the father of the conceptual DFT, on the occasion of his eighty-fifth birthday. *Author for correspondence: [email protected]
-
Upload
independent -
Category
Documents
-
view
0 -
download
0
Transcript of A Conceptual DFT Approach Towards Developing New QSTR Models
1
A Conceptual DFT Approach Towards Developing New
QSTR Models†
P. K. Chattaraja,*, D. R. Roya, S. Giria, S. Mukherjeea, V. Subramanianb,*, P. Bultinckc,* and S. Van Dammec
aDepartment of Chemistry, Indian Institute of Technology, Kharagpur 721 302, India bChemical Laboratory, Central Leather Research Institute, Adyar, Chennai 600 020,
India cDepartment of Inorganic and Physical Chemistry, Ghent University, Krijgslaan 281, B-
9000 Gent, Belgium
Abstract
Quantitative-structure-toxicity-relationship (QSTR) models are developed for
predicting the toxicity (pIGC50) of 252 aliphatic compounds on Tetrahymena pyriformis.
The single parameter models with a simple molecular descriptor, the number of atoms in
the molecule, provide unbelievable results. Better QSTR models with two parameters
result when global electrophilicity is used as the second descriptor. In order to tackle both
charge- and frontier-controlled reactions the importance of the local electro (nucleo)
philicities and atomic charges is also analyzed. Best possible three parameter QSTR
models are prescribed.
Keywords
Atom Counting, QSTR, Electrophilicity, Conceptual DFT, Tetrahymena
pyriformis
†This paper is dedicated to Professor Robert G. Parr, the father of the conceptual DFT, on the occasion of his eighty-fifth birthday.
*Author for correspondence: [email protected]
2
1. Introduction
Ever since the power of Quantitative- structure- activity- relationship (QSAR)
based techniques has been highlighted, several descriptors have been proposed from time
to time in developing QSAR models1-8 for understanding various aspects of
pharmacological sciences including drug design and the possible ecotoxicological
characteristics of the drug molecules. Specific quantitative structure toxicity relationship
(QSTR) models have also been developed. In these studies the toxicity of various
chemicals have been understood via corresponding molecular structures. An extensive
research has been carried out9-16 in understanding the toxicological effects of several
aliphatic compounds on ciliated protozoa called Tetrahymena pyriformis. Both European
Union and U.S. Environmental Protection Agency require reliable toxicity data set for
various classes of living systems like primary producers, invertebrates and vertebrates.
This information is used for QSAR/QSTR as well as regulatory purposes. The ciliated
protozoa, Tetrahymena pyriformis has been considered to be ideal for the associated
laboratory research. In this ciliate species, diverse endpoints can be used to originate the
cytotoxic effects and xenobiotics. Experimental determination of toxicological and
biochemical endpoints is a difficult task. Hence, QSAR/QSTR modeling of the toxicity of
aliphatic compounds on the T. pyriformis is of vital importance in investigation of its
toxicity in terms of its inhibitory growth concentration (IGC). A multitude of QSTR
models exist which analyze the associated toxicity behavior. Quantum chemical
descriptors17-20 have also been used for this purpose and they have been proved to be
versatile and reliable.

3
Toxicity analyses of a diverse class of systems have been carried out using
conceptual density functional theory (DFT) based reactivity/selectivity descriptors.
Possibility of electron transfer between a toxic molecule and a biosystem has been
considered to be one of the major reasons of toxic behavior of these molecules.
Accordingly the related descriptors like electron affinity, ionization potential, planarity,
electrophilicity etc. have been turned out to be useful QSTR descriptors. Experimental
toxicity values of a wide variety of polyaromatic hydrocarbons like polychlorinated
dibenzofurans (PCDFs), polychlorinated biphenyls (PCBs), polychlorinated dibenzo-p-
dioxins (PCDDs) and chlorophenols (CP), several aliphatic and aromatic toxic molecules
have been shown to correlate very well20-30 with the corresponding toxicity values
estimated using various conceptual DFT descriptors especially global and local
electrophilicities.31-33
Several researchers9-16 have studied the toxicological behavior of various
compounds on Tetrahymena pyriformis. They have highlighted the importance of the
studies as well as the possibility of constructing a large number of QSTR models with a
varied range of success and the difficulty in computation. A state-of-the art QSTR model
has been developed by Schultz et al.13 Toxicity of a large number of aliphatic compounds
on Tetrahymena pyriformis has been studied13 through QSTR models developed13 in
terms of logP and the lowest unoccupied molecular orbital energy (ELUMO) whereas the
effect of several aromatic compounds on the same system has been analyzed14 in terms of
log P, ELUMO and maximum acceptor superdelocalizability (Amax). In both cases the
models are found to be robust. We have shown20,25 that global and local electrophilicities
are useful descriptors of toxicity prediction. In the present work we propose to develop
4
QSTR models for toxicity of several aliphatic compounds on Tetrahymena pyriformis,
using a simple descriptor, viz. the number of atoms present in the molecule, which can be
obtained without even touching a computer. Section 2 provides the theoretical
background whereas the computational details are provided in section 3. Results and
discussion are provided in section 4 and finally, section 5 contains some concluding
remarks.
2. Theoretical Background
We consider the number of atoms in a molecule to be a valid descriptor of its
toxic nature. For a given group of molecules the number of electrons (N) is expected to
scale as the number of atoms present (Na). Molecules with larger Na values are supposed
to have larger molecular weights implying larger log P values. That in turn will provide
larger toxicity values. For simplicity we consider the number of carbon atoms (NC) as the
variable and for the set of molecules with a constant NC we may choose the number of
non-hydrogenic atoms (NNH) as the descriptor. Related descriptors have been used in the
past.34
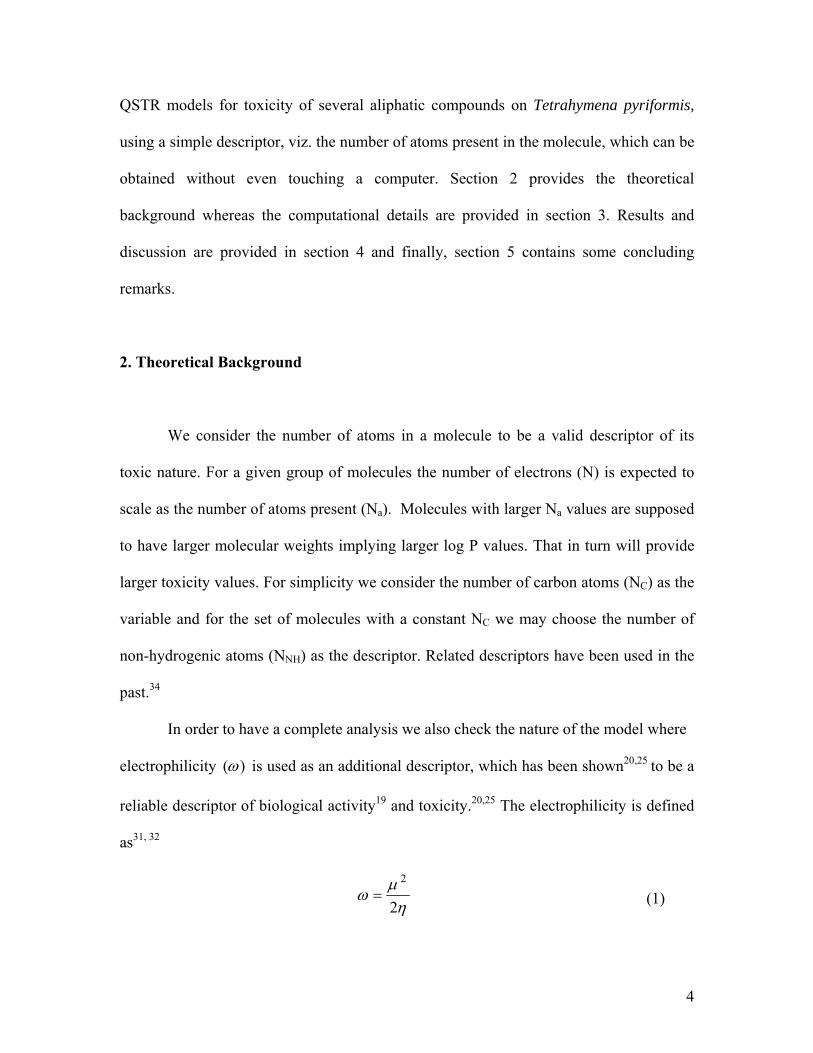
In order to have a complete analysis we also check the nature of the model where
electrophilicity )(ω is used as an additional descriptor, which has been shown20,25 to be a
reliable descriptor of biological activity19 and toxicity.20,25 The electrophilicity is defined
as31, 32
ημ
ω2
2= (1)
5
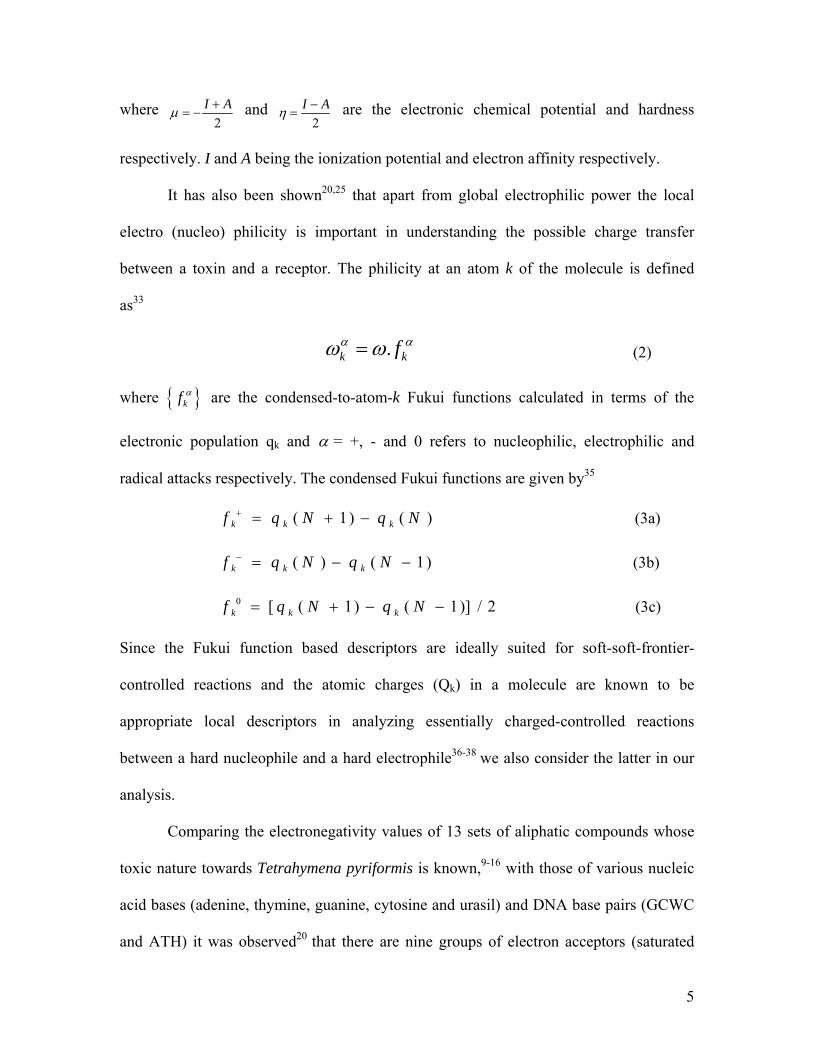
where 2+
= −I Aμ and
2−
=I Aη are the electronic chemical potential and hardness
respectively. I and A being the ionization potential and electron affinity respectively.
It has also been shown20,25 that apart from global electrophilic power the local
electro (nucleo) philicity is important in understanding the possible charge transfer
between a toxin and a receptor. The philicity at an atom k of the molecule is defined
as33
.k kfα αω ω= (2)
where { }kfα are the condensed-to-atom-k Fukui functions calculated in terms of the
electronic population qk and α = +, - and 0 refers to nucleophilic, electrophilic and
radical attacks respectively. The condensed Fukui functions are given by35
)()1( NqNqf kkk −+=+ (3a)
)1()( −−=− NqNqf kkk (3b)
2/)]1()1([0 −−+= NqNqf kkk (3c)
Since the Fukui function based descriptors are ideally suited for soft-soft-frontier-
controlled reactions and the atomic charges (Qk) in a molecule are known to be
appropriate local descriptors in analyzing essentially charged-controlled reactions
between a hard nucleophile and a hard electrophile36-38 we also consider the latter in our
analysis.
Comparing the electronegativity values of 13 sets of aliphatic compounds whose
toxic nature towards Tetrahymena pyriformis is known,9-16 with those of various nucleic
acid bases (adenine, thymine, guanine, cytosine and urasil) and DNA base pairs (GCWC
and ATH) it was observed20 that there are nine groups of electron acceptors (saturated

6
alcohols, diols, halogenated alcohols, mono- and di- esters, carboxylic and halogenated
acids, aldehydes and ketones) and four groups of electron donors (unsaturated alcohols,
α -acetylinic alcohols, amino alcohols and amines). For the former group +maxω and for
the latter group −maxω are considered to be20 appropriate descriptors where αωmax refers to
the αω k value at the site where it is maximum. For the hard interactions, maxkQ is
considered to be the proper descriptor where k is the site with the maximum value of the
magnitude of the charge (positive for the acceptors and negative for the donors).
3. Computational Details
Geometries of all the 252 aliphatic molecules (acceptors-171, donors-81)
corresponding to the 13 groups are optimized at the Hatree-Fock level with 6-311G*
basis set using the Gaussian 0339 program. These molecules were tested before20, 25 for
correlating their experimental log(IGC50-1) values10 against Tetrahymena pyriformis with
the corresponding values calculated in terms of global and local electrophilicities.
Equations (1)-(3) are used to calculate the global and local electrophilicities.
Necessary population and charges are calculated using the natural population analysis
(NPA) scheme. Single point calculations are done for the (N±1) - electron systems with
the N-electron molecule geometry.
In the statistical analysis, the systematic search is performed to determine
statistically significant relationships between the toxicity and a selection of one, two or
three descriptors out of the six available descriptors (NC, NNH, ω , +maxω , −
maxω and maxkQ ).
The analysis is performed using in-house software. In order to minimize the effect of

7
multicollinearity and to avoid redundancy, the descriptor set is first pre-evaluated with
unsupervised forward selection. This selection is a variable elimination technique where
variables are physically removed from the data set. Variables are eliminated for two
reasons. First, they are eliminated if they have a small variance, below some threshold
value. The second reason for variable removal is the existence of redundancy (exact
linear dependencies between subsets of the variables) and multicollinearity (high multiple
correlations between subsets of the variables) in QSAR data sets. Multicollinearity and
redundancy may result in highly unstable estimates for regression coefficients, because
their values may change enormously when variables are added or deleted to the
regression. Both these features are assessed by inspecting the multiple correlations within
the relevant subsets of descriptors. For a detailed overview of the UFS algorithm we refer
to references 40 and 41. As regression technique the multiple linear regression is
preferred over principal component regression or partial least squares regression, because
of the ease of interpretation of the outcome. The output provided in the paper gives the
most promising 3-parameter model for each dataset. The following statistical criteria of
the models are noted: R, R-square, adjusted R-square and the standard error of the
estimate are measures to confirm a good fit of the data to the regression line. Internal
validation is conducted with leave-one-out cross-validation and is given by Q². The
significance of this value is estimated by Y-randomisation.
A mechanistic interpretation can be deduced from the output, by using the
coefficients (b). These are descriptors calculated from scaled data values. This gives the
opportunity to evaluate the descriptors in relation to each other. Outliers are detected
graphically in the regression diagnostic plot.

8
Each statistical analysis is preceded by an analysis of the dataset. A graphical
analysis of the residuals (residual plot, normal probability plot and regression plot)
permits the user to confirm if the dataset is suitable for a multiple linear regression.
4. Results and Discussion
Experimental and calculated pIGC50 values along with various descriptors are
presented in Tables 1 and 2 for the electron acceptor and electron donor molecules
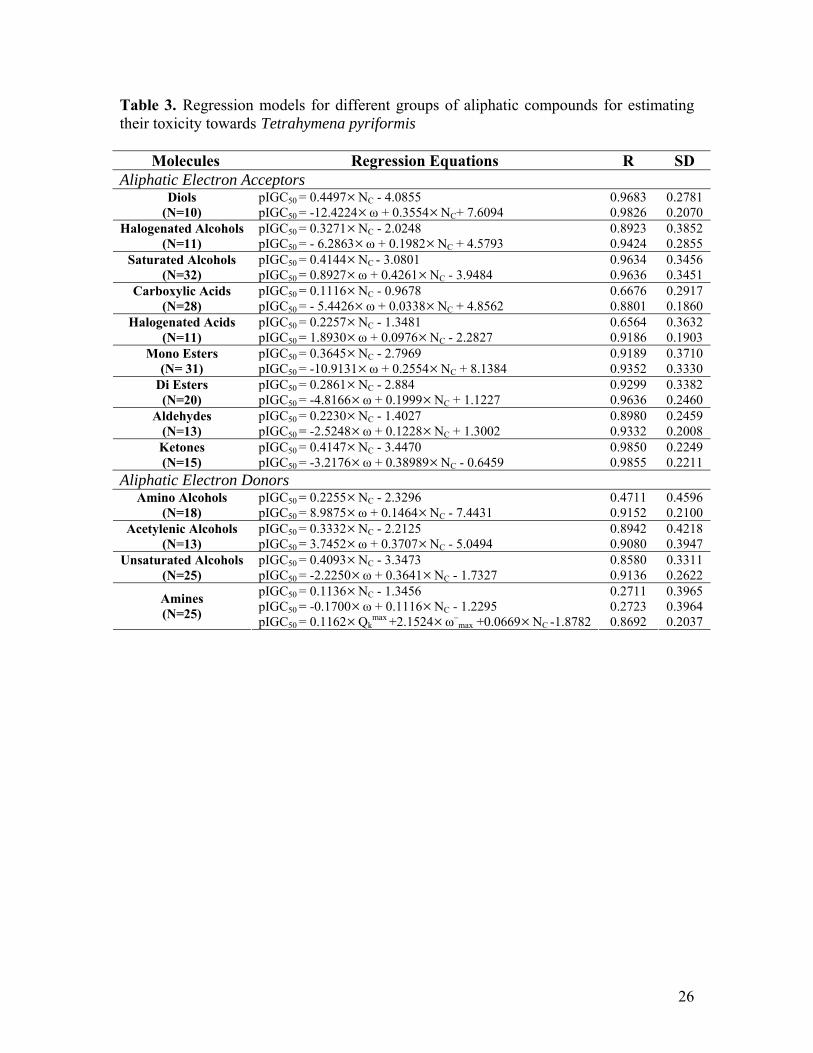
respectively. Table 3 presents the corresponding regression equations associated with one
(NC)- and two (NC,ω )- parameter models. The single parameter model with a simple
descriptor like the number of carbon atoms provides good estimates of toxicity in most
cases. The exceptions are carboxylic acids, halogenated acids, amino alcohols and
amines. Situation improves drastically in all cases except for amines where the
information of charge is also important. The constant terms in the two-parameter models
are not always significant. Figure 1 presents the plots of experimental pIGC50 versus
calculated pIGC50 values for the a) acceptor set (R2=0.9283, R2CV=0.9279, R2
Adj=0.9265)
and b) donor set (R2=0.8284, R2CV=0.8262, R2
Adj=0.8156) which authenticates the
efficacy of these regression models for QSTR. It is also important to note that the slopes
of these plots are unity and the intercepts are very close to zero, as expected. Although
the predicted toxicity trend is satisfactory when compared with the observed one, for the
individual outlier molecules it is difficult to provide with a rationale a priori. It may be
noted that the calculated pIGC50 values plotted in Figure 1 are obtained through different
regression models for 13 different sets of molecules. In each set the molecules of similar
9
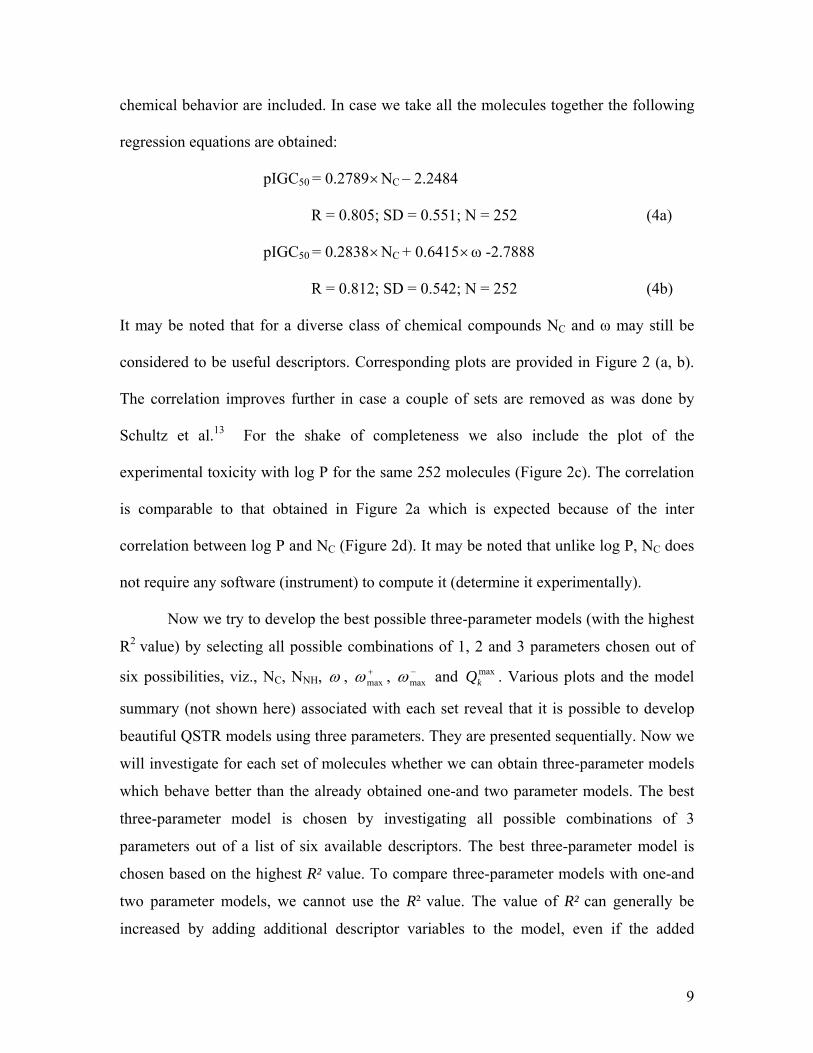
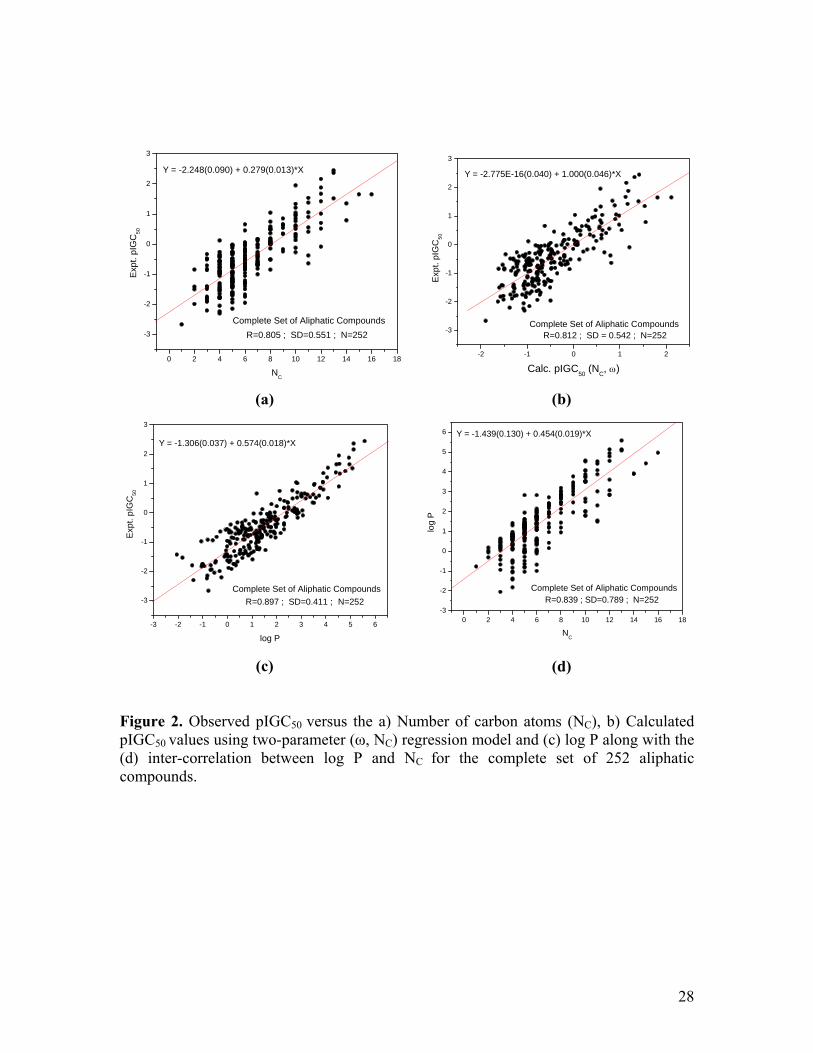
chemical behavior are included. In case we take all the molecules together the following
regression equations are obtained:
pIGC50 = 0.2789×NC – 2.2484
R = 0.805; SD = 0.551; N = 252 (4a)
pIGC50 = 0.2838×NC + 0.6415×ω -2.7888
R = 0.812; SD = 0.542; N = 252 (4b)
It may be noted that for a diverse class of chemical compounds NC and ω may still be
considered to be useful descriptors. Corresponding plots are provided in Figure 2 (a, b).
The correlation improves further in case a couple of sets are removed as was done by
Schultz et al.13 For the shake of completeness we also include the plot of the
experimental toxicity with log P for the same 252 molecules (Figure 2c). The correlation
is comparable to that obtained in Figure 2a which is expected because of the inter
correlation between log P and NC (Figure 2d). It may be noted that unlike log P, NC does
not require any software (instrument) to compute it (determine it experimentally).
Now we try to develop the best possible three-parameter models (with the highest
R2 value) by selecting all possible combinations of 1, 2 and 3 parameters chosen out of
six possibilities, viz., NC, NNH, ω , +maxω , −
maxω and maxkQ . Various plots and the model
summary (not shown here) associated with each set reveal that it is possible to develop
beautiful QSTR models using three parameters. They are presented sequentially. Now we
will investigate for each set of molecules whether we can obtain three-parameter models
which behave better than the already obtained one-and two parameter models. The best
three-parameter model is chosen by investigating all possible combinations of 3
parameters out of a list of six available descriptors. The best three-parameter model is
chosen based on the highest R² value. To compare three-parameter models with one-and
two parameter models, we cannot use the R² value. The value of R² can generally be
increased by adding additional descriptor variables to the model, even if the added
10
variable does not contribute to reduce the unexplained variance of the dependent variable.
This can be avoided by using another statistical parameter – the so-called adjusted R²
(R²adj).
Before any regression analysis can take place, we have to check the data set on a few
principal assumptions. These assumptions justify the use of linear regression models for
purposes of prediction: Independence, normality and linearity. If any of these
assumptions is violated, then the insights yielded by a regression model may be
inefficient or seriously biased or misleading. The characteristics of the data sets are
checked visually. For a detailed overview of these assumptions and their visualization,
the reader is referred to the reference 42. For the purpose of this article it is sufficient to
look at the graphics (a), (c) and (d) for each of the data sets. The graphic (a) has to be a
scattered plot of points around zero and the graphics (c) and (d) have to be a straight line
of points through the origin. As one can see, for each of the thirteen data sets, these
characteristics are fulfilled.
The performance of the multiple linear regression is summarized in a few statistical
parameters. The most important ones for this purpose are R²adj, the standard error of the
estimate, Q² and the F-ratio. Each of these terms is explained in the previous section and
their behavior can be found in statistical literature. If we encounter a model which does
not behave well for one of these parameters, the model has to be rejected. Based on these
four statistical parameters, each of the models can be accepted as statistically significant
models.
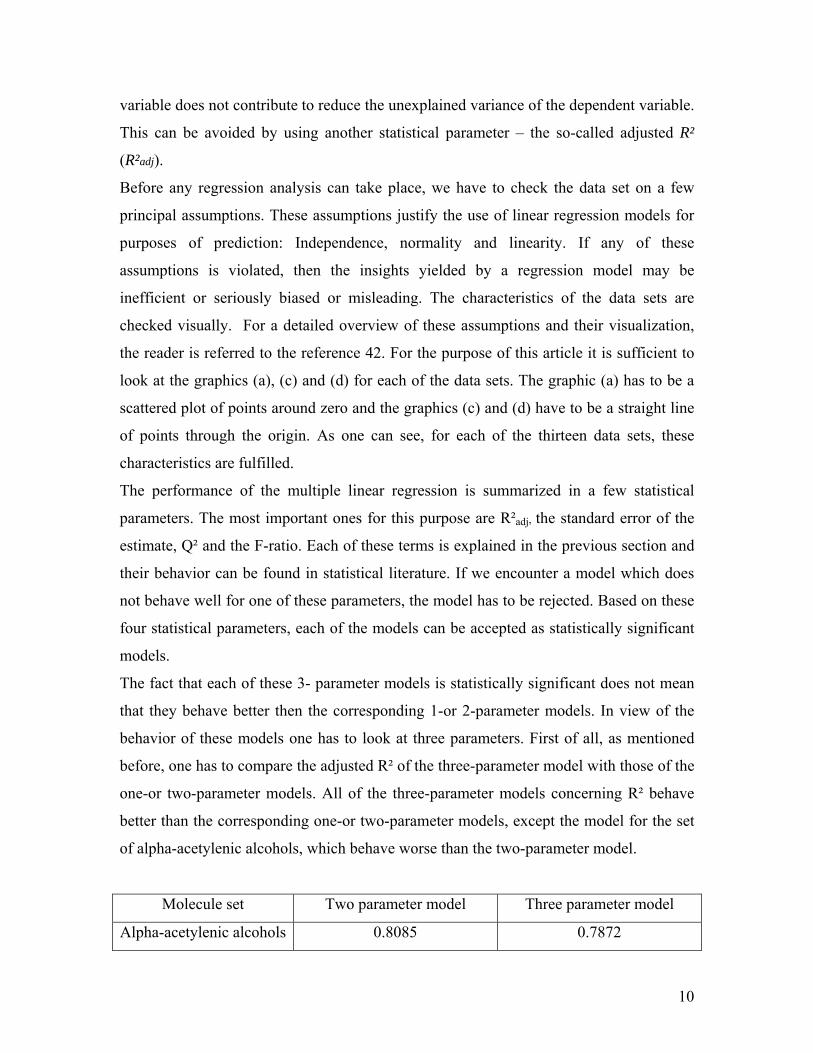
The fact that each of these 3- parameter models is statistically significant does not mean
that they behave better then the corresponding 1-or 2-parameter models. In view of the
behavior of these models one has to look at three parameters. First of all, as mentioned
before, one has to compare the adjusted R² of the three-parameter model with those of the
one-or two-parameter models. All of the three-parameter models concerning R² behave
better than the corresponding one-or two-parameter models, except the model for the set
of alpha-acetylenic alcohols, which behave worse than the two-parameter model.
Molecule set Two parameter model Three parameter model
Alpha-acetylenic alcohols 0.8085 0.7872

11
For the following three-parameter models the R² increases only slightly by adding one
descriptor.
Molecule set Two parameter model Three parameter model
Saturated Alcohols 0.9261 0.9267
Diester 0.9245 0.9272
Since it is better to have a model with as least as possible descriptors, according the
Principle of Parsimony,44 we prefer for these sets the two-parameter models.
Three parameter models are only better then the two-parameter models, if the
three parameters used are statistically significant. The in-house built statistical software
conducts this test of significance with a Students t-test. The following models are
assigned containing non-significant descriptors:
Molecule set Non significant parameters
Halogenated Acids NC
maxkQ
Aldehydes ω
Amino Alcohols NC
The remaining models can be used for predictive purposes, only if they do not fail on the
Y-randomisation test. As can be seen on the graphs (e), this concerns only the three-
parameter models of the aliphatic amines, the unsaturated alcohols, the monoesters and
the carboxylic acids. The three parameter models for these sets are
Molecule set
Carboxylic acid ω NC maxkQ
Monoester NNH ω maxω+
Unsaturated Alcohol ω maxω− NC

12
Aliphatic amines maxω− ω maxkQ
The fact that the remaining models of the halogenated alcohols, the diols and the ketones
do not provide good Y-randomisation test results might be originating from the small
number of molecules (respectively 11, 10 and 15 ) for the number of descriptors used.45
It is important to note that maxω+ and maxω− respectively appear in the electron
acceptor and donor sets, as expected. Except for the set of aliphatic amines the atom
number is a valuable descriptor. The global electrophilicity is also a reliable descriptor in
most cases.
In order to check the efficacy of the present QSTR models vis-à-vis other existing
popular models we make a comparative analysis of our work with that reported by
Schultz et al13 which may be considered to be by far the best available till date. To
compare the quality of regression we analyze our Figure 2 and Eq.(4) with their Figures 1
& 2 and Eq.(1). As opposed to the regression presented for only neutral narcotics,13 our
mixture of a wide class of compounds shows a reasonable correlation. Like our
correlations for 13 separate groups (both polar and nonpolar) as presented in Table 3,
their one parameter models for nonpolar molecules (Table 1 of Ref.13) and two
parameter models for 7 selected classes (Table 2 of Ref.13) we notice the following: a)
For one parameter models their slopes are positive and intercepts are negative for all 5
sets and are of same orders of magnitude. For one parameter models our slopes are
positive and intercepts are negative for all 13 sets and are of same orders of magnitude.
Moreover, obtaining log P is much more difficult than counting NC., b) For the two
parameter models their coefficients for log P are always positive as in our case the
coefficients for NC are also always positive. In their models the coefficients for ELUMO
and the intercept are positive in some cases and negative in other cases as is the case with
our coefficients of ω and the intercept., c) There is a good correlation43 between log P and
NC. It is expected that our works would be complimentary to their work., d) The
problems they faced in modeling carboxylic acids, amino alcohols, α-halo-activated
compounds etc. may be better tackled using these descriptors or a combination of them
(log P (NC), ELUMO, ω)., e) Importance of charge as the descriptor in modeling amines is
now understood, f) Macroscopic descriptors like log P or NC would be useful for a broad

13
spectrum of systems. However, electronic descriptors like ω would be useful when
systems with similar electronic environment are analyzed. They would be specially useful
when molecules will have nearly identical or identical log P (NC) values. For molecules
with similar electronic environment local (or group) electrophilicity would highlight the
importance of the site (group) especially for the toxic behavior.
5. Concluding Remarks
The number of atoms in a molecule can provide important insights into its
possible toxic behavior. It can be used as a molecular descriptor for predicting pIGC50
values of various aliphatic compounds against the ciliate Tetrahymena pyriformis. The
situation improves further when electrophilicity is used as an additional descriptor. Local
electro (nucleo) philicity and atomic charges are also considered to take care of local soft-
soft and hard-hard interactions, which resulted in robust three parameter QSTR models.
Acknowledgements
We thank BRNS, Mumbai for financial assistance and unknown referees for
constructive criticism. One of us (P.B.) acknowledges the Fund for Scientific Research-
Flanders (FWO-Vlaanderen) for continuous support for his group.
14
References
1. Smeyers,Y. G.; Bouniam, L.; Smeyers, N. J.; Ezzamarty, A.; Hernandez-Laguna,
A.; Sainz-Diaz, C. I. Eur J Med Chem 1998, 33, 103-112.
2. Busse, W. D.; Ganellin, C. R.; Mitscher, L. A. Eur J Med Chem 1996, 31, 747-
760.
3. Hansch, C.; Hoekman, D.; Leo, A.; Weininger, D.; Selassie, C. Chem Rev 2002,
102, 783-812.
4. Hansch, C.; Kurup, A.; Garg, R.; Gao, H. Chem Rev 2001, 101, 619-672.
5. Hansch, C.; Maloney, P. P.; Fujita, T.; Muir, R. M. Nature 1962, 194, 178-180.
6. Hansch, C.; Li, R. I.; Blaney, J. M.; Langridge, R. J. J Med Chem 1982, 25, 777-
784.
7. Leach, A. R.; Gillet, V. J. An Introduction to Chemoinformatics; Kluwer:
Dordrecht, 2003.
8. Ormerod, A.; Willett, P.; Bawden, D. Quant Struct-Act Relat 1989, 8, 115-129.
9. Akers, K. S.; Sinks, G. D.; Schultz, T. W. Environ Toxicol Pharmacol 1999, 7,
33-39.
10. Schultz, T. W. Toxicol Methods 1997, 7, 289-309. TETRATOX database
[http://www.vet.utk.edu/TETRATOX/]
11. Dimitrov, S. D.; Mekenyan, O. G.; Sinks, G. D.; Schultz, T. W. J Mol Struct
(THEOCHEM) 2003, 622, 63-70.
12. Netzeva, T. I.; Schultz, T. W.; Aptula, A. O.; Cronin, M. T. D. SAR QSAR
Environ Res 2003, 14, 265-283.
15
13. Schultz, T. W.; Cronin, M. T. D.; Netzeva, T. I.; Aptula, A. O. Chem Res Toxicol
2002, 15, 1602-1609.
14. Cronin, M. T. D.; Manga, N.; Seward, J. R.; Sinks, G. D.; Schultz, T. W. Chem
Res Toxicol 2001, 14, 1498-1505.
15. Xue, Y.; Li, H.; Ung, C. Y.; Yap, C. W.; Chen, Y. Z. Chem Res Tox 2006, 19,
1030-1039.
16. (a) Toropov, A. A.; Benfenati, E. J Mol Struct (Theochem) 2004, 679, 225-228.
(b) Castro, E. A.; Toropov, A. A.; Nesterova, A. I.; Nazarov, A. U. J Mol Struct
(Theochem) 2003, 639, 129-135.
17. (a) Parr, R. G.; Yang, W. Density Functional Theory of Atoms and Molecules;
Oxford University Press: Oxford.UK, 1989 (b) Chattaraj, P. K. Special Issue on
Chemical Reactivity, (Ed.). J Chem Sci 2005, 117.Geerlings, P.; De Proft, F.;
Langenaeker, W. Chem Rev 2003, 103, 1793-1873.
18. Chattaraj, P. K.; Nath, S.; Maiti, B. “Reactivity Descriptors” in ‘Computational
Medicinal Chemistry for Drug Discovery’, Tollenaere, J.; Bultinck, P.; Winter, H.
D.; Langenaeker, W., Eds. Marcel Dekker: New York, 2003; Chapter 11; pp 295–
322.
19. Parthasarthi, R.; Subramanian, V.; Roy, D. R.; Chattaraj, P. K. Bioorg Med Chem
2004, 12, 5533-5543.
20. Roy, D. R.; Parthasarathi, R.; Maiti, B.; Subramanian, V.; Chattaraj, P. K.
Bioorg Med Chem 2005, 13, 3405-3412.
21. Parthasarathi, R.; Elango, M.; Padmanabhan, J.; Subramanian, V.; Roy, D. R.;
Sarkar, U.; Chattaraj, P. K. Ind J Chem A 2006, 45, 111-125.

16
22. Parthasarathi, R.; Padmanabhan, J.; Subramanian, V.; Maiti, B.; Chattaraj, P. K.
Curr Sci 2004, 86, 535-542.
23. Sarkar, U.; Roy, D. R.; Chattaraj, P. K.; Parthasarathi, R.; Padmanabhan, J.;
Subramanian, V. J Chem Sci. 2005, 117, 599-612.
24. Padmanabhan, J.; Parthasarathi, R.; Subramanian, V.; Chattaraj, P. K.
Chem Res Tox 2006, 19, 356- 364.
25. Roy, D. R.; Parthasarathi, R.; Padmanabhan, J.; Sarkar, U; Subramanian, V.;
Chattaraj, P. K. J Phys Chem A 2006, 110, 1084-1093. In this paper we have
reported our earlier work (Ref. 20) which may be consulted for details.
26. Parthasarathi, R.; Padmanabhan, J.; Subramanian, V.; Maiti, B.; Chattaraj, P. K.
J Phys Chem A 2003, 107, 10346-10352.
27. Padmanabhan, J.; Parthasarathi, R.; Subramanian, V.; Chattaraj, P. K. J Phys
Chem A 2005, 109, 11043-11049.
28. Padmanabhan, J.; Parthasarathi, R.; Subramanian, V.; Chattaraj, P. K.
J Phys Chem A 2006, 110, 2739-2745.
29. Roy, D. R.; Sarkar, U.; Chattaraj, P. K.; Mitra, A.; Padmanabhan, J.;
Parthasarathi, R.; Subramanian, V.; Vandamme, S.; Bultinck, P.
Mol Div 2006, 10, 119-131.
30. Roy, D. R.; Parthasarathi, R.; Subramanian, V.; Chattaraj, P. K.
QSAR & Comb Sci 2006, 25, 114-122.
31. Parr, R. G.; Szentpaly, L. V.; Liu, S. J Am Chem Soc 1999, 121, 1922-1924.
32. Chattaraj, P. K.; Sarkar, U.; Roy, D. R. Chem Rev 2006, 106, 2065-2091.
33. Chattaraj, P. K.; Maiti, B.; Sarkar, U. J Phys Chem A 2003, 107, 4973-4975.

17
34. Szymanski, V.; Müller, W. R.; Knop, J. V.; Trinajstić, N. Int J Quantum Chem
1984, S20, 173-183.
35. Yang, W.; Mortier, W. J. J Am Chem Soc 1986, 108, 5708-5711.
36. Klopman, G. Ed. Chemical Reactivity and Reaction Paths: Wiley: New York,
1974. Klopman, G. J Am Chem Soc 1968, 90, 223-234.
37. Chattaraj, P. K. J Phys Chem A 2001, 105, 511-513.
38. Melin, J.; Aparicio, F.; Subramanian, V.; Galvan, M.; Chattaraj, P. K. J Phys
Chem A 2004, 108, 2487- 2491.
39. Gaussian 03, Revision B.03; Gaussian, Inc.: Pittsburgh, PA.
40. Livingstone, D. J.; Salt, D. W. Reviews in Computational Chemistry 2006, 21,
287-348.
41. Whitley, D.; Ford, M. G.; Livingstone, D. J. J Chem Inf Comp Sci 2004, 40,
1160-1168.
42. Van Damme, S.; Bultinck, P. J Comp Chem 2006 (in press).
43. Giri, S.; Roy, D. R.; Van Damme, S.; Bultinck, P.; Subramanian, V.; Chattaraj, P.
K., unpublished work.
44. Principle of Parsimony: All things being approximately equal, one should accept
the simplest possible model (Occam’s Razor; William of Ockham, 1285-1349,
English philosopher and logician)
45. Topliss, J. G.; Edwards, R. P. J Med Chem 1979, 22, 1238-1244.

18
Table Captions:
Table 1: Electrophilicity (ω), maximum atomic charge ( max
kQ ), number of carbon atoms (Nc), log P along with the experimental and calculated values of log (IGC50
-1) for the complete set of aliphatic acceptor compounds with Tetrahymena pyriformis. Table 2: Electrophilicity (ω), maximum atomic charge ( max
kQ ), number of carbon atoms (Nc), log P along with the experimental and calculated values of log (IGC50
-1) for the complete set of aliphatic donor compounds with Tetrahymena pyriformis. Table 3. Regression models for different groups of aliphatic compounds for estimating their toxicity towards Tetrahymena pyriformis

19
Figure Captions: Figure 1. Observed versus calculated pIGC50 values using two-parameter (ω, NC) regression models for the (a) Complete set of aliphatic electron acceptors and (b) Complete set of aliphatic electron donors. Please see the text for details. Figure 2. Observed pIGC50 versus the a) Number of carbon atoms (NC), b) Calculated pIGC50 values using two-parameter (ω, NC) regression model and (c) log P along with the (d) inter-correlation between log P and NC for the complete set of 252 aliphatic compounds.

20
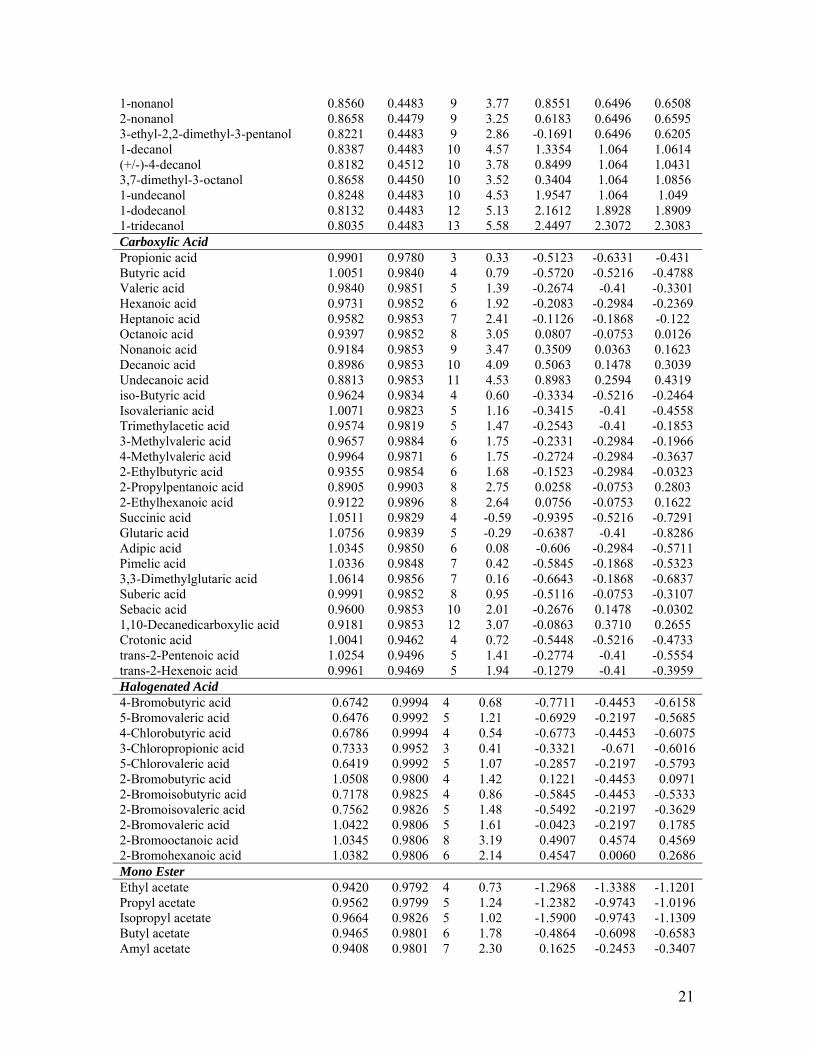
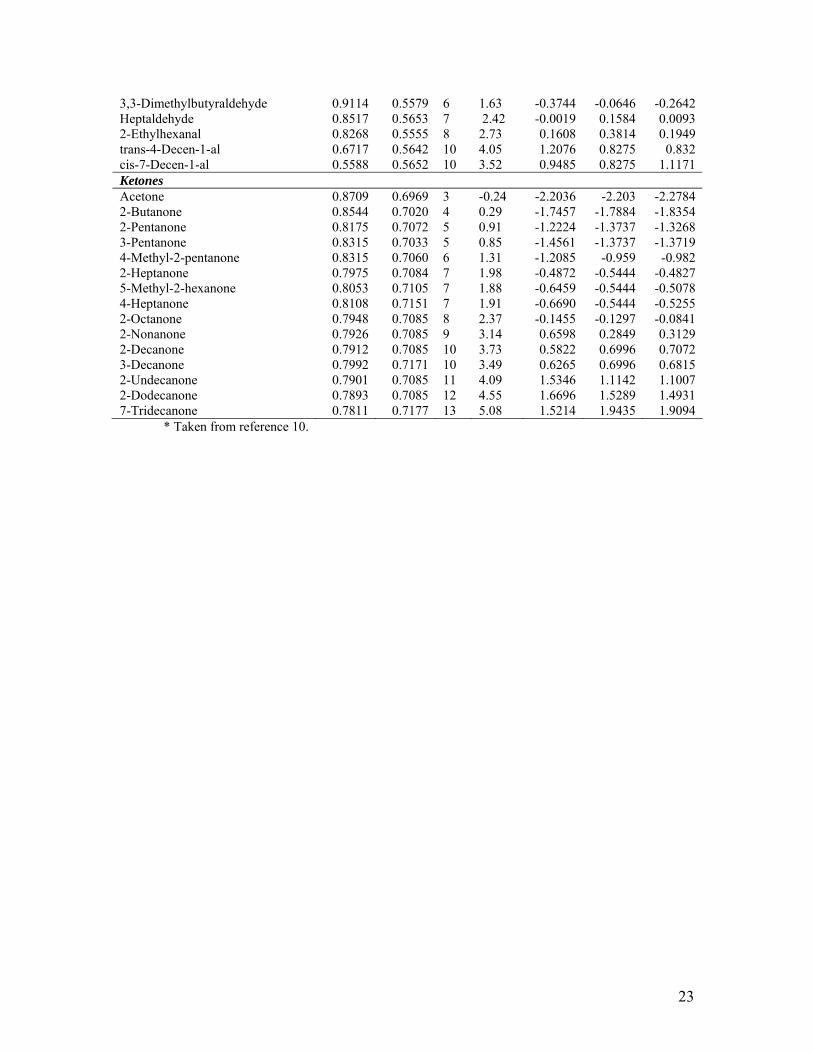
Table 1: Electrophilicity (ω), maximum atomic charge ( maxkQ ), number of carbon atoms
(Nc), log P along with the experimental and calculated values of log (IGC50-1) for the
complete set of aliphatic acceptor compounds with Tetrahymena pyriformis.
pIGC50 Molecules ω max
kQ Nc log P*
Expt.* Calc. (Nc)
Calc. (Nc, ω)
Diols (+/-)-1,2-butanediol 0.8999 0.4652 4 -0.53 -2.0482 -2.2868 -2.1479 (+/-)-1,3-butanediol 0.9286 0.4488 4 -1.38 -2.3013 -2.2868 -2.5044 1,4-butanediol 0.8915 0.4492 4 -0.83 -2.2365 -2.2868 -2.0435 1,2-pentanediol 0.8907 0.4652 5 0.00 -1.6269 -1.8371 -1.6782 1,5-pentanediol 0.9132 0.4487 5 -0.64 -1.9344 -1.8371 -1.9577 2-methyl-2,4-pentanediol 0.9200 0.4463 6 -0.68 -1.9531 -1.3874 -1.6868 (+/-)-1,2-hexanediol 0.8887 0.4652 6 0.53 -1.2669 -1.3874 -1.2979 1,6-hexanediol 0.9027 0.4487 6 -0.11 -1.4946 -1.3874 -1.4719 1,2-decanediol 0.8640 0.4651 10 2.64 0.7640 0.4113 0.4305 1,10-decanediol 0.8597 0.4484 10 2.01 0.2240 0.4113 0.4839 Halogenated Alcohol 2-Bromoethanol 0.9418 0.4575 2 0.18 -0.8457 -1.3706 -0.9446 2-Chloroethanol 1.0417 0.4578 2 -0.06 -1.4174 -1.3706 -1.5727 1-Chloro-2-propanol 1.0170 0.4549 3 0.14 -1.492 -1.0434 -1.2191 3-Chloro-1-propanol 1.0101 0.4525 3 0.50 -1.3992 -1.0434 -1.1758 4-Chloro-1-butanol 0.9570 0.4514 4 0.85 -0.7594 -0.7163 -0.6437 3-Chloro-2,2-dimethyl-1-propanol 0.9843 0.4553 5 0.81 -0.7822 -0.3892 -0.6171 6-Chloro-1-hexanol 0.9417 0.4497 6 1.59 -0.2726 -0.0621 -0.151 8-Chloro-1-octanol 0.9278 0.4490 8 2.65 0.4878 0.5921 0.3329 6-Bromo-1-hexanol 0.8636 0.4497 6 1.73 0.0074 -0.0621 0.3399 8-Bromo-1-octanol 0.8559 0.4490 8 2.79 1.0424 0.5921 0.7848 2,3-Dibromopropanol 0.9902 0.4599 3 0.63 -0.4861 -1.0434 -1.0507 Saturated Alcohol methyl alcohol 0.9485 0.4440 1 -0.77 -2.6656 -2.6657 -2.6755 ethyl alcohol 0.9186 0.4481 2 -0.31 -1.9912 -2.2513 -2.2761 1-propanol 0.8979 0.4485 3 0.25 -1.7464 -1.8369 -1.8685 2-propanol 0.9500 0.4548 3 0.05 -1.8819 -1.8369 -1.822 1-butanol 0.8960 0.4484 4 0.88 -1.4306 -1.4225 -1.4441 (+/-)-2-butanol 0.9227 0.4480 4 0.61 -1.542 -1.4225 -1.4202 2-methyl-1-propanol 0.9066 0.4501 4 0.76 -1.3724 -1.4225 -1.4346 2-pentanol 0.9045 0.4479 5 1.19 -1.1596 -1.0081 -1.0104 3-pentanol 0.8945 0.4569 5 1.21 -1.2437 -1.0081 -1.0193 3-methyl-2-butanol 0.8935 0.4482 5 1.28 -0.9959 -1.0081 -1.0202 tert-amylalcohol 0.9354 0.4459 5 0.89 -1.1729 -1.0081 -0.9828 2-methyl-1-butanol 0.9034 0.4502 5 1.22 -0.9528 -1.0081 -1.0114 3-methyl-1-butanol 0.9218 0.4481 5 1.16 -1.0359 -1.0081 -0.9949 2,2-dimethyl-1-propanol 0.9416 0.4516 4 1.31 -0.8702 -1.4225 -1.4034 2-methyl-2-propanol 0.9560 0.4446 4 0.35 -1.7911 -1.4225 -1.3905 1-hexanol 0.8955 0.4484 6 2.03 -0.3789 -0.5936 -0.5923 3,3-dimethyl-1-butanol 0.9357 0.4483 5 1.62 -0.7368 -1.0081 -0.9825 4-methyl-1-pentanol 0.9354 0.4484 6 1.75 -0.6372 -0.5936 -0.5567 1-heptanol 0.8958 0.4484 7 2.72 0.1050 -0.1792 -0.1659 2,4-dimethyl-3-pentanol 0.8519 0.4525 7 1.93 -0.7052 -0.1792 -0.2051 1-octanol 0.8769 0.4483 8 3.00 0.5827 0.2352 0.2433 2-octanol 0.8779 0.4479 8 2.90 0.0011 0.2352 0.2442 3-octanol 0.8560 0.4511 8 2.72 0.0309 0.2352 0.2247
21
1-nonanol 0.8560 0.4483 9 3.77 0.8551 0.6496 0.6508 2-nonanol 0.8658 0.4479 9 3.25 0.6183 0.6496 0.6595 3-ethyl-2,2-dimethyl-3-pentanol 0.8221 0.4483 9 2.86 -0.1691 0.6496 0.6205 1-decanol 0.8387 0.4483 10 4.57 1.3354 1.064 1.0614 (+/-)-4-decanol 0.8182 0.4512 10 3.78 0.8499 1.064 1.0431 3,7-dimethyl-3-octanol 0.8658 0.4450 10 3.52 0.3404 1.064 1.0856 1-undecanol 0.8248 0.4483 10 4.53 1.9547 1.064 1.049 1-dodecanol 0.8132 0.4483 12 5.13 2.1612 1.8928 1.8909 1-tridecanol 0.8035 0.4483 13 5.58 2.4497 2.3072 2.3083 Carboxylic Acid Propionic acid 0.9901 0.9780 3 0.33 -0.5123 -0.6331 -0.431 Butyric acid 1.0051 0.9840 4 0.79 -0.5720 -0.5216 -0.4788 Valeric acid 0.9840 0.9851 5 1.39 -0.2674 -0.41 -0.3301 Hexanoic acid 0.9731 0.9852 6 1.92 -0.2083 -0.2984 -0.2369 Heptanoic acid 0.9582 0.9853 7 2.41 -0.1126 -0.1868 -0.122 Octanoic acid 0.9397 0.9852 8 3.05 0.0807 -0.0753 0.0126 Nonanoic acid 0.9184 0.9853 9 3.47 0.3509 0.0363 0.1623 Decanoic acid 0.8986 0.9853 10 4.09 0.5063 0.1478 0.3039 Undecanoic acid 0.8813 0.9853 11 4.53 0.8983 0.2594 0.4319 iso-Butyric acid 0.9624 0.9834 4 0.60 -0.3334 -0.5216 -0.2464 Isovalerianic acid 1.0071 0.9823 5 1.16 -0.3415 -0.41 -0.4558 Trimethylacetic acid 0.9574 0.9819 5 1.47 -0.2543 -0.41 -0.1853 3-Methylvaleric acid 0.9657 0.9884 6 1.75 -0.2331 -0.2984 -0.1966 4-Methylvaleric acid 0.9964 0.9871 6 1.75 -0.2724 -0.2984 -0.3637 2-Ethylbutyric acid 0.9355 0.9854 6 1.68 -0.1523 -0.2984 -0.0323 2-Propylpentanoic acid 0.8905 0.9903 8 2.75 0.0258 -0.0753 0.2803 2-Ethylhexanoic acid 0.9122 0.9896 8 2.64 0.0756 -0.0753 0.1622 Succinic acid 1.0511 0.9829 4 -0.59 -0.9395 -0.5216 -0.7291 Glutaric acid 1.0756 0.9839 5 -0.29 -0.6387 -0.41 -0.8286 Adipic acid 1.0345 0.9850 6 0.08 -0.606 -0.2984 -0.5711 Pimelic acid 1.0336 0.9848 7 0.42 -0.5845 -0.1868 -0.5323 3,3-Dimethylglutaric acid 1.0614 0.9856 7 0.16 -0.6643 -0.1868 -0.6837 Suberic acid 0.9991 0.9852 8 0.95 -0.5116 -0.0753 -0.3107 Sebacic acid 0.9600 0.9853 10 2.01 -0.2676 0.1478 -0.0302 1,10-Decanedicarboxylic acid 0.9181 0.9853 12 3.07 -0.0863 0.3710 0.2655 Crotonic acid 1.0041 0.9462 4 0.72 -0.5448 -0.5216 -0.4733 trans-2-Pentenoic acid 1.0254 0.9496 5 1.41 -0.2774 -0.41 -0.5554 trans-2-Hexenoic acid 0.9961 0.9469 5 1.94 -0.1279 -0.41 -0.3959 Halogenated Acid 4-Bromobutyric acid 0.6742 0.9994 4 0.68 -0.7711 -0.4453 -0.6158 5-Bromovaleric acid 0.6476 0.9992 5 1.21 -0.6929 -0.2197 -0.5685 4-Chlorobutyric acid 0.6786 0.9994 4 0.54 -0.6773 -0.4453 -0.6075 3-Chloropropionic acid 0.7333 0.9952 3 0.41 -0.3321 -0.671 -0.6016 5-Chlorovaleric acid 0.6419 0.9992 5 1.07 -0.2857 -0.2197 -0.5793 2-Bromobutyric acid 1.0508 0.9800 4 1.42 0.1221 -0.4453 0.0971 2-Bromoisobutyric acid 0.7178 0.9825 4 0.86 -0.5845 -0.4453 -0.5333 2-Bromoisovaleric acid 0.7562 0.9826 5 1.48 -0.5492 -0.2197 -0.3629 2-Bromovaleric acid 1.0422 0.9806 5 1.61 -0.0423 -0.2197 0.1785 2-Bromooctanoic acid 1.0345 0.9806 8 3.19 0.4907 0.4574 0.4569 2-Bromohexanoic acid 1.0382 0.9806 6 2.14 0.4547 0.0060 0.2686 Mono Ester Ethyl acetate 0.9420 0.9792 4 0.73 -1.2968 -1.3388 -1.1201 Propyl acetate 0.9562 0.9799 5 1.24 -1.2382 -0.9743 -1.0196 Isopropyl acetate 0.9664 0.9826 5 1.02 -1.5900 -0.9743 -1.1309 Butyl acetate 0.9465 0.9801 6 1.78 -0.4864 -0.6098 -0.6583 Amyl acetate 0.9408 0.9801 7 2.30 0.1625 -0.2453 -0.3407

22
Hexyl acetate 0.9328 0.9801 8 2.83 -0.0087 0.1192 0.002 Octyl acetate 0.9115 0.9801 11 3.88 1.0570 1.2128 1.0007 Decyl acetate 0.8803 0.9801 12 4.94 1.8794 1.5773 1.5966 Ethyl propionate 0.9443 0.9821 5 1.21 -0.9450 -0.9743 -0.8897 Butyl propionate 0.9379 0.9829 7 2.30 0.1704 -0.2453 -0.3091 Isobutyl propionate 0.9721 0.9837 7 2.17 -0.6935 -0.2453 -0.6823 Propyl propionate 0.9502 0.9827 6 1.77 -0.8148 -0.6098 -0.6987 tert-Butyl propionate 0.9288 0.9847 7 1.95 -0.4095 -0.2453 -0.2098 Ethyl butyrate 0.9486 0.9879 6 1.77 -0.4903 -0.6098 -0.6813 Ethyl isobutyrate 0.9406 0.9843 6 1.55 -1.2709 -0.6098 -0.594 Ethyl valerate 0.9346 0.9889 7 2.30 -0.3580 -0.2453 -0.2731 Propyl butyrate 0.9483 0.9886 7 2.30 -0.4138 -0.2453 -0.4226 Butyl butyrate 0.9374 0.9887 8 2.83 0.5157 0.1192 -0.0482 Propyl valerate 0.9381 0.9896 8 2.83 0.0094 0.1192 -0.0558 Amyl propionate 0.9317 0.9829 5 2.83 -0.0431 -0.9743 -0.7522 Ethyl hexanoate 0.9248 0.9891 6 2.83 0.0637 -0.6098 -0.4215 Methyl butyrate 0.9518 0.9832 5 1.29 -1.2463 -0.9743 -0.9716 Methyl valerate 0.9380 0.9843 6 1.96 -0.8448 -0.6098 -0.5656 Methyl hexanoate 0.9271 0.9845 7 2.30 -0.5611 -0.2453 -0.1912 Methyl heptanoate 0.9157 0.9844 8 2.83 0.1039 0.1192 0.1886 Methyl octanoate 0.9027 0.9845 9 3.36 0.5358 0.4837 0.5859 Methyl nonanoate 0.8868 0.9845 10 3.88 1.0419 0.8482 1.0149 Methyl decanoate 0.8710 0.9845 11 4.41 1.3778 1.2128 1.4427 Methyl undecanoate 0.8562 0.9845 12 4.79 1.4248 1.5773 1.8596 Methyl formate 0.9611 0.8265 2 0.03 -1.4982 -2.0679 -1.8393 tert-Butyl formate 0.9594 0.8379 5 0.97 -1.3719 -0.9743 -1.0545 Di Ester Diethyl malonate 0.6983 1.0038 7 0.96 -0.9975 -0.8809 -0.8413 Diethyl sebacate 0.5494 1.0009 14 3.90 1.3536 1.1221 1.2753 Diethyl suberate 0.5705 1.0010 12 2.84 0.7018 0.5498 0.7738 Diethyl succinate 0.6764 0.9996 8 1.19 -0.8511 -0.5948 -0.5359 Dimethyl malonate 0.7367 0.9994 5 -0.05 -1.2869 -1.4532 -1.4261 Dibutyl adipate 0.5838 1.0017 14 3.90 0.7918 1.1221 1.1096 Dimethyl succinate 0.7085 0.9953 6 0.35 -1.0573 -1.1671 -1.0904 Diethyl adipate 0.5991 1.0010 10 1.79 -0.1265 -0.0225 0.2362 Dimethyl brassylate 0.5361 0.9966 15 4.43 1.6536 1.4083 1.5392 Dimethyl sebacate 0.5703 0.9967 12 2.84 1.0106 0.5498 0.7748 Dimethyl suberate 0.5952 0.9967 10 1.79 0.2962 -0.0225 0.255 Diethyl pimelate 0.5759 1.0006 11 2.31 0.4069 0.2636 0.5479 Dibutyl suberate 0.5574 1.0017 16 4.96 1.6556 1.6944 1.6366 Diethyl butylmalonate 0.6795 1.0140 11 3.02 0.5566 0.2636 0.0489 Diethyl ethylmalonate 0.6916 1.0133 9 1.96 -0.2422 -0.3086 -0.4092 Diethyl 3-oxopimelate 0.7225 1.0050 11 1.49 -0.3778 0.2636 -0.1582 Diethyl 4-oxopimelate 0.7458 1.0002 11 1.54 -0.6378 0.2636 -0.2705 Diethyl methylmalonate 0.7004 1.0079 8 1.44 -0.5114 -0.5948 -0.6515 Diethyl propylmalonate 0.6837 1.0140 10 2.49 0.1341 -0.0225 -0.1713 Dibutyl succinate 0.6602 1.0003 12 3.60 0.5123 0.5498 0.3418 Aldehyde Propionaldehyde 0.8905 0.5592 3 0.59 -0.4855 -0.7336 -0.5798 Butyraldehyde 0.8722 0.5638 4 0.88 -0.3805 -0.5106 -0.4108 Isobutyraldehyde 0.9295 0.5589 4 0.61 -0.4328 -0.5106 -0.5555 Valeraldehyde 0.8620 0.5651 5 1.36 -0.0223 -0.2876 -0.2623 2-Methyl-butyraldehyde 0.8494 0.5644 5 1.14 -0.3107 -0.2876 -0.2305 Hexylaldehyde 0.8384 0.5624 6 1.78 -0.1731 -0.0646 -0.0799 2-Methylvaleraldehyde 0.8354 0.5655 6 1.67 -0.4745 -0.0646 -0.0723 2-Ethylbutyraldehyde 0.8429 0.5542 6 1.67 -0.0544 -0.0646 -0.0913
23
3,3-Dimethylbutyraldehyde 0.9114 0.5579 6 1.63 -0.3744 -0.0646 -0.2642 Heptaldehyde 0.8517 0.5653 7 2.42 -0.0019 0.1584 0.0093 2-Ethylhexanal 0.8268 0.5555 8 2.73 0.1608 0.3814 0.1949 trans-4-Decen-1-al 0.6717 0.5642 10 4.05 1.2076 0.8275 0.832 cis-7-Decen-1-al 0.5588 0.5652 10 3.52 0.9485 0.8275 1.1171 Ketones Acetone 0.8709 0.6969 3 -0.24 -2.2036 -2.203 -2.2784 2-Butanone 0.8544 0.7020 4 0.29 -1.7457 -1.7884 -1.8354 2-Pentanone 0.8175 0.7072 5 0.91 -1.2224 -1.3737 -1.3268 3-Pentanone 0.8315 0.7033 5 0.85 -1.4561 -1.3737 -1.3719 4-Methyl-2-pentanone 0.8315 0.7060 6 1.31 -1.2085 -0.959 -0.982 2-Heptanone 0.7975 0.7084 7 1.98 -0.4872 -0.5444 -0.4827 5-Methyl-2-hexanone 0.8053 0.7105 7 1.88 -0.6459 -0.5444 -0.5078 4-Heptanone 0.8108 0.7151 7 1.91 -0.6690 -0.5444 -0.5255 2-Octanone 0.7948 0.7085 8 2.37 -0.1455 -0.1297 -0.0841 2-Nonanone 0.7926 0.7085 9 3.14 0.6598 0.2849 0.3129 2-Decanone 0.7912 0.7085 10 3.73 0.5822 0.6996 0.7072 3-Decanone 0.7992 0.7171 10 3.49 0.6265 0.6996 0.6815 2-Undecanone 0.7901 0.7085 11 4.09 1.5346 1.1142 1.1007 2-Dodecanone 0.7893 0.7085 12 4.55 1.6696 1.5289 1.4931 7-Tridecanone 0.7811 0.7177 13 5.08 1.5214 1.9435 1.9094 * Taken from reference 10.

24
Table 2: Electrophilicity (ω), maximum atomic charge ( max
kQ ), number of carbon atoms (Nc), log P along with the experimental and calculated values of log (IGC50
-1) for the complete set of aliphatic donor compounds with Tetrahymena pyriformis.
pIGC50 Molecules ω max
kQ Nc log P* Expt.* Calc. (Nc)
Calc. (Nc, ω)
Amino Alcohol 2-(methylamino)ethanol 0.5611 -0.7684 3 -0.94 -1.8202 -1.6530 -1.961 4-amino-1-butanol 0.6562 -0.8278 4 -1.06 -0.9752 -1.4275 -0.9598 2-(ethylamino)ethanol 0.5658 -0.7656 4 -0.46 -1.6491 -1.4275 -1.7723 2-Propylaminoethanol 0.5548 -0.7657 5 0.07 -1.6842 -1.2020 -1.7248 DL-2-amino-1-pentanol 0.6623 -0.8457 5 0.07 -0.6718 -1.2020 -0.7586 3-amino-2,2-dimethyl-1-propanol 0.6792 -0.8558 5 -0.79 -0.9246 -1.2020 -0.6067 6-amino-1-hexanol 0.6297 -0.8512 6 -0.01 -0.958 -0.9764 -0.9052 DL-2-amino-1-hexanol 0.6621 -0.8458 6 0.60 -0.5848 -0.9764 -0.614 DL-2-amino-3-methyl-1-butanol 0.6306 -0.8569 5 -0.06 -0.5852 -1.2020 -1.0435 2-amino-3,3-dimethyl-butanol 0.6430 -0.8599 6 0.34 -0.7178 -0.9764 -0.7857 2-amino-3-methyl-1-pentanol 0.6325 -0.8607 6 0.47 -0.6594 -0.9764 -0.88 2-amino-4-methyl-pentanol 0.6484 -0.8574 6 0.47 -0.6191 -0.9764 -0.7371 2-(tert.butylamino)ethanol 0.5856 -0.7671 6 0.41 -1.673 -0.9764 -1.3016 Diethanolamine 0.5880 -0.7685 4 -1.43 -1.7941 -1.4275 -1.5728 1,3-diamino-2-hydroxy-propane 0.6407 -0.8517 3 -2.05 -1.4275 -1.6530 -1.2456 N-methyldiethanol amine 0.5309 -0.7675 5 -1.04 -1.8338 -1.2020 -1.9396 3-(methylamino)-1,2-propanediol 0.5936 -0.7897 4 -1.82 -1.5341 -1.4275 -1.5225 Triethanolamine 0.5602 -0.7678 6 -1.00 -1.7488 -0.9764 -1.5298 Acetylenic Alcohols 3-Butyn-2-ol 0.7438 -0.7525 4 0.14 -0.4024 -0.8795 -0.781 1-Pentyn-3-ol 0.7443 -0.7565 5 0.67 -1.1776 -0.5463 -0.4085 2-Pentyn-1-ol 0.6737 -0.7387 5 0.89 -0.5724 -0.5463 -0.6729 2-Penten-4-yn-1-ol 0.6042 -0.7593 6 -0.01 -0.5549 -0.2130 -0.5625 1-Hexyn-3-ol 0.7265 -0.7565 6 1.2 0.6574 -0.2130 -0.1044 1-Heptyn-3-ol 0.7227 -0.7566 7 1.73 -0.265 0.1202 0.252 4-Heptyn-3-ol 0.6704 -0.7601 7 1.73 -0.0336 0.1202 0.0561 2-Octyn-1-ol 0.6495 -0.7388 8 2.48 0.1944 0.4534 0.3485 2-Nonyn-1-ol 0.6487 -0.7388 9 3.01 0.6486 0.7867 0.7162 2-Decyn-1-ol 0.6481 -0.7388 10 3.54 0.9855 1.1199 1.0847 2-Tridecyn-1-ol 0.6474 -0.7388 13 5.13 2.3665 2.1196 2.1941 4-Methyl-1-pentyn-3-ol 0.7265 -0.7565 6 1.07 -0.0267 -0.2130 -0.1044 4-Methyl-1-heptyn-3-ol 0.7018 -0.7566 8 2.13 0.7426 0.4534 0.5444 Unsaturated Alcohol 2-methyl-3-buten-2-ol 0.6225 -0.7821 5 0.52 -1.3889 -1.3007 -1.2972 4-pentyn-1-ol 0.7562 -0.7561 5 -0.01 -1.4204 -1.3007 -1.5947 2-methyl-3-butyn-2-ol 0.7465 -0.7635 5 0.28 -1.3114 -1.3007 -1.5731 trans-3-hexen-1-ol 0.4768 -0.7625 6 1.40 -0.7772 -0.8914 -0.6088 cis-3-hexen-1-ol 0.5049 -0.7703 6 1.40 -0.8091 -0.8914 -0.6714 5-hexyn-1-ol 0.7024 -0.7667 6 0.52 -1.2948 -0.8914 -1.1108 3-methyl-1-pentyn-3-ol 0.7596 -0.768 6 1.07 -1.3226 -0.8914 -1.2381 4-hexen-1-ol 0.4780 -0.7634 6 1.40 -0.754 -0.8914 -0.6115 5-hexen-1-ol 0.5493 -0.7636 6 1.40 -0.8411 -0.8914 -0.7702 4-pentyn-2-ol 0.7275 -0.772 5 0.12 -1.6324 -1.3007 -1.5308 5-hexyn-3-ol 0.7249 -0.7808 6 0.65 -1.4043 -0.8914 -1.1609

25
3-heptyn-1-ol 0.6046 -0.7656 7 1.40 -0.3231 -0.4820 -0.5291 4-heptyn-2-ol 0.6054 -0.7723 7 1.18 -0.616 -0.4820 -0.5309 3-octyn-1-ol 0.5983 -0.7656 8 1.93 0.017 -0.0727 -0.1509 3-nonyn-1-ol 0.5942 -0.7656 9 2.46 0.3401 0.3366 0.2223 2-propen-1-ol 0.6632 -0.7531 3 0.17 -1.9178 -2.1193 -2.116 2-buten-1-ol 0.5471 -0.7588 4 0.34 -1.4719 -1.7100 -1.4935 (+/-)-3-buten-2-ol 0.6295 -0.771 4 0.12 -1.0529 -1.7100 -1.6769 cis-2-buten-1,4-diol 0.6479 -0.7578 5 -0.81 -2.1495 -1.3007 -1.3537 cis-2-penten-1-ol 0.5885 -0.755 5 0.87 -1.1052 -1.3007 -1.2215 3-penten-2-ol 0.5738 -0.7709 5 0.65 -1.401 -1.3007 -1.1888 trans-2-hexen-1-ol 0.4642 -0.7591 6 1.40 -0.4718 -0.8914 -0.5808 1-hexen-3-ol 0.6304 -0.7748 6 1.18 -0.8113 -0.8914 -0.9506 cis-2-hexen-1-ol 0.5381 -0.7588 6 1.40 -0.7767 -0.8914 -0.7452 trans-2-octen-1-ol 0.4621 -0.759 8 2.45 0.3654 -0.0727 0.1521 Amines Propylamine 0.6353 -0.8330 3 0.47 -0.7075 -1.005 -1.003 Butylamine 0.6334 -0.8325 4 0.97 -0.5735 -0.891 -0.891 N-Methylpropylamine 0.5455 -0.6865 4 0.84 -0.8087 -0.891 -0.876 Amylamine 0.6218 -0.8510 5 1.49 -0.4848 -0.778 -0.777 N-Methylbutylamine 0.5416 -0.6826 5 1.33 -0.6784 -0.778 -0.764 Hexylamine 0.6213 -0.8510 6 2.06 -0.2197 -0.664 -0.666 Isopropylamine 0.6842 -0.8479 3 0.26 -0.8635 -1.005 -1.011 Isobutylamine 0.6703 -0.8631 4 0.73 -0.2616 -0.891 -0.897 N,N-Dimethylethylamine 0.4764 -0.5751 4 0.70 -0.9083 -0.891 -0.864 (+/-)-sec-Butylamine 0.6626 -0.8473 4 0.74 -0.6708 -0.891 -0.896 Isoamylamine 0.6505 -0.8314 5 1.32 -0.5774 -0.778 -0.782 1-Methylbutylamine 0.6543 -0.8469 5 1.23 -0.6846 -0.778 -0.783 1-Ethylpropylamine 0.6303 -0.8455 7 1.23 -0.8129 -0.551 -0.555 2-Methylbutylamine 0.6449 -0.8380 5 1.32 -0.4774 -0.778 -0.781 N,N-Diethylmethylamine 0.4888 -0.5714 5 0.95 -0.7559 -0.778 -0.755 tert-Butylamine 0.7163 -0.8541 4 0.40 -0.8973 -0.891 -0.905 tert-Amylamine 0.6995 -0.8592 5 1.10 -0.6978 -0.778 -0.790 (+/-)-1,2-Dimethylpropylamine 0.6367 -0.8457 5 1.10 -0.7095 -0.778 -0.780 Propargylamine 0.6898 -0.8084 3 -0.43 -0.826 -1.005 -1.012 N-Methylpropargylamine 0.6355 -0.6632 4 0.08 -0.9818 -0.891 -0.891 1-Dimethylamino-2-propyne 0.5750 -0.5392 5 -0.01 -1.1451 -0.778 -0.769 1,1-Dimethylpropargylamine 0.6681 -0.8289 5 0.64 -0.9104 -0.778 -0.785 2-Methoxyethylamine 0.6585 -0.8568 3 -0.67 -1.7903 -1.005 -1.007 3-Methoxypropylamine 0.6608 -0.8478 4 -1.02 -1.7725 -0.891 -0.895 3-Ethoxypropylamine 0.6592 -0.8479 5 -0.49 -1.7027 -0.778 -0.784 * Taken from reference 10.
26
Table 3. Regression models for different groups of aliphatic compounds for estimating their toxicity towards Tetrahymena pyriformis Molecules Regression Equations R SD Aliphatic Electron Acceptors
pIGC50 = 0.4497×NC - 4.0855 0.9683 0.2781 Diols (N=10) pIGC50 = -12.4224×ω + 0.3554×NC+ 7.6094 0.9826 0.2070
pIGC50 = 0.3271×NC - 2.0248 0.8923 0.3852 Halogenated Alcohols (N=11) pIGC50 = - 6.2863×ω + 0.1982×NC + 4.5793 0.9424 0.2855
pIGC50 = 0.4144×NC - 3.0801 0.9634 0.3456 Saturated Alcohols (N=32) pIGC50 = 0.8927×ω + 0.4261×NC - 3.9484 0.9636 0.3451
pIGC50 = 0.1116×NC - 0.9678 0.6676 0.2917 Carboxylic Acids (N=28) pIGC50 = - 5.4426×ω + 0.0338×NC + 4.8562 0.8801 0.1860
pIGC50 = 0.2257×NC - 1.3481 0.6564 0.3632 Halogenated Acids (N=11) pIGC50 = 1.8930×ω + 0.0976×NC - 2.2827 0.9186 0.1903
pIGC50 = 0.3645×NC - 2.7969 0.9189 0.3710 Mono Esters (N= 31) pIGC50 = -10.9131×ω + 0.2554×NC + 8.1384 0.9352 0.3330
pIGC50 = 0.2861×NC - 2.884 0.9299 0.3382 Di Esters (N=20) pIGC50 = -4.8166×ω + 0.1999×NC + 1.1227 0.9636 0.2460
pIGC50 = 0.2230×NC - 1.4027 0.8980 0.2459 Aldehydes (N=13) pIGC50 = -2.5248×ω + 0.1228×NC + 1.3002 0.9332 0.2008
pIGC50 = 0.4147×NC - 3.4470 0.9850 0.2249 Ketones (N=15) pIGC50 = -3.2176×ω + 0.38989×NC - 0.6459 0.9855 0.2211
Aliphatic Electron Donors pIGC50 = 0.2255×NC - 2.3296 0.4711 0.4596 Amino Alcohols
(N=18) pIGC50 = 8.9875×ω + 0.1464×NC - 7.4431 0.9152 0.2100 pIGC50 = 0.3332×NC - 2.2125 0.8942 0.4218 Acetylenic Alcohols
(N=13) pIGC50 = 3.7452×ω + 0.3707×NC - 5.0494 0.9080 0.3947 pIGC50 = 0.4093×NC - 3.3473 0.8580 0.3311 Unsaturated Alcohols
(N=25) pIGC50 = -2.2250×ω + 0.3641×NC - 1.7327 0.9136 0.2622 pIGC50 = 0.1136×NC - 1.3456 0.2711 0.3965 pIGC50 = -0.1700×ω + 0.1116×NC - 1.2295 0.2723 0.3964 Amines
(N=25) pIGC50 = 0.1162×Qkmax +2.1524×ω–
max +0.0669×NC -1.8782 0.8692 0.2037

27
-3 -2 -1 0 1 2 3
-3
-2
-1
0
1
2
3
R2=0.9283 ; R2Ad=0.9279 ; R2
CV=0.9265Y= -1.0415E-12 + 1*X
Complete Set of Aliphatic Electron Acceptors Two Parameter (ω,NC )
Calculated pIGC50
Obs
erve
d pI
GC
50SD=0.25812 N=171
(a)
-2 -1 0 1 2 3-3
-2
-1
0
1
2
3
R2=0.8284 ; R2Ad=0.8262 ; R2
CV=0.8156Y= 4.74532E-12 + 1*X
Complete Set of Aliphatic Electron Donors Two Parameter (ω,NC)
Calculated pIGC50
Obs
erve
d pI
GC
50
SD=0.31045 N=81
(b)
Figure 1. Observed versus calculated pIGC50 values using two-parameter (ω, NC) regression model for the (a) Complete set of aliphatic electron acceptors and (b) Complete set of aliphatic electron donors. Please see the text for details.
28
0 2 4 6 8 10 12 14 16 18
-3
-2
-1
0
1
2
3
Complete Set of Aliphatic Compounds
Exp
t. pI
GC
50
Y = -2.248(0.090) + 0.279(0.013)*X
R=0.805 ; SD=0.551 ; N=252
NC (a)
-2 -1 0 1 2
-3
-2
-1
0
1
2
3
R=0.812 ; SD = 0.542 ; N=252Complete Set of Aliphatic Compounds
Y = -2.775E-16(0.040) + 1.000(0.046)*X
Expt
. pIG
C50
Calc. pIGC50 (NC, ω) (b)
-3 -2 -1 0 1 2 3 4 5 6
-3
-2
-1
0
1
2
3
log P
Exp
t. pI
GC
50
Complete Set of Aliphatic Compounds
Y = -1.306(0.037) + 0.574(0.018)*X
R=0.897 ; SD=0.411 ; N=252
(c)
0 2 4 6 8 10 12 14 16 18-3
-2
-1
0
1
2
3
4
5
6
Complete Set of Aliphatic Compounds
Y = -1.439(0.130) + 0.454(0.019)*X
R=0.839 ; SD=0.789 ; N=252
log
P
NC
(d)
Figure 2. Observed pIGC50 versus the a) Number of carbon atoms (NC), b) Calculated pIGC50 values using two-parameter (ω, NC) regression model and (c) log P along with the (d) inter-correlation between log P and NC for the complete set of 252 aliphatic compounds.

29
Graphical Abstract
New QSTR Models for the Toxicity Analysis† P. K. Chattaraja,*, D. R. Roya, S. Giria, S. Mukherjeea, V. Subramanianb,*, P.
Bultinckc,* and S. Van Dammec
-3 -2 -1 0 1 2 3
-3
-2
-1
0
1
2
3
R2=0.9283 ; R2Ad=0.9279 ; R2
CV=0.9265Y= -1.0415E-12 + 1*X
Complete Set of Aliphatic Electron Acceptors Two Parameter (ω,NC )
Calculated pIGC50
Obs
erve
d pI
GC
50
SD=0.25812 N=171
-2 -1 0 1 2 3-3
-2
-1
0
1
2
3
R2=0.8284 ; R2Ad=0.8262 ; R2
CV=0.8156Y= 4.74532E-12 + 1*X
Complete Set of Aliphatic Electron Donors Two Parameter (ω,NC)
Calculated pIGC50
Obs
erve
d pI
GC
50
SD=0.31045 N=81
A deceptively simple descriptor, viz. the number of carbon / non-hydrogenic atoms present in a molecule is prescribed for the development of useful quantitative-structure-toxicity-relationship (QSTR) models. Please see the text for details.