A COMPUTATIONAL STUDY OF UNSTEADY AERODYNAMICS OF A SMALLER FIXED WING MICRO AERIAL VEHICLE (MAV)
11
INTERNATIONAL JOURNAL OF RESEARCH IN AERONAUTICAL AND MECHANICAL ENGINEERING Vol.2 Issue.5, May 2014. Pgs: 97-107 Somashekar V 97 ISSN (ONLINE): 2321-3051 INTERNATIONAL JOURNAL OF RESEARCH IN AERONAUTICAL AND MECHANICAL ENGINEERING A COMPUTATIONAL STUDY OF UNSTEADY AERODYNAMICS OF A SMALLER FIXED WING MICRO AERIAL VEHICLE (MAV) Somashekar V 1 2 Asst. Professor, Dept. of Aeronautical Engineering, Visvesvaraya Technological University, India [email protected] Address: Acharya Institute of Technology, Bangalore, Karnataka 560090 Abstract A bird or insect sized flapping wing Micro Aerial Vehicle (MAV) whose wingspan is of the order of a few centimeters cannot be physically built or flown today; they can be designed, tested, flown and studied on the computer using numerical simulation technique. While finalizing a design is quite significant in case of MAV, understanding the flow field environment in which MAVs fly is equally a requirement. The flow field environments encountered by Micro Air Vehicles (MAVs) are fundamentally unsteady – whether for fixed- wing, rotary-wing or flapping-wing configurations. High lift generation is typically a result of unsteady fluid flow phenomena in flapping flight of small birds and insects. Along with a good understanding of flow field environment of an MAV the insight into the aerodynamics characteristics of it calls for an investigation. These characteristics greatly influence the design of a prototype of an MAV which can serve the purpose of a specific application. As a first step towards exploring the flow environment and computing the aerodynamic characteristics of a smaller MAV we have chosen a fixed wing MAV for which a study is attempted considering a three dimensional flow field. In the present study, unsteady aerodynamic analysis of the MAV has been done using commercial CFD solver ANSYS FLUENT. The analysis aim at predicting aerodynamic characteristics such as lift coefficients drag coefficients, moment coefficients, pressure coefficients and flow visualization. During the study it is observed that lift and drag are both compared and validated well for the mid-range angle of attack from -10 to 20 degree AOA. Keywords: Low Reynolds Number, Stability and Control, Small moments of inertia, Miniaturization, Aerodynamic analysis, CFD. 1. Introduction A bird or insect sized flapping wing Micro Aerial Vehicle (MAV) whose wingspan is of the order of a few centimeters cannot be physically built or flown today; they can be designed, tested, flown and studied on the computer using numerical simulation technique. While finalizing a design is quite significant in case of MAV, understanding the flow field environment in which MAVs fly is equally a requirement. The flow field environments encountered by Micro Air Vehicles (MAVs) are fundamentally unsteady – whether for fixed-
-
Upload
independent -
Category
Documents
-
view
4 -
download
0
Transcript of A COMPUTATIONAL STUDY OF UNSTEADY AERODYNAMICS OF A SMALLER FIXED WING MICRO AERIAL VEHICLE (MAV)
INTERNATIONAL JOURNAL OF RESEARCH IN AERONAUTICAL AND MECHANICAL ENGINEERING
Vol.2 Issue.5,
May 2014.
Pgs: 97-107
Somashekar V 97
ISSN (ONLINE): 2321-3051
INTERNATIONAL JOURNAL OF RESEARCH IN AERONAUTICAL AND MECHANICAL ENGINEERING
A COMPUTATIONAL STUDY OF UNSTEADY AERODYNAMICS OF A SMALLER FIXED WING MICRO AERIAL VEHICLE (MAV)
Somashekar V1
2 Asst. Professor, Dept. of Aeronautical Engineering, Visvesvaraya Technological University, India [email protected]
Address: Acharya Institute of Technology, Bangalore, Karnataka 560090
Abstract
A bird or insect sized flapping wing Micro Aerial Vehicle (MAV) whose wingspan is of the order of a few centimeters cannot be physically built or flown today; they can be designed, tested, flown and studied on the computer using numerical simulation technique. While finalizing a design is quite significant in case of MAV, understanding the flow field environment in which MAVs fly is equally a requirement. The flow field environments encountered by Micro Air Vehicles (MAVs) are fundamentally unsteady – whether for fixed-wing, rotary-wing or flapping-wing configurations. High lift generation is typically a result of unsteady fluid flow phenomena in flapping flight of small birds and insects. Along with a good understanding of flow field environment of an MAV the insight into the aerodynamics characteristics of it calls for an investigation. These characteristics greatly influence the design of a prototype of an MAV which can serve the purpose of a specific application. As a first step towards exploring the flow environment and computing the aerodynamic characteristics of a smaller MAV we have chosen a fixed wing MAV for which a study is attempted considering a three dimensional flow field. In the present study, unsteady aerodynamic analysis of the MAV has been done using commercial CFD solver ANSYS FLUENT. The analysis aim at predicting aerodynamic characteristics such as lift coefficients drag coefficients, moment coefficients, pressure coefficients and flow visualization. During the study it is observed that lift and drag are both compared and validated well for the mid-range angle of attack from -10 to 20 degree AOA.
Keywords: Low Reynolds Number, Stability and Control, Small moments of inertia, Miniaturization, Aerodynamic analysis, CFD.
1. Introduction
A bird or insect sized flapping wing Micro Aerial Vehicle (MAV) whose wingspan is of the order of a few centimeters cannot be physically built or flown today; they can be designed, tested, flown and studied on the computer using numerical simulation technique. While finalizing a design is quite significant in case of MAV, understanding the flow field environment in which MAVs fly is equally a requirement. The flow field environments encountered by Micro Air Vehicles (MAVs) are fundamentally unsteady – whether for fixed-

INTERNATIONAL JOURNAL OF RESEARCH IN AERONAUTICAL AND MECHANICAL ENGINEERING
Vol.2 Issue.5,
May 2014.
Pgs: 97-107
Somashekar V 98
wing, rotary-wing or flapping-wing configurations. High lift generation is typically a result of unsteady fluid flow phenomena in flapping flight of small birds and insects. Micro air vehicles (MAVs) have attracted significant attention since mid-1990 for both civilian and military applications. Micro Air Vehicle (MAV) is defined here as a small, portable flying vehicle which is designed for performing useful work. The desire for portable, low altitude aerial surveillance has driven the development of aircraft on the scale of small birds. Vehicles in this class of small-scale aircraft are known as Micro Air Vehicles or MAVs, and have great potential for applications in surveillance and monitoring tasks in areas either too remote or too dangerous to send human agents. Equipped with small video cameras and transmitters, MAVs can image targets that would otherwise remain inaccessible. MAVs are also capable of carrying an array of sensors to obtain additional information including, for example, airborne chemical or radiation levels.
MAVs are by definition small aircrafts which fly at relatively low speeds. Such flight characteristics will result in flow regimes with Reynolds numbers. Another aerodynamic signature of MAV is wings with small aspect ratio; in most cases the chord is roughly equal to the wingspan. This combination of low Reynolds number flight and low aspect ratio wings results in a flow regime totally alien to conventional aircraft. Although small birds and insects have been flying under these conditions for quite some time, this is a new flight environment for man-made aircraft. In order for required MAV capabilities to be realized, several areas will need more focused attention. The absence of sophisticated computational analysis methods, lack of commercially available micro electro-mechanical sensors, and the difficulties associated with accurate experimental work at this scale has all restricted research. From a system and manufacturing standpoint, technological advances in micro fabrication techniques and in the miniaturization of electronics in the last decade made mechanical MAVs feasible. Key research challenges include: unsteady aerodynamics at low Reynolds number, low aspect ratio wings, stability and control issues associated with low weight, small moments of inertia, Miniaturization, Cooperative control and Micro sensors. Among these areas unsteady aerodynamics is an important area of research.
Unsteady aerodynamics plays a significant role in MAV flight and stability. Unsteady phenomena may arise due to natural time dependent changes in the flow itself or it may be created by changes in the position or orientation of a body. In many unsteady flows of interest, the important unsteady aspects involve not only the kinematic changes in boundary conditions caused by the motion of a body, but the influence of an unsteady wake, and the changes in the pressure-velocity relationship associated with the unsteady form of Bernoulli's equation.
Mechanisms such as rotational circulation, wake capture, and the unsteady leading edge vortex do seem to properly account for the aerodynamics forces. Regarding forward flight, the unsteady leading edge vortex is the only mechanism present to produce the necessary forces. The unsteady leading edge vortex involves leading edge flow separation that reattaches to the wing and forms a separation bubble. The vortex increases the circulation around the wing and creates much higher lift than the steady-state case. This vortex remains stable due to its highly three-dimensional nature.
Low Reynolds numbers make the problem of airfoil design difficult because the boundary layer is much less capable of handling an adverse pressure gradient without separation. Thus, very low Reynolds number designs do not have severe pressure gradients and the maximum lift capability is restricted. At very low Reynolds numbers, most or all of the boundary layer is laminar. Laminar separation bubbles are common and unless properly stabilized can lead to excessive drag and low maximum lift. The above discussion on low Reynolds number aerodynamics has generated lot of interest to investigate computationally the unsteady aerodynamic phenomenon over a fixed wing of an MAV. The problem is to determine the Aerodynamic characteristic such as Pressure distribution, Lift coefficient, Drag coefficient and Moment coefficient over the fixed wing MAV at different flight conditions. While solving the above problem it is attempted to keep the fulfillment of the following two key objectives.
INTERNATIONAL JOURNAL OF RESEARCH IN AERONAUTICAL AND MECHANICAL ENGINEERING
Vol.2 Issue.5,
May 2014.
Pgs: 97-107
Somashekar V 99
1. To predict the aerodynamic characteristics over the MAV by determining pressure distribution, lift coefficient, drag coefficient and moment coefficient over the fixed wing MAV at different flight conditions.
2. To achieve at an optimum result against the experimental and existing literature results.
2. Methodology
The focus of the proposed study to determine the characteristics of unsteady aerodynamics of fixed wing MAV at different angle of attack during operation and to achieve at an optimum result against the experimental and existing literature results. The rigorous work involves the modeling & analysis of the entire fixed wing MAV using CATIA, ANSYS FLUENT & ICEM-CFD. At various angle of attach MAV characteristics such as pressure distribution, lift coefficient, drag coefficient and moment coefficient over the fixed wing MAV at different flight conditions and fixed wing MAV analysis etc. will be studied and an optimum configuration will be suggested for safe operations. The following governing equations are the prime drivers for the computation of the aerodynamic characteristics.
3. Computational Fluid Dynamic Analysis
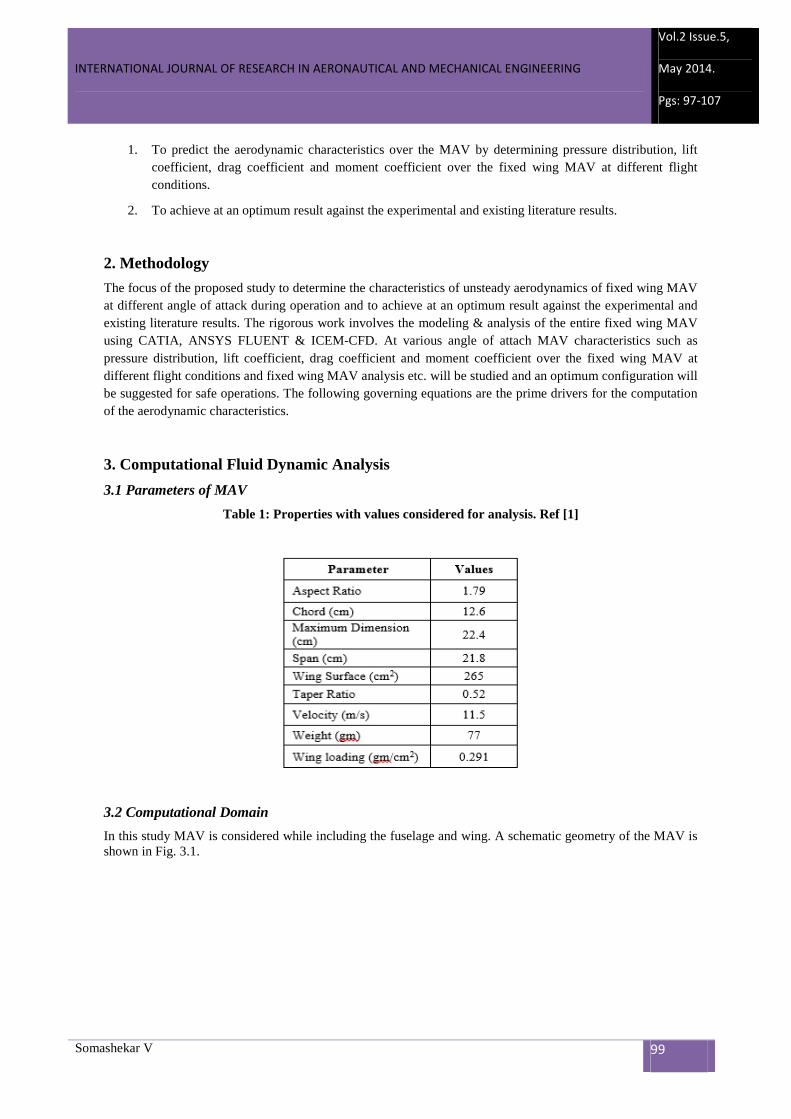
3.1 Parameters of MAV
Table 1: Properties with values considered for analysis. Ref [1]
3.2 Computational Domain
In this study MAV is considered while including the fuselage and wing. A schematic geometry of the MAV is shown in Fig. 3.1.
INTERNATIONAL JOURNAL OF RESEARCH IN AERONAUTICAL AND MECHANICAL ENGINEERING
Vol.2 Issue.5,
May 2014.
Pgs: 97-107
Somashekar V 100
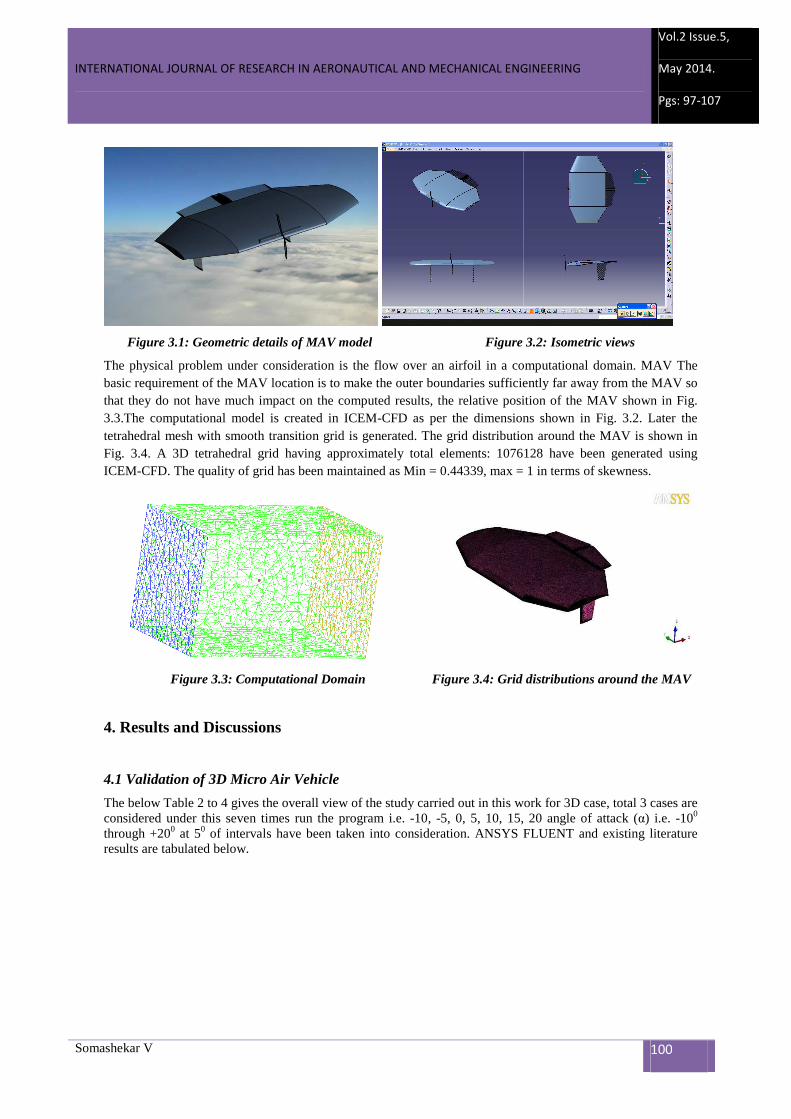
Figure 3.1: Geometric details of MAV model Figure 3.2: Isometric views
The physical problem under consideration is the flow over an airfoil in a computational domain. MAV The basic requirement of the MAV location is to make the outer boundaries sufficiently far away from the MAV so that they do not have much impact on the computed results, the relative position of the MAV shown in Fig. 3.3.The computational model is created in ICEM-CFD as per the dimensions shown in Fig. 3.2. Later the tetrahedral mesh with smooth transition grid is generated. The grid distribution around the MAV is shown in Fig. 3.4. A 3D tetrahedral grid having approximately total elements: 1076128 have been generated using ICEM-CFD. The quality of grid has been maintained as Min = 0.44339, max = 1 in terms of skewness.
Figure 3.3: Computational Domain Figure 3.4: Grid distributions around the MAV
4. Results and Discussions
4.1 Validation of 3D Micro Air Vehicle
The below Table 2 to 4 gives the overall view of the study carried out in this work for 3D case, total 3 cases are considered under this seven times run the program i.e. -10, -5, 0, 5, 10, 15, 20 angle of attack (α) i.e. -100 through +200 at 50 of intervals have been taken into consideration. ANSYS FLUENT and existing literature results are tabulated below.

INTERNATIONAL JOURNAL OF RESEARCH IN AERONAUTICAL AND MECHANICAL ENGINEERING
Vol.2 Issue.5,
May 2014.
Pgs: 97-107
Somashekar V 101
Table 2: Laminar flow (Measured values) Table 3: Inviside flow (Measured values)
Table 4: Turbulent flow (Measured Values) Table 5: Literature values. Ref [2]
In this section, the computed results are compared with reference values for different AOA. Fig. 4.1 shows the plot of the coefficient of lift vs. angle of attack for the MAV and the plot show very good co-relation between the three different models results as well as the experimental data obtained from the Ref [2]. The plot shows that the results obtained from the three different models results the CL maximum varied negligible percentage of error. The solution difference as compared to the experimental data the CL maximum varied 56% at higher AOA. Ref [2]
In this case the experimental data obtained from the Ref [2] is different configuration from the present work but it is almost very close to the present work, so due to this reason the amount of percentage variation as show in the Fig. 4.1 is high at higher AOA. The coefficient of lift is continuously increasing linearly as increasing the AOA, the coefficient of lift will going to be reach the stall condition somewhere at an a higher AOA due to the continuous circulation of the air around the MAV as per the lifting-line theory.

INTERNATIONAL JOURNAL OF RESEARCH IN AERONAUTICAL AND MECHANICAL ENGINEERING
Vol.2 Issue.5,
May 2014.
Pgs: 97-107
Somashekar V 102
Figure 4.1: CL vs. α Plot
Fig. 4.2 shows the plot of the coefficient of drag vs. angle of attack for the MAV and the plot show very good co-relation between the three different models results as well as the experimental data obtained from the Ref [2]. The plot shows that the results obtained from the three different models results the CD maximum varied 3%. The solution difference as compared to the experimental data the CD maximum varied 19% at higher AOA. In this case the experimental data obtained from the Ref [2] is different configuration from the present work but it is almost very close to my present work, so due to this reason the amount of percentage variation as show in the Fig. 4.2 is high at higher AOA.
Figure 4.2: CD vs. α Plot
Fig. 4.3 shows the plot of the coefficient of drag vs. coefficient of lift for the MAV and the plot show very good co-relation between the three different models results as well as the experimental data obtained from the Ref [2]. The plot shows that the results obtained from the three different models results the CD maximum varied 3%. The solution difference as compared to the experimental data the CD maximum varied 19% at higher AOA.
In this case we can study the amount of coefficient of drag variation for each model such as inviscid flow model: In this case the absence of viscous force i.e. skin friction drag, we can predict only pressure drag, and the coefficient of drag variation is much lesser as compared to the Laminar and turbulent models.
In Laminar Flow Model the presence of both pressure drag as well as skin friction drag the coefficient of Drag variation is high as compared to the inviscid flow model. In Turbulent Flow Model we can predict the exact skin friction Drag as well as pressure drag as compared to the laminar and inviscid flow models, so that the drag is more as shown in Figure 4.3 as compared to the other two models.

INTERNATIONAL JOURNAL OF RESEARCH IN AERONAUTICAL AND MECHANICAL ENGINEERING
Vol.2 Issue.5,
May 2014.
Pgs: 97-107
Somashekar V 103
Figure 4.3: CD vs. CL Plot
Fig. 4.4 shows the plot of the Lift/Drag vs. angle of attack for the MAV and the plot show very good co-relation between the three different models results as well as the experimental data obtained from the Ref [2]. The plot shows that the results obtained from the three different models results the L/D is Maximum at 00 AOA in inviscid flow condition as compared to the other two models. The solution difference as compared to the experimental data the L/D variation is high as compared to the present values at higher AOA.
Figure 4.4: L/D vs. α Plot
After the validation of 3D fixed wing MAV aerodynamic parameters with the existing literature and experimental data the same model was taken to study the behaviours of different coefficients with respect to the representative and key AOA mentioned above.
4.2 Variation of Non-dimensional Coefficients with AOA for Laminar Flow Model
In this section, the force coefficients are computed for the MAV for different AOA at 11.5 m/s speed using fluent software for the below conditions. Figure 4.5 shows the variation of the non-dimensional CL vs. AOA for all the test cases. Fig. 4.6 shows the variation of the non-dimensional CD vs. AOA for all the test cases. At an AOA, α=50, the reported value of is CL=0.15164 caused by the low pressure region on the upper surface. As the AOA is increased, the low pressure region on the upper wing surface increases. The coefficient of lift is almost linear with the AOA up to 200. Boundary layer separation occurs at a higher AOA, which introduces unsteadiness to the aerodynamic performance. As AOA is increased excess of 200, the lift increases and drag is also increases as seen in the Fig. 4.6 It also indicates of constant increase in the drag from 50 until it reaches its

INTERNATIONAL JOURNAL OF RESEARCH IN AERONAUTICAL AND MECHANICAL ENGINEERING
Vol.2 Issue.5,
May 2014.
Pgs: 97-107
Somashekar V 104
maximum value. From the results, at α=200, the value of CL and CD are 0.30884 and 0.13359 respectively and their ratio is 2.3118.
Flow conditions: P∞=1.01325 * 105 N/m2, ρ∞=1.225 Kg/m3, µ∞=1.789 * 10-5 Kg/m-s, Re=0.087 * 106, V=11.5 m/s, α=-100 to 150.
Figure 4.5: CL vs. α Plot Figure 4.6: CD vs. α Plot
4.3 Variation of Non-dimensional coefficients with AOA for Inviside Flow Model
In this section, the force coefficients are computed for the MAV for different AOA at 11.5 m/s speed using Fluent software for the below conditions. Figure 4.7 shows the variation of the non-dimensional CL vs. AOA for all the test cases. Figure 4.8 shows the variation of the non-dimensional CD vs. AOA for all the test cases. At an AOA, α=50, the reported value of is CL=0.15756 caused by the low pressure region on the upper surface. As the AOA is increased, the low pressure region on the upper wing surface increases. The coefficient of lift is almost linear with the AOA up to 200. Boundary layer separation occurs at a higher AOA, which introduces unsteadiness to the aerodynamic performance. As AOA is increased excess of 200, the lift increases and drag is also increases as seen in the Figure 4.8. It also indicates of constant increase in the drag from 50 until it reaches its maximum value. From the results, at α=200, the value of CL and CD are 0.32340 and 0.32340 respectively and their ratio is 2.72704.
Flow conditions: P∞=1.01325 * 105 N/m2, ρ∞=1.225 Kg/m3, µ∞=1.789 * 10-5 Kg/m-s, Re=0.087 * 106 V=11.5 m/s, α=-100 to 150.
Figure 4.7: CL vs. α Plot Figure 4.8: CD vs. α Plot
INTERNATIONAL JOURNAL OF RESEARCH IN AERONAUTICAL AND MECHANICAL ENGINEERING
Vol.2 Issue.5,
May 2014.
Pgs: 97-107
Somashekar V 105
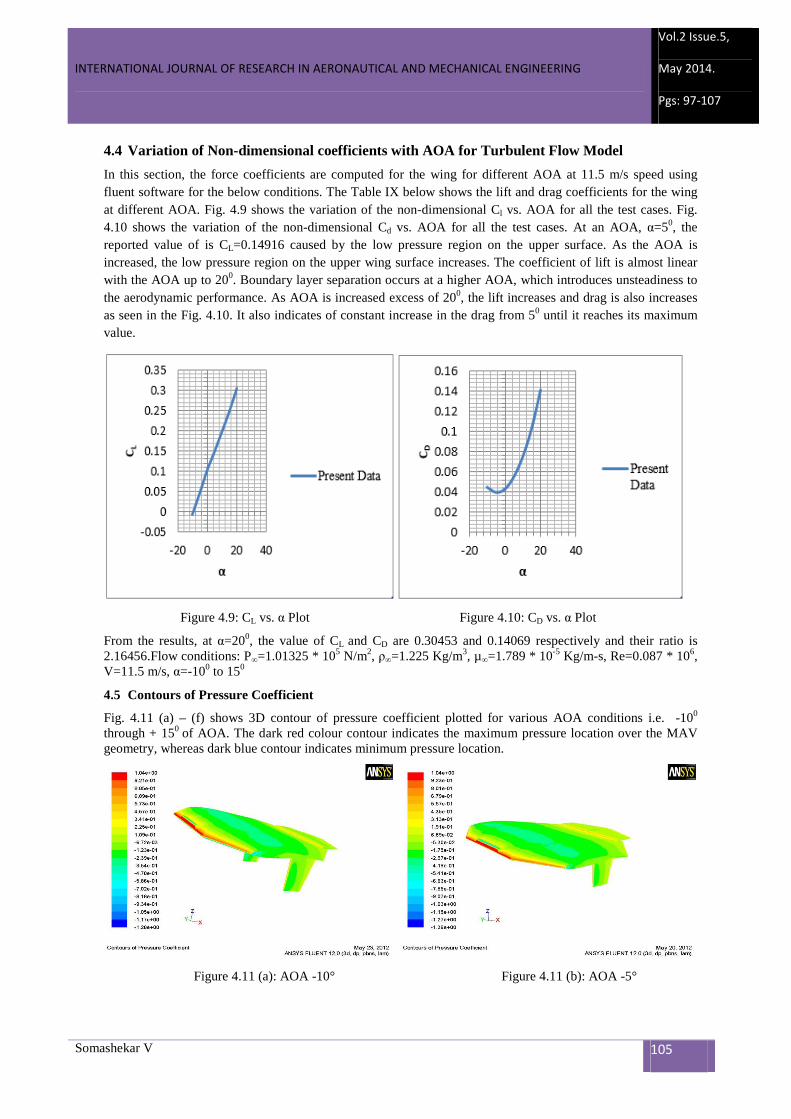
4.4 Variation of Non-dimensional coefficients with AOA for Turbulent Flow Model
In this section, the force coefficients are computed for the wing for different AOA at 11.5 m/s speed using fluent software for the below conditions. The Table IX below shows the lift and drag coefficients for the wing at different AOA. Fig. 4.9 shows the variation of the non-dimensional Cl vs. AOA for all the test cases. Fig. 4.10 shows the variation of the non-dimensional Cd vs. AOA for all the test cases. At an AOA, α=50, the reported value of is CL=0.14916 caused by the low pressure region on the upper surface. As the AOA is increased, the low pressure region on the upper wing surface increases. The coefficient of lift is almost linear with the AOA up to 200. Boundary layer separation occurs at a higher AOA, which introduces unsteadiness to the aerodynamic performance. As AOA is increased excess of 200, the lift increases and drag is also increases as seen in the Fig. 4.10. It also indicates of constant increase in the drag from 50 until it reaches its maximum value.
Figure 4.9: CL vs. α Plot Figure 4.10: CD vs. α Plot
From the results, at α=200, the value of CL and CD are 0.30453 and 0.14069 respectively and their ratio is 2.16456.Flow conditions: P∞=1.01325 * 105 N/m2, ρ∞=1.225 Kg/m3, µ∞=1.789 * 10-5 Kg/m-s, Re=0.087 * 106, V=11.5 m/s, α=-100 to 150
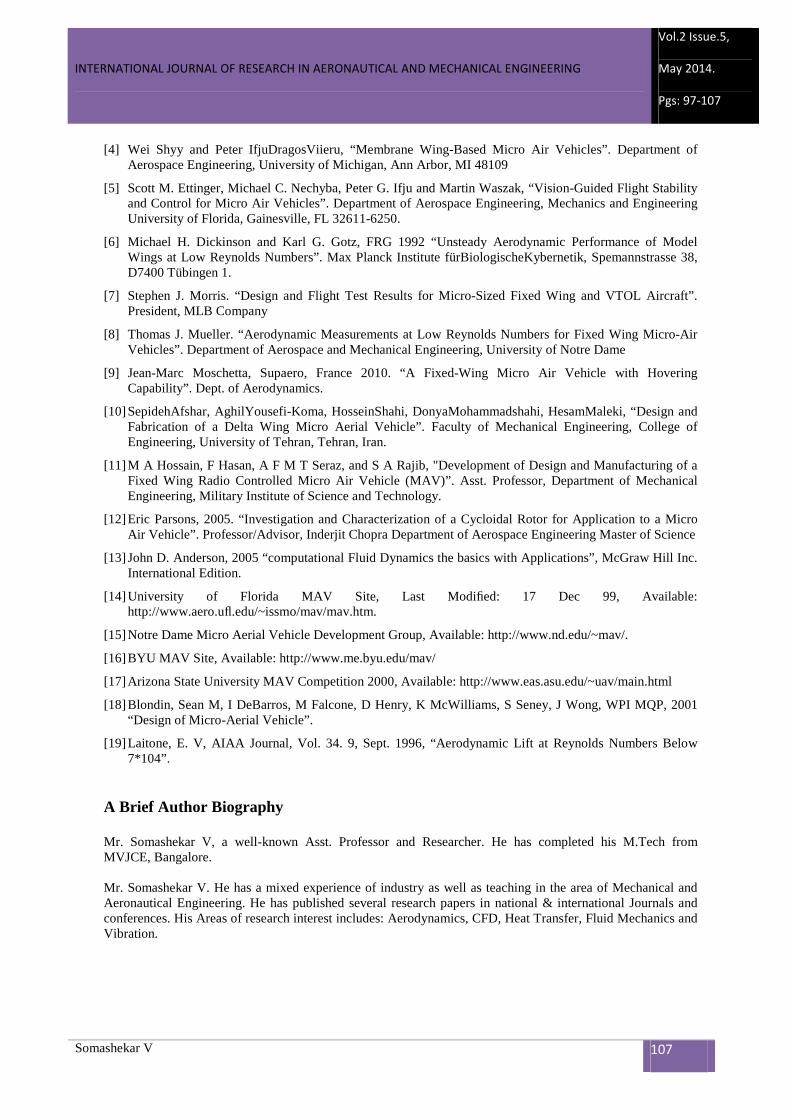
4.5 Contours of Pressure Coefficient
Fig. 4.11 (a) – (f) shows 3D contour of pressure coefficient plotted for various AOA conditions i.e. -100
through + 150 of AOA. The dark red colour contour indicates the maximum pressure location over the MAV geometry, whereas dark blue contour indicates minimum pressure location.
Figure 4.11 (a): AOA -10° Figure 4.11 (b): AOA -5°

INTERNATIONAL JOURNAL OF RESEARCH IN AERONAUTICAL AND MECHANICAL ENGINEERING
Vol.2 Issue.5,
May 2014.
Pgs: 97-107
Somashekar V 106
Figure 4.11 (c): AOA 0° Figure 4.11 (d): AOA 5°
Figure 4.11 (e): AOA 10° Figure 4.11 (f): AOA 15°
Figure 4.11 (a) – (f): Contours of pressure coefficient -100 through + 150 of AOA
5. Conclusions
The stall angle of attack is much higher that what the MAV is computed at since the lift curve slope is a straight line. Higher angles of attack were not computed due limitations of the balance. CFD predicted values very much at lower and higher angles of attack but conform to the experimental values at the mid-range of angle of attack. The L/D ratio for the MAV is highest between 5 to 10 degrees of angle of attack and the MAV should be flown at those angles of attack for best results.
References
[1] Francis Barnhart, Michael Cuipa, Daniel Stefanik, Zachary Swick. 7th March 2004 “Micro-Aerial Vehicle Design with Low Reynolds Number Airfoils”.
[2] Attari, Taher 2004 “CFD analysis and validation for solution to micro air vehicle airframes”. , I.Thesis Submitted in Partial Fulfillment Of the Requirements for the Degree Of MASTER OF SCIENCE IN mechanical engineering
[3] Bret Stanford, Peter Ifju. ”Fixed Membrane Wings for Micro Air Vehicles: Experimental Characterization, Numerical Modeling, and Tailoring”. Department of Mechanical and Aerospace Engineering, University of Florida, Gainesville, FL, 32611
INTERNATIONAL JOURNAL OF RESEARCH IN AERONAUTICAL AND MECHANICAL ENGINEERING
Vol.2 Issue.5,
May 2014.
Pgs: 97-107
Somashekar V 107
[4] Wei Shyy and Peter IfjuDragosViieru, “Membrane Wing-Based Micro Air Vehicles”. Department of Aerospace Engineering, University of Michigan, Ann Arbor, MI 48109
[5] Scott M. Ettinger, Michael C. Nechyba, Peter G. Ifju and Martin Waszak, “Vision-Guided Flight Stability and Control for Micro Air Vehicles”. Department of Aerospace Engineering, Mechanics and Engineering University of Florida, Gainesville, FL 32611-6250.
[6] Michael H. Dickinson and Karl G. Gotz, FRG 1992 “Unsteady Aerodynamic Performance of Model Wings at Low Reynolds Numbers”. Max Planck Institute fürBiologischeKybernetik, Spemannstrasse 38, D7400 Tübingen 1.
[7] Stephen J. Morris. “Design and Flight Test Results for Micro-Sized Fixed Wing and VTOL Aircraft”. President, MLB Company
[8] Thomas J. Mueller. “Aerodynamic Measurements at Low Reynolds Numbers for Fixed Wing Micro-Air Vehicles”. Department of Aerospace and Mechanical Engineering, University of Notre Dame
[9] Jean-Marc Moschetta, Supaero, France 2010. “A Fixed-Wing Micro Air Vehicle with Hovering Capability”. Dept. of Aerodynamics.
[10] SepidehAfshar, AghilYousefi-Koma, HosseinShahi, DonyaMohammadshahi, HesamMaleki, “Design and Fabrication of a Delta Wing Micro Aerial Vehicle”. Faculty of Mechanical Engineering, College of Engineering, University of Tehran, Tehran, Iran.
[11] M A Hossain, F Hasan, A F M T Seraz, and S A Rajib, "Development of Design and Manufacturing of a Fixed Wing Radio Controlled Micro Air Vehicle (MAV)”. Asst. Professor, Department of Mechanical Engineering, Military Institute of Science and Technology.
[12] Eric Parsons, 2005. “Investigation and Characterization of a Cycloidal Rotor for Application to a Micro Air Vehicle”. Professor/Advisor, Inderjit Chopra Department of Aerospace Engineering Master of Science
[13] John D. Anderson, 2005 “computational Fluid Dynamics the basics with Applications”, McGraw Hill Inc. International Edition.
[14] University of Florida MAV Site, Last Modified: 17 Dec 99, Available: http://www.aero.ufl.edu/~issmo/mav/mav.htm.
[15] Notre Dame Micro Aerial Vehicle Development Group, Available: http://www.nd.edu/~mav/.
[16] BYU MAV Site, Available: http://www.me.byu.edu/mav/
[17] Arizona State University MAV Competition 2000, Available: http://www.eas.asu.edu/~uav/main.html
[18] Blondin, Sean M, I DeBarros, M Falcone, D Henry, K McWilliams, S Seney, J Wong, WPI MQP, 2001 “Design of Micro-Aerial Vehicle”.
[19] Laitone, E. V, AIAA Journal, Vol. 34. 9, Sept. 1996, “Aerodynamic Lift at Reynolds Numbers Below 7*104”.
A Brief Author Biography Mr. Somashekar V, a well-known Asst. Professor and Researcher. He has completed his M.Tech from MVJCE, Bangalore. Mr. Somashekar V. He has a mixed experience of industry as well as teaching in the area of Mechanical and Aeronautical Engineering. He has published several research papers in national & international Journals and conferences. His Areas of research interest includes: Aerodynamics, CFD, Heat Transfer, Fluid Mechanics and Vibration.