
A comprehensive transcript index of the human genome generated using microarrays and computational...
17
Genome Biology 2004, 5:R73 comment reviews reports deposited research refereed research interactions information Open Access 2004 Schadt et al. Volume 5, Issue 10, Article R73 Research A comprehensive transcript index of the human genome generated using microarrays and computational approaches Eric E Schadt ¤* , Stephen W Edwards ¤* , Debraj GuhaThakurta * , Dan Holder † , Lisa Ying † , Vladimir Svetnik † , Amy Leonardson * , Kyle W Hart ‡ , Archie Russell * , Guoya Li * , Guy Cavet * , John Castle * , Paul McDonagh § , Zhengyan Kan * , Ronghua Chen * , Andrew Kasarskis * , Mihai Margarint * , Ramon M Caceres * , Jason M Johnson * , Christopher D Armour * , Philip W Garrett-Engele * , Nicholas F Tsinoremas ¶ and Daniel D Shoemaker * Addresses: * Rosetta Inpharmatics LLC, 12040 115th Avenue NE, Kirkland, WA 98034, USA. † Merck Research Laboratories, W42-213 Sumneytown Pike, POB 4, Westpoint, PA 19846, USA. ‡ Rally Scientific, 41 Fayette Street, Suite 1, Watertown, MA 02472, USA. § Amgen Inc, 1201 Amgen Court W, Seattle, WA 98119, USA. ¶ The Scripps Research Institute, Jupiter, FL 33458, USA. ¤ These authors contributed equally to this work. Correspondence: Eric E Schadt. E-mail: [email protected]. Daniel D Shoemaker. E-mail: [email protected] © 2004 Schadt et al.; licensee BioMed Central Ltd. This is an Open Access article distributed under the terms of the Creative Commons Attribution License (http://creativecommons.org/licenses/by/2.0), which permits unrestricted use, distribution, and reproduction in any medium, provided the original work is properly cited. A comprehensive transcript index of the human genome generated using microarrays and computational approaches <p>Computational and microarray-based experimental approaches were used to generate a comprehensive transcript index for the human genome. Oligonucleotide probes designed from approximately 50,000 known and predicted transcript sequences from the human genome were used to survey transcription from a diverse set of 60 tissues and cell lines using ink-jet microarrays. Further, expression activity over at least six conditions was more generally assessed using genomic tiling arrays consisting of probes tiled through a repeat-masked version of the genomic sequence making up chromosomes 20 and 22.</p> Abstract Background: Computational and microarray-based experimental approaches were used to generate a comprehensive transcript index for the human genome. Oligonucleotide probes designed from approximately 50,000 known and predicted transcript sequences from the human genome were used to survey transcription from a diverse set of 60 tissues and cell lines using ink- jet microarrays. Further, expression activity over at least six conditions was more generally assessed using genomic tiling arrays consisting of probes tiled through a repeat-masked version of the genomic sequence making up chromosomes 20 and 22. Results: The combination of microarray data with extensive genome annotations resulted in a set of 28,456 experimentally supported transcripts. This set of high-confidence transcripts represents the first experimentally driven annotation of the human genome. In addition, the results from genomic tiling suggest that a large amount of transcription exists outside of annotated regions of the genome and serves as an example of how this activity could be measured on a genome-wide scale. Conclusions: These data represent one of the most comprehensive assessments of transcriptional activity in the human genome and provide an atlas of human gene expression over a unique set of gene predictions. Before the annotation of the human genome is considered complete, however, the previously unannotated transcriptional activity throughout the genome must be fully characterized. Published: 23 September 2004 Genome Biology 2004, 5:R73 Received: 4 May 2004 Revised: 7 July 2004 Accepted: 16 August 2004 The electronic version of this article is the complete one and can be found online at http://genomebiology.com/2004/5/10/R73
-
Upload
independent -
Category
Documents
-
view
2 -
download
0
Transcript of A comprehensive transcript index of the human genome generated using microarrays and computational...
com
ment
reviews
reports
deposited research
refereed researchinteractio
nsinfo
rmatio
n
Open Access2004Schadtet al.Volume 5, Issue 10, Article R73ResearchA comprehensive transcript index of the human genome generated using microarrays and computational approachesEric E Schadt¤*, Stephen W Edwards¤*, Debraj GuhaThakurta*, Dan Holder†, Lisa Ying†, Vladimir Svetnik†, Amy Leonardson*, Kyle W Hart‡, Archie Russell*, Guoya Li*, Guy Cavet*, John Castle*, Paul McDonagh§, Zhengyan Kan*, Ronghua Chen*, Andrew Kasarskis*, Mihai Margarint*, Ramon M Caceres*, Jason M Johnson*, Christopher D Armour*, Philip W Garrett-Engele*, Nicholas F Tsinoremas¶ and Daniel D Shoemaker*
Addresses: *Rosetta Inpharmatics LLC, 12040 115th Avenue NE, Kirkland, WA 98034, USA. †Merck Research Laboratories, W42-213 Sumneytown Pike, POB 4, Westpoint, PA 19846, USA. ‡Rally Scientific, 41 Fayette Street, Suite 1, Watertown, MA 02472, USA. §Amgen Inc, 1201 Amgen Court W, Seattle, WA 98119, USA. ¶The Scripps Research Institute, Jupiter, FL 33458, USA.
¤ These authors contributed equally to this work.
Correspondence: Eric E Schadt. E-mail: [email protected]. Daniel D Shoemaker. E-mail: [email protected]
© 2004 Schadt et al.; licensee BioMed Central Ltd. This is an Open Access article distributed under the terms of the Creative Commons Attribution License (http://creativecommons.org/licenses/by/2.0), which permits unrestricted use, distribution, and reproduction in any medium, provided the original work is properly cited.A comprehensive transcript index of the human genome generated using microarrays and computational approaches<p>Computational and microarray-based experimental approaches were used to generate a comprehensive transcript index for the human genome. Oligonucleotide probes designed from approximately 50,000 known and predicted transcript sequences from the human genome were used to survey transcription from a diverse set of 60 tissues and cell lines using ink-jet microarrays. Further, expression activity over at least six conditions was more generally assessed using genomic tiling arrays consisting of probes tiled through a repeat-masked version of the genomic sequence making up chromosomes 20 and 22.</p>
Abstract
Background: Computational and microarray-based experimental approaches were used togenerate a comprehensive transcript index for the human genome. Oligonucleotide probesdesigned from approximately 50,000 known and predicted transcript sequences from the humangenome were used to survey transcription from a diverse set of 60 tissues and cell lines using ink-jet microarrays. Further, expression activity over at least six conditions was more generallyassessed using genomic tiling arrays consisting of probes tiled through a repeat-masked version ofthe genomic sequence making up chromosomes 20 and 22.
Results: The combination of microarray data with extensive genome annotations resulted in a setof 28,456 experimentally supported transcripts. This set of high-confidence transcripts representsthe first experimentally driven annotation of the human genome. In addition, the results fromgenomic tiling suggest that a large amount of transcription exists outside of annotated regions ofthe genome and serves as an example of how this activity could be measured on a genome-widescale.
Conclusions: These data represent one of the most comprehensive assessments oftranscriptional activity in the human genome and provide an atlas of human gene expression overa unique set of gene predictions. Before the annotation of the human genome is consideredcomplete, however, the previously unannotated transcriptional activity throughout the genomemust be fully characterized.
Published: 23 September 2004
Genome Biology 2004, 5:R73
Received: 4 May 2004Revised: 7 July 2004Accepted: 16 August 2004
The electronic version of this article is the complete one and can be found online at http://genomebiology.com/2004/5/10/R73
Genome Biology 2004, 5:R73
R73.2 Genome Biology 2004, Volume 5, Issue 10, Article R73 Schadt et al. http://genomebiology.com/2004/5/10/R73
BackgroundThe completion of the sequencing of the human, mouse andother genomes has enabled efforts to extensively annotatethese genomes using a combination of computational andexperimental approaches. Generating a comprehensive list oftranscripts coupled with basic information on where the dif-ferent transcripts are expressed is an important first steptowards annotating a genome once it has been fullysequenced. The task of identifying the transcribed regions ofa sequenced genome is complicated by the fact that tran-scripts are composed of multiple short exons that are distrib-uted over much larger regions of genomic DNA. Thischallenge is underscored by the widely divergent predictionsof the number of genes in the human genome. For example,direct clustering of human expressed sequence tag (EST)sequences has predicted as many as 120,000 genes [1],whereas sampling and sequence-similarity-based methodshave predicted far lower numbers, ranging from 28,000 to35,000 genes [2-5], and a hybrid approach has suggested anintermediate number [6]. Furthermore, the availability of acompleted draft sequence of the human genome has yieldedneither a proven method for gene identification nor a defini-tive count of human genes. Two initial analyses of the humangenome sequence that used strikingly different methods bothsuggested the human genome contains 30,000 to 40,000genes [2,3]. However, a direct comparison of the predictedgenes revealed agreement in the identification of well-charac-terized genes but little overlap of the novel predictions. Spe-cifically, 84% of the RefSeq transcripts agreed with fewerthan 20% of the predicted transcripts matching between thetwo analyses. This result suggests that, individually, thesedatasets are incomplete and that the human genome poten-tially contains substantially more unidentified genes [7].
Several recent studies have highlighted the limitations of rely-ing solely on computational approaches to identify genes inthe draft of the human genome [8-13]. Furthermore, substan-tial experimental data from direct assays of gene expressionprovide evidence for many genes that would not have beenrecognized in the analyses just mentioned. Saha and col-leagues used a new LongSAGE technology to provide strongevidence that there are thousands of genes left to be discov-ered in the human genome [9]. Specifically, they sequencedover 27,000 tags from a human colorectal cell line that col-lapsed down to 5,641 unique groups. Interestingly, only 61%(3,419) of the tags matched known or predicted genes,whereas 10% (575) matched novel internal exons and 14%(803) appear to represent completely novel genes [9]. Theyextrapolate from these data to predict as many as 7,500 exonsfrom previously unrecognized genes. A recent analysis byCamargo et al. [8] also indicates that we are far from defininga complete catalog of human genes based on the analysis of700,000 ORESTES (Open Reading Frame ESTs) that wererecently released into GenBank. Finally, Kapranov and col-leagues recently constructed genome-tiling arrays for humanchromosomes 21 and 22 to comprehensively query
transcription activity over 11 human tissues and cell lines[10]. They detected significant, widespread expression activ-ity over a substantial proportion of these chromosomes out-side of all known and predicted gene regions.
Most current methods in widespread use for identifying novelgenes in genomic sequence depend on sequence similarity toexpressed sequence and protein data. For example, ab initioprediction programs operate by recognizing coding potentialin stretches of genomic sequence, where the recognition capa-bility of these programs depends on a training set of knowncoding regions [14]. Therefore, genes identified by ab initioprediction programs or assembled from EST data are alsoinaccurate or incomplete much of the time [10-12]. While abinitio prediction programs perform well at identifying knowngenes, predictions that do not use existing expressedsequence and protein data often miss exons, incorrectly iden-tify exon boundaries, and fail to accurately detect the 3' and 5'untranslated regions UTRs [14]. Similarly, EST data may bebiased towards the 3' or 5' UTR [13]. These deficiencies areaddressed in full-length gene cloning strategies [13], but clon-ing is still a laborious process which could be accelerated if wewere able to start from a more accurate view of a putative gene[13].
Recently, several groups have used microarrays to test com-putational gene predictions experimentally and to tile acrossgenomic sequence to discover the transcribed regions in thehuman and other genomes [10-12,15-17]. These array-basedapproaches detected widespread transcriptional activity out-side of the annotated gene regions in the human, Arabidopsisthaliana and Escherichia coli genomes. The recent sequenc-ing and analysis of the mouse genome indicates extensivehomology between intergenic regions of the human andmouse genomes, further highlighting the potential for otherclasses of transcribed regions [18]. Interestingly, recent tilingdata suggests that many of these conserved intergenic regionsare transcribed [15,16].
In the study reported here, we describe hybridization resultsgenerated from two large microarray-based gene-expressionexperiments involving predicted transcript arrays spanningthe entire human genome and a comprehensive set ofgenomic tiling arrays for human chromosomes 20 and 22.mRNA samples collected from a diversity of conditions wereamplified using a strand-specific labeling protocol that wasoptimized to generate full-length copies of the transcripts.Analyses of the resulting hybridization data from both sets ofarrays revealed widespread transcriptional activity in bothknown or high-confidence predicted genes, as well as regionsoutside current annotations. The results from this analysisare summarized with respect to published genes on chromo-somes 20 and 22 in addition to our own extensive set ofgenome alignments and gene predictions. Combining compu-tational and experimental approaches has allowed us to gen-erate a comprehensive transcript index for the human
Genome Biology 2004, 5:R73

http://genomebiology.com/2004/5/10/R73 Genome Biology 2004, Volume 5, Issue 10, Article R73 Schadt et al. R73.3
com
ment
reviews
reports
refereed researchdepo
sited researchinteractio
nsinfo
rmatio
n
genome, which has been a valuable resource for guiding ourarray design and full-length cloning efforts. In addition, theexpression data from the 60 conditions provides a compre-hensive atlas of human gene expression over a unique set ofgene predictions [19].
ResultsGenerating a comprehensive transcript index of the human genomeFigure 1 illustrates the process we used to generate a compre-hensive transcript index (CTI) for the human genome thatrepresents just over 28,000 known and predicted transcriptswith some level of experimental validation. The first step inthis process was to generate a 'primary transcript index' (PTI)by mapping a comprehensive set of computationally andexperimentally derived annotations onto the genomicsequence. The computational predictions include the outputof gene-finding algorithms and protein similarities, while theexperimentally derived alignments are based on ESTs, serialanalysis of gene expression (SAGE), and full-length cDNAs.The resulting list of transcripts in the PTI can be looselyranked or classified into different categories, ranging fromhigh confidence to low confidence, on the basis of the level ofunderlying experimental support. The advantages of a PTI arethat the computations can be performed on a genome-widescale and it incorporates the massive amounts of publiclyavailable EST, SAGE and cDNA sequence data. However, theresulting transcript index has two significant limitations.First, the ab initio gene-finding algorithms tend to have ahigh false-positive rate when applied at a low-stringency set-ting to cast as broad a discovery net as possible. Second, gene-finding algorithms are trained on known protein-codinggenes, which may limit their ability to detect truly novelclasses of transcribed sequences.
The second step towards the CTI is the use of two differenttypes of microarrays to address these limitations (Figure 1).First, predicted transcript arrays (PTA) were used to deter-mine experimentally which of the lower-confidence predic-tions in the PTI were likely to represent real transcripts.Second, genomic tiling arrays were used to survey transcrip-tional activity in a completely unbiased and comprehensivefashion. As shown in Figure 1, the CTI plays a central part inthe subsequent design of screening arrays. These are used tomonitor RNA levels for all the transcripts across a largenumber of diverse conditions to begin the process of assign-ing biological functions to novel genes based on co-regulationwith known genes [20]. The CTI is also used to design exon/junction arrays that can be used to discover and monitoralternative splicing across different tissues and stages ofdevelopment [21].
Generating a PTITo generate the PTI, three distinct computational analysissteps were executed in parallel: predictions based on similar-
ity to expressed sequences from human and mouse; predic-tions based on similarity to all known proteins; and ab initiogene predictions. The process resulted in mapping 91% of thewell characterized genes found in the RefSeq database [22], apercentage consistent with initial genome annotation results[2,3]. The mapping results were generated by collapsing over-lapping gene models and regions of similarity to define locusprojections, which comprise the distinct transcribed regionsmaking up our PTI. While the reliance on gene predictionsand protein alignments biases the PTI towards protein-cod-ing genes, the alignment of all expressed sequences shouldrepresent many of the non-coding genes reported to date. Acomprehensive index of non-coding genes would require til-ing arrays, as described later.
All locus projections were classified into one of eight catego-ries on the basis of the level of underlying evidence fromexpressed sequence similarity, protein similarity and ab ini-tio predictions. The categories, in decreasing order of sup-port, are as follows: (1) known genes, taken as the set of 11,214human genes represented in the RefSeq database when thearrays were designed; (2) ab initio gene models withexpressed sequence and protein support; (3) ab initio genemodels with expressed sequence support; (4) ab initio genemodels with protein support; (5) alignments of expressedsequence and protein data; (6) alignments of expressedsequence data, requiring at least two overlapping expressedsequences; (7) ab initio gene models with no expressedsequence or protein support; and (8) alignments of proteindata. Because of the limitations discussed in the previous sec-tion, we considered predictions with a single line of evidence(categories 6-8) as low confidence.
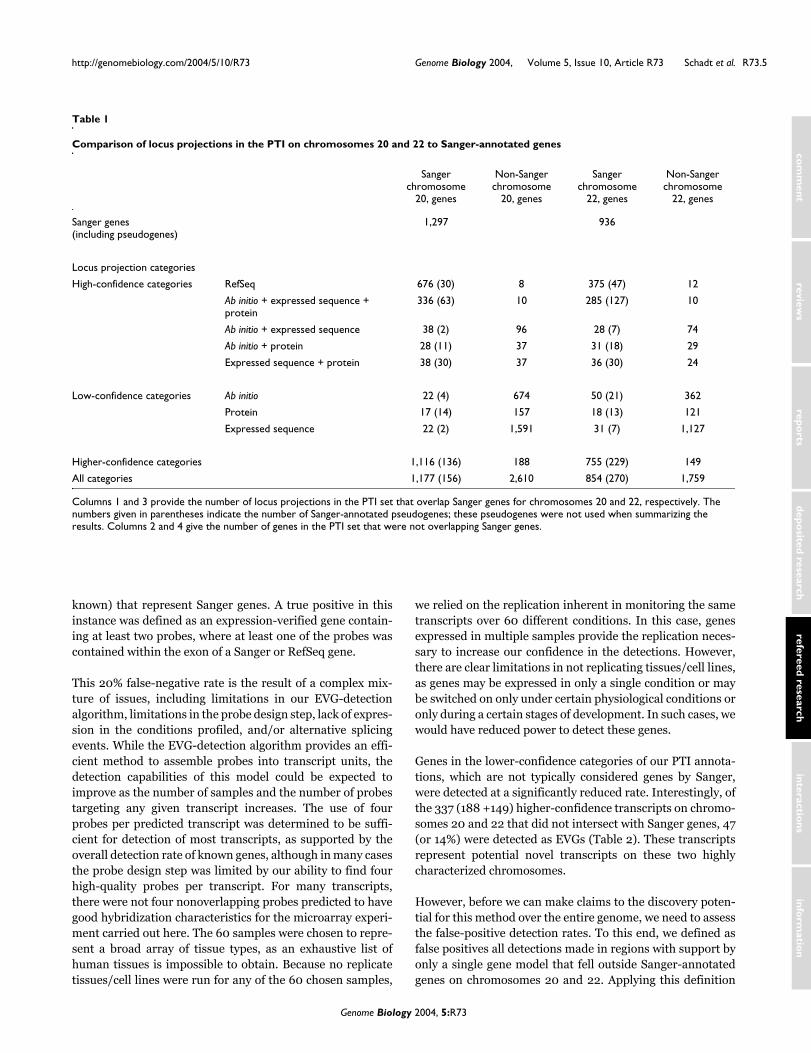
Table 1 provides summaries resulting from a comparisonbetween our PTI and the published Sanger Institute data forchromosomes 20 and 22 [23,24]. Our locus projections over-lap 1,177 of 1,297 (91%) Sanger genes on chromosome 20 and854 of 936 (91%) Sanger genes on chromosome 22, and ourpredicted exons overlap 7,306 of 7,556 (97%) and 4,819 of5,014 (96%) total Sanger chromosome 20 and 22 exons,respectively. This comparison highlights the fact that ourannotations result in the detection of both genes and exons ingenomic sequence with high sensitivity.
Predicted transcript arraysWe previously described a high-throughput, experimentalprocedure to validate predicted exons and assemble exonsinto genes by using co-regulated expression over a diversity ofconditions [11]. Here we employ a similar strategy over theentire genome by hybridizing RNA from 60 diverse tissue andcell-line samples to a set of arrays designed from the PTI. Fora complete list of the transcripts represented on the predictedtranscript arrays and 60 tissues and cell lines hybridized tothese arrays (see Additional data files 1 and 2). We designedtwo probes per exon, where possible, for exons containing thehighest-scoring probes as described in the methods from each
Genome Biology 2004, 5:R73

R73.4 Genome Biology 2004, Volume 5, Issue 10, Article R73 Schadt et al. http://genomebiology.com/2004/5/10/R73
transcript in our PTI set (on average, a total of four probes pertranscript). This was done to balance the poor specificity of abinitio gene-finding algorithms [14,25,26] against the signifi-cant microarray costs associated with large-scale gene-expression experiments. The resulting hybridization dataprovides experimental validation of those low-confidencepredicted genes that are either unsupported or minimallysupported by existing EST data, thereby providing a means ofdetermining which transcripts are included in the CTI.
Summary of predicted transcript validation on chromosomes 20 and 22We used an enhanced version of a previously described gene-detection algorithm to analyze the predicted transcript arraydataset [11]. Basically, the hybridization data from probeseach transcript from the PTI were examined to identify thosetranscripts with probes that appear to be more highly corre-lated over the 60 diverse conditions. Transcripts with probes
that behaved similarly over the different conditions testedwere considered to be expression-validated genes (EVGs).Unlike our original algorithm that used Pearson correlationsto group similarly behaving probes, our enhanced algorithmincorporated a probe-specific model to assess the most likelyset of probes making up a transcriptional unit [27] (seeMaterials and methods for details). We used the extensivepublicly available annotations on chromosomes 20 and 22 toassess the sensitivity and specificity of our array-based detec-tion procedure.
The sensitivity of our procedure was assessed by computingthe EVG detection rate for those Sanger genes that overlappredictions (locus projections) represented in our PTI (Table2). The average detection rate for our locus projections onchromosomes 20 and 22 is approximately 70% for those over-lapping Sanger genes and just over 80% for those locus pro-jections derived from RefSeq alignments (locus category =
A process to generate a comprehensive transcript index (CTI) for the human genomeFigure 1A process to generate a comprehensive transcript index (CTI) for the human genome. The first step is the assembly of a comprehensive set of annotations to generate a predicted transcript index (PTI). Sets of microarrays capable of monitoring the transcription activity over the entire genome can then be designed on the basis of the PTI. The different microarray types that can be used in this process include predicted transcript arrays (PTA), exon junction arrays (EJA) [21] and genome tiling arrays (GTA). After hybridizing a diversity of conditions onto these arrays, the transcription data are processed to identify a comprehensive set of transcripts (the CTI) and associated probes that are capable of querying all forms of transcripts that may exist in the genome. This set of probes comprises a focused set of microarrays that can be used in more standard microarray-based experiments.
Infer new biological function usingco-regulation over many condition
with genes of known function
PTI
Primary transcript index
About 50,000 known + predicted transcripts - 8 categories based onlevel of support
High Low
Key issues
Screening arrays
Expression atlas
IntronGenomic tiling arrays
3′1 2 2 4 5AAAAAAA5′ UTR
Predicted transcript arrays
Extensive public and custom genome annotations
annotations gene prediction Ab initio Genscan GrailEXP
FGENESH FGENESH++
Non-redundant protein sequences
Human MouseRefSeq
UniGeneGene index
RefSeqUniGene
Gene index
Sanger (chromosomes 20 and 22)NCBI UCSCEnsembl
CTI
Comprehensive transcript index
About 28,000 transcripts with experimental support- Complete list of transcripts- Low level of false positives
28k
CTI leads to set ofmicroarrays for
comprehensive transcription monitoring Transcript for gene of interest
5′ 3′
3′ 91 possible junction probes
14 exon probes
Transcript tiling/exon junction (splicing) arrays
Input
5′ 1 2 3 4 5 141. High false positives2. Biased towards known genes
Protein similarity
cDNA sequence similarity
Public annotation sources
ExonExon
Genome Biology 2004, 5:R73
http://genomebiology.com/2004/5/10/R73 Genome Biology 2004, Volume 5, Issue 10, Article R73 Schadt et al. R73.5
com
ment
reviews
reports
refereed researchdepo
sited researchinteractio
nsinfo
rmatio
n
known) that represent Sanger genes. A true positive in thisinstance was defined as an expression-verified gene contain-ing at least two probes, where at least one of the probes wascontained within the exon of a Sanger or RefSeq gene.
This 20% false-negative rate is the result of a complex mix-ture of issues, including limitations in our EVG-detectionalgorithm, limitations in the probe design step, lack of expres-sion in the conditions profiled, and/or alternative splicingevents. While the EVG-detection algorithm provides an effi-cient method to assemble probes into transcript units, thedetection capabilities of this model could be expected toimprove as the number of samples and the number of probestargeting any given transcript increases. The use of fourprobes per predicted transcript was determined to be suffi-cient for detection of most transcripts, as supported by theoverall detection rate of known genes, although in many casesthe probe design step was limited by our ability to find fourhigh-quality probes per transcript. For many transcripts,there were not four nonoverlapping probes predicted to havegood hybridization characteristics for the microarray experi-ment carried out here. The 60 samples were chosen to repre-sent a broad array of tissue types, as an exhaustive list ofhuman tissues is impossible to obtain. Because no replicatetissues/cell lines were run for any of the 60 chosen samples,
we relied on the replication inherent in monitoring the sametranscripts over 60 different conditions. In this case, genesexpressed in multiple samples provide the replication neces-sary to increase our confidence in the detections. However,there are clear limitations in not replicating tissues/cell lines,as genes may be expressed in only a single condition or maybe switched on only under certain physiological conditions oronly during a certain stages of development. In such cases, wewould have reduced power to detect these genes.
Genes in the lower-confidence categories of our PTI annota-tions, which are not typically considered genes by Sanger,were detected at a significantly reduced rate. Interestingly, ofthe 337 (188 +149) higher-confidence transcripts on chromo-somes 20 and 22 that did not intersect with Sanger genes, 47(or 14%) were detected as EVGs (Table 2). These transcriptsrepresent potential novel transcripts on these two highlycharacterized chromosomes.
However, before we can make claims to the discovery poten-tial for this method over the entire genome, we need to assessthe false-positive detection rates. To this end, we defined asfalse positives all detections made in regions with support byonly a single gene model that fell outside Sanger-annotatedgenes on chromosomes 20 and 22. Applying this definition
Table 1
Comparison of locus projections in the PTI on chromosomes 20 and 22 to Sanger-annotated genes
Sanger chromosome
20, genes
Non-Sanger chromosome
20, genes
Sanger chromosome
22, genes
Non-Sanger chromosome
22, genes
Sanger genes (including pseudogenes)
1,297 936
Locus projection categories
High-confidence categories RefSeq 676 (30) 8 375 (47) 12
Ab initio + expressed sequence + protein
336 (63) 10 285 (127) 10
Ab initio + expressed sequence 38 (2) 96 28 (7) 74
Ab initio + protein 28 (11) 37 31 (18) 29
Expressed sequence + protein 38 (30) 37 36 (30) 24
Low-confidence categories Ab initio 22 (4) 674 50 (21) 362
Protein 17 (14) 157 18 (13) 121
Expressed sequence 22 (2) 1,591 31 (7) 1,127
Higher-confidence categories 1,116 (136) 188 755 (229) 149
All categories 1,177 (156) 2,610 854 (270) 1,759
Columns 1 and 3 provide the number of locus projections in the PTI set that overlap Sanger genes for chromosomes 20 and 22, respectively. The numbers given in parentheses indicate the number of Sanger-annotated pseudogenes; these pseudogenes were not used when summarizing the results. Columns 2 and 4 give the number of genes in the PTI set that were not overlapping Sanger genes.
Genome Biology 2004, 5:R73

R73.6 Genome Biology 2004, Volume 5, Issue 10, Article R73 Schadt et al. http://genomebiology.com/2004/5/10/R73
over all transcripts in our PTI leads to a false-positive rate of3% (11 out of 406). Because we cannot exclude the possibilitythat some of the transcripts supported by a single gene modelrepresent real genes, we consider this false-detection rate asan upper bound on the actual false-positive rate. Acceptingthat the Sanger annotations represent the gold standard forchromosome 22, we detected 70% of all Sanger-annotatedgenes, while only 4% of the chromosome 22 locus projectionsthat did not intersect Sanger genes were detected by our pro-cedure, highlighting the sensitivity and specificity of thisapproach. In addition, the enrichment for EVG detections inSanger genes versus the non-Sanger PTI on chromosomes 20and 22 was extremely significant with a p-value effectivelyequal to 0 when using the chi-square test for independence(χ2 = 3,093, with 1 degree of freedom (df)).
Summarizing EVG data over the entire genome and assessingthe discovery potential. The last column of Table 2 providesthe number of expression verified genes detected over theentire genome for locus projections in our PTI. This repre-sents the most comprehensive direct experimental screeningof ab initio gene predictions ever undertaken. We can use thefalse-positive and negative rates derived above to assess thediscovery potential on that part of the genome that has notbeen as extensively characterized as chromosomes 20 and 22.First, we note that our detection rates over the genome weresimilar to that given for chromosomes 20 and 22. That is, 75%
of the category 1 genes (RefSeq genes) were detected over theentire genome, compared to 80% for chromosomes 20 and22. In total, 15,642 genes in the PTI were experimentally val-idated using this array-based approach. Assuming the false-positive rate of 3% defined above and a conservative false-negative rate of 30%, defined as the percentage of Sangergenes we failed to detect on chromosomes 20 and 22, thesedata suggest there are close to 21,675 potential coding genesrepresented in our PTI set. Because our PTI misses close to10% of the Sanger genes, we corrected this number for thosegenes not represented in this set and provide an estimate ofthe total number of protein-coding genes in the humangenome supported by our data to be approximately 25,000.This number is consistent with estimates given in the currentrelease (22.34d.1) of the Ensembl database [28,29].
However, we caution that the estimate provided is basedsolely on the data described here, and that orthogonal sourcesof data [30] continue to suggest that the actual number ofgenes will be known only after the transcriptome has beencompletely characterized.
From Table 2 we note that 2,093 (1,428 + 555 + 110) of thetranscripts that were detected as EVGs had only one line ofevidence (EST alignment, protein alignment or ab initio pre-diction). These 2,093 transcripts represent a rich source ofpotential discoveries in our PTI. To assess the potential bio-
Table 2
Summary of expression-validated genes (EVGs) from predicted transcripts over the entire human genome
Gene categories Sanger/PTI chromosome 20
Non-Sanger PTI chromosome 20
Sanger/PTI chromosome 22
Non-Sanger PTI chromosome 22
PTI genome-wide
Total Sanger genes represented
1,177 (826) 854 (575)
RefSeq 676 (552) 8 (2) 375 (290) 12 (5) 10,720 (7992)
Ab initio + expressed sequence + protein
336 (229) 10 (2) 285 (202) 10 (5) 8,801 (4269)
Ab initio + expressed sequence
38 (17) 96 (8) 28 (15) 74 (8) 3,733 (784)
Ab initio + protein 28 (9) 37 (7) 31 (16) 29 (4) 1,983 (233)
Expressed sequence + protein
38 (2) 37 (2) 36 (10) 24 (4) 1,126 (271)
Expressed sequence 22 (3) 1,591 (44) 31 (3) 1,127 (33) 7,170 (1428)
Ab initio 22 (12) 674 (39) 50 (35) 362 (17) 16,822 (555)
Protein 17 (2) 157 (7) 18 (4) 121 (4) 540 (110)
High-confidence categories
1,116 (809) 188 (21) 755 (533) 149 (26) 26,363 (13,549)
All categories 1,177 (826) 2,610 (111) 854 (575) 1,759 (80) 50,895 (15,642)
Columns 1 and 3 provide the total number of Sanger genes for each category for chromosomes 20 and 22, respectively, with the number of EVGs detected given in parentheses. Columns 2 and 4 provide the total number of LPs that did not overlap Sanger genes, with the number of EVGs detected given in parentheses. The last column provides the total number of LPs in the PTI represented on the PTA microarrays, with the number of EVGs detected over the entire genome given in parentheses.
Genome Biology 2004, 5:R73
http://genomebiology.com/2004/5/10/R73 Genome Biology 2004, Volume 5, Issue 10, Article R73 Schadt et al. R73.7
com
ment
reviews
reports
refereed researchdepo
sited researchinteractio
nsinfo
rmatio
n
logical functions of this novel gene set, we annotated transla-tions of this set by searching the domains represented in theProtein Families database (Pfam) [31]. The search resultswere used to assign each of the translations to Gene Ontology(GO) [32] codes as described in the methods. Figure 2 graph-ically depicts the breakdown of the most common GO codesfor two of the three major GO categories. These data suggestthere may still be a significant number of protein-codinggenes with important biological functions, given thatdomains/motifs represented in these predicted genes aresimilar to those found in known genes. The 339 predictionsthat were validated as EVGs and that had protein domains ofbiological interest would be natural candidates for full-lengthcloning, over the 24,532 (7,170 + 16,822 + 540 from Table 2)other lower-confidence predictions in our set.
EVG data as an expression indexBecause multiple probes in each of the approximate 50,000predicted genes in the human genome have been monitoredover 60 different tissues and cell lines, the EVG data repre-sent a significant atlas of human gene expression that is nowpublicly available [19]. For each transcript, the intensityinformation from the corresponding probes was optimallycombined as described by Johnson et al. [21] to provide aquantitative measure of the relative abundance across thepanel of 60 conditions, as shown in Figure 3.
Tiling arrays for chromosomes 20 and 22To complement the use of PTI arrays, we constructed a set ofgenome tiling arrays comprised of 60 mer oligonucleotideprobes tiled in 30 base-pair steps through both strands ofhuman chromosomes 20 and 22. Repetitive sequences iden-tified by RepeatMasker were ignored for probe design. Thesegenome tiling arrays allow for an unbiased view of the tran-scriptional activity outside of known and predicted genes onthese two chromosomes. mRNA from six (chromosome 20)or eight (chromosome 22) conditions was amplified andhybridized to the tiling arrays (see [19] and Additional datafiles 3 and 4). As with the PTI arrays, the amplification proto-col generated strand-specific cDNA copies of the transcripts,which were full-length. Using a two-step procedure, theresulting data were analyzed to detect sequences expressed inat least one condition [33]. First, we examined probe behaviorover conditions in overlapping windows of size 15,000 bp toidentify windows that probably contained transcribedsequences, using a robust principal component analysis(PCA) method [33]. Second, for regions identified as likely tocontain transcribed sequences, we attempted to discriminatebetween probes corresponding to expressed sequences(expressed 'exons') and probes corresponding to untran-scribed sequences ('introns' or intergenic sequence) using aclustering procedure on variables derived from the PCA pro-cedure [33]. All analysis results derived from this procedurewere interpreted in the light of the Sanger annotations andour custom PTI set described above.
Figure 4 provides two representative examples of tiling datafor two known Sanger genes, KDELR3 and EWRS1. In thefirst case (Figure 4a), the tiling data almost perfectly corre-spond to the RefSeq annotation of KDELR3, with just twopotential false positives out of the 178 intron probes. TheKDELR3 gene is annotated as having two alternative tran-scripts in the RefSeq database, given by the RefSeq accessionnumbers NM_006855 and NM_016657. The NCBI Acemblyalternative splicing predictions further suggest the presenceof additional isoforms of this gene (see Figure 4). One of thealternative forms, KDELR3.e, depicted in Figure 4a, includesa novel 5' exon. The presence of this exon is supported by theEST with GenBank accession number BM921831. The tilingdata for the KDELR3 gene in two conditions clearly showexpression of NM_006855 but not NM_016657, thereby reli-ably detecting distinct splice forms. Further, there is a signif-icant signal 5' to exon 2 in both transcripts that seems tosuggest a novel exon, as opposed to a true false positive. Thisputative exon exactly matches the location of the first exongiven in the Acembly prediction track noted in Figure 4a(KDELR3.e).
Figure 4b shows the tiling data for the EWSR1 gene. In con-trast to the first example, this gene has intense transcriptionalactivity outside of the annotated exons. Specifically, theEWSR1 gene has 43 potentially false-positive calls out of 203intron probes. However, the EST data and alternative splicingpredictions strongly suggest that these probes represent bio-logically relevant transcriptional activity. As with theKDELR3 gene, EWRS1 is annotated by RefSeq as having twotranscripts: NM_005243 and NM_013986. The Acemblypredictions identify four additional alternative splice forms;most noteworthy among these are EWSR1.b and EWSR.g,shown in Figure 4b. These predictions indicate thatalternative transcripts may exist for the EWSR1 gene thatessentially divide the largest transcript into two transcripts,suggesting that multiple promoter and transcription-stop sig-nals are present in this gene. The tiling data depicted in Fig-ure 4b shows that all exons from both RefSeq splice formswere detected. In addition, there is a region to the right ofprobe position 400 in Figure 4b that indicates significanttranscription activity but where there are no RefSeq exonsannotated. However, the green bars indicate exons that aresupported by EST data as well as the EWSR.b and EWSR.gpredicted alternative splice forms, providing experimentalsupport that these predictions represent actual isoforms ofthis gene. In fact, these data may provide a more accurate rep-resentation of the putative structure of this gene, as they sup-port multiple alternatively spliced transcripts in this gene,beyond what has already been annotated in the RefSeq data-base. In all, 5% of the probes detected as expressed in intronicsequence mapped to predicted alternative splice forms. Giventhe extent of alternative splicing that is yet to be characterized[21], we believe a significant proportion of the 'intron' tran-scriptional activity in our data may represent alternativesplicing.
Genome Biology 2004, 5:R73

R73.8 Genome Biology 2004, Volume 5, Issue 10, Article R73 Schadt et al. http://genomebiology.com/2004/5/10/R73
Gene Ontology (GO) classification of novel expression-validated genes (EVGs)Figure 2Gene Ontology (GO) classification of novel expression-validated genes (EVGs). EVGs not supported by the expressed sequence data (2,093) were submitted to a search against the Pfam database. Those with significant alignments (339) were assigned GO codes based on Pfam. The pie charts show the distribution of GO terms within this set of EVGs. Note that the total number of GO terms in each category is greater than the number of EVGs because of assignment of multiple GO terms to some EVGs. (a) Distribution of the different 'biological process' GO codes assigned to the EVGs with significant hits to the Pfam database: a total of 526 GO terms. (b) Distribution of the different 'molecular function' GO codes assigned to the EVGs with significant hits to the Pfam database: a total of 374 GO terms.
47%
37%
7%
5%3%
41%
20%
12%
7%
6%
5%
3%3% 2%
Physiological processes Metabolism Cell communication TransportCell cycle Developmental processes Stress response Death
Enzyme Nucleic acid binding Structural molecule TransporterSignal transducer Ligand binding or carrier Enzyme regulator Transcription regulator Motor Toxin Cell adhesion molecule Defense/immunity protein Molecular_function unknown
(a) Biological process
(b) Molecular function
1%
1%
Genome Biology 2004, 5:R73

http://genomebiology.com/2004/5/10/R73 Genome Biology 2004, Volume 5, Issue 10, Article R73 Schadt et al. R73.9
com
ment
reviews
reports
refereed researchdepo
sited researchinteractio
nsinfo
rmatio
n
Summarizing the tiling resultsOur genome tiling arrays consisted of 2,119,794 and1,201,632 probes for chromosomes 20 and 22, respectively.Of these, 1,615,034 probes fell into Sanger gene regions, with239,542 probes actually overlapping Sanger exons. Understringent criteria 64,241 probes were detected as expressed,with 34,245 of these falling within Sanger exons, 18,551 fall-ing within Sanger introns, and 15,835 probes falling com-pletely outside all Sanger annotations. This widespreadtranscriptional activity outside annotated regions of thehuman genome is consistent with other reports from multiplespecies [10,12,15,16]. Overall, at least one exon in each of 876Sanger genes was detected as expressed out of 1,703 totalgenes covered by probes (excluding annotated pseudogenes),leading to an overall gene detection rate of 52%. The bias ofprobes identified as exon probes that actually fall in exons isstriking, given that exons comprise roughly 2% of thegenomic sequence (the p-value for this enrichment using theFisher exact test is less than 10-15). To estimate the upperbound of false-positive calls, we counted as false-positive
events each probe identified as expressed by the detectionprocess, but falling within an annotated intron of the RefSeqgenes we detected as expressed. This resulted in an estimatedfalse-positive rate of 1.3%.
As indicated in Figure 4, a percentage of these false-positivecalls will be due to unannotated isoforms of genes. Others stillwill be due to cross-hybridization of the intron probes togenes in other parts of the genome. We consider cross-hybridization as made up of two components: specific cross-hybridization resulting from transcripts with similar, usuallyhomologous, sequences; and nonspecific cross-hybridizationresulting from the base composition of the probe sequence(J.C. and G.C., unpublished work). Of the intron probesdetected as expressed, 23% had sequence similarities toknown transcripts considered to render them susceptible tospecific cross-hybridization, and 17% contained sequence fea-tures associated with nonspecific cross-hybridization.Accounting for probes that were positive for both specific andnonspecific cross-hybridization, we are left with 55% of the
Utilizing PTA data as an expression indexFigure 3Utilizing PTA data as an expression index. Absolute transcript abundance over the 60 conditions described in [19] for two expression-supported transcripts. RLP09885002 represents a known gene (ATP1A1, ATPase, Na+/K+ transporting, alpha 1 polypeptide) whereas RLP10406004 was supported solely by gene model predictions before microarray validation.
RLP09885002 RLP10406004
Genome Biology 2004, 5:R73

R73.10 Genome Biology 2004, Volume 5, Issue 10, Article R73 Schadt et al. http://genomebiology.com/2004/5/10/R73
probes detected as expressed in the introns of Sanger genesthat cannot easily be explained as alternative splicing orcross-hybridization. These data support recent observationsthat significant levels of transcription exist within the intronsof known genes [15,16].
For those probes falling outside all Sanger genes, we againmade use of our custom genome annotations to help interpret
the extent of transcriptional activity in these regions. Table 3summarizes the detections made for each of the categoriesdescribed above. Filtering probes using the same cross-hybridization predictors described above suggests that 65%of those probes falling outside all annotations are not likely tobe the result of cross-hybridization. Furthermore, for thosedetections that overlap low-confidence locus projections inour PTI, we used the classification procedure discussed above
Examples of tiling results for known genesFigure 4Examples of tiling results for known genes. The colored bars across the bottom of the data window are color matched with the corresponding exon annotations shown in the genome viewer. (a) The KDELR3 gene shows strong agreement between the public transcript annotations and the tiling results. The top panel represents a screen shot from the UCSC genome browser [60] highlighting KDLER3. The bottom panel represents transcription activity as raw intensities (y-axis) for each probe used to tile through KDLER3 (x-axis), in one of the eight conditions monitored by the genomic tiling arrays. (b) The EWRS1 gene potentially contains a larger number of false-positive predictions, but more probably lends additional experimental support to previously predicted alternative splice forms (EWSR.b and EWSR.g), giving a more accurate representation of the putative structure of this gene. The top panel represents a screen shot from the UCSC genome browser [60] highlighting EWRS1. The bottom panel represents transcription activity as raw intensities (y-axis) for each probe used to tile through EWSR1 (x-axis), in one of the eight conditions monitored by the genomic tiling arrays. (c) Conserved regions between mouse and human upstream of the beta-actin gene. The tiling data readily detect all of the transcribed parts of the gene, but not the conserved regulatory regions. The green bars in the probe-intensity plot represent the annotated transcribed regions for the beta-actin gene, while the blue bars indicate regions that are not known to be transcribed. The lower section shows the sequence conservation between human and mouse as obtained through the program rVISTA [36,61]. Conserved coding (blue peaks) and non-coding regions (red peaks) are shown where the two genomic sequences align with 75% identity over 100-bp windows. The rows marked ELK, ETF, and SRF show binding sites for these transcription factors predicted using TRANSFAC matrix models and the MATCHTM program, which are part of the rVISTA suite. The exons for the gene are shown in blue.
Predicted alternativesplice form: EWSR1.
Predicted alternativesplice form: EWSR1.
Indication of novel alternative splicing
ELK
ETF
SRF
Probe position
Pro
be In
tens
ity
0 200 400 600
020
0060
0010
000
Exons overlapping NM_005243 and NM_013986Exons to NM_005243 onlyPotential RefSeq-unannotated alt spliced exon
Probe position
Pro
be in
tens
ity0
500
1500
2500
Alternative Splicing in the KDELR3 Gene
Exons overlapping NM_006855 and NM_016657Exons to NM_016657 onl yExons to NM_006855 onl yPotential RefSeq-unannotated alt spliced exon
Probe position
Pro
be in
tens
ity
020
000
4000
060
000
0
0 50 100 150 200 250
50 100 150 200
(a) (b)
(c)
Genome Biology 2004, 5:R73

http://genomebiology.com/2004/5/10/R73 Genome Biology 2004, Volume 5, Issue 10, Article R73 Schadt et al. R73.11
com
ment
reviews
reports
refereed researchdepo
sited researchinteractio
nsinfo
rmatio
n
to assign GO codes to these transcripts. Only seven of the 297transcribed regions detected outside of all Sanger genes viathe tiling results (see Table 3) contained GO protein domains.This suggests that a large fraction of the transcriptionalactivity detected using tiling arrays is non-coding and ofunknown biological function [15,34].
Tiling data help classify conserved sequences between speciesOne further advantage of the tiling data is that they can beused to discriminate between transcribed and non-tran-scribed sequences conserved between human and mouse, orbetween any other pair of species. Figure 4c highlights tilingdata under one condition for the beta-actin gene, a gene thatis constitutively expressed in all tissues and often serves as apositive control in mRNA and protein expression experi-ments. The genomic region containing the complete beta-actin mRNA and 10 kilobases (kb) of genomic sequenceupstream of the transcription start, was obtained from themouse and human genomes, aligned using the AVID program[35] and then fed into the rVista program [36]. From this, weidentified the conserved regions in this gene between mouseand human, including several relevant transcription factorbinding domains that are key to the transcriptional regulationof this gene [37-39]. As can be seen directly from the figure,
the exons are all detected as highly expressed, but none of theconserved transcription factor regions shows activity. Thiscombination of expressed sequence in close proximity to con-served regions that are not expressed (as determined by thetiling data), offers another powerful advantage of the tilingdata in discriminating among the possible roles of conservedsequences.
DiscussionA complete understanding of the human genome will onlycome after all genes have been identified and the functions ofthose genes have been determined. There has been muchrecent progress in defining the human transcriptome with abinitio methods, sequencing of EST libraries, full-length genecloning projects, and comparative analyses between fullysequenced genomes of different species. However, we are stilla long way from having a comprehensive set of annotationsfor the human and other genomes. There is need for newhigh-throughput experimental approaches to accelerate theprocess of annotating sequenced genomes in acomprehensive and accurate fashion. Toward this goal, wehave used two microarray-based experimental approaches toprovide evidence of widespread transcription activity outsideof any known or predicted genes in the human genome. We
Table 3
Summary of transcription activity detected from the chromosome 20 and 22 genome tiling data
Locus projection categories Sanger tiling chromosome 20
Non-Sanger tiling chromosome 20
Sanger tiling chromosome 22
Non-Sanger tiling chromosome 22
Total Sanger genes 1,278 933
Sanger category 1 577 (398) 368 (184)
Sanger category 2 155 (32) 121 (60)
Sanger category 3 338 (150) 144 (52)
Sanger category 4 161 (117) 294 (138)
RefSeq 3 0
Ab initio + expressed sequence + protein
1 0
Ab initio + expressed sequence 15 8
Ab initio + protein 6 4
Expressed sequence + protein 4 1
Ab initio 71 26
protein 11 21
Expressed sequence 80 46
Outside all annotations* 1,936 1,058
High-confidence categories NA 25 NA 12
All annotation categories 1,231 (697) 191 927 (434) 106
*Number of probes detected as components of EVGs. Columns 1 and 3 provide the number of Sanger genes represented on the genome tiling arrays for chromosomes 20 and 22, respectively, with the number of genes detected given in parentheses. Columns 2 and 4 provide the number of LPs not overlapping Sanger genes that were detected on chromosomes 20 and 22, respectively. NA, not applicable.
Genome Biology 2004, 5:R73
R73.12 Genome Biology 2004, Volume 5, Issue 10, Article R73 Schadt et al. http://genomebiology.com/2004/5/10/R73
have also provided experimental support for many ab initiopredicted genes that have no other or minimal experimentalsequence support, suggesting a small but significant class ofgenes that have evaded all other forms of experimental detec-tion. Similar identifications have been made recently in thefirst extensive comparative analysis between mouse andhuman genomes [18]. Despite the extent of novel discovery,our data suggest there are only 25,000-30,000 protein-cod-ing genes in the human genome, with perhaps an equalnumber of non-coding transcripts that may serve importantregulatory roles [34,40]. Finally, our data indicate wide-spread alternative splicing across known genes, providing aglimpse into the extent of transcript complexity that may existin mammalian genomes.
We have used the expression data for the approximate50,000 predicted transcripts hybridized to 60 diverse condi-tions in combination with genomic tiling data to generate aCTI containing 28,456 experimentally supported transcripts.The transcripts represented in the CTI include allcomputational predictions with two or more lines of evidencefrom our PTI (independent of microarray validation), in addi-tion to the overlapping set of 15,642 transcripts detected asEVGs. This resulting comprehensive list of known and pre-dicted transcripts provides the starting point for large-scalesystematic studies to determine the biological function ofgenes in both normal and disease states. The primary goal ofthe CTI is to allow researchers to focus experimental effortson a comprehensive set of genes that are likely to be real.
It is of note that between the time the predicted transcriptarrays were designed and annotated using the customgenome annotations described above, and the time this workwas published, more than 6,000 genes were added to the Ref-Seq collection. These newer RefSeq genes were representedby 5,100 locus projections in our original PTI that were notclassified in the RefSeq category. Interestingly, 4,212 weredetected as EVGs in the present analysis and had already beenincluded in our CTI, a validation rate slightly greater than82%. Only 19% of the non-RefSeq genes in our PTI had beendetected as EVGs (see Table 2), yet more than 82% of the newRefSeq genes coming from this set were detected as EVGs.This result speaks to the utility of the microarray-basedapproach to gene validation described here (see Additionaldata file 5 for a complete breakdown of validation rates bycategory).
While using microarrays to test computational gene predic-tions experimentally has the advantage of being economicallyfeasible across the whole genome, the tiling data represent amore comprehensive and unbiased view of transcription. Ourdata indicate widespread transcriptional activity in theintrons of annotated genes and in intergenic regions, where asignificant proportion of this activity can be explained bynonspecific and specific cross-hybridization. The transcrip-tional activity noted for our low-onfidence transcripts in the
PTI indicates that 25% of the activity we observe may be cod-ing for proteins that are at least somewhat related to existingprotein data. Much of the transcription activity we have notedin the introns of genes may also represent uncharacterizedalternative splicing, and potentially novel genes, in additionto specific and nonspecific cross-hybridization.
ConclusionsAt present, predicted transcript arrays allow for the discoveryof most protein-coding genes genome wide when many differ-ent conditions are considered. Until the discovery andcharacterization of these protein-coding genes is completed,this method will continue to be a cost-effective solution todrive such discovery. In contrast, genomic tiling represents acompletely unbiased method for monitoring transcriptionalactivity in genomes, but due to cost will probably be limited toscreening a smaller number of conditions. However, as noveltranscription regions are identified from the tiling data, theseregions can be represented on predicted transcript arrays thatare hybridized over many more conditions, as described inFigure 1. As the microarray technologies have evolved, tilingthe entire human genome is now possible, with such effortspresently being supported by the ENCODE (Encyclopedia ofDNA Elements) project of the National Human GenomeResearch Institute (NHGRI) [41].
We believe the steps taken here are necessary for querying allpotential transcription activity in the genome, for the purposeof identifying novel genes, more completely characterizingexisting genes, and identifying a more comprehensive set ofprobes for these genes that can be used to monitortranscription abundances in more standard gene expressionstudies. Not all uses of microarrays demand an exhaustiverepresentation of probes to all genes in the genome understudy. However, experiments that seek to identify key driversof pathways [42] or that seek to discriminate between alterna-tive splice forms of genes within a given tissue [21] require amore comprehensive set of arrays to ensure success. Thesedata provide an essential first step to generating a compre-hensive set of arrays that are based on experimental supportcombined with computational annotation, instead of relyingsolely on the latter. These comprehensive arrays will be inval-uable as we seek to better understand mechanisms of actionfor existing and novel drug targets and elucidate pathwaysunderlying complex diseases. In addition, further study of theextensive noncoding RNA identified via the methodsdescribed here and elsewhere [10,12,15,16] is likely to opennew fields of biology as the functional roles for these entitiesare determined.
Materials and methodsData preparationThe NCBI 8/2001 assembly of the human genome was theinput data for this analysis. The 4/21/1999 release of Repeat-
Genome Biology 2004, 5:R73
http://genomebiology.com/2004/5/10/R73 Genome Biology 2004, Volume 5, Issue 10, Article R73 Schadt et al. R73.13
com
ment
reviews
reports
refereed researchdepo
sited researchinteractio
nsinfo
rmatio
n
Masker [43] was used to mask for human repeats. An internaldatabase of RNA genes and bacterial and vector sequenceswas aligned to the genome with BLASTN. Genomic sequenceswith 95% or higher identity over at least 50 bases weremasked. No probes were designed from masked regions.
Gene index productionTo predict genes on the basis of expressed sequence similar-ity, we first clustered and aligned all expressed human andmouse sequences in GenBank to create a human gene index(HGI) and a mouse gene index (MGI). Clustering and align-ment were performed with the DoubleTwist Clustering andAlignment Tools (CAT) [44]. Input data included all mouseand human RefSeq mRNA sequences, and EST and mRNAsequences from GenBank release 124, masked as describedabove for repeats and contaminating sequences. For eachspecies, the CAT software first clustered sequences and thendefined subclusters on the basis of a multiple sequence align-ment. The subclusters represent candidate alternativelyspliced gene transcripts. The 644,168 human and 291,656mouse sequences that were singleton ESTs or completelymasked were excluded from the HGI and MGI.
Expressed sequence mappingHuman and mouse UniGene and RefSeq, MGI, and HGIsequences were aligned with the genome first by BLASTN2.2.1 [45], followed by refinement of intron/exon boundariesby the sim4 algorithm (12/17/2000 release) [46]. Only therepresentative sequences (Hs.seq.uniq) for each UniGenecluster designated in the 3 August 2001/build 138 version ofthe UniGene database were used in this analysis. We onlyrefined BLAST alignments with an E-value of less than 10-20
for human sequences and 10-8 for mouse sequences. Forhuman UniGene and HGI, we refined only those BLAST hitswhere the target sequence showed greater than or equal to92% identity to the genomic sequence over 75 bp. For humanRefSeq, we refined hits with greater than or equal to 95%identity, and for MGI, RefSeq, and UniGene, we refined hitswith greater than or equal to 80% identity. These thresholdswere empirically determined to provide good sensitivity inaligning most sequences to the genome while limiting multi-ple alignments past those expected from paralogs present inthe human genome. In all cases percent identity was meas-ured over 75 bp. Individual sim4 exons of questionableconfidence were then removed on the basis of percent identityand length thresholds. All sequence databases were down-loaded from GenBank August, 2001.
Protein sequence mappingThe GenBank nonredundant protein database (downloaded25 August 2001) was aligned to the genomic sequence withBLASTX 2.2.1 [45] using an E-score threshold of 10-5. Adja-cent protein alignments from a single protein were groupedtogether as a prediction whenever the protein sequence coor-dinates of the alignments were consistent in direction and didnot significantly overlap.
Ab initio gene predictionGrailEXP 4.0 [47], GENSCAN 1.0 [48], FGENESH [49], andFGENESH+ [49]ab initio gene-prediction algorithms wererun independently across the entire genome assembly to aug-ment alignment-based gene identification methods.GrailEXP 4.0, GENSCAN 1.0, and FGENESH version 1.c wererun with default parameters for human sequence. GrailEXPused expressed sequence evidence from RefSeq, UniGene andDoubleTwist HGI to refine gene predictions. FGENESH+ wasrun with protein sequences from BLASTX with E-score lowerthan 10-5. When multiple protein alignments overlapped, alloverlapping protein sequences were clustered with BLAST-Clust [50] and the lowest E-score hit was used byFGENESH+.
Synthesis and analysisLocus projections contained the union of all exons from alloverlapping predictions in a contiguous region of the chromo-some that were derived from sequence alignments or gene-finding algorithms. Predictions to a given strand of thegenomic sequence that overlapped by even a single nucleotidewere grouped into a single locus projection (antisense tran-scripts were not considered in defining the locus projections).The criteria for grouping predictions were intentionally keptloose, given that the intent was to include as many potentialexons as possible in a given genomic region, and then use theexperimental microarray-based approach to elucidate theactual gene structure. These merged overlapping predictionsdefined the 5' and 3' ends of the locus projections. Overlap-ping predicted exons were merged to form an exon predictionof maximal extent. Low-quality predicted exons from sim4alignments that contained a high percentage of A or T wereremoved. We also removed sim4-predicted exons that over-lapped two or more predicted exons from another sim4 align-ment. Additionally, 3' sim4 and 3' or 5' FGENESH+ predictedexons that were short and/or distant from internal predictedexons were removed. Finally, locus projections that containedmRNAs from RefSeq were split at the 5' end of the RefSeqsequence.
Locus projections supported by expressed sequences alonecould be portions of 3' or 5' UTRs of genes included in theother gene-prediction categories described in the text. Tominimize the consequences of this potential artifact, we useda UTR filter to exclude locus projections from the expressedsequence alone category that were within 20 kb of a locus pro-jection supported by an ab initio gene model.
All data were loaded into a relational database to count andcategorize locus projections. At least one type of evidence wasassigned to each predicted exon for each locus projection.Multiple types of evidence were assigned to a merged pre-dicted exon if there was overlap between predicted exons ofdifferent types for at least 1% of the length of the merged exonprediction. One of the eight evidence categories discussed inthe text was assigned to each exon on the basis of the combi-
Genome Biology 2004, 5:R73
R73.14 Genome Biology 2004, Volume 5, Issue 10, Article R73 Schadt et al. http://genomebiology.com/2004/5/10/R73
nation of types of evidence. Locus projections inherited thehighest-ranking evidence category of their constituent exons.Evidence categories were ranked in the following order: Ref-seq (highest); expressed sequence + protein + ab initio;expressed sequence + ab initio; protein + ab initio; expressedsequence + protein; ab initio alone; protein alone; expressedsequence alone. FGENESH+ predictions were counted asprotein + ab initio. For the ab initio category, predictionsfrom at least two of FGENESH, GENSCAN and GrailEXPwere required to overlap in at least one exon to be merged.
Probe selection for the genome tiling and predicted transcript arraysInput sequences for probe selection were masked for vector,interspersed repeats, simple repeats, poly(A) tails,Escherichia coli contamination and human non-coding RNAand mitochrondrial DNA contamination using Scylla (Para-cel). For genomic tiling arrays, 60 mer probes were thenselected from unmasked regions of both forward and reversecomplement strands at uniform 30-base intervals. For pre-dicted transcript arrays, up to four oligonucleotide probeswere selected from the unmasked regions of each transcriptusing a multistep process.
The first step in the probe-selection process was the genera-tion of a pool of candidate probes 60 nucleotides long (60mers), where each probe was required to fall entirely withinan exon from the set of exons under consideration. If therewere fewer than four 60 mers then all 50 mers were consid-ered as well. If there were fewer than four 50 mers or 60 mersthen all 40 mers were considered, and so on. Stilts composedof sequence from Saccharomyces cerevisiae were added tothe 3' ends of probes shorter than 60 nucleotides so that theyhad a total length of 60 bases when printed onto the arrays.
The second step in the probe-selection process was the classi-fication and reduction of the probe pool on the basis of basecomposition and related filters. Probes were sorted into fourclasses on the basis of several criteria, including A, G, C and Tcontent, GC content, the length of the longest homopolymericrun and the number of A residues at the 5' end. For example,a probe had to have GC content between 35 and 45% to be inclass 1, between 15 and 55% to be in class 2, and between 10and 60% to be in class 3. After all classifications were made,probes from lower-quality classes were discarded, keepingthe number of probes per gene greater than 15. In cases wherea pair of probes was overlapping by more than 50 bases, onlya single probe was chosen.
The final step in the probe-selection process identified probeswith minimal overlap, and predicted cross-hybridization anddesirable positions in the transcript sequence. Cross-hybridi-zation prediction was based on BLAST searching of the fullcollection of transcript sequences [51]. Probes with perfectmatches to transcript sequences for genes other than the oneundergoing design were discarded unless they were the only
probes available. Otherwise the probes with the weakest pre-dicted cross-hybridization interactions were preferred.Probes were also selected to have as little overlap as possible,and probes located in the last 500 bp of each transcript werediscarded where possible to reduce the effects of impairedamplification in this region [52].
All arrays included a set of standard control probes whichwere used for image processing and quality control. Eacharray also included 30 randomly distributed copies of each of51 negative-control probes. These probes were selected fortheir low intensities in previous human hybridizations. Thenegative controls local to each experimental probe were usedfor background correction. Non-control probes were added toeach array such that all probes for a given input sequencewere grouped together and ordered by their position on thesequence.
Preparation of labeled cDNA and array hybridizationHybridization material was generated through a random-priming amplification procedure using primers with a ran-dom sequence at the 3' end and fixed motif at the 5' end. Thisamplification procedure has been fully described [52] and hasbeen optimized to generate strand-specific cDNA copies ofthe mRNA transcripts that are full-length. The 60 mRNAsamples from the human tissues described in Additional datafiles 2 and 3 were purchased from Clontech. The 60 mRNAsamples hybridized to the predicted transcript set of arrayswere done in duplicate with fluor reversal to systematicallycorrect for dye bias. For tiling hybridizations, six sampleswere used for chromosome 20 arrays and eight samples forchromosome 22. The mRNA samples hybridized to the set oftiling arrays were not done in duplicate as the analysis carriedout on these data was intensity based, and our preliminarydata demonstrated reasonable results without performing thetiling experiments in fluor-reverse pairs (data not shown).Additional data files 2-4 contain the full list of samples usedfor each set of arrays.
Array images were processed as described [53] to obtainbackground noise, single channel intensity and associatedmeasurement error estimates. Expression changes betweentwo samples were quantified as log10 (expression ratio) wherethe expression ratio was taken to be the ratio between nor-malized, background-corrected intensity values for the twochannels (red and green) for each spot on the predicted tran-script arrays. An independent normalization routine was car-ried out on the tiling data as described [33] to correct for dyebiases, given the lack of technical replicates for these data.
Analysis of predicted transcript array dataProbes from each computationally determined locus wereanalyzed for coordinated expression over 60 tissues by adapt-ing an additive, probe-specific model initially developed toestimate gene expression indices [27]. The model for a singleprobe in a single sample pair is given by
Genome Biology 2004, 5:R73

http://genomebiology.com/2004/5/10/R73 Genome Biology 2004, Volume 5, Issue 10, Article R73 Schadt et al. R73.15
com
ment
reviews
reports
refereed researchdepo
sited researchinteractio
nsinfo
rmatio
n
yij = µ + φj + θi + εj,
where the yij represent the mlratio measurements for sample
pair i and probe j in the current transcriptional model, µ is thegrand mean term, φi is the probe-specific term for probe j in
the model, θi is the sample-specific term for sample i, and εj is
the probe-specific error term, which is taken to be normally
distributed with mean 0 and variance . Given the above
representation for an observed mlratio value, the likelihoodfor a single probe over N condition pairs is simply
From this, the likelihood for a given transcriptional model,where a transcriptional model in this context is defined as aset of probes that are adjacent to one another in the genomicsequence and that co-regulate over a number of conditions, iseasily seen to be the product of the individual probe likeli-hoods defined above over the M probes comprising the cur-rent model:
The maximum likelihood estimates for the parameters of thismodel are obtained using standard optimization techniques.
With the likelihood model described above, probe groupsmaking up a transcriptional model were formed by iterativelyconsidering whether neighboring probes (within a PTI mem-ber based on genomic location) of a given probe improved thefit of the model just described. This was determined by exam-ining the likelihood ratio statistics between the current, besttranscriptional model with or without an additional probeincluded in the model. Thresholds for the likelihood ratio teststatistic and the different model parameters were empiricallydetermined to minimize false-positive and false-negativerates. False positives were estimated by the detection of PTImembers supported by only a single ab initio prediction thatfell outside annotated Sanger genes on chromosomes 20 and22. False negatives were defined as Sanger genes on chromo-some 20 and 22 that were not detected. Probe sets with amaximum likelihood statistic greater than 100 and an r2 valuefor fit of data to the model greater than 0.8 were consideredhigh-confidence candidates for EVGs.
For each high-confidence EVG candidate, probes were fur-ther assessed by considering the number of conditions inwhich the absolute intensity of the probe was seen to be sig-nificantly above background, and the number of times theprobe was seen significantly differentially expressed.
Candidate EVGs with at least one probe that was: signifi-cantly above background (p-value < 0.01) in at least 10% ofthe samples; or significantly differentially expressed (p-value< 0.01) in at least 10% of the condition pairs, were consideredvalidated.
Analysis of tiling array dataThe analysis of the tiling data has been described in detail byYing et al. [33]. Briefly, probes were separated into 15 kb win-dows along the genome with 7.5 kb overlap between thewindows. For each window, a robust principal componentanalysis was applied to the between-sample correlationmatrix for probes in the window. Windows containing tran-scriptional activity were characterized by comparing the dis-tribution of the Mahalanobis distances for the probes in thewindow (the Mahalanobis distance for each probe was calcu-lated from the probe location to the center of the data in thefirst dimensions of the principal component score (PCS))space with the reference distribution calculated based onknown intron probes. Individual probes were then classifiedas belonging to the transcribed unit or not on the basis of thelog of the Mahalanobis distance and an approximation of thediagonal distance (slope) of the probe from the minimum firstPCS and median second PCS. Using these measures for dis-tance, the probes were clustered using standard clusteringtechniques as described [33].
The procedure for estimating cross-hybridization of theprobes is the subject of a separate manuscript. For the analy-ses described in this paper, the nonspecific cross-hybridiza-tion was estimated by the presence of motifs within the probesequence that were enriched in probes observed to have ahigh level of nonspecific cross-hybridization. These probeswere observed to have significant intensity when hybridizedto human mRNA samples despite having no EST support andfalling in introns of well characterized genes on chromosomes20 and 22. Specific cross-hybridization was estimated by theminimum predicted ∆G value for hybridization of the probe toall genes other than the intended target in the UniGene data-base (build 157).
Annotation of EVG and tiling dataHidden Markov model Pfam (HMMPfam) domain predic-tions were run on six-frame translations of the PTIs using theHFRAME software from Paracel with an E-value cutoff of0.01 and frameshift penalty of -12. Information on Pfam [31]domains is available [54,55]. GO terms [32] were thenassigned to each locus projection using the full set of Pfam toGO mappings available from EBI FTP site [56]. The domain-to-ontology mapping is a part of the larger InterPro effort onannotating the proteome [57,58]. Multiple GO categories canbe assigned to a single element of the PTI.
σ j2
Le
jji
N
yij j
j
=
−
=
− −( )
∏
µ φ
σ
πσ
2
22
1 2,
L Ljj
M=
=∏
1
.
Genome Biology 2004, 5:R73

R73.16 Genome Biology 2004, Volume 5, Issue 10, Article R73 Schadt et al. http://genomebiology.com/2004/5/10/R73
Additional data filesThe following additional data is available with the online ver-sion of this paper and at [19]. Additional data file 1 gives acomplete list of 48,614 transcripts in the PTI that were repre-sented on the set of predicted transcript arrays. Additionaldata file 2 gives a complete list of 60 tissues and cell lineshybridized to the predicted transcript arrays. Additional datafile 3 gives a list of six tissues and cell lines hybridized to thechromosome 20 genomic tiling arrays. Additional data file 4lists the eight tissues and cell lines hybridized to the chromo-some 22 genomic tiling arrays. Additional data file 5 containsa comparison of EVG predictions with RefSeq sequences(March 2004). Also available on our website [19] are: ratiodata and body atlas data along with the EVG status, and fullsequences for the locus projections in fasta format. All probesequences and expression data are available from the GEOdatabase [59]. The series accession numbers for the tiling andpredicted transcript arrays are GSE1097 and GSE918respectively.Additional data file 1A complete list of 48,614 transcripts in the PTI that were repre-sented on the set of predicted transcript arraysA complete list of 48,614 transcripts in the PTI that were repre-sented on the set of predicted transcript arraysClick here for additional data fileAdditional data file 2A complete list of 60 tissues and cell lines hybridized to the pre-dicted transcript arraysA complete list of 60 tissues and cell lines hybridized to the pre-dicted transcript arraysClick here for additional data fileAdditional data file 3A list of six tissues and cell lines hybridized to the chromosome 20 genomic tiling arraysA list of six tissues and cell lines hybridized to the chromosome 20 genomic tiling arraysClick here for additional data fileAdditional data file 4The eight tissues and cell lines hybridized to the chromosome 22 genomic tiling arraysThe eight tissues and cell lines hybridized to the chromosome 22 genomic tiling arraysClick here for additional data fileAdditional data file 5A comparison of EVG predictions with RefSeq sequencesA comparison of EVG predictions with RefSeq sequencesPClick here for additional data file
AcknowledgementsWe thank D. Kessler, M. Marton and the rest of the Rosetta Gene Expres-sion Laboratory for sample preparation and hybridization, S. Dow forreagent and primer handling, and E. Coffey and the Array Production Teamfor array synthesis. We also thank M. Krolewski and S. Ezekiel for databaseand programming support. Finally, we would like to thank B. Bush and J.Sachs for critical evaluation of the manuscript. The authors thank J. Bur-chard for mapping the PTI probes to the current RefSeq sequences. RosettaInpharmatics LLC is a wholly owned subsidiary of Merck & Co, Inc.
References1. Liang F, Holt I, Pertea G, Karamycheva S, Salzberg SL, Quackenbush
J: Gene index analysis of the human genome estimatesapproximately 120,000 genes. Nat Genet 2000, 25:239-240.
2. Lander ES, Linton LM, Birren B, Nusbaum C, Zody MC, Baldwin J,Devon K, Dewar K, Doyle M, FitzHugh W, et al.: Initial sequencingand analysis of the human genome. Nature 2001, 409:860-921.
3. Venter JC, Adams MD, Myers EW, Li PW, Mural RJ, Sutton GG, SmithHO, Yandell M, Evans CA, Holt RA, et al.: The sequence of thehuman genome. Science 2001, 291:1304-51.
4. Ewing B, Green P: Analysis of expressed sequence tags indi-cates 35,000 human genes. Nat Genet 2000, 25:232-234.
5. Adams MD, Kerlavage AR, Fleischmann RD, Fuldner RA, Bult CJ, LeeNH, EF Kitrkness, Weinstock KG, Gocayne JD, White O, et al.: Ini-tial assessment of human gene diversity and expression pat-terns based upon 83 million nucleotides of cDNA sequence.Nature 1995, 377:3-174.
6. Wright FA, Lemon WJ, Zhao WD, Sears R, Zhuo D, Wang JP, YangHY, Baer T, Stredney D, Spitzner J, et al.: A draft annotation andoverview of the human genome. Genome Biol 2001,2:research0025.1-0025.18.
7. Hogenesch JB, Ching KA, Batalov S, Su AI, Walker JR, Zhou Y, KaySA, Schultz PG, Cooke MP: A comparison of the Celera andEnsembl predicted gene sets reveals little overlap in novelgenes. Cell 2001, 106:413-415.
8. Camargo AA, Samaia HP, Dias-Neto E, Simao DF, Migotto IA, BrionesMR, Costa FF, Nagai MA, Verjovski-Almeida S, Zago MA, et al.: Thecontribution of 700,000 ORF sequence tags to the definitionof the human transcriptome. Proc Natl Acad Sci USA 2001,98:12103-12108.
9. Saha S, Sparks AB, Rago C, Akmaev V, Wang CJ, Vogelstein B, KinzlerKW, Velculescu VE: Using the transcriptome to annotate thegenome. Nat Biotechnol 2002, 20:508-512.
10. Kapranov P, Cawley SE, Drenkow J, Bekiranov S, Strausberg RL,Fodor SP, Gingeras TR: Large-scale transcriptional activity inchromosomes 21 and 22. Science 2002, 296:916-919.
11. Shoemaker DD, Schadt EE, Armour CD, He YD, Garrett-Engele P,McDonagh PD, Loerch PM, Leonardson A, Lum PY, Cavet G, et al.:Experimental annotation of the human genome using micro-array technology. Nature 2001, 409:922-927.
12. Yamada K, Lim J, Dale JM, Chen H, Shinn P, Palm CJ, Southwick AM,Wu HC, Kim C, Nguyen M, et al.: Empirical analysis of transcrip-tional activity in the Arabidopsis genome. Science 2003,302:842-846.
13. Strausberg RL, Feingold EA, Klausner RD, Collins FS: The mamma-lian gene collection. Science 1999, 286:455-457.
14. Rogic S, Mackworth AK, Ouellette FB: Evaluation of gene-findingprograms on mammalian sequences. Genome Res 2001,11:817-832.
15. Kampa D, Cheng J, Kapranov P, Yamanaka M, Brubaker S, Cawley S,Drenkow J, Piccolboni A, Bekiranov S, Helt G, et al.: Novel RNAsidentified from an in-depth analysis of the transcriptome ofhuman chromosomes 21 and 22. Genome Res 2004, 14:331-342.
16. Rinn JL, Euskirchen G, Bertone P, Martone R, Luscombe NM, Hart-man S, Harrison PM, Nelson FK, Miller P, Gerstein M, et al.: Thetranscriptional activity of human chromosome 22. Genes Dev2003, 17:529-540.
17. Tjaden B, Saxena RM, Stolyar S, Haynor DR, Kolker E, Rosenow C:Transcriptome analysis of Escherichia coli using high-densityoligonucleotide probe arrays. Nucleic Acids Res 2002,30:3732-3738.
18. Waterston RH, Lindblad-Toh K, Birney E, Rogers J, Abril JF, AgarwalP, Agarwala R, Ainscough R, Alexandersson M, An P, et al.: Initialsequencing and comparative analysis of the mouse genome.Nature 2002, 420:520-562.
19. Supporting online material for: A comprehensive transcriptindex of the human genome generated using microarraysand computational approaches [http://pubinfo.rii.com/CTI_BodyAtlas]
20. Riley JL, Mao M, Kobayashi S, Biery M, Burchard J, Cavet G, GregsonBP, June CH, Linsley PS: Modulation of TCR-induced transcrip-tional profiles by ligation of CD28, ICOS, and CTLA-4receptors. Proc Natl Acad Sci USA 2002, 99:11790-11795.
21. Johnson JM, Castle J, Garrett-Engele P, Kan Z, Loerch PM, ArmourCD, Santos R, Schadt EE, Stoughton R, Shoemaker DD: Genome-wide survey of human alternative pre-mRNA splicing withexon junction microarrays. Science 2003, 302:2141-2144.
22. Pruitt KD, Maglott DR: RefSeq and LocusLink: NCBI gene-cen-tered resources. Nucleic Acids Res 2001, 29:137-140.
23. Deloukas P, Matthews LH, Ashurst J, Burton J, Gilbert JG, Jones M,Stavrides G, Almeida JP, Babbage AK, Bagguley CL, et al.: The DNAsequence and comparative analysis of human chromosome20. Nature 2001, 414:865-871.
24. Collins JE, Goward ME, Cole CG, Smink LJ, Huckle EJ, Knowles S, ByeJM, Beare DM, Dunham I: Reevaluating human gene annotation:a second-generation analysis of chromosome 22. Genome Res2003, 13:27-36.
25. Claverie JM: Computational methods for the identification ofgenes in vertebrate genomic sequences. Hum Mol Genet 1997,6:1735-1744.
26. Dunham I, Shimizu N, Roe BA, Chissoe S, Hunt AR, Collins JE, Brusk-iewich R, Beare DM, Clamp M, Smink LJ, et al.: The DNA sequenceof human chromosome 22. Nature 1999, 402:489-495.
27. Li C, Wong WH: Model-based analysis of oligonucleotidearrays: expression index computation and outlier detection.Proc Natl Acad Sci USA 2001, 98:31-36.
28. Ensembl Genome Browser [http://www.ensembl.org/Homo_sapiens]
29. Hubbard T, Barker D, Birney E, Cameron G, Chen Y, Clark L, Cox T,Cuff J, Curwen V, Down T, et al.: The Ensembl genome databaseproject. Nucleic Acids Res 2002, 30:38-41.
30. Ota T, Suzuki Y, Nishikawa T, Otsuki T, Sugiyama T, Irie R, Waka-matsu A, Hayashi K, Sato H, Nagai K, et al.: Complete sequencingand characterization of 21,243 full-length human cDNAs. NatGenet 2004, 36:40-45.
31. Pfam home (St Louis) [http://pfam.wustl.edu]32. Gene Ontology Consortium [http://www.geneontology.org]33. Ying L, Schadt EE, Holder SVD, Edwards S, Guhathakurta D: Identi-
fication of chromosomal regions containing transcribedsequences using microarray expression data. In 2003 Proceed-ings of the American Statistical Association Alexandria, VA: American Sta-tistical Association; 2003:4672-4677.
34. Cawley S, Bekiranov S, Ng HH, Kapranov P, Sekinger EA, Kampa D,Piccolboni A, Sementchenko V, Cheng J, Williams AJ, et al.: Unbiased
Genome Biology 2004, 5:R73
http://www.ncbi.nlm.nih.gov/entrez/query.fcgi?cmd=Retrieve&db=PubMed&dopt=Abstract&list_uids=7566098
http://www.ncbi.nlm.nih.gov/entrez/query.fcgi?cmd=Retrieve&db=PubMed&dopt=Abstract&list_uids=7566098
http://genomebiology.com/2004/5/10/R73 Genome Biology 2004, Volume 5, Issue 10, Article R73 Schadt et al. R73.17
com
ment
reviews
reports
refereed researchdepo
sited researchinteractio
nsinfo
rmatio
n
mapping of transcription factor binding sites along humanchromosomes 21 and 22 points to widespread regulation ofnoncoding RNAs. Cell 2004, 116:499-509.
35. Bray N, Dubchak I, Pachter L: AVID: a global alignmentprogram. Genome Res 2003, 13:97-102.
36. Loots GG, Ovcharenko I, Pachter L, Dubchak I, Rubin EM: rVista forcomparative sequence-based discovery of functional tran-scription factor binding sites. Genome Res 2002, 12:832-839.
37. Treisman R, Marais R, Wynne J: Spatial flexibility in ternary com-plexes between SRF and its accessory proteins. EMBO J 1992,11:4631-4640.
38. Kawamoto T, Makino K, Niwa H, Sugiyama H, Kimura S, Amemura M,Nakata A, Kakunaga T: Identification of the human beta-actinenhancer and its binding factor. Mol Cell Biol 1988, 8:267-272.
39. Frederickson RM, Micheau MR, Iwamoto A, Miyamoto NG: 5' flank-ing and first intron sequences of the human beta-actin generequired for efficient promoter activity. Nucleic Acids Res 1989,17:253-270.
40. Storz G: An expanding universe of noncoding RNAs. Science2002, 296:1260-1263.
41. National Human Genome Research Institute - Encyclopediaof DNA Elements (ENCODE) [http://www.genome.gov/10005107]
42. Schadt EE, Monks SA, Drake TA, Lusis AJ, Che N, Colinayo V, RuffTG, Milligan SB, Lamb JR, Cavet G, et al.: Genetics of gene expres-sion surveyed in maize, mouse and man. Nature 2003,422:297-302.
43. Repeat Masker [http://ftp.genome.washington.edu/RM/RepeatMasker.html]
44. Burke J, Davison D, Hide W: d2_cluster: a validated method forclustering EST and full-length cDNAsequences. Genome Res1999, 9:1135-1142.
45. Altschul SF, Madden TL, Schaffer AA, Zhang J, Zhang Z, Miller W, Lip-man DJ: Gapped BLAST and PSI-BLAST: a new generation ofprotein database search programs. Nucleic Acids Res 1997,25:3389-3402.
46. Florea L, Hartzell G, Zhang Z, Rubin GM, Miller W: A computerprogram for aligning a cDNA sequence with a genomic DNAsequence. Genome Res 1998, 8:967-974.
47. Xu Y, Uberbacher EC: Automated gene identification in large-scale genomic sequences. J Comput Biol 1997, 4:325-338.
48. Burge C, Karlin S: Prediction of complete gene structures inhuman genomic DNA. J Mol Biol 1997, 268:78-94.
49. Salamov AA, Solovyev VV: Ab initio gene finding in Drosophilagenomic DNA. Genome Res 2000, 10:516-522.
50. Standalone BLAST Additions|Fall/Winter[http:www.ncbi.nlm.nih.gov/Web/Newsltr/FallWinter2000/standalone.html]
51. Hughes TR, Mao M, Jones AR, Burchard J, Marton MJ, Shannon KW,Lefkowitz SM, Ziman M, Schelter JM, Meyer MR, et al.: Expressionprofiling using microarrays fabricated by an ink-jet oligonu-cleotide synthesizer. Nat Biotechnol 2001, 19:342-347.
52. Castle J, Garrett-Engele P, Armour CD, Duenwald SJ, Loerch PM,Meyer MR, Schadt EE, Stoughton R, Parrish ML, Shoemaker DD, et al.:Optimization of oligonucleotide arrays and RNA amplifica-tion protocols for analysis of transcript structure and alter-native splicing. Genome Biol 2003, 4:R66.
53. Roberts CJ, Nelson B, Marton MJ, Stoughton R, Meyer MR, BennettHA, He YD, Dai H, Walker WL, Hughes TR, et al.: Signaling andcircuitry of multiple MAPK pathways revealed by a matrix ofglobal gene expression profiles. Science 2000, 287:873-880.
54. Pfam home page [http://www.sanger.ac.uk/Software/Pfam]55. Bateman A, Coin L, Durbin R, Finn RD, Hollich V, Griffiths-Jones S,
Khanna A, Marshall M, Moxon S, Sonnhammer EL, et al.: The Pfamprotein families database. Nucleic Acids Res 2004, 32 Databaseissue:D138-D141.
56. EBI FTP site [ftp://ftp.ebi.ac.uk/pub/databases/GO/goa/old/external2go]
57. InterPro: home [http://www.ebi.ac.uk/interpro]58. Mulder NJ, Apweiler R, Attwood TK, Bairoch A, Barrell D, Bateman
A, Binns D, Biswas M, Bradley P, Bork P, et al.: The InterPro Data-base, 2003 brings increased coverage and new features.Nucleic Acids Res 2003, 31:315-318.
59. Gene Expression Omnibus [http://www.ncbi.nlm.nih.gov/geo]60. UCSC genome browser home [http://genome.ucsc.edu]61. rVISTA submission [http://www-gsd.lbl.gov/vista/rvista/sub
mit.shtml]
Genome Biology 2004, 5:R73
http://www.ncbi.nlm.nih.gov/entrez/query.fcgi?cmd=Retrieve&db=PubMed&dopt=Abstract&list_uids=1425594
http://www.ncbi.nlm.nih.gov/entrez/query.fcgi?cmd=Retrieve&db=PubMed&dopt=Abstract&list_uids=1425594
http://www.ncbi.nlm.nih.gov/entrez/query.fcgi?cmd=Retrieve&db=PubMed&dopt=Abstract&list_uids=3422098
http://www.ncbi.nlm.nih.gov/entrez/query.fcgi?cmd=Retrieve&db=PubMed&dopt=Abstract&list_uids=2911466
http://www.ncbi.nlm.nih.gov/entrez/query.fcgi?cmd=Retrieve&db=PubMed&dopt=Abstract&list_uids=9254694
http://www.ncbi.nlm.nih.gov/entrez/query.fcgi?cmd=Retrieve&db=PubMed&dopt=Abstract&list_uids=9750195
http://www.ncbi.nlm.nih.gov/entrez/query.fcgi?cmd=Retrieve&db=PubMed&dopt=Abstract&list_uids=9750195
http://www.ncbi.nlm.nih.gov/entrez/query.fcgi?cmd=Retrieve&db=PubMed&dopt=Abstract&list_uids=9750195
http://www.ncbi.nlm.nih.gov/entrez/query.fcgi?cmd=Retrieve&db=PubMed&dopt=Abstract&list_uids=9278063
http://www.ncbi.nlm.nih.gov/entrez/query.fcgi?cmd=Retrieve&db=PubMed&dopt=Abstract&list_uids=9278063