A Complete Keypics Experiment with Size Functions
10
A Complete Keypics Experiment with Size Functions Andrea Cerri, Massimo Ferri, and Daniela Giorgi ARCES and Dept. of Mathematics, University of Bologna, Piazza di Porta S. Donato, 5 I-40126 Bologna Italy {cerri, ferri, giorgid}@dm.unibo.it Abstract. Keypics are graphical metadata intended for indexing of im- ages on the Internet. They are conceived as hand-drawn sketches, not re- stricted to a definite set. An obvious difficulty when dealing with keypics is that they elude rigid geometric treatment. A proposal of solution comes from Size Functions. This paper is the report of a complete experiment on 494 keypics with Size Functions based on three measuring functions (distances, projections and jumps) and their combination. 1 Introduction The recent, original idea (by P. Frosini and our Vision Mathematics Group in Bologna) [7] of “Keypics” poses serious problems to an Image Retrieval (IR) System. In fact, the main difficulty inherent to the “search–by–sketch” paradigm is by–passed by Keypics: “search–by–sketch” doesn’t work well because it tries to match sketches with real images; with Keypics, an IR System needs to match sketches with sketches. This seems to be more promising; still, the problem of comparing hand–drawn sketches for similarity is hard, as for any recognition and retrieval system which has to deal with “natural” images (like signatures, biological images, faces, the sign alphabet etc.). Size Functions (SF’s) have proven to be particularly apt to this kind of set- tings, because of their geometrical–topological nature and their modularity. The mathematical core of SF’s was exactly conceived for formalizing qualitative as- pects of signals (images, but also 3D data, sounds, etc.). Modularity allows the user to fit a SF to the specific nature of the objects to be recognized or retrieved, through the choice of a “measuring function” (see Section 3). When proposing [7], our team had just performed a preliminary study on a set of Keypics, with only one type of measuring functions: distances from a set of fixed points. Here we enhance that experiment by using two more sets of independent measuring functions: “projections” and “jumps”, and finally by integrating the three subsystems (see Section 5). Two necessary clarifications: 1) The adjective “complete” in the title refers to the fact that the present experiment considers not only the retrieved sketches, W.-K. Leow et al. (Eds.): CIVR 2005, LNCS 3568, pp. 357–366, 2005. c Springer-Verlag Berlin Heidelberg 2005
-
Upload
independent -
Category
Documents
-
view
0 -
download
0
Transcript of A Complete Keypics Experiment with Size Functions
A Complete Keypics Experimentwith Size Functions
Andrea Cerri, Massimo Ferri, and Daniela Giorgi
ARCES and Dept. of Mathematics, University of Bologna,Piazza di Porta S. Donato, 5 I-40126 Bologna Italy
{cerri, ferri, giorgid}@dm.unibo.it
Abstract. Keypics are graphical metadata intended for indexing of im-ages on the Internet. They are conceived as hand-drawn sketches, not re-stricted to a definite set. An obvious difficulty when dealing with keypicsis that they elude rigid geometric treatment.
A proposal of solution comes from Size Functions. This paper isthe report of a complete experiment on 494 keypics with Size Functionsbased on three measuring functions (distances, projections and jumps)and their combination.
1 Introduction
The recent, original idea (by P. Frosini and our Vision Mathematics Groupin Bologna) [7] of “Keypics” poses serious problems to an Image Retrieval (IR)System. In fact, the main difficulty inherent to the “search–by–sketch” paradigmis by–passed by Keypics: “search–by–sketch” doesn’t work well because it triesto match sketches with real images; with Keypics, an IR System needs to matchsketches with sketches. This seems to be more promising; still, the problem ofcomparing hand–drawn sketches for similarity is hard, as for any recognitionand retrieval system which has to deal with “natural” images (like signatures,biological images, faces, the sign alphabet etc.).
Size Functions (SF’s) have proven to be particularly apt to this kind of set-tings, because of their geometrical–topological nature and their modularity. Themathematical core of SF’s was exactly conceived for formalizing qualitative as-pects of signals (images, but also 3D data, sounds, etc.). Modularity allows theuser to fit a SF to the specific nature of the objects to be recognized or retrieved,through the choice of a “measuring function” (see Section 3).
When proposing [7], our team had just performed a preliminary study ona set of Keypics, with only one type of measuring functions: distances from aset of fixed points. Here we enhance that experiment by using two more setsof independent measuring functions: “projections” and “jumps”, and finally byintegrating the three subsystems (see Section 5).
Two necessary clarifications: 1) The adjective “complete” in the title refers tothe fact that the present experiment considers not only the retrieved sketches,
W.-K. Leow et al. (Eds.): CIVR 2005, LNCS 3568, pp. 357–366, 2005.c© Springer-Verlag Berlin Heidelberg 2005
358 A. Cerri, M. Ferri, and D. Giorgi
but also the images that they are indexing. So it is really an experiment onkeypics, whereas our preliminary studies were only on retrieval of sketches bysketches. 2) We want to show that image retrieval through keypics has at leastSize Functions as a possible solution. We do not claim that Size Functions are abetter tool than the competitors’; in fact, we invite other researchers to try theirmethods on keypics. We shall be very glad, for instance, to make our datasetavailable for comparison and integration of retrieval methods.
2 Keypics
In [7] it was proposed that the owner or the manager of a set of images ona Web site, equips each image with a simplified drawing, called “Keypic” (asalternative to “keyword”). This might be performed by use of simple drawingand processing tools, or by hand, but preferably in SVG [1]. The Keypic shouldbe representative of what is felt as essential by the site manager. So it could bean outline of the relevant shapes in the image, or a symbol semantically referringto its content. Several images might be associated to the same keypic, and morethan one Keypic might be associated to the same image. Keypics could also beused for indexing Web pages or sites.
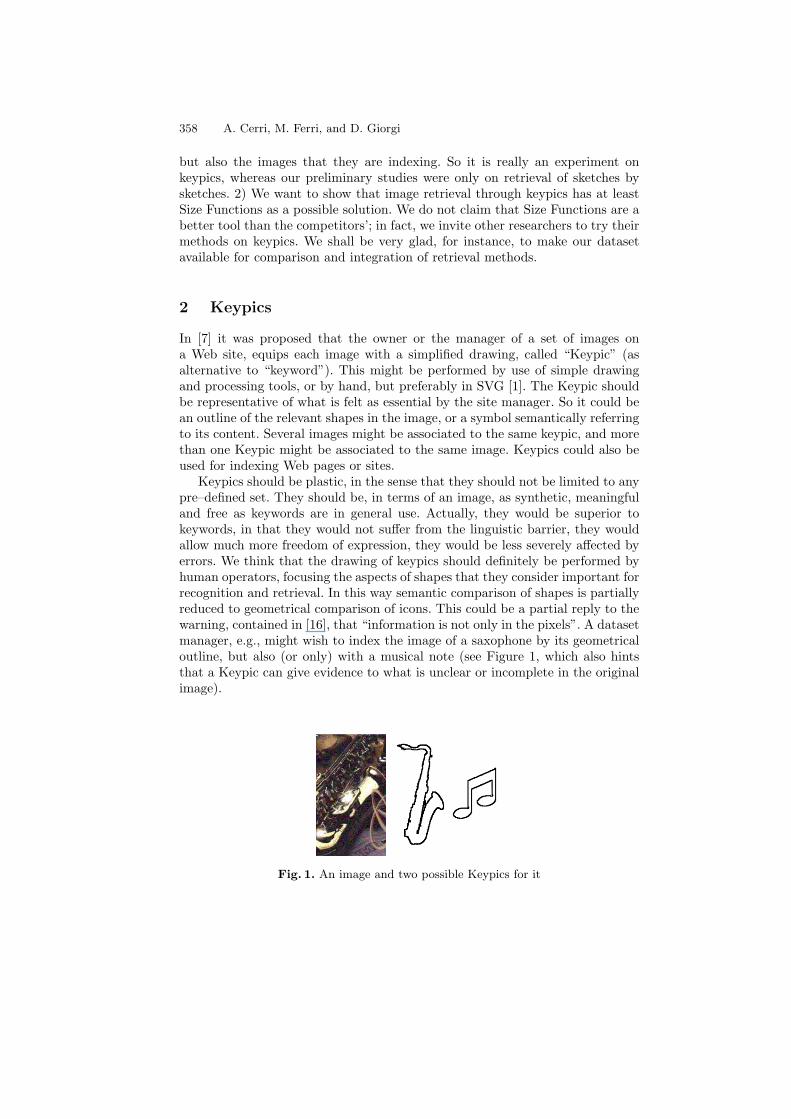
Keypics should be plastic, in the sense that they should not be limited to anypre–defined set. They should be, in terms of an image, as synthetic, meaningfuland free as keywords are in general use. Actually, they would be superior tokeywords, in that they would not suffer from the linguistic barrier, they wouldallow much more freedom of expression, they would be less severely affected byerrors. We think that the drawing of keypics should definitely be performed byhuman operators, focusing the aspects of shapes that they consider important forrecognition and retrieval. In this way semantic comparison of shapes is partiallyreduced to geometrical comparison of icons. This could be a partial reply to thewarning, contained in [16], that “information is not only in the pixels”. A datasetmanager, e.g., might wish to index the image of a saxophone by its geometricaloutline, but also (or only) with a musical note (see Figure 1, which also hintsthat a Keypic can give evidence to what is unclear or incomplete in the originalimage).
Fig. 1. An image and two possible Keypics for it
A Complete Keypics Experiment with Size Functions 359
3 Size Functions
The key idea underlying SF’s is that of setting metric obstructions to the classicalnotion of connectedness, thus conveying informations both on the geometry andthe topology of the viewed shape.
Let us recall the formal definition of a SF. Consider a continuous real-valuedfunction ϕ : M → IR, defined on a subset M of a Euclidean space. The SizeFunction of the pair (M,ϕ) is a function �(M,ϕ) : {(x, y) ∈ IR2 |x < y} → IN. Foreach pair (x, y) ∈ IR2, consider the set Mx = {P ∈ M |ϕ(P ) ≤ x}. Two pointsin My are then considered to be equivalent if they belong to the same connectedcomponent of My. The value �(M,ϕ)(x, y) is defined to be the number of theequivalence classes obtained by quotienting Mx with respect to the previousequivalence relation in My.
SF’s have a simple geometric interpretation: �(M,ϕ)(x, y) is equal to the num-ber of connected components of My containing at least one point of Mx.
A discrete version of the theory exists, which substitutes the subset M ofthe space with a graph G = (V,E), the function ϕ : M → R with a functionϕ′ : V → R , and the concept of connectedness with the usual connectednessnotion for graphs.
It is important to remark that SF’s are easily and fast computable; see [4]for details.
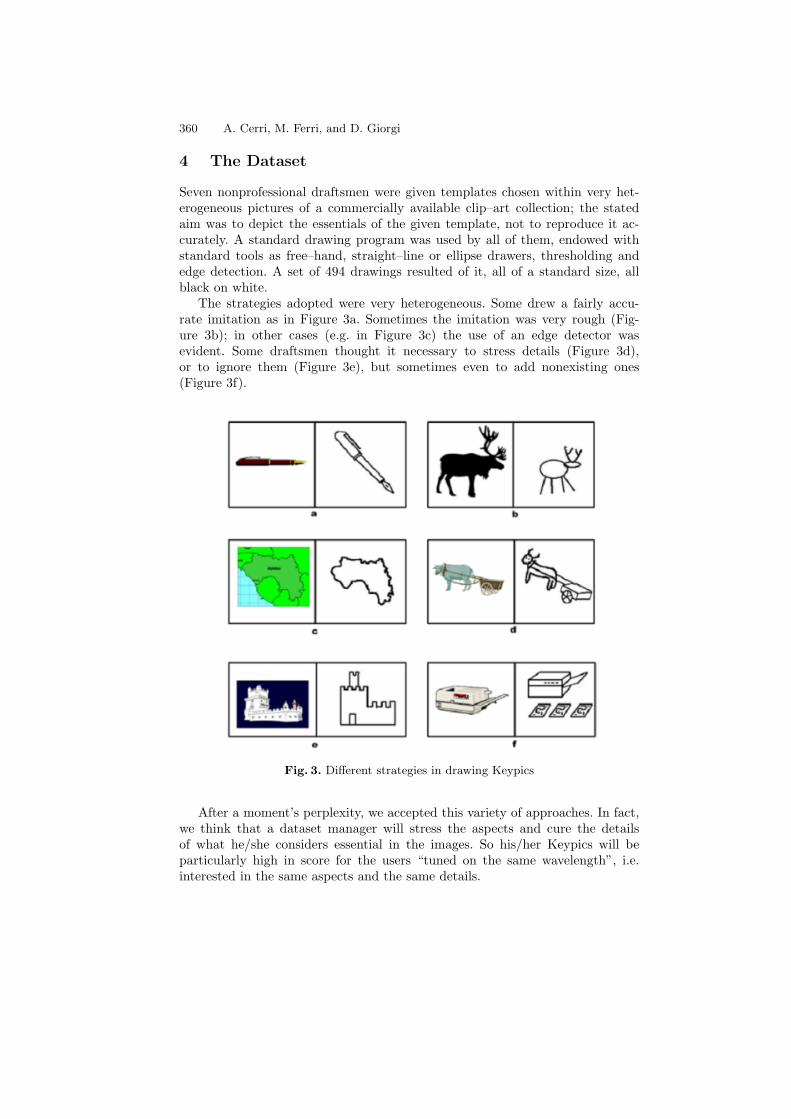
Figure 2 shows a simple example of SF. In this case the topological space Mis a curve, while the measuring function ϕ is the distance from point C.
As Figure 2 shows, SF’s have a typical structure: They are linear combina-tions (with natural numbers as coefficients) of characteristic functions of trian-gular regions. That implies that each SF can be described by a formal linearcombination of cornerpoints and cornerlines. Due to this kind of representa-tion, the original complex issue of comparing shapes can be turned into a sim-pler algebraic problem: Each distance between formal series naturally producesa distance between SF’s. A detailed treatment of this subject can be foundin [8].
Of the many available distances between formal series(see, e.g., [5]), the onewe use in this paper is the Hausdorff distance.
Fig. 2. A curve and its SF with respect to the distance from point C
360 A. Cerri, M. Ferri, and D. Giorgi
4 The Dataset
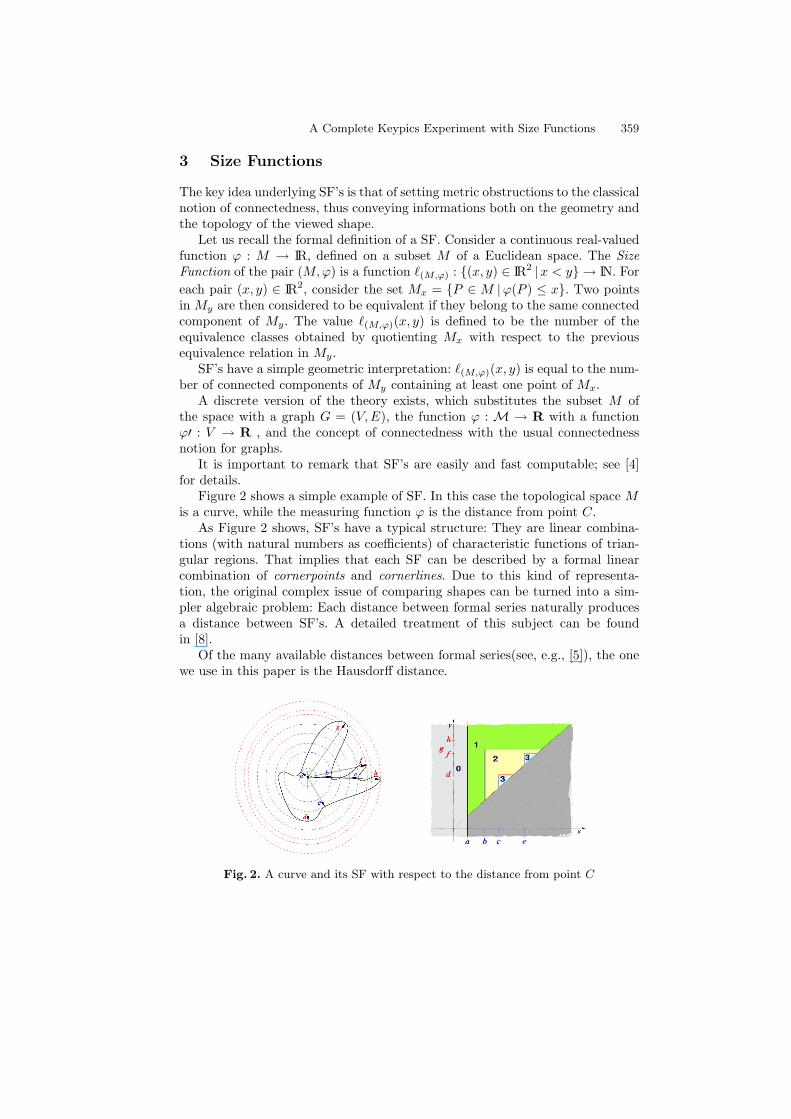
Seven nonprofessional draftsmen were given templates chosen within very het-erogeneous pictures of a commercially available clip–art collection; the statedaim was to depict the essentials of the given template, not to reproduce it ac-curately. A standard drawing program was used by all of them, endowed withstandard tools as free–hand, straight–line or ellipse drawers, thresholding andedge detection. A set of 494 drawings resulted of it, all of a standard size, allblack on white.
The strategies adopted were very heterogeneous. Some drew a fairly accu-rate imitation as in Figure 3a. Sometimes the imitation was very rough (Fig-ure 3b); in other cases (e.g. in Figure 3c) the use of an edge detector wasevident. Some draftsmen thought it necessary to stress details (Figure 3d),or to ignore them (Figure 3e), but sometimes even to add nonexisting ones(Figure 3f).
Fig. 3. Different strategies in drawing Keypics
After a moment’s perplexity, we accepted this variety of approaches. In fact,we think that a dataset manager will stress the aspects and cure the detailsof what he/she considers essential in the images. So his/her Keypics will beparticularly high in score for the users “tuned on the same wavelength”, i.e.interested in the same aspects and the same details.
A Complete Keypics Experiment with Size Functions 361
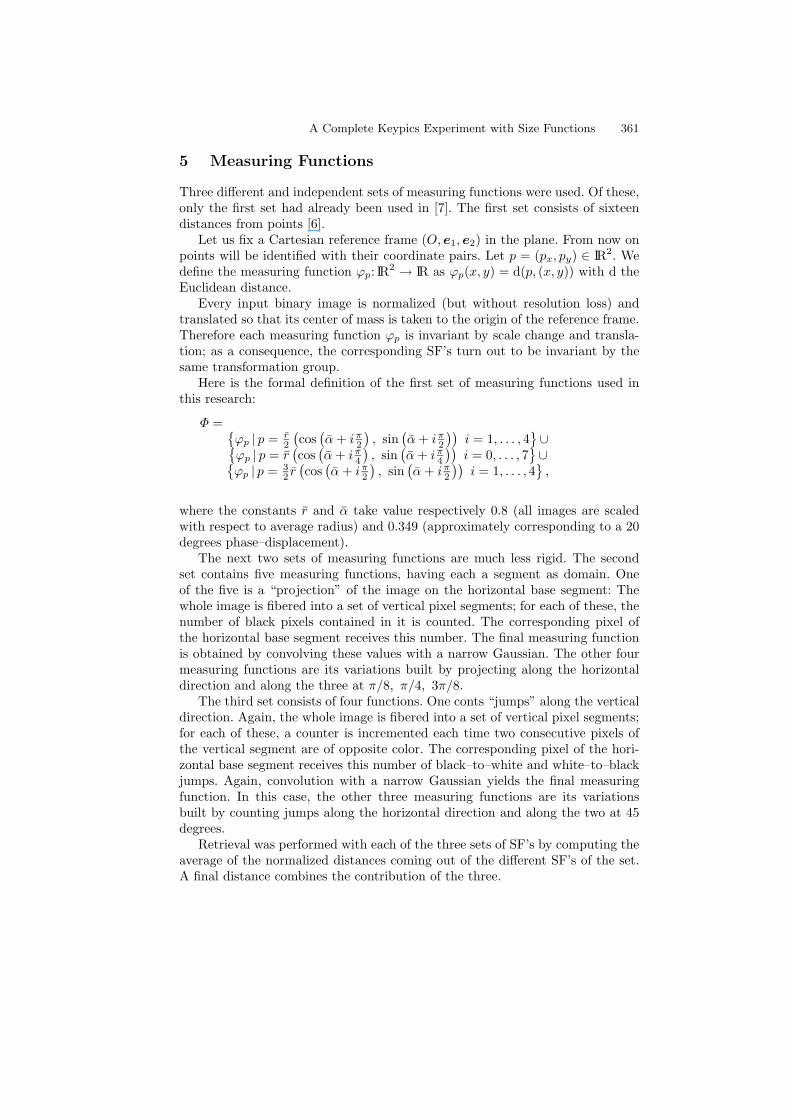
5 Measuring Functions
Three different and independent sets of measuring functions were used. Of these,only the first set had already been used in [7]. The first set consists of sixteendistances from points [6].
Let us fix a Cartesian reference frame (O,e1,e2) in the plane. From now onpoints will be identified with their coordinate pairs. Let p = (px, py) ∈ IR2. Wedefine the measuring function ϕp: IR2 → IR as ϕp(x, y) = d(p, (x, y)) with d theEuclidean distance.
Every input binary image is normalized (but without resolution loss) andtranslated so that its center of mass is taken to the origin of the reference frame.Therefore each measuring function ϕp is invariant by scale change and transla-tion; as a consequence, the corresponding SF’s turn out to be invariant by thesame transformation group.
Here is the formal definition of the first set of measuring functions used inthis research:
Φ = {ϕp | p = r
2
(cos
(α + iπ
2
), sin
(α + iπ
2
))i = 1, . . . , 4
}∪{ϕp | p = r
(cos
(α + iπ
4
), sin
(α + iπ
4
))i = 0, . . . , 7
}∪{ϕp | p = 3
2 r(cos
(α + iπ
2
), sin
(α + iπ
2
))i = 1, . . . , 4
},
where the constants r and α take value respectively 0.8 (all images are scaledwith respect to average radius) and 0.349 (approximately corresponding to a 20degrees phase–displacement).
The next two sets of measuring functions are much less rigid. The secondset contains five measuring functions, having each a segment as domain. Oneof the five is a “projection” of the image on the horizontal base segment: Thewhole image is fibered into a set of vertical pixel segments; for each of these, thenumber of black pixels contained in it is counted. The corresponding pixel ofthe horizontal base segment receives this number. The final measuring functionis obtained by convolving these values with a narrow Gaussian. The other fourmeasuring functions are its variations built by projecting along the horizontaldirection and along the three at π/8, π/4, 3π/8.
The third set consists of four functions. One conts “jumps” along the verticaldirection. Again, the whole image is fibered into a set of vertical pixel segments;for each of these, a counter is incremented each time two consecutive pixels ofthe vertical segment are of opposite color. The corresponding pixel of the hori-zontal base segment receives this number of black–to–white and white–to–blackjumps. Again, convolution with a narrow Gaussian yields the final measuringfunction. In this case, the other three measuring functions are its variationsbuilt by counting jumps along the horizontal direction and along the two at 45degrees.
Retrieval was performed with each of the three sets of SF’s by computing theaverage of the normalized distances coming out of the different SF’s of the set.A final distance combines the contribution of the three.
362 A. Cerri, M. Ferri, and D. Giorgi
6 Evaluation
As stressed in several papers (e.g. [14], [15] and[11]) evaluation is a very criticalissue for IR Systems. Apart from the common problem of possessing a reliableand objective ground truth, all most common parameters have some drawbacks.
A particular fault of several evaluation methods, is that they don’t takesufficiently well into account the position of the retrieved relevant objects withinthe scope (i.e. within the whole retrieved set). In what follows, we try to overcomethis problem in two ways. First, we adopt the normalized average rank Rankintroduced by [15]:
Rank =1
NNrel
(Nrel∑i=1
Ri − Nrel(Nrel + 1)2
)where Ri is the rank at which the ith relevant image is retrieved, N is thedataset size, and Nrel is the number of relevant images for a given query. It is 0for perfect performance and approaches 1 as performance worsens.
Second, we have also computed P (k) and R(k), respectively precision andrecall on the first k retrieved images, with k = Nrel, 2Nrel, 3Nrel, so adaptingthe scope to the (varying) number of relevant objects, rather in the line of thenormalizations supported by [11]. (Of course, R(Nrel) = P (Nrel)) Explicitly,
P (k) =NR(k)
kR(k) =
NR(k)Nrel
,
where NR(k) is the number of relevant items among the first k retrieved.
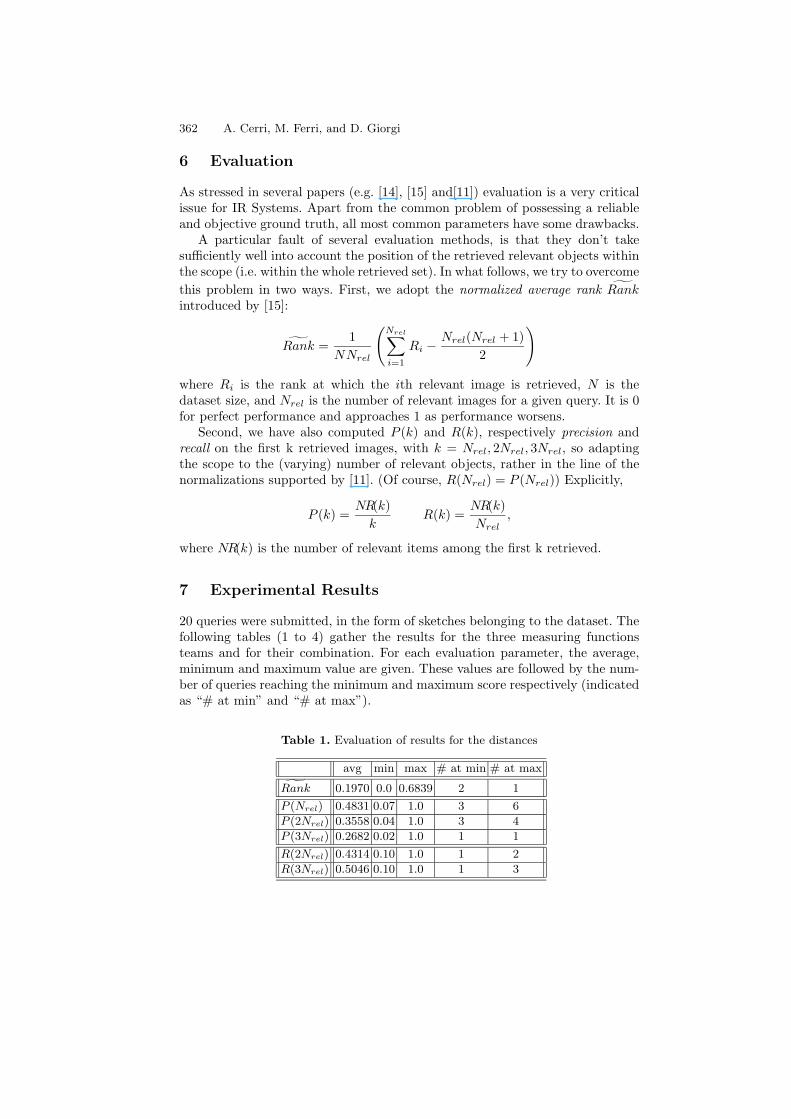
7 Experimental Results
20 queries were submitted, in the form of sketches belonging to the dataset. Thefollowing tables (1 to 4) gather the results for the three measuring functionsteams and for their combination. For each evaluation parameter, the average,minimum and maximum value are given. These values are followed by the num-ber of queries reaching the minimum and maximum score respectively (indicatedas “# at min” and “# at max”).
Table 1. Evaluation of results for the distances
avg min max # at min # at max
Rank 0.1970 0.0 0.6839 2 1
P (Nrel) 0.4831 0.07 1.0 3 6
P (2Nrel) 0.3558 0.04 1.0 3 4
P (3Nrel) 0.2682 0.02 1.0 1 1
R(2Nrel) 0.4314 0.10 1.0 1 2
R(3Nrel) 0.5046 0.10 1.0 1 3

A Complete Keypics Experiment with Size Functions 363
Table 2. Evaluation of results for the projections
avg min max # at min # at max
Rank 0.2360 0.0171 0.5655 1 1
P (Nrel) 0.4795 0,07 1.0 5 7
P (2Nrel) 0.2701 0.04 1.0 2 4
P (3Nrel) 0.2096 0.02 1.0 2 1
R(2Nrel) 0.3543 0.10 0.67 1 1
R(3Nrel) 0.3942 0.10 0.75 1 1
Table 3. Evaluation of results for the jumps
avg min max # at min # at max
Rank 0.1539 0.0010 0.4622 7 1
P (Nrel) 0.4962 0,07 1.0 4 7
P (2Nrel) 0.2886 0.04 1.0 2 1
P (3Nrel) 0.2376 0.02 1.0 2 1
R(2Nrel) 0.3887 0.07 0.75 1 1
R(3Nrel) 0.4274 0.14 1.0 1 1
Table 4. Evaluation of results for the combination
avg min max # at min # at max
Rank 0.1794 0.0 0.4852 1 1
P (Nrel) 0.5117 0,07 1.0 2 7
P (2Nrel) 0.3719 0.04 1.0 2 3
P (3Nrel) 0.2703 0.02 1.0 2 1
R(2Nrel) 0.4749 0.10 1.0 1 2
R(3Nrel) 0.4856 0.10 1.0 1 2
The number of relevant items Nrel for each queried class is greatly variable:it goes from a minimum of 2 to a maximum of 14. The reader should keep inmind that good ranks have low values, while good precision and recall havehigh scores.
The precision–recall graph of Figure 4 (left) refers to the combined distance.The system runs on an Athlon 900 MHz based PC, under Linux OS. Responsetime for a query is, for the moment, between 7 and 10 seconds.
Figure 4 (right) depicts the GRiP graph, plotting the value of precision=recallversus − log2(g), where the generality g is the ratio of the number of relevantitems for each query (2 to 14) by the total size of the data set (494) [11].
Browsing the actual outputs of the queries is rather interesting. For instance,the query consisting of a stylized bird yields a sequence of as uninteresting bird

364 A. Cerri, M. Ferri, and D. Giorgi
Fig. 4. Precision–recall (left) and GRiP graph for the combined distance
Fig. 5. A successful query
Fig. 6. An unexpected output
sketches, as Keypics; things turn interesting if we look at the real images towhich the Keypics point (Figure 5): Without the intermediation of the Keypics— rough and childish as they may appear — it is unlikely that a “normal” querywould have retrieved such heterogeneous images. More remarkable is a querywith the USA flag, where the map of Nevada pops up, because the operator haddecided to add the Stars and Stripes — absent in the original image — in orderto convey a meaning to the Keypic (Figure 6; by the way, that image has notbeen considered as relevant in the statistics of this Section).
A Complete Keypics Experiment with Size Functions 365
8 Other Descriptors
Of course, there are several shape descriptors and shape matching methods (see,e.g., [17]). A comparison of methods is really possible only when performed onthe same data. We have actually done it recently on a data set of trade marks [3].For the moment, let us examine similarities and differences with competitors.
Take the classical Fourier descriptors, for instance [9]. A coincidence in thefirst few coefficients would grant that two shapes are roughly superimposable, dif-ferences being limited to the higher frequencies. SF’s (with distance from centerof mass as a measuring function) recognize the presence and size of comparablebumps even if they are differently disposed in the two images to compare; thisis a simple case of similarity with no (even rough) superimposition. We remindthat, anyway, also SF’s enjoy completeness theorems like Fourier descriptors [6].
Other descriptors, like order structure [2], turning function [13], chain codehistogram [12], need a sort of local superimposition and are mainly limited tosilhouettes. A much closer relative to size functions is the Reeb Graph [10], whichhas been used so long — as far as we know — only for 3D objects.
9 Conclusions
Keypics — plastic graphical metadata — cannot have a chance of diffusing andsucceeding as universal bridges of the semantic gap, unless powerful, qualitativetools are developed for comparing and retrieving hand–drawn sketches.
The feasibility of Keypics is shown by the experiment reported here. SizeFunctions propose themselves as a possible candidate for retrieving images throughKeypics. Our research shows that different measuring functions can integrate to-gether effectively. Of course, integration with still different methods should giveKeypics an even better chance.
Acknowledgements
Work performed within the activity of ARCES “E. De Castro” and of CIRAM,University of Bologna, under the auspices of INdAM-GNSAGA and of the Uni-versity of Bologna, funds for selected research topics.
References
1. http://w3.org/Graphics/SVG/About.html2. Carlsson, S.: Order structure, correspondence, and shape based categories. In: D.A.
Forsyth et al. (Eds.): Shape, Contour and Grouping in Computer Vision, LNCS1681 (1999) 58–71.
3. Cerri, A., Ferri, M., Giorgi D.: A New Framework for Trademark Retrieval Basedon Size Functions. To appear on: Proc. 2nd International Conference on Vision,Video and Graphics, 7-8 July 2005 Heriot Watt University, Edinburgh

366 A. Cerri, M. Ferri, and D. Giorgi
4. d’Amico, M.: A New Optimal Algorithm for Computing Size Functions of Shapes.In: CVPRIP Algorithms III, Proc. Intl. Conf. on Computer Vision, Pattern recog-nition and Image Processing, Atlantic City, (2000) 107–110.
5. Donatini, P., Frosini, P., Landi, C.: Deformation energy for size functions. In: E.R.Hancock, M. Pelillo (eds.) Energy Minimization Methods in Computer Vision andPattern Recognition,, LNCS 1654 (1999) 44–53.
6. Ferri, M., Frosini, P.: Range size functions. Proc. SPIE Conf. on Vision GeometryIII, Boston, 1994 Nov. 2–3 (1995) 243-251.
7. Ferri, M., Frosini, P.: A proposal for image indexing: “keypics”, plastic graphicalmetadata Proc. IS&T/SPIE Symp. on Electronic Imaging, Internet Imaging VI,San Jose, 2005 Jan. 16–20 (2005).
8. Frosini, P., Landi, C.: Size functions and formal series. Applicable Algebra in En-gineering Communication and Computing, 12 (2001) 327–349
9. Granlund, G.H.: Fourier preprocessing for hand print character recognition. IEEETrans. Computers, C-21 (1972) 195–201.
10. Hilaga, M., Shinagawa, Y., Kohmura, T., Kunii, T.L.: Topology matching for fullyautomatic similarity estimation of 3D shapes. SIGGRAPH 2001, Computer Graph-ics Proc., Annual Conference Series (2001) 203–212.
11. Huijsmans, D.P., Sebe, N.: How to Complete Performance Graphs in Content-Based Image Retrieval: Add Generality and Normalize Scope IEEE Trans. onPAMI 27 (2005), 245–251.
12. Iivarinen, J., Visa, A.: Shape recognition of irregular objects. In: D. P. Casasent(ed.) Intelligent Robots and Computer Vision XV: Algorithms, Techniques, ActiveVision, and Materials Handling, Proc. SPIE 2904 (1996) 25–32.
13. Leung, M-W., Chan, K.-L.: Object–based image retrieval using hierarchical shapedescriptor. In: M.S. Lew, N. Sebe, J.P. Eakins (Eds.): Image and Video Retrieval,LNCS 2383 (2002) 165–174.
14. Liu, W., Su, Z., Li, S., Zhang, H. J.: A Performance Evaluation Protocol forContent-Based Image Retrieval Algorithms/Systems. In: Proc. IEEE CVPR Work-shop on Empirical Evaluation in Computer Vision, Kauai, USA, December, 2001.
15. Muller, H., Muller, W., Squire, D.M., Marchand–Maillet, S., Pun, Th.: Performanceevaluation in content–based image retrieval: Overview and proposals. Pattern Rec.Letters 22 (2001) 593–601.
16. Petkovic, D., Jain, R. C.: Visual Information systems: lessons for its future. Proc.IS&T/SPIE Symp. on Electronic Imaging, Internet Imaging VI, San Jose, 2005Jan. 16–20 (2005).
17. Veltcamp, R.C., Hagedoorn, M.: State–of–the–art in shape matching. In: M. Lew(Ed.), Principles of Visual Information Retrieval, Springer (2001) 87–119.