Permafrost, active layer and meteorological data (2010–2020)
A comparison between the ERA40 and the SMHI gridded meteorological databases as applied to Baltic Sea modelling*
A. Omstedt*, Y. Chen and K. Wesslander
Department of Earth Sciences: Oceanography, Göteborg University, Box 460, SE-40530 Göteborg, Sweden
'Corresponding author. E-mail: [email protected]
Received November 2004; accepted in revised form 20 April 2005
Abstract Two gridded meteorological data sets for the Baltic Sea region, both having 1° x 1° horizontal
resolution, were compared and analysed for use in Baltic Sea modelling. The SMHI 1° x 1° data set covers
surface parameters with a three-hour time resolution over the 1970-2004 period. The ERA40 data cover
analysed and modelled parameters for several atmospheric layers with a six-hour time resolution over the
1957-2002 period. Meteorological variables considered in this analysis were air temperature, wind speed, total
cloud cover, relative humidity and precipitation. In considering Baltic Sea modelling, we examined maximum ice
extent, water temperature, salinity and net precipitation calculations.
The two data sets are largely similar and can both be used in Baltic Sea modelling. However, their horizontal
resolution is too coarse for resolving marine conditions over the Baltic Sea. This implies, for example, that the
ERA40 original surface winds are too low for some Baltic Sea regions. The ERA40 precipitation values are also
too low compared with those of the SMHI and other available data.
Keywords Baltic Sea; evaporation; meteorological data; modelling; precipitation; sea ice
Introduction The possibility of obtaining forcing data for modelling and process studies has considerably
increased over the last few decades. For the meteorological forcing of ocean models,
synoptic station values without horizontal interpolations are available from various national
weather services. Gridded data sets are also produced by these services. For the Baltic Sea,
the BALTEX data centres provide station data as well as one gridded data set. This
meteorological data set, the SMHI 1° X 1° data set, has played an important role in the
BALTEX project, being used for both process studies and ocean and hydrological modelling
(e.g. Omstedt et al. 1997; Graham 1999; Lehmann and Hinrichsen 2001; Rutgersson et al.
2001; Meier and Döscher 2002; Hennemuth et al. 2003; Omstedt and Axell 2003).
Meteorological gridded data sets are also available from other sources: ERA40 from the
European Centre for Medium-Range Weather Forecasts and NCEP/NCAR from the US
National Oceanic and Atmospheric Administration. The NCEP/NCAR data for the Baltic
drainage basin was recently analysed by Ruprecht and Kahl (2003), who illustrated the
problems in using this data set for basic water balance studies.
The aim of this study is to compare two gridded meteorological data sets, the SMHI
1° X 1° and the ERA40 data sets, for the Baltic Sea and determine which is more reliable for
use in Baltic Sea modelling. We have investigated various surface meteorological variables
and also used Baltic Sea modelling and independent marine observations to evaluate these
meteorological data sets.
'Paper presented at the 4th BALTEX Study Conference, Bornholm, Denmark, May 2004.
The outline of the paper is as follows. The next section provides the data used and some
statistical properties of the data. Then the various variables of the two data sets are compared
one by one. The variables discussed are air temperature, wind speed, total cloud cover,
relative humidity and precipitation. Then in the next section results from Baltic Sea
modelling are presented and the last section provides a summary and some conclusions.
0 Material and statistics
1 The gridded data set from SMHI (SMHI 1° X 1°) covers the 1970-2004 period using mainly
meteorological surface parameters. This data set is available from the BALTEX
œ Hydrological Data Centre (BHDC, http://www.gkss.de/baltex/) and is briefly described in
Omstedt et al. (1997). The data set is continuously updated with a delay of about half a year,
and has been used in several ocean and hydrological projects. For example, Rutgersson et al.
(2001) analysed precipitation over the Baltic Sea using this database and other methods.
Rutgersson et al. (2002) and Omstedt et al. (1997) examined net precipitation rates over the
Baltic Sea. Hennemuth et al. (2003) analysed various methods for calculating turbulent
fluxes over the Baltic Sea, with one method using ocean modelling and the SMHI database.
Lehmann and Hinrichsen (2001), Meier and Döscher (2002) and Omstedt and Axell (2003)
applied the same database in modelling the Baltic Sea; Graham (1999) applied the same data
in large-scale hydrological modelling.
The ERA40 reanalysis project (http://www.ecmwf.int/research/era/), covering the 1957—
2002 period, has been a major undertaking of the ECMWF. Through combining a large
number of observations of various origins and numerical modelling, several different
meteorological variables have been calculated and made available to the research
community. The ERA40 data have already been analysed in some other studies. For
example, Karlsson (2003) has found good agreement between ERA40 data and NOAA
AVHRR satellite data.
The time period from 1 January 1971 to 31 December 2000 was used in the comparison.
The two data sets both have a resolution of 1° X 1°, a resolution that does not resolve the
complex geometry of the Baltic Sea. The land influence arising from this coarse resolution
has been analysed in the SMHI 1° X 1° data by Rutgersson et al. (2001), and Omstedt and
Axell (2003) have introduced some correction methods.
The various variables studied are temperature, wind, total cloud cover, relative humidity
and precipitation. The data were selected from several regions in the Baltic Sea (see Figure 1
and Table 1). To avoid land influence as much as possible, the strategy has been to select grid
cells in the central part of the various sub-basins. Tables 2 and 3 present summary statistics
pertaining to the two data sets. The comparison will be discussed in the next section.
Comparison of the two data sets
Air temperature
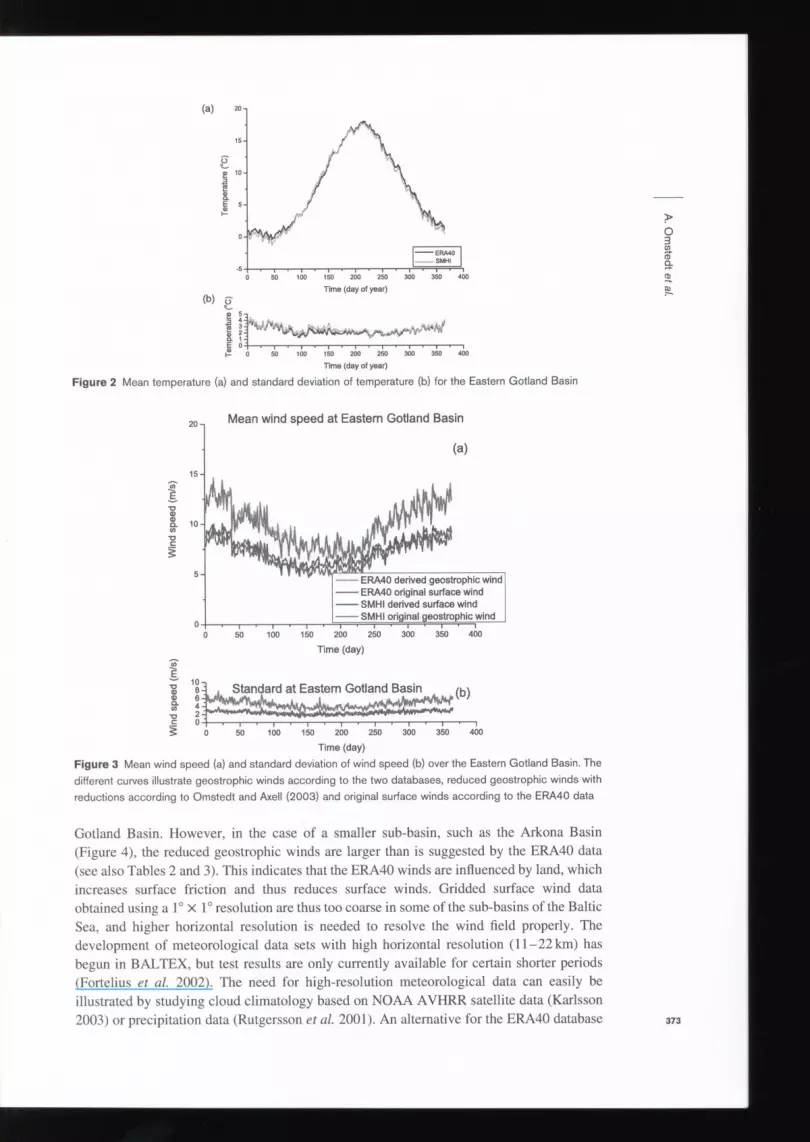
The comparison of air temperatures from the Eastern Gotland Basin is illustrated in Figure 2
as an example of what was done in the study. Both the 30-year daily mean temperatures and
standard deviations show a clear yearly cycle, with the highest standard deviation occurring
in the winter. The SMHI 1° X 1° data is slightly 'colder' and has a greater standard deviation.
However, the two temperature data sets are largely similar. Looking at other regions of the
Baltic Sea, the results are similar. In some regions the SMHI 1° X 1° data is slightly colder/
warmer, with greater/less standard deviation than the ERA40 data set. This is also reflected
in Tables 2 and 3, where the difference in mean temperatures between the two data sets is
370 less than 0.7 °C.

Archipelago Sea
Northwestern Gotland Basin
Eastern Gotland Basin
Öresund.
Bornholm Basin Arkona^
Basin ^
Finland
Sweden
60° Sea -
IS" 20" Figure 1 The Baltic Sea with sub-basins defined according to the ocean modelling. The stars indicate where
data from the different meteorological data sets were extracted
Table 1 Positions in the two analysed data sets with latitude and longitude given for the ERA40 data. The
corresponding values for the SMHI database are equal to those of the ERA40 minus 0.5° in both longitude and
latitude
Area Position
Kattegat N 57 E 12
Öresund N 56 E 13
Belt Sea N 55 E 11
Arkona Basin N 55 E 14
Bornholm Basin N 55 E 16
Eastern Gotland Basin N 57 E 19
NW Gotland Basin N 59 E 20
Gulf of Riga N 58 E 24
Gulf of Finland N 60 E 26
Archipelago Sea N 60 E 22
Aland Sea N 60 E 19
Bothnian Sea N 63 E 20
Bothnian Bay N 65 E 23
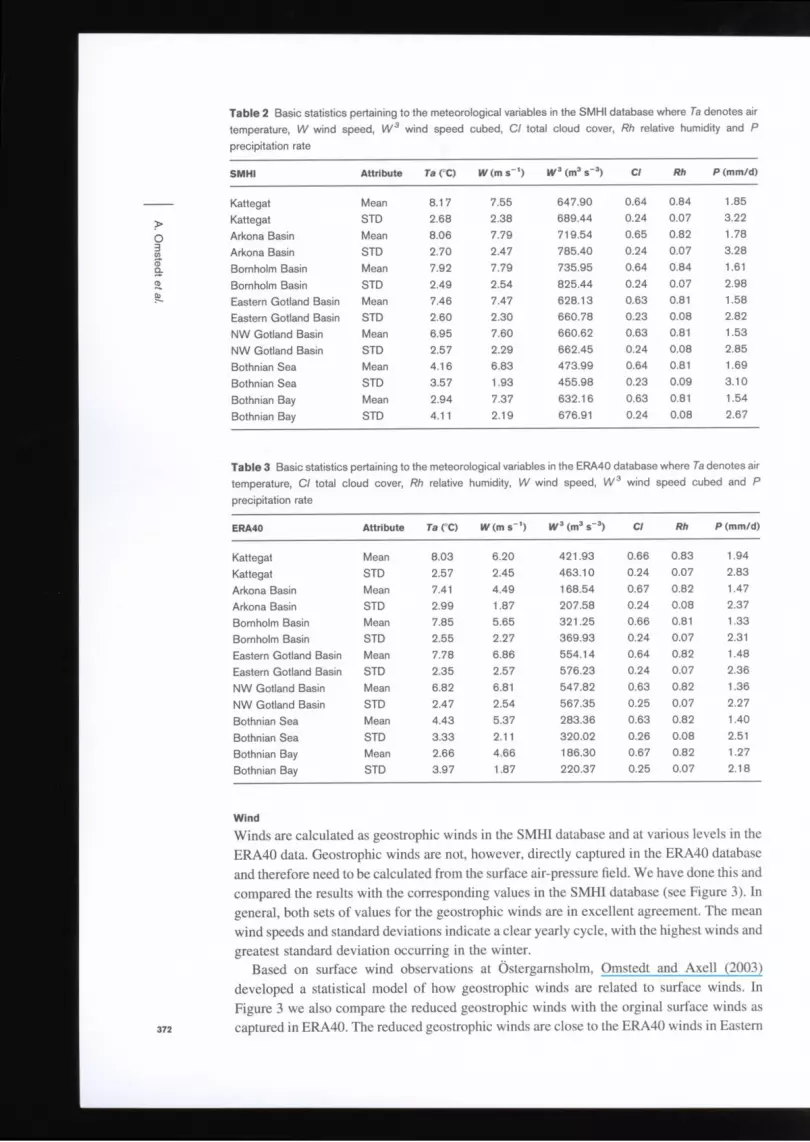
Table 2 Basic statistics pertaining to the meteorological variables in the SMHI database where Ta denotes air
temperature, W wind speed, W3 wind speed cubed, CI total cloud cover, Rh relative humidity and P
precipitation rate
SMHI Attribute Ta (X) M/(m s_1) M/3 (m3 s~3) CI Rh P (mm/d)
Kattegat Mean 8.17 7.55 647.90 0.64 0.84 1.85
Kattegat STD 2.68 2.38 689.44 0.24 0.07 3.22
Arkona Basin Mean 8.06 7.79 719.54 0.65 0.82 1.78
Arkona Basin STD 2.70 2.47 785.40 0.24 0.07 3.28
Bornholm Basin Mean 7.92 7.79 735.95 0.64 0.84 1.61
Bornholm Basin STD 2.49 2.54 825.44 0.24 0.07 2.98
Eastern Gotland Basin Mean 7.46 7.47 628.13 0.63 0.81 1.58
Eastern Gotland Basin STD 2.60 2.30 660.78 0.23 0.08 2.82
NW Gotland Basin Mean 6.95 7.60 660.62 0.63 0.81 1.53
NW Gotland Basin STD 2.57 2.29 662.45 0.24 0.08 2.85
Bothnian Sea Mean 4.16 6.83 473.99 0.64 0.81 1.69
Bothnian Sea STD 3.57 1.93 455.98 0.23 0.09 3.10
Bothnian Bay Mean 2.94 7.37 632.16 0.63 0.81 1.54
Bothnian Bay STD 4.11 2.19 676.91 0.24 0.08 2.67
Table 3 Basic statistics pertaining to the meteorological variables in the ERA40 database where 7a denotes air
temperature, CI total cloud cover, Rh relative humidity, W wind speed, W3 wind speed cubed and P
precipitation rate
ERA40 Attribute Ta CC) W (m s"') IV3 (m3 s~3) CI Rh P (mm/d)
Kattegat Mean 8.03 6.20 421.93 0.66 0.83 1.94
Kattegat STD 2.57 2.45 463.10 0.24 0.07 2.83
Arkona Basin Mean 7.41 4.49 168.54 0.67 0.82 1.47
Arkona Basin STD 2.99 1.87 207.58 0.24 0.08 2.37
Bornholm Basin Mean 7.85 5.65 321.25 0.66 0.81 1.33
Bornholm Basin STD 2.55 2.27 369.93 0.24 0.07 2.31
Eastern Gotland Basin Mean 7.78 6.86 554.14 0.64 0.82 1.48
Eastern Gotland Basin STD 2.35 2.57 576.23 0.24 0.07 2.36
NW Gotland Basin Mean 6.82 6.81 547.82 0.63 0.82 1.36
NW Gotland Basin STD 2.47 2.54 567.35 0.25 0.07 2.27
Bothnian Sea Mean 4.43 5.37 283.36 0.63 0.82 1.40
Bothnian Sea STD 3.33 2.11 320.02 0.26 0.08 2.51
Bothnian Bay Mean 2.66 4.66 186.30 0.67 0.82 1.27
Bothnian Bay STD 3.97 1.87 220.37 0.25 0.07 2.18
Wind
Winds are calculated as geostrophic winds in the SMHI database and at various levels in the
ERA40 data. Geostrophic winds are not, however, directly captured in the ERA40 database
and therefore need to be calculated from the surface air-pressure field. We have done this and
compared the results with the corresponding values in the SMHI database (see Figure 3). In
general, both sets of values for the geostrophic winds are in excellent agreement. The mean
wind speeds and standard deviations indicate a clear yearly cycle, with the highest winds and
greatest standard deviation occurring in the winter. Based on surface wind observations at Östergarnsholm, Omstedt and Axell (2003)
developed a statistical model of how geostrophic winds are related to surface winds. In
Figure 3 we also compare the reduced geostrophic winds with the orginal surface winds as
captured in ERA40. The reduced geostrophic winds are close to the ERA40 winds in Eastern
0 £ 1 I E
Time (day of year) (b)
Time (day of year)
Figure 2 Mean temperature (a) and standard deviation of temperature (b) for the Eastern Gotland Basin
Mean wind speed at Eastern Gotland Basin 20 -,
15-
1 T3 <d a) a. 1 0 -V) TJ C I
5-ERA40 derived geostrophic wind ERA40 original surface wind SMHI derived surface wind SMHI original geostrophic wind
400 250 300 350 100 150 200 0 50
Time (day)
\ , Standard at Eastern Gotland Basin
Time (day)
Figure 3 Mean wind speed (a) and standard deviation of wind speed (b) over the Eastern Gotland Basin. The
different curves illustrate geostrophic winds according to the two databases, reduced geostrophic winds with
reductions according to Omstedt and Axell (2003) and original surface winds according to the ERA40 data
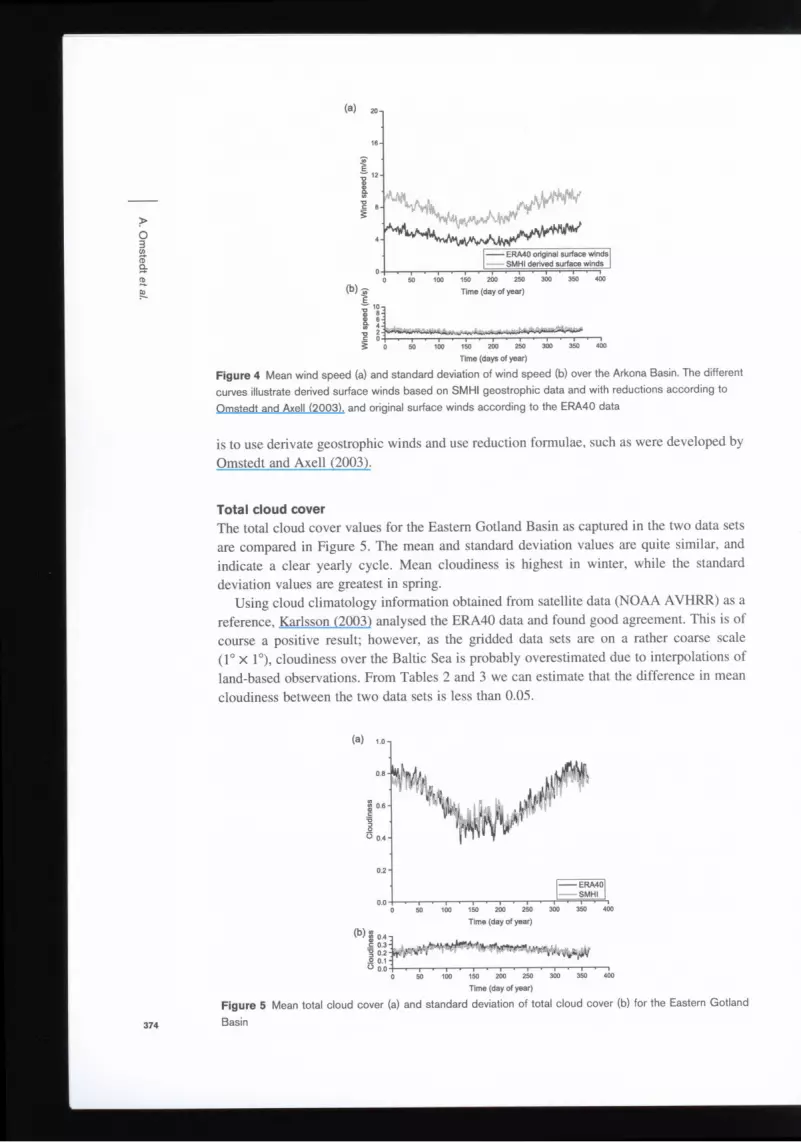
Gotland Basin. However, in the case of a smaller sub-basin, such as the Arkona Basin
(Figure 4), the reduced geostrophic winds are larger than is suggested by the ERA40 data
(see also Tables 2 and 3). This indicates that the ERA40 winds are influenced by land, which
increases surface friction and thus reduces surface winds. Gridded surface wind data
obtained using a 1° X 1° resolution are thus too coarse in some of the sub-basins of the Baltic
Sea, and higher horizontal resolution is needed to resolve the wind field properly. The
development of meteorological data sets with high horizontal resolution (11-22 km) has
begun in BALTEX, but test results are only currently available for certain shorter periods
(Fortelius et al. 2002). The need for high-resolution meteorological data can easily be
illustrated by studying cloud climatology based on NOAA AVHRR satellite data (Karlsson
2003) or precipitation data (Rutgersson et al. 2001). An alternative for the ERA40 database
(a) 20-,
, /^%Vv*A^¥ LUA.
- ERA40 original surface winds SMHI derived surface winds
(b), È •O 1 OJ i
150 200 250
Time (day of year)
2 -
50 100 150 200 250 300 350 400
Time (days of year)
Figure 4 Mean wind speed (a) and standard deviation of wind speed (b) over the Arkona Basin. The different
curves illustrate derived surface winds based on SMHI geostrophic data and with reductions according to
Omstedt and Axell (2003), and original surface winds according to the ERA40 data
is to use derivate geostrophic winds and use reduction formulae, such as were developed by
Omstedt and Axell (2003).
Total cloud cover The total cloud cover values for the Eastern Gotland Basin as captured in the two data sets
are compared in Figure 5. The mean and standard deviation values are quite similar, and
indicate a clear yearly cycle. Mean cloudiness is highest in winter, while the standard
deviation values are greatest in spring. Using cloud climatology information obtained from satellite data (NOAA AVHRR) as a
reference, Karlsson (2003) analysed the ERA40 data and found good agreement. This is of
course a positive result; however, as the gridded data sets are on a rather coarse scale
(1° X 1°), cloudiness over the Baltic Sea is probably overestimated due to interpolations of
land-based observations. From Tables 2 and 3 we can estimate that the difference in mean
cloudiness between the two data sets is less than 0.05.
(a)
S0.6-
" 0.4-
—ERA40 — SMHI
Time (day of year)
u 0.0 H—<—r—•—i—»—i—•—i—'—i—'—i—'—i—'—i 0 50 100 150 200 250 300 350 400
Time (day of year)
Figure 5 Mean total cloud cover (a) and standard deviation of total cloud cover (b) for the Eastern Gotland
Basin
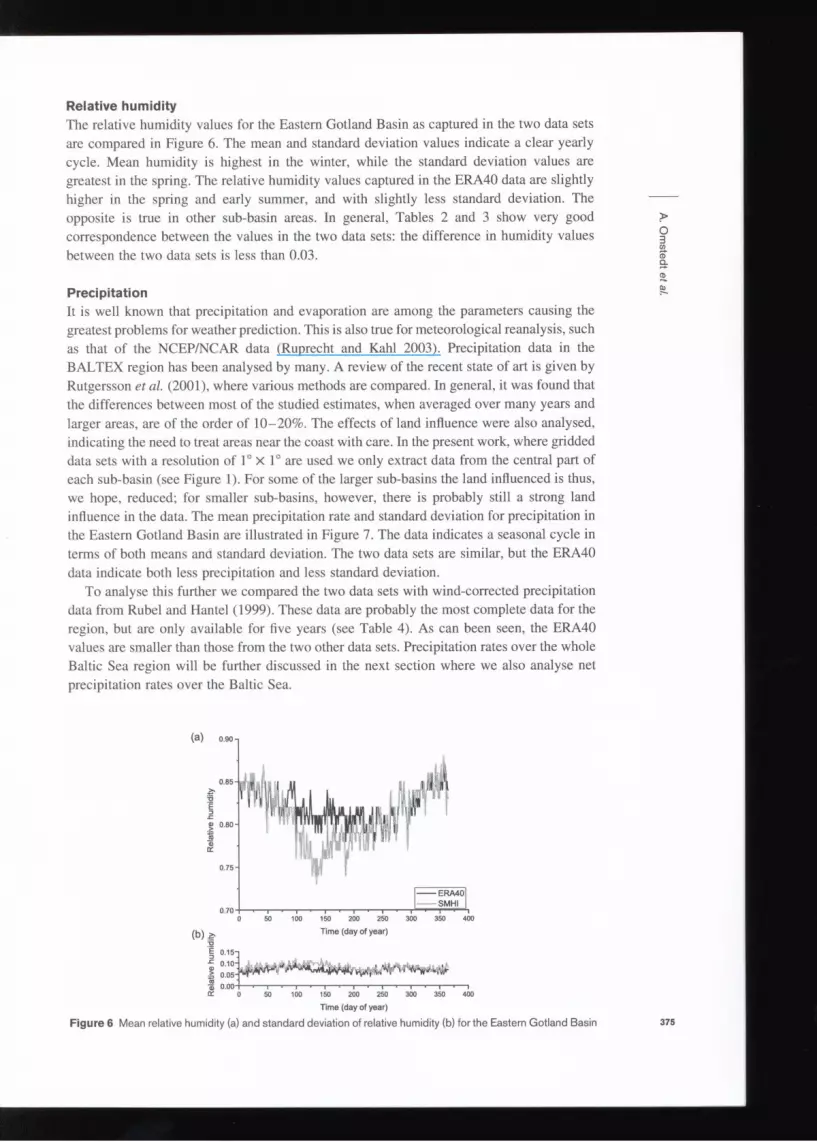
Relative humidity
The relative humidity values for the Eastern Gotland Basin as captured in the two data sets
are compared in Figure 6. The mean and standard deviation values indicate a clear yearly
cycle. Mean humidity is highest in the winter, while the standard deviation values are
greatest in the spring. The relative humidity values captured in the ERA40 data are slightly
higher in the spring and early summer, and with slightly less standard deviation. The
opposite is true in other sub-basin areas. In general, Tables 2 and 3 show very good >
correspondence between the values in the two data sets: the difference in humidity values ° 0)
between the two data sets is less than 0.03. o Q.
CD
Precipitation * It is well known that precipitation and evaporation are among the parameters causing the
greatest problems for weather prediction. This is also true for meteorological reanalysis, such
as that of the NCEP/NCAR data (Ruprecht and Kahl 2003). Precipitation data in the
BALTEX region has been analysed by many. A review of the recent state of art is given by
Rutgersson et al. (2001), where various methods are compared. In general, it was found that
the differences between most of the studied estimates, when averaged over many years and
larger areas, are of the order of 10-20%. The effects of land influence were also analysed,
indicating the need to treat areas near the coast with care. In the present work, where gridded
data sets with a resolution of 1° X 1° are used we only extract data from the central part of
each sub-basin (see Figure 1). For some of the larger sub-basins the land influenced is thus,
we hope, reduced; for smaller sub-basins, however, there is probably still a strong land
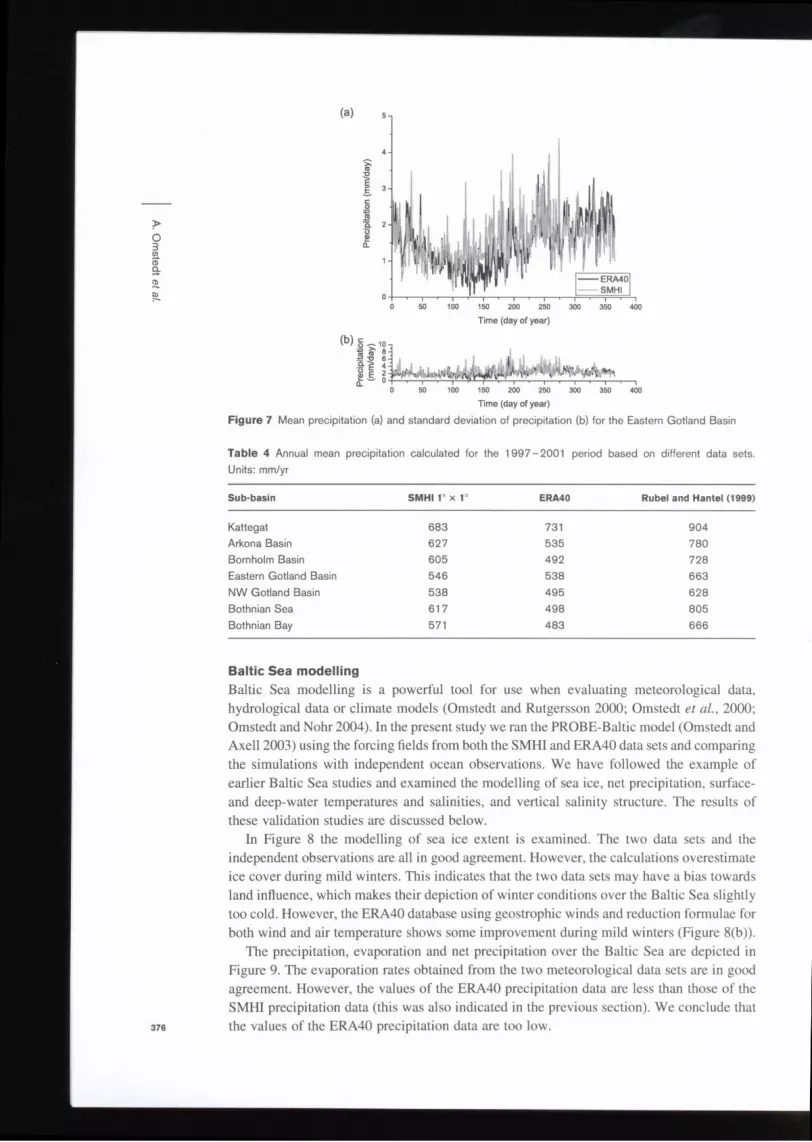
influence in the data. The mean precipitation rate and standard deviation for precipitation in
the Eastern Gotland Basin are illustrated in Figure 7. The data indicates a seasonal cycle in
terms of both means and standard deviation. The two data sets are similar, but the ERA40
data indicate both less precipitation and less standard deviation.
To analyse this further we compared the two data sets with wind-corrected precipitation
data from Rubel and Hantel (1999). These data are probably the most complete data for the
region, but are only available for five years (see Table 4). As can been seen, the ERA40
values are smaller than those from the two other data sets. Precipitation rates over the whole
Baltic Sea region will be further discussed in the next section where we also analyse net
precipitation rates over the Baltic Sea.
(a)
£ "D E
"filiijj »
I i pP»
J ! ERA40
—«—i—i—«—i—i—i , SMHI
—i 11 ' 1 '1
(b)£ 2 1 0.15-
0.10-
0.05-
o.oo-
150 200 250
Time (day of year)
50 100 150 200 250 300 350 400
Time (day of year)
Figure 6 Mean relative humidity (a) and standard deviation of relative humidity (b) for the Eastern Gotland Basin
(a) 5-,
ERA40 SMHI
Time (day of year)
Time (day of year)
Figure 7 Mean precipitation (a) and standard deviation of precipitation (b) for the Eastern Gotland Basin
Table 4 Annual mean precipitation calculated for the 1997-2001 period based on different data sets.
Units: mm/yr
Sub-basin SMHI 1° x 1° ERA40 Rubel and Hantel (1999)
Kattegat 683 731 904
Arkona Basin 627 535 780
Bornholm Basin 605 492 728
Eastern Gotland Basin 546 538 663
NW Gotland Basin 538 495 628
Bothnian Sea 617 498 805
Bothnian Bay 571 483 666
Baltic Sea modelling
Baltic Sea modelling is a powerful tool for use when evaluating meteorological data,
hydrological data or climate models (Omstedt and Rutgersson 2000; Omstedt et al., 2000;
Omstedt and Nohr 2004). In the present study we ran the PROBE-Baltic model (Omstedt and
Axell 2003) using the forcing fields from both the SMHI and ERA40 data sets and comparing
the simulations with independent ocean observations. We have followed the example of
earlier Baltic Sea studies and examined the modelling of sea ice, net precipitation, surface-
and deep-water temperatures and salinities, and vertical salinity structure. The results of
these validation studies are discussed below.
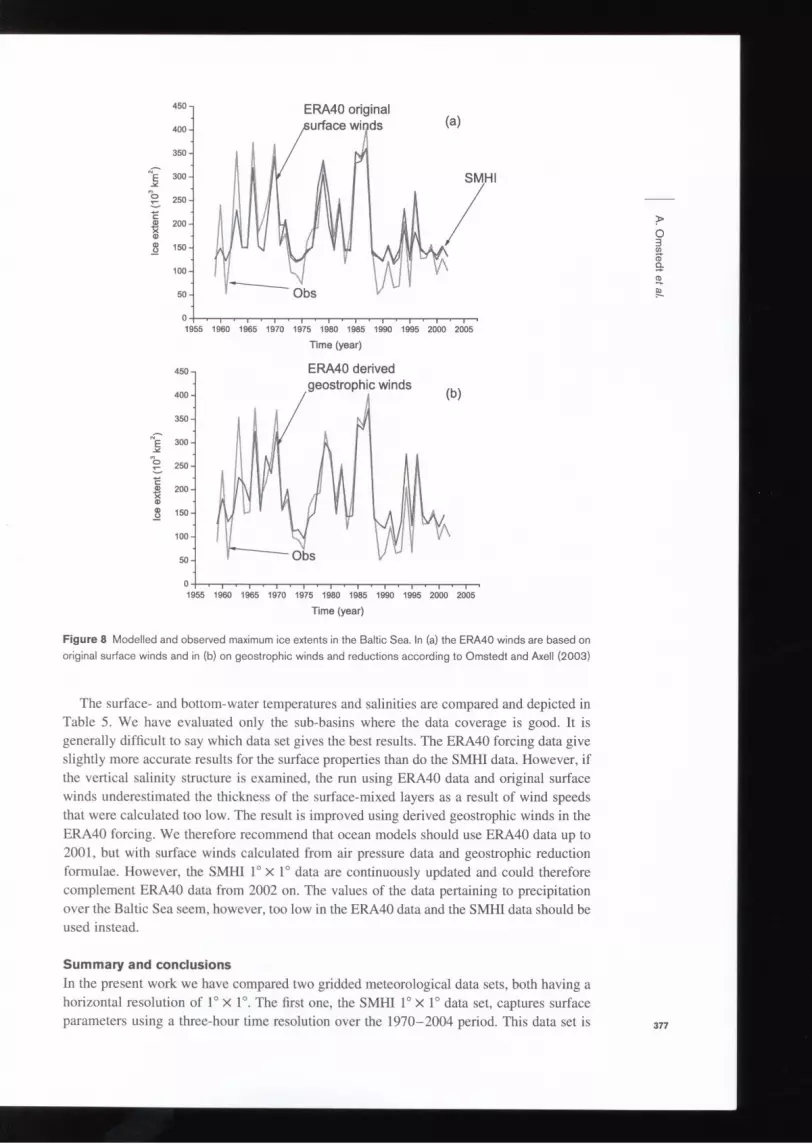
In Figure 8 the modelling of sea ice extent is examined. The two data sets and the
independent observations are all in good agreement. However, the calculations overestimate
ice cover during mild winters. This indicates that the two data sets may have a bias towards
land influence, which makes their depiction of winter conditions over the Baltic Sea slightly
too cold. However, the ERA40 database using geostrophic winds and reduction formulae for
both wind and air temperature shows some improvement during mild winters (Figure 8(b)).
The precipitation, evaporation and net precipitation over the Baltic Sea are depicted in
Figure 9. The evaporation rates obtained from the two meteorological data sets are in good
agreement. However, the values of the ERA40 precipitation data are less than those of the
SMHI precipitation data (this was also indicated in the previous section). We conclude that
the values of the ERA40 precipitation data are too low.
450-i
400-
350-
1 300-
250-
c 0) 200-200-<D
8 150-
100-
50-
0-
ERA40 original surface winds
SMHI
Obs
4501
400-
350-
F 300-
o 250-
c 0) 200-k
200-O) 8 150-
100-
50-
0-
1960 1965 1970 1975 1980 1985 1990 1995 2000 2005
Time (year)
ERA40 derived geostrophic winds
•—i—.—i—i—i—i—i—i—i—.—i—i—i—i—i—.—i—.—i—, 1960 1965 1970 1975 1980 1985 1990 1995 2000 2005
Time (year)
Figure 8 Modelled and observed maximum ice extents in the Baltic Sea. In (a) the ERA40 winds are based on
original surface winds and in (b) on geostrophic winds and reductions according to Omstedt and Axell (2003)
The surface- and bottom-water temperatures and salinities are compared and depicted in
Table 5. We have evaluated only the sub-basins where the data coverage is good. It is
generally difficult to say which data set gives the best results. The ERA40 forcing data give
slightly more accurate results for the surface properties than do the SMHI data. However, if
the vertical salinity structure is examined, the run using ERA40 data and original surface
winds underestimated the thickness of the surface-mixed layers as a result of wind speeds
that were calculated too low. The result is improved using derived geostrophic winds in the
ERA40 forcing. We therefore recommend that ocean models should use ERA40 data up to
2001, but with surface winds calculated from air pressure data and geostrophic reduction
formulae. However, the SMHI 1° X 1° data are continuously updated and could therefore
complement ERA40 data from 2002 on. The values of the data pertaining to precipitation
over the Baltic Sea seem, however, too low in the ERA40 data and the SMHI data should be used instead.
O 3
Summary and conclusions
In the present work we have compared two gridded meteorological data sets, both having a
horizontal resolution of 1° X 1°. The first one, the SMHI 1° X 1° data set, captures surface
parameters using a three-hour time resolution over the 1970-2004 period. This data set is

(a)
I e.
(c)
1 i
Figure 9 Interannual variation of precipitation (a) evaporation (b) and net precipitation (c) over the Baltic Sea
(the Kattegat and Danish Straits are not included). The precipitation data are extracted from the two data sets
and the evaporation is calculated using the PROBE Baltic model
continuously updated and is available from the BALTEX Hydrological Data Centre. The
second one, the ERA40 data set, includes analysed and modelled parameters for several
layers in the atmosphere using a six-hour time resolution over the 1957-2002 period. This
data set is available from the ECMWF.
The aim of this study was to compare two gridded meteorological data sets and find out
which is more reliable for Baltic Sea modelling. The meteorological variables considered
were air temperature, wind speed, total cloud cover, relative humidity and precipitation. In
modelling the Baltic Sea we examined the maximum ice extent, water temperature, salinity
and net precipitation calculations.
We tested the two data sets using the same Baltic Sea model, the same period and the
same validation data. Both data sets can be used to run Baltic Sea models, but the 1° X 1°
resolution gridded meteorological data sets for the Baltic Sea are still too coarse; this implies,
for example, that the original ERA40 surface winds are often underestimated due to land
influence. It is also clear that the precipitation data from the ERA40 reanalysed data set
appears to underestimate the amount of precipitation over the Baltic Sea.
There is generally good agreement between the two data sets. The ERA40 data offer much
more variables for investigation than do the SMHI 1° X 1° data. However, the SMHI 1° X 1°
data are continuously updated and could therefore complement ERA40 data from 2002 on.
The ERA40 precipitation data appear to underestimate precipitation over the Baltic Sea, and
the horizontal resolution is too coarse, at least in parts of the Baltic Sea region. The
378 conclusions from the paper can be summarised as follows:
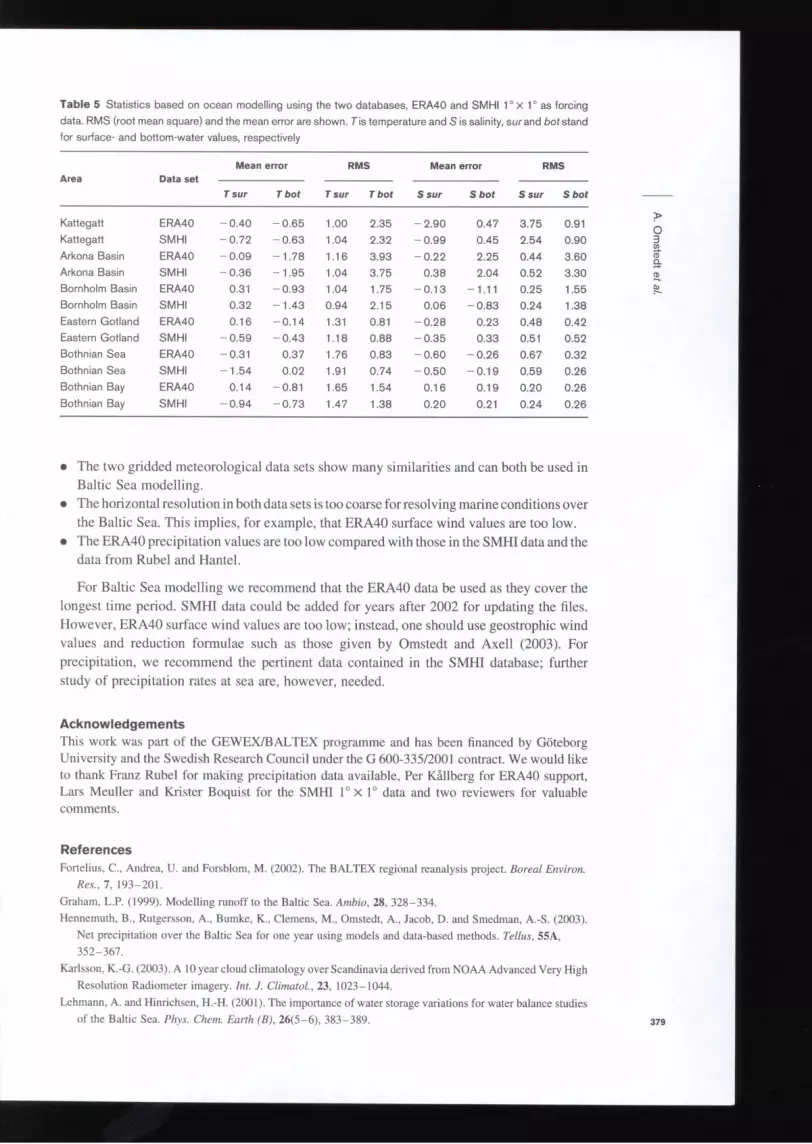
Table 5 Statistics based on ocean modelling using the two databases, ERA40 and SMHI 1° x 1° as forcing
data. RMS (root mean square) and the mean error are shown. Fis temperature and S is salinity, surand bot stand
for surface- and bottom-water values, respectively
Area Data set
Mean error RMS Mean error RMS Area Data set
T sur T bot T sur T bot S sur Shot S sur S bot
Kattegatt ERA40 -0.40 -0.65 1.00 2.35 -2.90 0.47 3.75 0.91
Kattegatt SMHI -0.72 -0.63 1.04 2.32 -0.99 0.45 2.54 0.90
Arkona Basin ERA40 -0.09 -1.78 1.16 3.93 -0.22 2.25 0.44 3.60
Arkona Basin SMHI -0.36 -1.95 1.04 3.75 0.38 2.04 0.52 3.30
Bornholm Basin ERA40 0.31 -0.93 1.04 1.75 -0.13 -1.11 0.25 1.55
Bornholm Basin SMHI 0.32 -1.43 0.94 2.15 0.06 -0.83 0.24 1.38
Eastern Gotland ERA40 0.16 -0.14 1.31 0.81 -0.28 0.23 0.48 0.42
Eastern Gotland SMHI -0.59 -0.43 1.18 0.88 -0.35 0.33 0.51 0.52
Bothnian Sea ERA40 -0.31 0.37 1.76 0.83 -0.60 -0.26 0.67 0.32
Bothnian Sea SMHI -1.54 0.02 1.91 0.74 -0.50 -0.19 0.59 0.26
Bothnian Bay ERA40 0.14 -0.81 1.65 1.54 0.16 0.19 0.20 0.26
Bothnian Bay SMHI -0.94 -0.73 1.47 1.38 0.20 0.21 0.24 0.26
• The two gridded meteorological data sets show many similarities and can both be used in Baltic Sea modelling.
• The horizontal resolution in both data sets is too coarse for resolving marine conditions over
the Baltic Sea. This implies, for example, that ERA40 surface wind values are too low.
• The ERA40 precipitation values are too low compared with those in the SMHI data and the
data from Rubel and Hantel.
For Baltic Sea modelling we recommend that the ERA40 data be used as they cover the
longest time period. SMHI data could be added for years after 2002 for updating the files.
However, ERA40 surface wind values are too low; instead, one should use geostrophic wind
values and reduction formulae such as those given by Omstedt and Axell (2003). For
precipitation, we recommend the pertinent data contained in the SMHI database; further
study of precipitation rates at sea are, however, needed.
Acknowledgements This work was part of the GEWEX/BALTEX programme and has been financed by Göteborg University and the Swedish Research Council under the G 600-335/2001 contract. We would like to thank Franz Rubel for making precipitation data available, Per Kållberg for ERA40 support, Lars Meuller and Krister Boquist for the SMHI 1° X 1° data and two reviewers for valuable comments.
References
Fortelius, C., Andrea, U. and Forsblom, M. (2002). The BALTEX regional reanalysis project. Boreal Environ.
Res., 7, 193-201.
Graham, L.P. (1999). Modelling runoff to the Baltic Sea. Ambio, 28, 328-334.
Hennemuth, B., Rutgersson, A., Bumke, K., Clemens, M., Omstedt, A., Jacob, D. and Smedman, A.-S. (2003).
Net precipitation over the Baltic Sea for one year using models and data-based methods. Tellus, 55A,
352-367.
Karlsson, K.-G. (2003). A 10 year cloud climatology over Scandinavia derived from NOAA Advanced Very High
Resolution Radiometer imagery. Int. J. Climatol., 23, 1023-1044.
Lehmann, A. and Hinrichsen, H.-H. (2001). The importance of water storage variations for water balance studies
of the Baltic Sea. Phys. Chem. Earth (B), 26(5-6), 383-389.
Meier, H.E.M. and Döscher, R. (2002). Simulated water and heat cycles of the Baltic Sea using a 3D coupled
atmosphere-ice-ocean model. Boreal Environ. Res., 7, 327-334.
Omstedt, A. and Axell, L. (2003). Modeling the variations of salinity and temperature in the large Gulfs of the
Baltic Sea. Continental Shelf Res., 23, 265-294.
Omstedt, A., Gustafsson, B„ Rodhe, B. and Walin, G. (2000). Use of Baltic Sea modelling to investigate the water
and heat cycles in GCM and regional climate models. Climate Res., 15, 95-108.
Omstedt, A., Meuller, L. and Nyberg, L. (1997). Interannual, seasonal and regional variations of precipitation and
^ evaporation over the Baltic Sea. Ambio, 26(8), 484-492.
3* Omstedt, A. and Nohr, C. (2004). Calculating the water and heat balances of the Baltic Sea using ocean modelling W c? and available meteorological, hydrological and ocean data. Tellus, 56A, 400-414.
a Omstedt, A. and Rutgersson, A. (2000). Closing the water and heat cycles of the Baltic Sea. Meteorol. Z„ 9,
8L 57-64.
Rubel, F. and Hantel, M. (1999). Correction of daily rain gauge measurements in the Baltic Sea drainage basin.
Nordic Hydrol., 30(3), 191-208.
Ruprecht, E. and Kahl, T. (2003). Investigation of the atmospheric water budget of the BALTEX area using
NCEP/NCAR reanalysis data. Tellus, 55A, 426-437.
Rutgersson, A., Bumke, K., Clemens, M., Foltescu, V., Lindau, R., Michelson, D. and Omstedt, A. (2001).
Precipitation estimates over the Baltic Sea: Present State of the Art. Nordic Hydrol., 32(4), 285-314.
Rutgersson, A., Omstedt, A. and Räisänen, J. (2002). Net precipitation over the Baltic Sea during present and
future climate conditions. Climate Res., 22, 27-39.
380
Copyright © 2022 FDOKUMEN