
A COMPARATIVE STUDY OF - VTechWorks - Virginia Tech
175
A COMPARATIVE STUDY OF ·mE FLEXIBILI1Y OF THREE 1YPES OF APPAREL PRODUCTION SYSTEI\tlS TO VARIATIONS IN COLLAR DESIGNS by K.S.Kanakadurga Thesis submitted to the Faculty of the Virginia Pol)1echnic Institute and State University in partial fulfillment or requirements for the degree or MASTER OF SCIENCE APPROVED: CarolynlL. Moore Assistant Professor Clothing and Textiles in Clothing and Textiles Doris Chairman Assistant Professor Clothing and Textiles June 1994 Blacksburg, Virginia R8bert T: Sumichrast Associate Professor Management Science
-
Upload
khangminh22 -
Category
Documents
-
view
0 -
download
0
Transcript of A COMPARATIVE STUDY OF - VTechWorks - Virginia Tech

A COMPARATIVE STUDY OF ·mE FLEXIBILI1Y
OF THREE 1YPES OF APPAREL PRODUCTION SYSTEI\tlS
TO VARIATIONS IN COLLAR DESIGNS
by
K.S.Kanakadurga
Thesis submitted to the Faculty
of the Virginia Pol)1echnic Institute and State University
in partial fulfillment or requirements for the degree or MASTER OF SCIENCE
APPROVED:
CarolynlL. Moore Assistant Professor
Clothing and Textiles
in Clothing and Textiles
Doris H~ncade, Chairman Assistant Professor
Clothing and Textiles
June 1994 Blacksburg, Virginia
R8bert T: Sumichrast Associate Professor
Management Science

A COMPARATIVE STUDY OF THE FLEXIBILI1Y
OF THREE 1YPES OF APPAREL PRODUCTION SYSTEMS
TO VARIATIONS IN COLLAR DESIGNS
by
K..S.Kanakadurga
Committee Chairman: Doris H. Kincade Clothing and Textiles
(ABSTRACT)
The purpose of this study was to examine and compare the flexibilities of
three apparel production systems to variations in products manufactured on them.
The production system used by a company was determined based on five system
attributes (i.e., type of workflow, level of WIP inventory, number of tasks, mode of
transportation between workstations, and level of interaction between operators).
The product line of the company (i.e., staple, semi-staple, fashion, and high-
fashion) was determined based on the number and type of collar designs
manufactured by the company. Flexibility of a system was determined by the
range of collar designs manufactured by the system.
A stratified proportionate random sample of manufacturers producing
men's and women's shirts and blouses was selected for the survey. The
questionnaire was pilot tested for content validity and reliability. The adjusted
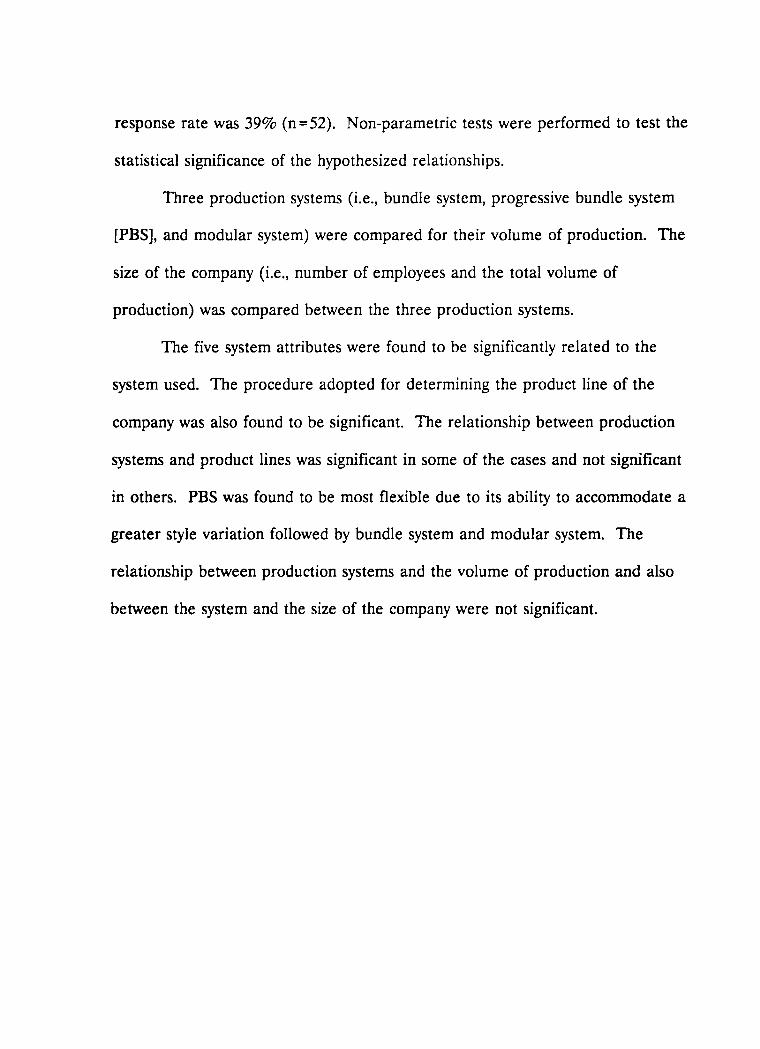
response rate was 39% (n=52). Non-parametric tests were performed to test the
statistical significance of the hypothesized relationships.
Three production systems (i.e., bundle system, progressive bundle system
[PBS], and modular system) were compared for their volume of production. The
size of the company (i.e., number of employees and the total volume of
production) was compared between the three production systems.
The five system attributes were found to be significantly related to the
system used. The procedure adopted for determining the product line of the
company was also found to be significant. The relationship between production
systems and product lines was significant in some of the cases and not significant
in others. PBS was found to be most flexible due to its ability to accommodate a
greater style variation followed by bundle system and modular system. The
relationship between production systems and the volume of production and also
between the system and the size of the company were not significant.

Dedicated to my Parents, Husband, Sister, Brother, and
for their unending love and support
&
my advisor
Dr. Doris H. Kincade for her invaluable patience and support
IV

ACKNOWLEDGEMENTS
I sincerely wish to thank my advisor Dr. Doris H. Kincade, for her
continued guidance, incredible patience, support, and encouragement through out
the process of this research. I also thank my committee members, Dr. Carolyn L.
Moore and Dr. Robert T. Sumichrast, for their valuable suggestions, keen interest,
and co-operation with this seemingly never ending process.
I wish to thank the International Textiles and Apparel Association (IT AA)
for the valuable research funds.
Thanks are due, to Dr. Coakely for assisting in instrument development
and statistical analysis and to Dr. Frari for assisting with the statistical analysis.
I wish to thank my host family, Dr. Vera J. Wall, for her warmth and
constant encouragement throughout the course of my master's program .
I wish to thank , and for their valuable time in assisting
with the data collection. I wish to thank my friends , and
for keeping my spirits high when things didn't seem to go fine.
v

TABLE OF CONTENTS
ABSTRACT .................................................. ii ACKNOWLEDGEMENTS ....................................... v LIST OF TABLES . . . . . . . . . . . . . . . . . . . . . . . . . . . . . . . . . . . . . . . . . . . vin LIST OF FIGURES ............................................. x CHAPTER
I. Introduction . . . . . . . . . . . . . . . . . . . . . . . . . . . . . . . . . . . . . . . . 1 Background . . . . . . . . . . . . . . . . . . . . . . . . . . . . . . . . . . . . 1 Statement of purpose . . . . . . . . . . . . . . . . . . . . . . . . . . . . 3 Conceptual framework . . . . . . . . . . . . . . . . . . . . . . . . . . . 4 Definitions . . . . . . . . . . . . . . . . . . . . . . . . . . . . . . . . . . . . 9
II. Review of literature . . . . . . . . . . . . . . . . . . . . . . . . . . . . . . . . . . 12
III. Statement of problem . . . . . . . . . . . . . . . . . . . . . . . . . . . . . . . . 52 Research problem . . . . . . . . . . . . . . . . . . . . . . . . . . . . . . 54 Objectives . . . . . . . . . . . . . . . . . . . . . . . . . . . . . . . . . . . . 54 Hypotheses . . . . . . . . . . . . . . . . . . . . . . . . . . . . . . . . . . . 54 Assumptions . . . . . . . . . . . . . . . . . . . . . . . . . . . . . . . . . . 56
IV. Research method . . . . . . . . . . . . . . . . . . . . . . . . . . . . . . . . . . . 58 Research design . . . . . . . . . . . . . . . . . . . . . . . . . . . . . . . 58 Instrument . . . . . . . . . . . . . . . . . . . . . . . . . . . . . . . . . . . 59 Sample selection . . . . . . . . . . . . . . . . . . . . . . . . . . . . . . . 65 Data collection . . . . . . . . . . . . . . . . . . . . . . . . . . . . . . . . 67 Data analysis . . . . . . . . . . . . . . . . . . . . . . . . . . . . . . . . . 68 Statistical tests ................................ 71 Limitations . . . . . . . . . . . . . . . . . . . . . . . . . . . . . . . . . . . 72
V. Results and discussion ................................ 74 Response Rate of the Survey . . . . . . . . . . . . . . . . . . . . . . 74 Company Demographics . . . . . . . . . . . . . . . . . . . . . . . . . 77 Production Systems . . . . . . . . . . . . . . . . . . . . . . . . . . . . . 82 Product Line . . . . . . . . . . . . . . . . . . . . . . . . . . . . . . . . . . 96 Production System Vs Product Line . . . . . . . . . . . . . . . . 100 Production System Vs Volume of Production ......... 104 Production System Vs Size of Company ............. 107
Vl
VI. Summary, Conclusions, Implications and Suggestions . . . . . . . . 111
BIBLIOGRAPHY . . . . . . . . . . . . . . . . . . . . . . . . . . . . . . . . . . . . . . . . . . . . 122 APPENDICES ............................................... 127
A - Collar designs for Q-Sorts . . . . . . . . . . . . . . . . . . . . . . . . . . . . . . 128 B - Cover letter . . . . . . . . . . . . . . . . . . . . . . . . . . . . . . . . . . . . . . . . . 130 C - Questionnaire . . . . . . . . . . . . . . . . . . . . . . . . . . . . . . . . . . . . . . . 131 D - Follow-up Post card ................................... 135
SUPPLEMENT . . . . . . . . . . . . . . . . . . . . . . . . . . . . . . . . . . . . . . . . . . . . . . 136
VITA ...................................................... 165
Vll

Table 1
Table 2
Table 3
Table 4
Table 5
Table 6
Table 7
Table 8
Table 9
Table 10
Table 11
Table 12
Table 13
Table 14
Table 15
LIST OF TABLES
Manufacturing System Elements and Groups by Troxler and Blank(1989) . . . . . . . . . . . . . . . . . . . . . . . . . . . . . . . . . . . . 7
Manufacturing System Groups and Sub-Groups by Piener, Kruger, and Adendorff (1986) ........................... 8
Similarities in the Groups and Sub-Groups of Manufacturing System Value Holders ................................. 8
The Merchandise Classification for Apparel Products . . . . . . . . . 13
SIC Classification . . . . . . . . . . . . . . . . . . . . . . . . . . . . . . . . . . . 16
Relation between Product line and Product line Attributes . . . . . 20
Classification of Collar designs based on Collar Styles and Collar Types ..................................... 29-30
Uncertainties in the Manufacturing Environment and the Associated Flexibility Required for Manufacturing Systems (Gerwin, 1987) . . . . . . . . . . . . . . . . . . . . . . . . . . . . . . . . . . . . . 46
Attributes of the Three Production Systems ................ 61
Product Categories Manufactured by the Respondents . . . . . . . . 81
WIP Inventory Levels of the Determined Production system . . . . 86
Workflow for the Determined Production systems ........... 87
Mode of Transfer of Workunits in the Determined Production Systems ........................................... 89
Number of Tasks Per Operator in the Determined Production systems . . . . . . . . . . . . . . . . . . . . . . . . . . . . . . . . . . . . . . . . . . 93
Degree of Worker Interaction in the Determined Production Systems ........................................... 95
Vlll

Table 16 Relationship Between System Attributes and Production Systems ........................................... 96
fable 17 Frequency Distribution of the Product line Categories based on Collar Designs . . . . . . . . . . . . . . . . . . . . . . . . . . . . . . . . . . . 98
lX
LIST OF FIGURES
Figure 1 Example of Product Categorization based on the AAMA Classification ................................. 14
Figure 2 Illustration of Collar types . . . . . . . . . . . . . . . . . . . . . . . . . . . . . 24
:;-igure 3 Return Rate for the Survey . . . . . . . . . . . . . . . . . . . . . . . . . . . . 76
Size Breakdown of Companies by Number of Employees ...... 78
:;oigure 5 Size Breakdown of Companies by Total Volume of Production of the Company . . . . . . . . . . . . . . . . . . . . . . . . . . . . 79
Production System Usage . . . . . . . . . . . . . . . . . . . . . . . . . . . . . 83
'igure 7 Product Lines Manufactured by the Companies . . . . . . . . . . . . . 99
'igure 8 Product Lines Manufactured on the three Production systems .......................................... 102
'igure 9 Volume of Production on the three Production Systems .......................................... 105
~igure 10 Production System Usage by Size of Company (No. of Employees) . . . . . . . . . . . . . . . . . . . . . . . . . . . . . . . . . . . . . . . 108
~igure 11 Production System Usage by Size of Company (Vol. of Production) ....................................... 110
x

CHAPTER I
Introduction
Backmund
The U.S. apparel market is fast changing and offers a challenge that few
other consumer products offer to marketeers and manufacturers alike. The
American apparel market is characterized by increasing number of imports, an
individualistic consumer, and fast turns in fashion (Lowder, 1991). In a world of
ever changing fashions, more and more apparel manufacturers are adopting
strategies suitable to capture the growing apparel market while keeping in mind
the customers' individualistic needs. With foreign producers often using low cost
labor and maintaining a competitive price for their goods, the U.S. manufacturers
will have to take a closer look at their manufacturing strategies and management
techniques (Soni, 1990).
The apparel industry has traditionally been a low capital and less advanced
industry compared to the hard goods industry, but the picture is rapidly changing
with the introduction of new and more productive apparel production equipment
(Brown, 1992). Apparel manufacturers are now choosing more appropriate and
effective production systems to face the challenges of increased competition.
1

On the other hand, the nature of the competition is constantly changing
with more emphasis being placed on improving the characteristics of the products
and being responsive to differing customer requirements (Gerwin, 1987).
According to the U.S. Office of Technological Assessment (1987), current trends
in the apparel market indicate greater variations in styles, frequent changes in
styles, shorter lead times and smaller lot sizes.
In today's world of variety and Just-in-Time (JIT) manufacturing, flexibility
of apparel manufacturing systems attains great importance and is fast emerging as
an important factor in determining the competitiveness of a manufacturing system
(Miller & Roth, 1987; Ramasesh & Jaikumar, 1991). Flexibility is used to
describe objects that are capable of conforming to changing or new situations. In
manufacturing, flexibility implies or refers to the ability of a system to cope with
changes (Gupta & Buzacott, 1989). Flexibility is required to cope with
uncertainties both in the internal and external operating environments. Changes
in the demand for particular products is an uncertainty in the external
environment (Buzacott, 1982). Flexibility of a production system is considered
one of the most important attributes in selecting an apparel production system
(Hodge & Canada, 1989).
2

Statement of purpose
Apparel is a highly complex product that varies greatly in terms of style
features and length of product life. The frequency of style change in apparel is
growing and the size of orders is getting smaller (Hodge & Canada, 1989).
Changes in the market caused by changing fashions and seasonality leads to a
wide variation in the demand for apparel items. This situation affects the styles of
apparel products that are to be produced. The styles of apparel product influence
the assembly operations during manufacturing. The fast changing nature of the
apparel market requires manufacturing systems that are capable of responding to
changes in the market, as revealed in the changes in apparel product styling (Lin,
Kincade, & Warfield, in press). With more consumers tending towards one-of-a-
kind clothing, manufacturing systems need to be highly flexible to enable
customized production with shorter production runs, while still maintaining the
economy of production (Sisselman, 1990). This type of flexibility is referred to as
mix flexibility (Gerwin, 1987). A system that is highly flexible can respond more
easily to demand than a system with little flexibility (Hodge & Canada, 1989).
Hodge and Canada ( 1989) indicate that the net worth of the system, its
manufacturing flexibility, quality, and serviceability are the most important
attributes in selecting a production system in the apparel industry. The
importance of flexibility has resulted in a need for research on issues related to
product and production characteristics as a function of degree of flexibility of a
3

production system (Soni, 1990). Information on flexibility also helps operations
managers in making decisions related to strategic issues related to flexibility
(Ramasesh & Jaikumar, 1991).
Conceptual Framework
Planning is the basis for all future managerial activities. Planning
establishes the guidelines and actions that must be taken to meet the company's
objectives and goals (Evans, Anderson, Sweeney, & Williams, 1984 ). A company's
decision making process is influenced by a number of factors like economic
conditions, government regulation, competition, and technology (Troxler & Blank,
1989).
Planning and decision-making for a company could be classified
hierarchically into strategic, tactical, and operational planning. A strategic plan
should recognize specific capabilities of the company and tools that can be used to
enhance its competitiveness (Chase & Aquilano, 1992). Strategic plans are broad
in scope, and include activities related to marketing, production, and finance.
Identification of the factors that affect each of these activities in relation to the
company's objectives and goals will help evaluate each of the three activities. For
example, in the production activity, the various internal and external factors that
affect production need to be identified. The external factors affecting production
include type of products, product mix, processing requirements, training and skill
4

of operators. The internal factors include machine and material handling system
material flow, (i.e., the intrinsic qualities of the production system), processing
time, operator absences, and quality (Buzacott, 1982). The internal factors exist
within the company and are therefore easier to control. The most important
internal factors affecting a system are the intrinsic qualities of the production
system.
Production systems are one of the major components of production in an
organization and constitute a major portion of the company's investment (Evans,
Anderson, Sweeney, & Williams, 1984 ). Selecting the right production system
assumes great importance since investors would want a system worth the
investment. Production systems have to be evaluated to help companies make
informed choice of production systems.
Evaluation of Production Systems. Evaluation of a production system is a
multi-factor decision analysis. The evaluation must consider cost issues,
technology, and operations in relation to company objectives (Troxler & Blank,
1989). The evaluation of a system follows three steps: (a) identifying the elements
that characterize the system, (b) categorizing the elements into some rational
groups to give a comprehensive indication of the value of a system, and
( c) aggregating the groups and measuring the contributions of each group to the
system (Troxler & Blank, 1989).
5

Troxler and Blank (1989) have identified suitability, capability,
performance, and productivity as the groups that comprehensively reflect a
manufacturing system's value (Table 1). Suitability of a manufacturing system
refers to compliance of the system with the corporate strategy. Capability of a
system refers to the intrinsic ability of the system. The capabilities of a
production system are evaluated in terms of the products manufactured on the
system (Frank, 1953; Georgia Institute of Technology, 1980; Wise, 1990).
Performance of a system is a measure of achievement in terms of the system's
physical performance. Productivity of a system refers to the total cost and
financial benefit of the system.
6

Table 1 Set I-Manufacturing system elements and groups by Troxler and Blank(1989)
I Groups I Elements II Groups I Elements I Suitability Investment Performance Throughput
Growth Quality Technology position Inventory Market Position Information Employee relations Capacity Workforce composition utilization Organizational structure Operations management
Capability Design of the system Productivity Economic Function infrastructure Reliability Customer Availability response CIM ability Environment Flexibility al influence Human factors Technical feasibility
Piener, Kruger, and Adendorff (1986) have identified utility, availability,
and cost-benefit (see Table 2) as the groups that comprehensively reflect a
manufacturing system's value. Utility of a system refers to the user's desirability
of the performance capabilities of a system. Availability is the ability of the
system to assume a functional state at any point of time. Cost-benefit is the
benefit obtained on cost incurred through the life cycle of the system. Each of
the groups is a combination of two sub-groups (see Table 2). Sub-groups consist
of elements.
7

Table 2 Set 2-Manufacturing system groups and sub-groups by Piener, Kruger and
AdendorfT (1986)
Groups Sub-Groups
Utility Suitability Effectiveness
Availability Reliability Maintainability
Cost- Cash-flow Benefit Timing
The groups identified by Piener et al. (1986) are similar but not identical
to the groups identified by Troxler and Blank (see Table 3). The utility group of
Set 2 is split into two groups in Set 1 (i.e., suitability and performance).
Table 3 Similarities between Group 1 and Group 2
I Set 1 I Set 2 I Suitability
Performance Utility
Capability Availability
Productivity Cost-benefit
The attributes of the system are compiled and lastly, they are evaluated
mathematically to determine the value of a manufacturing system (Troxler &
Blank, 1989). For an aggregate value of a manufacturing system, all the groups
8

and the corresponding elements of the groups needs to be evaluated. For
example, in order to determine the capability of a system all the elements of
capability need to evaluated.
Definitions
For clarity in understanding the important terms have been defined:
Collar is a decorative and functional feature on the neckline of a garment (Kopp,
Rolfo, Zelin, & Gross, 1987).
Collar types is defined as the shape of the collar neckline (Kopp, Rolfo, Zelin, &
Gross, 1987).
Collar styles is defined as the shape of the outeredge of the collar (Kopp, Rolfo,
Zelin, & Gross, 1987).
Collar design is defined as the look of a collar with variation in the collar type
and collar style.
Degree of Style Variation is the variation that occurs between the first and
following styles (Lin, Kincade, & Warfield, in press). For this study the degree of
variation may be defined as the variation that exists between any two styles on a
continuum. The wider the range of characteristics between the part types of two
styles, the higher the degree of variation.
Flexibility of a manufacturing system is defined as the capability of a system to
continue to function effectively in response to a wide range of changes in the
9

manufacturing environment (Mandelbaum, 1982; Ramasesh & Jaikumar, 1991;
and Zelenovic, 1982).
Mix flexibility is defined as the ability of a system to produce a number of
products at the same time (Gerwin, 1987). For this study, mix flexibility has been
defined as the ability of a system to produce a number of part types (i.e., collar
designs) at the same time.
Operation is a function whose input parameters consist of a workpiece, a
machine, or a group of machines together with their corresponding operating job
(Chase & Aquilano, 1992).
Part is one component of a garment (eg., collar, sleeves, placket). A part is
manufactured by performing a required task or set of tasks.
Part types refers to the varieties of a part. In womens' blouse for example, a
sleeve could be a part and the different types of sleeves would be the part types.
Product is made up of a set of assembled parts, in this case a garment (Evans,
Anderson, Sweeney, & Williams, 1984 ).
Production is "the process of converting the resources available to an organization
into products"(Evans, Anderson, Sweeney, & Williams, 1984, p. 9).
Production/ Manufacturing System is a set of activities and operations related to
production (Evans, Anderson, Sweeney, & Williams, 1984). A production system
is defined as a set of components whose function is to convert a set of inputs into
some desired output through a transformation process (Chase & Aquilano, 1992).
10

The terms production system and manufacturing system are used interchangeably
(Ramasesh & Jaikumar, 1991).
Task is defined as a function whose input parameters include one or more
operations. A task could be all the operations performed at one workstation, or
single operations. Tasks maybe input to higher level tasks (i.e., assembly and
subassembly) (Hapeman, 1971).
Work-in-Process (WIP) is the stock of partially finished goods.
Workunit is a physical object that undergoes a sequence of transformations during
the production process. When a workunit undergoes an operation, it is changed
in some physical manner (Hapeman, 1971).
11
CHAPTER II
Literature Review
The purpose of this research was to compare the flexibilities of three types
of apparel production systems across variations in the collar designs of men's and
women's shirts and blouses. The literature for this research is reviewed in the
following broad sections (a) apparel products and classifications, (b) production
systems, (c) flexibility of production systems, and (d) production systems as related
to products.
Apparel Products
Classifications of Apparel Products
Apparel is a highly complex manufactured product. Meeting the
consumers' demand for apparel products is an extremely challenging task for
manufacturers because of the wide variety of styles demanded by the consumers.
Classification of apparel products is an extremely difficult task. Apparel products
have been classified for various purposes but none of the classifications are
exhaustive.
The various classifications are explained in the following sections: (a) the
merchandise classification, (b) the American Apparel Manufacturers Association
(AAMA) classification (1982), (c) the Standard Industrial Code (SIC)
12
classification (1950), (d) product line classification by Glock & Kunz (1990),
(e) product line classification by Johnson and Hill (1978), and (f) product line
classification by Lin, Kincade, and Warfield (in press).
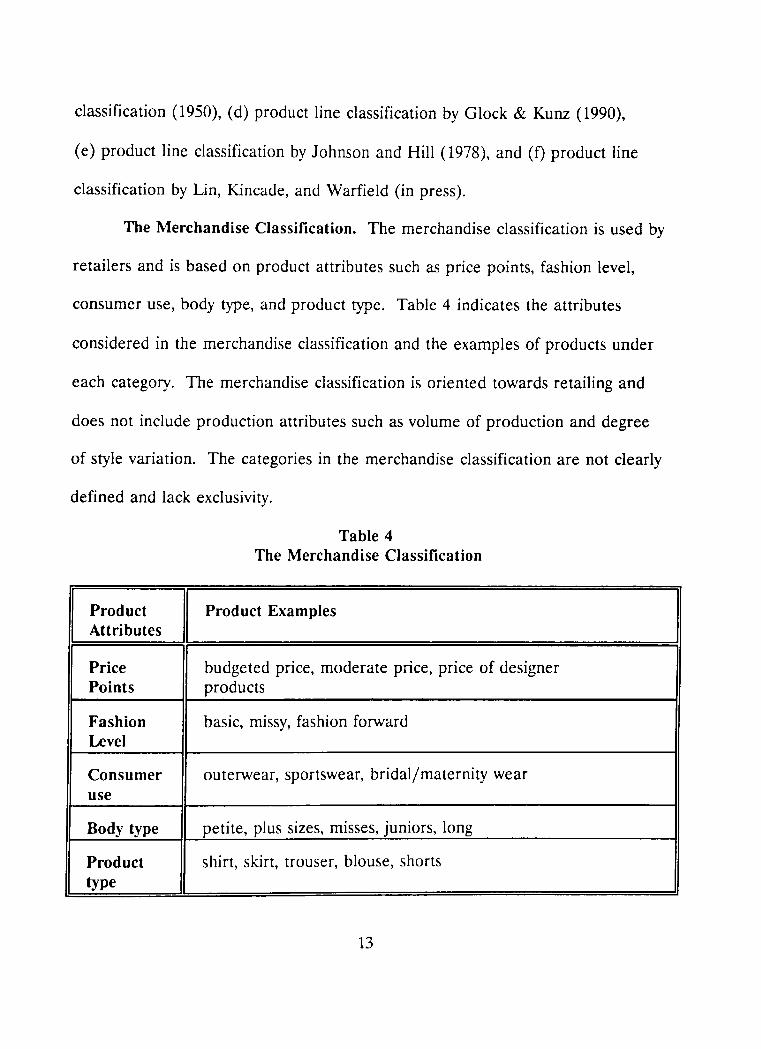
The Merchandise Classification. The merchandise classification is used by
retailers and is based on product attributes such as price points, fashion level,
consumer use, body type, and product type. Table 4 indicates the attributes
considered in the merchandise classification and the examples of products under
each category. The merchandise classification is oriented towards retailing and
does not include production attributes such as volume of production and degree
of style variation. The categories in the merchandise classification are not clearly
defined and lack exclusivity.
Table 4 The Merchandise Classification
Product I Product Examples Attributes
Price budgeted price, moderate price, price of designer Points products
Fashion basic, missy, fashion forward Level
Consumer outerwear, sportswear, bridal/maternity wear use
Body type petite, plus sizes, misses, juniors, long
Product shirt, skirt, trouser, blouse, shorts type
13
I

The American Apparel Manufacturers Association (AAMA) Classification
(1982). The AAMA classified apparel products, based on the degree of variation,
into product category, product types, and product styles. The AAMA
classification takes on the shape of an inverted pyramid with product categories at
the base of the pyramid. Product category refers to product identification (e.g.,
shirt, skirt, trousers). The degree of variation between the products within a
category is very high. Product type refers to variations within a product category.
The variations between product types is not as high as the variations between
product categories. Product style refers to design variations that exist within
product types. The degree of variation between product styles is less than the
degree of variation that exists between product types. Figure 1 shows how a
product would be classified in the AAMA classification.
Product category
Product type
Product style
Figure 1 Example of AAMA Classification for Apparel Products
14

The AAMA classification lacks clarity of definitions. For example, the
types of variations within the categories needed to identify product types are not
explained. The variations may be in terms of the end use of the product or in
terms of the construction features. The AAMA classification is more production
oriented than the merchandise classification and does not include attributes like
price points and body type.
The Standard Industrial Code (SIC) Classification (1950). The U.S.
Department of Commerce (1950) categorized all manufactured products to obtain
economic data and assigned a multiple digit code to each of the categories. This
system is the SIC classification. Apparel products have been classified based on
gender, age category and end use of the apparel item. Table 5 reveals the
categories in the SIC classification.
15

Table 5 SIC Classification
SIC Code Apparel categories
2300 apparel and other finished products
2311 men's and boys' suits and overcoats
2321 men's and boys' shirts except workshirts
2322 men's and boys' underwear and nightwear
2325 men's and boys' separate trousers and slacks
2326 men's and boys' work clothing
2329 men's and boys' clothing and NEC
2331 women's misses, and juniors blouses and shirts
2335 women's and juniors dresses
2337 women's misses, juniors suits and skirts
2339 women's misses outerwear and NEC
2341 women's misses underwear and nightwear
2342 brassieres, girdles, and allied garments
2353 hats, caps and millinery
2361 girls', childrens', infants dresses and blouses
2369 girls', children's, infants outerwear and NEC
2381 dress and work gloves except knit/leather
2384 robes and dressing gowns
2385 waterproof outerwear
2387 apparel belts
2389 apparel and accessories NEC
16

Although apparel styles and clothing behavior have changed greatly, the
SIC classification has not been updated since 1950. The SIC classification does
not consider either the production or retail attributes like seasonality, volume of
production, degree of style variation, or price points. Also, the categories in the
SIC classification have not been clearly defined.
Product Line Classification by Glock and Kunz (1990). Glock and Kunz
(1990) classified apparel products by product line, class, assortment, style and
design. A product line is a group of items that are closely related, because the
items satisfy certain consumer needs and wants (e.g., coats for warmth). Class
refers to a subdivision within a product line. Assortment is the styles within the
class (e.g., parkas, dress coats). Design is a specific unique version of a class.
The product line classification by Glock and Kunz (1990) is both retail and
production oriented. This classification is similar to the AAMA classification in
some aspects. The system is a multi-stage pyramid as is the AAMA classification
with parallel levels. Product line in the Glock and Kunz (1990) classification is
similar to product type in AAMA classification. Product style in the AAMA
classification is split into design and style in Glock and Kunz classification (1990).
Although the Glock and Kunz (1990) classification is more broad and includes
both retail and production attributes, the classification lacks clarity of definitions.
17

Product Line Classification by Johnson-Hill (1978). Johnson-Hill (1978)
classified apparel product line on the basis of three attributes. The attributes are
volume of production, degree of style variation, and seasonality of the products.
This classification considers product lines rather than products alone. According
to the classification, product lines are classified as staple, semi-staple, fashion and
high-fashion based on the degree of variation between them. The degree of style
variation for the product lines is described as being basic, semi-basic, various
styles or great style variety for the four product lines respectively. A staple
product line includes basic garment styles by adding or changing small areas of
the garment such as pockets, collars, sleeves, yoke, placket. The variation
between styles, in terms of construction features, is minimal. For example,
between two styles of staple garments a change in the shape of the pockets would
be the degree of variation between the two styles of garments. Staple products
are produced in long and continuous production runs. A manufacturing system
that produces staple products tends to be highly inflexible.
A semi-staple product line includes styles with more variation between
them. The variation, between styles of one basic garment, in terms of
construction features, is greater than the variation in a staple product line. A
semi-staple product line consists of various styles of a basic garment. For
example, with two similar types of trousers, the various types of pocket, belts,
18

loops, and pleats provide the style variation. Semi-staple product line are
produced in moderately small batches.
A fashion product line includes styles with more variation when compared
to styles in the semi-staple product line. A fashion product line is produced in
small batches of various styles. A high-fashion product line includes styles that
have the highest degree of style variation between them. A high-fashion product
line is produced in very short production runs.
The product line classification by Johnson-Hill (1978) considers the
frequency of style change, determined as the number of style changes in a season.
Another factor considered in this classification is the production volume. The
production volume is categorized as mass volume, mid volume, low volume, or
very low volume. The attributes of product lines are, however, not completely
operationalized in this classification.
Product line Classification by Lin, Kincade, and Warfield (in press). Lin,
Kincade, and Warfield (in press) modified Johnson-Hill's (1978) classification by
operationalizing the volume of production and frequency of style change. The
volume of production is expressed as dozens of units of a style per season, and a
season is equivalent to 13 weeks. The frequency of style change is expressed as
the number of style changes occurring per season. The number of style changes
per season range from none to more than six style changes for the categories of
19

product line. "Degree of variation is the variation that occurs between the first
and the following styles" (Lin, Kincade, & Warfield, in press, p. ?). The variations
in styles within a product line is less than variations in styles between the product
lines. Variations in styles of garments may be in color, type of fabric or
component parts (AAMA, 1982). Table 6 indicates the relation between product
line and product line attributes.
Table 6 Relation between Product Line and Product Line Attributes
Product Degree of Frequency of Vol./style/ line Style style season
Variation change/ season
Staple basic style 0-1 mass volume
Semi-Staple semi-basic 2-3 mid-volume style
Fashion various styles 4-6 low volume
High Fashion great style > 6 very low variety volume
Note. From " An Analysis of Sewing Systems with a focus on Alabama Apparel Producers" by Lin, Kincade, and Warfield (in press), Clothing and Textiles Research Journal.
This classification considers more factors than other classifications yet has
some limitations. The classification is more production oriented and is limited to
product line. The classification does not consider specific products within a
20

product line. Although the classification identifies the four categories of the
degree of style variation between products, they are not completely
operationalized. For example, the classification does not explain the variations
occurring within the product line. The classification also does not consider any
measures of consumer usage ( eg., price point, body type).
Classification Systems applied to Collars
Garment styles in general may vary in number of components or in the
characteristics of components. Variations in the number or characteristics of
components require production systems to have mix flexibility (Gerwin, 1987).
Mix flexibility is the ability of a system to produce a number of different products
at the same time (Browne et al., 1984; Gerwin, 1987; Ramasesh & Jaikumar,
1991). To measure the mix flexibility of a production system, the range of
component characteristics handled by the system is considered a better measure,
because the characteristics of the components are more important than the
number of components (Gerwin, 1987). The characteristics of components are
exemplified in the style of a garment. Innumerable styles of garments exist. To
study the variations among each of these styles, all products and their variations
would have to be included. A bottoms-up approach is suggested where the degree
of variation can be identified separately for different parts of a garment and then
aggregated for the entire garment.
21

An upper body garment has components such as collar, sleeves, bodice,
placket, pockets, and belt (Hollen & Kundel, 1987). The collar is one of the most
important components of an upper body garment. Also, collar making involves
additional construction steps (Brown, 1992; Stamper, Sharp, & Donnell, 1986) and
adds substantially to the cost of the garment due to the additional time, fabric,
and labor required (Stamper, Sharp, & Donnell, 1986). Making and attaching of
the collar to the neckline is one of the more difficult operations in the assembly
of a garment. This operation requires better skills and manipulation to produce a
better quality product (Smith, 1987; Y.B. Nayak, personal communication,
March,1992). The collar attachment area is one of the top-priority areas for
inspection by quality control personnel, because the collar area attracts the first
attention in a garment when worn (Hertal, personal communication, March,
1992). Good quality garment construction is said to be revealed in a finished
collar (Hertal, personal communication, March, 1992; Lawrence & Yurick, 1977).
Collar Characteristics. A collar is a decorative and functional feature on
the neckline of a garment (Kopp, Rolfo, Zelin, & Gross, 1987). The design of the
collar varies with the product line of garments. For example, simple collars are
more appropriate for casual sportswear styles, while complex collars are more
appropriate for tailored garments (Brown, 1992,).
22

Collar designs can be determined by the collar type and collar style.
Collar types are defined by the shape of the collar neckline, and collar styles are
defined by the shape of the outer edge of the collar (Brackelsberg & Marshall,
1990; Brown, 1992; Hollen & Kundel, 1987). The shape of the collar and the
shape of outer edge of the collar determine the difficulty in construction. The
shape of collar neckline also influences the type of finish at the neckline (e.g., full
facing, facing at front). The outer front edge of the collar (i.e., collar style) is
either rounded, pointed, or other shapes. The collar style may also determine the
number of pieces required in the construction of the collar. If the collar neckline
finish is complex and the shape of outer edge is complicated, the construction
becomes very difficult.
Collar types. The shape of the collar neckline (i.e., collar type) determines
if the collar is flat, rolled (i.e., partial roll or full roll), or standing (see Figure 2).
The closer the shape of collar neckline to the shape of the garment neckline, the
flatter the roll (Brackelsberg & Marshall, 1990; Hollen & Kundel, 1987; and
Stamper, Sharp, & Donnell, 1986). The shape ratio of the collar and garment
neckline generally affects the construction, appearance, and the neckline finish of
the collar. The neckline shape ratio dictates the amount of stand in a collar. The
stand in a collar is the material under the collar at the center back which extends
upward from the garment neckline to the point where a collar rolls or folds over.
23

i 1- f AU.. 0 F Co LI.AR.
.-~
. J - fAL.L OF CoLu,ll
- - } ._. gTAN.D Qp (o u.AR
ILLUSTRATION OF COLLAR TYPES Figure 2
24

The portion of the collar that folds over is the roll of the collar (Brown, 1992;
Kopp, Rolfo, Zelin, & Gross, 1987) (see Figure 2).
In a flat collar, the shape of the collar neckline is concave and matches the
neckline of the garment. A flat collar lies flat against the garment all the way
around the neck of the garment (Brown, 1992; Kopp, Rolfo, Zelin, & Gross,
1987). The neckline for a flat collar can be finished with a binding, facing,
stitching, or other edge finish.
The full roll collar or standing collar neckline is created when the collar
neckline is fairly straight. A full roll/standing collar may be simple full roll/
standing collar or a full roll shawl collar. The full roll collar has a full stand and
a roll. A full roll collar could be made of one piece or two piece. In a one piece
full roll collar, both the collar and the stand are cut in one piece. A standing
collar with a band and collar is a two piece collar where the stand and the collar
are cut as two separate pieces and then attached (Stamper, Sharp, & Donnel,
1991 ). This construction makes the two piece collar more complex in construction
than the one piece collar. The two piece full roll collar extends to the end of the
front neckline (Stamper, Sharp, & Donnell, 1991). The neckline of garment and
front facing is generally sandwiched between the collar layers for attachment. If
this method is not adopted, a facing or binding is used to finish the neckline, but
this operation makes the neckline bulky (Brown, 1992). For most manufactured
25

garments, both one piece and two piece standing collars do not have a facing at
the back neckline.
A full roll shawl collar has a full stand and a roll like the simple full roll
collar, but with a varied construction technique. The full roll shawl collar has an
attached collar only at the back. The back collar neckline is fairly straight
creating the full stand and the roll. The front of a full roll shawl collar is an
extension of the front bodice. Shawl collars can only be worn open. Most shawl
collars are finished with a facing at the back neckline for hanger appeal. The
bodice front forms the front of the under collar, and a two piece upper collar is
used for front and back (Knopp, Rolfo, Zelin, & Gross, 1987). The back of a
shawl collar is characterized by a seam at center back. A shawl collar has no
seam for the facing on the front, because the front facing is an extension of the
upper collar. The order of construction steps for a shawl collar vary from the
simple full roll collar.
A partial rolled collar can be either simple partial roll collar or a partial
roll shawl collar. A partial rolled collar has a back stand and a roll. The stand of
a partial roll collar is less than the stand of a full roll collar. If the shape of the
collar neckline is concave, but less concave than the neckline, the collar rolls at
the back of the neck, and it is a partial roll collar. If the neckline of the bodice
extends beyond the collar, the collar has a facing at the front edge of the collar.
The neckline of a partial roll collar is, generally, finished with a facing at the
26

front neckline and may or may not have a facing or binding at the back neckline
(Brown, 1992; Moore C., personal communication, March, 1994 ). The use of
facing at the back neckline is determined by the amount of stand (i.e., its ability
to take in the neckline allowance) and the cost incurred in attaching a facing
(Brackelsberg & Marshall, 1977; Hollen & Kunde!, 1993).
A partial roll shawl collar is similar to a simple partial roll collar in the
shape of the back collar neckline but is different in the type of attachment. A
shawl collar has an attached collar only at the back. A partial roll shawl collar is
similar to the full roll shawl collar in the attachment technique but differs in the
shape of the back neckline. A partial roll shawl collar has a concave back
neckline which creates the partial roll with a slight stand. The order of
construction steps for a shawl collar vary from a simple partial roll collar.
Collar styles. Collar style refers to the shape of the outside edge of the
collar and is grouped into three categories: rounded, pointed, and other shapes.
A rounded collar has a round outside edge. A rounded collar is made with two
separate pieces, the upper and under collar. If the collar is divided at the back
and front, as in opened garments, the collar is made with four pieces. Pointed
collars have a pointed outer front edge. Pointed collars are constructed in three
ways. A one-piece pointed collar is made with the upper and under collar in one-
piece, and the outer edge is a fold line (Brackelsberg & Marshall, 1990). One-
27

piece collars are generally found in low-price lines (Brown, 1992). A two-piece
pointed collar has separate upper and under pieces and should have a row of
understitching on the edge seam to make the edge of the upper collar roll towards
the under collar. Sometimes a two-piece pointed collar is made by stitching all
three sides of the outer edge in a single operation (Brackelsberg & Marshall,
1990). Two piece collars require more labor than a one piece collar (Brown,
1992). In a three-piece pointed collar, the upper collar is in one piece and the
under collar is in two pieces with a seam at center back. A three-piece collar
requires more labor than a one piece or two piece collar, thereby increasing the
cost of the garment. In a three piece collar, the two pieces of the under collar are
cut on the diagonal. Two piece under collars are selected because of the added
shaping and roll that can be developed in the neck part of the collar.
Shaped collars have outer edge shapes that are not just rounded or pointed
(e.g., scalloped collars). In the case of the shawl collar, the shape of the bodice
can be changed to achieve greater variety. Collars with shaped edges can be
made with two or three pieces.
Collar Desips. The type and style of a collar affect not only the
construction but also the appearance of collars. Each collar design has a
generally accepted name and an accepted appearance. The type and style of
collar are combined to determine the design of the collar. Table 7 lists the
designs of collars based on the type and style of each collar.
28

N l.O
Cola- styles
Rowlded
Pointed
2 pc
3 pc
4 pc
1 pc
Flat Partllll rol
Slmple Partllll rol
Peter Pan collar Notched with a cape
Ruffle collar Horse shoe
Peter Pan with trimming at outer edge
Bertha collar
Sailor with rounded edge
Bertha collar Horse shoe
Sailor with rounded Notched with a cape edge on back
Peter Pan collar
Peter Pan with trimming at outer edge
Sailor with pointed Convertible edge on back
Notched with a cape
Colar types
Standlng/fUI rol
Shawl colar 1 pc 2pc
Slmple u rol Ful rol Shawl
Simple Shawl Simple Shawl
Shawl with a Shawl with a cape cape
Notched shawl Turtle neck Notched shawl Wing collar collar collar
Shawl collar Cowl Shawl collar with Shirt with stylized stylized point collar point
Mandarin
Shirt collar without band

w 0
~- - -
Colar styles
Pointed
Olher shapes
- - - -
Rat
1 pc Flat collar with styllzed point
Sailor wtth pointed edge on back
3 pc Square bertha collar
Flat collar with stylized point
2 pc Scalloped collar
4 pc Petal collar
Colar types
Partllll rol Standlng/Fdl rol
Simple Partllll rol Shawl cols 1 pc 2 pc
Slmple M rol Fdl rol Shawl
Convertible Wing collar
Notched with cape Buckle collar Shirt collar
Notched with peak lapels Scar1 collar
Portrait Edwardian
Convertible Notched with Wing cape collar
Buckle collar Shirt collar
Notched with peak lapels
Chelsea
Scar1 collar
Notched with peak lapels

For clarification of this typology, several collar designs are discussed below.
A Peter Pan collar is a flat collar, with no stand or with limited stand, because the
neckline shape of the collar matches the neckline shape of the bodice. The outer
edge of peter pan collar may be rounded or scalloped and may have ruffles or
trimming at the outer edge (Kopp, Rolfo, Zelin, & Gross, 1987). A Peter Pan
collar can be made as two-piece or four-piece collar. The outer edge of a two-
piece Peter Pan collar is shaped only at center front and has an upper and under
collar. A four-piece collar is shaped at the both center front and center back and
has two upper and two under collars. A Peter Pan collar can be finished with a
binding or facing at the neckline.
A Bertha collar is a large cape-like flat collar. A Bertha collar can be
squared or rounded at the collar outer edge (Kopp, Rolfo, Zelin, & Gross, 1987).
It can be made with one upper and one under collar (i.e., two piece) or one upper
and two under collars (i.e., three piece). Bertha collars can be finished with
binding or facing at the neckline. A sailor collar is a large flat collar squared or
rounded at the back and tapering to a 'V' at the front (Kopp, Rolfo, Zelin, &
Gross, 1987). The construction of the sailor collar is similar to the Bertha collar
except that the bertha collar is almost never made with one piece. The sailor
collar, on the other hand, can be made with one piece, two piece, or three piece.
A one piece sailor collar has only an upper collar and is finished with a binding at
the outer edge. A two piece sailor collar has one upper and one under collar. A
31

three piece sailor collar has one upper and two under collars. The front and back
neckline are finished with a binding or a facing.
A convertible collar is a simple partial roll collar and can be worn open or
closed. The neckline shape of the collar is partially convex and the bodice
neckline is concave. This difference develops the stand and roll when the neck
seam is constructed. The convertible collar can be developed as two piece or
three piece with a rounded or square stylized point (Kopp, Rolfo, Zelin, & Gross,
1987). A two piece convertible collar has one upper and one under collar. A
three piece convertible collar has one upper and two under collars. A convertible
collar is finished with a facing at the front neckline. The back neckline is finished
by turning the upper collar in at the neckline and top stitching.
A notched collar is a roll collar and is normally worn open. It consists of a
lapel and a collar. The collar extends to the front of the bodice and meets the
lapel, resulting in a notch (Kopp, Rolfo, Zelin, & Gross, 1987). This type of
collar design requires special construction. The neckline seams are constructed
first. The outer edge of the bodice and facings are sewn last. Notched collars may
be made with or without a cape. The outer edge of cape may be rounded or
squared. The collar is generally made of three pieces. A three piece notched
collar has one upper and two under collars. The under collars are used for
shaping the roll.
32

A shirt collar is attached to a straight or slightly shaped stand-up neckband
(Kopp, Rolfo, Zelin, & Gross, 1987). The neckband may be in one piece with the
collar or a separate piece with an attached collar. If the collar is made of one
piece, the outer edge of collar is on fold and does not have a seam. A two piece
collar has one upper and one under collar. A shirt collar is finished at the
neckline by turning the upper collar in and seam stitching.
A wing collar is a two piece standing collar with a neckband. It has a
stand and a roll. The outer edge of the collar has spread points (Kopp, Rolfo,
Zelin, & Gross, 1987). The collar may two piece or three piece depending on
whether it has a seam on the under collar at the center back. The neckline of a
wing collar is finished by turning the upper collar in at the neckline. A wing
collar does not have a facing at the back or front neckline.
A mandarin collar is a standing collar that extends up from the neckline.
It has only a stand and no roll. This collar meets at the centerfront or at any
point between the shoulder and the centerfront. A mandarin collar can have a
straight or shaped collar edge (Kopp, Rolfo, Zelin, & Gross, 1987). A mandarin
collar is generally made with two pieces, one upper and one under collar. The
mandarin collar does not have a facing at the neckline and is finished by turning
the top collar inside at the neckline and top stitching.
33

An Edwardian collar is a variation of the standing collar. It has a trimming
at the outer edge of the normally standing collar. It is finished the same way as
the standing collar.
Production Systems
A production system is defined as a set of components whose function is to
convert a set of inputs into some desired output through a transformation process
(Chase & Aquilano, 1992). The components can be a man, machine, equipment,
or tool. A production system should, in general, allow a manufacturer to produce
goods efficiently while keeping in mind the customers' needs. Both the
manufacturer and the customer should benefit from the production process. The
manufacturer should have monetary gains, and the customer should be able to
obtain the product at a price worth the value the product holds.
'IJ:pes of Production Systems
Various production systems are in use in the soft goods and hard goods
industry. Each of the systems are characterized by distinctive attributes. These
attributes can help identify the various systems.
Hapeman (1971) and Solinger (1988) have identified production systems
based on the dimension of time factor. Production systems can be intermittent or
continuous systems based on the time a workunit rests between successive
34

workstations. This factor is directly related to the level of WIP inventory in the
system. In an intermittent production system, the work unit rests temporarily in
some storage area between successive workstations. Consequently the level of
WIP inventory is high in an intermittent system. In continuous production
systems, the workunit does not rest between successive workstations.
Consequently the level of WIP inventory is zero or minimal in a continuous
production system. The WIP inventory level is an attribute of a system and can
be used as one of the determinants of production systems.
Solinger (1988) has also identified production systems based on the scope
of workers duties and type of product flow. The scope of workers duties may be
determined by the number of tasks assigned to individual operator in a system.
Individual operators may be assigned single tasks or multiple tasks. The scope of
workers duties is directly related to the skill of the workers. Production systems
that assign single tasks to operators may not require multi-skilled workers as
opposed to the systems that assign multiple tasks. Also, single task operators are
limited by their skill and so cannot be used for more complex processing
operations. The number of tasks assigned to individual operators in a system can
be used as one of the determinants of production systems.
Production systems can be distinguished based on the type of product flow
between workstations (Solinger, 1988). The products may flow either singly or in
groups. The type of product flow dictates the means of transportation of
35

workunits between workstations. Single productflow is associated with automated
transfer of workunits between workstations or the handoff approach. In the
handoff approach, the workunits are handed off to the next operator depending
on the demand for work by the next operator. Group productflow is associated
with manual transfer of bundles of workunits between workstations. The mode of
transportation of workunits between workstations can be used as one of the
determinants of production systems.
Kimura and Terada (1981) identify production systems based on the type
of workflow. The type of workflow may be pull through or push through
depending on the source of the force that drives the work through the system.
The normal approach in industrial production is the push system in which piles of
WIP inventory helps push the work through the system. In a pull system, the
need to increase the production helps pull the work through the system. The type
of workflow can be used as one of the attributes in determining a production
system.
A recent approach in manufacturing is the team approach, where groups of
operators function as a self-directed team (Cole, 1992; Ross, 1991; Sisselman,
1990). The production systems may be associated with interaction between
operators or no interaction. The presence or absence of interaction between
operators may be used as a determinant of a production system.
36

Based on the various attributes, production systems have been classified
into several broad categories. Solinger (1988) identified two broad categories of
production systems based on the scope of workers duties (number of tasks per
operator), time factor (continuous systems or intermittent systems), and product
flow (single or multiple flow). Solinger's (1988) classification represents systems
used in the hard goods industry and very traditional apparel manufacturing such
as job shop operations. Knapton (1990) broadly divided manufacturing systems
in the apparel industry into traditional or dedicated systems and modular systems.
The traditional or dedicated systems consist of the bundle system and PBS.
Georgia Institute of Technology (1980) and Lin (1990) identified three apparel
production systems that are most commonly found in the American apparel
industry: (a) bundle systems, (b) progressive bundle systems, and (c) modular
systems.
Bundle Systems. The bundle system is a traditional dedicated system that
is normally comprised of bundles of workunits. Individual operators perform
some or all of the operations on the bundle (Hannan, 1963). Traditionally
individual operators perform only certain operations on all the bundles of
workunits. The productflow is in groups and the workunits are transported
manually by the operator himself (Lin, 1990). A bank of inventory is positioned
at each machine and work flows intermittently from the storage to the operator
37

and back to the storage after the bundles are worked on. This mode of
transportation results in racks of WIP inventory (Mazziotti, 1993). The WIP
inventory helps push the work through the system. The bundle system is
essentially a push system. No interaction exists between the operators in a bundle
system, because each operator is responsible for his own job.
Pro&ressive Bundle System CPBSl. The PBS is also referred to as an
assembly line (Chase & Aquliano, 1992). In a progressive bundle system, the
operations are laid out in a sequence. A group of operators work as a single unit,
producing one style at a time. Progressive bundle system involves two or three
work stations being worked upon for the same operation at the same time but two
or more different operations/jobs of a garment are never done simultaneously in
a planned synchronized manner (Solinger, 1988). Individual operators are
assigned single tasks as opposed to multiple tasks in a bundle system (Mazziotti,
1993; Sisselman, 1990). The bundles of workunits are passed along singly from
operator to operator. The PBS is associated with single productflow, and the
workunits are transferred by means of conveyors or other automated transfer
devices (Chase & Aquilano, 1992; Ross, 1991). These conveyors become storage
devices which can result in moderate to high level of WIP inventory (Ross, 1991).
The level of WIP inventory is controlled in a PBS by balancing the lines. The
WIP inventory in a PBS is controlled to a certain extent as opposed to the level
38
of WIP inventory in a bundle system. The inventory drives the work through the
system. PBS, therefore, is a push system. Though a group of operators work on a
single style at a time, no interaction exists between the operators.
Modular System. This system is also referred to as Cellular system.
Modular system consists of teams of operators functioning as a single unit
assembling a whole garment (Sisselman, 1990). The operators rotate to different
machines as they work through the garment (Brown, 1992; Ross, 1991). The
operators in a modular system can perform single or multiple tasks. The
workunits are handed off to the next operator depending on the demand for work
by the operator (Mazziotti, 1993). The handoff approach is associated with single
product flow. The team of operators make the entire product one at a time
rather than moving large masses of inventory (Ross, 1991). The workunits flow
continuously through the system. This movement helps minimize the WIP
inventory to a great extent (Cole, 1992).
Kron (1987) and Frank (1988) define modular manufacturing as consisting
of modules or cells where each module or cell is a contained manageable work
unit of people performing a measurable task. The people are self-directed and
work in a team. The need to increase production helps drive the work through a
modular system. Modular system is essentially a pull system (Carrere & Little,
1989). The operators are interchangeable among tasks within the group (Kron,
39

1987; Frank, 1988). Since the group of operators in a modular system work as a
team a great deal of interaction is noticed among the operators. Modular systems
encourage team work, improve quality, and increase production (Ross, 1991;
Sisselman, 1990).
Carrere and Little (1989) examined eleven modular manufacturing
situations. The degree of flexibility desired within a modular unit and the product
characteristics dictated the level of WIP that could be accommodated. Modular
manufacturing revealed benefits such as improved quality, reduction of waste,
increased manufacturing flexibility, reduced turn over and absenteeism and
organizational and cultural growth. Modular manufacturing also indicated a
reduction of bundle or batch size, balancing of operations, pull through
production and production of exact quantities of the product.
Sisselman (1990) conducted a case study of an apparel firm that
reorganized its production system from the traditional progressive bundle system
to the more modern modular system. During its progressive bundle stage, all the
people in the plant worked in a single group and on one style at a time. The
operators were thus assigned specific operations to which he/she was limited.
Under the changed system, a group of six chains formed the production system,
and each chain functioned as a single complete unit assembling a whole garment.
Operators in the chain only assembled components to the body while the other
operators worked on the less skilled operations. Although the turn cycle, from
40

cutting to shipping and the direct and indirect costs were reduced modular
manufacturing was not found to be as productive as when the work was repetitive.
Advantanees and disadvantaKes of the three production systems
The inherent qualities of a system enable system performance. Each
system has its advantages and disadvantages. In any production system, certain
elements of work are repetitive, and this affects the performance of the systems.
In general, the performance is higher when the non-repetitive elements are fewer
(Hodge & Canada, 1989). The time required for production is usually shorter in
continuous-production system than in the intermittent production system
(Hopeman, 1971).
For example, PBS with overhead conveyors (i.e., UPS) has no lifting,
bending, or carrying of bundles. The garment pieces are transported to
workstations by conveyor mechanisms. The transport of pieces is controlled by
computer programs which minimize the waiting time for work-in-process (WIP) by
more than 50% and reduce the time spent on handling and bundling (Cole, 1987;
Hodge & Canada, 1989; JSN International, 1989). The work is always presented
to the operator in the ideal position of work. High rest and fatigue allowances
are eliminated. Operators can thus spend more time at the needle completing the
task at hand at a pace not possible in a bundle situation. Results of Cock's study
(1989), on simulation of line balancing indicated that PBS with conveyors can
41

offer large savings by reducing the amount of capital tied up in work-in-process
inventory.
The bundle system and PBS are considered best suited for basic products
with very little style variation (Hunter, 1990; Knapton, 1990; Schoenberger, 1982;
Solinger, 1988). Modular manufacturing is considered more flexible as different
apparel operations can be performed by the same worker with access to
multifunctional machines (Hunter, 1990; Carrere & Little, 1989; Kurt Salmon,
1988; Schonberger, 1982; The Textile Technology Clothing Corporation, 1989).
The modular system can therefore produce different styles of products at the
same time more easily (Ross, 1991; Sisselman, 1990).
Evaluation of Sjrstem Performance
Several factors affect the performance of a production system. Evaluation
of the performance of a production system should include the study of logistics in
material flow, operators, efficiency and tailoribility (Shishoo, 1990). Soni and
Welker (1990) suggest machine utilization, due date, and mean flow time as the
criteria for evaluating system performance. Soni (1990) suggests addressing the
issues of volume of product, value of the product in terms of value of material
used, the flexibility and compatibility of production processes, parts to be
assembled for the finished product, inspection testing and quality control, material
handling and packaging, warehouse storage and production scheduling, inventory
42

control, manufacturing system design and cost and related improvement in
productivity of new or modified systems. Hodge and Canada (1989) identify net
present worth, manufacturing flexibility, quality, and serviceability as being the
most important attributes in selecting a sewing work station but admit that a full
decision model would doubtlessly include additional attributes and an elaborate
analysis.
Flexibility of Production Systems
Capability of a system refers to the system's intrinsic ability (Troxler &
Blank, 1989), and flexibility is one of the determinants of capability of a system.
Flexibility refers to the capability of a system to respond effectively to changing
circumstances (Gerwin, 1987).
Flexibility is an adaptive response to changes or uncertainties in the
environment (Gerwin, 1987); therefore, any attempt at studying the flexibility of
apparel manufacturing system necessitates a close look at the uncertainties that
exist in the manufacturing environment (Buzacott, 1982). Understanding the
uncertain circumstances for flexibility is essential, because a wide range of
circumstances could be associated with the flexibility of manufacturing systems.
The environment of a factory constitutes the internal environment and
external environment. Uncertainties in the internal environment that might affect
the flexibility of a system include uncertain capacity of resources, and skill of
43

labor. In general uncertainties in the internal environment are easier to control
than the uncertainties in the external environment.
Uncertainties in the external environment include variation in product mix,
targeted production volumes, and availability of raw materials. Uncertainty in
composition of apparel products demanded (i.e., product mix) is due to the
frequent changes in style that occur in the market. Product demand changes are
both short term and long term. Frequent occurrences of short term change, such
as change in the part being produced at a machine, cause significant change in the
performance of the system and the system has to respond with minimal loss in
production and minimal cost. Long term changes in demand could be the
introduction of new products into the system. Again, the system needs to be
flexible enough to respond effectively to the change to produce the product with
minimal change in·the system and with minimal cost (Gupta & Buzacott, 1989).
The uncertainty created as a result of variety in needs of the customers requires
the system to be flexible to enable production of various products at the same
time (Wise, 1990).
A production system is said to be flexible to style changes if it responds to
frequent changes in style in an efficient manner. Lin (1990) described "frequent"
in terms of number of style changes per season. Flexibility to style change is
therefore considered to increase as the number of changes per season that a
system can respond to increases.
44

A priority for apparel manufacturers is to select sewing systems that can
respond to changes in the market (Hunter, 1990). A production system must be
flexible enough to produce or accommodate a wide variety of products in terms of
style features and to produce a selected volume efficiently within the region of
economy of production.
'IJ'.pes of Flexibility
A wide variety of uncertainties exist in any manufacturing environment,
and various types of flexibility are associated with each type of uncertainty.
Gerwin (1987) has identified seven types of flexibility based on uncertainties in
the manufacturing environment. Table 8 indicates the various types of flexibility
that are used as a response to each type of uncertainty (Gerwin, 1987).
45

I
I
Table 8 Uncertainties in the manufacturing environment and the associated
Flexibility required of manufacturing systems (Gerwin, 1987)
Type of Uncertainty Flexibility
The products that will be Mix flexibility: The manufacturing accepted by the customers are system should be able to produce a uncertain. number of different products at the
same time.
The life cycles of products Changeover flexibility: The system differ from one another. should be able to deal with addition or
subtraction from the mix over time.
The attributes that customers Modification flexibility: The system want over time are uncertain. should be able to deal with functional
changes in the product over time.
The downtime of the machine Rerouting flexibility: The system is uncertain. should be capable of undergoing a
change in the operating sequence through which the product flows.
The volume demanded by the Volume flexibility: The system should customers is uncertain. be adaptable to different volumes of
production.
The material inputs to a Material flexibility: The system should manufacturing process may have the ability to process inputs with not meet standards. Also uncontrollable variations in part more than one substance or dimensions. material may need to be handled for the same or different component.
The delivery times of raw Sequencing flexibility: materials are uncertain. The system should have the ability to
rearrange the way different parts are fed into the system.
46
i
I
Browne (1984) has identified eight types of flexibility that are similar to
Gerwin (1987). In that, mix flexibility (Gerwin, 1987) is similar to product
flexibility (Browne, 1984). Modification flexibility is similar to machine flexibility;
material flexibility is similar to process flexibility, and sequencing flexibility is
similar to operation flexibility (Brown, 1984; Gerwin, 1987). Browne (1984) also
identified production flexibility which is the universe of part types that can be
produced by the system; however, Gerwin (1987) does not list production
flexibility as one of the types of flexibility.
Ramasesh and Jaikumar (1991) have identified eleven types of flexibility
after reviewing the literature. In addition to those identified by Browne (1984)
and Gerwin (1987), Ramasesh and Jiakumar (1991) have identified program
flexibility, material handling flexibility, and labor flexibility. Variations of labor
flexibility, material flexibility, and process flexibility have been identified. Mix
flexibility is a variation of process flexibility which is the capability of a production
system to produce different types of products without major effort (Ramasesh &
Jaikumar, 1991). The types of flexibility identified by Ramasesh and Jaikumar
(1991) are more exhaustive than those identified by Browne (1984) and Gerwin
(1987). The evaluation of flexibility of systems is a multi-factor decision analysis.
The analysis must consider each of the types of flexibility for a more holistic
evaluation of system performance.
47

Although flexibility of a manufacturing system is familiar to the hard goods
industry, it is a relatively new concept in the apparel industry. Limited literature
is available on the flexibility of apparel manufacturing systems. Three types of
flexibility have been identified in the apparel industry (Hodge & Canada, 1989).
Process flexibility is the capability of the system to adapt to variations in cloth
characteristics. Product flexibility is the ability of a system to produce different
parts (e.g., collars, pockets). Part flexibility is the capability of a system to
produce different part types (e.g., different shapes of collars). Product and
part flexibility are similar to the concept of mix flexibility identified by
Gerwin (1987).
Of the various types of flexibility in the apparel industry, mix flexibility
demands a closer look because of the nature of the apparel product and its
market. The apparel market is characterized by great variation in the products
demanded (AAMA, 1965). This characteristic requires mix flexibility of apparel
production systems so that the system will produce a number of different products
at the same time (Gerwin, 1987).
Measures for evaluatin& mix flexibility of production systems. Any
measure of flexibility should be made with respect to the environment in which
the system functions. Part size, part geometry, volume demanded, batch size,
product types, and change over cost have been identified as attributes used to
48

measure the flexibility of a manufacturing system (Ramasesh & Jaikumar, 1991;
Troxler & Blank, 1989). Several measures are proposed for evaluating mix
flexibility:
1. Mix flexibility can be measured by the ratio of the number of
components processed by the equipment to the total number processed by the
factory. This method will determine the mix flexibility of the equipment
(Buzacott, 1982).
2. Mix flexibility can be measured by the number of components that can
be handled by the system (Browne, 1984; Chaterjee et al., 1984, cited in Gerwin,
1987). The higher the number of components that can be handled by the system,
the higher the flexibility of the system (Gerwin, 1987).
3. The range of product component characteristics handled by the system
can be used to measure mix flexibility. The broader the range of component
characteristics, that a system can handle, the higher the flexibility of the system
(Buzacott, 1982).
Some measures are more appropriate for certain industries depending on
the characteristics of the industry. If the machines are dissimilar, the ratio
measure could be used, but in the apparel industry, most often, similar machines
are used for different tasks. The ratio measure is inappropriate to use in the
apparel industry. The number of components measure is also inappropriate for
the apparel industry, because the number of components (i.e., parts) in a garment
49

may be small, but the degree of variation between the components may be high.
In this case, the measure would not be reliable. The range of component
characteristics measure can be adapted to determine the mix flexibility of a system
in the apparel industry. This method will be a more valid measure of mix
flexibility of a system (Gerwin, 1987), because the range of component
characteristics encompasses the widest variation that can occur in terms of styles
of apparel. The wider the range of characteristics between parts that a system
can manufacture, the higher the mix flexibility of the system.
Production Systems as Related to Products
One of the external factors affecting the performance of production
systems is the type of products being produced (Buzacott, 1982). The Technical
Advisory Committee of the AAMA (1965) studied the affect of style variation on
manufacturing costs taking into consideration a hypothetical company producing a
line of ladies tailored blouses. Style goods were found to be inherently more
expensive to produce than staple goods because of product variety. If style goods
replace the same quantity of staples, the efficiency lowers. As apparel products
depart from staple to more complex styles, production runs are shortened.
The conventional belief is that flexible manufacturing systems are best used
in low volume production (AAMA, 1965; Hunter, 1990; Mazziotti, 1993). A
module, as in modular system, is considered best suited for low volumes and a
50

greater variety of parts. An assembly line or a PBS on the other hand is
considered best suited for high volumes and lower number of different parts
(Chase & Aquilano, 1992). Very little empirical evidence exists to support the
relationship between apparel production systems and apparel products.
51

CHAPTER III
Statement of problem
The changing nature of the market has resulted in an increase in the need
for flexibility of manufacturing systems. The market is affected by intense
competition from imports and varied requirements of customers. Manufacturing
systems utilize flexibility as an adaptive measure to respond to such uncertainties
in the environment (Gerwin, 1987).
This study examines the flexibility element of apparel manufacturing
systems. Flexibility of production systems is an extremely broad concept. The
concept of flexibility, especially mix flexibility, is relatively new in the apparel
industry. Limited empirical evidence exists in this area. To fully understand a
relatively new concept, a bottoms-up approach is suggested (Buzacott, 1982).
Variations in different parts of a garment may be identified and aggregated to
obtain the variations for an entire product. The various systems may be
compared for their flexibility to the variations in the garment. This study focuses
on the flexibility of production systems to variations in the types of one part of a
garment (i.e., collars).
Flexibility is defined as the ability of the machine or manufacturing system
or the entire factory to respond effectively to changing circumstances
(Mandelbaum, 1978; Zelenovic, 1982). In general, flexibility in manufacturing can
52

be achieved by the manufacturing process, system, or function. Flexibility of
systems can be achieved by an individual machine, a group of machines, or by the
entire factory. Flexibility of a system is one of the determinants of capability of a
system. Capability of a system refers to the system's intrinsic ability (Troxler &
Blank, 1989).
A wide variety of uncertainties exist in a manufacturing environment.
Various types of flexibility are associated with each type of uncertainty (Table 8)
(Gerwin, 1987). The apparel market is highly uncertain. Customers are tending
toward more individualistic and one-of-a-type clothing. The market situation
leads to wide variation in the demand for apparel items. Style variation is one
criteria for differentiating apparel product line categories (i.e., staple, semi-staple,
fashion, and high-fashion) (Johnson-Hill, 1978; Lin, Kincade, & Warfield, in
press). To meet the demand for such a wide variation of products, the
manufacturing system should be able to produce different products at the same
time. In other words the system should have mix flexibility (Gerwin, 1987).
The statement of problem for this research is outlined in the following
sections: (a) research problem, (b) objectives, (c) hypotheses, (d) assumptions,
and ( e) conceptual framework.
53

Research Problem
This study analyses the relationship between apparel production systems
and style variation as revealed in the collar designs of men's and women's shirts
and blouses.
Objectives
This research was designed with the following objectives:
1. To develop an instrument that can be used to determine the relationship
between apparel production systems and style variation in apparel products.
2. To classify men's and women's collar designs into the four product line
(i.e, staple, semi-staple, fashion, and high-fashion) categories.
3. To examine the relationship between types of apparel production
systems and categories of product line represented by collar designs.
4. To analyze the relationship between size of the company (i.e., number of
employees and volume of production) and apparel production systems and the
corresponding product line as represented by the collar designs.
Hypotheses
Research hypothesis llHi1 The production systems (i.e., bundle system, PBS,
and modular system) will vary with the type of product line that is
produced on each of them. Bundle system will be used to produce
collars from a staple product line and modular system will be used
54

to produce collars from a fashion product line. In other words, mix
flexibility to collar designs will increase progressively from bundle to
PBS to modular system.
Statistical hypothesis 1. Mix flexibility of bundle system is less than PBS. The
mix flexibility of PBS is less than modular system.
Research Hypothesis UH:J,s The volume of production on a production system is
related to the type of system used.
Statistical hypothesis 2. The volume of production on bundle systems will be
more than the volume of production on PBS. The volume of
production on PBS will be more than the volume of production on
modular systems.
Research hypothesis 3CH~ A relationship exists between size of the company
(i.e., number of employees) and the production system used by the
company. In general, larger companies with greater number of
employees will use more advanced production systems, such as the
modular production systems, than smaller companies.
Statistical hypothesis 3. Companies with more number of employees will use
modular systems. Companies with moderate number of employees
will use PBS or bundle system.
Research hypothesis 4CH4). The volume of production of each product line is
related to the production system used by the company. Modular
55

systems will be used more often by large companies with larger
volume of production than by small companies with smaller volume
of production.
Statistical hypothesis 4. Larger companies (i.e., by the volume of production)
will use modular systems. Moderately large companies will use PBS,
and small companies will use bundle system.
Assumptions of the study
This research was carried out under the following assumptions:
1.The complexity in collar construction is revealed in the sketch of collar
designs.
2. The product line categories differ in the complexity of construction.
Staple product line is more simple in its construction than semi-staple product
line. Semi-staple product line is simpler in construction than fashion product line.
Fashion product line is simpler in construction compared to high-fashion product
line.
3. The subjects for the Q-Sort are experts in product assembly.
4. The production managers who are respondents of the survey are
conversant with apparel assembly on the shopfloor.
56

5. The manufacturers listed as producers of shirts and blouses manufacture
the widest range of collars and adequately represent all the collars made in the
textile/apparel industry.
6. The collars made on apparel products, other than men's shirts and
women's blouses and shirts, are replications of the ones made in blouses and
shirts.
7. The identified collar designs are representative of all the possibilities of
collar designs.
57

CHAPTER IV
Research Method
An exploratory research was done to compare the flexibilities of three
types of apparel production systems to variations in collar designs. Companies
manufacturing women's blouses and shirts and men's shirts were examined. The
method adopted to achieve the objectives of this research is explained in the
following sections (a) research design, (b) instrument, ( c) sample selection,
(d) data collection, (e) data analysis, and (f) limitations.
Research Desi&n
The survey method with mailed questionnaires was used to achieve the
objectives for this research. Survey method is generally used to obtain data that
come to the researcher through observation. This method implies the assumption
that "a given phenomenon usually follows a common pattern or norm under
similar conditions and could be observed again in the future" (Leedy, 1993, pp.
185-186). The results of survey can be generalized to the larger population if the
sample represents the population. This method allows a researcher to determine
the interrelations among variables (Kerlinger, 1973). Experimental method was
not used for this research as it would mean tampering with real life apparel
production systems and that would not be appealing to manufacturers. Case
58

studies limit generalizability of the research to the larger population because of
the sample size (Kerlinger, 1993); therefore, this method was not considered for
this research .
Instrument
The instrument used to obtain the data for this research was the mailed
questionnaire. The questionnaire consisted of three distinct sections:
(a) Company demographics, (b) Production system(s) used by the company, and
(c) Product line of the company (see Appendix C).
Company demomphics
This section contained questions on: total volume of production of the
company, volume of production/product line, and the number of employees. All
the above questions were obtained in numerical figures by an open ended
question, rather than as a range. This method enabled accurate placement of the
company with respect to other companies in the sample. More powerful statistical
analysis could be performed on this type of data (Coakley, C.W., personal
communication, December, 1993). Also, continuous data has the flexibility of
being converted to categorical data when desired.
59

Production Systems
This section consisted of questions related to production systems and their
attributes. Questions regarding the flow of work (i.e., push or pull system), tasks
per worker (i.e.,one to multiple tasks), work-in-process inventory (i.e., zero to
piles of inventory), mode of transportation of workunits (i.e.,manual, brought to
the employee by other means or handed off), and interaction between employees
(i.e., no interaction to teamwork) were asked. Responses to these questions were
tabulated to determine the primary production system used by the company (see
Table 9). This method of analysis was adopted to avoid misinterpretation of the
different production systems that could have occurred due to the differences in
terminologies used in the literature and industry. A direct question about the
production systems used by the company was asked to test the reliability of the
questions related to production system attributes.
Product line of the company
This section consisted of line drawings of the collar designs that had been
classified into staple, semi-staple, fashion, and high-fashion categories based on
the results of Q-Sorts. The collar designs on the questionnaire were randomly
arranged to avoid bias in selection of the collars. The respondents were asked to
identify the collar designs that are most easily manufactured by their production
systems. A direct question about the product lines that they manufacture was also
60

Table 9 Attributes of the three types of production systems
Production Bundle System Progressive Bundle Modular System system/ System Attributes .
Worktlow push push pull
Method of self-help brought to operator handoff retrieval between operator workstations
Work-in-Process high levels(racks moderate levels(just zero /minimal Inventory of bundles enough to balance
the lines)
Number of tasks single task, whole single task single,multiple per operator garment task or whole
garment
Interaction no teamwork no team work teamwork between workers
isked. This question helped test the reliability of 0-sorting that was used to
:ategorize the collar designs into staple, semi-staple, fashion, and high-fashion
Jroduct lines.
0-Sorts to develop instrument. A two-way structured Q-Sort was done to
:lassify the collars designs into four categories of product line namely staple, semi-
;taple, fashion, and high-fashion. Q-Sorts "force individuals to make
jiscriminations that they often do not make unless required to do so" (Kerlinger,
1973, p. 596). Q-Sorts help to see what is common to groups or sets of objects.
61

Use of Q-Sorts increased the validity of the line drawings of collar designs. A
structured Q-Sort is used to rank order a set of items all of which are in one
domain but are differentiated on the basis of one or more variable classifications.
A one-way structured Q-Sorts is structured on the basis of one variable
classification (Kerlinger, 1973). The variable that was used for classifying the
collar designs was the product line. The collar designs were determined based on
the type of collar-neckline attachment and the shape of outer edge of collars.
Collars, in general, differ in their construction method on the basis of collar-
neckline attachment and the shape of the outer edge of the collar (Smith, 1987).
Q-Sorting of collar designs into the product line categories was done in the
following steps:
1. Thirty two designs of collars were identified from literature. The collar
designs varied in terms of the method of construction (i.e., collar-neckline
attachment and shape of outer edge of collar) used for each of them. Line-
drawings of all the collar designs with different collar-neckline attachment and
shape of outer edge of collar were made on separate cards. Reliability deals with
the accuracy of a measure (Kerlinger, 1973; Leedy, 1993). To improve reliability
of a measure instructions have to be stated clearly and unambiguously (Kerlinger,
1973). The collar type, which could not be identified in the sketch, was
mentioned on the cards. An additional instruction sheet was prepared with the
definitions of the collar types and product line categories. The definitions of
62

collar styles was not included, because collar style was assumed to be revealed in
the sketch of the collar. Inclusion of the details avoided misinterpretation of the
collar types by the subjects. Also, inclusion of the details improved the reliability
of Q-sorts. All the collar designs were assigned numbers in a random order to
avoid bias in selection.
2. Six subjects were selected to sort the collar designs into the four
product line categories. The sample consisted of students, staff, and faculty in the
department of Clothing and Textiles at Virginia Tech. The subjects were selected
based on their knowledge of apparel production.
The subjects were provided with the stack of cards containing the line
drawings of collar designs and the instruction sheet with the definitions. The
stack of cards were randomly arranged to avoid bias that could have been
introduced if the cards were arranged in order. The subjects were asked to sort
the pictures into four categories based on the difficulty in construction.
3. Frequency distribution of collar designs (see Appendix A} was done to
determine the collar designs that would be selected to represent each of the four
product line categories (i.e., staple, semi-staple, fashion, and high-fashion). The
collar designs selected, for use in the questionnaire, were chosen based on the
following conditions:
Condition 1. The collar designs that were most frequently selected to
represent the product line were picked.
63
Condition 2. If more than three collar designs were selected most
frequently, the collar designs were selected in the order of their assigned
numbers. Since the numbers were randomly assigned, selection bias was
eliminated.
Condition 3. If less than three collar designs were selected most frequently,
the next most frequently occuring collar designs were picked and condition
1 and 2 were applied.
4. Twelve collar designs, three for each of the four product line categories,
were thus selected to be used in the questionnaire.
Content Validity and Readability
A pilot test was conducted to test the content validity and readability of the
instrument. Content validity indicates the representativeness of the content of a
measuring instrument (Kerlinger, 1973; Leedy, 1993). The questionnaires were
distributed to the production personnel of a medium sized manufacturer of ladies
apparel. The subjects were asked to examine the instrument for clarity and
adequacy of terminology. Based on the feedback from the pilot test, revisions
were made to the questionnaire before mailing it to the manufacturers. The
pilot test of the questionnaire indicated the need to ask the primary production
system used by the company, rather than just the production systems. The
questions related to the attributes of the production systems were also directed to
64

the primary production system. The pilot test was used to test the clarity of the
terms used to describe the collar types. The pilot test results indicated that no
definitions were required to clarify the collar types.
Sample selection
The procedure used for selecting the product sample and subject sample is
explained in the following sections: (a) product sample and (b) subject sample.
Product Sample
For a comprehensive study of the relationship between apparel production
systems and degree of style variation in apparel products, all the apparel products
with all the variations would have to be included. Innumerable variations exist
among apparel products and to include each one of them would be beyond the
scope of this study.
To begin examination of this topic, one product type with variations in one
area of the garment was selected. An upper body garment with a collar was
investigated. This area of the garment was selected for various reasons:
1. Making and attaching the collar to the neckline is one of the more
difficult operations in the assembly of a garment during production. This
operation requires better skills and manipulation to produce a better quality
product (Smith, 1987; Y.B. Nayak, personal communication, March,1992).
65

2. The collar area attracts the first attention in a garment when worn. This
reason makes the collar attachment area in a garment one of the top-priority
areas for inspection by quality control personnel. Good quality garment
construction is said to be revealed in a finished collar (Hertal, personal
communication, March, 1992; Lawrence & Yurick, 1977).
3. Collar attachment is one of the few operations in apparel assembly that
is amenable to automation (Brown, 1992). Automation tends to reduce the
flexibility of a production system (Hutchinson & Sinha, 1989; U.S. Office of
Technological Assessment, 1987).
4. Additional time is required for designing collar, making collar patterns,
and cutting collars. Extra fabric is required for collars. For these reasons collar-
making adds substantially to the cost of the garment (Stamper, Sharp, & Donnell,
1986).
Subject Sample
Manufacturers listed in SIC 2321, men's and boys' shirts, and SIC 2331,
women's, misses, and juniors blouses and shirts, categories constituted the
population for this study. These categories were selected, because the collars
made in the two categories· were considered to represent all the collars made in
the apparel industry. A stratified, proportionate, random sample of 200
manufacturers was selected out of a population of 1523 manufacturers in the two
66

categories(Dun and Bradstreet, personal communication, December, 1993). Sixty-
eight manufacturers were selected from SIC 2321 and 132 manufacturers were
selected form SIC 2331. The proportions were based on the population of
manufacturers in each category. The list was purchased from Dun and Bradstreet.
Dun and Bradstreet maintains records of small and large manufacturing business
establishments. Random selection from this list would avoid any bias that could
have resulted from including companies based on their size. The list is made by
compiling information obtained from reporters on the field, from the Department
of Commerce, business principals, newspapers, postal service, and court
proceedings. The list is considered to be current as the records are updated daily.
Out of the purchased list of 200 manufacturers, 23 had to be eliminated at the
first stage, since manufacturing was not done at the facility listed. The sample for
mailing contained 177 companies.
Data Collection
Questionnaires were mailed to the owners/CEOs of the selected 177
apparel manufacturing firms. Self-addressed, stamped envelopes were included
for returning the questionnaires. The initial mailing packet also included a cover
letter (see Appendix B) mentioning the purpose of the research. The company
owners/CEOs were asked to direct the questionnaires to the production
managers. Four weeks were allotted for return of the questionnaires. An
67

executive summary of the results was offered as an incentive for returning the
questionnaires. To maintain confidentiality of the apparel manufacturers and
monitor the return list, numbers were assigned to each of the manufacturers. The
return envelopes were numbered before the actual mailing. Post cards (see
Appendix D) were mailed a week later to serve as a reminder/thank-you. The
questionnaire was separated from the cover letter and the envelope before data
analysis to maintain confidentiality of respondents. After four weeks, telephone
calls were made to increase the response rate. Phone calls were made at random
to non-participants to improve the reliability of the sample.
Data analysis
The variables under study were: (a) production systems, (b) size of the
company in terms of number of employees, ( c) size of the company in terms of
volume of production, and ( d) the product line manufactured by the company.
Production systems
The primary production system for each company was determined by the
sum of the weights assigned to each of the attributes. Weights were assigned to
the attributes that define the production systems. More weight was assigned to the
attributes that are more important in defining the systems. Lower weight was
assigned to attributes that were less important in defining the systems.
68

The number of tasks and the method of retrieval of the cut parts were
assigned a higher weight since the three production systems differ distinctly in
these two attributes. These attributes were identified as Level 1. The type of
work-flow, levels of work-in-process inventory, and the presence/absence of
interaction between workers were assigned a lower weight since two of the three
systems distinctly differ in these three attributes but the third system could be
defined by either of the two alternatives. These attributes were identified as Level
2. For example, in bundle system and in a true PBS, no interaction takes place
between the workers, but in a modular system the work is based on the
interaction between workers (i.e., team approach). If a company has the same
Level 1 attributes, it was considered as that system under which the two
attributes occurred. On the other hand, if the two Level 1 attributes did not
belong to the same group, the Level 2 attributes were considered. If two of the
three Level 2 attributes coincided with either one of Level 1 attributes, the
company was considered to use the production system corresponding with the two
similar Level 2 attributes. Production systems were thus obtained as categorical
data.
Product line of the company
The product line of a company was identified as staple, semi-staple,
fashion, or high-fashion based on the collar design(s) selected by the
69

manufacturers. The product lines were assigned values from one to four
progressively from staple to high-fashion product line. This procedure was
adopted since the product lines differed in their degree of complexity. Staple
product line was considered to be least complex and thereby carried a value of
one, while high-fashion product line was considered to be most complex and
thereby carried a value of four. The difference between the values of the product
line categories was used to determine the degree of complexity of the product
line. For example, the difference between staple and semi-staple product line is
one, which means that the semi-staple product line is more complex than staple
product line by one degree. On the other hand, the difference in values between
staple and fashion product line is two, which means that the fashion product line
is more complex than staple product line by two degrees.
Values were assigned to each collar design based on the product line it
represented. The sum of all the values of all the collar designs that were selected
by the company determined the position of the company on the product line
continuum. The product line continuum thus ranged from a minimum of one to a
maximum of 30.0. Companies placed between 1.0 and 4.0 on the product line
continuum were considered as producing staple product line. Within the product
line, the companies having a value of less than 3.0 were considered to produce
more staple product line than companies with values greater than 3.0 but less than
4.0. The companies with a product line value of more than three but less than 4.0
70

were considered to produce product lines tending to be more semi-staple.
Similarly, a value of 7.0 was considered to be the maximum value for a semi-
staple product line. A value of 10.0 was considered to be the maximum value for
fashion product line, and a value of 30.0 was considered to be the maximum value
for a high-fashion product line. Thus, product line values for the companies were
obtained as continuous data. The product line values were recorded as
continuous data, since a clear distinction cannot be made between the
complexities of the product lines.
Size of the company
Size of the companies was identified by the number of employees and
volume of units produced per week. The size of the companies was recorded as
continuous data which is statistically more informative. This type of data can be
converted to categorical data when required. Also, more powerful statistical tests
can be performed on continuous data (Coakley, C.W., personal communication,
December, 1993).
Statistical Tests
The type of statistical tests used for each hypothesis is explained below:
Hypothesis 1
Apparel production systems was used as categorical data and the product
line categories was used as continuous data for this hypothesis. Analysis of
71

Variance (ANOVA) was performed to determine if mix flexibility of apparel
production systems (i.e., product line types) increases from Bundle to PBS to
Modular system.
Hmothesis 2
The type of production system was used as categorical data and size of the
company (i.e., number of employees) was used as continuous data to test this
hypothesis. ANOVA was administered to determine the relationship between size
of the company (i.e., number of employees) and the production system used by
the company.
Hypothesis 3
The type of production system was used as categorical data and the size of
the company (i.e. the volume of production) was used as continuous data.
ANOV A was administered to determine the relationship between the volume of
production and the production system used by the company.
Limitations of the Study
Like all research, this study had certain limitations:
1. This study was limited to one part of a product which is the collars of
men's and women's uppergarments (i.e., men's shirts and women's shirts &
blouses).
72

2. Only SIC 2321 and 2331 have been included in this study. Workshirts
and night shirts and women's dresses that might have collars are not included in
this study.
3. This study is limited to garments made from textile fabrics, those that
involve cutting and sewing operations.
73

CHAPTER V
Results and Discussion
This study examined some of the important variables in the apparel
production environment and the interaction between them. The important
variables analyzed were product line manufactured by the company and the
production system used to manufacture the product line.
The results of this study are presented in the following sections
(a) response rate of the survey, (b) company demographics, (c) production system,
( d) product line, ( e) production system-product line relationship,
(f) production system-volume of production relationship, and (g) production
system-size of company relationship.
Response Rate of the Survey
The sample selected for this research constituted 13% of the population of
manufacturers producing men's and women's blouses and shirts. Twenty-one
completed questionnaires were received by the end of four weeks of data
collection with an initial response rate of 15%. Fifteen questionnaires were
returned due to wrong addresses, the companies going out of business, or the
companies having moved without leaving a forwarding address. Telephone
74

interviews were made in the fifth week of data collection to increase the response
rate.
Forty companies had to be eliminated from the sample, because they had
gone out of business, had disconnected numbers, or did not fall under the criteria
set for this research (i.e., manufacturers of upper body garments). Wrong
numbers were verified through directory assistance. Companies in these groups
constituted the unusable portion of the sample. In all, 53 companies responded to
the survey. All the remaining manufacturers were contacted a minimum of three
times. Those manufacturers who were busy and refused to be interviewed were
included in the non-respondent portion of the sample. Figure 3 indicates the
proportion of responses, non-respondents, and wrong numbers. Exclusion of the
unusable portion of the sample resulted in an adjusted response rate of 39%. The
response rate increased phenomenally by 24% with the follow-up telephone
interviews. Increase in response rate with telephone interviews is in confirmation
with Ko's findings (1993).
The general characteristics of the non-respondents was investigated. Their
characteristics were found to be similar to that of the respondents. This enhanced
the reliability of the sample. Any bias in the results due to sampling error was
thus discounted.
75

,.... ,.... ..... II z
··:::::::::::::::::::::::::::::::::::::::!::::::::::::::::::::::::::::::::::::·· ·.·.·.·.·.·.·.·.·.·.·:.·.·.·.·.·.· ... ·.·.·.·.·.·.·.·.·.·.·.·.·.·:.·.· ........................
'a c 0 CL .,, • a:
I c 0 z
76
> 1':1:1
~ ::> Cll
1':1:1 ::c: 8 M
~ Q) 0 ,... ~ ::s
t7' 1':1:1 -~
~ ~
~ ::> 8 1':1:1 ~

Company Demo&raphics
Size of the Companies
The size of the companies was determined based on the number of
operators and the total volume of production of the company. The size of the
companies in the sample varied widely both in terms of the number of employees
and the total volume of production. Figures 4 and 5 illustrate the size breakdown
of companies based on the number of employees and the total volume of
production. Based on the number of employees, most of the companies in the
sample ranged from very small to small. Based on the volume of production,
most of the companies ranged from very small to medium. This profile parallels
the size range of all U.S. apparel manufacturers (Dickerson, 1991; Ziemke, &
Adams, 1990). This profile further supports the reliability of the sample.
Product CateKQries
The sample for this study was selected, based on product categories, from
the SIC classification of manufactured products. The categories selected were
men's shirts and women's blouses and shirts. The original sample of 200
manufacturers consisted of 66% women's and 34% men's wear category of
producers. The returned sample of 53 respondents indicated production of
women's wear (79.2%), men's wear (47.2%) and children's wear (35.8%). The
proportion of women's wear manufacturers to men's wear manufacturers in the
77

0 IO
II II II 11
• E' "' . E = :s. >-•-.,. ... E -u .. • • II >fD::::E..1
'I. .,, 0
78
0 c p

....... \.0
., ...
N=46
50
40
G> ... ::I 30 -() ca -::I c ca ::::E 20
-.st.
10
41.3%
26. 1 % 28.1"'
8.5%
0 "-~~~~~~~~~~~~~~~~--"~~~~~~~~-L-~~~~~~~--' Very Sm•ll Sm•ll Medium L•rge
Size of the Company
SIZE BREAKDOWN OF COMPANIES BY VOLUME OF PRODUCTION
Figure 5
Very Small• < 1000 Small • 1001·8000 Medium "' 8001·30000 Large • > 30000

adjusted sample was found to be greater than the proportion of manufacturers
inthe actual sample. This change could be attributed to the fact that some
manufacturers produce both men's and women's wear (26.9% ), and they reported
both of the categories.
Most of the women's wear manufacturers in the sample produce upper
body garments such as blouses. Most of the men's wear producers manufacture
shirts (i.e., sports and dress shirts). The manufacturers of children's wear mostly
produce girls' wear. Table 10 indicates the frequency and percentage of
respondents based on the product categories manufactured by them.
80

Table 10 Product Categories manufactured by the Respondents.
Product Category Frequency Percent n %
Women's Wear 42 80.8
Blouses 31 59.6
Skirts 26 50.0
Pants 21 40.4
Dresses 21 40.4
Jackets 13 25.0
Coats 5 9.4
! Under Garments 2 3.8
Others 7 13.5
Men's Wear 24 47.2
Dress Shirts 6 13.2
Sports Shirts 18 34.6
Jackets 5 9.4
Coats 0 0
Trousers 3 5.8
Underwear 0 0
Others 8 19.8
Children's Wear 19 36.5
Boys 9 17.3
Girls 14 26.9
Infants 6 11.5
Others 5 9.6
N=52
81

Production Systems
The three production systems selected for this study included bundle
system, PBS, and modular system. Great inconsistency exists in the terminologies
used in the apparel industry and literature (Gerwin, 1987; Gupta & Buzacott,
1989; Ramasesh & Jaikumar, 1991). To overcome the inconsistency, attributes
that characterize the three production systems were selected from literature. The
attributes identified were type of workflow, mode of transportation of workunits
between workstations, the number of tasks per operator, level of WIP inventory,
and interaction between workers (Hapeman, 1971; Kimura & Terada, 1981;
Solinger, 1988). Definitions were provided for each of the attributes for clarity in
terminology.
The production system used by the company was determined by
aggregating the weights assigned to each of the attributes and was designated as
the determined production system. A direct question, as to the system being used,
indicated the type of production system that the manufacturers thought they were
using and was designated as the selected production system. Figure 6 indicates
the rate at which the various systems both determined and selected system were
represented in the sample. According to the system determined based on the
attributes, PBS was found to be used by most (60%) while bundle system and
modular system had lower usage with 18% and 22% respectively. In the selected
system, most of the manufacturers use bundle system (53.8%) and very few use
82

N=52
70
so
50 U) -CD -::I - 40 c.> ca -::I c: 30 ca
00 :::!: w -ae. 20
"10
0
80% ••
.... .......... .......... .... ... . . .
......... ......... . . . ... . . . ......... .. .... ... . . . .. . .. . . . .... .. . . . . ..... . . . . ... .. . . . ... ... . . . ... ... . . . . . . . . . . ......... . . . . . . . . . .. .... ...
PBS
- .. .. .. .. .. ... .. - .. ... - - .. - .. - .. - .. .. ... .. . .. .. .. - - - - .. .. .. .. .. .. - .. .. - - ..
Bundle
53.8% - .... - - - . - - - - - - - - - - .. - .. - -
.. - ......... - .. - .... - -
D Selected Prod. Sys.
D Determined Prod. Sys.
...... - - .. - .. - - - - - .. - - - - .. -
Modular
Production System
PRODUCTION SYSTEM USAGE
Figure 6
modular (11.5%) system. The results obtained for selected production system is
consistent with the findings of Lin, 1990. A simple chi square test indicated a
significant relation between the determined production system and the selected
production system (r [4, N=50] =19.541,p=.001). This confirms the reliability
of the method used to determine the system. The difference that is noticed
between detemi.ined and selected production system is not significant and may be
attributed to the inconsistency in terminologies between the industry and
literature.
To further check the reliability of the definition of determined production
system, the relationship between individual attributes and the determined system
was evaluated. The significance of the attributes in determining the production
system in use was tested using a simple chi square test. The level of significance
was set at a probability of .05.
WIP Inventon
The bundle and PB system have been classified as intermittent systems
(Solinger, 1988). Modular systems have been classified as continuous systems.
Intermittent systems consists of WIP inventory that remains stationary between
successive workstations (Solinger, 1988) while continuous systems have
zero/minimal WIP inventory. Modular systems have been defined as consisting of
zero/minimal WIP inventory (Ross, 1991). Significant associations were found
84

between apparel production systems and the level of WIP inventory for each of
the systems in this sample (determined production system, z2 [4, N =49] =22.674,
p=.000; selected production system, z2 [4, N=49] =48.327, p=.000). More than
50% of the cells had less than the minimum values and so the test was repeated
for bundle and PBS only. Fisher's exact test indicated a significant relation
between the two variables (p = .001). This result indicates the reliability of the
three levels of WIP inventory that was used for the three systems.
The frequencies and percentages of the WIP inventory levels of the three
production systems is shown in Table 11. All bundle system users reported high
levels of WIP inventory (100%). This finding is consistent with the theoretical
concept of WIP inventory levels in for the three systems. Most of the PBS and
modular system users reported having moderate levels of WIP inventory (PBS
53.33%; modular system 50% ). High levels of WIP inventory was noticed most in
PBS (56%) compared to bundle system and modular system. Only modular
system had a zero inventory level (100%). This finding suggests that zero
inventory level is probably possible only in modular system and that bundle system
almost always involves high levels of WIP inventory.
85

Table 11 WIP of the Determined Production Systems.
I Level of WIP
I Determined Production System Total
PBS Bundle Modular
High n 9 14 2 25 % 18.37 28.57 4.08 51.02
Row% 36.00 56.00 8.00 Col% 100.00 46.67 20.00
Moderate 0 16 5 21 0.00 32.65 10.20 42.86 0.00 76.19 23.81 0.00 53.33 50.00
Low 0 0 3 3 0.00 0.00 6.12 6.12 0.00 0.00 100.00 0.00 0.00 30.00
Total n 9 30 10 49 % 18.37 61.22 20.41 100.00
Workflow
The type of workflow in any production system is either push or pull
depending on what drives the work through the system (Kimura & Terada, 1981).
A significant relationship was found between the production system and the type
of workflow in the case of both determined and selected production systems
(determined production system, x2 [2, N = 48] = 10.640, p = .005; selected
production system, r [2, N =48] = 16.538, p = .000). This finding suggests the
86
.

reliability of the two types of workflow as a contributing factor in determining the
type of system. Table 12 indicates the frequency and percentage of determined
production systems with the associated workflow.
Table 12 Work Flow in the three Determined Production Systems.
Level of Work Flow Determined Production System
PBS Bundle Modular Total
Push through n 6 29 5 40 % 12.50 60.42 10.42 83.33
Row% 15.00 72.50 12.50 Col% 66.67 96.67 55.56
Pull 3 1 4 8 through 6.25 2.08 8.33 16.67
37.50 12.50 50.00 33.33 3.33 44.44
Total n 9 30 9 48 % 18.75 62.50 18.75 100.00
Most of the manufacturers reported a push workflow (83.33%) and very
few manufacturers reported a pull workflow on their systems. This finding could
be attributed to the fact that very few manufacturers used modular system which
has been associated with pull workflow. Most of the bundle system (66.67%) and
PBS (96.7%) indicated push workflow. This finding is consistent with findings in
literature that indicate a push workflow in traditional manufacturing systems
(Carrere & Little, 1989). The type of workflow is directly related to the WIP
87

inventory between the workstations. High levels of WIP is said to be the motive
to push the work through the system; however, modular system users reported
pull and push workflow almost equally. This finding could be attributed partly to
the inconsistency in terminology used in the industry. Also a better representation
of modular system users would probably have revealed more obvious differences
in the type of workflow for modular system. Of the very few manufacturers who
adopted the pull workflow, most of them were modular system users (50% ). This
finding is consistent with the findings of Carrere and Little (1989). In a pull
workflow, a need to increase the production helps pull the work through the
system.
Mode or transportation or workunits
The type of product flow is dictated by the method of retrieval or mode of
transportation of workunits between workstations (Solinger, 1988). The mode of
transportation between workstations is one of the more important attributes that
characterize apparel production systems. Significant association was noticed
between the determined production systems and the mode of transportation of
workunits between workstations but not for the selected production system
(determined production system I [4, N =49] =28.756, p=.000; selected
production system x2 [ 4, N = 49] = 3.848, p = .427). The chi square test was not
considered valid due to under representation of modular system users. To
88

improve the validity of the test, bundle system and PBS only were tested for the
relation. Significant relation was found between the systems and the mode of
transportation of workunits between workstations Cr [2, N = 45] = 20.019, p = .000).
Table 13 indicates the frequency and percentage of the various means of
transportation of workunits found in the determined production systems. Most of
the manufacturers using bundle system indicated that the operator himself carries
Table 13 Mode of Transfer of Workunits
in the Determined Production Systems.
Mode of Transfer of Determined Production System Workunits
PBS Bundle Modular Total
Self-Help n 7 2 2 13 Operator % 14.29 4.08 8.16 26.53
Row% 53.85 15.38 30.77 Col% 77.78 6.67 40.00
Transport by 2 27 3 32 other means 4.08 55.10 6.12 65.31
6.25 84.38 9.38 22.22 90.00 30.00
Handed off 0 1 3 4 0.00 2.04 6.12 8.16 0.00 25.00 75.00 0.00 3.33 30.00
Total n 9 30 10 49 % 18.37 61.22 20.41 100.00
89

the workunits to the workstation (77.78%). This finding is consistent with the
theoretical definitions put forward by Hannan (1963). Most of the PB system
users indicated transportation of workunits by other means of transportation (e.g.,
conveyors or material handlers). This finding confirms the theoretical definitions
of PBS in literature (Chase & Aquilano, 1992; Ross, 1991). Transportation by
other means increases the time spent on actual sewing operation and helps
improve productivity (Hodge & Canada, 1989).
Within modular system, the three modes of transportation of workunits
were noticed almost equally. Across the systems, handoff approach for retrieval
of workunits was most commonly found in modular system (75%). This finding
indicates that this mode of transportation is a characteristic feature of modular
systems and not bundle or PB systems. In the modular system, the workflow is
continuous and the workunits do not remain stationary at any moment during
processing (Solinger, 1988). The workunits are handed off to the next operator
when the operator is ready to work on the oncoming workunit. Transportation by
other methods such as conveyors was noticed most in PBS (84.38% ). This finding
is consistent with the definition of the PBS in the literature (Sisselman, 1990).
Lack of significant association between the selected production
system and the mode of transportation between workunits may be attributed to
the finding that most of the selected bundle system users (71.43%) reported
transportation of workunits by other than manual means. This finding is contrary
90

to the findings of the mode of transportation for determined production systems
This finding could be attributed to the increased awareness among apparel
manufacturers about the unproductivity of the time spent on non-value added
repetitive tasks. Manual transportation is probably being replaced by automated
devices to overcome this problem (Cole, 1987; Hodge & Canada, 1989; JSN
International, 1989).
The number of tasks per operator
The number of tasks assigned to each operator have been identified as
being different in each of the three production systems. Significant association
was found between apparel production systems and the number of tasks assigned
to each operator (determined production system, r [4, N=50] =47.928, p=.000;
selected production system, r [ 4, N = 50] = 23.508, p = .000). Majority of the
manufacturers (78%) reported assigning single tasks to an individual operator and
the operator does not make the entire garment. This finding is consistent with
the classification of PBS as a section production system rather than a whole
garment production system by Solinger (1988). This finding could be attributed to
the over representation of PBS in which operators work on single tasks and do
not make the entire garment.
Table 14 indicates the frequency and percentage of the production systems
with the associated number of tasks per operator. Most of the bundle system
91

users (77.78%) reported assigning single tasks to operators, and the operator does
not make the entire garment unlike the definition of bundle system by Hannan
(1963). In a traditional bundle system, operators perform multiple tasks and
sometimes may make the entire garment. All the PBS users ( 100%) reported
assigning single tasks and the operator does not make the entire garment. This
finding is consistent with the theoretical definition of PBS (Sisselman, 1990;
Solinger, 1988). This finding suggests that manufacturers are increasingly
adopting the latter approach to overcome the problem of locating multiskilled
operators. Assigning single tasks to individual operators reduces the need for
multi-skilled operators (Maziotti, 1993). This finding is consistent with the
theoretical definition of PBS (Sisselman, 1990; Solinger, 1988). The operations
are laid out in a sequence and work flows from one operator to the next in a
progression.
92

I
Table 14 Number of Tasks per Operator in the Determined Production
Systems.
Tasks
I Determined Production System
PBS Bundle Modular
Multiple n 2 0 0 % 4.00 0.00 0.00
Row% 100.00 0.00 0.00 Col% 22.22 0.00 0.00
Single 7 30 2 14.00 60.00 4.00 17.95 76.92 5.13 77.78 100.00 18.18
Single or 0 0 9 Multiple 0.00 0.00 18.00
0.00 0.00 100.00 0.00 0.00 81.82
Total n 9 30 11 % 18 60.00 22.00
Total
2 4.00
39 78.00
9 18.00
50 100.00
In a modular system most of the manufacturers (81.82%) reported assigning single
or multiple tasks depending on the work demanded by the next operator. This
finding is a direct consequence of the handoff approach as reported earlier. The
results are consistent with the theoretical concept of handoff approach in modular
manufacturing (Ross, 1991).
93

Interaction between operators
One of the characteristic features of modular system is the team approach
to manufacturing (Carrere & Little, 1989; Cole, 1992). A great degree of
interaction exists between operators in a modular system. Simple chi square tests
were performed to determine the relationship between production system and
interaction between operators in the sample. Significant association was found
between production system and interaction between workers (determined
production system, r [4, N =50] = 13.992, p = .007; selected production system, r [4, N =50] = 12.731, p =.013). The chi square tests were not considered valid due
to under representation of modular systems, but the frequencies and percentages
in Table 15 indicate that in determined production systems, most of the modular
system users (81.82%) reported interaction among operators. Correspondingly
most of the bundle system (55.56%) and PBS users (70%) indicated no interaction
among the operators. An interesting finding was the relatively high degree of
interaction among operators in a PBS. This finding is not consistent with the
theoretical definition of PBS. This finding suggests that manufacturers are
incorporating team work in PBS.
The chi square test was repeated for determined bundle system and PBS to
determine the relation between traditional systems and interaction among
workers. Fisher's exact test indicated no significant relation between the
production system and interaction between workers (r [1, N =45] =0.512,
94

p = .474). These findings are consistent with the theoretical concepts of teamwork
in the three systems. The high degree of significance between the production
systems and the attributes indicate the reliability of the attributes in determining
the system. The attributes of one system could be incorporated into other
production systems, based on the company's objectives, to improve their
effectiveness. Table 16 is an overview of the significance of attributes with
respect to the determined and selected production systems. The variable,
determined production system was used in hypotheses testing.
Table 15 Degree of Interaction among operators in Determined Production System.
Degree of Interaction Determined Production System
PBS Bundle Modular Total
Interaction n 4 9 9 22 % 8.00 18.00 18.00 44.00
Row% 18.18 40.91 40.91 Col% 44.44 30.00 81.82
No Interaction 5 21 1 27 10.00 42.00 2.00 54 18.52 77.78 3.70 55.56 70.00 9.09
Total n 9 30 11 50 % 18.00 60.00 22.00 100.00
95

Table 16 Level of significance of System Attributes and Production System.
System Attributes
Production System WIP Work Mode of No. of Team Flow Transfer Tasks Work
x2 22.67 10.64 28.76 47.93 13.99 Determined
prob. 0.00 0.01 0.00 0.00 0.01 x2 48.3 16.5 3.9 23.5 12.7
Selected prob. 0.00 0.00 0.43 0.00 0.01
For hypotheses testing, only the determined production system was used because
relation between determined and selected production systems was significant and
linear.
Product line
The product line of a company was determined based on the collar designs
that the company manufactures. The collar designs were previously selected and
categorized, by Q-sorts, into product lines (see Appendix A). Collar designs
classified as staple and semi-staple product line were in general simpler in
construction. The collar designs that were classified as fashion and high-fashion
product line were more complex in construction. This finding is consistent with
the product line description by (Hill, 1978). Table 17 indicates the frequencies
96

and percentage of manufacturers producing the various collar designs. Most
manufacturers produced collars from the staple/semi-staple product line. The
pointed convertible collar was produced by most manufacturers ( 60%) followed by
the mandarin collar (56%) and pointed shirt collar ( 48% ). Fashion/high-fashion
collars were produced by the least number of manufacturers. The scarf collar
(10%) and chelsea collar (12%) from the high-fashion product line were produced
by the least number of manufacturers. Values were assigned to each product line
and the corresponding collar design as designated in Chapter IV. The sum of
scores for all the collar designs manufactured by a company is referred to as the
product line value.
Figure 7 indicates the product lines manufactured by the companies. The
product line selected by the company is compared with the product line value
determined by the collar designs manufactured.
97

Table 17 Frequency Distribution of the Product line Categories Based on Collar
Designs.
Product line
Staple Semi-Staple Fashion High Fashion
Collar 6 8 10 4 9 12 1 2 7 3 s 11 Designs
by numbers
n 28 24 9 17 30 11 6 10 5 6 3 5
% 56 48 18 34 60 22 12 20 10 12 6 10
Product 81.33 72.33 28 18.67 line%
98

\.0 \.0
N=SO
50
40
~ CD ~ 30 -u ca -::I c ca
:::::E 20
~
10
---------------------------------
H" 32.7%
CZJ Selected Product Line 0 Productlln• V•lue
ov :<. / / ,, Sl•ple Seml-Sl•ple F••hlon
Productllne High F••hlon
PRODUCT LINES MANUFACTURED BY THE COMPANIES
Figure 7

Collars in the staple product line was produced by most ( 44%) of the
manufacturers, followed by the semi-staple product line (38% ). Fashion and high-
fashion collars was produced by the least number of manufacturers (fashion, 10%;
high-fashion, 8%). The Student-Newman-Keuls analysis of variance test was
performed to determine the relation between product line value and the selected
product line. Significant association was found between the selected production
system and the selected product line (F [3, 48] =3.18, p=.0322).
For testing of the hypotheses, both the measures of the product line
variable were used (i.e., selected product line and the product line value). This
procedure of testing was adopted because the analysis of variance tests revealed a
significant relation between the two variables, but the relation was not linear.
Production System and Product line Relationship
The main objective of this research was to compare the flexibility of three
types of apparel production systems to variations in collar designs. It was
hypothesized on theoretical grounds that modular system would be more flexible
than PBS and PBS would be more flexible than bundle system (H1). For
hypothesis testing, the following combination of variables were tested: determined
production system and product line value; and determined production system and
selected product line.
100

First, the three production systems were compared for their product line
value which is the summation of all the collar design scores. Analysis of variance
procedure was used to test this hypothesis. The Student-Newman-Keuls test
revealed no significant relation between the determined production system and
the calculated product line value (F [2, 47] =0.27, p=.7640). Hypothesis 1 (H1)
was not confirmed with this sample. This finding may be due to type II error that
could have occurred because of the small sample size.
For further validation, a simple chi square test was performed with the
determined production system and the selected product line. A significant
relation was found between the two variables (.y [6, N=50] =14.816,p=.022).
The chi square test was not considered valid due to under representation by
bundle and modular systems. To improve the validity of the test, staple and semi-
staple product lines were combined in one group and the fashion and high-fashion
product lines were combined in another group. Results of the test indicate a
significant association between the determined production system and the selected
product line (r [2, N = 50] = 8.186, p = .017). This result indicates that a relation
exists between production systems and product line categories, but a more
balanced sample may be needed for further confirmation of this hypothesis.
Figure 8 illustrates the different production systems with the associated product
lines.
101

~
0 N
Cit ... CD ...
215
20
:I 115 -u ca -:I c ca 10 ::::ii:
"l/t.
IS
- - - - - . - - - - - - - - - - . - - .. - - - - - - - . - - - - -
- - - - - . - - - - - - - - - - - - - - - - - - ... - - - - - .
---------------------------------
- - - - - - - - - -
OIL ,/ L J
PBS Bundle Modul•r
Production System
PRODUCT LINES MANUFACTURED ON THE THREE PRODUCTION SYSTEMS
Figure 8
Product llne ~ Hlgh-F•ahlon ~F•ahlon Oseml-•l•pl• IZJ St•ple

A difference in the results between the two measures of product line may
be attributed to the misinterpretation of product line terms despite the definitions.
Fashion product line, for example, may have been interpreted as a product line
that is being produced more recently rather than a product line that consists of
more frequent changes in styles. Some of the manufacturers selected fashion
product line though they produced more staple collar designs.
Frequency distribution of determined production systems and the
associated product line values indicate that PBS was most used for all product line
categories. This finding could be attributed to the over representation of PBS in
the sample. Within the system, bundle system was most used for staple product
line (8% ). This finding is consistent with the theoretical concept of the flexibility
of bundle system (Hunter, 1990; Johnson-Hill, 1978; Knapton, 1990;
Schoenberger, 1982; Solinger, 1988). Staple collars are simpler in construction
with very little variation in styles. Very little variation in styles does not require
the system to be very flexible to style variation. Bundle system was used to a very
small extent for fashion (2%) and high-fashion product line (2% ). PBS was most
used for both staple (24%) and semi-staple (24%) product line compared to high-
fashion product line ( 4% ). Semi-staple product line consists of more variation
between styles compared to staple product line (Johnson-Hill, 1978). PBS could
be considered more flexible than bundle system due to its ability to accommodate
more style variations. This finding is consistent with the findings in literature.
103

An interesting finding was that modular system was most used to produce
staple product line (12%) and was least used for fashion product line (0%). This
finding is contrary to the expected results. Modular system was hypothesized as
having the ability to produce greater style variation as found in fashion/high-
fashion product line (Carrere & Little, 1989; Hunter, 1990; Johnson-Hill, 1978;
Kurt Salmon, 1988; Ross, 1991; Schoenberger, 1982; Sisselman, 1990) compared
to bundle system and PBS (i.e., a higher degree of flexibility). This result could
be attributed largely to the under representation of modular system. On the other
hand, modular system may not be as flexible as theorized in the literature.
A significant association between the selected and determined production
system and between selected and calculated product line value confirmed the
reliability of responses to the questionnaire. Comparison of the flexibility of the
three production systems was limited due to the under representation of modular
and bundle system users.
Production 5.ystem and Volume of Production Relationship
The volume of production on a modular system was hypothesized (H2) on
theoretical grounds to be less than that on PBS and bundle systems. This
hypothesis was not confirmed with the sample. Student-Newman-Keuls analysis of
variance test indicated no significant relation between the two variables
(determined production system, F [2, 42] = 1.87, p=.1668). Figure 9 illustrates the
104

N=45
30
25
"' ... ~ 20 ::I -u ca 15 -~ ::I 0 c VI ca
== 10
"' 5
0 PBS Modular Bundi•
Production System
VOLUME OF PRODUCTION ON THE THREE SYSTEMS
Figure 9
Volume of production
•very High
~High
t:J Moderate
t'.11 Low
Overy low

volume of production on the primary system. Comparison of the three systems
indicated that modular system was most used for very low production which is
consistent with the findings in literature (Ross, 1991). Very low volume of
production is associated with custom production and high degree of variation
(Johnson-Hill, 1978), but all three systems were found to be equally used (11%)
for very low and low volume of production. PBS was used the most for moderate
and high/very high volumes (33.4%) compared to bundle system (8.8%) and
modular system ( 11.1 % ). Within the system, PBS was used most for moderate
volume of production (24.4%) followed by low volume (8.9% ). This result is
consistent with the theoretical concepts found in literature. Bundle system was
used most for low volume production (8.9% ). Modular system was used most for
very low (8.9%) and moderate volumes of production (8.9% ). Bundle system was
least used for high and very high volumes of production. This finding is contrary
to the theoretical concepts that claim bundle system to be used for high volume or
bulk production. Modular systems were least used for very-high volumes of
production. This finding is consistent with the theoretical definitions of modular
manufacturing where the system is said to be used for more customized
production.
106

Production System and Size of the Company
The size of the company was determined based on the number of
employees and the total volume of production of the company. A relation was
hypothesized (H3) to exist between the determined production system and the size
of the company by number of employees. The Student-Newman-Keuls analysis of
variance test indicated no significant relation between the two variables (F [2, 44]
= 1.59, p = .2152). Hypothesis, H3, therefore could not be confirmed with this
sample. This finding is interesting in the light of the fact that larger companies
continue to use traditional production systems as seen in Figure 10. Claims in
literature, that many companies are adopting advanced production systems as a
fad, may not be true (Cole, 1992). Figure 10 indicates that PBS was used most
often irrespective of the size of the company; however, comparison within the
system indicated that modular system was most used by small companies (10.7%).
Within the system, PBS was used most by small companies (27.7%), and within
the system, bundle system, was most used by very small companies (10.7%). This
finding is not consistent with the literature that advanced production systems like
modular system are generally used by large companies. This finding may probably
be due to the inadequate representation of large companies in the sample.
107

30
25 .,, ~
~ 20 ::s -u ca 15 -....... ::s c 0 ca CX> :::e 10 'a'
5
N=46 - - - - - - - - - - - - - - - - - - . - - -
- - . - - .... - - - - - - ... - - - - - ...
- - - - - - - - - - - - - - - - - - . - - -
- - - - - - - - - - - - - - - - . - - -
- - - - - - - - - - - - - - - . - - .
Size of the Company ~luge
~medium
[Z]•m•ll
Overy •m•ll
PBS Bundle Modul•r
Production System
PRODUCTION SYSTEM USAGE BY SIZE OF COMPANY (no. of employees)
Figure 10

Relation between production system and size of a company was tested with
the volume of production as an indicator of the size of the company (H4). H4 was
tested with the Student-Newman-Keuls analysis of variance procedure. No
significant relation was noticed between the size of the company, by volume of
production, and the system that is adopted by the company (F [2, 43] =0.54,
p = .5841 ). Figure 11 illustrates the systems used by companies of different sizes in
terms of volume of production. Usage of PBS was found to be used more than
bundle system and modular system irrespective of the size of the company. This
finding could be attributed to the inadequate representation of modular system in
the sample. Bundle system was most used by very small companies, and PBS was
used most by small companies. These findings are similar to the results obtained
for size of company in terms of the number of employees. This finding confirms
the finding that larger companies do not necessarily use more advanced
production systems.
109

N=47
30.0
21!1.0
I!! 20.0 --=i ...... u ...... -0 "5 11!1.0 c: -:::::::&! 'l/!. 10.0
I. . 1!1.0
. . . . . . . . 1 ·· ....
PBS Bundle Modul•r
Production Syet•m
PRODUCTION SYSTEM USAGE BY SIZE OF COMPANY (vol. of prod.)
Figure 11
Size of the Company rsllarge ISi medium
1ZJ small
Overy small

CHAPTER VI
Summary, Conclusions, Implications, and Suggestions
Production and efficiency of apparel production systems have been
examined, but, finer aspects of manufacturing, such as flexibility, have been
neglected in the apparel industry. With the fast-changing nature of the apparel
market, apparel manufacturers must begin adopting strategies for increased
flexibility, simultaneously improving productivity and efficiency (Soni, 1990).
The capability of a system is the system's intrinsic ability (Troxler & Blank,
1989), and flexibility is one of the determinants of capability of a system.
Flexibility refers to the capability of a system to respond effectively to uncertain
circumstances (Gerwin, 1987); therefore, any attempt at studying the flexibility of
apparel manufacturing system necessitates a close look at the uncertainties that
exist in the manufacturing environment (Buzacott, 1982). A production system is
said to be flexible to style changes if it responds to frequent changes in style in an
efficient manner. A production system must be flexible enough to produce or
accommodate a wide variety of products in terms of style features and to produce
a selected volume efficiently within the region of economy of production.
The purpose of this research was to analyze flexibility at the basic level, by
examining one aspect of flexibility (i.e., mix flexibility) and one part of a garment
111

(i.e., collars). Starting at the basic level facilitates defining and operationalizing of
terms and concepts.
This study was designed to examine the relationship between apparel
production systems and product line categories. An objective of this study was to
determine the production systems used by the company and the product line
manufactured by the company. The information obtained was used to compare
the flexibility of three types of apparel production systems.
Summaa and Conclusions
This study analyses the relationship between apparel production systems
and style variation as revealed in the collar designs of men's and women's shirts
and blouses. The objectives of this research were achieved by the survey method.
Mailed questionnaires were used to obtain the data. The survey instrument
contained three sections (i.e., company demographics, production systems and
product line of the company). Q-Sorts were done to select the collar designs that
represent the product line categories. Thirty two collar designs were identified for
the initial Q-Sorting. From the Q-Sorts twelve collar designs (i.e., three for each
product line) were selected to represent the product line categories in the
instrument. The instrument was pilot tested for content validity and reliability.
The questionnaires were mailed to a stratified, proportionate, random
sample of 177 apparel manufacturers in the United States. Fifty-two responses
112

were received with a response rate of 39%. The respondents represented
manufacturers producing men's and women's shirts and blouses. Values were
assigned to each collar based on its product line. The values of the collar designs
manufactured by a company were summed to obtain the product line of the
company. Questions were asked about the five production system attributes and
responses were aggregated to obtain the production system for the company.
Analysis of variance (ANOV A) and chi square tests were performed to analyze
the data.
Company Demouaphics
A majority of the companies in the sample ranged from very small to
medium with less than 100 employees and volume of production of less than
30,000 units per week. The sample consisted of producers of women's
wear(79.2%), producers of men's wear (47.2%), and producers of children's wear
(35.8%). This finding is consistent with the general profile of all U.S. apparel
manufacturers (Dickerson, 1991).
Production Systems
The three production systems selected for this study were bundle system,
PBS, and modular system. Most of the respondents used PBS, followed by
modular system, and bundle system. The production system used by a company
113
was determined based on five attributes identified from literature (i.e., Work flow,
mode of transportation, WIP inventory, number of tasks, and interaction between
workers).
Significant associations were found between the production system
attributes and the production system used by the company. Bundle system was
found to have high levels of WIP inventory. The level of WIP inventory is directly
related to the type of workflow adopted by the company. Consequently, most of
the bundle system users reported adopting the push workflow where piles of WIP
inventory causes to push the work through the system. Most of the manufacturers
using bundle systems reported assigning single tasks to individual operators
although in traditional bundle system operators are sometimes assigned multiple
tasks where they make the entire garment. The workunits in a bundle system
were reported to be transported manually between workstations. Some of the
findings indicated transportation of workunits by other means. This change could
occur, because manufacturers are beginning to increase automation for more
repetitive and non-value added tasks like material handling. No interaction was
found among bundle system users which indicates the absence of team approach
to manufacturing. These findings confirm the classification of bundle system as
the traditional manufacturing system defined by Knapton (1990).
Most of the PBS users reported moderate WIP inventory levels that were
just enough to balance the lines, and push workflow was most reported by PBS
114

users. Most of the PBS users reported assigning single tasks to an individual
operator, and the operator does not make the entire garment. The need for
multi-skilled operators is minimized. The workunits in PBS were found to be
transported more by automatic transfer devices rather than manually. As
reported earlier, this mode of transportation helps improve productivity. PBS
users also reported no interaction among operators. These findings confirm the
classification of PBS as a traditional system similar to the bundle system
(Knapton, 1990). ·
Modular system attributes were dissimilar when compared to the bundle
system and PBS. Modular system users were found to have zero WIP inventory
and pull type of workflow. In a pull workflow, the need to increase production
helps pull the work through the system rather than high levels of WIP inventory
that helps push the work through the system (Kimura & Terada, 1989).
Individual operators in a modular system are assigned multiple tasks depending
on the demand for work by the next operator. This feature of modular system
confirms the system's classification as a continuous rather than an intermittent
system (Carrere & Little, 1989). The team approach to manufacturing was
reported only by modular system users. This finding coincides with Knapton's
(1990) classification of modular system as being different from the more
traditional bundle and PB systems.
115

Product Line
The product line of a company was determined based on the collar designs
that the company manufactures. The collar designs were previously selected and
categorized, by 0-sorts, into four product lines (i.e., staple, semi-staple, fashion,
and high-fashion [see Appendix A]). Collar designs classified as staple and semi-
staple product line were in general simpler in construction. The collar designs
that were classified as fashion and high-fashion product line appeared to be more
complex in construction. Values were assigned to each product line and the
corresponding collar design. The sum of scores for all the collar designs
manufactured by a company was referred to as the product line value. Significant
associations were noticed between the product line selected by the companies and
the product line determined by the collar designs. Most manufacturers produced
collars from the staple/semi-staple product line. Fashion/high-fashion collars
were produced by the least number of manufacturers.
Production System and Product Line Relationship
Modular system was hypothesized (H1} to be more flexible than PBS and
that PBS would be more flexible than bundle system. Flexibility was measured by
the range of characteristics of part types (i.e., product line based on collar
designs) that a system can manufacture. For this hypothesis (i.e., H1}, the three
production systems were compared for their selected product line and for their
116

product line value, which is the summation of all the collar design scores.
Analysis of variance test confirmed this hypothesis with the determined production
system and the selected product line. PBS was found to be most flexible followed
by modular system and bundle system.
When analysis was done using product line value instead of selected
product line, chi square test failed to confirm this hypothesis. The difference in
the relationship of production system with selected product line and the product
line value may be attributed to the fact that the relationship between product line
value and selected product line was not a completely linear relationship. Some
manufacturers who selected more fashion product line produced more staple
collars. These staple collars may be considered more fashionable today as the
consumers are opting for more simple lines for fashion items.
Production System and Volume of Production
The type of production system and the volume of production were
Hypothesized (H2) to be positively related. Comparison of the three systems for
their volume of production indicated that bundle system was most used for low
volume production, PBS was used most for moderate and high volumes, followed
by modular system that was most used for very low volume of production.
Analysis of variance test did not confirm the relationship between the two
variables. High volume of production is generally associated with more staple
117

products with very little style variation (Johnson-Hill, 1978; Lin, Kincade, &
Warfield, in press). Very low volumes are associated with custom production and
high degree of style variation (Johnson-Hill, 1978; Lin, Kincade, & Warfield, in
press). The volume of production on bundle system is not consistent with
literature.
Production System and Size of the Company
The type of production system and the size of company (i.e., number of
employees [H3] and the total volume of production of the company [H4]) were
hypothesized to be related. Although bundle system was used most by small
companies, PBS was used by small to medium sized companies, and modular
system was most used by small companies, the analysis of variance tests did not
confirm these hypotheses. The use of modular system by small companies is not
consistent with literature (Cole, 1992). This finding may be attributed to the fact
that other variables are affecting selection of production systems. Smaller
companies are more adaptable to new situations and may be adopting advanced
manufacturing systems more easily compared to larger companies (Cole, 1992;
Ko, 1993).
118

Implications
The results of this study could be used for subsequent research on flexibility
of apparel manufacturing systems. The five system attributes that were identified
may be used reliably for determining the production systems used by a company.
This procedure would help identify systems when evaluated in subsequent
research.
The procedure adopted for determining the product line of a company was
partially successful in determining the product line. With additional study, this
procedure may be used for determining the product line based on style variation
in garment parts. A classification system may be developed for research in the
apparel industry based on the criteria set forth in this study (i.e., construction
features and look of a garment). Quantifying these variables will help improve
the validity of statistics in research related to production systems and product
lines.
Sua:a:estions
The suggestion.s for this research include:
1. The sample size for the Q-Sorts may be increased to improve the
reliability of categorization of collar designs into product lines.
119

2. This research can be repeated with a larger sample and including more
modular system users to reexamine some of the hypotheses that could not be
confirmed in this study.
3. A similar study could be done using computer simulation where the
flexibility of production systems could be determined taking into consideration all
the factors that influence or affect system performance.
4. The results of this study could be used to determine the mix flexibility of
apparel manufacturing systems. Other types of flexibility could be determined by
their underlying parameters and the aggregate flexibility of an apparel
manufacturing system calculated. The flexibility attribute is input to a multi-
criterion decision making problem. Flexibility will provide the additional
competitive edge in meeting the evergrowing challenges of varying product design
(Soni, 1990).
5. The flexibilities of other manufacturing systems can be determined and
compared to identify the most flexible manufacturing system. The measures of
flexibility can be used by decision makers in support of choosing a manufacturing
system for specific products lines.
6. Research could also be done to determine the relationship between
quality of the apparel product and flexibility of the manufacturing system.
Research can be done to determine how much flexibility was lost or gained as a
result of improvement in quality. Flexibilities of different systems performing the
120

same task can be compared. The uncertainties that are controlled and adapted to,
and the strategies used for controlling and adapting can also be studied.
Ultimately, this research could lead to a comprehensive analysis of the flexible
factory, as it adapts to uncertainty.
121

BIBLIOGRAPHY
Abernathy, W. J., Clark, K. B. & Kantrow, A. M. (1983). Industrial renaissance. New York: Basic Books.
American Apparel Manufacturers Association. (1965). The effect of style variation on manufacturing cost. Washington, DC Author.
American Apparel, Manufacturers Association. (1982). Fashion apparel manufacturing. Arlington, VA: Author.
Boothroyd, G. & Dewhurst, P. (1989). Product design for product assembly. Wakefield, Rhode Island.
Brackelsberg, P., & Marshall, R. (1977). Unit method of clothing construction (6th ed). Iowa: Iowa State University.
Brackelsberg, P., & Marshall, R. (1990). Unit method of clothing construction (7th ed). Iowa: Iowa State University.
Brown, P. (1991). Ready-to-wear apparel analysis. New York: Macmillan.
Browne, J., Dubois, D., Rathmill, K., Sethi, S. P., & Stecke, K.E.(1984). Classification of flexible manufacturing systems. The FMS Magazine: Flexible Manufacturing Systems, April, 114-117.
Buzacott, J. A. (1982). The fundamental principals in manufacturing systems. Proceedings of the first International Congress on Flexible Manufacturing Systems (pp 13-22). Brighton, England.
Carrere, C. G. & Little, T. J. (1989). A case study and definition of modular manufacturing. International Journal of Clothing Science and Technolo&,y 1( 1 ), 30-38.
Chase, R. B. & Aquilano, N. J. (1992). Production and operations management. Irwin: Homewood, IL; Boston, MA.
Cline, W. (1987). The future of world trade in textiles and apparel. Washington, DC: Institute for International Economics.
122

Cooklin, G. (1991). Introduction to clothing manufacture. London: BSP Professional Books.
Cole, W. R. (1992). Modular's true colors. Bobbin, 1J.(1 l), 66-67.
Dickerson, K. G. (1991). Textile and api>arel in the international economy. New York NY: MacMillan Publishing Co.
Evans, Anderson, Sweeney, & Williams. (1984). Applied production and operations management. St. Paul, MI: West Publishing Co.
Frank, B. (1953). Progressive apparel production with case problems. New York: Fairchild Publications.
Georgia Institute of Technology. (1980). Marketing strategies for U.S. apparel producers to compete more effectively with imports (pub 81-105256) Washington, DC: U.S. Dept. of Commerce.
Gerwin, D. (1987). An agenda for research on the flexibility of manufacturing processes. International Journal of Operations and Production Management, 1(1), 38-49.
Glock, R. E. & Kunz, G. I. (1990). Apparel manufacturing: Sewing product analysis. New York: MacMillan Publishing Company.
Gupta, D & Buzacott, J. A. (1989). A framework for understanding flexibility of manufacturing systems. Journal of Manufacturing Systems, .8(2), 89-97.
Hannan W.M. (1963). The methods of sewing. New York: Kogos Publications.
Hill, E. (1992). Flexible manufacturing systems, Part 2. Bobbin, ~(7), 70-78.
Hill-Johnson B. (1978). Fashion your future. London: The Clothing Institute.
Hodge, G. L & Canada, J. R. (1989). Multiple attributes/criteria for evaluating manufacturing systems. Apparel Manufacturer, 1(1), 53-58.
Hollen, R. N., & Kundel, C. J. (1987). Patternmaking by the flat pattern method (6th ed.). New York: Macmillan Publication.
Hopeman, R. J. (1971). Production concepts. analysis. control (2nd ed). Ohio: Charles E. Meritt Publication.
123
Hunter, A (1990). Quick Response in apparel manufacturing. Manchester: The Textile Institute.
Hutchinson, G. K., & Sinha, D. (1998). A quantification of the value of flexibility. Journal of Manufacturing Systems, .8(1), 47-56.
INA Systems. (1989). INA knows: Unit production for the apparel industry. JSN International, ..82(1), 22-23.
Kimura, 0. & Terada, H. (1981). Design and analysis of pull systems: A method of multi stage production control. International Journal of Production Research, 19, 241-253.
Knapton, J. (1990). Exploding the traditions of an old fashioned industry. Apparel Manufacturer, 2(3), 58-65.
Ko, E. (1993). A study of the relationships between organizational characteristics and OR adoption in the apparel industiy. Unpiblished Master's thesis, VPI & SU, Blacksburg, VA.
Kopp, E., Rolfo, V., Zelin, B., & Gross, L. (1982). Designing apparel through ~flat pattern (revised 5th ed.). New York: Fairchild Publications.
Kron, P. (1987). Pondering modular. Apparel Industiy Magazine, ~(8), 70-80.
Leedy, P. D. (1993). Practical research: Planning and design (5th ed.). New york: Macmillan.
Lin, S. H. (1990). Apparel industiy sewing system study. Unpublished Master's thesis, Auburn University, Alabama.
Lin, S. H., Kincade, D. H., & Warfield, C. (in press). An analysis of sewing systems with a focus on Alabama apparel producers. Clothing and Textiles Research Journal.
Lowder, R. (1991). Balance: A delicate word in modular manufacturing. Bobbin, .JJ(3), 132-138.
Lokiec, M. (1990). Modernization of the apparel industry. Apparel Manufacturer, 2(3), 68-74.
124

Mandelbaum, M. (1978). Flexibility in decision making: An exploration and unification. Unpublished manuscript, University of Toronto, Department of Industrial Engineering, Toronto.
Mazziotti, B. W. (1993). Modular manufacturing's new breed. Bobbin, ,M(8), 36-42.
Piener, A., Kruger, P. S., & Adendorff, K. (1986). An evaluation model for quantifying system value. Institute of Industrial Engineers Transactions ..Qil Engineering Management, 18(1), 10-15.
Ramasesh, R.V. & Jaikumar, M.D. (1991). Measurement of manufacturing flexibility: A value based approach. Journal of Operations Management, .10(4), 446-467.
Ross J.R. (1991). Assessing modular and cellular manufacturing. International Industrial Engineering Conference Proceedings, Institute of Industrial Engineers, 231-240.
Schonberger R.J. (1982). Japanese manufacturing techniques: Nine hidden lessons in simplicity. New York: The Free Press.
Schorr, A. (1992). Analysis of garment production methods, Part 2 -comparison of cost and production between a traditional bundle system and modular manufacturing. Education Foundation for the Fashion lndustzy, p 98.
Sisselman, S. (1990). Modular manufacturing in outerwear. Apparel Manufacturer, 2(8), 24-32.
Smith, L S. (1987). The art of sewing basics and beyond. Colorado: Morton Publications.
Solinger, J. (1980). Apparel manufacturing handbook: Analysis. principles and practice. New York: Van Nostrand Reinhold Co.
Solinger, J. (1988). Apparel manufacturing handbook. Columbia, SC: Bobbin Media Corporation.
Stamper, A. A., Sharp, M. S., & Donnell, B. L. (1986). Evaluating apparel qµality. New York: Fairchild Publications.
125

Soni AH. (1990). Flexible assembly systems. Presented at 1990 American Society of Mechanical Engineers: 2nd Conference in Flexible Manufacturing Systems, Chicago, IL. DE 28.
Soni, R. G. & Welker, J. E. (1990). Simulation of a flexible manufacturing system. Proceedings of the 21st annual Pittsburgh conference: Modelling and Simulation, 21 pt 2, 605-607.
Technical Advisory Committee, American Apparel Manufacturers Association. (1982). Fashion in apparel manufacturing: Coping with style variation. Arlington: Author.
Troxler, J. W. & Leland, B. (1989). A comprehensive methodology for manufacturing system evaluation and comparison. Journal of Manufacturing Systems, .8. 175-183.
U.S. Office of Technological Assessment. (1987). The U.S. textile and apparel Industiy: A revolution in progress (OTA-TET-332). Washington, DC: U.S. Government Printing Office.
VA Business Directory (1991/92). The manufacturers index. Virginia: The Virginia Chamber of Commerce.
Wise, W. (1990). Flexibility: The key to competitiveness for United States swimwear and intimate apparel producers. Apparel Manufacturer, .2(2), 46-52.
Zamkoff, B., & Price, J. (1987). Basic pattern skills for fashion design. New York: Fairchild Publications.
Zelenovic, D. M. (1982). Flexibility - A condition for effective production systems. International Journal of Production Research, 2!!. 319-337
Ziemke, M. C. & Adams, M. (1990). Strategic management for the small apparel manufacturer and contractor. Apparel Manufacturer, .2( 4 ), 70-75.
126

APPENDICES
127
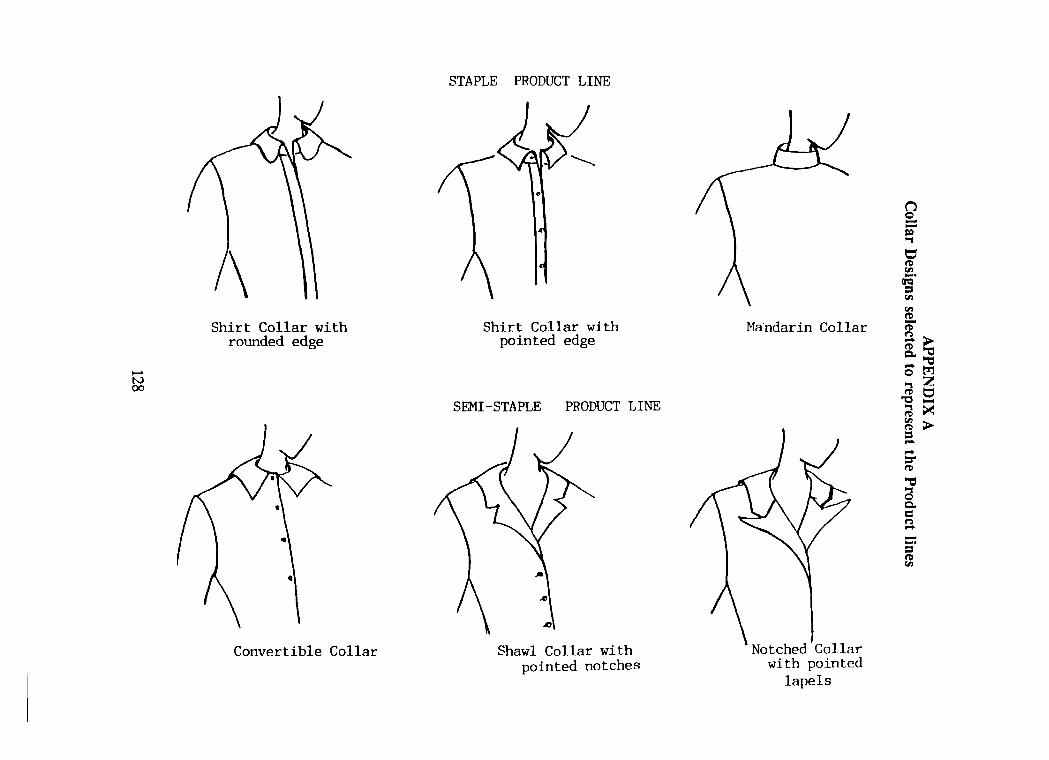
~
~
\ Shirt Collar with
rounded edge
•
Convertible Collar
STAPLE PRODUCT LINE
Shirt Collar with pointed edge
SEMI-STAPLE PRODUCT LINE
Shawl Collar with pointed notches
Mandarin Collar
Notched.Collar with pointed
lapels
Q --= .., t:I ft) fl)
~· fl)
fl)
~ [~ _.,, 0 tr:! ~ z
"Cl t:I ~ :;< ~ > ::s --; .,, a c. ~ ---· ::s ft) fl)

..... N \0
Simple Shawl collar
Scarf Collar
FASHION PRODUCT LINE
Sailor collar
HIGH-FASHION PRODUCT LINE
Wing Collar Rounded notch collar with a cape

Plant Manager Company Street Address City, State, zip code Date
SALUTATION:
APPENDIX B Cover letter for the questionnaire
The apparel industry has recently seen an upsurge in the need for technical information and analysis. As part of my thesis I am asking you to contribute to this information. You and your plant will benefit from the results by receiving an executive summary of this study.
The enclosed survey asks about the production systems you use and the type of products you manufacture. The questionnaire can be completed in less than 10 minutes. The answers to the questions will remain confidential. Only the investigator will have access to the data. So we are not asking for exact figures. You are free to omit any question on the survey.
The study is carefully designed so that individual firms cannot be identified. There are no identification numbers or individual ink. I will not be able to identify the survey because the envelops and the letter will be separated from the survey before reaching me.
I realize your time is important, but the success of this important study will depend on your response. Please return the completed survey by (date). If you wish to receive an executive summary of the study, please indicate this on the back of the envelope. The results will be mailed to you within the next few months. If you have any questions about this research, please contact Dr. Doris Kincade at (703) 231-7637. If you have questions about the conduct of this research please contact Dr. Ernest Stout, Research Division at (703) 231-6077. The study has been approved by the university IRB.
Thank you very much, Sincerely,
Durga Graduate Student, Dept of Clothing & Textiles VPI & SU
I have read the letter and understand the conditions of the survey.
signature
Please return this letter with the survey.
130

APPENDIX C Questionnaire for Apparel Manufacturers
SECTION I: PRODUCTS [Please check all that apply ( V ) ] 1. Do you produce women's wear?
If so what kind? ( )blouses ( )dresses
( )Yes ( )No
( )skirts ( )jackets
( )pants ( )coats
( )undergarments ( )others (specify)----
2. Do you produce men's wear? ( )Yes ( )No
If so what kind? ( )dress shirts ( )sports shirts ( )jackets
( )coats ( )trousers ( )underwear ( )others (specify) ___ _
3. Do you produce children's wear? ( )Yes ( )No
If so what kind? ( )boys ( )girls ( )infants ( )others (specify) ___ _
4. Given below is a list of collar designs. Circle the collar designs that are manufactured most Dllll'. by your primary production system.
(1) (2) (3) (4)
(5) (6) (7) (8)
(9) (10) (11) (12)
131

5. What product line(s) does your company manufacture? [Check all that apply. Please read the definitions before you check the answer(s)]
( ) staple - basic garment styles with long and continuous production runs (almost 1 style change/season) ( ) semi-staple - basic garment styles with some changes in styles (2-3 style changes/season) ( ) fashion - varied styles with frequent changes in the styles (4-6 style changes/season) ( ) high-fashion - highly varied styles with rapid changes (>6 style changes/season)
6. What is the primary product line that your company manufactures? ( )staple ( )semi-staple ( )fashion
7. Did your company at any time refuse to produce an order? ( )Yes ( )No
If yes, what are the reasons [check all that apply] ( ) did not have the capacity to produce a large order ( ) did not have the machines to produce the required styles ( ) operators were not appropriately skilled ( ) it was not cost effective to produce the required styles
because of the operations and system that we have ( ) other--------------
( )high-fashion
SECTION II: COMPANY DEMOGRAPHICS [please give as accurate an answer as possible]
1. How many operators (sewing machine and assistant operators) does your company employ? no. of oprs. ----
2. What is the total volume of production of your company? ____ _.pcs/week
3. What is the volume of production for each of the product line that you manufacture? Staple pcs/week Semi-Staple pcs/week Fashion pcs/week High-Fashion pcs/week
SECTION III: PRODUCTION SYSTEMS [please circle the most appropriate answer(s)]
1. What are the production system(s) used by your company? [Circle all that apply. Please read the definitions before you circle the answer(s)]
(1) bundle system-comprises of bundles of workunits and each operator performs one operation on all the units or, produces the entire product.
(2) progressive bundle system-comprises of workunits that are passed along singly from operator to operator. Each operator works only on one set of operations and does not make the entire product. . .
(3) modular system-comprises of teams of operators producing one garment at a tlDle. The operators rotate to different machines as they work through the garment.
(4) other---------
132
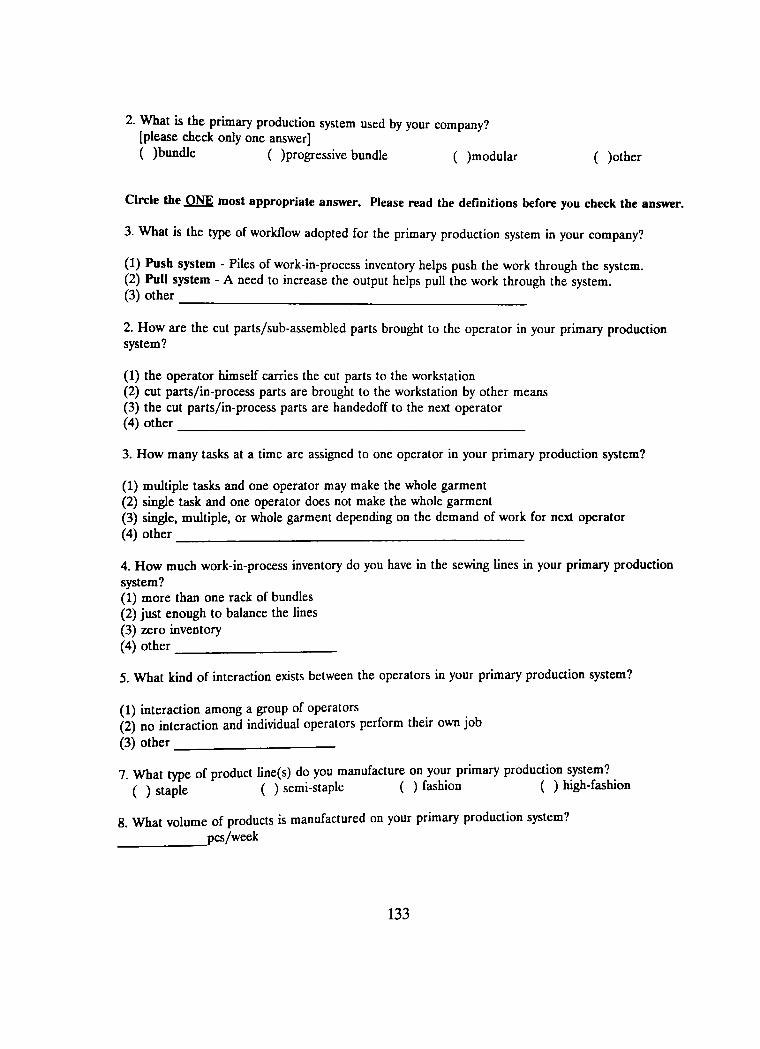
2. What is the primary production system used by your company? [please check only one answer] ( )bundle ( )progressive bundle ( )modular ( )other
Circle the ONE most appropriate answer. Please read the definitions before you check the answer.
3. What is the type of workflow adopted for the primary production system in your company?
(1) Push system - Piles of work-in-process inventory helps push the work through the system. (2) Pull system - A need to increase the output helps pull the work through the system. (3) other ----------------------2. How are the cut parts/sub-assembled parts brought to the operator in your primary production system?
(1) the operator himself carries the cut parts to the workstation (2) cut parts/in-process parts are brought to the workstation by other means (3) the cut parts/in-process parts are handedoff to the next operator (4) other--------------------
3. How many tasks at a time are assigned to one operator in your primary production system?
(1) multiple tasks and one operator may make the whole garment (2) single task and one operator does not make the whole garment (3) single, multiple, or whole garment depending on the demand of work for next operator (4) other--------------------
4. How much work-in-process inventory do you have in the sewing lines in your primary production system? (1) more than one rack of bundles (2) just enough to balance the lines (3) zero inventory (4) other---------
5. What kind of interaction exists between the operators in your primary production system?
(1) interaction among a group of operators . . (2) no interaction and individual operators perform their own JOb (3) other---------
7. What type of product line(s) do you manufacture on your primary production ~ystem?. ( ) staple ( ) semi-staple ( ) fashion ( ) high-fashion
8. What volume of products is manufactured on your primary production system? pcs/week ------
133

9. What were the criteria for selecting the primary production system that you are currently using? (check all that apply)
( ) suitable to the product line we manufacture ( ) flexible, in that the system can produce any style that we want to produce ( ) least expensive ( ) easy to maintain ( ) is traditionally used in the apparel industry ( ) other
THANK YOU!
134

Dear Mr./Ms.xxxx
APPENDIX D Follow-up Postcard
April 12 1994
Over a week ago you received a questionnaire from VPI & SU asking about your apparel production and operation. I will be using your responses to profile the apparel industry and to examine its future competitive position.
If you have already returned the completed questionnaire, please accept my sincere thanks. If not, I request you to take 10 minutes and complete it today. Your responses are of utmost importance for our research. For the results to be generalized to the American apparel industry, it is important that your farm be included. If you have not received it, please do call me as soon as you can and I will have one mailed to you immediately.
I'm extremely thankful for your co-operation and enthusiastically look forward to receiving your responses.
Sincerely,
Kanakadurga (703) 951-3998
135

SUPPLEMENT
136

Manuscript for publication in The International Journal of Manufacturing
Systems
Introduction
The U.S. apparel market is fast changing and offers a challenge that few
other consumer products offer to marketeers and manufacturers alike. The
American apparel market is characterized by increasing number of imports, an
individualistic consumer, and fast turns in fashion. Current trends in the apparel
market indicate greater variations in styles, frequent changes in styles, shorter lead
times and smaller lot sizes (Hodge & Canada, 1989; U.S. Office of Technological
Assessment, 1987). In a world of ever changing fashions, more and more apparel
manufacturers are adopting strategies suitable to capture the growing apparel
market while keeping in mind the customers' individualistic needs. With foreign
producers often using low cost labor and maintaining a competitive price for their
goods, the U.S. manufacturers will have to take a closer look at their
manufacturing strategies and management techniques to remain competitive(Soni,
1990).
Changes in the market caused by changing fashions and seasonality leads
to a wide variation in the styles of apparel items demanded. This situation affects
the styles of apparel products that are to be produced and influences the assembly
operations during manufacturing (Lin, Kincade, & Warfield, in press). With more
137

consumers tending towards one-of-a-kind clothing, manufacturing systems need to
be highly flexible to enable customized production with shorter production runs,
while still maintaining the economy of production (Sisselman, 1990). A system
that is highly flexible can respond more easily to demand than a system with little
flexibility (Hodge & Canada, 1989).
Back2round
Planning should be the basis for all future managerial activities. Planning
establishes the guidelines and actions that must be taken to meet the company's
objectives and goals (Evans, Anderson, Sweeney, & Williams, 1984). A company's
decision making process is influenced by a number of factors like economic
conditions, government regulation, competition, and technology (Troxler & Blank,
1989).
Production systems are one of the major components of production in an
organization and constitute a major portion of the company's investment (Evans,
Anderson, Sweeney, & Williams, 1984). Selecting the right production system
assumes great importance since investors would want a system worth the
investment. Production systems have to be evaluated to help companies make
informed choice of production systems. The purpose of this study was to develop
an instrument which could accurately measure the production system
manufactured by a company.
138
Production Systems
A production system is defined as a set of components whose function is to
convert a set of inputs into some desired output through a transformation process
(Chase & Aquilano, 1992). The components can be a man, machine, equipment,
or tool. A production system should, in general, allow a manufacturer to produce
goods efficiently while keeping in mind the customers' needs. Both the
manufacturer and the customer should benefit from the production process. The
manufacturer should have monetary gains, and the customer should be able to
obtain the product at a price worth the value the product holds.
Types of Production Systems
Various production systems are in use in the soft goods and hard goods
industry. Each of the systems are characterized by distinctive attributes. These
attributes can help identify the various systems.
Hapeman (1971) and Solinger (1988) have identified production systems
based on the dimension of time factor. Production systems can be intermittent
or continuous systems based on the time a workunit rests between successive
workstations. This factor is directly related to the level of WIP inventory in the
system.
Solinger (1988) has also identified production systems based on the scope
of workers duties and type of product flow. The scope of workers duties may be
determined by the number of tasks assigned to individual operator in a system.
139

Individual operators may be assigned single tasks or multiple tasks. The scope of
workers duties is directly related to the skill of the workers. Production systems
that assign single tasks to operators may not require multi-skilled workers as
opposed to the systems that assign multiple tasks.
Production systems can be distinguished based on the type of product flow
between workstations (Solinger, 1988). The products may flow either singly or in
groups. The type of product flow dictates the means of transportation of
workunits between workstations. Single productflow is associated with automated
transfer of workunits between workstations or the handoff approach.
Kimura and Terada (1981) identified production systems based on the type
of workflow. The type of workflow may be "pull through" or "push through"
depending on the source of the force that drives the work through the system.
The normal approach in industrial production is the push system in which piles of
work-in-process (WIP) inventory help push the work through the system. In a pull
system, the need to increase the production helps pull the work through the
system.
A recent approach in manufacturing is the team approach, where groups of
operators function as a self-directed team (Cole, 1992; Sisselman, 1990). The
production systems may be associated with interaction between operators or no
interaction. The presence or absence of interaction between operators may be
used as a determinant of a production system.
140

Based on the various attributes, production systems have classified into
several broad categories (Solinger, 1988).
Bundle Systems. The bundle system is a traditional dedicated system that
is normally comprised of bundles of workunits. Individual operators perform
some or all of the operations on the bundle (Hannan, 1963). Traditionally,
individual operators perform only certain operations on all the bundles of
workunits. The productflow is in groups, and the workunits are transported
manually by the operator himself (Lin, 1990). A bank of inventory is positioned
at each machine and work flows intermittently from the storage to the operator
and back to the storage after the bundles are worked on. This mode of
transportation results in racks of WIP inventory (Mazziotti, 1993). The WIP
inventory helps push the work through the system. The bundle system is
essentially a push system. No interaction exists between the operators in a bundle
system, because each operator is responsible for his own job.
Pro2ressive Bundle System (PBS). The PBS is also referred to as an
assembly line (Chase & Aquliano, 1992). In a progressive bundle system, the
operations are laid out in a sequence. A group of operators work as a single unit,
producing one style at a time. Progressive bundle system involves two or three
work stations being worked upon for the same operation at the same time but two
or more different operations/jobs of a garment are never done simultaneously in
a planned synchronized manner (Solinger, 1988). Individual operators are
141

assigned single tasks as opposed to multiple tasks in a bundle system (Mazziotti,
1993; Sisselman, 1990). The bundles of workunits are passed along singly from
operator to operator. The PBS is associated with single productflow, and the
workunits are transferred by means of conveyors or other automated transfer
devices (Chase & Aquilano, 1992; Ross, 1991). These conveyors become storage
devices which can result in moderate to high levels of WIP inventory (Ross, 1991).
The level of WIP inventory is controlled in a PBS by balancing the lines. The
WIP inventory in a PBS is controlled to a certain extent, as opposed to the level
of WIP inventory in a bundle system. The inventory drives the work through the
system; therefore, PBS is a push system. Though a group of operators work on a
single style at a time, no interaction exists between the operators.
Modular System. This system is also ref erred to as Cellular system (Ross,
1991). Modular system consists of teams of operators functioning as a single unit
assembling a whole garment (Sisselman, 1990). The operators rotate to different
machines as they work through the garment (Brown, 1992; Ross, 1991). The
operators in a modular system can perform single or multiple tasks. The
workunits are handed off to the next operator depending on the demand for work
by the operator (Mazziotti, 1993). The handoff approach is associated with single
productflow. The team of operators make the entire product one at a time rather
than moving large masses of inventory (Ross, 1991). The workunits flow
142

continuously through the system. This helps minimize the WIP inventory to a
great extent (Cole, 1992).
Kron (1987) and Frank (1988) define modular manufacturing as consisting
of modules or cells where each module or cell is a contained manageable work
unit of people performing a measurable task. The people are self-directed and
work in a team. The need to increase production helps drive the work through a
modular system. Modular system is essentially a pull system (Carrere & Little,
1989). The operators are interchangeable among tasks within the group (Kron,
1987; Frank, 1988). Since the group of operators in a modular system work as a
team a great deal of interaction is noticed among the operators. Modular systems
encourage team work, improve quality, and increase production (Ross, 1991;
Sisselman, 1990).
Related Research
Carrere and Little (1989) examined eleven modular manufacturing
situations. The degree of flexibility desired within a modular unit and the product
characteristics dictated the level of WIP that could be accommodated. Modular
manufacturing revealed benefits such as improved quality, reduction of waste,
increased manufacturing flexibility, reduced turn over and absenteeism and
organizational and cultural growth. Modular manufacturing also indicated a
reduction of bundle or batch size, balancing of operations, pull through
production, and production of exact quantities of the product.
143

Sisselman (1990) conducted a case study of an apparel firm that
reorganized its production system from the traditional progressive bundle system
to the more modern modular system. During its progressive bundle stage, all the
people in the plant worked in a single group and on one style at a time. The
operators were thus assigned specific operations to which he/she was limited.
Under the changed system, a group of six chains formed the production system,
and each chain functioned as a single complete unit assembling a whole garment.
Operators in the chain only assembled components to the body while the other
operators worked on the less skilled operations. Although the turn cycle, from
cutting to shipping and the direct and indirect costs were reduced modular
manufacturing was not found to be as productive as when the work was repetitive.
Objectives
This research was designed with the following objectives:
I.To develop an instrument that can be used to quantify the apparel
production system variable.
2. To classify production systems into three categories.
Research Design
The survey method with mailed questionnaires was used to achieve the
objectives for this research. The results of survey can be generalized to the larger
population if the sample represents the population and also allows a researcher to
determine the interrelations among variables (Kerlinger, 1973).
144

l_rJ st rumen t
The instrument used to obtain the data for this research was the mailed
questionnaire. The questionnaire consisted of questions related to production
system(s) attributes of the company. Questions regarding the flow of work
(i.e., push or pull system), tasks per worker (i.e., one to multiple tasks), work-in-
process inventory (i.e., zero to piles of inventory), mode of transportation of
workunits (i.e., manual, brought to the employee hy other means or handed off),
and interaction between employees (i.e., no interaction to teamwork) were asked.
Responses to these questions were talrnlatcd to determine the primary production
system used by the company (see Table I).
Table I Attributes of the three production systems
Product ion syslt'm/ Bundle System Progressive Bundle Modular System Altrihull's Sysll'111
Workllow push pu.~h pull
f\lrtlwd of retrieval self-help operator lirnught lo operator handoff hl'lwct•n workstations
\Vork-in-l'n1ccss high lc\'cls( racks of moderate kvels(jusl zero/minimal linl·ntorJ bundles enough to habnce !he
lines)
NumhtT of tasks Jll'I" ~inglc t<isk, \vholc sirl!'le la~k c• singlc,multiplc task operator- garment or whole garment
I 11 ll' nu:t ion bc!Wl'Cll II<> teamwork IHI team work tc am work work en;
145

Sample selection
Manufacturers listed in SIC 2321, men's and boys' shirts, and SIC 2331,
women's, misses, and juniors blouses and shirts categories, were the population for
this study. A stratified, proportionate, random sample of 200 manufacturers was
selected out of a population of 1523 manufacturers in the two categories (Dun
and Bradstreet, personal communication, December, 1993). Sixty eight
manufacturers were selected from SIC 2321, and 132 manufacturers were selected
form SIC 2331. The proportions were based on the population of manufacturers
in each category. The list is considered to be current as the records are updated
daily. Out of the list of 200 manufacturers, 23 had to be eliminated at the first
stage, since manufacturing was not done at the facility listed. The sample for
mailing contained 177 companies.
Data Collection
Questionnaires were mailed to the owners/CEOs of the selected 177
apparel manufacturing firms. Self-addressed, stamped envelopes were included
for returning the questionnaires. The initial mailing packet also included a cover
letter mentioning the purpose of the research. The company owners/CEOs were
asked to direct the questionnaires to the production managers. Postcards and
telephone calls were sent to increase the response rate. Phone calls were made at
random to non-participants to evaluate the reliability of the sample.
146

Data analysis
The three production systems selected for this study included bundle
system, PBS, and modular system. Great inconsistency exists in the terminologies
used in the apparel industry and literature (Gerwin, 1987; Gupta & Buzacott,
1989; Ramasesh & Jaikumar, 1991). To overcome the inconsistency, attributes
that characterize the three production systems were selected from literature. The
attributes identified were type of workflow, mode of transportation of workunits
between workstations, the number of tasks per operator, level of WIP inventory,
and interaction between workers (Hopeman, 1971; Kimura & Terada, 1981;
Solinger, 1988). Definitions were provided for each of the attributes for clarity in
terminology.
Weights were assigned to the attributes that define the production systems.
More weight was assigned to the attributes that are more important in defining
the systems. Lower weight was assigned to attributes that less important in
defining the systems. The production system used by the company was
determined by aggregating the weights assigned to each of the attributes and was
designated as the determined production system. A direct question, as to the
system being used, indicated the type of production system that the manufacturers
thought they were using and was designated as the selected production system.
Chi square tests were used to test the relationship between the selected
and determined system5 and between the selected system and each attribute.
147

Results and Discussion
A majority of the companies in the sample ranged from very small to
medium with less than 100 employees and volume of production of less than
30,000 units per week. The sample consisted of 79.2% women's wear producers,
47.2% men's wear producers, and 35.8% children's wear producers. This finding
is consistent with the general profile of all U.S. apparel manufacturers (Dickerson,
1991).
This study examined one of the important variables in the apparel
production environment: production systems and the attributes of production
systems.
Production Systems
A simple chi square test indicated a significant relation between the
determined production system and the selected production system (x2 [df =4]
= 19.541, p = .001). This confirms the reliability of the method used to determine
the system. The results obtained for selected production system is consistent with
the findings of Lin (1990).
To further check the reliability of the definition of determined production
system, the relationship between individual attributes and both the determined
and selected production system was evaluated. The significance of the attributes
in determining the production system in use was tested using a simple chi square
test. The level of significance was set at a probability of 0.05.
148

WIP Inventory. The bundle and PB system have been classified as
intermittent systems (Solinger, 1988). Modular systems have been classified as
continuous systems. Intermittent systems consists of WIP inventory that remains
stationary between successive workstations (Solinger, 1988) while continuous
systems have zero/minimal WIP inventory. Modular systems have been defined
as consisting of zero/minimal WIP inventory (Ross, 1991 ). Significant associations
were found between apparel production systems and the level of WIP inventory
for each of the systems in this sample (determined production system, x.2 [df =4]
=22.674, p=.000; selected production system, x.2 [df=4] =48.327, p=.000)., More
than 50% of the cells had less than the minimum values; therefore, the test was
repeated for bundle and PBS only. Fisher's exact test indicated a significant
relation between the two variables (p = .001 ). This result indicates the reliability
of the three levels of WIP inventory that was used for the three systems.
The frequencies and percentages of the WIP inventory levels of the three
production systems is shown in Table 2.
149

Table 2 \VIP of the Determined Production Systems.
Level of \VIP Dl'll'nnincd l'rnduction Sysll'm Total
PBS Bundle Modular
High 11 9 14 2 25 o/o 18.37 28.57 4.08 51.02
Row% 36.00 56.00 8.00 Col% 100.00 46.<17 20.00
J\lockrnte () I (1 5 21 () .00 32.<i.5 10.20 42.8<1 0.00 7(1. l 'I 23.81 0.00 53.3.1 50.00
Low () () 3 3 (J.()() ().()() (1.12 (i.12 0.00 (J.0() 100.00 0.00 { ).()() 30.00
Total 11 9 30 10 49 ct ,c 18 . .\7 (1 l.22 20.41 100.00
All bundle system users reported high levels of WIP inventory ( 100%).
This finding is consistent with the theoretical concept of WIP inventory levels for
the three systems. Most of the PBS and modular system users reported having
moderate levels of \VIP inventory (PBS 53.33%; modular system 50%). High
levels of WIP inventory was noticed most in J>BS (56r/;:J) compared lo bundle
system and modular system. Only modular system had a zero inventory level
( J()()fj-~J). This finding suggests that zero inventory level is probably possible only
in modular system and that bundle system almost always involves high levels of
WIP inventory.
150

Workflow. The type of workflow in any production system is either push or
pull depending on what drives the work through the system (Kimura & Terada,
1981). A significant relationship was found between the production system and
the type of workflow in the case of both determined and selected production
systems (determined production system, x.2 [df=2] = 10.640, p=.005; selected
production system, x.2 [df=2] = 16.538, p=.000). This finding suggests the
reliability of the two types of workflow as a contributing factor in determining the
type of system. Table 3 indicates the frequency and percentage of determined
production systems with the associated workflow.
Table 3 Work Flow in the three Determined Production Systems.
Level of Work Flow Determined Production System
PBS Ihm die Modular Total
Push through n 6 29 5 40 % 12.50 60.42 10.42 83.33
Row% 15.00 72.50 12.50 Col% 66.67 96.67 55.56
Pull 3 1 4 8 through 6.25 2.08 8.33 16.67
37.50 12.50 50.00 33.33 3.33 44.44
Total II 9 30 9 48 % 18.75 62.50 18.75 100.00
Most of the manufacturers reported a push workflow (83.33%) and very
few manufacturers reported a pull workflow on their systems. This finding could
be attributed to the fact that very few manufacturers used modular system which
151
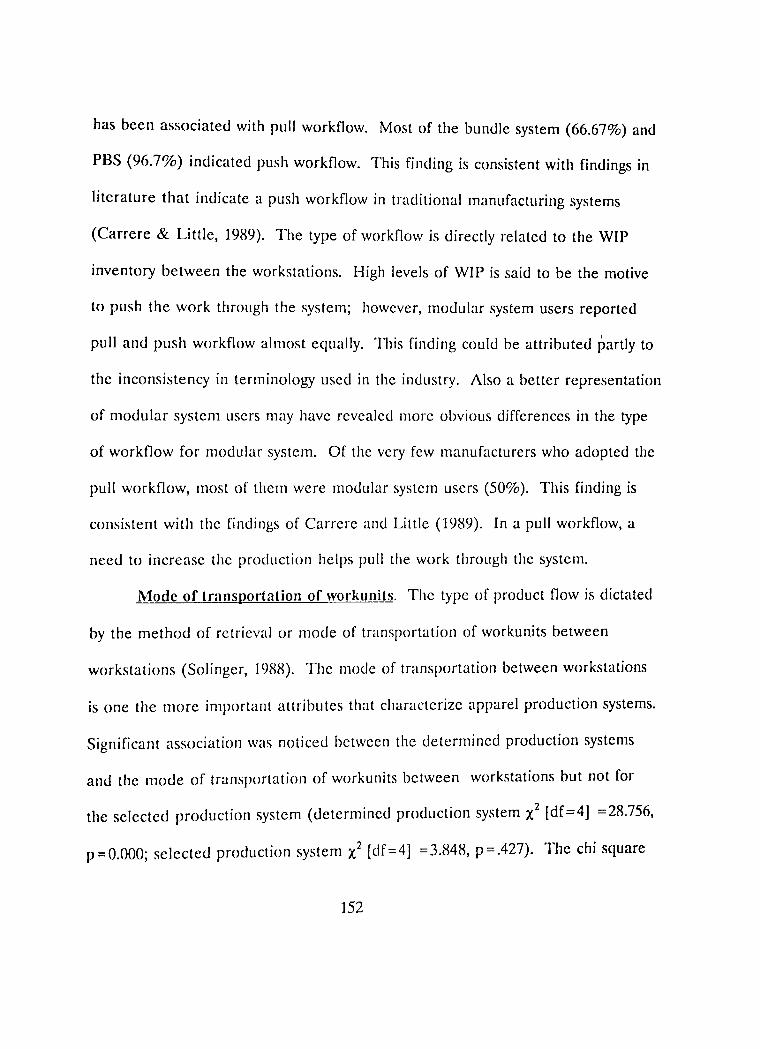
has been associated with pull workflow. Most of the bundle system (66.67%) and
PBS (96.7%) indicated push workflow. This finding is consistent with findings in
literature that indicate a push workflow in traditional manufacturing systems
(Carrere & Little, 1989). The type of workflow is directly related to the WIP
inventory between the workstations. High levels of WIP is said to be the motive
to push the work through the system; however, modular system users reported
pull and push worktlow almost equally. This finding could be attributed partly to
the inconsistency in terminology used in the industry. Also a better representation
of modular system users may have revealed more obvious differences in the type
of workflow for modular system. Of the very few manufacturers who adopted the
pull workflow, most of them were modular system users (50%). This finding is
consistent with the findings of Carrere and Little (1989). In a pull workflow, a
need to increase the production helps pull the work through the system.
Mode of transportation of workunits. The type of product flow is dictated
by the method of retrieval or mode of transportation of workunits between
workstations (Solinger, 1988). The mode of transportation between workstations
is one the more important attributes that characterize apparel production systems.
Significant association was noticed between the determined production systems
and the mode of transportation of workunits between workstations but not for
the selected production system (determined production system x2 [df=4] =28.756,
p=0.000; selected production system x2 [df=4] =3.848, p=.427). The chi square
152
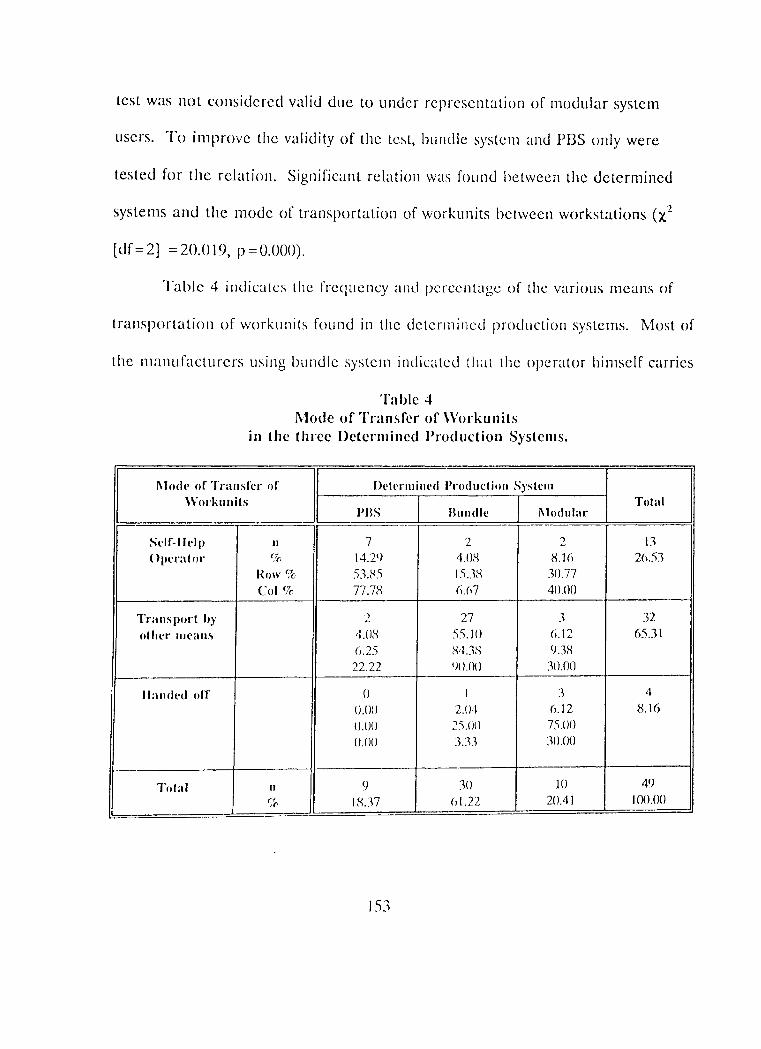
test was not considered valid due to under representation of modular system
users. To improve the validity of the test, bundle system and PBS only were
tested for the relation. Significant relation was found between the determined
systems and the mode of transportation of workunits between workstations (x; 2
[ df = 2] = 20.019, p = 0.000).
Table 4 indicates the frequency and percentage of the various means of
transportation of workunits found in the determined production systems. Most of
the manufacturers using bundle system indicated tli;it the operator himself carries
Table 4 .Mode of Transfer of Workunits
in the three Determined Production Systems.
I\ Ioele or Transfer or Dl'ter111i1a·d Production Sysll'm \Vorkunits Total
l'BS Bundle J\1odular
Sdf-lldp 11 7 2 2 11 Opl'rator <;7<; 14.29 4.08 8.16 26.53
Row% 53.85 15 .. 18 30.77 Col% 77.78 (j.(,7 40.00
Transpol't hy 2 27 3 32 of her means 4.08 55.10 6.12 65.11
(,.25 8438 9.38 22.22 I)() .00 30.00
I la111kd off () I 3 4 () .()() 2.04 6.12 8.16 ( J. ()() 25.0I) 75.00 ( J. ()() :LB 30.00
Tola I II I) 30 10 4<) p ;(' 18.37 (, 1.22 20.41 100.00
153
the workunits to the workstation (77.78%). This finding is consistent with the
theoretical definitions put forward by Hannan (1963). Most of the PB system
users indicated transportation of workunits by other means of transportation (e.g.,
conveyors or material handlers). This finding confirms the theoretical definitions
of PBS in literature (Ross, 1991; Chase & Aquilano, 1992). Transportation by
other means increases the time spent on actual sewing operation and helps
improve productivity (Hodge & Canada, 1989).
Within in modular system, the three modes of transportation of workunits
were noticed almost equally. Across the systems, handoff approach for retrieval
of workunits was most commonly found in modular system (75%). This finding
indicates that this mode of transportation is a characteristic feature of modular
systems and not bundle or PB systems. In the modular system, the workflow is
continuous and the workunits do not remain stationary at any moment during
processing (Solinger, 1988). The workunits arc handed off to the next operator
when the operator is ready to work on the oncoming workunit. Transportation by
other methods such as conveyors was noticed most in PBS (84.38% ). This finding
is consistent with the definition of the PBS in the literature (Sisselman, 1990).
Lack of significant association between the selected production
system and the mode of transportation between workunits may be attributed to
the finding that most of the selected bundle system users (71.43%) reported
transportation of workonits by other than manual means. This finding is contrary
154

to the findings of the mode of transportation for determined production systems
This finding could be attributed to the increased awareness among apparel
manufacturers about the unproductivity of the time spent on non-value added
repetitive tasks. Manual transportation is probably being replaced by automated
devices to overcome this problem (Hodge & Canada, 1989; JSN International,
1989; Cole, 1987).
The number of tasks per operator. The number of tasks assigned to each
operator have been identified as being different in each of the three production
systems. Significant association was found between apparel production systems
and the number of tasks assigned to each operator (determined production
system, x2 [df=4] =47.928, p=.000; selected production system, x2 [df=4]
= 23.508, p = .000). Majority of the manufacturers (78%) reported assigning single
tasks to an individual operator, and the operator docs not make the entire
garment. This finding is consistent with the classification of PBS as a section
production system rather than a whole garment production system by Solinger
(1988). This finding could be attributed to the over representation of PBS in
which operators work on single tasks and do not make the entire garment.
Table 5 indicates the frequency and percentage of the production systems
with the associated number of tasks per operator. Most of the bundle system
users (77.78%) reported assigning single tasks to operators, and the operator does
not make the entire garment unlike the definition of bs by Hannan (1963). In a
155

traditional bundle system operators perform multiple tasks and sometimes may
make the entire garment. All the PBS users ( 100%) reported assigning single
tasks, and the operator does not make the entire garment. This finding suggests
that manufacturers are increasingly adopting the latter approach to overcome the
problem of locating multiskilled operators. Assigning single tasks to individual
operators reduces the need for multi-skilled operators (Maziotti, 1993)). ,This
finding is consistent with the theoretical definition of PBS (Solinger, 1988;
Sisselman, 1990). The operations are laid out in a sequence and work flows from
one operator to the next in a progression.
I
Table 5 Number of Tasks per Operator in the three Determined Production
Systems.
Tasks
I Determined Production System
PHS Hund le Modular
Multiple n 2 0 0 % 4.00 0.00 0.00
Row% 100.00 0.00 0.00 Col% 22.22 0.00 0.00
Single 7 30 2 14.CXJ 60.CK) 4.00 17.95 76.92 5.13 77.78 100.00 18.18
Single or 0 0 9 Multiple 0.00 0.00 18.00
0.()() 0.00 100.00 0.00 0.00 81.82
Total n 9 30 11 % 18 60.00 22.00
156
Total
2 4.00
39 78.00
9 18.00
50 100.00

In a modular system most of the manufacturers (81.82%) reported
assigning single or multiple tasks depending on the work demanded by the next
operator. This finding is a direct consequence of the handoff approach as
reported earlier. The results are consistent with the theoretical concept of
handoff approach in modular manufacturing (Ross, 1991).
Interaction between operators. One of the characteristic features of
modular system is the team approach to manufacturing (Carrere & Little, 1989;
Cole, 1992). A great degree of interaction exists between operators in a modular
system. Simple chi square tests were performed to determine the relationship
between production system and interaction between operators in the sample.
Significant association was found between production system and interaction
between workers (determined production system, z2 [df=4] =13.992, p=.007;
selected production system, x2 [df=4] = 12.731, p = .013). The chi square tests
were not considered valid due to under representation of modular systems, but
the frequencies and percentages in Table 6 indicate that for determined
production systems, most of the modular system users (81.82%) reported
interaction among operators. Correspondingly most of the bundle system
(55.56%) and PDS users (70%) indicated no interaction among the operators. An
interesting finding was the relatively high degree of interaction among operators
in a PDS. This finding is not consistent with the theoretical definition of PDS.
This finding suggests that manufacturers are incorporating team work in PBS.
157
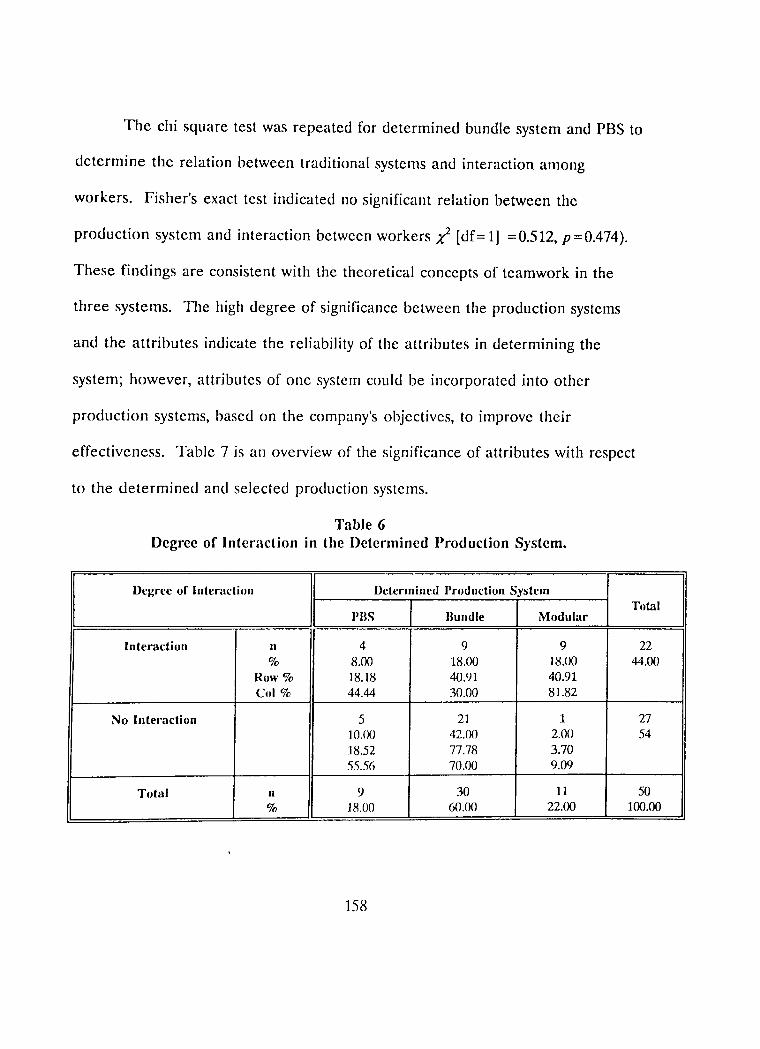
The chi square test was repeated for determined bundle system and PBS to
determine the relation between traditional systems and interaction among
workers. Fisher's exact test indicated no significant relation between the
production system and interaction between workers r [df= 1] =0.512, p=0.474).
These findings are consistent with the theoretical concepts of teamwork in the
three systems. The high degree of significance between the production systems
and the attributes indicate the reliability of the attributes in determining the
system; however, attributes of one system could be incorporated into other
production systems, based on the company's objectives, to improve their
effectiveness. Table 7 is an overview of the significance of attributes with respect
to the determined and selected production systems.
Table 6 Degree of Interaction in the Determined Production System.
Degree or Interaction Determined Production System Total
PHS Hundle Modular
Interaction n 4 9 9 22 % 8.00 18.00 18.00 44.00
Row% 18.18 40.91 40.91 Col% 44.44 30.00 81.82
No Interaction 5 21 1 27 10.00 42.00 2.00 54 18.52 77.78 3.70 55.56 70.00 9.09
Total n 9 30 11 50 % 18.00 60.00 22.00 100.00
158
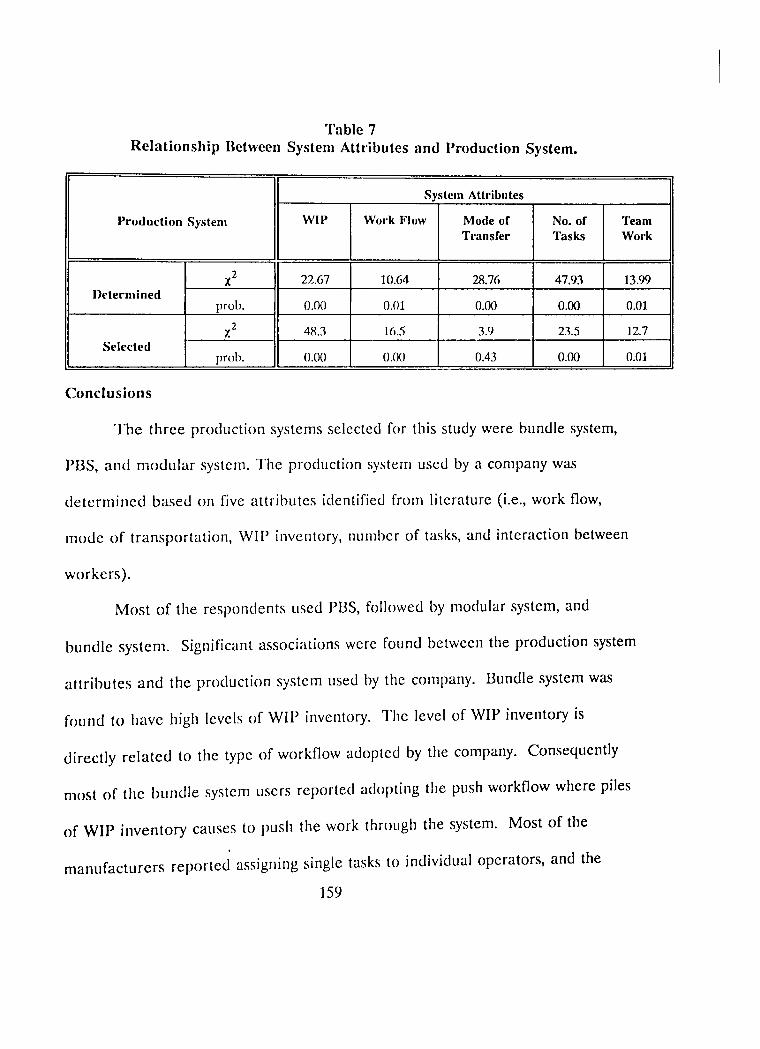
Table 7 Relationship Uctwccn System Attributes and Production System.
System Attributes
Production System WIP Work Flow Mode of No. of Transfer Tasks
x2 22.67 10.64 28.76 47.93 Determined
prob. 0.00 O.ol 0.00 0.00.
x2 48.3 16.5 3.9 23.5 Selected
prob. 0.00 0.00 0.43 0.00
Conclusions
The three production systems selected for this study were bundle system,
PBS, and modular system. The production system used by a company was
determined based on five attributes identified from literature (i.e., work flow,
Team Work
13.99
0.01
12.7
0.01
mode of transportation, WIP inventory, number of tasks, and interaction between
workers).
Most of the respondents used PBS, followed by modular system, and
bundle system. Significant associations were found between the production system
attributes and the production system used by the company. Bundle system was
found to have high levels of WIP inventory. The level of WIP inventory is
directly related to the type of workflow adopted by the company. Consequently
most of the bundle system users reported adopting the push workflow where piles
of WIP inventory causes to push the work through the system. Most of the
manufacturers reported assigning single tasks to individual operators, and the
159

operator does not make the entire garment, although in traditional bundle system
operators are sometimes assigned multiple tasks where they make the entire
garment. The workunits in a bundle system were reported to be transported
manually between workstations. Although some of the results indicated
transportation of workunits by other means which implies that manufacturers are
beginning to increase automation for more repetitive tasks like material h(l.ndling.
No interaction was noticed among bundle system users indicating the absence of
the more recent concept of team approach to manufacturing. This confirms the
classification of bundle system as a traditional manufacturing system by
Knap ton ( 1990).
Most of the PBS users reported moderate WIP inventory levels that was
just enough to balance the lines. Consequently push workflow was most reported
by PBS users. Most of the PBS users reported assigning single tasks to an
individual operator, and the operator does not make the entire garment. The
need for multi-skilled operators is, therefore, minimized. The workunits in PBS
were found to be transported more by automatic transfer devices rather than
manually. As reported earlier, this mode of transportation helps
improve productivity. PBS users also reported no interaction among operators,
which confirms the classification of PBS as a traditional system along side bundle
system (Knapton, 1990).
160

Modular system constituted system attributes that more unique in nature
compared to the bundle system and PBS. Modular system users were found to
have zero WIP inventory. Consequently, pull type of workflow was most reported
by the manufacturers. In a pull workflow the need to increase production helps
pull the work through the system rather than high levels of WIP inventory that
helps push the work through the system. Individual operators in a modular
system are assigned multiple tasks depending on the demand for work by the next
operator. This feature of modular system confirms the system's classification as a
continuous rather than an intermittent system where the workunits rest between
successive workstations before being worked upon. The modern team approach
to manufacturing was noticed only among modular system users. This confirms
Knapton's ( 1990) classification of modular system as being different from the
more traditional bundle and PB systems.
Implications
The results of this study could be used for subsequent research on flexibility
of apparel manufacturing systems. The five system attributes that were identified
may be used reliably for determining the production systems used by a company.
This procedure would help evaluate systems for subsequent research related to
production systems. Quantifying this variable will help perform more valid
statistics in research related to production systems.
161

Suggestions
The suggestions for this research include:
1. This research can be repeated with a larger sample and more modular
systems users to confirm some the hypotheses that could not be confirmed in this
study.
2. A similar study could be carried using computer simulation where the
flexibility of production systems could be determined along with the factors that
influence or affect the system performance.
3. The results of this study could be used to determine the flexibility of
apparel manufacturing systems. Similarly other types of flexibility could also be
determined by their underlying parameters and the aggregate flexibility of an
apparel manufacturing system calculated.
5. The flexibilities of different manufacturing systems can be determined
and compared to identify the most flexible manufacturing system. The measures
of flexibility can be used by decision makers in support of choosing a
manufacturing system, and products to produce.
8. The measures of flexibility can be used by decision makers in support of
choosing a manufacturing system, and products to produce.
162

References
Browne, J., Dubois, D., Rathmill, K., Sethi, S. P., & Stecke, K.E.(1984). Classification of flexible manufacturing systems. The FMS Magazine: Flexible Manufacturing Systems, April, 114-117.
Carrere, C. G. & Little, T. J. (1989). A case study and definition of Modular Manufacturing. International Journal of Clothing Science and Technology 1( 1 ), 30-38.
Chase, R. B. & Aquilano, N. J. (1992). Production and operations management. Irwin: Homewood, IL; Boston, MA.
Cole, W.R. (1992). Modular's true colors. Bobbin, 33(11), 66-67.
Dickerson, K. G. (1991). Textile and apparel in the international economy. New York NY: Macmillan Publishing Co.
Evans, Anderson, Sweeney, & Williams. (1984). Applied production and operations management. St. Paul, MI: West Publishing Co.
Frank, B. (1953). Progressive apparel production with case problems. New York: Fairchild Publications.
Hannan W.M. (1963). The methods of sewing. New York: Kogos Publications.
Hodge, G. L. & Canada, J. R. (1989). Multiple attributes/criteria for evaluating manufacturing systems. Apparel Manufacturer, 1(1), 53-58.
Hopeman, R. J. (1971). Production concepts. analysis. control (2nd ed). Ohio: Charles E. Meritt Publication.
INA Systems. (1989). INA knows: Unit production for the apparel industry. JSN International, 89(1), 22-23.
Knapton, J. (1990). Exploding the traditions of an old fashioned industry. Apparel Manufacturer, 1(3), 58-65.
163
Kimura, 0. & Terada, H. (1981). Design and analysis of pull systems: A method of multi stage production control. International Journal of Production Research, 12, 241-253.
Kron, P. (1987). Pondering modular. Apparel Industry Magazine, ~(8), 70-80.
Lin, S. H. (1990). Apparel industry sewing system study. Unpublished Master's thesis, Auburn University, Alabama.
Lin, S. H., Kincade, D. H., & Warfield, C. (in press). An analysis of sewing systems with a focus on Alabama apparel producers. Clothing and Textiles Research Journal.
Mazziotti, B. W. (1993). Modular manufacturing's new breed. Bobbin, ..3.4(8), 36-42.
Ross J.R. (1991). Assessing modular and cellular manufacturing. International Industrial Engineering Conference Proceedings, Institute of Industrial Engineers, 231-240.
Sisselman, S. (1990). Modular manufacturing in outerwear. Apparel Manufacturer, 2(8), 24-32.
Solinger, J. (1980). Apparel manufacturing handbook: Analysis. principles and Practice. New York: Van Nostrand Reinhold Co.
Solinger, J. (1988). Apparel manufacturing handbook. Columbia, SC: Bobbin Media Corporation.
Soni A.H. (1990). Flexible assembly systems. Presented at 1990 American Society of Mechanical Engineers: 2nd Conference in Flexible Manufacturing Systems, Chicago, IL. DE 28.
Troxler, W. & Leland, B. ( 1989). A comprehensive methodology for manufacturing system evaluation and comparison. Journal of Manufacturing Systems, _8, 175-183.
U.S. Office of Technological Assessment. (1987). The U.S. textile and apparel Industry: A revolution in progress (OTA-TET-332). Washington, D.C: U.S. Government Printing Office.
164

The vita has been removed from the scanned document