A Comparative Eye Tracking Study of Usability—Towards ...
31
Sustainability 2021, 13, 10415. https://doi.org/10.3390/su131810415 www.mdpi.com/journal/sustainability Article A Comparative Eye Tracking Study of Usability—Towards Sustainable Web Design Mihai Țichindelean 1 , Monica Teodora Țichindelean 1, *, Iuliana Cetină 2 and Gheorghe Orzan 2 1 Department of Management, Marketing and Business Administration, Faculty of Economic Sciences, Lucian Blaga University of Sibiu, 550324 Sibiu, Romania; [email protected] 2 Faculty of Marketing, Bucharest University of Economic Studies, 010981 Bucharest, Romania; [email protected] (I.C.); [email protected] (G.O.) * Correspondence: [email protected]; Tel.: +40-749-214-171 Abstract: Websites are one of the most frequently used communication environments, and creating sustainable web designs should be an objective for all companies. Ensuring high usability is prov- ing to be one of the main contributors to sustainable web design, reducing usage time, eliminating frustration and increasing satisfaction and retention. The present paper studies the usability of different website landing pages, seeking to identify the elements, structures and designs that in- crease usability. The study analyzed the behavior of 22 participants during their interaction with five different landing pages while they performed three tasks on the webpage and freely viewed each page for one minute. The stimuli were represented by five different banking websites, each of them presenting the task content in a different mode (text, image, symbol, graph, etc.).; the data obtained from the eye tracker (fixations location, order and duration, saccades, revisits of the same element, etc.), together with the data from the applied survey lead to interesting conclusions: the top, center and right sides of the webpage attract the most attention; the use of pictures depicting persons increase visibility; the scanpaths follow a vertical and horizontal direction; numerical data should be presented through graphs or tables. Even if a user's past experience influences their experience on a website, we show that the design of the webpage itself has a greater influence on webpage usability. Keywords: sustainable web design; web usability; neuromarketing; eye tracking; scanpaths; ANOVA technique 1. Introduction During a time when a great part of our activity takes place online, ensuring the quality of user-interface interaction becomes vital for keeping consumers satisfied. It has been shown that consumers often become loyal to certain brands, not only because of the intrinsic qualities of their product or service but also thanks to the unique and pleasant interaction and communication choices that the company makes. Secondly, when de- signing a website, its impact on the consumer should not be the only concern; but con- sideration should also be given to its impact on the environment. As high usability will ensure high consumer satisfaction and low environmental impact, the present study analyzes five different landing pages, seeking to identify the elements, formats, and structures of information that increase the usability of the landing page of a website. While the first part of the paper presents a detailed literature review about sustainable web design and neuromarketing, the second part aims at obtaining relevant results about the way information should be structured on a webpage by com- bining traditional research methods such as survey (questionnaire) with neuromarketing (eye tracking). This study involved 22 subjects who visualized five different webpages while performing three different identification tasks on each of them; additionally, each Citation: Țichindelean, M.; Țichindelean, M.T.; Cetină, I.; Orzan, G. A Comparative Eye Tracking Study of Usability—Towards Sustainable Web Design. Sustainability 2021, 13, 10415. https://doi.org/10.3390/ su131810415 Academic Editors: Juan Sánchez-Fernández, Luis-Alberto Casado-Aranda and Iris Vermeir Received: 27 June 2021 Accepted: 13 September 2021 Published: 18 September 2021 Publisher’s Note: MDPI stays neu- tral with regard to jurisdictional claims in published maps and insti- tutional affiliations. Copyright: © 2021 by the authors. Licensee MDPI, Basel, Switzerland. This article is an open access article distributed under the terms and conditions of the Creative Commons Attribution (CC BY) license (http://creativecommons.org/licenses /by/4.0/).
-
Upload
khangminh22 -
Category
Documents
-
view
1 -
download
0
Transcript of A Comparative Eye Tracking Study of Usability—Towards ...
Sustainability 2021, 13, 10415. https://doi.org/10.3390/su131810415 www.mdpi.com/journal/sustainability
Article
A Comparative Eye Tracking Study of Usability—Towards Sustainable Web Design Mihai Țichindelean 1, Monica Teodora Țichindelean 1,*, Iuliana Cetină 2 and Gheorghe Orzan 2
1 Department of Management, Marketing and Business Administration, Faculty of Economic Sciences, Lucian Blaga University of Sibiu, 550324 Sibiu, Romania; [email protected]
2 Faculty of Marketing, Bucharest University of Economic Studies, 010981 Bucharest, Romania; [email protected] (I.C.); [email protected] (G.O.)
* Correspondence: [email protected]; Tel.: +40-749-214-171
Abstract: Websites are one of the most frequently used communication environments, and creating sustainable web designs should be an objective for all companies. Ensuring high usability is prov-ing to be one of the main contributors to sustainable web design, reducing usage time, eliminating frustration and increasing satisfaction and retention. The present paper studies the usability of different website landing pages, seeking to identify the elements, structures and designs that in-crease usability. The study analyzed the behavior of 22 participants during their interaction with five different landing pages while they performed three tasks on the webpage and freely viewed each page for one minute. The stimuli were represented by five different banking websites, each of them presenting the task content in a different mode (text, image, symbol, graph, etc.).; the data obtained from the eye tracker (fixations location, order and duration, saccades, revisits of the same element, etc.), together with the data from the applied survey lead to interesting conclusions: the top, center and right sides of the webpage attract the most attention; the use of pictures depicting persons increase visibility; the scanpaths follow a vertical and horizontal direction; numerical data should be presented through graphs or tables. Even if a user's past experience influences their experience on a website, we show that the design of the webpage itself has a greater influence on webpage usability.
Keywords: sustainable web design; web usability; neuromarketing; eye tracking; scanpaths; ANOVA technique
1. Introduction During a time when a great part of our activity takes place online, ensuring the
quality of user-interface interaction becomes vital for keeping consumers satisfied. It has been shown that consumers often become loyal to certain brands, not only because of the intrinsic qualities of their product or service but also thanks to the unique and pleasant interaction and communication choices that the company makes. Secondly, when de-signing a website, its impact on the consumer should not be the only concern; but con-sideration should also be given to its impact on the environment.
As high usability will ensure high consumer satisfaction and low environmental impact, the present study analyzes five different landing pages, seeking to identify the elements, formats, and structures of information that increase the usability of the landing page of a website. While the first part of the paper presents a detailed literature review about sustainable web design and neuromarketing, the second part aims at obtaining relevant results about the way information should be structured on a webpage by com-bining traditional research methods such as survey (questionnaire) with neuromarketing (eye tracking). This study involved 22 subjects who visualized five different webpages while performing three different identification tasks on each of them; additionally, each
Citation: Țichindelean, M.;
Țichindelean, M.T.; Cetină, I.;
Orzan, G. A Comparative Eye
Tracking Study of
Usability—Towards Sustainable
Web Design. Sustainability 2021, 13,
10415. https://doi.org/10.3390/
su131810415
Academic Editors: Juan
Sánchez-Fernández, Luis-Alberto
Casado-Aranda and Iris Vermeir
Received: 27 June 2021
Accepted: 13 September 2021
Published: 18 September 2021
Publisher’s Note: MDPI stays neu-
tral with regard to jurisdictional
claims in published maps and insti-
tutional affiliations.
Copyright: © 2021 by the authors.
Licensee MDPI, Basel, Switzerland.
This article is an open access article
distributed under the terms and
conditions of the Creative Commons
Attribution (CC BY) license
(http://creativecommons.org/licenses
/by/4.0/).

Sustainability 2021, 13, 10415 2 of 31
website was freely viewed by the participants for one minute. During the four interac-tions of the participants with the websites, the eye tracking device mounted on the laptop recorded the visual gaze of the users, offering information such as fixation location, order and duration, saccades, revisits of the same element, etc. Moreover, each participant in the study completed a set of questions, offering more details about their general experi-ence with the online environment, as well as specific opinions about each studied website and the tasks performed there. This setup of the study allowed the researchers to analyze the subjects’ online behavior so that each of the following research objectives could be fulfilled: (1) Identify elements memorized by the users following the free-viewing of the websites and their correlation with the elements registered by the eye tracker as being viewed (heat map); (2) Determining the order in which subjects visualize different bits of information on the landing pages of a website while performing a task; (3) Establishing the relationship between the measured and perceived difficulty for fulfilling a task, in the case of different website structures and designs and (4) Determining the variance (ANOVA) of the measured difficulty of fulfilling a task for different structures and de-sign of the landing page. A set of valuable conclusions were obtained within the pre-sented research, on a general level; thereby, showing that the design of a website influ-ences, to a great extent, the usability of a website and the user experience.
2. Sustainable Web Design, User Experience and Consumers’ Perception When accessing the internet, we find ourselves in what seems like an endless pool of
information, facilitated by numerous websites trying to sell something, convince people about a concept or offer new perspectives over a primary aspect of our lives. We rarely (or maybe never) stop and ask ourselves, “What is the environmental impact of all this information”?
Starting from the 17th century, when sustainability was referred to in relation to deforestation [1], the notion of sustainability has been widely present and seems to vary in terms of definition, content and approach; still, the three main pillars of sustainability remain standing in all approaches and theorizations of the notion: social, economic and environmental pillars [2,3].
Furthermore, sustainable development was, as early as 1987, defined by the Brund-tland Commission of the United Nations to be a process that “meets the needs of the present without compromising the ability of future generations to meet their own needs” [4] (p. 15). Since a big part of our daily activity takes place online, it is vital to consider and talk about sustainable web design and how it can contribute to the environmen-tal—but also to the social—pillar of sustainability.
A very up-to-date example of the impact of the online environment and its func-tionality is the high usage of internet services during the COVID-19 pandemic when the internet traffic grew up to 20% within one week of the pandemic [5]. While most busi-nesses were closed for face-to-face activity, so was the worldwide education system; thus, all courses and seminars were moved online. While many higher education institutions lacked the resources for full-online teaching, this period highlighted more than ever the acute need for a stable e-education infrastructure. While a usable web design of the e-learning platform will ensure smooth usage, monitoring users’ behavior allows for an-ticipation and prevention of bottlenecks of the web environment, equipment and infra-structure [6]. Fedushko et al. show that by establishing correct and comprehensive ser-vice level agreements, e-learning platforms can predict online behavior and customer expectations. This further allows for better monitoring techniques and user behavior analysis, leading to higher customer satisfaction and lower resource usage [7]. Therefore, it can be seen how, in the case of e-learning, the interface and technical infrastructure of a website/platform can affect, in addition to the environment, a whole social group and its educational development.
Let us take another example and look at 14 December 2020, when all Google services turned off for about 2 h, globally. Because of internal storage issues, millions of users had

Sustainability 2021, 13, 10415 3 of 31
problems accessing productivity, utility, or information resources, such as Gmail, YouTube, Google Drive, Google Docs, Google Calendar and Google Play. This was a pe-riod when, due to the COVID-19 pandemic, a big part of daily activities switched online; thus, it is clear that an event like this cuts sustainability to a much lower level. Why? Leaving aside frustration, the time and energy consumption needed for data restoration appear as a cost for the environment. What is still reassuring, in this case, is that Google is one of the relatively few companies that embraced carbon neutrality (since 2017) using 100% renewable energy sources [8]. Unfortunately, not all online presences have the same sustainable drive as Google. In 2013, the internet carbon footprint was evaluated to be 830 million tons of CO2 per year, a figure comparable to the entire aviation business [9]. Another study estimated that communication technology would use 14% of global electricity by 2040, up from just under 4% in 2020 [10]. In his last book, Garry McGoven [11] evaluates how many trees would need to be planted in order to counteract the en-vironmental impact of the world wide web, reaching the conclusion that 1.6 billion trees would cover for the pollution generated by email spam; meanwhile, to offset the pollu-tion caused by yearly e-commerce returns in the US, 1.5 billion trees would have to be planted and to compensate for the pollution generated by the approximately 1.9 trillion yearly Google searches, 16 million trees would be needed. We, therefore, have indisput-able evidence for the necessity of a sustainable worldwide web.
The central solution to limit the environmental impact of the internet is to adopt a sustainable web design approach. Tom Greenwood [12] (p. 5) defines sustainable web design as “an approach to designing web services that prioritize the health of our home planet. At its core is a focus on reducing carbon emissions and energy consumption”. The emphasis of this definition on reduced carbon emissions clearly indicates how efficient and clean web design can contribute to the stop of global warming, goal number 13 of the 17th Sustainable Developmental Goals defined by the United Nations [13]. Tim Frick [14] presents sustainable web design as a set of environmental principles applied to any dig-ital product, service, or media by energy use reduction and green ingredient inclusion. The following four-category framework for sustainable design ensures lower energy consumption and lower carbon emission, thus fitting the Sustainable Consumption and Production and Sustainable Industrial Policy Action Plan, proposed by the Council of the European Union in 2007 [15]. • Sustainable components, such as green housing, green workplaces, energy-efficient
frameworks, Agile workflows—where multiple team members communicate and brainstorm solutions;
• Increased findability, content and search engine optimization (SEO)—reducing meaningless content, easy-to-find information, data with clear purpose and utility, the inclusion of tools such as search buttons;
• Web performance optimization—fast loading websites consume less energy while keeping users happy;
• Design and user experience (UX)—the focus of the present paper—creating enjoya-ble online experiences, removing information overload, keeping things simple, eas-ily apprehensible, ensuring valuable information, generating high conversion rates and positive brand perception. Detailed research, interviewing users, testing and retesting, are the key elements for
obtaining a good web design to increase consumer satisfaction and trust, website visits and conversions or purchases [16–19]. However, what is good web design? How can we evaluate it? Keeping in mind the sustainability goal, companies strive to create high us-ability and a rich user experience for their website visitors. Usability is defined by the International Organization for Standardization (ISO) as the “extent to which a system, product or service can be used by specified users to achieve specified goals with effec-tiveness, efficiency and satisfaction in a specified context of use” [20] (p. 2). When refer-ring to the use of a website, usability measures the ease to use that website, the design of
Sustainability 2021, 13, 10415 4 of 31
the task-based interaction, or how intuitive and easy it is for consumers to reach their goal on the website. Palmer [21] demonstrates through a series of three studies that website usability and success are usually associated with download speed, layout or-ganization, information sequencing, type and amount of content, interactivity, customi-zation degree and responsiveness (e.g., feedback opportunities and FAQs). Regarding aesthetics, Sonderegger and Sauer [22] used a computer simulation of a mobile phone and analyzed how the visual appearance of the phone influenced perceived usability, performance and attractiveness. Even if (aside from one aspect) the phones were identi-cal, the participants using the highly appealing phone found it more usable than the case of the non-appealing one. Furthermore, the task completion time was lower in the case of the appealing mobile device, underlining the impact that a pleasing design can have over UX as a usability component.
User experience (UX), on the other hand, is a holistic view of human-computer in-teraction. This dimension embeds usability as a component and broadens out, consider-ing elements such as cognition and emotional involvement; therefore, it is a more he-donic view of how users’ satisfaction is reached [23]. Starting in 1995, when Norman and colleagues introduced the term UX [24], and continuing with Alben [25], the field of UX became of interest for marketers and web designers, presenting itself as a challenge—as it is influenced not only by technical, objective factors (usability) but also by situational factors such as the emotional state of the user.
Lee and Kozar [17] propose ten dimensions to be measured when evaluating the usability of a website and UX, similar to those proposed by Shackel [26]: • Consistency (consistent design and structure throughout the whole website); • Navigability (ease of accessing information, presences of search features); • Supportability (easy to receive personalized support from provider); • Learnability (frequent usage makes the website easier to use); • Simplicity (succinct, easy to understand content and structure); • Interactivity (presence of animations, video, etc., or possibility to contact other
consumers or providers); • Telepresence (the existence of emotional involvement while using the website); • Credibility (clear information about security features); • Content relevance (accurate, in-depth and up-to-date information); • Readability (easy-to-understand words, appropriate formatting, pleasant use of
colors and structures). We conclude that UX combines the physical and technical aspects of a website with
the cognitive processes that occur while the user interacts with the website. A qualitative UX will positively impact memory and website familiarity; these aspects have been shown to be in close relation with consumer satisfaction and loyalty [27]. The notion of UX can also be related to the term “online atmospherics”—the design of a website that seeks to create positive cognition and affect, having as the final objective, to obtain posi-tive responses from consumers [28,29]. Without getting into technical details, we have to mention the gold standard of approaching web design, meaning progressive enhance-ment. This is a web design method that does not build around the browser but around the content and the way it contributes to UX. As it fits with HTML, CSS or JavaScript, progressive enhancement allows adaptation according to the users’ needs, starting, in a layered manner, from the context in which the user accesses the webpage [30].
In a world filled with information, as an individual is targeted by thousands of marketing messages every day, it is vital to know how to differentiate yourself in the mind of the consumer, creating, through UX, a favorable perception about the business presented [31,32]. Perception can be defined as “the process through which a person re-ceives, selects, organizes and interprets stimuli from the environment while assigning them a meaning” [33] (p. 58). An essential part of the perceptual process is represented by perceptual selection–what consumers choose to see and interpret. As the sensation—part

Sustainability 2021, 13, 10415 5 of 31
of the perceptual selection process is influenced by both internal factors (attitude, ex-pectations, motives, etc.) and external factors (color, shape, movement, light, etc.)—it is vital that when opting for web design styles, one takes into consideration both categories, while also keeping in mind the objective of sustainability.
In terms of internal influences, it is important not to forget that users access a web-site to satisfy their needs; no matter if they are searching for information, a product, or a service, they come on a platform with an open heart, hoping that it will match their ex-pectations. It is not recommended to try to trick visitors into buying something they do not need; thus, we refer to an ethical approach to web design [34]; providers should avoid asking for credit card information for free trials or adding hidden costs or essential in-formation in small fonts hoping that the user will not notice. UX is about the appearance, comfort and trust developed between the consumer, website and provider; therefore, website design should be simple, direct and easy to use [16].
Structural elements (external influences), such as a good choice of fonts and typog-raphy, colors, imagery, or information position on the page—even if not directly related to the buying decision process—will contribute to high usability by creating a pleasant and memorable experience [35,36]. Still, the sustainability issue should not be forgotten. For example, blue pixels consume up to 25% more energy to be displayed than red or green; using Google Maps in night mode reduces screen power usage by 63 percent [12]. When choosing between black background—white text or vice versa, consider that while black text on a white background will be easier to the eye, the black background may consume lower energy. For OLED screens, the use of black light does not activate any pixels; therefore, no energy is consumed, but this is not the same for LCD screens, where displaying a black background might consume even more energy than a light one [13]. Color can influence a consumer’s perception, disposition, purchase intent, perception over a brand or brand personality [37–39]. In terms of online atmospherics, color can in-fluence perception over website loading time [40], can attract attention and impact memory over the viewed item, or reversely, a bad choice of colors can distract the atten-tion of users from the main information [41]. Generally speaking, long-wavelength colors like red or orange are usually associated with arousal and excitement, while browns can be connected to the idea of nature and earth, green with the feeling of security, and blue with qualities like sanitary [38].
Closely related to color is imagery in the online environment, a tool that can increase users’ attention and memory but, when wrongly managed, can prove unsustainable. As images occupy a large amount of data in the website’s background, the benefit versus cost of using images and videos on the website should be evaluated. PNG and GIF files are recommended for showing graphs; JPGs are a good choice for photos, while logos should be exposed through vector images. Another critical aspect of imagery use and sustainable web design is running all visuals through an online compressor tool like Smush.it or Image Optimizer; this will reduce file size without affecting quality too much. In terms of impact, the correct use of images in relation to the content of the text presented showed an increase in consumer attitude towards the website and brand [42]. Font-wise, it is important to make the web page look neat and pleasant; the recommen-dation is not to use more than two different fonts to keep the design sustainable; always evaluate the loading time that each font needs. For online use (not print), fonts like Georgia or Verdana are recommended [14]. Furthermore, using fonts pre-installed on the devices where the website is expected to be viewed more often will require less server use [12].
Other external characteristics that affect sensation and can impact UX and consumer perception of the website are: • The size of the content—larger is easier to see but has more energy cost; • Intensity—brightness, color intensity, intrusiveness of ads (ads that users have to
interact with to get to the desired content) or repetition (frequency intensity);
Sustainability 2021, 13, 10415 6 of 31
• Movement—videos or motion pictures—attract attention but consume more energy and data than static information;
• Position—not only how, but where information is presented might make a differ-ence—in the US, it has been shown that the best place to display important infor-mation is on the top left side [43].
3. Neuromarketing and Web Design Whether we are at home, at the office, on the street or in the car, we are constantly
exposed to marketing stimuli [44]. A poster of a Guns N’ Roses concert spotted on the street, a radio ad for a weekend in Greece heard while taking a shower, the smell of a freshly baked croissant coming from the bakery on the street corner, a free sample of the newly-released mint ice cream received in the cake shop or the feel of ripe mango in the supermarket. These are all ways through which businesses are targeting each of the hu-man senses, what Aristotle, thousands of years ago, was referring to as visus/sight, au-ditus/hearing, odoratus/smell, gustus/taste and tactus/touch [45]. The way each con-sumer reacts to these inputs, their preferences, thoughts, emotions and their behaviors are elements of interest for marketing researchers. Self-report research techniques (sur-veys, interviews, etc.) used for measuring consumer behavior have limited value as one will be subjective when talking about thoughts and emotions, elusive when discussing taboo subjects, present behavior in a socially acceptable way or may not be able to ex-press the actual feelings that they have [46]. Obtaining clear and objective information is where neuromarketing, as a relatively new and innovative research technique, proves extremely valuable. Neuromarketing “asks” the body and brain how they feel about a particular marketing stimulus, thus, being able to complete the gaps of expressed be-havior with an objective measurement of impact [47–49].
While it can be very hard for individuals to objectively evaluate their emotions, it is crucial not to lose emotions from our sight when evaluating consumer behavior. The consumer is very often considered and approached as homo economicus, having the ability to make rational decisions; this approach is profoundly wrong and undesirable. Many theoreticians and practitioners underline the way that rationality and emo-tions—defined by Damasio as chances that appear in the body and brain states as a result of exposure to stimuli [50,51]—weave together to make us what we are. Daniel Kahne-man [52] presents this wonderful partnership between rational and emotional, or con-scious and unconscious, as System 1 and System 2. System 1, or fast-thinking (present in animals), is represented by all the reactions and activities that happen spontaneously, involuntarily, quickly and with little or no effort. System 2, or slow-thinking, appeals to conscious, learned and complex mental processes for a problem to be solved. While Sys-tem 1 generates intuitions, feelings and impressions, it needs System 2 to transform these into beliefs, organized ideas or voluntary actions. In terms of timing, System 1 acts first, gathering information from the environment and providing information for making fast decisions. As System 1 is represented by the intuitive and emotional reactions, it is im-possible to even consider that decisions can be made only rationally by directly involving System 2. The weight that each system brings to a decision depends on several aspects, including the hot/cold states that Lowenstein and colleagues [53] discuss. In cold states, cognitive, rational thinking will prevail, while under hot states, when the need is acute, the emotional aspects will weigh heavier, thus guiding the decision-making process.
Rene Descartes argued that the rationale behavior is the first the first marker of ex-istence. Antonio Damasio [50] contradicted this approach, justifying that the existence of emotions makes us behave at our best. Emotions should not be removed from the deci-sion-making process, but first and foremost, we should never desire this. Damasio [54] considers that the brain is responsible for the body and mind homeostasis and that, by using emotions and feelings, the brain manages to restore an equilibrium state in the body whenever things get complicated, and decisions are tough. Damasio reached this conclusion through several hands-on experiences with patients who had their cerebral

Sustainability 2021, 13, 10415 7 of 31
prefrontal cortex damaged from various medical conditions and, even if the general ca-pacities of the patients remained unchanged, they became incapable of feeling emotions. The main impact of this was that they were incapable of making decisions anymore; the instinct, the intuition, that gut feeling was gone, leaving them with only the rational analysis at disposal for choosing the best options. The result? Endless self-debate taking into consideration cost-benefit criteria, resulting in poor decisions, affecting their per-sonal and social life [55–57]. These studies, together with other revealing research of the brain, undergone by Damasio and colleagues, lead to the well-known Somatic Marker hypothesis, where emotions are considered vital in guiding the decision-making process [50,58]. The somatic marker hypothesis has a major role in the way individuals take risks, therefore, how their decision-making process works. Pleasant emotions, which correlate with dopamine release, are higher when positive outcomes are unexpected; therefore, when the risks are higher. People are motivated by the desired reward to take risks; thus, without somatic states (emotions and moods), consumers would stick to a narrow set of choices, without assuming any risk (monetary, time related, socially related, etc.) for achieving better results and higher satisfaction [59].
Analyzing the emotions triggered by specific stimuli is easier by using neuromar-keting. In order to correctly define neuromarketing, we must first discuss neurosciences, neuroeconomy and consumer neurosciences. While the first seeks to understand human behavior in general, through the study of the brain [60], neuroeconomy and consumer neurosciences bring consumer behavior to the center of the analysis by studying psy-chological processes such as perception, memory, attention and arousal [61]. Concerning the previous notions, neuromarketing can be treated as a niche of consumer neurosci-ences, focusing exclusively on studying consumer behaviors that arise from the interac-tion between individuals and markets or marketing stimuli [62,63].
Pioneer neuromarketing studies can be found as early as 1979 [64] when the effect of watching an advertisement was studied by measuring pupil dilation or changes in con-sumer’s brain waves; however, until 2002, when professor Smidts first used the term “neuromarketing”, these studies did not belong to a specific field of research [65]. Seek-ing to increase marketing effectiveness [66] and offer a deeper understanding of the rela-tionship between individuals, businesses, and markets through the study of the brain [63], neuromarketing utilizes several research techniques. Studying either the metabolic or electric reaction of the brain or other behaviors and conducts of the consumer [49,67–71], the most well-known and frequently used techniques are: • fMRI (functional magnetic resonance imaging)—a scanner that combines magnetic
and radio waves, used for the study of the brain’s reaction to stimuli; • EEG (electroencephalography)—a helmet that measures how the brain’s electrical
currents change when the subject is facing a marketing stimulus; • MEG (magnetoencephalography)—a detector that measures the magnetic fields
created by the brain during interaction with a marketing stimulus; • fNIRS (functional near-infrared spectroscopy)—one of the latest neuromarketing
techniques, taking the form of a set of electrodes that records the changes of the hemoglobin concentration present in the brain;
• The eye tracker—a fixed or mobile camera that records the individual’s eye move-ment, establishing where, when, and in which order certain elements of a visual stimulus (static or dynamic) are viewed. Metrics such as time elapsed until first fix-ation, duration of fixation, saccades (visual paths between two fixations), order of the fixations, pupil dilation modification as a result of positive or negative arousal, etc., can be produced by the eye tracker, allowing researchers to understand in more detail what catches the eye. The eye tracker can generate both quantitative data (performance of key objects) and qualitative data (usability issues), thus being a perfect tool for the study of web design [68].

Sustainability 2021, 13, 10415 8 of 31
Even if the saccades of the eyes were known in ophthalmology as early as 1879, when Lois Javal [72] observed the way the eye moves during the reading process, the eye tracker was only used in 1947 to study the eye movements of pilots during their flight [73]. Later on, based on data from experiments using visual cues, the scanpath theory was developed [74,75], which suggests that actively looking at stimuli, together with visual perception, is cognitively controlled by the individual—using visual memory while fo-cusing on specific details of the visual stimulus. In terms of fixations, or the static se-quence of a scanpath, Dario Salvucci and Joseph Goldberg [76] propose five different algorithms for identifying and measuring fixations, offering a standardized method for analysis that is valuable for the field. As eye tracking proved to offer valuable infor-mation about the physical and mental state of an individual, several domains resorted very early to this practice in order to obtain answers. Holzman and his colleagues [77] studied the eye movements in patients with schizophrenia, identifying certain differ-ences compared to the eye movement of healthy people, thus establishing new diagnostic criteria for the field. Jacob [78] uses the eye tracker, seeking to identify how eye move-ments can be used as an input in human-computer communication, proposing ways to facilitate this interaction in both directions. Consumer behavior was early studied offline, as well as online. Lohse [79] analyzed how people scan yellow page advertisements, sharing valuable evidence regarding the positions and formats that attract visual atten-tion, thus contributing to advertising efficiency. Online, Granka et al. [80] gather infor-mation via eye trackers to understand how consumers use search engines and what makes them choose certain ones from the long list of results, concluding that usually only the first two results are accessed. The previously mentioned works are some of the most well-known in the field. Still, many eye tracking researchers have contributed to the current state of knowledge in the field. As it would be impossible to mention all of them, we chose to present a set of practical commercial applications of the eye tracker, offering several examples for each category: • Advertising creation and testing [73,81–88]—understanding where the consumer
looks when viewing an advertisement, the order in which different elements are viewed or finding out what type of emotions are produced by a particular message, are essential in order to create or refine ads;
• Packaging [89,90]-colors, shapes, and unique differentiation elements can make a product memorable; neuromarketing provides valuable techniques to study how the package of the product impacts the consumer and influences their buying deci-sion;
• Pricing [91,92]—psychological prices, absolute and differential thresholds in price adjustment, or different psychological concepts that stand at the basis of the con-sumer’s price evaluation process can be studied through neuromarketing tech-niques, offering a positioning advantage for a company;
• Retail [93–95]—merchandising aspects (e.g., shelf position of the product), as well as environmental aspects of the shopping space (e.g., lightning, scents, colors), can be studied in store, thanks to gadgets such as eye tracking glasses or EEG helmets;
• Product development [96,97]—additional to the verbalized opinion of consumers regarding the use of certain products, neuromarketing research offers data about the psychological and neural connections that the brain makes regarding a potential new product;
• Website/app design—aspects such as information position, dynamic, format, or content can majorly impact the time that consumers spend on a website and the perception that they form about the business. Neuromarketing techniques open a new door to understanding how the users perceive these aspects and what can be done to improve the usability of the website/app. Over time, many academics and practitioners got involved in developing web de-
sign, and neuromarketing became a widely used research method in the field. As the

Sustainability 2021, 13, 10415 9 of 31
present paper focuses on the study of web design sustainability, usability and UX, the following section summarizes the results of several research papers that applied neuro-marketing techniques—especially eye tracking- to the study of web design.
Pan and his team [98] combined the traditional survey method with neuromarket-ing, namely the eye tracker, to study behavior patterns in webpage viewing and their determinants. The study showed that demographic elements, such as gender and stim-ulus design, are the main influencers of the user’s viewing pattern. Lee and his colleagues [99] used the fMRI and the EEG to test how the brain’s reactions differ when viewing a good or bad web design. As twenty-five subjects viewed and categorized fifty websites as having a “good” or “bad” design, the researchers concomitantly studied the subjects’ brain reactions. The fMRI results showed that the perceived quality of the design was associated with activations of the frontal and occipital lobes, while the EEG showed that the brain had a faster and more intense reaction to bad designs rather than good ones.
The relation between user’s age and web design was studied by Djamasbi and col-leagues [100]: based on the evaluation of 50 web pages performed by 98 generation Y in-dividuals, six websites (the three most liked and three most disliked) were used as stim-uli for an eye tracking study. The data obtained by the eye tracker (e.g., visual fixations), combined with the verbalized perceptions offered by the participants during the surveys, and interviews following the experiment, showed that the use of large pictures, the presence of a search feature, and the use of celebrities were actions that contributed to increasing the attractiveness of a webpage for generation Y consumers. Another study of the relation between age and web design preference has been conducted by Jenifer Bergstrom and her colleagues [101], who studied how elderly users interact with certain web pages. The study involved 37 users in an eye tracking study, where particular met-rics of pre-established areas of interest (AOIs) were measured (duration until first fixa-tion, fixation duration). The heat maps and metrics indicated that elderly users focus more on the center part of the webpage, while young users look more frequently in the peripheral area. Moreover, the upper side of the website is much later viewed by elderly users compared to young ones. Seeking to study the impact of personal traits on web utilization, Hernandez and team [102] researched the attention of users with the use of an eye tracker by analyzing how individuals who only read from left to right interact with a web page, compared with those who can read in both directions. The research showed that users who can read from both sides have better spatial attention, while those who only read from left to right have better attention to details. These studies provide helpful information regarding the ideal web design according to the personal characteristics of the target group.
In terms of web characteristics and user behavior, Cyr and her team [103] studied the relation between color and satisfaction, loyalty, and trust and added the culture var-iable by comparing this correlation for three different cultures (Japanese, Canadian and German). Ninety subjects from the countries mentioned above viewed one e-commerce website. By combining perceptions measured through the eye tracker with perceptions expressed by the participants through follow-up discussions, the researchers concluded that the colors used in web design influence the trust and satisfaction related to the web-site.
Seeking to evaluate the usefulness of neuromarketing research for the field of web design, Lee & Seo [104] conducted a study where they tested and compared bio-signals usability research (electroencephalogram, electrocardiogram) versus traditional usability testing (satisfaction interviews, performance measurements, participator evaluations). Within the study, ten subjects evaluated four automotive company websites. The results showed that the used neuromarketing techniques provided similar conclusions to the traditional usability tests, indicating that, besides being reliable, neuromarketing is val-uable for completing the traditional usability tests with information about emotions and feelings that specific web designs may trigger. Similar results were obtained by Pablo Loyola and his colleagues [105] when they used an eye tracker to record fixations and

Sustainability 2021, 13, 10415 10 of 31
pupil dilation during a subjects’ (23 persons) interaction with a website. Seeking to better define the web elements that attract most of the users’ attention, the information pro-vided by the eye tracker proved not to be sufficient if used alone but showed a 14% ac-curacy increase in defining the key elements of attraction when compiled with data ob-tained through traditional research methods.
In terms of users’ cognitive load and website design, several neuromarketing studies showed how the structure and format of a webpage could influence the way users in-teract with the content and the final result of their interaction. Wang et al. [106] tested how simple and complex tasks were performed on simple versus complex website structures. The researchers used the eye tracker to record the interaction of the 42 subjects with the websites, and, based on the result obtained from the ANOVA statistical test, they concluded that the website complexity influences usability at a lower rate than the complexity of the task. While no statistical differences were shown in the analysis of simple versus complex websites, more fixations and longer duration of fixations were identified when the task carried out by the subjects was a complex one, no matter the complexity of the website. In the same area of interest, Zlokazova et al. [107] compared how an airline web page’s structure impacted web usability. While being eye tracked, the subjects (23) firstly used a website that presented two-way flights on the same page; secondly, a webpage that presented each route on a separate, subsequent page was used. The study showed that the two-page structure allowed users to complete the task faster but presented a higher number of errors due to a higher cognitive load.
4. Methodology Past research of the authors [108] proved that a business’s website is a top choice for
marketing communication. As usability and UX are key concepts that contribute to web-site sustainability, the present paper aims to evaluate the usability of five different web-site structures and designs by analyzing users’ attention while they perform tasks on the landing pages of the considered websites. The main source of inspiration for the present study was the work of Munoz-Leiva [88], who tested how tourism advertisement ban-ners are seen in different online environments, thus different layouts and design, con-ducting three neuromarketing studies with 15 participants each, where subjects had to solve a task (find certain information) on a blog, website and Facebook page of a touristic business.
The present research seeks to compare different design styles, layouts and formats of the same type of business website. By establishing the key attractors and the measured and perceived difficulty of performing the tasks, the purpose of the research is to identify the elements, formats, and structures of information that increase the usability of the landing page of a website. Derived from the purpose of the research, following the results of other research papers, a set of objectives and hypotheses were established.
Various studies, such as Bucher and Schumacher [109], show that visual attention to information and memorization are highly influenced by layout and design. Matzen and her colleagues showed that a subject devotes a large part of their attention to text, and specifically, to the titles of each section [110]. Laeng et al. [91] and Pieters and Wedel [111] showed that pictures are the most viewed. Bonnardel et al. [112] show that colors have a determinant influence on how the users interact with a website. Having this in mind, we propose the following objective and hypothesis: • Objective 1—Identify the elements registered by the eye tracker as being viewed
(heat map) and memorized by the users following the free-viewing of the websites.
Hypothesis 1 (H1). Information layout and design influence the extent to which information is viewed and memorized by the subjects.
In terms of page scanning directions, Pinto et al. [113] and Connor et al. [114] showed that top-down scanning patterns are identified for goal-oriented (task-solving) web visualizations. Furthermore, Hung and Wang [115] argued that scanpaths within

Sustainability 2021, 13, 10415 11 of 31
their eye tracking study were mainly vertical and horizontal. Buscher et al. [116] consid-ered that users usually look at the top side of the screen in the first moments of their en-counter with the website. Considering these aspects, the following objective and hy-pothesis were established. • Objective 2—Determining the order in which subjects visualize different infor-
mation on the landing pages of a website while performing a task.
Hypothesis 2 (H2). A pattern of visualization can be established.
Even if it was not applied on website design, we considered useful the method used by Andrzejewska and Stolińska [117] in their research, where the subjective difficulty of the tasks that the subjects had to perform while being eye tracked was compared to the time needed for each task to be completed. In the end, the two variables had a direct correlation. As our research model defined the eye tracking time of each task for each participant to be the measured task difficulty, we decided to correlate this dimension with the perceived difficulty of the task expressed by the participants. • Objective 3—Establishing a relationship between the measured and perceived dif-
ficulty for fulfilling a task, in the case of different website structures and designs
Hypothesis 3 (H3). The relationship between the measured and perceived difficulty of carrying out the task is a negative one.
• Goldberg and Helfman [118] and Wang et al. [106] used ANOVA techniques for analyzing timed completion of the task and perceived website complexity. Starting from their analysis approach, the following objective was developed. Objective 4—Determining the variance (ANOVA) of the measured difficulty of fulfilling a task for different structures and design of the landing page. We consider that a longer sequence of fixations and saccades before the completion
of the task, therefore a longer duration, indicates a higher difficulty for completing the task. Different studies indicate that the scanpath format, as well as task completion du-ration, are influenced by the structure of the webpage. Goldberg et al. [119] suggest that important information should be placed on the top and left sides of the portal, as well as that different scanpath directions (vertical/horizontal) occur, depending on the columns position. Bojko’s [120] comparative analysis of two versions of the American Society of Clinical Oncology (ASCO) website proved, through the reduced time needed for a task to be fulfilled, that the new, improved design of the website was far more usable, proving again the influence of design over visual attention. Pan et al. [98] showed that the com-plexity of the webpage, therefore the way information is structured, impacts the scanpath structure and the extent to which it differs from one individual to another. Zlokazova et al. [107] compared two different designs for an airline webpage, showing that a two-page structure of the booking feature proved to perform faster but with more errors.
Hypothesis 4.1 (H4.1). The measured difficulty as a result of carrying out a task differs signifi-cantly depending on the landing page structure and design.
Various studies [118,121–123] showed that information that is new and unfamiliar will be either fixated for a longer time or will need more fixations in order to be under-stood; having this in mind, the following hypothesis was established.
Hypothesis 4.2 (H4.2). Each subsequent task will be performed faster as a result of the learning process.
A randomly created, non-representative sample of 22 subjects (21–36 years old), 11 male and 11 female, was selected for the study. Taking into consideration the samples used in different other eye-tracking studies [73,89,91,105,107], we have established a minimum of 20 participants to the study; out of the 50 invitations sent to students and graduates of Bucharest University of Economic Studies, Romania, 22 participants showed

Sustainability 2021, 13, 10415 12 of 31
up for the study. Data were collected by applying a combined research method: a survey (questionnaire) and neuromarketing (eye tracking).
The implementation phase of the research: an initial information session regarding the purpose and structure of the study was performed by the researchers; following the information session, each participant signed the consent form for participating in the study. The first research step consisted of each subject completing a questionnaire, self-evaluating their online consumption behavior. The second research stage was per-formed on a laptop with an SMI REDn Scientific System mounted eye tracker. While each participant followed the calibration dots moving on the screen, the eye tracker was cali-brated for each subject individually, assuring the correctness of gaze recording.
Researchers like Danaher and Mullarkey [124] consider that screening a website having a task in mind makes it less probable for information to be memorized, thus generating a constant debate whether to set up tasks for participants within eye tracking studies or to choose a free-viewing approach. We decided to undergo both options: (1) we have established three tasks to be performed by the participants so that we can com-pare which of the design options (picture/symbol/text) perform better and (2) offer par-ticipants the chance to free-view the webpages for a fixed duration of one minute, so that the memorized elements can be evaluated.
The eye tracker recorded the subjects’ gaze while each of them fulfilled three tasks on five different website landing pages; the duration needed for each task to be fulfilled was recorded and considered to be the overall task completion time, based on Bojko [120] and Andrzejewska and Stolińska [125].
Each participant evaluated the difficulty level for fulfilling the first, second and third tasks (perceived difficulty). In addition, 1 min of free-viewing was performed by each subject for each website. Following the 1 min free-viewing, the subjects completed a complex questionnaire, expressing their perception and experience over the five different websites. Each task consisted of identifying a certain section on the webpage (exchange rate, shopping bankcard, mobile banking). For comparison reasons, the content of the task was chosen so that each webpage would present the information under a different format (text, image, symbol, table, etc.).
Seeking to compare the usability of different layouts, the study used five different web pages from the same service category (banking); the web pages used were not de-signed for this study, but the actual landing pages of five of the most popular banks in Romania were used. Besides their popularity, these five banking web pages were chosen so that the three elements contained by the tasks (exchange rate, shopping card and mo-bile banking) were displayed differently (text/picture/symbol) so that a comparison of each format attractiveness and usability could be made. The authors consider the results to be valuable for web design development, no matter the field of activity.
5. Results and Discussion Objective 1—Identifying the elements memorized by users following the
free-viewing of the websites and their correlation with the elements registered by the eye tracker as being viewed (heat map)
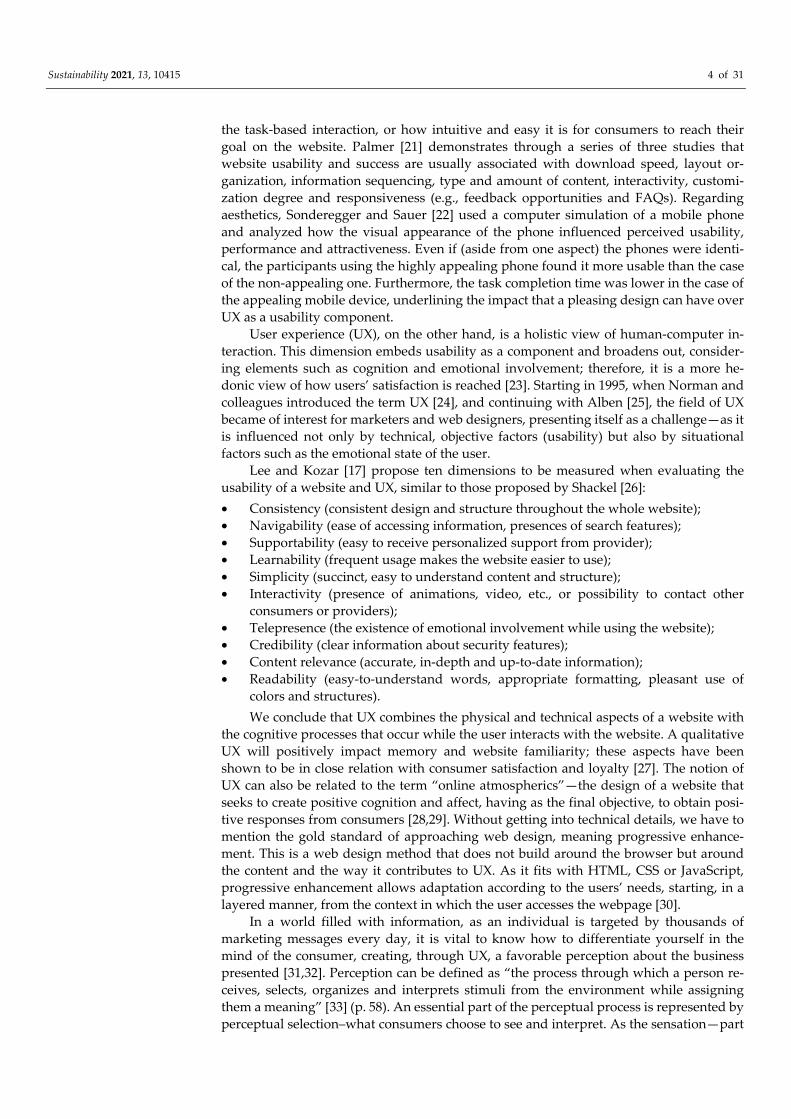
After a 1-min free-viewing of the landing page of each studied website, the subjects made a list of elements and information that stood out during their interaction with the page, which they memorized. As the eye tracker recorded each subject’s eye gaze during the 1-min free-viewing of the webpages, a heat map showing the most viewed elements of each webpage was created (as shown in Figure 1). Moreover, using the eye tracker software, an AOI (areas of interest) map was generated so that metrics such as visualiza-tion sequence, number of visualizations (attention), or average fixation (milliseconds) could be analyzed against the mentioning frequency (memory) of the elements memo-rized by subjects; this data was analyzed for the specific information of each website. After completing the eye tracker data with the information obtained through the final

Sustainability 2021, 13, 10415 13 of 31
questionnaire, a set of results, valid regardless of the considered webpage, were ob-tained.
Figure 1. Heat Map BRD bank website in free-viewing conditions.
• By comparing the frequently mentioned elements as being memorized by the sub-jects with the heat map generated by the eye tracker for each task performance on each of the five websites, it can be concluded that most of the memorized infor-mation was recorded as the eye tracker as being intensely viewed. This confirms the results of Laeng and his colleagues [91], who showed that a long stare at an element directly correlates with a higher preference, therefore a greater chance for the visu-alized element to be memorized.
• In situations where subjects have previously interacted with the web page, their experience facilitates the revision and mentioning of already known elements. Some of the memorized elements would have a higher mention rate, even if they were not intensely viewed, while other memorized information has a low mentioning rate as it is considered redundant, being mentioned within another task. From the analysis of heat maps, it can be noticed that the already known elements (exchange rate, shopping card or internet banking) represent, in most cases, anchor elements that guide the scanpaths towards new areas of the page. These results are in line with the ones obtained in other studies [126,127], suggesting that the use of familiar infor-mation alongside new elements of a web design facilitates the visual search, thus increasing the chances for a wider area of the webpage to be visualized. A particular case can be identified for website E, where, due to the multitude of buttons and well-highlighted sections, there is an intense view and increased attention on most sections, not only the ones previously viewed. As we are now referring to free-viewing, where the number of fixations and memorized bits of information are an indicator about web design appropriateness, this information could be highly useful when considering the choice of section structure and use of buttons on a website in order to create an increased interaction between the user and the website.
• Considering that the images (promotional banners) placed at the top of the pages were one of the most efficient elements in terms of mentioning and memorizing, it can be concluded that the information transmitted through images, in a visual form, needs a shorter viewing time in order to be memorized. Findings regarding the impact of pictures and their visibility are contrasting: several studies performed on

Sustainability 2021, 13, 10415 14 of 31
different webpages, analyzing the eye movement and scanpaths during free-viewing or while performing a task sustain that text information is more at-tractive than pictures/video/graphical information [119,128–131]. The results ob-tained within the present study are in line with the other half of research, which considers pictures as having better visual performance on websites and in offline communications. Laeng et al. showed that while eye tracking the visual attention of consumers looking at different wine bottles, the pictures depicted by the wine labels were the ones viewed the most [91]. Pieters and Wedel [111] showed through their study that pictures always performed better and were more attractive to the users, while Wu et al. [132] argue that in situations when more images are present, the most conspicuous of them will be the ones attracting visual attention.
• Even if the subjects mentioned different specific elements of the image content, most often, the image itself and the title/main subject are mentioned. This result is sus-tained by the results of Matzen et al. [110], who show that most of the time, users read the title of a text section first and for the longest period (about 70% of the viewing time).
• As stated by Bonnardel et al. [112], colors have a determinant influence on how the users interact with a website. Our results proved that intense colors attract attention and increase the chances of information being memorized. It was possible to observe this aspect specifically mentioned or deduced by analyzing the color used to present the memorized information. On the other hand, the excessive use of colors seems to be annoying for the user; proving the theoretical point of view of Greenwoond [12], using different fonts and text sizes increases the user’s attention and the chance that this information will be stored. As in the case of colors, the excessive use of different fonts proved to be tiring for the users.
• While Le Meur and Liu [133] claim through their study that scanpaths follow a horizontal, rather than vertical, direction under free-viewing conditions, the present study cannot incline for a majority of the vertical or horizontal direction, but for a majority of both compared to chaotically or diagonal scanning. Thus, the viewing scanpaths templates usually respect a vertical and horizontal direction, following the page layout through different boxes and sections. In the case where six separate box-shaped sections are used to present the information, the focus falls on the first three boxes presented in the first line. The information in the first, being mentioned to a greater extent. This conclusion indicates that a structured way to present the information on a website, avoiding excessive text and sections, will ensure a full visual cover of the content.
• In line with Li et al. [134], the findings suggest that a combination between text and picture attract viewer’s attention to a greater extent compared to pictures or text alone. In several situations, it was noticed that attention is directed more often to the images that accompany each section of information, thus guiding the gaze and in-dicating the differentiation of the sections;
• Analyzing the position of the memorized items on the web pages, it can be con-cluded that the essential information should be placed in the center, top, and right side of the web page. While the center and upper side of the page proved to be in-tensely viewed within other studies, we note a difference represented by the left-right attention. As Buscher et al. [116], Goldberg et al. [119], and Durgin et al. [95] showed, besides the upper and center areas, the left side of the screen is viewed sooner and for a longer period of time compared to the right side of the screen. As Djamasbi [135] had similar results, the right side of the webpage being viewed be-fore the left side, we consider that this difference is also due to the structure of the information on the studied webpages, some sections and panels attract the sight to the right area.
• Using intuitive images, graphics, buttons or icons for the described product or ser-vice leads to increased attention and a higher understanding of the information. This

Sustainability 2021, 13, 10415 15 of 31
finding is supported by Linderman and Fried [136]. However, graphics should be wisely chosen; childish pictures risk creating an unprofessional perception of the business.
• In accordance with Miniukovich et al. [137], who propose structuring text by using bullets rather than continuous prose, it was observed that if the information is pre-sented in text form, subjects went through this information only if the text was structured in a list format and not as a block of compact text. In the cases where the information was presented mainly through text, it can be noticed that only the titles of the sections were viewed, a fact demonstrated by Matzen et al. [110]. While the language used does not have to be very technical or specialized, it is observed that unique information (e.g., live chat, live shop, investments in gold, personalized names) attracts attention and is retained to a greater extent, indicating that present-ing information in unexpected ways makes it more probable to be visualized and easier to be memorized. This is not surprising, as the literature gives credit to unique and unexpected forms of presentation for being able to be memorized for a longer period of time [138,139]. By taking into consideration the results obtained, namely that information presented
in strong colors, positioned on the top or right sides of the screen, the information pre-sented with a picture or alongside it, or text arranged using bullet points rather than continuous writing will attract the most user attention, it can be stated that hypothesis H1 is confirmed, with information layout and design influencing the extent to which infor-mation is viewed and memorized by the subjects.
Objective 2—Determining the order in which subjects visualize different infor-mation on the landing pages of a website while performing a task.
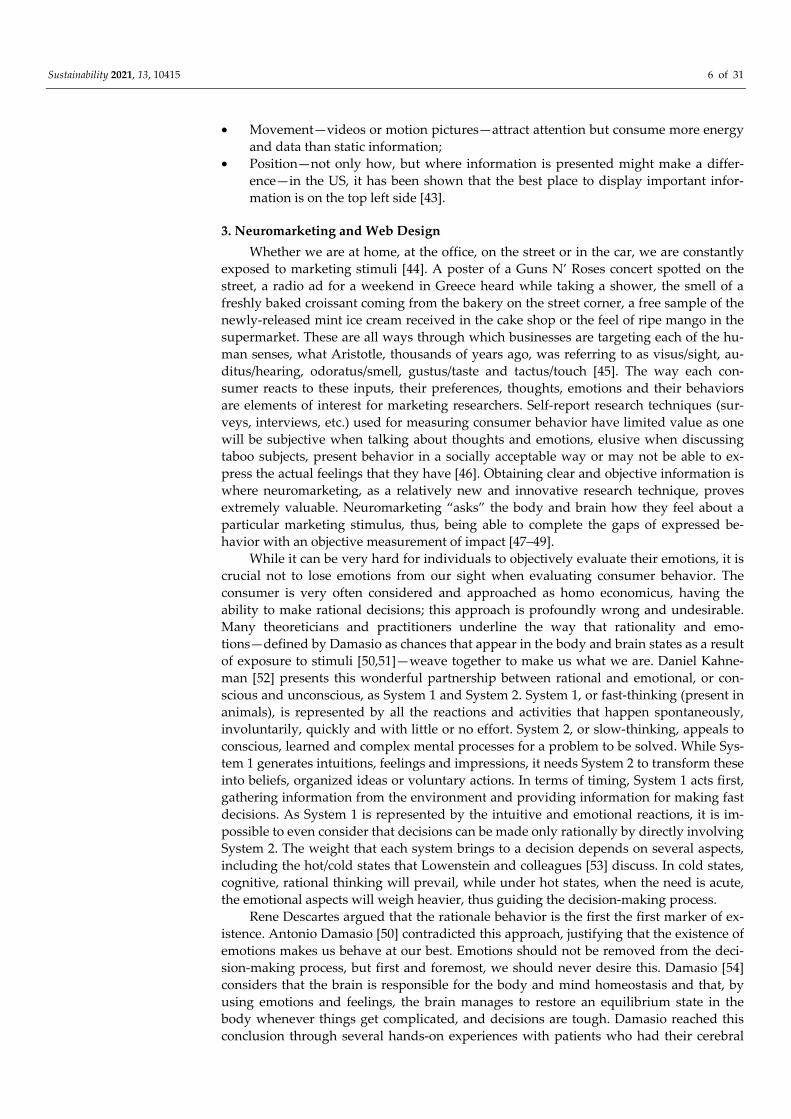
While performing each of the three tasks on the five different webpages, the atten-tion of each subject was driven by different information/design elements. Using the eye tracker software, an Areas of Interest (AOI) map was generated, information such as the viewing order, duration of each fixation, revisits of the elements, etc., being centralized. A scanpath map of the first ten elements viewed by the subjects (Figure 2) was created based on this information. Bellow, the scan path map obtained for the website of BRD bank stands as an example of the maps created for each website and each task in partic-ular.
Figure 2. Scan path map showing the first 10 viewed elements on the website of BRD bank.

Sustainability 2021, 13, 10415 16 of 31
By analyzing the top 10 elements viewed for each of the five websites during the tasks, a series of conclusions can be drawn, indicating the ideal ways for information presentation: • On a general level, the structure of the information sections, the position of buttons
and images and the use of colors for highlighting certain information prove to be the elements that guide the scanning paths of the consumers. A general valid model regarding the visualization order cannot be established. Similar to the previous ob-jective, these results are in line with the ones obtained by Bucher and Schumacher [109], indicating that through the chosen web design elements, the visual attention of the user can be guided so that he or she will interact the most with the webpage. As we are now referring to the gaze analysis under free-viewing conditions, these findings are in line with the results of Pinto et al. [113] and Connor et al. [114], who showed that while top-down scanning patterns are identified for goal-oriented web visualization, bottom-up scanning of the webpage is more frequent when the user freely scans the content of the page. In this case, the colors, contrasts and other visual characteristics of the website are the ones guiding the sight. In terms of scanning direction, users tend to scan the webpage vertically, top-down, shifting their atten-tion to highlighted elements once these enter their visual field. While we cannot de-fine a certain scanning pattern, a vertical tendency of the gaze was discovered, con-tradicting the findings of Goldberg et al. [119]. Not having a compelling result and taking into consideration the results of Hung and Wang [115], where scanpaths within the eye tracking study were mainly vertical and horizontal, we can conclude that the arrangement of the sections, images, text and other information remain the main determinant of the direction of the user’s visual gaze. The top and right sides of the displayed webpage proved to receive more attention from users compared to other areas; the lower area of the webpage is least interacted with. While the results about the top and right sides of the webpage were previously discussed, the fact that the lower side of the website is less seldom viewed was shown by Buscher et al. [116] as well. When textual information is presented as part of an image or in its immedi-ate vicinity, the text receives more attention from users than when it is presented separately. This aspect was concluded by Beymer et al. [140] as well, with the men-tion that once the user gets to see the text, the image that accompanies it will slow down the reading process, demanding more attention for both the text and image to be understood. We can therefore conclude that designing sections by using colors, symbols, borders, or images seem to increase the attractiveness and attention gath-ered by information from low-visibility sections of the webpage; The logo of the website is reviewed almost every time among the first ten items viewed, as the subjects seek to be sure that they are performing the task on the correct page. This comes as natural behavior, as Buscher et al. [116] stated that it is normal for the user to firstly look at the upper side of the page (heather, logo) for a quick check about the presumed content of the page encountered.
• Most of the time, the same elements were identified as being visualized in each of the three tasks, indicating that the subjects used these elements as anchors, guiding them within the page. This finding could be valuable for personalized online ser-vices: in an ideal case where the regular activity of a customer on the website is known, his visual behavior on the webpage would be easy to predict.
• In most cases, the viewing format (scan path) is simplified within task 2 and task 3, compared to task 1, becoming more linear, this being the result of familiarization with the information; In line with other researches from the field [90–93], this result does not imply a shorter duration for the task fulfillment (this will be studied in the next section) but indicates less chaotic viewing path, with a shorter number of sac-cades and longer fixations.
Sustainability 2021, 13, 10415 17 of 31
• Images depicting persons attracting users’ attention are viewed among the first ten elements each time. This was demonstrated by several other researchers [141–143]. Pictures with human faces have a higher memorization rate. Similar to the case of the texts, the title of the main images is always viewed first within the first task and a bit later within the subsequent tasks. By looking at the results obtained within the current objective and comparing them
to the ones from the previous objective, similar visual behaviors can be identified; this leads us to an important conclusion, namely that there are no major differences in visual behavior when the user is scanning the website having a task in mind or in a free-view format.
The proposed hypothesis of the present objective was that a visualization pattern could be established for the moment users scan a webpage having a task in mind. Using the viewing sequence of the AOIs produced by the eye tracking software, the first 10 scanpaths were identified for each of the five studied websites. A general vertical ten-dency of the gaze was discovered, one that becomes more linear within each subsequent task. Furthermore, we can conclude that the visual path depends on the position of the information sections, images and buttons; thus, for the same layout, a similar visual route will be approached by users. As we cannot define a general visualization pattern inde-pendent of the page layout, we consider Hypothesis H2 to be only partly confirmed.
Objective 3—Identifying the relationship between the perceived and measured dif-ficulty for completing a task in the case of different website structures and designs.
The difficulty for completing each task on the five web pages was measured by the eye tracker (duration in seconds until the fulfillment of the task) and expressed by the participants (perceived difficulty level on a 1 to 5 Likert scale—1-very difficult; 5-very easy). The duration was considered to be the objective task difficulty, while the expressed perception was considered the subjective difficulty of the task [125]. The following sec-tion will analyze the relationship between the two variables by calculating Pearson and Spearman correlation coefficients, seeking to find out to what extent the perceived level of difficulty is congruent with the measured one. Given that both scales are met-ric—proportional scale for measured difficulty (duration) and interval scale for perceived difficulty, both correlation coefficients can be calculated.
Eighteen correlations were performed, three computations calculating the correla-tion at a general level without considering the website difference, and fifteen computa-tions for each task on each of the five banking websites. Each computation followed the same steps: the initial values of the measured and perceived difficulty were standard-ized, and all the values that were not included in the 0.99 confidence interval around the mean were excluded from further computation; for the new N, the Pearson and Spear-man correlation coefficients were calculated, together with their significance levels.
In the following part, an example of the correlation computation process will be presented, namely the case of perceived and measured difficulty for the first task at a general level (all websites).
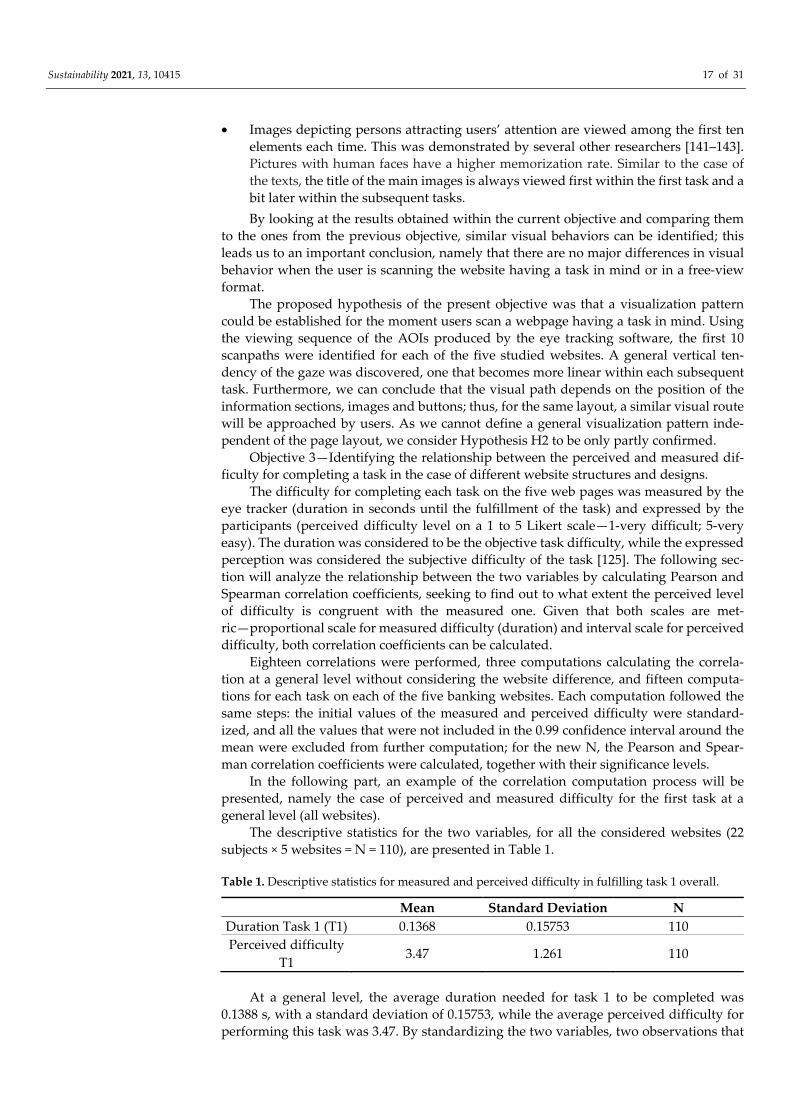
The descriptive statistics for the two variables, for all the considered websites (22 subjects × 5 websites = N = 110), are presented in Table 1.
Table 1. Descriptive statistics for measured and perceived difficulty in fulfilling task 1 overall.
Mean Standard Deviation N Duration Task 1 (T1) 0.1368 0.15753 110 Perceived difficulty
T1 3.47 1.261 110
At a general level, the average duration needed for task 1 to be completed was 0.1388 s, with a standard deviation of 0.15753, while the average perceived difficulty for performing this task was 3.47. By standardizing the two variables, two observations that

Sustainability 2021, 13, 10415 18 of 31
exceeded three standard deviations (are not included in the confidence interval of 0.99 around the mean) were identified. By excluding these observations from the analysis, the values from Table 2 were obtained for the two correlation coefficients.
Table 2. Pearson and Spearman correlation between perceived difficulty and measured difficulty in fulfilling task 1 overall.
Pearson Correlation Spearman Correlation
Duration T1 Perceived
Difficulty T1 Duration T1 Perceived
Difficulty T1
Duration T1
Correlation coefficient 1 −0.496 ** 1.000 −0.516 **
Significance level 0.000 0.000 N 108 108 108 108
Perceived difficulty T1
Correlation coefficient −0.496 ** 1 −0.516 ** 1.000
Significance level 0.000 0.000 N 108 108 108 108
** Correlation significant at 0.01 level.
Based on the values obtained for the correlation coefficients, it can be seen that, at a general level, there is a negative correlation of medium intensity between the perceived difficulty and the measured difficulty of performing task 1 (Pearson = −0.496; Spearman = −0.516); statistical significant for a 0.01 level. Therefore, it can be concluded that when the perceived difficulty decreases, the measured difficulty (the time required to complete the task) decreases as well. In other words, the perceived level of difficulty is consistent with its measured level, subjects correctly assessing the task difficulty.
Following the same computation process, the Pearson and Spearman correlation coefficients were calculated for each task and each website. Out of the eighteen compu-tations, seventeen cases indicate the existence of a medium or high-intensity negative correlation between the two variables; given that the scale for perceived difficulty was defined as (1-very difficult; 5-very easy), the negative values of the correlations indicate that the perceived level of difficulty is consistent with its measured level, with subjects correctly assessing the ease of performing tasks for each website. The only exception appears in task 3, for website A, where the ambiguity of the information needed to be identified made it hard for the subjects to be sure if the task was performed completely or correctly.
There are more examples in the literature where the relation between measured (objective) and perceived (subjective) difficulty of a task within an eye tracking study was analyzed. On one side, there are researchers that indicate that a correlation between the two types of difficulty cannot always be identified [144]; or that, even when modest cor-relations are established, the perceived difficulty was influenced not only by the meas-ured difficulty but by the users’ cognitive abilities and online search experience [145]. On the other side, several researchers present strong correlations between the two types of difficulty [125,146], some other objective measurements of the visual gaze like the devia-tion from the optimal path visual linearity being identified to correlate with the perceived difficulty as well [147]. The results of the present paper are in line with the second half of researchers, showing a correlation between the measured (objective) and perceived (subjective) difficulty of a task, suggesting that users’ perceptions regarding the usability of a website for a given purpose can be considered valid and taken into consideration when aiming for website design improvements.
Given the obtained results, it is considered that Hypothesis H3 is confirmed, the re-lationship between the perceived difficulty of carrying out the task and the measured difficulty being a negative one.

Sustainability 2021, 13, 10415 19 of 31
Objective 4—Determining the variance (ANOVA) of the measured difficulty of ful-filling a task for different structures and design of the landing page.
As each participant in the study fulfilled the proposed tasks on the websites, the eye tracker recorded their gaze but also the time spent since the first contact with the page until the end of the task.
The average durations recorded for each task on each of the studied websites are presented in Table 3.
Table 3. Average durations for fulfilling the tasks on each website.
Website Task Average Duration (Seconds) Std. Dev.
A Task 1 0.205 0.234 Task 2 0.210 0.267 Task 3 0.285 0.108
B Task 1 0.139 0.211 Task 2 0.525 0.412 Task 3 0.130 0.101
C Task 1 0.124 0.094 Task 2 0.192 0.157 Task 3 0.410 0.324
D Task 1 0.137 0.071 Task 2 0463 0.529 Task 3 0.344 0.273
E Task 1 0.077 0.029 Task 2 0.397 0.254 Task 3 0.412 0.310
The relationship between the measured and perceived difficulty is a negative one, meaning that a task that needed a longer duration of time to be fulfilled was also per-ceived as tasks with a high difficulty level. Taking this information into consideration, the next step of the research focused only on the measured difficulty (duration), seeking to determine the variance of the measured difficulty levels for fulfilling the three tasks on the five websites. Thus, in computing the ANOVA values for each case, the measured difficulty (duration) was considered to be the dependent variable (Y), while the five websites constitute the considered factors (X); the measured difficulty variable was noted on a proportional scale, while the five website pages were recorded on a nominal scale.
The same computation process was respected for each of the three tasks. The fol-lowing part presents the data for the first task that was undertaken by the subjects on the webpages; for the sake of simplicity, for the other two tasks, only the conclusions will be presented.
Firstly, the two hypotheses of the ANOVA technique were tested: the Kolmogorov Smirnov and Shapiro-Wilk tests were used to test (1) if the dependent variables follow a normal distribution within each factor category (Tables 4 and 5), while the Levene statis-tical test was used to test if (2) the variation of the dependent variable within each cate-gory of the considered factor is a homogeneous one (Table 6).

Sustainability 2021, 13, 10415 20 of 31
Table 4. Kolmogorov-Smirnov and Shapiro-Wilk tests for the measured difficulty (duration) of completing the task.
Web Site Kolmogorov-Smirnov Shapiro-Wilk
Statistic Df. Sig. Statistic Df. Sig.
Task duration
A 0.292 22 0.000 0.513 22 0.000 B 0.203 22 0.019 0.831 22 0.002 C 0.218 22 0.008 0.848 22 0.003 D 0.341 22 0.000 0.666 22 0.000 E 0.292 22 0.000 0.711 22 0.000
As the dependent variable (duration) does not follow a normal distribution for any of the factor categories (significance level < 0.05), the outliers were excluded from the computation, and the two tests were performed again. The new results are presented below.
Table 5. Kolmogorov-Smirnov and Shapiro-Wilk tests for the measured difficulty (duration) of completing the task after eliminating the outliers.
Web Site Kolmogorov-Smirnov Shapiro-Wilk
Statistic Df. Sig. Statistic Df. Sig.
Task duration
A 0.113 21 0.200 * 0.945 21 0.276 B 0.203 22 0.019 0.831 22 0.002 C 0.206 18 0.043 0.870 18 0.018 D 0.174 18 0.158 0.921 18 0.132 E 0.150 19 0.200 * 0.918 19 0.105
* This is a lower bound of the true significance.
Category B has a significance level = 0.019 < 0.005, the dependent variable (duration) did not have a normal distribution. Given that website C is approaching a normal dis-tribution (significance level = 0.043), we will consider this category in the following computations. In the case of categories A, D and E, the time-dependent variable follows a normal distribution.
Table 6. Levene statistical test—homogeneity of duration variation within each studied website.
Levene Statistic df1 df2 Sig.
Task duration
Based on Mean 21.819 4 93 0.000 Based on Median 12.375 4 93 0.000
Based on Median, with adjusted df
12.375 4 29.456 0.000
Based on trimmed mean 20.229 4 93 0.000
For each calculation method, the Levene test is statistically significant (significance level < 0.05), thus the null hypothesis and the two hypotheses specific for ANOVA tech-niques were fulfilled.
Following the elimination of category B, the Kolmogorov-Smirnov and Shapiro-Wilk tests (Table 7) and the Levene statistical test (Table 8) were performed again.

Sustainability 2021, 13, 10415 21 of 31
Table 7. Kolmogorov-Smirnov and Shapiro-Wilk tests for the measured difficulty (duration) of completing the task after eliminating category B.
Web Site Kolmogorov-Smirnov Shapiro-Wilk
Statistic Df. Sig. Statistic Df. Sig.
Task duration
A 0.113 21 0.200 * 0.945 21 0.276 C 0.206 18 0.043 0.870 18 0.018 D 0.174 18 0.158 0.921 18 0.132 E 0.150 19 0.200 * 0.918 19 0.105
* This is a lower bound of the true significance.
Table 8. Levene statistical test—homogeneity of duration variation within each studied bank after eliminating category B.
Levene Statistic Df1 Df2 Sig.
Task duration
Based on Mean 1.433 3 72 0.240 Based on Median 0.995 3 72 0.400
Based on Median, with adjusted df
0.995 3 60.582 0.401
Based on trimmed mean 1.323 3 72 0.274
As the two hypotheses of the ANOVA technique were fulfilled, the analysis was performed; the results of the one-factor-dependent ANOVA technique are presented in Table 9.
Table 9. ANOVA analysis for the measured difficulty (duration) of completing the task according to each category.
Sum of Squares Df Mean Square F Sig. Between Groups 0.236 3 0.079
7.129 0.000 Within Groups 0.793 72 0.011 Total 1.029 75
The F value = 7.129 > 1 (ratio between the systematic and non-systematic variation of Y) indicates a greater variation of the dependent variable between categories than the variation of the dependent variable within the categories; it can thus be stated that the dependent variable (duration of the task) differs depending on the categories of the factor considered, meaning that the structure and design of the webpages influence the dura-tion of the task fulfillment.
The final step of the computation was to develop contrast tests (Table 10) in order to verify the pairs of websites where a statistically significant difference is present for the dependent variable.
Table 10. Contrast tests: duration for fulfillment of the task on the website pages taken two-by-two.
Contrast Contrast Value
Standard Error
T Df. Sig.
Duration of the task
Assuming equal
variations
1 = A–C 0.0269 0.03372 0.798 72 0.427 2 = A–D −0.0787 0.03372 −2.333 72 0.022 3 = A–E −0.1106 0.03323 −3.326 72 0.001 4 = C–D −0.1056 0.03499 −3.017 72 0.004 5 = C–E −0.1375 0.03452 −3.981 72 0.000 6 = D–E −0.0319 0.03452 −0.924 72 0.359
Assuming 1 = A–C 0.0269 0.02797 0.962 36.574 0.342

Sustainability 2021, 13, 10415 22 of 31
unequal variation
2 = A–D −0.0787 0.03296 −2.387 32.306 0.023 3 = A–E −0.1106 0.03525 −3.136 31.830 0.004 4 = C–D −0.1056 0.03327 −3.173 31.617 0.003 5 = C–E −0.1375 0.03554 −3.868 31.452 0.001 6 = D–E −0.0319 0.03958 −0.806 34.824 0.426
The values above clearly indicate that the duration for fulfilling the task significantly differs between website A and D, A and E, C and D, C and E; concluding that between each of the websites in these pairs there are significant design differences that lead to different duration of task fulfillment.
The same steps as presented before were taken into computing the ANOVA values for each of the three tasks. At least four pairs of websites with statistically significant differences being obtained for each task, thus indicating that the measured difficulty (duration) and, in a strong, negative correlation, the perceived difficulty of performing the tasks, are influenced by the design of the webpage. The results of the three ANOVA techniques provided valuable information for identifying the information position and formats that lead to the lowest difficulty (both measured and perceived) of each task, thus concluding: • From the analysis of the exchange rate format, presented on the websites as a table,
graph, or a symbol, it can be concluded that for numerical information, the tabular format, followed by a combination between graphical and numeric format are the ones that make it the easiest for users to identify the information. The fact that these formats were the easiest to identify within the page, even if their position was at the bottom side of the webpage, proves the usefulness of the format. The third option in presenting numerical information on a webpage is to signal that section through an intuitive symbol (preferably a large one, positioned in the center of the webpage). These results are not surprising, as similar information can be identified in the studies of Tufte [148], who show that reading and understanding the information from a tabular form is easier compared to a narrative form. Resnick et al. [149] demonstrate that the tabular form of information needs a lower time to be scanned compared to a list. Smerecnik et al. [150] recommend the graphical form, followed by the tabular form for presenting numerical information; if we are to compare be-tween different graphical formats, Goldberg and Helfman [151] indicate that the linear graphs are easier and faster to read and comprehend. A set of results supported by several other researchers [67,111,132,134] was obtained
from the analysis of the shopping bank card, presented on the website either as a picture, a text section, or a title. Thus, it can be concluded that presenting information as a picture (preferably in the main carousel of the website) is preferred to the option of using text sections or blocks of text for presenting the product/service on the landing page of a website. In terms of position, when the searched information was placed on the upper or right sides of the webpages, the time needed for the section to be identified was shorter, a finding supported by other studies as well [95,116,119,135]. From the analysis of the mo-bile banking section, presented on the websites as text, text with symbol or text with login button for mobile banking, it can be concluded that for the information referring to dif-ferent tools, the use of symbols and buttons are making it easier for the user to identify the needed information on the landing page of a website. While Scholz et al. [152] define a symbol as a graphical image depicting a concept or idea, Detheridge and Detheridge [153] confirm our results by proposing three different approaches for making infor-mation more accessible: (1) by text simplification, (2) by replacing parts of the text or as-sociating it with pictures and meaningful pictorials or (3) by replacing the whole text with pictures or videos. Thus, showing that the use of symbols makes information easier to identify and understand. Given the results previously presented, Hypothesis H4.1 is

Sustainability 2021, 13, 10415 23 of 31
confirmed, the measured difficulty of carrying out a task differs significantly depending on the landing page structure and design.
As the specific theory refers to the impact of memory and learning process on usa-bility and UX, the authors re-examined the values obtained for the measured and per-ceived difficulty for fulfilling the tasks and seeking to identify if the task difficulty de-creases as the users move from one task to the other. The values for both variables (measured difficulty and perceived difficulty) have a heterogeneous variation, with a frequent increase of difficulty for Task 2 or 3 compared to Task 1. Thus, in line with other studies [118,121–123], past experience proved to simplify the visualization format. Therefore, Hypothesis H4.2 is rejected, the learning process and memory not helping the users perform each subsequent task faster, only in a more linear way. Together with previous conclusions, this result proves once again that the ease of finding information on a website, implicitly the usability and UX, are strongly influenced by the layout and design of the webpage.
6. Conclusions and Recommendations The purpose of the current paper was to identify the elements, formats and struc-
tures of information that increase the usability of the landing page of a website; thus, being able to make several recommendations regarding layout and information structure that eases the users’ experience on a webpage. While the first sections of the paper pre-sent theoretical aspects about sustainable web design and ways to reach this goal, but also about neuromarketing and its application in marketing, the second part of the paper presents the results of an eye tracking study. Carried out as a combination between neuromarketing (eye tracking) study and survey (questionnaire), the study analyzed the online behavior of 22 subjects. The study used five banking webpages as stimuli and proposed to the subject three tasks to be performed (identifying three types of infor-mation on each website). Additionally, one minute free-viewing of each website was performed by each subject. During these four interactions of the subjects with the webpages, an eye tracker recorded their gaze and offered the researchers information like fixation location and duration, saccades or revisits of the same elements. The subjects’ perceptions about the five websites content, layout and design were expressed by an-swering the questionnaire. By using both subjective (expressed) and objective (measured) variables of visual attention, the researchers could draw a series of conclusions regarding the impact of web design on user experience.
In terms of methodological approach, the main difference between the present study and other similar research is that the subject had both free-viewing and task-solving in-teractions with the stimuli; thus, allowing the researchers to compare visual behaviors for each scenario. Given that the order of the stimuli was of no importance, the webpages were not randomized but shown to the participants in the same order; this allowed for the comparison of visual behavior under a standardized stimulus input.
While many diverse outcomes were obtained from the analyzed data, several main ideas can be underlined, together with their practical implication in web design. Thus, one of the main outcomes was that we confirmed the results of other studies [64,79,86,98,106,107,120], showing that the structure of information and layout proved to influence usability more than users’ experience with the website. Regarding the best ap-proaches to attract attention, the following results are useful for web developers, as they can contribute to one of the two possible objectives: (1) design the webpage so that the user finds the needed information as easy as possible, spending a short time on the webpage for fulfilling a task or (2) ensure a pleasant experience, thus a longer stay on the webpage and full visual coverage of the content, for explorative visits of the webpage. Thus, in terms of position and layout, several results present preferable approaches: the top and right sides of the webpage proved to receive most of the attention, and the main carousel (upper side) is usually the first to be visualized. The information presented here had a higher memorization rate. The least viewed area of the website is the lower part.

Sustainability 2021, 13, 10415 24 of 31
This information is valuable when considering where to position certain data on a web-site, as it shows where the users will look first and where it would be ideal to position information that is vital to be seen and remembered.
Besides position, several tips on how to attract and retain attention resulted from the research. In terms of font and color use, the use of two different fronts within a section proved to attract attention. Using intense colors can have the same impact. Displaying too many types of fonts of too many different colors can become tiring and annoying for the user.
When comparing pictures, text, tables and graphics as forms to present information on a website, the most efficient option was the picture, as they are viewed earlier, for a longer period of time and allow better memorization compared to text. Of all picture types, the ones depicting persons seem to catch the eye the most. It is evident that many types of information must be put in words; in this case, the present study showed that text has a better chance to be read when it is not very long, does not use specialized words or when a picture is shown beside the text. In terms of numerical data, the tabular or graphical choice would be the best, as it offers the user an easier to comprehend for-mat.
The appearance of the content itself is not the only important factor; the main structure of the webpage had a great influence on the users’ behavior on the website. In order to make information visually pleasing, either easy to find or interesting to read until the end, chaotic page arrangement should be avoided. Thus, the use of boxes for delimitating types of information/services proved to guide the viewer in a vertical and horizontal way, increasing predictability of what type of information will be present in each box. Similarly, the use of buttons and suggestive symbols attract attention and guide the view throughout the webpage, increasing full visual coverage. Even if the lower sec-tion of the webpage proved to be very seldom or only shortly viewed, the use of pictures, buttons or symbols in this area decreases the chances for the information presented in this area to be ignored.
The following section presents these conclusions in a visual form (Figure 3), pro-posing a webpage layout that might prove useful, no matter the field of activity.

Sustainability 2021, 13, 10415 25 of 31
Figure 3. Recommendation for landing page layout and structure.

Sustainability 2021, 13, 10415 26 of 31
Author Contributions: Conceptualization, M.T.Ț., M.Ț., I.C. and G.O.; methodology M.Ț., G.O. and I.C.; software, M.T.Ț.; validation, M.Ț., G.O. and I.C.; formal analysis, M.T.Ț. and M.Ț.; fund-ing acquisition M.Ț.; investigation, M.T.Ț. and I.C.; resources, I.C.; writing—original draft prepa-ration, M.T.Ț., M.Ț. and I.C.; writing—review and editing, M.T.Ț., M.Ț., I.C. and G.O.; visualiza-tion, M.T.Ț.; supervision G.O. All authors have read and agreed to the published version of the manuscript.
Funding: Project financed by Lucian Blaga University of Sibiu & Hasso Plattner Foundation re-search grants LBUS-IRG-2020-06.
Institutional Review Board Statement: Ethical review and approval were waived for this study, due to the fact that the researchers did not manipulate the subjects, their choices or their usual state in any way; following their consent, their voluntary and uninfluenced behavior was externally observed.
Informed Consent Statement: Informed consent was obtained from all subjects involved in the study.
Data Availability Statement: Other analysis of the data used in the present study is openly avail-able at: https://doi.org/10.2478/sbe-2019-0034 and https://doi.org/10.24818/18423264/53.4.19.08 (ac-cessed on 8 March 2021).
Conflicts of Interest: The authors declare no conflict of interest.
References 1. Warde, P. The invention of sustainability. Mod. Intellect. Hist. 2011, 8, 153–170. 2. Purvis, B.; Mao, Y.; Robinson, D. Three pillars of sustainability: In search of conceptual origins. Sustain. Sci. 2019, 14, 681–695. 3. Hansmann, R.; Mieg, H.A.; Frischknecht, P. Principal sustainability components: Empirical analysis of synergies between the
three pillars of sustainability. Int. J. Sustain. Dev. World Ecol. 2012, 19, 451–459. 4. United Nations. Our Common Future-Report of the World Commission on Environment and Development. 1987. Available
online: https://sustainabledevelopment.un.org/content/documents/5987our-common-future.pdf (accessed on 8 March 2021). 5. Feldmann, A.; Gasser, O.; Lichtblau, F.; Pujol, E.; Poese, I.; Dietzel, C.; Wagner, D.; Wichtlhuber, M.; Tapidor, J.;
Vallina-Rodriguez, N.; et al. The Lockdown Efect: Implications of the COVID-19 Pandemic on Internet Trafic. In Proceedings of the ACM Internet Measurement Conference, Virtual conference, 27–29 October 2020.
6. Cegan, L.; Filip, P. Advanced web analytics tool for mouse tracking and real-time data processing. In Proceedings of the IEEE 14th International Scientific Conference on Informatics, Poprad, Slovakia, 14–16 November 2017; pp. 431–435.
7. Fedushko, S.; Ustyianovych, T.; Syerov, Y.; Peracek, T. User-Engagement Score and SLIs/SLOs/SLAs Measurements Correlation of E-Business Projects Through Big Data Analysis. Appl. Sci. 2020, 10, 9112.
8. Sundar, P. Our Third Decade of Climate Action: Realizing a Carbon-Free Future. Available online: https://blog.google/outreach-initiatives/sustainability/our-third-decade-climate-action-realizing-carbon-free-future/ (accessed on 8 March 2021).
9. James, C. Sustainable Web Design. Available online: https://alistapart.com/article/sustainable-web-design/ (accessed on 8
March 2021). 10. Belkhir, L.; Elmeligi, A. Assessing ICT global emissions footprint: Trends to 2040 & recommendations. J. Clean. Prod. 2018, 177,
448–463. 11. McGoven, G. World Wide Waste: How Digital Is Killing Our Planet—and What We Can Do About It; Silver Beach: Amherst, MA,
USA, 2020. 12. Greenwoond, T. Sustainable Web Design; A book Apart: New York, NY, USA, 2021. 13. Take Action for the Sustainable Development Goals. Available online:
https://www.un.org/sustainabledevelopment/sustainable-development-goals/ (accessed on 7 August 2021). 14. Frick, T. Designing for Sustainability. A Guide to Building Greener Digital Products and Services; O'Reilly Media: Sebastopol, CA,
USA, 2016. 15. Sustainable Consumption and Production and Sustainable Industrial Policy Action Plan—Council conclusions. Available
online: https://data.consilium.europa.eu/doc/document/ST-16914-2008-INIT/en/pdf (accessed on 7 August 2021). 16. Casalo, L.; Flavian, C.; Guinaliu, M. The role of perceived usability, reputation, satisfaction and consumer familiarity on the
website loyalty formation process. Comput. Hum. Behav. 2008, 24, 325–345. 17. Lee, Y.; Kozar, K.A. Understanding of website usability: Specifying and measuring constructs and their relationships. Decis.
Support Syst. 2012, 52, 450–463. 18. Sauro, J.; Lewis, J.R. Quantifying the User Experience: Practical Statistics for User Research; Elsevier Inc.: Cambridge, MA, USA,
2012. 19. Li, L.; Peng, M.; Jiang, N.; Law, R. An empirical study on the influence of economy hotel website quality on online booking
intentions. Int. J. Hosp. Manag. 2017, 63, 1–10.

Sustainability 2021, 13, 10415 27 of 31
20. International Organisation for Standardisation. Ergonomics of Human-System Interaction—Part 11: Usability: Definitions and Concepts (ISO 9241-11:2018), 2018. Available online: https://www.iso.org/obp/ui/#iso:std:iso:9241:-11:ed-2:v1:en (accssed on 7 August 2021).
21. Palmer, J.W. Web site usability, design, and performance metrics. Inf. Syst. Res. 2002, 13, 151–167. 22. Sonderegger, A.; Sauer, J. The influence of design aesthetics in usability testing: Effects on user performance and perceived
usability. Appl. Ergon. 2010, 41, 403–410. 23. Lallemand, C.; Gronier, G.; Koenig, V. User experience: A concept without consensus? Exploring practitioners’perspectives
through an international survey. Comput. Hum. Behav. 2015, 43, 35–48. 24. Norman, D.; Miller, J.; Henderson, A. What you see, some of what’s in the future, and how we go about doing it: HI at apple
computer. In Proceedings of the ACM Conference on Human Factors in Computing Systems (CHI 1995), Denver, CO, USA, 7–11 May 1995.
25. Alben, L. Quality of experience: Defining the criteria for effective interaction design Interactions. Interactions 1996, 3, 11–15. 26. Shackel, B. Usability—Context, framework, definition, design and evaluation. Interact. Comput. 2009, 21, 339–346. 27. Kaya, B.; Behravesh, E.; Abubakar, A.M.; Kaya, O.S.; Orús, C. The Moderating Role of Website Familiarity in the Relationships
Between e-Service Quality, e-Satisfaction and e-Loyalty. J. Internet Commer. 2019, 18, 369–394. 28. Eroglu, S.A.; Machleit, K.A.; Davis, L.M. Empirical Testing of a model of online atmospherics and shopper responses. Psychol.
Mark. 2003, 20, 139–150. 29. Dailey, L. Navigational web atmospherics: Explaining the influence of restrictive navigation cues. J. Bus. Res. 2004, 57, 795–
803. 30. Wells, J.; Draganova, C. Progressive enhancement in the real world. In Proceedings of the Eighteenth Conference on
Hypertext and Hypermedia, Manchester, UK, 10–12 September 2007. 31. Wedel, M.; Pieters, R. Eye fixations on advertisements and memory for brands: A model and findings. Mark. Sci. 2000, 19, 297–
312. 32. Winer, R.S. New communications approaches in marketing: Issues and research directions. J. Interact. Mark. 2009, 23, 108–117. 33. Cătoiu, I.; Teodorescu, N. Comportamentul Consumatorului, 2nd ed.; Uranus: București, Romania, 2004. 34. Falbene, T.; Andersen, K.; Fedriksen, M.M. The Ethical Design Handbook. Smashing Media AG: Freiburg, Germany, 2020. 35. Nielsen, J. Designing Web Usability; New Riders: Indianapolis, IN, USA, 2000. 36. Hunter, R.; Mukerji, B. The Role of Atmospherics in Influencing Consumer Behaviour in the Online Environment. Int. J. Bus.
Soc. Sci. 2011, 2, 118–125. 37. Gorn, G.J.; Chattopadhyay, A.; Yi, T.; Dahl, D.W. Effects of color as an executional cue in advertising: They’re in the shade.
Manag. Sci. 1997, 43, 1387–1400. 38. Labrecque, L.I.; Milne, G.R. Exciting red and competent blue: The importance of color in marketing. J. Acad. Mark. Sci. 2012, 40,
711–727. 39. Seimienea, E.; Kamarauskaiteb, E. Effect of brand elements on brand personality perception. Procedia Soc. Behav. Sci. 2014, 156,
429–434. 40. Gorn, G.J.; Chattopadhyay, A.; Sengupta, J.; Tripathi, S. Waiting for the web: How screen color affects time perception. J. Mark.
Res. 2004, 41, 215–225. 41. Arabi, A. Influence Of Colors On Consumer Behavior “Conceptual And Theoretical Approaches”. Ann. „Constantin Brâncuşi”
Univ. Târgu Jiueconomy Ser. 2017, 3, 163–170. 42. Van Rompay, T.J.L.; de Vries, P.; van Venrooij, X.G. More than Words: On the Importance of Picture—Text Congruence in the
Online Environment. J. Interact. Mark. 2010, 24, 22–30. 43. Quester, P.G.; Pettigrew, S.; Kopanidis, F.; Hill, S.R.; Hawkins, D.I. Consumer Behaviour: Implications for Marketing Strategy, 8th
ed.; McGraw-Hill Education: Sydney, Australia, 2015. 44. Piwowarski, M. Neuromarketing tools in studies on models of social issue advertising impact on recipients. In Problems,
Methods and Tools in Experimental and Behavioral Economics; Springer: Berlin/Heidelberg, Germany, 2018; pp. 99–111. 45. Jutte, R. A History of the Senses: From Antiquity to Cyberspace; Polity Press: Cambridge, UK, 2005. 46. Mohr, G.S.; Lichtenstein, D.R.; Janiszewski, C. The Effect of Marketer-Suggested Serving Size on Consumer Responses: The
Unintended Consequences of Consumer Attention to Calorie Information. J. Mark. 2012, 76, 59–75. 47. Lewis, D.; Fisma, P. Everything you Wanted to Know about Neuromarketing but you didn’t Know who to Ask. Available
online: http://neuromarketingbyprofprasadkulkarni.blogspot.com/2012/06/everything-you-wanted-to-know-about.html (accessed on 10 March 2021).
48. Brenninkmeijer, J.; Schneider, T.; Woolgar, S. Witness and Silence in Neuromarketing: Managing the Gap between Science and Its Application. Sci. Technol. Hum. Values 2019, 45, 1–25.
49. Sánchez-Fernández, J.; Casado-Aranda, L.A.; Bastidas-Manzano, A.B. Consumer Neuroscience Techniques in Advertising Research: A Bibliometric Citation Analysis. Sustainability 2021, 13, 1589.
50. Damasio, A.R. Descartes' Error: Emotion, Reason, and the Human Brain; Grosset/Putnam: New York, NY, USA, 1994. 51. Damasio, A.R. The Feeling of What Happens: Body and Emotion in the Making of Consciousness; Harcourt Brace & Co.: New York,
NY, USA, 1999. 52. Kahneman, D. Thinking Fast and Slow; Farrar, Straus and Giroux: New York, NY, USA, 2011. 53. Loewenstein, G.F.; Weber, E.U.; Hsee, C.K.; Welch, N. Risk as feelings. Psycholog. Bull. 2001, 127, 267–286.

Sustainability 2021, 13, 10415 28 of 31
54. Damásio, A.R. The Strange Order of Things: Life, Feeling, and the Making of Cultures; Pantheon Books: New York, NY, USA, 2018. 55. Bechara, A.; Damasio, A.R.; Damasio, H.; Anderson, S.W. Insensitivity to future consequences following damage to human
prefrontal cortex. Cognition 1994, 50, 7–15. 56. Bechara, A.; Tranel, D.; Damasio, H.; Damasio, A.R. Failure to respond autonomically to anticipated future outcomes
following damage to prefrontal cortex. Cereb. Cortex 1996, 6, 215–225. 57. Bechara, A.; Damasio, H.; Damasio, A.R.; Lee, G.P. Different contributions of the human amygdala and ventromedial
prefrontal cortex to decision-making. J. Neurosci. 1999, 19, 5473–5481. 58. Damasio, A.R.; Tranel, D.; Damasio, H.C. Somatic markers and the guidance of behaviour: Theory and preliminary testing. In
Frontal Lobe Function and Dysfunction; Levin, H.S., Eisenberg, H.M., Benton, A.L., Eds.; Oxford University Press: Oxford, UK, 1991; Chapter 11, pp. 217–229.
59. Bechara, A.; Damasio, A.R. The somatic marker hypothesis: A neural theory of economic decision. Games Econ. Behav. 2005, 52, 336–372.
60. Plassman, H.; Ramsřy, T.Z.; Milosavljevic, M. Branding the brain: A critical review and outlook. J. Consum. Psychol. 2012, 22, 18–36.
61. Breiter, H.C.; Block, M.; Blood, A.J.; Calder, B.; Chamberlain, L.; Lee, N.; Livengood, S.; Mulhern, F.J.; Raman, K.; Schultz, D.; et al. Redefining neuromarketing as an integrated science of influence. Front. Hum. Neurosci. 2015, 8, 1073.
62. Lee, N.; Broderick, A.J.; Chamberlain, L. What is “neuromarketing”? A discussion and agenda for future research. Int. J. Psychophysiol. 2007, 63, 199–204.
63. Babiloni, F.; Cherubino, P. Neuromarketing. In Reference Module in Neuroscience and Biobehavioral Psychology; Elsevier: Amsterdam, The Netherlands, 2020.
64. Arch, D.C. Pupil dilation measures in consumer research: Applications and limitations. Adv. Consum. Res. 1979, 6, 166–168. 65. Levallois, C.; Smidts, A.; Wouters, P. The emergence of neuromarketing investigated through online public communications
(2002–2008). Bus. Hist. 2021, 63, 443–466. 66. Smidts, A. Looking into the Brain: On the Prospects of Neuromarketing. Available online: https://repub.eur.nl/pub/308
(accessed on 10 March 2021). 67. Calvert, G.A.; Thensen, T. Multisensory integration: Methodological approaches and emerging principles in the human brain.
J. Psychol. 2004, 98, 191–205. 68. Kenning, P.; Plassmann, H. NeuroEconomics: An Overview from an Economic Perspective. Brain Res. Bull. 2005, 67, 343–354. 69. Zurawicki, L. Neuromarketing, Exploring the Brain of the Consumer; Springer: Berlin/Heidelberg, Germany, 2010. 70. Constantinescu, M.; Orindaru, A.; Pachitanu, A.; Rosca, L.; Caescu, S.C.; Orzan, M.C. Attitude Evaluation on Using the
Neuromarketing Approach in Social Media: Matching Company’s Purposes and Consumer’s Benefits for Sustainable Business Growth. Sustainability 2019, 11, 7094.
71. Orzan, G.; Zara, I.A.; Purcarea, V.L. Neuromarketing techniques in pharmaceutical drugs advertising. A discussion and agenda for future research. J. Med. Life 2012, 5, 428–432.
72. Tatler, W.B. Did Javal measure eye movements during reading? J. Eye Mov. Res. 2008, 2, doi: 10.16910/jemr.2.5.5. 73. Bojko, A. Eye Tracking the User Experience: A Practical Guide to Research, 1st ed.; Rosenfeld Media: New York, NY, USA, 2013. 74. Noton, D.; Stark, L. Scanpaths in saccadic eye movements while viewing and recognizing patterns. Vis. Res. 1971, 11, 929–IN8. 75. Noton, D.; Stark, L. Scanpaths in Eye Movements During Pattern Perception. Science 1971, 171, 308–311. 76. Salvuci, D.; Goldberg, J. Identifying fixations and saccades in eye-tracking protocols. In Proceedings of the 2000 Symposium
on Eye Tracking Research & Applications, Palm Beach, FL, USA, 6–8 November 2000; pp. 71–78. 77. Holzman, P.S.; Leonard, R.P.; Hughes,D.W. Eye-tracking patterns in schizophrenia. Science 1973, 181, 179–181. 78. Jacob, R.J. The use of eye movements in human-computer interaction techniques: What you look at is what you get. ACM
Trans. Inf. Syst. 1991, 9, 152–169. 79. Lohse, G.L. Consumer eye movement patterns on yellow pages advertising. J. Advert. 1997, 26, 61–73. 80. Granka, L.A.; Joachims, T.; Gay, G. Eye-tracking analysis of user behavior in WWW search. In Proceedings of the 27th Annual
International ACM SIGIR Conference on Research and Development in Information Retrieval, Sheffield, UK, 25–27 July 2004; pp. 478–479.
81. Pieters, R.; Wedel, M. Goal control of visual attention to advertising: The Yarbus implication. J. Consum. Res. 2007, 34, 224–233. 82. Velasquez, C.E.; Pasch, K.E. Attention to food and beverage advertisements as measured by eye-tracking technology and the
food preferences and choices of youth. J. Acad. Nutr. Diet. 2014, 114, 578–582. 83. Falk, E.B.; O'Donnell, M.B.; Tompson, S. Functional brain imaging predicts public health campaign success. Soc. Cogn. Affect.
Neurosci. 2016, 11, 204–214. 84. Vezich, I.S.; Gunter, B.C.; Lieberman, M.D. The mere green effect: An fMRI study of pro-environmental advertisements. Soc.
Neurosci. 2016, 12, 400–408. 85. Fidelis, B.T.; Oliveira, J.H.C.; Giraldi, J.E.; Santos, R.O.J. Sexual appeal in print media advertising: Effects on brand recall and
fixation time. Res. J. Text. Appar. 2017, 21, 42–58. 86. Trettel, A.; Cherubino,P.; Cartocci, G.; Rossi, D.; Modica, E.; Maglione, A.G.; di Flumeri, G.; Babiloni, F. Transparency and
Reliability in Neuromarketing Research. In Ethics and Neuromarketing; Springer: Cham, Switzerland, 2017; pp. 101–111. 87. Cetina, I.; Orzan, G.; Dumitrescu, L.; Fuciu, M.; Stoicescu, C. Modelling the Influences of Online Social Networks on
Consumers' Buying Behaviour. Econ. Comput. Econ. Cybern. Stud. Res. 2018, 52, 5–20.

Sustainability 2021, 13, 10415 29 of 31
88. Munoz-Leiva, F.; Hernandez-Mendez, J.; Gomez-Carmona, D. Measuring advertising effectiveness in Travel 2.0 websites through eye-tracking technology. Physiol. Behav. 2019, 200, 83–95.
89. Milosavljevic, M.; Koch, C.; Rangel, A. Consumers can make choices in as little as a third of a second. Judgm. Decis. Mak. 2011, 6, 520–530.
90. Koenigstorfer, J.; Wasowicz-Kirylo, G.; Stysko-Kunkowska, M.; Groeppel-Klein, A. Behavioural effects of directive cues on front of package nutrition information: The combination matters! Public Health Nutr. 2014, 17, 2115–2121.
91. Laeng, B.; Suegami, T.; Aminihajibashi, S. Wine labels: An eye-tracking and pupillometry study. Int. J. Wine Bus. Res. 2016, 28, 327–348.
92. Boz, H.; Arslan, A.; Koc, E. Neuromarketing aspect of tourısm pricing psychology. Tour. Manag. Perspect. 2017, 23, 119–128. 93. Nissbet, R.E.; Wilson, T.D. Telling more than we can know: Verbal reports on mental processes. Psychol. Rev. 1977, 84, 231–
259. 94. Efron, R.; Yund, E.W. Spatial nonuniformities in visual search. Brain Cogn. 1996, 31, 331–368. 95. Durgin, F.H.; Doyle, E.; Egan, L. Upper-left gaze bias reveals competing search strategies in a reverse Stroop task. Acta Psychol.
2008, 127, 428–448. 96. Ariely, D.; Berns, G. Neuromarketing: The hope and hype of neuroimaging in business. Nat. Rev. Neurosci. 2010, 11, 284–292. 97. Hernández-Fernández, A.; Mora, E.; Hernández, M.I.V. When a new technological product launching fails: A multi-method
approach of facial recognition and E-WOM sentiment analysis. Physiol. Behav. 2019, 200, 130–138. 98. Pan, B.; Granka, L.A.; Hembrooke, H.A.; Feusner, M.K.; Gay, G.K.; Newman, J.K. The Determinants of Web Page Viewing
Behavior: An Eye-Tracking Study. In Proceedings of Eye-Tracking Research & Application Symposium (ETRA 04), San Antoni, TX, USA, 22–24 March 2004; ACM: New York, NY, USA; pp. 147–154.
99. Lee, H.; Lee, J.; Seo, S. Brain Response to Good and Bad Design. In Human-Computer Interaction; Jacko, J.A., Ed.; Springer: Berlin/Heidelberg, Germany, 2009.
100. Djamasbi, S.; Siegel, M.; Tullis, T. Generation Y, web design, and eye tracking. Int. J. Hum. Comput. Stud. 2010, 68, 307–323. 101. Bergstrom, J.C.R.; Olmsted-Hawala, E.L.; Jans, M.E. Age-Related Differences in Eye Tracking and Usability Performance:
Website Usability for Older Adults. Int. J. Hum. Comput. Interact. 2013, 29, 541–548. 102. Hernandez, M.; Wang, Y.; Sheng, H.; Kallini, M. Escaping the corner of death? An eye-tracking study of reading direction
influence on attention and memory. J. Consum. Mark. 2017, 34, 1–10. 103. Cyr, D.; Headb, M.; Larios, H. Colour appeal in website design within and across cultures: A multi-method evaluation. Int. J.
Hum. Comput. Stud. 2010, 68, 1–21. 104. Lee, H.; Seo, S. A Comparison and Analysis of Usability Methods for Web Evaluation: The Relationship Between Typical
Usability Test and Bio-Signals Characteristics (EEG, ECG). Available online: http://www.drs2010.umontreal.ca/data/DRS2010web.pdf (accessed on 10 March 2021).
105. Loyola, P.; Martinez, G.; Muñoz, K.; Velásquez, J.D.; Maldonado, P.; Couve, A. Combining eye tracking and pupillary dilation analysis to identify Website Key Objects. Neurocomputing 2015, 168, 179–189.
106. Wang, Q.; Yang, S.; Liu, M.; Cao, Z.; Ma, Q. An eye-tracking study of website complexity from cognitive load perspective. Decis. Support Syst. 2014, 62, 1–10.
107. Zlokazova, T.; Blinnikova, I.; Grigorovich, S.; Burmistrov, I. Search Results on Flight Booking Websites: Displaying Departure and Return Flights on a Single Page vs. Two Consecutive Pages. In Human-Computer Interaction 2019—INTERACT 2019; Springer: Berlin/Heidelberg, Germany, 2019; pp. 668–671.
108. Țichindelean, M.T.; Țichindelean, M. A study of banking marketers’ perception regarding the use of neuromarketing techniques in banking services. Ann. Univ. Apulensis Ser. Oeconomica 2019, 21, 73–82.
109. Bucher, H.J.; Schumacher, P. The relevance of attention for selecting news content. An eye-tracking study on attention patterns in the reception of print and online media. Communications 2006, 31, doi:10.1515/COMMUN.2006.022.
110. Matzen, L.E.; Haass, M.J.; Divis, K.M.; Stites, M.C. Patterns of attention: How data visualizations are read. In International Conference on Augmented Cognition; Springer: Cham, Switzerland, 2017; pp. 176–191.
111. Pieters, R.; Wedel, M. Attention capture and transfer in advertising: Brand, pictorial, and text-size effects. J. Mark. 2004, 68, 36–50.
112. Bonnardel, N.; Piolat, A.; Le Bigot, L. The Impact Of Color On Website Appeal And Users’ Cognitive Processes. Displays 2011, 32, 69–80.
113. Pinto, Y.; van der Leij, A.; Sligte, I.G.; Lamme, V.A.F.; Scholte, H.S. Bottom-up and top-down attention are independent. J. Vis. 2013, 13, 1–14.
114. Connor, C.E.; Egeth, H.E.; Yantis, S. Visual attention: Bottom-up versus top-down. Curr. Biol. 2004, 14, R850–R852. 115. Hung, J.C.; Wang, C.C. Exploring the website object layout of responsive web design: Results of eye tracking evaluations. J.
Supercomput. 2020, 77, 343–365. 116. Buscher, G.; Cutrell, E.; Morris, M.R. What do you see when you're surfing? Using eye tracking to predict salient regions of
web pages. In Proceedings of the SIGCHI Conference on Human Factors in Computing Systems, Boston, MA, USA, 4–9 April 2009; pp. 21–30.
117. Andrzejewska, M.; Stolińska, A. Eye-tracking and the tasks difficulty. J. Eye Mov. Res. 2016, 9, 1–16.

Sustainability 2021, 13, 10415 30 of 31
118. Goldberg, J.H.; Helfman, J.I. Comparing information graphics: A critical look at eye tracking. In Proceedings of the 3rd BELIV'10 Workshop: Beyond Time and Errors: Novel Evaluation Methods for Information Visualization, Atlanta, GA, USA, 10–11 April 2010; pp. 71–78.
119. Goldgerb, J.H.; Stimson, M.J.; Lewenstein, M.; Scott, N.; Wichansky, A.M. Eye tracking in web search tasks: Design implications. In Proceedings of the 2002 Symposium on Eye Tracking Research & Applications, New Orleans, LA, USA, 25–27 March 2002.
120. Bojko, A. Using Eye Tracking to Compare Web Page Designs: A Case Study. J. Usability Stud. 2006, 1, 112–120. 121. Poole, A.; Ball, L.J. Eye tracking in HCI and usability research. In Encyclopedia of Human Computer Interaction; Ghaoui, C., Ed.;
IGI Global: Hershey, PA, USA, 2006; pp. 211–219. 122. Fu, B.; Noy, N.F.; Storey, M.A. Eye tracking the user experience—An evaluation of ontology visualization techniques. Semant.
Web 2017, 8, 23–41. 123. Duchowski, A.T. A Breadth-First Survey of Eye Tracking Applications. Behav. Res. Methods Instrum. Comput. 2002, 34, 455–470. 124. Danaher, P.J.; Mullarkey, G.W. Factors affecting online advertising recall: A study of students. J. Advert. Res. 2003, 43, 252–267. 125. Andrzejewska, M.; Stolińska, A. Comparing the difficulty of tasks using eye tracking combined with subjective and
behavioural criteria. J. Eye Mov. Res. 2016, 9, doi: 10.16910/jemr.9.3.3. 126. Reicher, G.M.; Snyder, C.R.R.; Richards, J.T. Familiarity of background characters in visual scanning. J. Exp. Psychol. Hum.
Percept. Perform. 1976, 2, 522–530. 127. Wang, Q.; Cavanagh, P.; Green, M. Familiarity and pop out in visual search. Percept. Psychophys. 1994, 56, 495–500. 128. Josephson, S.; Holmes, M.E. Visual Attention to Repeated Internet Images: Testing the Scanpath Theory on the World Wide
Web. In Proceedings of the Eye Tracking Research & Applications (ETRA) Symposium, New Orleans, LA, USA, 25–27 March 2002; ACM: New York, NY, USA, 2002; pp. 43–51.
129. Nielsen, J.; Pernice, K. Eyetracking Web Usability; New Riders: Indianapolis, IN, USA, 2010. 130. Stanford Poynter Project. Front Page Entry Points. Available online:
https://news.stanford.edu/news/2000/may10/eyetrack-55.html (accessed on 6 August 2021). 131. Rayner, K.; Rottello, C.M.; Stewart, A.J.; Keir, J.; Duffy, S.A. Integrating Text and Pictorial Information: Eye Movements when
Looking at Print Advertisements. J. Exp. Psychol. Appl. 2001, 7, 219–226. 132. Wu, K.; Vassileva, J.; Zhao, Y.; Noorian, Z.; Waldner, W.; Adaji, I. Complexity or simplicity? Designing product pictures for
advertising in online marketplaces. J. Retail. Consum. Serv. 2016, 28, 17–27. 133. Le Meur, O.; Liu, Z. Saccadic model of eye movements for freeviewing condition. Vis. Res. 2015, 116, 152–164. 134. Li, Q.; Huang, Z.; Christianson, K. Visual attention toward tourism photographs with text: An eye-tracking study. Tour.
Manag. 2016, 54, 243–258. 135. Djamasbi, S. Eye tracking and web experience. AIS Trans. Hum. Comput. Interact. 2014, 6, 37–54. 136. Linderman, M.; Fried, J. Defensive Design for the Web: How to Improve Error Messages, Help, Forms, and Other Crisis Points; New
Riders Publishing: Thousand Oaks, CA, USA, 2004. 137. Miniukovich, A.; Scaltritti, M.; Sulpizio, S.; De Angeli, A. Guideline-based evaluation of web readability. In Proceedings of the
2019 CHI Conference on Human Factors in Computing Systems, Glasgow, UK, 4–9 May 2019; pp. 1–12. 138. Strick, M.; Holland, R.W.; Van Baaren, R.; Van Knippenberg, A. Humor in the eye tracker: Attention capture and distraction
from context cues. J. Gen. Psychol. Exp. Psychol. Comp. Psychol. 2009, 137, 37–48. 139. Bireta, T.J.; Simels, B.A. The isolation effect and advertising: Are unusual advertisements remembered better? In Applied
Memory; Kelley, M.R., Ed.; Nova Science Publishers: Hauppauge, NY, USA, 2009; pp. 57–72. 140. Beymer, D.; Orton, P.Z.; Russell, D.M. An Eye Tracking Study of How Pictures Influence Online Reading. In Human-Computer
Interaction—INTERACT 2007; Springer: Berlin/Heidelberg, Germany, 2007; pp. 456–460. 141. Childers, T.L. Memory for the visual and verbal components of print advertisements. Psychol. Mark. 1986, 3, 137–149. 142. Cyr, D.; Head, M.; Larios, H.; Pan, B. Exploring human images in website design: A multi-method approach. MIS Q. 2009, 33,
539–566. 143. Sajjacholapunt, P.; Ball, L.J. The influence of banner advertisements on attention and memory: Human faces with averted gaze
can enhance advertising effectiveness.Front. Psychol. 2014, 5, 166. 144. May, J.G.; Kennedy, R.S.; Williams, M.C.; Dunlop, W.P.; Brannan, J.R. Eye movement indices of mental workload. Acta Psychol.
1990, 75, 75–89. 145. Maynard, D.C.; Hakel, M.D. Effects of objective and subjective task complexity on performance. Hum. Perform. 1997, 10, 303–
330. 146. Kim, J.H. Task as a Predictable Indicator for Information Seeking Behavior on the Web. Ph.D. Thesis, SCILS, Rutgers
University, New Brunswick, NJ, USA, 2006, Unpublished. 147. Gwizdka, J.; Spence, I. What can searching behavior tell us about the difficulty of information tasks? A study of Web
navigation. Proc. Am. Soc. Inf. Sci. Technol. 2006, 43, 1–22. 148. Tufte, E.R. Visual Display of Quantitative Information; Graphics Press: Cheshire, CT, USA, 2001. 149. Resnick, M.L.; Maldonado, C.A.; Santos, J.M.; Lergier, R. Modeling On-line Search Behavior Using Alternative Output
Structures. In Proceedings of the Human Factors and Ergonomics Society 45th Annual Conference, Minneapolis, MN, USA, 8–12 October 2001.

Sustainability 2021, 13, 10415 31 of 31
150. Smerecnik, C.M.; Mesters, I.; Kessels, L.T.; Ruiter, R.A.; De Vries, N.K.; De Vries, H. Understanding the positive effects of graphical risk information on comprehension: Measuring attention directed to written, tabular, and graphical risk information. Risk Anal. Int. J. 2010, 30, 1387–1398.
151. Goldberg, J.; Helfman, J. Eye tracking for visualization evaluation: Reading values on linear versus radial graphs. Inf. Vis. 2011, 10, 182–195.
152. Scholz, M.; Dönges, C.; Dechant, C.; Endres, A. Theoretical and conceptual approaches to reduce reading barriers in natural scientific texts. Zeitschrift für Heilpädagogik 2016, 67, 454–464.
153. Detheridge, T.; Detheridge, M. Literacy through Symbols: Improving Access for Children and Adults, 2nd ed.; David Fulton: London, UK, 2002.