A Comparative Evaluation of TiO 2 Suspension Coating Techniques: A Novel Technique to Achieve...
9
Hindawi Publishing Corporation International Journal of Photoenergy Volume 2012, Article ID 634802, 9 pages doi:10.1155/2012/634802 Research Article A Comparative Evaluation of TiO 2 Suspension Coating Techniques: A Novel Technique to Achieve Optimal Thickness and Uniformity of Photocatalytic Film Masoud Rismanchian, 1, 2 Farideh Golbabaei, 1 Yadollah Mortazavi, 3 Gholamhossein Pourtaghi, 4 Abbas Rahimi Foroushani, 5 and Parvin Nassiri 1 1 Department of Occupational Health Engineering, School of Public Health, Tehran University of Medical Sciences, Tehran 1417613151, Iran 2 Department of Occupational Health Engineering, School of Health, Isfahan University of Medical Sciences, Isfahan 8174673461, Iran 3 School of Chemical Engineering, College of Engineering, University of Tehran, Tehran, Iran 4 Health Research Center, Baqiyatallah University of Medical Sciences, Tehran, Iran 5 Department of Epidemiology and Biostatistics, School of Public Health, Tehran University of Medical Sciences, Tehran, Iran Correspondence should be addressed to Farideh Golbabaei, [email protected] Received 25 August 2012; Revised 31 October 2012; Accepted 31 October 2012 Academic Editor: Leonardo Palmisano Copyright © 2012 Masoud Rismanchian et al. This is an open access article distributed under the Creative Commons Attribution License, which permits unrestricted use, distribution, and reproduction in any medium, provided the original work is properly cited. The most important parameters affecting the efficiency of catalysts for the oxidation of the surrounding materials are considered to be the thickness and uniformity of the catalyst layer. The present method for the determination of thickness used in most studies is the analysis of cross-sectional pictures from SEM imaging. This method, however, has several restrictions. This study proposes a feasible and simple method for evaluating the optimal thickness and uniformity using UVA light transmitted through the samples. Three techniques for catalyst deposition have been investigated in this study using UVA light transmitted through the samples and by measuring the photocatalytic activity. These methods include lowering, dip coating, and spraying, which showed coefficients of variation for the coated catalyst weight of 28.4%, 13.6%, and 3.24%, respectively. The samples from the lowering, dip coating, and spraying techniques showed UVA transmissions of 95.02%, 68.8%, and 15.6%, respectively. The spraying technique displayed the lowest values for both. The estimated removal efficiencies (%RE/mg·cm −2 ) for lowering, dip coating, and spraying were 18.42, 16.84, and 24.15, respectively. Using these analyses it was determined that the spraying technique yielded the best photocatalytic oxidation performance of the three techniques studied. 1. Introduction Photocatalysts are a group of nanoscale semiconductor materials that are able to generate free radicals after being stimulated by photons of light at certain wavelengths [1]. The free radicals that are generated cause the photocatalytic oxidation of surrounding materials [2, 3]. A variety of materials possess this capability including TiO 2 , ZnO 2 , ZrO 2 , NiO 2 , Fe 2 O 3 , and hybrid catalysts [3, 4]. Of these materials, TiO 2 has been widely used due to its lower cost and toxicity as well as its higher accessibility [2, 4, 5]. When evaluating the photocatalytic performance of materials in removing compounds in the gas phase, it is necessary for the catalysts to be coated on a fixed [6–8] or mobilised bed [9, 10]. Researchers have applied different techniques for coating the surfaces [1, 11]. One of the simplest methods of coating uses a suspension that includes a prepared photocatalyst [11]. Three different techniques that have been used for this coating method include dip coating and pulling up the substrate at a constant speed (dip coating) [6], dip coating and evaporation of the solvent containing the photocatalyst
-
Upload
independent -
Category
Documents
-
view
0 -
download
0
Transcript of A Comparative Evaluation of TiO 2 Suspension Coating Techniques: A Novel Technique to Achieve...

Hindawi Publishing CorporationInternational Journal of PhotoenergyVolume 2012, Article ID 634802, 9 pagesdoi:10.1155/2012/634802
Research Article
A Comparative Evaluation of TiO2 Suspension CoatingTechniques: A Novel Technique to Achieve Optimal Thicknessand Uniformity of Photocatalytic Film
Masoud Rismanchian,1, 2 Farideh Golbabaei,1 Yadollah Mortazavi,3
Gholamhossein Pourtaghi,4 Abbas Rahimi Foroushani,5 and Parvin Nassiri1
1 Department of Occupational Health Engineering, School of Public Health, Tehran University of Medical Sciences,Tehran 1417613151, Iran
2 Department of Occupational Health Engineering, School of Health, Isfahan University of Medical Sciences,Isfahan 8174673461, Iran
3 School of Chemical Engineering, College of Engineering, University of Tehran, Tehran, Iran4 Health Research Center, Baqiyatallah University of Medical Sciences, Tehran, Iran5 Department of Epidemiology and Biostatistics, School of Public Health, Tehran University of Medical Sciences, Tehran, Iran
Correspondence should be addressed to Farideh Golbabaei, [email protected]
Received 25 August 2012; Revised 31 October 2012; Accepted 31 October 2012
Academic Editor: Leonardo Palmisano
Copyright © 2012 Masoud Rismanchian et al. This is an open access article distributed under the Creative Commons AttributionLicense, which permits unrestricted use, distribution, and reproduction in any medium, provided the original work is properlycited.
The most important parameters affecting the efficiency of catalysts for the oxidation of the surrounding materials are consideredto be the thickness and uniformity of the catalyst layer. The present method for the determination of thickness used in most studiesis the analysis of cross-sectional pictures from SEM imaging. This method, however, has several restrictions. This study proposes afeasible and simple method for evaluating the optimal thickness and uniformity using UVA light transmitted through the samples.Three techniques for catalyst deposition have been investigated in this study using UVA light transmitted through the samples andby measuring the photocatalytic activity. These methods include lowering, dip coating, and spraying, which showed coefficientsof variation for the coated catalyst weight of 28.4%, 13.6%, and 3.24%, respectively. The samples from the lowering, dip coating,and spraying techniques showed UVA transmissions of 95.02%, 68.8%, and 15.6%, respectively. The spraying technique displayedthe lowest values for both. The estimated removal efficiencies (%RE/mg·cm−2) for lowering, dip coating, and spraying were 18.42,16.84, and 24.15, respectively. Using these analyses it was determined that the spraying technique yielded the best photocatalyticoxidation performance of the three techniques studied.
1. Introduction
Photocatalysts are a group of nanoscale semiconductormaterials that are able to generate free radicals after beingstimulated by photons of light at certain wavelengths [1].The free radicals that are generated cause the photocatalyticoxidation of surrounding materials [2, 3]. A variety ofmaterials possess this capability including TiO2, ZnO2, ZrO2,NiO2, Fe2O3, and hybrid catalysts [3, 4]. Of these materials,TiO2 has been widely used due to its lower cost and toxicityas well as its higher accessibility [2, 4, 5].
When evaluating the photocatalytic performance ofmaterials in removing compounds in the gas phase, it isnecessary for the catalysts to be coated on a fixed [6–8] ormobilised bed [9, 10]. Researchers have applied differenttechniques for coating the surfaces [1, 11]. One of thesimplest methods of coating uses a suspension that includesa prepared photocatalyst [11].
Three different techniques that have been used for thiscoating method include dip coating and pulling up thesubstrate at a constant speed (dip coating) [6], dip coatingand evaporation of the solvent containing the photocatalyst

2 International Journal of Photoenergy
(lowering) [12], and the technique of spraying the photocat-alyst onto the surface (spraying) [13, 14].
The essential factor in order for these materials toshow photocatalytic activity is the potential for all of thephotocatalyst molecules to receive light irradiation withan appropriate wavelength. It is important, therefore, todetermine the optimal thickness of the film that ensures thepenetration of UV light throughout the entire depth of thephotocatalyst layer.
In the evaluation of the activity of a photocatalyst suchas TiO2, the performance is usually reported in terms of theremoval efficiency per milligram of catalyst in a given area. Ifthe irradiated light penetrates only some parts of the coatedlayer of a photocatalyst, then only a small portion of thephotocatalyst will be active.
If a photocatalyst’s performance is measured in terms ofremoval efficiency per milligram of catalyst per square cen-timetre of area that is receiving the light (%RE/mg−1·cm−2),the performance will be underestimated. Xianyu et al. haveconfirmed the influence of thickness on TiO2 photocatalystperformance and have shown that a thin layer of TiO2 filmwith a thickness of 670 nm has a photocatalytic activity only3.7 times that of films with a 70 nm thickness [15]. In anotherstudy conducted by Akhavan, the influence of thicknessfrom 10 to 50 nm on TiO2 antimicrobial performance wasinvestigated, and the optimum thickness of the TiO2 coatingwas 10 nm [16]. Chang et al. has studied the influence ofthickness and roughness of doped TiO2 films on ZnO2 andfound that increasing the thickness of the film from 30 nm to950 nm increased the roughness [17].
In the study of Bessergenev et al., the large range ofthe coating film thickness (30 to 2000 nm) illustrates theimportance of the thickness and uniformity of the sampleto be evaluated as well as its effect on the measuredphotocatalytic activity [1].
Another feature that can have an effect on the photocat-alytic activity is the uniformity of the coating layer on thefilm. As the uniformity of the coating layer increases, theaverage catalyst per square centimetre area will be closer tothe true value. In the case of complete uniformity of thecoating layer, these two values will be equal.
A review of the literature on this subject reveals thatdifferent techniques have been used to determine the pho-tocatalyst layer thickness.
In the study conducted by Bessergenev et al, the coatingfilm thickness has been measured by weight [1].
In several studies, Scanning Electron Microscopy (SEM)has been used to examine the thickness of the layer [6, 15,18–20]. In a study performed by de Groot and de Lega[21], a white-light scanning interferometer was applied toevaluate the surface profile of transparent layers. Comparingthe results of this technique with those using Atomic ForceMicroscopy (AFM), de Groot found this method to be veryeffective. The white-light scanning interferometer methodis a precise optical method that is able to scan surfacetopography. In a study by Blount, the photocatalyst layerthickness was evaluated using the weight of the coating [22].
Despite the extensive research and presentation of thesetechniques in assessing and describing the coating layer
0E+004E−078E−07
1.2E−061.6E−06
2E−062.4E−062.8E−06
Irra
dian
ce (
W/c
m2·n
m)
200
220
240
260
280
300
320
340
360
380
400
420
440
460
480
500
520
540
560
580
600
Wavelength (nm)
Figure 1: Irradiation spectrum of the UVA lamp used in this study.
thickness, it seems that a professional apparatus is needed.It is also important to note that the evaluation of thelayer thickness and uniformity is impossible using previouslyreported methods.
One important limitation of testing catalyst samples bySEM is that the sample must be destroyed during testing andcannot be measured for photocatalytic performance afterSEM imaging is completed. Furthermore, if results from SEMtesting indicate an inappropriate thickness or uniformity, allphotocatalytic tests should be repeated.
This study aimed to compare three catalyst coatingtechniques on a flat surface using the suspension methodwhile introducing a testing technique that is innovative,practical, and easy to use to control the uniformity of thesurface. Additionally, the method aimed to determine theoptimal thickness of photocatalyst samples (the thicknessin which the light irradiation is able to most completelypenetrate) using UVA transmittance through the samplesduring the coating stages.
2. Materials and Methods
Since the condition of composing TiO2 nanoparticles, spe-cially the calcination temperature [23] and crystallizationmethod [24], has been affected on the TiO2 photocatalyticperformance, commercial TiO2 (P25 with a specific area of50 ± 10 m2/g and an average particle size of 21 nm) wasused in this study as well as the gas chromatographic grademethanol (Merck, Germany). The substrate used was flatquartz (Shanghai Puya Quartz Glass Factory, China) with athickness of 3 mm and dimensions of 2.5 by 7 centimetres.The UVA light source used in this study was an 8 watt lampmade by Sylvania Company, Japan. The irradiation spectrumof the UV lamp is illustrated in Figure 1.
2.1. Catalyst Characterization. Regarding to this matter offact that all three techniques applied in this research do notcause any changes in crystallized properties of the samples[23, 24], the morphology experiments were carried out onthe primary photocatalyst.
The sample’s morphology and thickness were inves-tigated using a scanning electron microscope made bySERON Technology (AIS–2100) and Crystallinity of the TiO2
thin film was determined by X-Ray Diffraction (Bruker,DBADVANCE, Germany, X-Ray Tube Anode: Cu, Filter: Ni).

International Journal of Photoenergy 3
1
5
4
3
2
1. UVA lamp2. Quartz substrate coated with TiO2
3. UV detector4. UV meter5. UV detector position
Figure 2: Schematic diagram for the UVA transmission measure-ment apparatus.
The absorbance of the film was measured by Ultravioletvisible diffuse reflectance spectroscopy (Uv-vis-DRS: JASCOV-670, Japan) and The oxidation state of TiO2 was studiedby X-Ray photoelectron spectroscopy (XPS: VG Microtech8025-Twin anode X-Ray source-Germany).
2.2. Different Coating Techniques. Several coating techniqueshave been investigated in this study. The coating techniquesincluded dip coating and pulling up the film at a constantspeed (dip coating) [6], dip coating and evaporation of thesolvent containing the photocatalyst (lowering) [12], andthe technique of spraying the photocatalyst onto the surface(spraying) [25]. To avoid varying the TiO2 concentration inall these experiments, a 5% suspension of TiO2 in methanolwas prepared by ultrasonic mixing for 15 minutes using ahomogenizer apparatus (Bandelin, Germany).
All quartz substrates were used after washing twicewith distilled water followed by washing with methanol.The substrates were then dried in an autoclave at 120◦Covernight. A quartz film was chosen for these experimentsbecause its transparency is conducive to UV illumination[26].
The UVA detector used in these experiments (Laybold,Germany) had a 1 cm diameter, and UVA light was transmit-ted through the samples at 4 different points on the coatedsurface. The setup schematic and the points on the surface tobe examined in each sample are illustrated in Figure 2.
In the lowering technique [12], the film was placed ina watch glass horizontally and the catalyst solution wasadded to the point where it covered the surface. Aftersubmerging the film, the solution was heated to 80◦C untilit evaporated to dryness. The underlying substrate was thencleaned and weighed, and the uniformity test was performed
Figure 3: Custom-built apparatus for pulling up the substrate withconstant speed in the lowering technique.
by transmitting UVA light through the samples. The coatingof the samples was performed only once because light wasnot transmitted through the samples on more than oneoccasion.
An electromechanical device was designed and built forthe dip coating technique [6] (Figure 3) that had the abilityof moving the sample at a completely constant rate. Thesample in this experiment was pulled out of the photocatalystsolution at a speed of 10 mm/min, followed by removalof the photocatalyst coating on one side of the film. Thissection of the experiment was repeated and the samples weredried in an autoclave for 15 minutes at a temperature of100◦C. Subsequently, the samples were cooled in desiccatorscontaining silica gel and each one was weighed prior tobeing examined with the UVA light. The coating techniquewas repeated until the UVA light transmittance through thecoating reached zero at a minimum of one point. In otherwords, the coating was repeated so that the penetration ofthe UVA beam was ensured at the four points of the surfaceunderlying the film showing that the catalyst layer thicknesswas at its optimal level.
The third technique, spraying [25], was completed bygenerating a catalyst solution and pouring it in a paint sprayapparatus. The solution was then sprayed on the substratesurface with a constant speed of 4 cm/s, a flow rate of25 mL/min, and a pressure of 2 Barr. To meet the desiredparameters, the paint sprayer was fixed on a base and anelectromechanical apparatus was used to pass the samplesunder the sprayer at a constant velocity. In this technique,the catalyst sample was dried following each spraying at atemperature of 100◦C. The samples were then cooled in thedesiccator and weighed before being tested for uniformityusing UVA light. The number of spraying events for eachsample was chosen using the same criteria as the previoustechnique to ensure that the catalyst layer thickness was at itsoptimal level.
2.3. Photocatalytic Activity Measurement. Using each tech-nique separately, five laminates prepared were placed insidethe dynamic apparatus made for the evaluation of the

4 International Journal of Photoenergy
Table 1: Coating frequency, UVA transmittance, and catalyst coating weight results for the lowering technique.
Sample codeCoatingfrequency
Catalystweight (mg)
% UVA transmittance in 4 point
(reference irradiation 8 W·m−2) MeanStandarddeviation
1 2 3 4
G 1 39 12.4 16.1 7.2 5.5 7.8 3.1
K 1 67.3 0 6.1 2.3 4.4 3.2 2.64
E 1 84.8 0 0 3.5 1.8 1.3 1.68
P 1 83.1 2.6 1.4 0 0 1 1.25
L 1 58.6 9.8 1.1 3.4 6.9 5.3 3.83
1
2
3
33
3
4
56 6
7 To vent
1. Zero air2. Xylene in N2
3. Flow meter4. Temperature and humidity unit control5. Mixing chamber6. Sampling probe7. Photocatalytic reactor
Figure 4: Schematic diagram of the photocatalytic activity testapparatus for the determination of xylene removal efficiency forthe samples prepared by the lowering, dip coating, and sprayingtechniques.
photocatalytic performance of removing xylene from an airstream. The schematic design of this apparatus is presentedin Figure 4. The examination was conducted using the 8watt UVA lamps used in the first part of the research andmeasuring the xylene concentration in both the input (Cin)and the output (Cout) of the reactor using a PID detector.Using this method, the removal efficiency of xylene wasobtained from an initial concentration of 30 ppm, an air flowrate of 220 mL/min, and relative humidity of 50%. Removalefficiency is calculated by the following equation:
Removal efficiency (RE%) = Cin − Cout
Cin× 100. (1)
The PID system performance has been confirmed in anotherstudy [27]. The results from each test are reported in termsof removal efficiency of the photocatalyst in mg/cm2 of eachsample.
(a)
(b)
(c)
Figure 5: Scanning electron microscopy of the samples prepared bythe lowering (a), dip coating (b), and spraying techniques (c).
3. Results
3.1. Sample Characterization. The cross-sectional imagesfrom the SEM are illustrated in Figure 5.
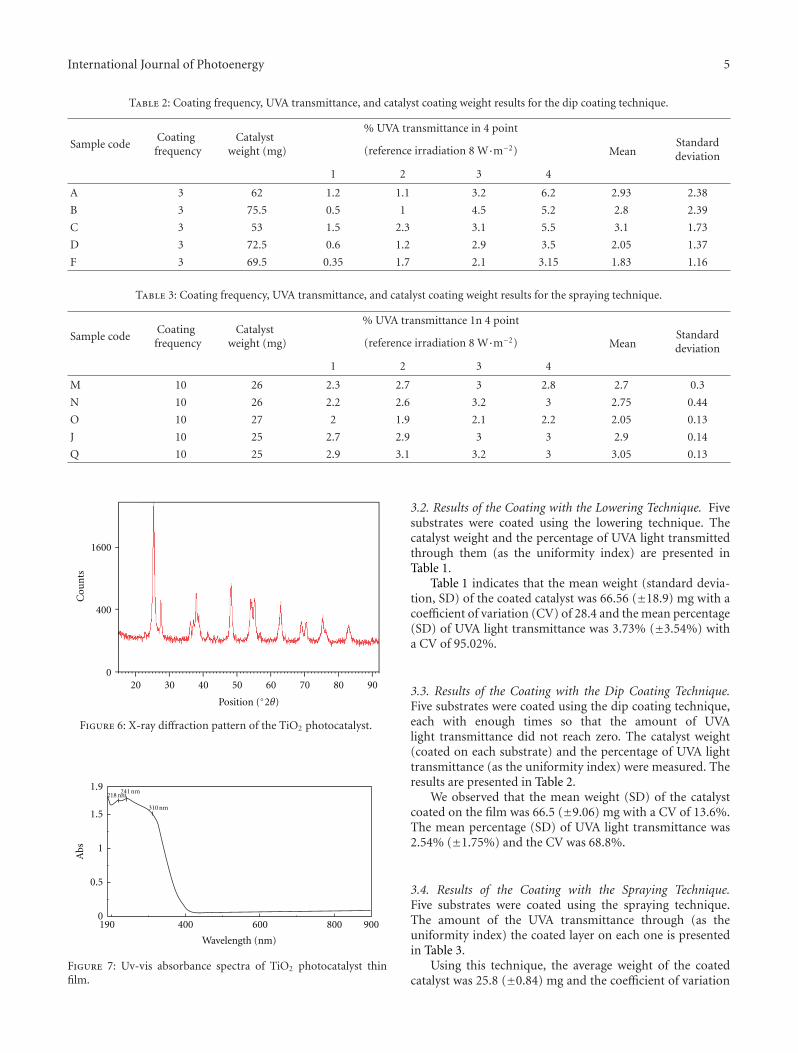
X-ray diffraction pattern and Uv-vis absorbance spectraof TiO2 photocatalyst were illustrated in Figures 6 and 7,respectively.
The composition of TiO2 thin film was characterizedwith XPS. The XPS results (Figures 8(a) and 8(b)) show thatTiO2 film deposited on quartz contains Ti, O, and C (18.3%,65.7%, and 16% resp.).
International Journal of Photoenergy 5
Table 2: Coating frequency, UVA transmittance, and catalyst coating weight results for the dip coating technique.
Sample codeCoatingfrequency
Catalystweight (mg)
% UVA transmittance in 4 point
(reference irradiation 8 W·m−2) MeanStandarddeviation
1 2 3 4
A 3 62 1.2 1.1 3.2 6.2 2.93 2.38
B 3 75.5 0.5 1 4.5 5.2 2.8 2.39
C 3 53 1.5 2.3 3.1 5.5 3.1 1.73
D 3 72.5 0.6 1.2 2.9 3.5 2.05 1.37
F 3 69.5 0.35 1.7 2.1 3.15 1.83 1.16
Table 3: Coating frequency, UVA transmittance, and catalyst coating weight results for the spraying technique.
Sample codeCoatingfrequency
Catalystweight (mg)
% UVA transmittance 1n 4 point
(reference irradiation 8 W·m−2) MeanStandarddeviation
1 2 3 4
M 10 26 2.3 2.7 3 2.8 2.7 0.3
N 10 26 2.2 2.6 3.2 3 2.75 0.44
O 10 27 2 1.9 2.1 2.2 2.05 0.13
J 10 25 2.7 2.9 3 3 2.9 0.14
Q 10 25 2.9 3.1 3.2 3 3.05 0.13
0
400
1600
Cou
nts
20 30 40 50 60 70 80 90
Position (◦2θ)
Figure 6: X-ray diffraction pattern of the TiO2 photocatalyst.
190 400 600 800 900
Wavelength (nm)
310 nm
241 nm218 nm
0
0.5
1
1.5
1.9
Abs
Figure 7: Uv-vis absorbance spectra of TiO2 photocatalyst thinfilm.
3.2. Results of the Coating with the Lowering Technique. Fivesubstrates were coated using the lowering technique. Thecatalyst weight and the percentage of UVA light transmittedthrough them (as the uniformity index) are presented inTable 1.
Table 1 indicates that the mean weight (standard devia-tion, SD) of the coated catalyst was 66.56 (±18.9) mg with acoefficient of variation (CV) of 28.4 and the mean percentage(SD) of UVA light transmittance was 3.73% (±3.54%) witha CV of 95.02%.
3.3. Results of the Coating with the Dip Coating Technique.Five substrates were coated using the dip coating technique,each with enough times so that the amount of UVAlight transmittance did not reach zero. The catalyst weight(coated on each substrate) and the percentage of UVA lighttransmittance (as the uniformity index) were measured. Theresults are presented in Table 2.
We observed that the mean weight (SD) of the catalystcoated on the film was 66.5 (±9.06) mg with a CV of 13.6%.The mean percentage (SD) of UVA light transmittance was2.54% (±1.75%) and the CV was 68.8%.
3.4. Results of the Coating with the Spraying Technique.Five substrates were coated using the spraying technique.The amount of the UVA transmittance through (as theuniformity index) the coated layer on each one is presentedin Table 3.
Using this technique, the average weight of the coatedcatalyst was 25.8 (±0.84) mg and the coefficient of variation

6 International Journal of Photoenergy
Cou
nts
1100 1000 900 800 700 600 500 400 300 200 100
Binding energy (eV)
O 2
pO
2s
C 1
s
Ti 2
p1
O 1
Ti 2
s
Ti 3
s
O K
LL-
1O
Au
ger
Ti L
MM
-2
Ti A
uge
r
Atom %44.5%38.3%17.2%
Peak IDO 1s
Ti 2p1C 1s
0100020003000400050006000700080009000
10000
(a)
300
500
700
900
1100
1300
1500
1700
Cou
nts
540 538 536 534 532 530 528 526 524 522
Binding energy (eV)
ABC
A
B
C
BE (eV)
530.53 eV532.2 eV
533.56 eV
FWHM
1.65 eV1.65 eV1.65 eV
Peak area
2137.7 cts653.7 cts294.9 cts
Rel %
69.3%21.2%9.6%
Atom %
16%
65.7%
18.4%
Peak ID
C 1s
O 1s
Ti 2p
Peak-fit baseline: 536.75 to 526.22 eV
Reduced Chi-squared: 0.74
(b)
Figure 8: XPS spectra of the TiO2 thin film (a) and O1s region of the TiO2 film (b).
0
20
40
60
80
100
LoweringDip coatingSpraying
Coating techniques
CV UV transmittanceCV catalyst weight
Figure 9: A comparative chart for the coefficient of variation ofthe catalyst weight coated on a substrate and UVA transmissionpercentage in the lowering, dip coating, and spraying techniques.
was 3.24%. The average amount of UVA light transmittancewas 2.69% (±0.42%) and its coefficient of variation was15.6%.
The comparison between the CV of the catalyst weightand the UVA light transmittance is illustrated in Figure 9.
3.5. Results of Photocatalytic Activity Tests in 3 CoatingTechniques. The results of the photocatalytic activity testsof the samples prepared using the three different techniquesshow that the removal efficiency (%RE) of xylene from theair was 70%, 64%, and 35.5% for dip coating, lowering,and spraying, respectively. The xylene removal efficiency(%RE/mg·cm−2) estimated for dip coating, lowering, andspraying was 18.42, 16.84, and 24.15, respectively.
4. Discussion
In this study, the commercial P25 photocatalyst was used.The commercial P25 specifications were evaluated by usingXRD, XPS, and Uv-vis-DRS. The morphology results of P25TiO2 have been confirmed by the results of other studies[28–30]. The SEM images of the samples show the differentsurface morphologies in the three techniques.
Performance evaluation of photocatalysts for the trans-formation of gas phase substrates is generally accomplishedby coating them on a substrate which is either fixed [6–8] orunfixed [9, 10].
In few studies the interactional effect of the semi-conductor film composition method on the thickness has
International Journal of Photoenergy 7
been considered as well as its effect on the photocatalyst’sperformance [23, 24].
One of the easiest techniques when performing a fixed-bed study is coating the catalyst using a suspension in whichthe prepared photocatalyst is dispersed in an appropriatesolution and coated on the substrate [11].
Although the catalyst layer thickness has been investi-gated in several studies [16, 31–36], only a limited numberof studies on the layer thickness have been conducted [15–17], and none of them have presented a suitable method toevaluate the uniformity of the photocatalyst layer.
Three coating techniques have been compared in thisresearch in terms of the sample uniformity and optimumthickness regarding the amount of UVA light transmittance.The interaction of the factors affected on the semiconductorscomposition method, such as the calcination temperature[23] and crystallization method [24], has been investigatedin the previous studies. Using commercial P25 TiO2, thesefactors can be considered as the controlled factors. Sothis study indicates the effect of catalyst thickness on thephotocatalytic performance.
These techniques include dip coating [6], lowering [12],and spraying [25].
The comparison of the three techniques shows that themethod of performing the experiment does not have anyinfluence on the amount of catalyst coated on the substrateor on its uniformity. This feature of the experiment makes itpossible to directly compare the photocatalytic properties ofthe different coating processes.
The coating results from the lowering technique areillustrated in Table 1.
The coefficient of variation related to the percentage ofUVA light transmittance through these samples was 95.02%,which is a sign that the thickness changes dramatically usingthis technique. Blount has confirmed this result in his study[22]. Another feature of this technique is that a very largeamount of the photocatalyst is coated on the substrate in justone run, and as a result, UVA light does not pass throughsome parts of the sample after the first coating. This is a signof high thickness in some sections of the substrate.
It can be inferred from the results for the loweringtechnique that it is impossible to control the amount ofcoated catalyst weight and the thickness of the film layer.In addition, the thickness is more than the optimum levelat least in some sections of the coated layer. Because theefficiency of catalysis is reported in removal efficiency per mgof photocatalyst per unit area, the efficiency results for thelowering technique are less than the true value.
The results from the dip coating technique show that thecoefficient of variation is lower than that for the loweringtechnique due to the higher uniformity of the photocatalystfilm. However, the results demonstrate that the mean (SD)amount of transmitted UVA light, 0.83% (±0.5%), 1.46%(±0.58%), 3.16% (±0.86%), and 4.71% (±1.32%) for points1 through 4, respectively, is not equal at the evaluated points.These differences are due to the nature of the method inwhich the sample is removed vertically from the suspensioncontaining the catalyst. This may cause increased thickness in
the lower parts of the substrate. Bennani also has confirmedthis point in his study [19].
The results from the spraying technique show the lowestcoated catalyst weight after 10 spraying processes. In otherwords, this technique has the potential to accurately coata layer of catalyst at the optimum level. The coefficient ofvariation of this technique was 15.6%, which is lower thanthose for the other two techniques (dip coating had a CV =68.8%, and lowering had a CV = 95.02%).
The SEM images of the coating profiles (illustrated inFigure 6) confirm the hypothesis that choosing the optimalthickness seems possible.
The results from the examination of the photocatalyticperformance of the samples prepared by the three differenttechniques in removing xylene from the air stream indicatethat the maximum removal efficiency (in %RE/mg·cm−2)is achieved with samples from the spraying technique. Thespraying technique also provides the lowest thickness. Thesefindings agree with those from the studies conducted byXianyu et al. [15] and Shang et al. [37].
Akhavan also has illustrated similar conclusions aboutthe effect of thickness on the antimicrobial function of TiO2
[16]. In the study performed by Bessergenev et al, the effectof physical and chemical properties as well as the thicknesshas been investigated on the photocatalytic performance.According to this study, the photocatalytic performanceefficiency will de decreased due to the declining of the UVlight absorption, in those cases that the photocatalyst layer isnot sufficiently thick. Thus, the evaluation of the thicknessby measuring the transmitted UV light can prevent any erroroccurred due to the low thickness of the catalyst [1].
5. Conclusion
The current study indicates that by measuring the UVA lighttransmittance through the samples, it is possible to choosethe optimal thickness of the catalyst coating layer with highaccuracy without wasting the sample.
Using this method it is also possible to measure coatinguniformity. Compared to other techniques, the sprayingtechnique provided the most uniform coating.
Acknowledgments
The authors thank Tehran University of Medical Sciences(Grant no. 11983-27-04-89) for supplying funds for thisproject and Isfahan University of Medical Sciences forsupport. The authors also thank Mrs. Mahnaz Shakerian.
References
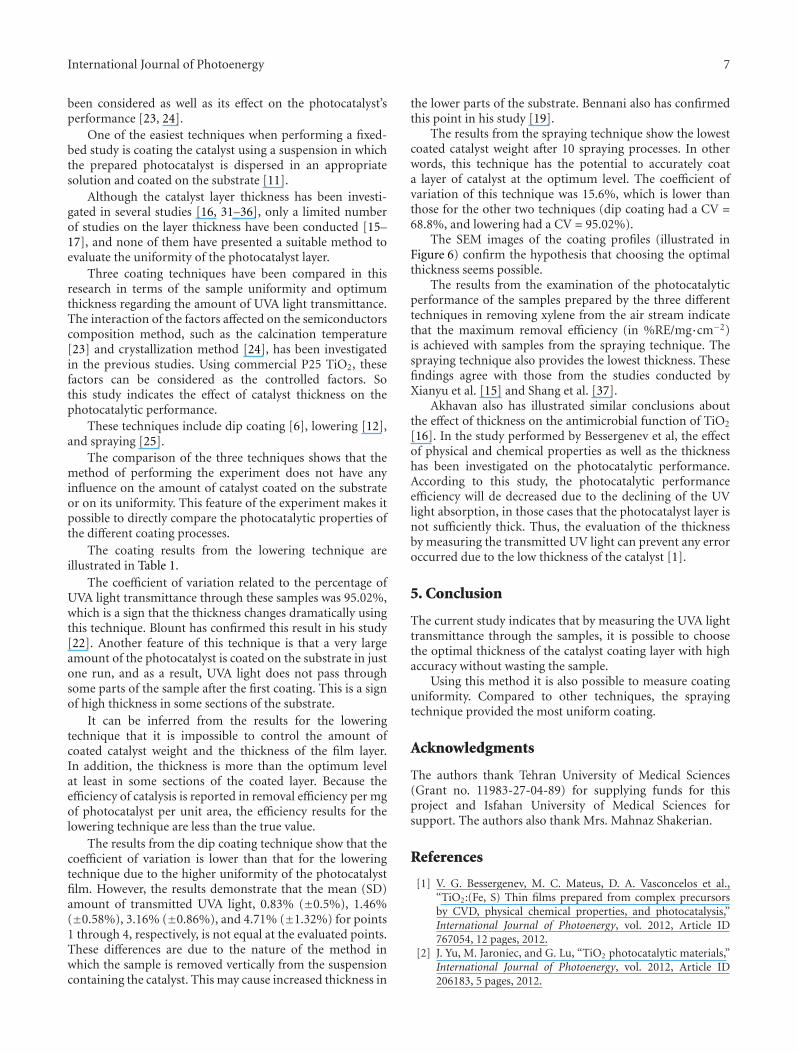
[1] V. G. Bessergenev, M. C. Mateus, D. A. Vasconcelos et al.,“TiO2:(Fe, S) Thin films prepared from complex precursorsby CVD, physical chemical properties, and photocatalysis,”International Journal of Photoenergy, vol. 2012, Article ID767054, 12 pages, 2012.
[2] J. Yu, M. Jaroniec, and G. Lu, “TiO2 photocatalytic materials,”International Journal of Photoenergy, vol. 2012, Article ID206183, 5 pages, 2012.
8 International Journal of Photoenergy
[3] J. A. Byrne, P. A. Fernandez-Ibanez, P. S. M. Dunlop, D. M. A.Alrousan, and J. W. J. Hamilton, “Photocatalytic enhancementfor solar disinfection of water: a review,” International Journalof Photoenergy, vol. 2011, Article ID 798051, 2011.
[4] U. I. Gaya and A. H. Abdullah, “Heterogeneous photocatalyticdegradation of organic contaminants over titanium dioxide:a review of fundamentals, progress and problems,” Journal ofPhotochemistry and Photobiology C, vol. 9, no. 1, pp. 1–12,2008.
[5] L. Zhao, J. Ran, Z. Shu et al., “Effects of calcinationtemperatures on photocatalytic activity of ordered titanatenanoribbon/SnO2 films fabricated during an EPD process,”International Journal of Photoenergy, vol. 2012, Article ID472958, 7 pages, 2012.
[6] B. I. Stefanov, N. V. Kaneva, G. L. Puma, and C. D.Dushkin, “Novel integrated reactor for evaluation of activityof supported photocatalytic thin films: case of methylene bluedegradation on TiO2 and nickel modified TiO2 under UV andvisible light,” Colloids and Surfaces A, vol. 382, no. 1–3, pp.219–225, 2011.
[7] S. Wu, Q. Zhao, D. Miao, and Y. Dong, “Synthesis andcharacterization of Sb-doped SnO2-(CeO2-TiO2) compositethin films deposited on glass substrates for antistatic electricityand UV-shielding,” Journal of Rare Earths, vol. 28, no. 1, pp.189–193, 2010.
[8] P. Novotna, J. Krysa, J. Maixner, P. Kluson, and P. Novak,“Photocatalytic activity of sol-gel TiO2 thin films depositedon soda lime glass and soda lime glass precoated with a SiO2
layer,” Surface and Coatings Technology, vol. 204, no. 16-17, pp.2570–2575, 2010.
[9] L. A. Dibble and G. B. Raupp, “Fluidized-bed photocatalyticoxidation of trichloroethylene in contaminated airstreams,”Environmental Science and Technology, vol. 26, no. 3, pp. 492–495, 1992.
[10] M. Lim, V. Rudolph, M. Anpo, and G. Q. (Max) LuG.Q., “Fluidized-bed photocatalytic degradation of airbornestyrene,” Catalysis Today, vol. 131, no. 1–4, pp. 548–552, 2008.
[11] V. Meille, “Review on methods to deposit catalysts onstructured surfaces,” Applied Catalysis A, vol. 315, pp. 1–17,2006.
[12] H.-H. Tseng, M. C. Wei, S. F. Hsiung, and C. W. Chiou,“Degradation of xylene vapor over Ni-doped TiO2 photo-catalysts prepared by polyol-mediated synthesis,” ChemicalEngineering Journal, vol. 150, no. 1, pp. 160–167, 2009.
[13] R. W. Sidwell, H. Zhu, B. A. Kibler, R. J. Kee, and D. T.Wickham, “Experimental investigation of the activity andthermal stability of hexaaluminate catalysts for lean methane-air combustion,” Applied Catalysis A, vol. 255, no. 2, pp. 279–288, 2003.
[14] M. Schuessler, M. Portscher, and U. Limbeck, “Mono-lithic integrated fuel processor for the conversion of liquidmethanol,” Catalysis Today, vol. 79-80, pp. 511–520, 2003.
[15] W. X. Xianyu, M. K. Park, and W. I. Lee, “Thickness effect inthe photocatalytic activity of TiO2 thin films derived from sol-gel process,” Korean Journal of Chemical Engineering, vol. 18,no. 6, pp. 903–907, 2001.
[16] O. Akhavan, “Thickness dependent activity of nanostructuredTiO2/α- Fe2O3 photocatalyst thin films,” Applied SurfaceScience, vol. 257, no. 5, pp. 1724–1728, 2010.
[17] H. P. Chang, F. H. Wang, J. C. Chao, C. C. Huang, and H. W.Liu, “Effects of thickness and annealing on the properties ofTi-doped ZnO films by radio frequency magnetron sputter-ing,” Current Applied Physics, vol. 11, no. 1, supplement, pp.S185–S190, 2011.
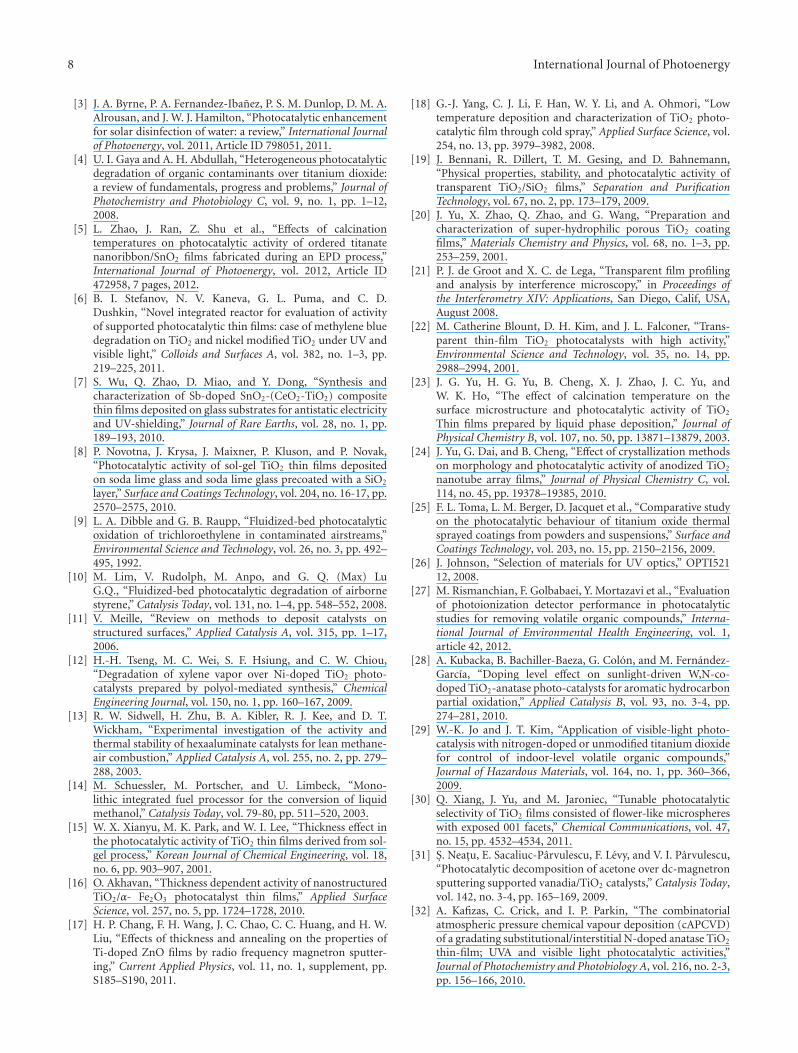
[18] G.-J. Yang, C. J. Li, F. Han, W. Y. Li, and A. Ohmori, “Lowtemperature deposition and characterization of TiO2 photo-catalytic film through cold spray,” Applied Surface Science, vol.254, no. 13, pp. 3979–3982, 2008.
[19] J. Bennani, R. Dillert, T. M. Gesing, and D. Bahnemann,“Physical properties, stability, and photocatalytic activity oftransparent TiO2/SiO2 films,” Separation and PurificationTechnology, vol. 67, no. 2, pp. 173–179, 2009.
[20] J. Yu, X. Zhao, Q. Zhao, and G. Wang, “Preparation andcharacterization of super-hydrophilic porous TiO2 coatingfilms,” Materials Chemistry and Physics, vol. 68, no. 1–3, pp.253–259, 2001.
[21] P. J. de Groot and X. C. de Lega, “Transparent film profilingand analysis by interference microscopy,” in Proceedings ofthe Interferometry XIV: Applications, San Diego, Calif, USA,August 2008.
[22] M. Catherine Blount, D. H. Kim, and J. L. Falconer, “Trans-parent thin-film TiO2 photocatalysts with high activity,”Environmental Science and Technology, vol. 35, no. 14, pp.2988–2994, 2001.
[23] J. G. Yu, H. G. Yu, B. Cheng, X. J. Zhao, J. C. Yu, andW. K. Ho, “The effect of calcination temperature on thesurface microstructure and photocatalytic activity of TiO2
Thin films prepared by liquid phase deposition,” Journal ofPhysical Chemistry B, vol. 107, no. 50, pp. 13871–13879, 2003.
[24] J. Yu, G. Dai, and B. Cheng, “Effect of crystallization methodson morphology and photocatalytic activity of anodized TiO2
nanotube array films,” Journal of Physical Chemistry C, vol.114, no. 45, pp. 19378–19385, 2010.
[25] F. L. Toma, L. M. Berger, D. Jacquet et al., “Comparative studyon the photocatalytic behaviour of titanium oxide thermalsprayed coatings from powders and suspensions,” Surface andCoatings Technology, vol. 203, no. 15, pp. 2150–2156, 2009.
[26] J. Johnson, “Selection of materials for UV optics,” OPTI52112, 2008.
[27] M. Rismanchian, F. Golbabaei, Y. Mortazavi et al., “Evaluationof photoionization detector performance in photocatalyticstudies for removing volatile organic compounds,” Interna-tional Journal of Environmental Health Engineering, vol. 1,article 42, 2012.
[28] A. Kubacka, B. Bachiller-Baeza, G. Colon, and M. Fernandez-Garcıa, “Doping level effect on sunlight-driven W,N-co-doped TiO2-anatase photo-catalysts for aromatic hydrocarbonpartial oxidation,” Applied Catalysis B, vol. 93, no. 3-4, pp.274–281, 2010.
[29] W.-K. Jo and J. T. Kim, “Application of visible-light photo-catalysis with nitrogen-doped or unmodified titanium dioxidefor control of indoor-level volatile organic compounds,”Journal of Hazardous Materials, vol. 164, no. 1, pp. 360–366,2009.
[30] Q. Xiang, J. Yu, and M. Jaroniec, “Tunable photocatalyticselectivity of TiO2 films consisted of flower-like microsphereswith exposed 001 facets,” Chemical Communications, vol. 47,no. 15, pp. 4532–4534, 2011.
[31] S. Neatu, E. Sacaliuc-Parvulescu, F. Levy, and V. I. Parvulescu,“Photocatalytic decomposition of acetone over dc-magnetronsputtering supported vanadia/TiO2 catalysts,” Catalysis Today,vol. 142, no. 3-4, pp. 165–169, 2009.
[32] A. Kafizas, C. Crick, and I. P. Parkin, “The combinatorialatmospheric pressure chemical vapour deposition (cAPCVD)of a gradating substitutional/interstitial N-doped anatase TiO2
thin-film; UVA and visible light photocatalytic activities,”Journal of Photochemistry and Photobiology A, vol. 216, no. 2-3,pp. 156–166, 2010.

International Journal of Photoenergy 9
[33] B. Wang, Q. Li, W. Wang, Y. Li, and J. Zhai, “Preparation andcharacterization of Fe3+-doped TiO2 on fly ash cenospheres forphotocatalytic application,” Applied Surface Science, vol. 257,no. 8, pp. 3473–3479, 2011.
[34] L. Cui, F. Huang, M. Niu, L. Zeng, J. Xu, and Y. Wang,“A visible light active photocatalyst: nano-composite withFe-doped anatase TiO2 nanoparticles coupling with TiO2(B)nanobelts,” Journal of Molecular Catalysis A, vol. 326, no. 1-2,pp. 1–7, 2010.
[35] Y. Ohko, Y. Nakamura, N. Negishi, S. Matsuzawa, and K.Takeuchi, “Photocatalytic oxidation of nitrogen monoxideusing TiO2 thin films under continuous UV light illumina-tion,” Journal of Photochemistry and Photobiology A, vol. 205,no. 1, pp. 28–33, 2009.
[36] N. Ma, X. Fan, X. Quan, and Y. Zhang, “Ag-TiO2/HAP/Al2O3
bioceramic composite membrane: fabrication, characteriza-tion and bactericidal activity,” Journal of Membrane Science,vol. 336, no. 1-2, pp. 109–117, 2009.
[37] J. Shang, W. Li, and Y. Zhu, “Structure and photocatalyticcharacteristics of TiO2 film photocatalyst coated on stainlesssteel webnet,” Journal of Molecular Catalysis A, vol. 202, no.1-2, pp. 187–195, 2003.