a comparative assessment of the factors that attract ... - NWU-IR Home
185
A COMPARATIVE ASSESSMENT OF THE FACTORS THAT ATTRACT OIL SECTOR FDI IN NIGERIA AND ANGOLA. J.W. EGGINK 20672330 Dissertation submitted in partial fulfilment of the requirements for the degree Magister Commercii in International Trade at the Potchefstroom Campus of the North-West University Supervisor: Mr. R. Wait Co-supervisor: Dr. H. Bezuidenhout November 2013
-
Upload
khangminh22 -
Category
Documents
-
view
7 -
download
0
Transcript of a comparative assessment of the factors that attract ... - NWU-IR Home
A COMPARATIVE ASSESSMENT OF THE FACTORS THAT
ATTRACT OIL SECTOR FDI IN NIGERIA AND ANGOLA.
J.W. EGGINK
20672330
Dissertation submitted in partial fulfilment of the requirements for the
degree Magister Commercii in International Trade at the Potchefstroom
Campus of the North-West University
Supervisor: Mr. R. Wait
Co-supervisor: Dr. H. Bezuidenhout
November 2013

i
Preface
This dissertation is submitted in partial fulfilment of the requirements for the degree
Magister Commercii in International Trade at the Potchefstroom Campus of the
North-West University. The purpose of this dissertation is to determine domestic and
global factors that influence FDI inflows in the Angolan and Nigerian oil industries.
The dissertation explores benefits and costs of FDI and its determinates, as well as
how FDI links to current trends in the oil industry on global, regional and national
levels. This dissertation should be of interest to decision makers at government and
industry level, especially in developing African countries.
Acknowledgements
I would like to thank all friends and family for their continued moral support and
motivation throughout the gruelling times. Without your support this study would not
have been possible.
Firstly, I would like to thank my study supervisor Mr. R. Wait and co-supervisor Dr. H.
Bezuidenhout for their time and effort.
Secondly, I would like to thank my family, not only for being the motivation to
undertake the task of furthering my studies, but also for supporting me financially
and morally during my studies.
Thirdly, I would like to single out my mother, Dr. M.E. Eggink, for being an inspiration
by completing her studies during this period.
Lastly, I would like to thank Elana Joynt and her family for their continued support
and motivation throughout the period of this study.
J.W. Eggink
Potchefstroom, March 2014
ii
Abstract
This dissertation focuses on Foreign Direct Investment (FDI) in the oil sector of
Africa, more specifically in Nigeria and Angola. A large problem faced by most
African countries is their low domestic investment. This is due to the low savings
rates in these countries. FDI serves as a supplement to domestic investment and
therefore allows for increased production and growth in the region that can ultimately
lead to better development. Further, FDI brings forth positive spill over effects that
can further increase levels of development in African countries. Therefore, it is
beneficial for African countries to achieve higher levels of FDI inflows. The African oil
sector has, in recent years, received much deserved attention as Africa supplied
approximately 11 percent of worldwide oil supply and the African untapped oil
reserves constitute approximately 10 percent of the total worldwide proven oil
reserves in 2010. There are currently 19 African countries known to have significant
oil reserves and further surveying may increase this number. This dissertation
focuses on Nigeria and Angola as these countries are the continent’s largest
producers of oil and their oil sectors are the sectors with the strongest FDI inflows.
Through economic and policy reforms and increased share in global oil supply, it is
believed that these countries can be the drivers of economic growth and
development in the region.
Greater FDI is needed to fully exploit the available oil resources. Although many
studies have been done on the factors that attract FDI, very few studies have
focussed on oil sector specific FDI. Therefore, the aim of this dissertation is to
determine and compare the factors that attract oil sector FDI in Nigeria and Angola.
This dissertation undertakes both a literature review and an empirical analysis. The
literature review provides an overview of FDI theory, the motives for investment, the
types and benefits thereof; an overview of the African and, more specifically, the
Nigerian and Angolan oil industry and the influence that FDI inflows have had on this
sector. The current FDI inflow trends and oil sector FDI in Nigeria and Angola are
reviewed. The dissertation examines and compares the current state of the Nigerian
and Angolan oil industries. The empirical analysis consists of a country comparison
through four least square regression models (domestic models for Nigeria and
iii
Angola and global models for both countries) using data between 1990 and 2011
obtained from the World Data Bank and the 2012 BP statistical review. The data
used will describe the traditional determinants of FDI inflows as set out in literature
review and other determinants derived from past studies of FDI inflows in transitional
economies and oil sector dependent countries. In Nigeria and Angola, the problems
of lack of accurate and sufficient data over a longer time period persist, as they do in
most African countries.
The main findings are that significant domestic influences of FDI inflows in Angola
include: lower public power to entice private gain; better policies that are effectively
enforced to improve civil and public services; and the proven oil reserves. This
entails that government policy, transparency and their oil reserves are held in high
regard by the foreign investors in Angola. In Nigeria, however, domestic influences of
FDI inflows include: better citizen ability to select a government; freedom of
expression; freedom of association and a free media; better ability of the government
to formulate and implement sound policies and regulations that permit and promote
private sector development; and oil production. This indicates that democracy,
government policy and oil production are highly regarded by foreign investors who
invest in Nigeria. Therefore, it can be argued that, even though results for factors
influencing FDI inflows differ, there are similarities as government policy and the oil
sector in general influence both countries even though the issues in both countries
are not necessarily the same. However, on a global level, investment in the two
countries is driven by completely different factors. According to the models, Angolan
FDI inflows are driven by global oil production (supply) in the previous year whereas
FDI inflows in Nigeria are correlated to the oil price in the previous year. Both of
these models, however, leave much to be desired as they have low R2 values which
indicate that they explain very little of what influences FDI inflows in the countries.
Key words: Foreign Direct Investment (FDI); oil sector; oil sector FDI; African FDI;
Nigeria; Angola.
iv
Opsomming
Hierdie verhandeling fokus op direkte buitelandse investering in die Afrika oliesektor
en meer spesifiek op Nigerië en Angola se oliesektore. 'n Groot probleem wat ervaar
word deur die meeste Afrika-lande is hul lae binnelandse investering. Dit is grootliks
as gevolg van die lae spaarkoers in hierdie lande. direkte buitelandse investering
dien as 'n aanvulling tot binnelandse investering en daarom kan verhoogde
produksie en groei bereik word wat uiteindelik kan lei tot beter ontwikkeling. Direkte
buitelandse investering kan ook lei tot positiewe oorspoel-effekte wat die vlak van
ontwikkeling in Afrika-lande kan verhoog. Daarom is dit voordelig vir Afrika-lande om
hoër vlakke van direkte buitelandse investeringsinvloei te bereik. Die Afrika
oliesektor het in afgelope jare baie aandag geniet, omdat Afrika verantwoordelik is
vir ongeveer 11 persent van die wêreldwye olieproduksie en Afrika se onontginde
oliereserwes maak ongeveer 10 persent van die totale wêreldwye bewese
oliereserwes in 2010 uit. Daar is tans 19 Afrika-lande wat noemenswaardige
oliereserwes het en daar word verwag dat hierdie getalle in die toekoms kan styg
met verdere eksplorasie. Hierdie studie fokus spesifiek op Nigerië en Angola, omdat
hierdie lande Afrika se grootste olieprodusente is en die oliesektor die sektor in
Afrika is wat tans die sterkste direkte buitelandse investeringsinvloei ontvang.
Volgens sekere ekonome kan hierdie lande die dryfkrag vir ekonomiese groei en
ontwikkeling in die streek wees as hulle die nodige ekonomiese en
beleidshervormings toepas en ‘n groter aandeel in die globale olie-aanbod bekom.
Groter direkte buitelandse investeringsinvloei word benodig om die beskikbare
oliehulpbronne te ontgin en in inkomste te omskep. Alhoewel daar al menigte studies
gedoen is oor die faktore wat direkte buitelandse investeringsinvloei aantrek, het
baie min studies spesifiek gefokus op oliesektor direkte buitelandse investering. Die
doel van hierdie studie is dus om vas te stel watter faktore direkte buitelandse
investering in Nigerië en Angola se oliesektore aantrek en om die faktore in die twee
lande te vergelyk.
Die studie bestaan uit 'n literatuurstudie en 'n empiriese analise. Die literatuurstudie
verskaf 'n oorsig oor direkte buitelandse investeringsteorie, die motiewe vir
investering, die tipes direkte buitelandse investering en voordele daarvan, sodat 'n
v
oorsig gegee kan word van die Afrika en, meer spesifiek, die Nigeriese en Angolese
olie-sektore en die invloed wat direkte buitelandse investeringsinvloei op hierdie
sektor het. Die huidige direkte buitelandse investeringsinvloei-tendense en oliesektor
direkte buitelandse investering in Nigerië en Angola word dan hersien. Die studie
ondersoek en vergelyk dan die huidige toestand van die Nigeriese en Angolese olie-
industrie. Die empiriese ontleding bestaan uit 'n vergelyking tussen die lande deur
vier regressiemodelle (plaaslike modelle vir Nigerië en Angola en globale modelle vir
beide lande), deur gebruik te maak van data tussen 1990 en 2011 verkry van die
World Data Bank en die BP statistical review 2012. Die data sal die tradisionele
determinante van direkte buitelandse investeringsinvloei, soos uiteengesit in
literatuuroorsig, beskryf en ander faktore wat afgelei word van vorige studies oor
direkte buitelandse investeringsinvloei in ontwikkelende ekonomieë asook oliesektor-
afhanklike lande. 'n Gebrek aan akkurate en voldoende data oor 'n langer tydperk is
egter ‘n probleem wat voorkom in Nigerië en Angola soos in die meeste Afrika-lande.
Die modelle was geïnterpreteer en vergelyk en die bevindinge was dat beduidende
plaaslike invloede van direkte buitelandse investeringsinvloei in Angola die volgende
insluit: laer openbare bevoegdheid het om private gewin te bewerkstellig; 'n beter
beleid wat effektief afgedwing word om burgerlike en openbare dienste te verbeter;
en die bewese olie reserwes te lok. Dit behels dat die regeringsbeleid, deursigtigheid
en hul olie-reserwes hooggeag word deur buitelandse beleggers wat belê in Angola.
Die beduidende Nigeriese plaaslike invloede van buitelandse investeringsvloei het
egter die volgende ingesluit: beter burgerlike vermoë om 'n regering te kies; vryheid
van uitdrukking; vryheid van assosiasie en vrye media; beter regeringsvermoë om
gesonde beleide te formuleer en te implementer; regulasies wat toelaat dat privaat-
sector ontwikkeling bevorder word; en olieproduksie. Dit dui daarop dat demokrasie,
regeringsbeleid en olieproduksie hooggeag word deur buitelandse beleggers wat
belê in Nigerië. 'n Mens kan dus argumenteer dat daar wel ooreenkomste bestaan
tussen die lande se plaaslike invloede op direkte buitelandse investering. Die
ooreenkomste dui dat beide lande beïnvloed word deur regeringbeleid en die
oliesektor in die algemeen, selfs al is die kwessies in beide lande nie noodwendig
dieselfde nie. Op ‘n globale vlak word investering in die twee lande egter deur
heeltemal ander faktore gedryf. Volgens die modelle in die bogenoemde afdelings

vi
word Angolese direkte buitelandse investeringsinvloei gedryf deur globale
olieproduksie (aanbod) in die vorige jaar, terwyl direkte buitelandse
investeringsinvloei in Nigerië gekorreleer is met die olieprys in die vorige jaar. Albei
hierdie modelle laat egter veel te wense oor, as gevolg van hul lae R-kwadraat wat
aandui dat die onafhanklike veranderilkes baie min verduidelik van wat direkte
buitelandse investeringsinvloei in die lande beïnvloed.
Sleutelwoorde: direkte buitelandse investering; oliesektor; oliesektor direkte
buitelandse investering; direkte buitelandse investering in Afrika; Nigerië; Angola.
vii
Table of contents
Preface ........................................................................................................................ i
Acknowledgements ..................................................................................................... i
Abstract ....................................................................................................................... ii
Opsomming ................................................................................................................ iv
List of tables ............................................................................................................... xi
List of figures ............................................................................................................. xii
List of abbreviations ................................................................................................. xiii
Chapter 1: Introduction and context of analysis ......................................................... 1
1.1. Introduction: Rationale and context ............................................................... 1
1.1.1. The oil sector ............................................................................................. 3
1.1.1.1. Nigeria ................................................................................................. 8
1.1.1.2. Angola ................................................................................................. 8
1.2. Problem statement ........................................................................................ 9
1.3. Motivation .................................................................................................... 10
1.4. Objectives ................................................................................................... 10
1.4.1. Sub-objectives ......................................................................................... 10
1.5. Research method ........................................................................................ 11
1.6. Outline of the dissertation ........................................................................... 11
Chapter 2: Literature review of FDI and the oil sector .............................................. 12
2.1. Introduction ................................................................................................. 12
2.2. FDI theory ................................................................................................... 12
2.2.1. FDI Definitions ......................................................................................... 12
viii
2.2.2. Categorising FDI ...................................................................................... 14
2.2.2.1. Categorising FDI according to the direction of flow ........................... 14
2.2.2.2. Categorising FDI according to investment type ................................. 14
2.2.2.3. Categorising FDI according to investors’ motivations ........................ 15
2.2.3. Benefits of FDI ......................................................................................... 15
2.2.3.1. Direct positive effects of FDI.............................................................. 15
2.2.3.2. Indirect positive effects of FDI ........................................................... 16
2.2.4. Costs of FDI .......................................................................................... 17
2.2.5. Determinants of FDI ................................................................................. 19
2.2.5.1. Macro determinants of FDI ................................................................ 19
2.2.5.2. Micro determinants of FDI ................................................................. 21
2.3. Oil sector theory .......................................................................................... 23
2.3.1. Types of oil reserves ............................................................................ 24
2.3.2. Upstream versus downstream investment ............................................ 25
2.3.3. Role players in the oil sector ................................................................. 26
2.3.3.1. Small independent oil companies .................................................. 26
2.3.3.3. Fully integrated multi-national oil companies (MNOCs) ................. 26
2.3.3.2. National oil companies (NOCs) ...................................................... 27
2.3.3.4. Other companies (Service companies) .......................................... 27
2.3.4. Classifications of Petroleum fiscal systems .......................................... 27
2.3.5. The natural resource curse ................................................................... 29
2.4. Past studies of oil sector FDI....................................................................... 30
2.5. Summary ..................................................................................................... 32
Chapter 3 – Current trends in FDI inflows and the Oil Sector ................................... 35
3.1. Introduction ................................................................................................. 35
ix
3.2. Global trends ............................................................................................... 36
3.2.1 Global FDI trends ................................................................................. 36
3.2.2. Global oil sector and FDI trends ........................................................... 38
3.3. Africa ........................................................................................................... 42
3.3.1. African FDI trends ................................................................................. 43
3.3.2 FDI inflows in the African oil sector ....................................................... 45
3.4. Nigeria and Angola .................................................................................. 50
3.4.1. Nigeria ..................................................................................................... 50
3.4.1.1. Nigerian oil sector and FDI inflows .................................................... 51
3.4.2. Angola ...................................................................................................... 54
3.4.2.1. Angolan oil sector and FDI inflows .................................................... 55
3.5. Summary ..................................................................................................... 58
Chapter 4 –Empirical Analysis of oil sector FDI in Nigeria and Angola .................... 60
4.1. Introduction of oil sector FDI in Nigeria and Angola .................................... 60
4.2. Theoretical framework ................................................................................. 61
4.3. Empirical analysis ...................................................................................... 63
4.3.1. Factors expected to influence oil sector FDI ........................................ 63
4.3.2. Data description ................................................................................... 63
4.3.2.1. Domestic variables ......................................................................... 64
4.3.2.2. Global variables ............................................................................. 64
4.3.2.3. Renamed identity of variables ........................................................ 64
4.3.2.4. Data transformation ........................................................................ 65
4.3.3. The FDI functions ................................................................................. 66
4.3.3.1 Nigerian econometric analysis ....................................................... 67
4.3.3.1.1 Nigerian domestic model............................................................ 67

x
4.3.3.1.2. Nigerian global model ............................................................... 70
4.3.3.2 Angolan econometric analysis ....................................................... 72
4.3.3.2.1. Angolan domestic model ........................................................... 72
4.3.3.2.2. Angolan global model ............................................................... 75
4.3.3.3 Model comparison .......................................................................... 76
4.4. Conclusion .................................................................................................. 77
Chapter 5 – Summary, Conclusion and Recommendations .................................... 80
5.1. Summary ..................................................................................................... 80
5.2. Conclusion .................................................................................................. 85
Reference list ........................................................................................................... 86
Appendix A Description of variables ................................................................... 103
Appendix B Nigeria domestic model ................................................................... 108
Appendix C Nigeria global model ........................................................................ 129
Appendix D Angola domestic model ................................................................... 139
Appendix E Angola Global model ....................................................................... 161
xi
List of tables
Table 1.1: Review of studies on African oil ......................................................... 7
Table 2.1. Production and reserves of top African oil producing countries (2012)
........................................................................................................ 24
Table 2.2. Review of Past studies on determinants of FDI in the oil sector ...... 30
Table 3.1 Top 10 African Countries with the biggest proven reserves (2011) . 46
Table 3.2 The 10 largest oil producing countries in Africa (2011) ................... 47
Table 4.1 Factors found to have an influence on FDI inflows .......................... 61
Table 4.2. Renamed identities for variables ..................................................... 64
Table 4.3. Conversion to constant prices base year 2005................................ 66
Table 4.4. Model for domestic factors influencing Nigerian FDI inflows ........... 68
Table 4.5. Model for global factors influencing Nigerian FDI inflows ................ 71
Table 4.6. Model for domestic factors influencing Angolan FDI inflows ........... 73
Table 4.7. Model for global factors influencing Angolan FDI inflows ................ 75
xii
List of figures
Figure 2.1. Petroleum fiscal systems ................................................................. 28
Figure 3.1. Global FDI inflows 1970 – 2010 (US Dollars at current prices and
current exchange rates in millions) .................................................. 37
Figure 3.2. Global consumption 1965 – 2010 (Thousand barrels per day) ........ 39
Figure 3.3. Global production 1965 – 2010 (thousand barrels per day) ............ 40
Figure 3.4. Brent crude oil price 1980 – 2010 (US Dollars 2011 basis year) ..... 40
Figure 3.5. Global oil reserves 1980 – 2010 (thousand million barrels) ............. 41
Figure 3.6. African FDI inflows 1970 – 2010 (US Dollars at current prices and
current exchange rates in millions) .................................................. 44
Figure 3.7. The 10 largest oil producing countries in Africa (2011) ................... 46
Figure 3.8. Total Greenfield FDI in African oil sector (in million dollars current
currency) ......................................................................................... 49
Figure 3.9. Nigerian oil production 1965 to 2010 ............................................... 51
Figure 3.10. Total Nigerian FDI inflows between 1970 and 2010 (million US$)... 52
Figure 3.11. Total Greenfield investment in the Nigerian oil sector ..................... 53
Figure 3.12. Angolan oil Production 1965 – 2009 (Thousand barrels per day)... 55
Figure 3.13. Total Greenfield FDI in the Angolan oil sector between 2003 and
2010 (in million dollars current currency) ......................................... 56
Figure 3.14. Total Angolan FDI inflows between 1970 and 2009 (million US$) ... 57
xiii
List of abbreviations
BP: British Petroleum
Bpd: Barrels per day
CIA: Central Intelligence Agency
COMESA: Common Market for Eastern and Southern Africa
CRF: Council on Foreign Relations
EAC: East African Community
EIA: U.S. Energy Information Administration
FAO: Food and Agriculture Organisation
FDI: Foreign Direct Investment
GDP: Gross Domestic Product
IMF: International Monetary Fund
IOCs: International oil companies
LDCs: Least developed countries
LNG: Liquefied Natural Gas
MNCs: Multi-national companies
MNOCs: Multi-national oil companies
NCEMA: National Centre for Economic Management and Administration
NIPC: Nigerian Investment Promotion Commission
NNPC: Nigerian National Petroleum Corporation
NOCs: National oil companies
OECD: Organisation for Economic Co-operation and Development
xiv
OGIC: Oil and Gas sector reform Implementation Committee
OPEC: Organization of the Petroleum Exporting Countries
PIB: Petroleum Industry Bill
PSA: Production Sharing Agreement
PSC: Production Sharing Contract
SADC: Southern African Development Community
SAP: Structural Adjustment Programme
SPE: Society of Petroleum Engineers
UNECA: United Nations Economic Commission for Africa
UNCTAD: United Nations Conference on Trade and Development
WPC: The World Petroleum Congress
1
Chapter 1: Introduction and context of analysis
1.1. Introduction: Rationale and context
Africa is a continent with vast natural resources. However, a major problem faced by
Africa is the lack of local investment because of the low domestic savings rates.
Nevertheless, Africa is a continent with potential, as much of Africa’s natural
resources have lain untapped for many years. Foreign direct investment (FDI) has
given African countries a way to supplement their lack in investment United Nations
Conference on Trade and Development (UNCTAD, 2011). In most oil rich African
countries, the oil sector receives the majority of FDI inflows and outweighs all the
other sectors combined (UNCTAD, 2011; Levitt, 2011).
Traditionally, FDI in Africa was primarily attracted by natural resources like gold and
coal but for some time now the oil industry has been showing an increased ability to
attract FDI (Levitt, 2011). The oil sector is currently the highest FDI recipient sector
in Africa and is, according to many economists, the continent’s way forward and a
doorway to a brighter future concerning sustainable economic growth and
development (Levitt, 2011).
Nigeria and Angola are the largest oil producing countries in Africa (UNCTAD, 2011;
US Department of Energy, 2011). Further, these countries also have the second and
third biggest oil reserves in Africa (BP, 2012; OPEC, 2011). Therefore, these two
countries were chosen as subjects as they not only have significant oil reserves and
production but are also both heavily dependent on FDI in their oil sectors (UNCTAD,
2011). Therefore, this dissertation will focus on oil sector FDI inflows to Nigeria and
Angola. The aim of this dissertation is to identify the factors that influence FDI inflows
to the oil sectors of Nigeria and Angola.
FDI is defined as long-term investment made by entities outside the borders of the
host country (UNCTAD, 2005). The aim of these investments is to gain a long-
standing interest in a sector with good prospects for growth. To qualify as FDI, the
investor must acquire at least ten per cent of the company’s voting stock (UNCTAD,
2
2005). Alternatively, a new business can be established or an existing business can
be acquired as a whole by the foreign investors (UNCTAD, 2005). There is,
therefore, a clear distinction between FDI and portfolio investment as portfolio
investment entails limited control of the company. It is generally shorter in term and
therefore more volatile (Goldstein and Razin, 2006: 32-33).
Within FDI, two main categories of investment can be distinguished, namely,
Greenfield investment and Brownfield investment (Paull, 2008: 9-15). Greenfield
investment is the direct investment through funding of new facilities in the host
country. This type of investment is optimal for the host country as it provides linkages
to the global market place, the transfer of knowledge and technology as well as
contributing to job creation (Qiu and Wang, 2011: 836-838). Brownfield investment
consists of mergers and acquisitions. Ownership of existing assets owned by local
firms is transferred to foreign companies (Paull, 2008: 9-15). This form of investment
does not necessarily lend itself to long-term benefits in the local economy unlike
Greenfield investment (Estrinet and Meyer, 2011: 3-5).
FDI is seen as a positive attribute for any economy but it is especially beneficial to
African countries (Lumibla, 2005). Most African countries have a low savings rate
that is insufficient to fund local investment (Kirk and Celemens, 1999). FDI has the
potential to have a positive effect on a number of economic factors within the host
country. These positive effects include higher foreign currency reserves, growth in
the countries’ gross domestic production (GDP) and job creation in the sector where
investment has been made. All of the aforementioned influences can ultimately lead
to higher living standards of the general population (Lumibla, 2005; Levitt, 2011).
Multi-national companies (MNCs) or multi-national oil companies (MNOCs) are the
main sources of FDI to developing countries and this creates a number of other
benefits. These benefits include new technology being obtained, easier access into
world markets, training of the workforce and new skills they obtain, as well as new
ideas and procedures (Kehl, 2009: 1-11). In comparison to other companies, MNCs
are more beneficial as these companies have the means for greater expenditure in
research and development (Kehl, 2009: 1-11). These benefits can improve the

3
shortcomings of the African labour and commodities markets. The commodities
market is supplemented by higher investment and the labour market by a rise in
technical knowledge (Perkins, Radelet and Lindauer, 2006:418 - p426). However,
there are costs associated with FDI. These costs include the crowding out of local
firms, higher strain on infrastructure, the fiscal burden on authorities in the host
country and the increased dependency of the economy in the investing country
(OECD, 2002).
It must be noted that investors have different motivations for investing abroad. The
main motivations include market seeking, efficiency seeking and resource seeking
(Kudina and Jakubiak, 2008). Market seeking entails that companies invest in
companies within countries with strong demand whereas efficiency seeking
motivates investors to invest in companies in certain countries because they can
produce goods more cost effectively than in others (Kudina and Jakubiak, 2008).
Finally, resource-seeking FDI is investment in a country that is richly endowed in
natural resources to realise financial gain from the extraction of these resources
(Makino, Lau and Yeh, 2002: 403-421). Even though Africa is a fast growing region,
the region does not possess a particularly enriched market as the per capita income
is relatively low and the lack of technical knowledge makes the region less efficient
than developing countries in other regions. Therefore, the main motivation for
investing in Africa is often resource seeking, as Africa is richly endowed with natural
resources (Makino and Lau andYeh, 2002: 403-421; Southall and Melber, 2010:
171-173; Kudina and Jakubiak, 2008).
1.1.1. The oil sector
Oil sector investment can take place in two divisions of the sector, that is, the
upstream and the downstream divisions. Upstream investment entails the funding of
exploration and production activities in the oil industry while downstream investment
entails funding of, amongst others, refinery and marketing activities (Fauli-Oller,
Sandoris and Santamaria, 2011: 884-898). This dissertation is focused on the
upstream sector.
4
A country’s oil endowment is measured through reserves in the country. Proven oil
reserves are the estimated quantities of oil that can, with reasonable certainty, be
extracted for commercial use under clear economic conditions, operating measures
and government regulation (National Centre for Economic Management and
Administration (NCEMA), 2003). In addition to proven reserves, oil reserves may
also be measured in terms of probable and possible reserves (BP, 2011). Probable
reserves indicating estimated oil reserves that have a 50 percent or higher chance of
being technically and economically extractable and possible reserves are estimated
reserves that can prove to be significant but have a lower than 50 percent chance of
being technically and economically extractable (Society of Petroleum Engineers
(SPE) and The World Petroleum Congress (WPC), 2004). Both probable and
potential reserves may become proven reserves with further exploration (BP, 2011;
SPE and WPC 1997).The level of proven, probable and possible reserves is the
most important factor for attracting oil sector FDI (UNCTAD, 2009).
Upstream exploration is conducted by many different types of companies. These
companies include small independent oil companies, national oil companies (NOCs)
and fully integrated oil companies (Petro Strategies, 2011). Firstly, small
independent oil companies focus on exploration. By utilising all their resources in the
field of exploration these companies are able to compete with larger integrated oil
companies (Petro Strategies, 2011; Akello, 2010). Secondly, integrated oil
companies are well known companies like Chevron and Shell as they usually supply
oil to consumers worldwide. These companies are multi-national and are listed on
the stock exchange. Their investment in African countries is much larger than that of
small independent companies (Petro Strategies, 2011; Kingdom Zephyr, 2011).
Thirdly, national oil companies are state owned oil entities that usually exist in oil rich
countries. Examples of these companies include Sanangol in Angola and the
Nigerian National Petroleum Corporation (NNPC) in Nigeria. These companies are
amongst the largest in the world but, unlike integrated oil companies, their objectives
are related to the economic wellbeing of the country rather than to an increase in
equity or shareholder value (Pirog, 2007). Nigeria and Angola are both part of the
Organisation of Petroleum Exporting Countries (OPEC), which is an
intergovernmental organisation with 12 member countries. The function of OPEC is
5
to unify and coordinate the policies of developing oil-exporting countries (OPEC,
2011). OPEC’s objective is to safeguard its members by stabilising oil prices and
assuring members of a steady, sustainable income through their oil sector. In
attempts to stabilise oil prices, OPEC formulates quotas for production for each
member country to counter over production or unfair competition (OPEC, 2011).
There are currently 19 African countries identified as significant producers of oil.
Most of these countries have shown strong economic growth partially because of
foreign direct investment in their oil sectors (Ernst and Young, 2011). According to
estimates, there is in excess of 7.3 trillion US dollars’ worth of oil in Eastern Africa
alone (Levitt, 2011). FDI inflows to the oil rich African countries have continued to
grow over recent years and other countries, including countries in Southern Africa,
have discovered oil fields within their borders (Ernst and Young, 2011). The rapid
growth of the economies of Asian countries is one of the more prominent reasons for
the higher investment in the African oil industry. In particular, the growth in China
triggered strong demand for African oil and China is now one of the biggest
contributors to the higher FDI received by the African oil sector. Chinese interest in
the African oil industry showed an increase during the 1990’s with Africa contributing
20 percent of their oil imports in 1999. This continued to rise to 31 percent in 2005 as
Africa now plays a large role in China’s new growth strategy (Zhao, 2007: 399-415).
Chinese oil imports from Africa remained nearly unchanged at 30 percent of their
total oil imports but this percentage is expected to change in the near future as
Reuters (2013) forecasts that Chinese oil demand will increase from 2.5 million bpd
in 2005 to 9.2 million bpd in 2020 (CFR , 2012). However, China is not the only
country interested in African oil. Because of the recent rise in oil prices, the
developed world has also shown interest in African oil (Ernst and Young, 2011;
Harding, 2012; UNCTAD, 2011).
The level of investment is, however, still highly dependent on the attitude of the host
governments towards foreign investors (UNCTAD, 2008). For example, FDI inflows
in the Nigerian oil industry dropped during 2011 because of their proposed
Petroleum Industry Bill (PIB). The Bill was introduced in 2008 with the objectives of
the vesting of petroleum, better allocation of land, better management of petroleum
6
resources, higher participation by the government, better transparency and
governance and lowering the level of environmental damage associated with the
industry (Oil and Gas sector reform Implementation Committee (OGIC), 2009). The
Bill has not yet been passed but is regarded as less favourable to transnational
companies as the government seeks to regulate the oil sector more closely by
introducing stricter criteria for the licensing rights of oil exploration in Nigeria
(UNCTAD, 2011). In contrast, less regulated countries such as Ghana attracted
higher FDI levels and have therefore thrived (UNCTAD, 2011). African governments
have for some time now worked on removing unnecessary regulations and
restrictions, controlling corruption and improving the ease of doing business. By
changing policies, these governments attempt to improve the investment climate to
attract more FDI (UNCTAD, 2008; UNCTAD, 2011; ADB, 2009).
There are contrasting views on the impact of abundant resources, and more
specifically, the oil abundance in Africa. This is widely known as the “resource curse”
(Clarke, 2010). The resource curse entails that the resource abundance of
developing countries has a negative effect in the forms of political instability, more
corruption, a hostile environment and a decline in growth in other sectors of the
economy. In many African countries, including Nigeria and Angola, this seemed to
be the case as these countries have been severely influenced by civil war and
terrorism (Southall and Melber, 2009: 171-173). Mismanagement of foreign funds
and outdated policies are viewed as the main cause of the negative impact of
abundant natural resources in developing countries (Ernst and Young. 2011). These
causes lead to a small percentage of the population realising financial gain while the
rest remain in severe poverty. Therefore, it is important for these countries to
implement the necessary economic reform and support structures to realise
sustainable economic growth and development (Clarke, 2010; Southall and Melber,
2009: 171-173; Ernst and Young. 2011). However, the management of oil revenue
and the so-called oil curse falls outside the scope of this dissertation.
A review of the literature suggests that oil in Africa may in the future create
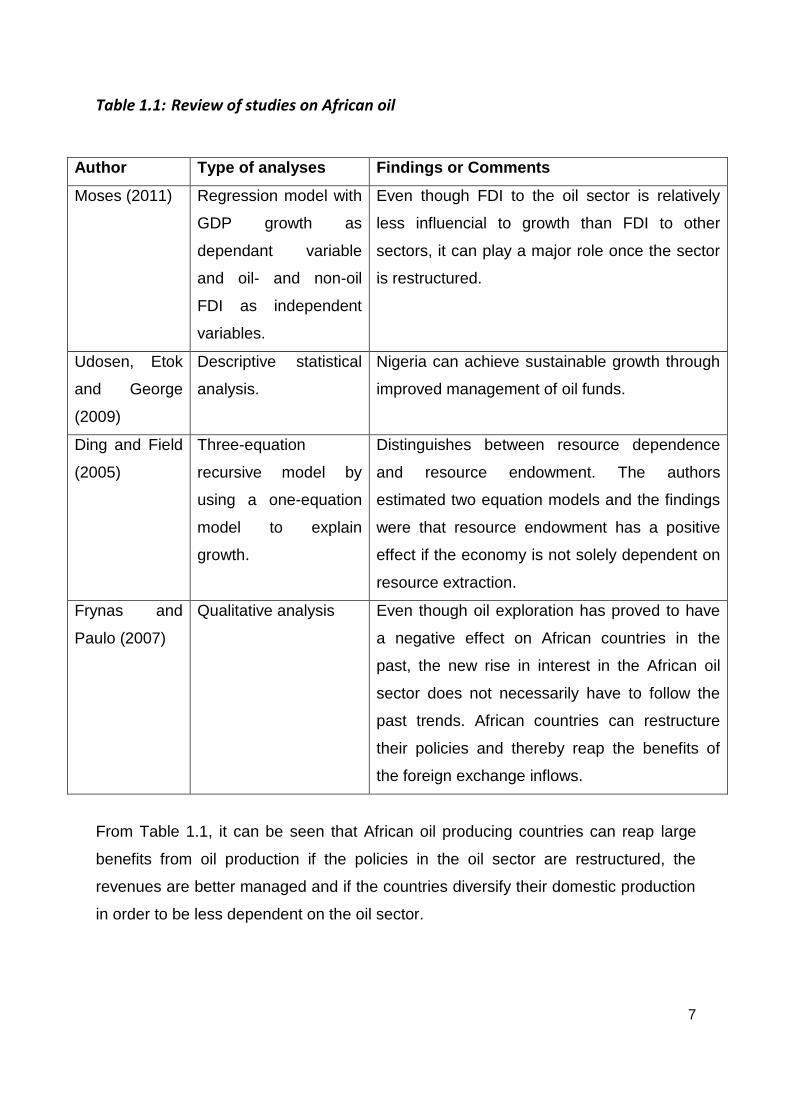
sustainable economic growth and development. Table 1.1 summarises the literature
on growth and oil sector FDI in Africa.
7
Table 1.1: Review of studies on African oil
Author Type of analyses Findings or Comments
Moses (2011) Regression model with
GDP growth as
dependant variable
and oil- and non-oil
FDI as independent
variables.
Even though FDI to the oil sector is relatively
less influencial to growth than FDI to other
sectors, it can play a major role once the sector
is restructured.
Udosen, Etok
and George
(2009)
Descriptive statistical
analysis.
Nigeria can achieve sustainable growth through
improved management of oil funds.
Ding and Field
(2005)
Three-equation
recursive model by
using a one-equation
model to explain
growth.
Distinguishes between resource dependence
and resource endowment. The authors
estimated two equation models and the findings
were that resource endowment has a positive
effect if the economy is not solely dependent on
resource extraction.
Frynas and
Paulo (2007)
Qualitative analysis Even though oil exploration has proved to have
a negative effect on African countries in the
past, the new rise in interest in the African oil
sector does not necessarily have to follow the
past trends. African countries can restructure
their policies and thereby reap the benefits of
the foreign exchange inflows.
From Table 1.1, it can be seen that African oil producing countries can reap large
benefits from oil production if the policies in the oil sector are restructured, the
revenues are better managed and if the countries diversify their domestic production
in order to be less dependent on the oil sector.
8
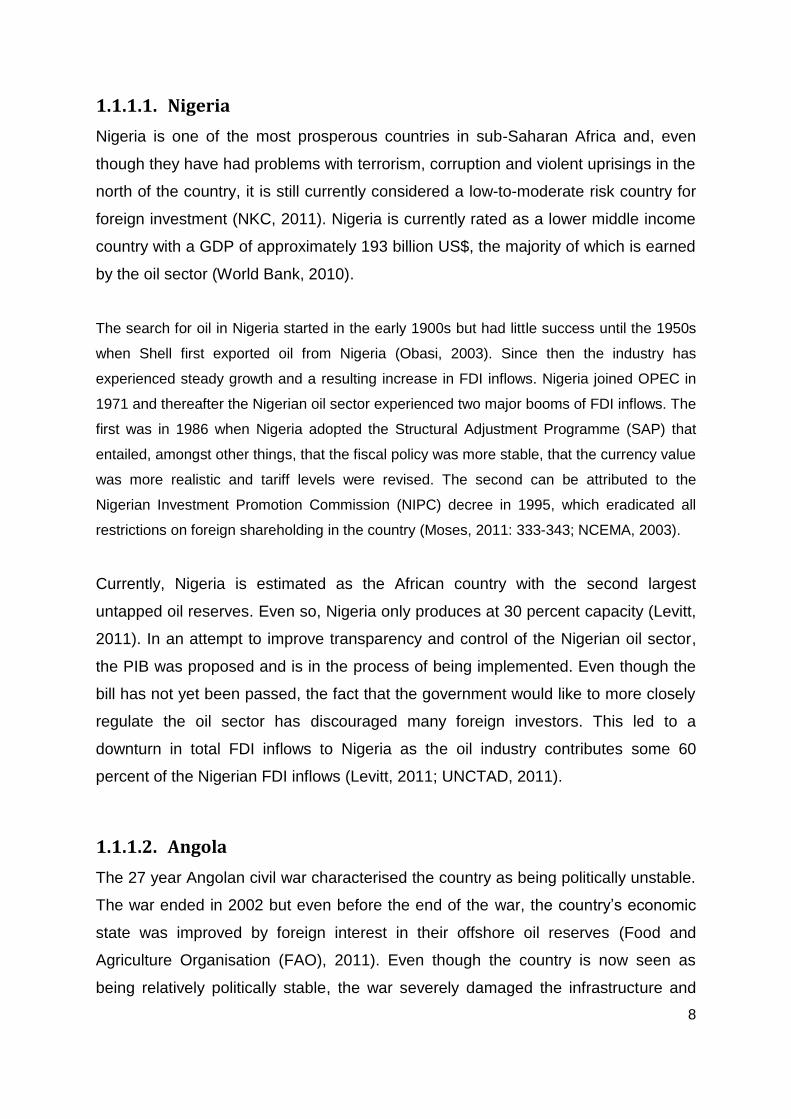
1.1.1.1. Nigeria
Nigeria is one of the most prosperous countries in sub-Saharan Africa and, even
though they have had problems with terrorism, corruption and violent uprisings in the
north of the country, it is still currently considered a low-to-moderate risk country for
foreign investment (NKC, 2011). Nigeria is currently rated as a lower middle income
country with a GDP of approximately 193 billion US$, the majority of which is earned
by the oil sector (World Bank, 2010).
The search for oil in Nigeria started in the early 1900s but had little success until the 1950s
when Shell first exported oil from Nigeria (Obasi, 2003). Since then the industry has
experienced steady growth and a resulting increase in FDI inflows. Nigeria joined OPEC in
1971 and thereafter the Nigerian oil sector experienced two major booms of FDI inflows. The
first was in 1986 when Nigeria adopted the Structural Adjustment Programme (SAP) that
entailed, amongst other things, that the fiscal policy was more stable, that the currency value
was more realistic and tariff levels were revised. The second can be attributed to the
Nigerian Investment Promotion Commission (NIPC) decree in 1995, which eradicated all
restrictions on foreign shareholding in the country (Moses, 2011: 333-343; NCEMA, 2003).
Currently, Nigeria is estimated as the African country with the second largest
untapped oil reserves. Even so, Nigeria only produces at 30 percent capacity (Levitt,
2011). In an attempt to improve transparency and control of the Nigerian oil sector,
the PIB was proposed and is in the process of being implemented. Even though the
bill has not yet been passed, the fact that the government would like to more closely
regulate the oil sector has discouraged many foreign investors. This led to a
downturn in total FDI inflows to Nigeria as the oil industry contributes some 60
percent of the Nigerian FDI inflows (Levitt, 2011; UNCTAD, 2011).
1.1.1.2. Angola
The 27 year Angolan civil war characterised the country as being politically unstable.
The war ended in 2002 but even before the end of the war, the country’s economic
state was improved by foreign interest in their offshore oil reserves (Food and
Agriculture Organisation (FAO), 2011). Even though the country is now seen as
being relatively politically stable, the war severely damaged the infrastructure and
9
reconstruction is still under way (USAID, 2011). Angola is currently rated as a lower
middle-income country with a GDP of approximately 75 billion USD, the majority of
which is earned by the oil sector (FAO, 2011).
Oil production in Angola started in the 1950’s and, ever since, the country has
become more dependent on the oil industry (OPEC, 2011). In 1998, Angola
experienced an upwards spike which boosted their FDI inflows from under 200
million US$ to over 1.4 billion US$. This increase was due to large offshore oil
exploration that attracted various foreign investors and in 2007, Angola joined the
OPEC group (OPEC, 2011). From that time, the FDI inflows have shown a strong
increase with the exception of periods of downturn due to perceptions of political
instability (FAO, 2011).
Angola is currently one of the region’s largest FDI recipients and the majority of FDI
inflows are attributed to the oil sector. The Angolan oil sector became the largest oil
exporter to China in 2005, contributing more than 50 percent of China’s oil imports
(Zhao, 2007: 399-415). One significant problem currently faced by Angola is that
their oil output exceeds their OPEC quota (UNCTAD, 2011).
1.2. Problem statement
A problem faced by Africa is the lack of local investment because of the low savings
rate. To explore and develop Africa’s oil resources, investment funding and
knowledge in the field is required. Africa lacks both of these assets. Nigeria and
Angola are two of the largest oil producers in Africa. By attracting FDI to this sector,
not only will the Nigerian and Angolan oil sectors gain the necessary funding for oil
extraction but they will also gain knowledge from transnational corporations. Greater
FDI is needed to fully exploit their available oil resources. Although many studies
have been undertaken on the factors that attract FDI, few studies have focussed on
oil sector specific FDI. Therefore, the aim of this dissertation is to determine and
compare the factors that attract oil sector FDI in Angola and Nigeria.
10
1.3. Motivation
Nigeria and Angola are both countries richly endowed with crude oil. The problem
faced by the vast majority of the African continent however is to develop and extract
these resources to better their poor development standing. To develop the upstream
sector, investment funding and knowledge in the field is required. Africa lacks in both
investment funding and technical knowledge. By attracting FDI to this sector, not
only will the Nigerian and Angolan oil sectors gain the necessary funding for oil
extraction but they will also gain knowledge from transnational corporations.
1.4. Objectives
The main objective of this dissertation is, primarily, to determine the external factors
and internal factors that influence FDI inflows to the Nigerian and Angolan oil sector.
Secondly, the dissertation will compare the main contributing factors to establish
which of the factors play a significant role in attracting FDI to oil sector in these
countries in order to identify similarities and differences.
1.4.1. Sub-objectives
The sub-objectives of this dissertation are to:
Provide a literature review of FDI and the oil industry.
Review the current trends, in FDI flows and in the oil sector from a global, an
African and a country specific perspective.
Analyse the literature and current trends in Nigeria and Angola in order to
determine the factors that may have an influence on attracting oil sector FDI.
Use FDI data and test the factors that may have a significant influence on
attracting FDI inflows to the oil sectors of Nigeria and Angola.
Compare the findings of both countries and draw conclusions from this
comparison and thereafter, to make recommendations.
11
1.5. Research method
This dissertation will undertake both a literature review and an empirical analysis.
The literature review will provide an overview of FDI theory, the motives for
investment, the types and benefits thereof; an overview of the African and, more
specifically, the Nigerian and Angolan oil industries and the influence that FDI inflows
have had on these sectors. The current FDI inflow trends in Nigeria and Angola will
be reviewed and oil sector FDI compared to the other FDI attracting industries. The
dissertation will then examine and compare the current state of the Nigerian and
Angolan oil industries.
The empirical analysis will consist of a country comparison through four least square
regression models (domestic models for Nigeria and Angola and the global models
for both countries) using data between 1990 and 2011 obtained from the World data
Bank and the BP statistical review 2012. The data used will describe the traditional
determinants of FDI inflows laid out in literature review and other determinants
derived from past studies of FDI inflows in transitional economies and oil sector
dependent countries. However, it must be noted that the lack of accurate and
sufficient time series data for Nigeria and Angola constrains the analysis.
1.6. Outline of the dissertation
The remainder of this dissertation is structured as follows: Chapter two provides a
literature review of FDI theory and oil sector theory. Chapter three provides an
overview of current trends in FDI inflow trends and the oil sector in a global, African
and country specific perspective, focusing on Nigeria and Angola. Chapter four then
provides a theoretical framework and detailed description of the data used before
presenting a domestic and global model for Nigeria and Angola and comparing the
influencing factors in each country. Finally, Chapter five summarises the dissertation
and provides recommendations for further studies.
12
Chapter 2: Literature review of FDI and the oil sector
2.1. Introduction
Through a theoretical explanation of FDI and the oil sector, a better understanding
can be reached of the necessity of FDI to developing countries in Africa and of the
role that the African oil industry plays in obtaining higher level of FDI. Thereafter, the
factors influencing the oil sector FDI can be investigated.
This chapter will consist of two sections, the first of which will discuss the literature
on FDI (Section 2.2). This will include the difference between FDI and portfolio
investment, different types of FDI, benefits and costs of FDI and the determinants of
FDI. The second section will discuss oil industry theory (Section 2.3) which will
include investment type, oil reserves, the different companies who invest in the
industry and the contrasting views of the so-called oil curse.
2.2. FDI theory
As discussed in chapter one, FDI can be highly beneficial to African countries by
supplementing their savings rates as well as having a positive influence on the
industry in which the investment is made. Therefore, the theoretical foundations of
FDI are explained in this section to facilitate a better understanding of the following
chapter on the current trends in FDI.
2.2.1. FDI Definitions
FDI can be defined as:
“the objective of obtaining a lasting interest by a resident entity in one
economy in an economy other than that of the investor. The lasting
interest implies the existence of a long-term relationship between the
direct investor and the enterprise and a significant degree of influence on
the management of the enterprise. Direct investment involves both the
initial transaction between the two entities and all subsequent capital
13
transactions between them and among other affiliated enterprises, both
incorporated and unincorporated” (OECD, 1996).
The standard definition for FDI according to UNCTAD (2005) is:
“A long-term relationship involving a significant degree of influence on the
management of the enterprise encompasses a heterogeneous group of
corporate actors, some with complex integrated production structures,
others with little more than a sales outlet in a single foreign market, a
problem that is hardly resolved by reducing the control threshold to a
minimum 10 per cent equity claim”.
According to the International Monetary Fund (IMF, 1993), FDI has three
components:
1. equity investment,
2. reinvested earnings, and short-
3. and long-term inter-company loans between parent firms and foreign
affiliates.
The main difference between FDI and other investments from abroad lie in the
lasting interest and control by foreign investors through management of the host
company.
Therefore, FDI and foreign Portfolio investment must not be confused. Portfolio
investment entails the purchase of securities on the stock market (Rutherford, 1995:
1299-1324). Portfolio investors do not necessarily intend to influence the
management or direction of the company, the investment is usually shorter in term
and funds can more easily be divested (UNCTAD, 1998). In contrast, FDI investors
have a much higher interest in the wellbeing of the company and therefore, the
investors seek to influence the management to better productivity (Itay and Razin,
2005). Further, FDI investment is usually long-term and therefore more stable when
considering the company’s growth prospects (Rutherford, 1995: 1299-1324;
UNCTAD, 1998; Itay and Razin, 2005). FDI is also less susceptible to the effect of
changing exchange rates than is portfolio investment because a lower valued
14
currency can lead to lower cost of production, which will have a positive effect on
direct investors (UNCTAD, 1999).
2.2.2. Categorising FDI
FDI can be categorised by its direction, the type of investment and the investors’
motivations. Firstly, the direction is dependent on whether FDI flows into the “home”
economy from abroad or if investment flows outward from the “home” country to a
foreign economy (IMF, 1993). Secondly, the investment type refers to whether
investment is made by obtaining a share of an existing company in the host country
or obtaining the existing company as a whole or investing to fund new facilities in the
host country (Estrinet and Meyer, 2011: 3-5). Lastly, FDI can also be categorised by
the reason for investors to choose a certain country to invest in. These reasons may
include the procurement of a certain natural resource, the penetration of a growing
market or better production efficiency in the foreign market than in the local market
(Basu and Srinivasan, 2002; UNCTAD, 1998).
2.2.2.1. Categorising FDI according to the direction of flow
The direction can be distinguished by either inflows or outflows. FDI inflows are the
investment capital received from investors abroad or non-resident investors into a
certain host country (IMF, 1993). FDI outflows on the other hand are local investors
or residents of the “home” country funding activities abroad (IMF, 1993).
2.2.2.2. Categorising FDI according to investment type
The type of investment can be divided into Greenfield or Brownfield investment
(Nocke and Yeaple, 2006: 1-4) as previously stated. Greenfield investment is direct
investment through the funding of new facilities in the host country. This type of
investment is optimal for the host country as it provides linkages to the global market
place, the transfer of knowledge and technology as well as job creation (Qiu and
Wang, 2011: 836-838). Brownfield investment, on the other hand, consists of
mergers and acquisitions. Ownership of existing assets owned by local firms is
transferred to foreign companies (Paull, 2008: 9-15). This form of investment does
15
not necessarily lend itself to long-term benefits to the local economy, as does
Greenfield investment (Estrinet and Meyer, 2011: 3-5).
2.2.2.3. Categorising FDI according to investors’ motivations
Investors seek certain benefits that the host country possesses that encourage the
investor to invest in the country. These motivations include natural resource seeking,
efficiency seeking and market seeking investment (Basu and Srinivasan, 2002;
UNCTAD, 1998). Natural resource seeking investment entails the search for specific
resources of which the host country is endowed with. Included in this classification is
investment from abroad in exploration of oil, gold and coal in African countries.
Secondly, market-seeking investment entails that investors would invest in the host
country because of the sheer size of the local market and the economic growth in the
host country. Lastly, efficiency seeking investment entails that investors are driven to
invest in the host country to reap the benefits of special features that the host
country possesses. These features may include low cost labour, a highly skilled work
force or technological and infrastructural superiority (Basu and Srinivasan, 2002;
UNCTAD, 1998).
2.2.3. Benefits of FDI
The benefits of FDI can be divided into direct and indirect effects of FDI. Direct
effects include supplementing local savings to achieve greater production within the
host country while indirect effects include several effects that better growth and
development in a country through the interest of foreign investors and the presence
of foreign firms (Lumblila, 2005).
2.2.3.1. Direct positive effects of FDI
The positive correlation between FDI and economic growth has been proven by a
number of empirical studies including studies by Braunstein and Epstein (2000) and
by Gallagher and Zarsky (2003: 19-44). Higher availability of capital in the host
country leads to higher production and therefore to an increase in GDP growth
(Dabla-Norris, Honda, Lahreche, Verdier, 2010: 4-17).
16
In developing countries, this is all the more evident as their low domestic savings
rate is the reason for lower domestic investment (Kirk and Celemens, 1999).
Through increased FDI inflows, the gap between the domestic savings rate and the
desired investment level can be filled. This can cause FDI to have a larger effect on
economic growth in developing countries than in developed countries (Dabla-Norris,
et al, 2010: 4-17).
2.2.3.2. Indirect positive effects of FDI
Most indirect effects of FDI arise from multi-national corporations (MNCs) who invest
in the host country. MNCs are usually large businesses that operate in a number of
countries. The expansion of these companies into countries abroad is usually a
result of strong growth in the company due to their superiority in technological
advances and better productivity when compared to other and smaller companies
(Aggarwal, Berrill, Hutson and Kearney, 2010: 557-577).
The first positive externality brought about by MNCs is the transfer of technology.
This can be attributed to research and development, as MNCs are known for their
expenditure in these areas. The transfer of technology arises as other businesses
observe the MNC and adopt some of their processes and, thereby, become more
efficient (Keller, 2009: 1-5, 59-61). Secondly, it is the probability of knowledge
transfers from MNCs. This entails the transfer of knowledge from one employee to
another or skills obtained through in house training by the MNC. These skills and
knowledge obtained from the MNC can be transferred by the employee leaving the
MNC and thereafter applying the newfound knowledge and skills in another local
company (Keller, 2009: 1-5, 59-61). Thirdly, the employment level in the country is
increased as jobs are created through expansion of the companies within which
investment takes place. Some studies, however, found employment not to be
proportional to the amount of FDI being invested. The findings were that FDI does
increase per capita income that promoted economic development (Waldkirch,
Nunnenkamp and Bremont, 2009). Finally, companies investing in a country or
region will ensure that infrastructure is in place for their operations and this will in
turn motivate the government concerning infrastructure development (ECOSOC,
2000; UNCTAD, 1999).
17
There are several other positive indirect influences of FDI. Three of these influences
include the promotion of international safety standards, better resource allocation
and stronger financial markets (Lumblila, 2005).
2.2.4. Costs of FDI
The majority of studies find that the effects of FDI on the economy are positive
(Blomstrom, Kokko and Zejan, 2000: 7-9; Sjohlomn, 1999). However, there are
contrasting views on the effects of FDI in developing countries. There are costs of
FDI to the host country including the cost of FDI to the host country through the
crowding out effect (Aitken and Harrison, 1999: 605-617) and constraints of
absorbing the positive effects of FDI (Alfaro Chanda, Kalemli-Ozcan and Sayek
2009: 242-256), as well as over dependency on FDI (Adams, 2009: 939-949;
Rhagavan, 2000).
The crowding out effect is also known as the market stealing effect (Aitken and
Harrison, 1999: 605-617). It entails that the domestic demand in the host country
moves away from domestic firms to multi-national firms, and that the domestic firms
suffer more because the lower demand outweighs the positive effects from spillovers
from the multi-national firms. As there may be large gap in technology when
comparing domestic firms to foreign firms in developing countries, the possibility of
the crowding out effect is larger than in developed countries. Therefore, policies in
the host country should be formulated to best suit the host economy as excessive
FDI inflows may not be in the host country’s best interest (Meyer, 2004: 259-277;
Blomstrom, et al. 2000: 7-9).
Constraints in developing countries may include technological constraints,
infrastructural constraints, educational and healthcare constraints, corruption and
political instability (Alfaro Chanda, Kalemli-Ozcan and Sayek 2009: 242-256).
According to the World Bank (2011), the constraints are caused by a lack of linkages
between the local firms, the local economy and the MNCs. Firstly, technological
constraints occur when the host country does not have the capacity to absorb the
spill-overs because of the technological gap between the host country and the multi-
18
national company (Alfaro, 2003: 13-16). Secondly, infrastructural constraints can be
classified as telecommunications or physical infrastructural constraints. These
constraints cause barriers in absorbing the FDI and therefore the effects of the FDI
might be less than desired (Alfaro, 2003: 13-16). Thirdly, a lack of education and
health care in developing countries play a large role in the deterioration of the
workforces’ productivity as less money is spent on education because of high
mortality rates. This is also why several African countries have a less productive
workforce and, with the high number of AIDS victims in this region, knowledge in the
workforce is lost (Simtowe and Kinkingninhoun-Medagbe, 2011: 2118-2131).
Fourthly, corruption is a cause of lower beneficial influences of FDI being absorbed
as the money being invested only makes the rich and powerful richer and more
powerful. It also leads to lower trust by investors and therefore lowers the country’s
FDI inflow as a whole (Kenisarin and Andrews-Speed, 2008: 301-316). Finally,
political instability is another constraint in obtaining and absorbing FDI as investors
observe countries with political instability as having higher risk for their investments
where government spending may be not be contributing to economic growth
(Neuhaus, 2006).
However, these constraints are not necessarily negative effects of FDI but are rather
a motivation for improvement in developing countries. An increase in FDI is usually
found to have a positive effect on the economy and the general standard of living in
the population even if these effects are not proportionate to the amount of FDI
inflows (Alfaro Chanda, Kalemli-Ozcan and Sayek 2009: 242-256).
Further, high dependence on FDI is also seen as a negative effect on growth and
development as it may cause monopolisation as only one or a few companies with
the means obtained through FDI can deliver the product or service with no
competition in the market. These companies can therefore dominate pricing in their
sector (Rhagavan, 2000). This in turn can negatively influence productivity, income
distribution and employment (Ajayi, 2006; Rhagavan, 2000). High dependence also
implies that the host country is subject to the performance of the investing countries
and investing companies (Adams, 2009: 939-949).
19
2.2.5. Determinants of FDI
FDI inflows are an important element for economic growth in developing countries,
as these countries need to supplement local investment to achieve optimal
investment levels (Kirk and Celemens, 1999). Further, the local economy can
benefit through indirect effects of FDI (Keller, 2009: 1-5, 59-61). To increase the
levels of FDI inflows, it is important to understand those factors that play a significant
role in attracting FDI inflows. These factors can be divided into macro and micro
determinants as explained below.
2.2.5.1. Macro determinants of FDI
Macro-economic determinates exist throughout the whole economy of the host
country and they include political risk, exchange rates, inflation rates, openness of
the market, domestic investment, value of exports and the budgetary deficit (Naude
and Krugell, 2003: 2-12).
Political risk includes social instability, internal and external conflicts and
expropriation within the host country (Musonera, 2008). It can influence a company
through production disruption, damage to property and even the confiscation of
goods (Lucas, 1993: 391-406). Political risk may be brought about by change in
government rule and the nature of the new government, the mind-set of the opposing
parties, the possibility of labour disruptions, the possibility of domestic terrorism,
corruption and the competence of the legal system (Naude and Krugell, 2003: 2-12).
Investors may be expected to invest in a country with sound political stability rather
than in a politically unstable country.
The influence of exchange rates varies between countries (Blonigen, 2005: 4-18). It
can be argued that a devaluation of the host countries currency leads to lower
production cost relative to the country of the investor that can give the company in
the host country an internationally competitive advantage if the business is export
orientated. If the business relies heavily on imports, the opposite may be true as the
production cost relative to other countries may in fact increase (Naude and Krugell,
2003: 2-12). The opposite can also be argued through the returns of investment
20
being larger as the host countries currency appreciates (Froot and Stein, 1991:
1215-1216). The motivation for investment plays a large role in the desired exchange
rate as market seeking investors would prefer a higher valued currency in the host
country whereas efficiency seeking and resource seeking investors would most
probably prefer a higher currency value in the host country (Blonigen, 2005: 4-18).
Volatile fluctuation in the currency is however expected to decrease FDI inflows to
the host country as it raises doubt concerning the economic stability of the host
country (Urata and Kawai, 2000: 79-103).
It can be argued that a higher inflation rate leads to higher returns on investment as
the higher price in the host country relative to the country of the investor may lead to
greater profitability (Botric and Skuflic, 2005: 2-7, 14-20). A contrasting argument
holds, however, that inflation is an indicator of economic stability in the host country
and therefore higher or volatile inflation rates have a negative effect on the
perception of investors that subsequently entails lower FDI inflows (Demirhan and
Masca, 2008: 357-363; Urata and Kawai, 2000: 79-103).
Similar to exchange rates, the effect of trade and investment openness is linked to
the motivation for investment. Openness in terms of trade leads to lower FDI through
market seeking investors as exporting goods to the host country may be more cost
efficient. Greater openness of trade may, however, increase FDI inflows to the host
country by efficiency seeking and resource-seeking investors as these investors
would like to export goods from the host country (Seim, 2009: 11-70). In general and
especially in developing countries, however, FDI will increase with more relaxed
investment and trade policies. The more restrictive the policies, the lower the FDI
inflows will be (Onyeiwu and Sherestha, 2004: 98-105).
Domestic savings contribute to the current growth and development in a country and
indicate whether there is sufficient infrastructure. In resource rich countries, however,
domestic savings is believed to have a less significant influence on FDI inflows
(Ndikumana and Verick, 2008: 2-5, 26-27). Domestic savings is strongly correlated
with the openness of the host country. The openness of the host country does,
however, not necessarily entail that the host country has a high quantitative value of
21
exports (Singh and Jun, 1995). Yousaf, Hussain and Ahmad (2008: 35-56) found
that export growth has a negative effect on FDI in the short term but a positive effect
in the long-term. This may be because the company is not restricted to their local
market and can display larger margins of growth and therefore higher revenue
(Naude and Krugell, 2003: 2-12).
A government budget deficit usually leads to an increase in taxation. Therefore, it
can have a direct influence on the company being invested in by the foreign
investors (Azam, Khan, Hunjra, Ahmad and Chani, 2010: 4306-4313). This means
that a large budgetary deficit can lead to tax uncertainty and the resulting lower FDI
inflows (Naude and Krugell, 2003: 2-12).
2.2.5.2. Micro determinants of FDI
Micro-economic determinants exist on an industry level that directly influences the
profitability and cost of FDI. These include growth within the market, the market size,
the cost of labour, the policies of the host countries government and trade barriers
(Naude and Krugell, 2003: 2-12).
Growth within the market is particularly imperative to market seeking investors as the
growth of the market indicates potential growth for the company that is being
invested in and therefore growth of investment and revenue for the investor (Botric
and Skuflic, 2005: 2-7, 14-20). This determinant is not as significant to resource or
efficiency seeking investors as their interest lies with factors other than that
concerning the local market, including cost, skill level and productivity of labour and
the cost and accessibility of resources.
There is a vast literature on market size as a determinant of FDI. The conclusion of
the majority of the studies shows that a country with a larger population is likely to
receive higher FDI as this indicates larger local demand for the host company
(Resmini, 2000: 65-89; Bevan and Eastrin, 2000: 7-9). Similar to growth in the
domestic market, however, market size is more significant to market seeking
investors and does not pertain to resource seeking and efficiency seeking investors
to the same degree (Botric and Skuflic, 2005: 2-7, 14-20).
22
Lower labour cost in the host country relative to the investors’ country can attract
higher levels of FDI as this may lead to lower production costs. This especially
pertains to efficiency seeking FDI but can also have an influence on both market
seeking and resource seeking investment (Nunes, Oscategui and Peschiera, 2006:
2-11)
Policies of the host country’s government will influence the decision to invest in a
foreign country, as investors will expect certain advantages from investing in the
location. The policies and structures put in place by the host government lay the
foundations for the investment climate in the country. These foundations include the
quality of infrastructure, the quality of public services and the skills level of the
general population (Te Velde, 2001). International companies tend to invest in
countries with more stable economic policies that are investment friendly as
government policies may influence the operations of the company that is invested in
(Musonera, 2008). The host government also initiates and enforces laws that may
influence the investor’s decisions. These laws include tax laws, liability laws, trade
restrictions and property rights (Musonera, 2008). According to Morgan (1998), the
more liberal the laws are, the more likely FDI inflows are to increase and the
management within such an investment climate will be more efficient and likely to
lead to improved spill over’s into the host economy.
Trade barriers can take the form of tariff or non-tariff barriers (Fliess and Busquets,
2006: 5-8). Tariffs include import and export taxes as well as any duties paid to the
governing body to transport goods across a countries border. Non-trade barriers
include a number of elements that hinder trade between countries. Amongst others,
these barriers include import and export tariffs and quotas, customs administration
and technical, health and safety restrictions (Fliess and Busquets, 2006: 5-8). The
impacts of trade barriers are uncertain as FDI inflows may increase because of
higher trade barriers as FDI may be the only way that companies can cost effectively
enter the market. On the other hand, companies that would like to export or have to
import goods for production reasons may be reluctant to invest in a country with high
trade barriers and this may deter FDI inflows (Lim, 2001: 4-9, 10-12).
23
2.3. Oil sector theory
Traditionally FDI in Africa was mainly attracted by natural resources like gold and
coal but for some time now, the oil industry has been showing an increased ability to
attract FDI (Levitt, 2011). The oil sector is currently the highest FDI recipient sector
in Africa and, according to many economists, the oil industry is the continent’s way
forward and a doorway to a brighter future regarding sustainable economic growth
and development (Levitt, 2011).
Africa is a well-endowed continent when considering their crude oil reserves (ADB, 2010). In
2010, Africa supplied approximately 11 percent of worldwide oil supply and the African
untapped oil reserves constitutes of approximately 10 percent of the total worldwide proven
oil reserves (PriceWaterhouseCoopers, 2010). In 2012, the African share of global
production remained almost unchanged but the share of African proven oil reserves dropped
to 8 percent. This decrease can be attributed to African proven oil reserves remaining
relatively unchanged in comparison to strong increases to proven oil reserves in North
America (7.2%), the Middle East (6%) and South America (2.4%) between 2010 and 2012
(BP, 2011; BP 2013).
Table 2.1 illustrates the four major oil producing countries in sub-Saharan Africa
along with their current production, proven oil reserves in 2012 in comparison to the
African and world total.
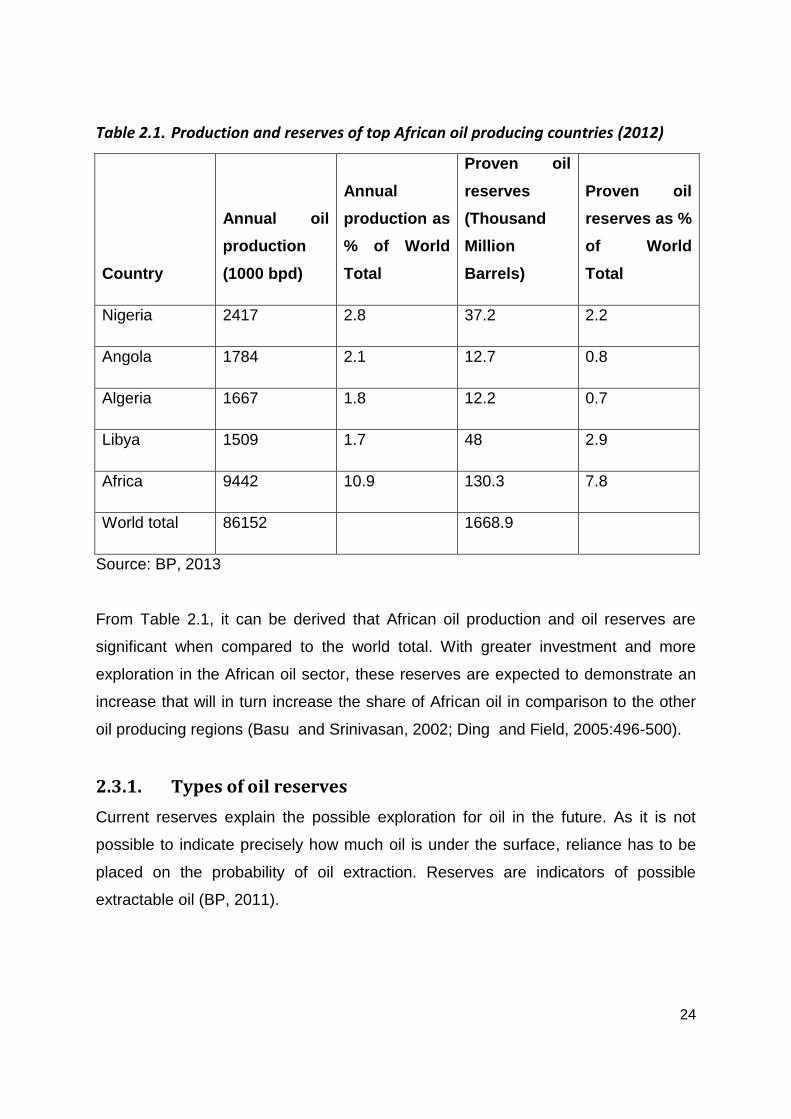
24
Table 2.1. Production and reserves of top African oil producing countries (2012)
Country
Annual oil
production
(1000 bpd)
Annual
production as
% of World
Total
Proven oil
reserves
(Thousand
Million
Barrels)
Proven oil
reserves as %
of World
Total
Nigeria 2417 2.8 37.2 2.2
Angola 1784 2.1 12.7 0.8
Algeria 1667 1.8 12.2 0.7
Libya 1509 1.7 48 2.9
Africa 9442 10.9 130.3 7.8
World total 86152 1668.9
Source: BP, 2013
From Table 2.1, it can be derived that African oil production and oil reserves are
significant when compared to the world total. With greater investment and more
exploration in the African oil sector, these reserves are expected to demonstrate an
increase that will in turn increase the share of African oil in comparison to the other
oil producing regions (Basu and Srinivasan, 2002; Ding and Field, 2005:496-500).
2.3.1. Types of oil reserves
Current reserves explain the possible exploration for oil in the future. As it is not
possible to indicate precisely how much oil is under the surface, reliance has to be
placed on the probability of oil extraction. Reserves are indicators of possible
extractable oil (BP, 2011).
25
The definition of proven oil reserves may vary, as there is no universally accepted
standard definition of proven oil reserves. However, the most commonly used
definition is:
"the estimated quantities of oil which geological and engineering data
demonstrate with reasonable certainty to be recoverable in future years
from known reservoirs under current economic and operating conditions"
(BP, 2011).
Proven reserves are usually reserves with a recovery probability of 90 percent and
higher. These proven reserves may increase through technological advances and
improved economic conditions (BP, 2011).
Probable reserves indicate oil reserves that have a recovery probability of 50 percent
and higher. Therefore, using current technological standing and economic
conditions, the chances of oil being produced in the future is higher than 50 percent
(BP, 2011).
Possible reserves indicate oil reserves that are significant but with a probability of
less than 50 percent of being recovered. These reserves tend to become probable or
even proven reserves as production continues and the production process improves.
This is because the probability of oil production increases as geological,
technological and economic factors changes (BP, 2011).
2.3.2. Upstream versus downstream investment
Investment in the African oil sector can be categorised according to the activities in
the oil sector in which investment is made. These categories are known as upstream
and downstream investment. Upstream investment entails investment in exploration,
which includes surveying and drilling. It also involves the extraction and primary
production of oil once a significant production well is found (Fauli-Oller, Sandoris
and Santamaria, 2011: 884-898). Downstream investment on the other hand entails
investment in the refinery and the production of by-products of oil (Fauli-Oller,
Sandoris and Santamaria, 2011: 884-898). In African countries, the majority of FDI
inflows are received in upstream investment. Usually, upstream investment would
26
have been the core focus of this type of dissertation but, the availability of data did
not allow for separation of FDI into categories. Therefore, the dissertation was
refocused.
2.3.3. Role players in the oil sector
When reviewing the oil sector, it is essential to realise that there are companies of
different sizes and objectives each fulfilling a role in the oil sector. These companies
include small independent companies, fully integrated multi-national oil companies,
national oil companies and other companies that all fulfil supplementary functions.
2.3.3.1. Small independent oil companies
Small independent oil companies are non-integrated companies that focus their
resources on exploration rather than allocating a portion of their resources to refinery
and marketing (Jent, 2007). They also focus on a specific area rather than cross-
border operations (Jent, 2007). Through the focus on one segment of the industry,
they are capable to compete with large integrated oil companies (Petro Strategies,
2011; Akello, 2010). These companies range in size but characteristics of small
independent oil companies are usually that they produce less than 50 000 barrels
per day (Jent, 2007).
2.3.3.3. Fully integrated multi-national oil companies (MNOCs)
MNOCs or international oil companies (IOCs) are well known companies as they
supply petroleum to final consumers. In the oil industry, they are known as the super
majors (Petro Strategies, 2011). These companies include BP, Chevron Corporation,
ExxonMobil Corporation, Royal Dutch Shell, Total and ConocoPhillips Company.
The activities of these companies range from initial exploration to any downstream
activity, which means that they are involved with nearly all activities in the oil sector.
These companies are multi-national and are listed on the stock exchange. Their
investment in African countries is much larger than small independent companies
(Petro Strategies, 2011; Kingdom Zephyr, 2011). Some of their activities (mainly
initial exploration) are, however, outsourced to small independent oil companies.
27
2.3.3.2. National oil companies (NOCs)
National oil companies are state owned oil companies that usually exist in oil rich
countries. Examples of these companies include Sanangol in Angola and the
Nigerian National Petroleum Corporation (NNPC) in Nigeria. Fourteen of the top
twenty largest oil-producing companies in the world are national oil companies,
which means that these companies are amongst the largest in the world (Jaffe and
Soligo, 2007: 56-57). However, unlike integrated oil companies their objectives are
related to economic wellbeing of the country rather than to an increase in equity
(Pirog, 2007). In contrast to worldwide trends of moving away from state controlled
enterprise, the state owned companies still have a major influence on worldwide oil
production (Victor, 2007).
Unlike independent oil companies, these companies engage in a number of activities
in the oil sector besides exploration. These activities may include, amongst other
activities, refining and processing of crude oil and the administration, marketing and
supply thereof (Petro Strategies, 2011).
2.3.3.4. Other companies (Service companies)
Contractor companies are also involved in supplement to activities of independent-,
national- and integrated multi-national oil companies. These companies specialise in
a certain field and render their services about surveying and drilling. These
companies are strongly aligned with the needs of the oil company and can prove to
be valuable role players in the upstream industry (E-tech, 2011).
2.3.4. Classifications of Petroleum fiscal systems
Legislation in the host country regulates the degree of ownership that is allowed to
be held by an investing country. The legislation also regulates the workings between
privately owned multi-national or small independent oil companies and national or
state owned oil companies. The legislation therefore determines the petroleum fiscal
system. The role of petroleum fiscal systems is to ensure revenues to the host
country whilst allowing investors to realise a return on investment to a degree that
investors are enticed to invest in the host country’s oil sector. The broad differences
in fiscal systems are illustrated in Figure 2.1 and discussed below.
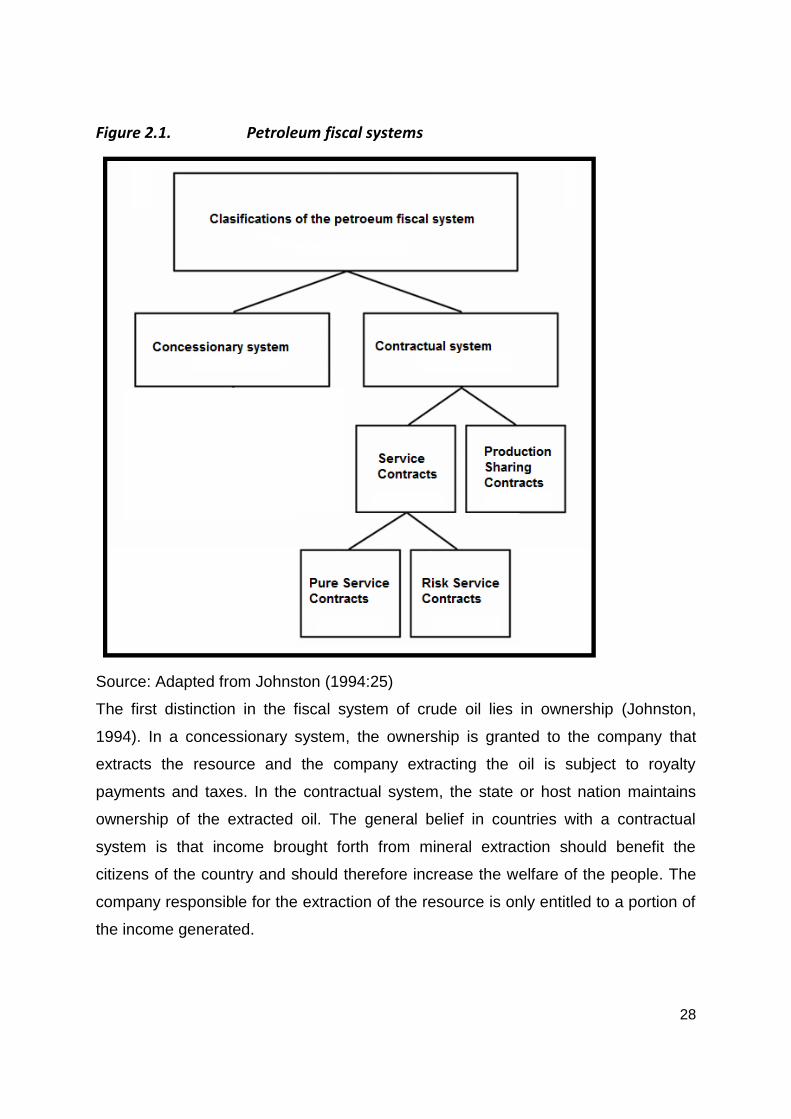
28
Figure 2.1. Petroleum fiscal systems
Source: Adapted from Johnston (1994:25)
The first distinction in the fiscal system of crude oil lies in ownership (Johnston,
1994). In a concessionary system, the ownership is granted to the company that
extracts the resource and the company extracting the oil is subject to royalty
payments and taxes. In the contractual system, the state or host nation maintains
ownership of the extracted oil. The general belief in countries with a contractual
system is that income brought forth from mineral extraction should benefit the
citizens of the country and should therefore increase the welfare of the people. The
company responsible for the extraction of the resource is only entitled to a portion of
the income generated.

29
The contractual system can be divided into service contracts and production sharing
contracts (PSC) also known as production-sharing agreements (PSA). Under a PSC,
the private company is entitled to a certain portion of the profits made from the
extracted natural resource while under service contracts the extracting company is
entitled to payment (whether it be in cash or in crude oil) from the host countries
government for their extraction (Johnston, 1994). Service contracts can be divided
into pure service contracts and risk service contracts. In the case of a pure service
contract, the government is liable for the risk in extraction and the company is
compensated for its services (Omorogbe, 1997). Risk service contracts, on the other
hand, hold the private company liable for the risks during extraction and the
company is not only compensated for their services but they also receive payment
from the government for compensation for the risk taken if the resource is extracted.
If, however, no oil is found or extracted during exploration, these companies receive
no compensation (Smith, Dzienkowski, Anderson, Conine, Lowe, Kramer, 2000).
2.3.5. The natural resource curse
In literature, there is frequently reference to misfortunes in developing countries
because of their resource abundance and their dependency on these natural
resources as the natural resource curse (Clarke, 2010). It is believed that the
abundance of a certain commodity that is in high demand has the effect of creating
political instability, increased corruption, a hostile environment and a decline in
growth in other sectors of the economy. According to literature, this can be attributed
to mismanagement of foreign funds (in this case, FDI in the oil sector) that implies
that a small percentage of the population is enriched while the rest of the country
remains in severe poverty (Clarke, 2010; Ernst and Young. 2011; Southall and
Melber, 2009: 171-173). As a region that is well endowed with oil reserves, Africa will
have to better its management of oil revenues to avoid the negative impact of the
natural resource curse (ADB, 2010). Whether foreign funds have a positive effect or
not is, however, not the debate focused on in this dissertation.
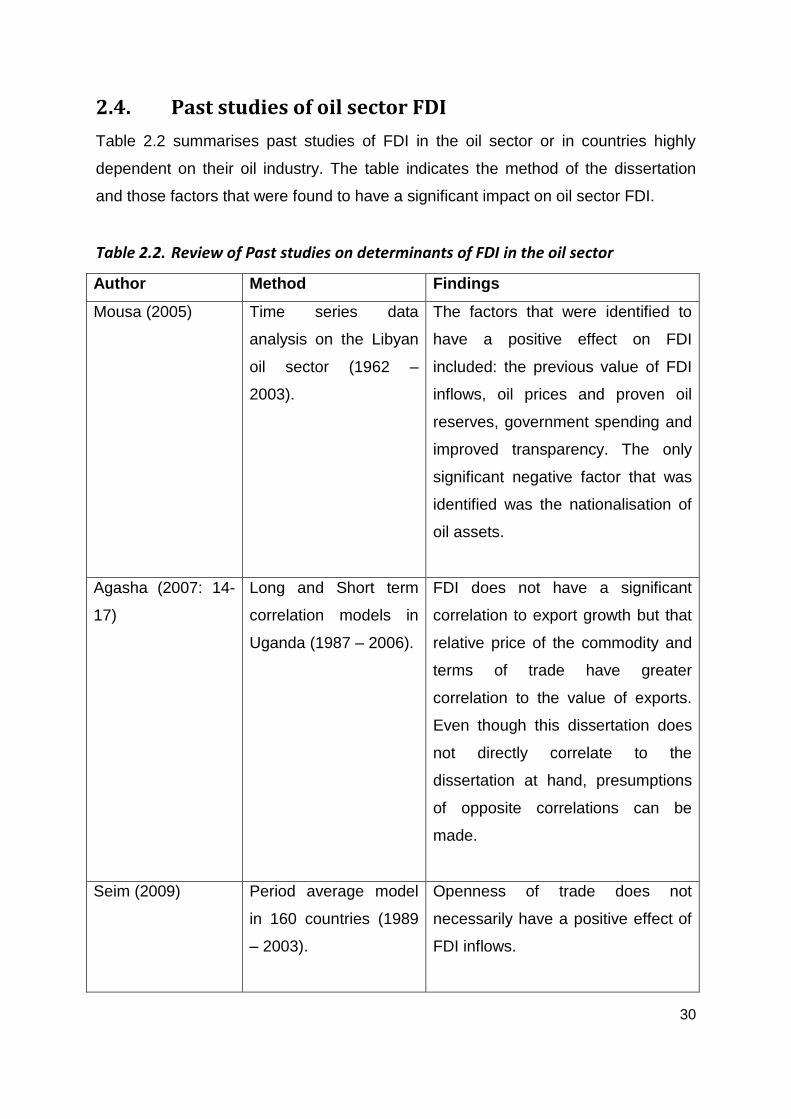
30
2.4. Past studies of oil sector FDI
Table 2.2 summarises past studies of FDI in the oil sector or in countries highly
dependent on their oil industry. The table indicates the method of the dissertation
and those factors that were found to have a significant impact on oil sector FDI.
Table 2.2. Review of Past studies on determinants of FDI in the oil sector
Author Method Findings
Mousa (2005)
Time series data
analysis on the Libyan
oil sector (1962 –
2003).
The factors that were identified to
have a positive effect on FDI
included: the previous value of FDI
inflows, oil prices and proven oil
reserves, government spending and
improved transparency. The only
significant negative factor that was
identified was the nationalisation of
oil assets.
Agasha (2007: 14-
17)
Long and Short term
correlation models in
Uganda (1987 – 2006).
FDI does not have a significant
correlation to export growth but that
relative price of the commodity and
terms of trade have greater
correlation to the value of exports.
Even though this dissertation does
not directly correlate to the
dissertation at hand, presumptions
of opposite correlations can be
made.
Seim (2009) Period average model
in 160 countries (1989
– 2003).
Openness of trade does not
necessarily have a positive effect of
FDI inflows.
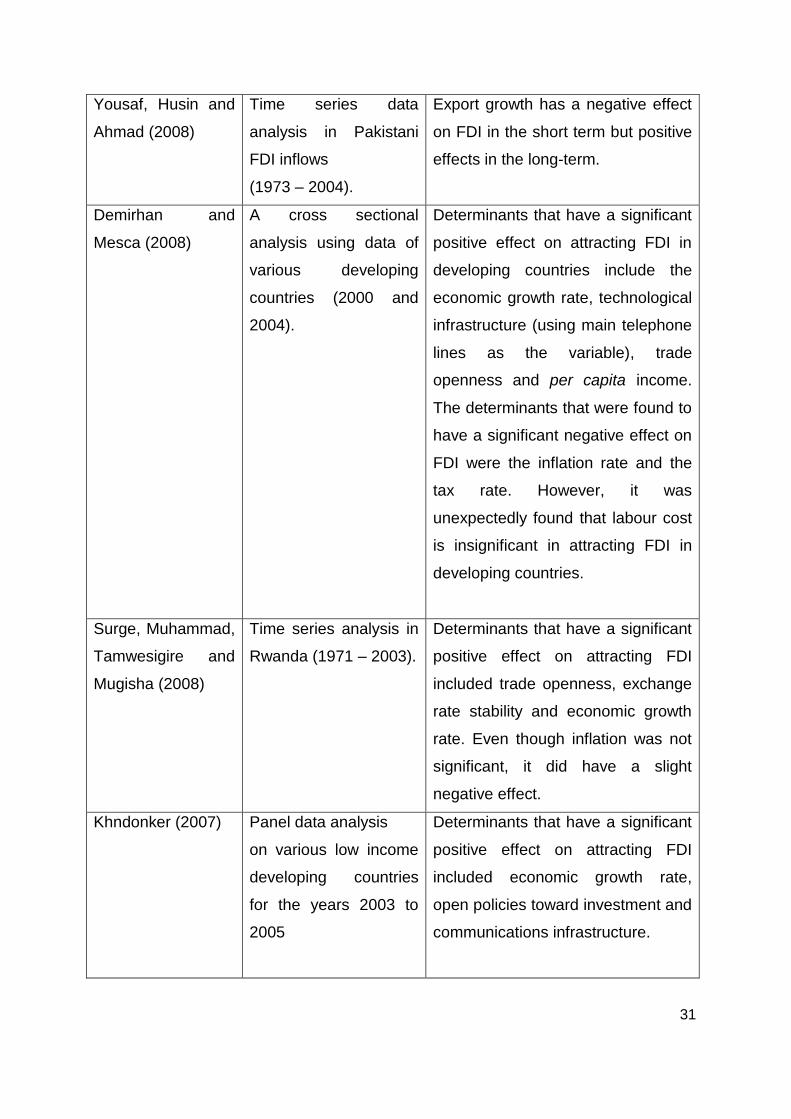
31
Yousaf, Husin and
Ahmad (2008)
Time series data
analysis in Pakistani
FDI inflows
(1973 – 2004).
Export growth has a negative effect
on FDI in the short term but positive
effects in the long-term.
Demirhan and
Mesca (2008)
A cross sectional
analysis using data of
various developing
countries (2000 and
2004).
Determinants that have a significant
positive effect on attracting FDI in
developing countries include the
economic growth rate, technological
infrastructure (using main telephone
lines as the variable), trade
openness and per capita income.
The determinants that were found to
have a significant negative effect on
FDI were the inflation rate and the
tax rate. However, it was
unexpectedly found that labour cost
is insignificant in attracting FDI in
developing countries.
Surge, Muhammad,
Tamwesigire and
Mugisha (2008)
Time series analysis in
Rwanda (1971 – 2003).
Determinants that have a significant
positive effect on attracting FDI
included trade openness, exchange
rate stability and economic growth
rate. Even though inflation was not
significant, it did have a slight
negative effect.
Khndonker (2007) Panel data analysis
on various low income
developing countries
for the years 2003 to
2005
Determinants that have a significant
positive effect on attracting FDI
included economic growth rate,
open policies toward investment and
communications infrastructure.
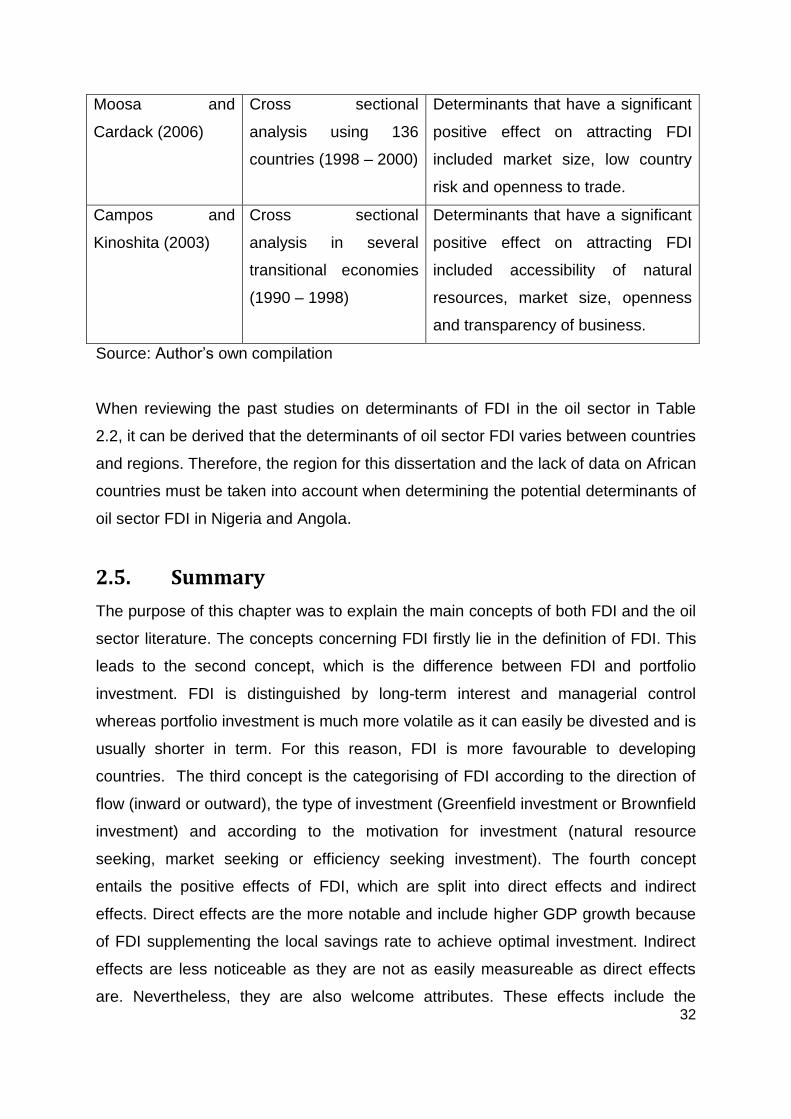
32
Moosa and
Cardack (2006)
Cross sectional
analysis using 136
countries (1998 – 2000)
Determinants that have a significant
positive effect on attracting FDI
included market size, low country
risk and openness to trade.
Campos and
Kinoshita (2003)
Cross sectional
analysis in several
transitional economies
(1990 – 1998)
Determinants that have a significant
positive effect on attracting FDI
included accessibility of natural
resources, market size, openness
and transparency of business.
Source: Author’s own compilation
When reviewing the past studies on determinants of FDI in the oil sector in Table
2.2, it can be derived that the determinants of oil sector FDI varies between countries
and regions. Therefore, the region for this dissertation and the lack of data on African
countries must be taken into account when determining the potential determinants of
oil sector FDI in Nigeria and Angola.
2.5. Summary
The purpose of this chapter was to explain the main concepts of both FDI and the oil
sector literature. The concepts concerning FDI firstly lie in the definition of FDI. This
leads to the second concept, which is the difference between FDI and portfolio
investment. FDI is distinguished by long-term interest and managerial control
whereas portfolio investment is much more volatile as it can easily be divested and is
usually shorter in term. For this reason, FDI is more favourable to developing
countries. The third concept is the categorising of FDI according to the direction of
flow (inward or outward), the type of investment (Greenfield investment or Brownfield
investment) and according to the motivation for investment (natural resource
seeking, market seeking or efficiency seeking investment). The fourth concept
entails the positive effects of FDI, which are split into direct effects and indirect
effects. Direct effects are the more notable and include higher GDP growth because
of FDI supplementing the local savings rate to achieve optimal investment. Indirect
effects are less noticeable as they are not as easily measureable as direct effects
are. Nevertheless, they are also welcome attributes. These effects include the
33
transfer of technology and knowledge, higher levels of employment, better
infrastructure, international safety standards, better resource allocation and stronger
financial markets. The fifth concept is the argument against the effects of FDI that is
split into the crowding out effect and the constraints in absorption capacity. The
crowding out effect entails that foreign firms in the local market may decrease the
market share of local firms in the market and the constraints in absorption capacity
refers to negative attributes of the host country that may cause FDI to have a less
positive effect. Lastly, the determinants of FDI are described by dividing them into
micro-economic and macro-economic determinants. Macro-economic determinants
exist throughout whole economy whereas micro-economic determinants are on the
industry level that directly influences the profitability and cost of FDI.
The concepts concerning the oil sector include firstly the types of oil reserves, which
indicate the probability of extractable oil in the country. The second concept is the
difference between upstream and downstream investment, upstream investment
being the production and extraction of oil and downstream being the refinery and
production of oil by-products. The third concept deals with the different companies
investing in the oil industry. These companies include small independent oil
companies who focus on the exploration of oil, national oil companies who also focus
mainly on exploration but their objectives are related to economic wellbeing of the
country rather than an increase in equity and, finally, fully integrated multi-national oil
companies who focuses of both upstream and downstream activities as well as the
supply of oil to the public. Another topic discussed is the working of the petroleum
fiscal system distinguished between concessionary and contractual systems.
Contractual systems are further divided into PSCs and service contracts. In turn,
service contracts can be either a pure service contract or a risk service contract.
Lastly, the natural resource curse argues that misfortunes in resource rich
developing countries are brought forth because of their focus on natural resources
and the resulting dependency of the country on these natural resources.
A review of past studies on the determinants of FDI inflows in developing and oil
producing countries which may be relevant to the Nigerian and Angolan oil sector
FDI inflows shows that the determinants of oil sector FDI varies between countries

34
and regions. Therefore, the region for this dissertation and the lack of data on African
countries must be considered when determining the potential determinants.
The following chapter will review the current trends in FDI inflows and the oil sector
on the global, African and country specific level.
35
Chapter 3 – Current trends in FDI inflows and the Oil Sector
3.1. Introduction
Africa consists of developing and least developed countries (LDCs) with low
domestic savings rates and, therefore, higher FDI inflows to the region are greatly
beneficial. This is why the oil sector is significant in this regard for the oil sector is the
main source of FDI inflows to this region (UNCTAD, 2011).
The aim of this chapter is to give an overview of what has occurred in FDI inflows
globally, FDI into Africa and FDI into Nigeria and Angola. Along with FDI inflows, the
current situation of the oil sector in the previously mentioned regions will be
discussed. Total FDI inflows in each country will also be compared to Greenfield
investment in the oil sectors of these countries as Greenfield investment values are
identified whereas Brownfield values are only available per request from each party
involved in transactions thus rendering them impractical to use. The previous chapter
provides the foundation for this chapter as it gave a broad overview of underlining
theory of FDI through discussions on the definitions of FDI, the motivations for FDI,
its determinates, and benefits. Further, the chapter discussed broad theory on the oil
sector along with the so-called natural resource curse.
This chapter will start by discussing the global trends in FDI by comparing FDI over a
period of forty years (1970 – 2010). Further, the global oil market and investment in
the oil sector will be discussed by assessing global consumption, production of oil
and crude oil prices together with the influence of investment in the sector. Secondly,
the African economic situation will be summarised as a whole with an overview of
the African oil sector by assessing the largest oil producing countries along with
Greenfield FDI in the oil sector and comparing this to FDI inflows in Africa as a
whole. Thirdly, the Nigerian Angolan economic conditions, FDI inflow trends and oil
sector overviews will be conducted.
36
3.2. Global trends
Global FDI inflows can be used to compare FDI inflows to Africa, Nigeria and
Angola. Through comparing global FDI inflows with the mentioned region and
countries, the performance of these countries about general FDI flow trends can be
illustrated. In this section, FDI trends will be discussed by assessing global FDI
inflows between the years 1970 and 2010. Economic factors influencing FDI inflows
during recent years will be discussed. Thereafter the global oil sector will be
assessed by focussing on the global demand, supply, reserves and the oil price.
3.2.1 Global FDI trends
During the last decade, global FDI inflows increased significantly. In 2007, global FDI
flows reached an all-time high of $1 970 939 (US Dollars at current prices and
current exchange rates in millions) breaking the record set in 2000 by more than 400
billion US dollars (UNCTAD, 2008). These numbers were, however, slightly higher
than the true increase in nominal FDI flows because of the slight depreciation of the
dollar against other major currencies. The boom in FDI flows during 2007 can be
attributed to the higher reinvestment earnings in recent years and healthy growth,
particularly in developing and transitional economies. This motivated multi-national
companies to increase their cross border activities. Cross border multi-national
companies activity reached new records in 2007, which gave the FDI inflows a
further boost. Up to 2008, FDI flows were driven by developed economies such as
the United States, the United Kingdom, the Netherlands and France. In 2007, the
developed countries of the world still contributed close to two thirds of global FDI
flows (UNCTAD, 2008).
In 2008, FDI flows suffered a major downturn because of the financial crisis. The
global economic crisis started in the United States because of mortgage loan
defaults and then spread to Europe. As these are two of the largest buying powers in
the world, the global economy was affected by the economic downturn in these
regions (Münchau, 2010). This downturn was caused by the retraction of investment
because of a lack in liquidity of the investors and the investors’ uncertainty of the
global market (UNCTAD, 2010). In 2010, the FDI inflows had still not recovered to
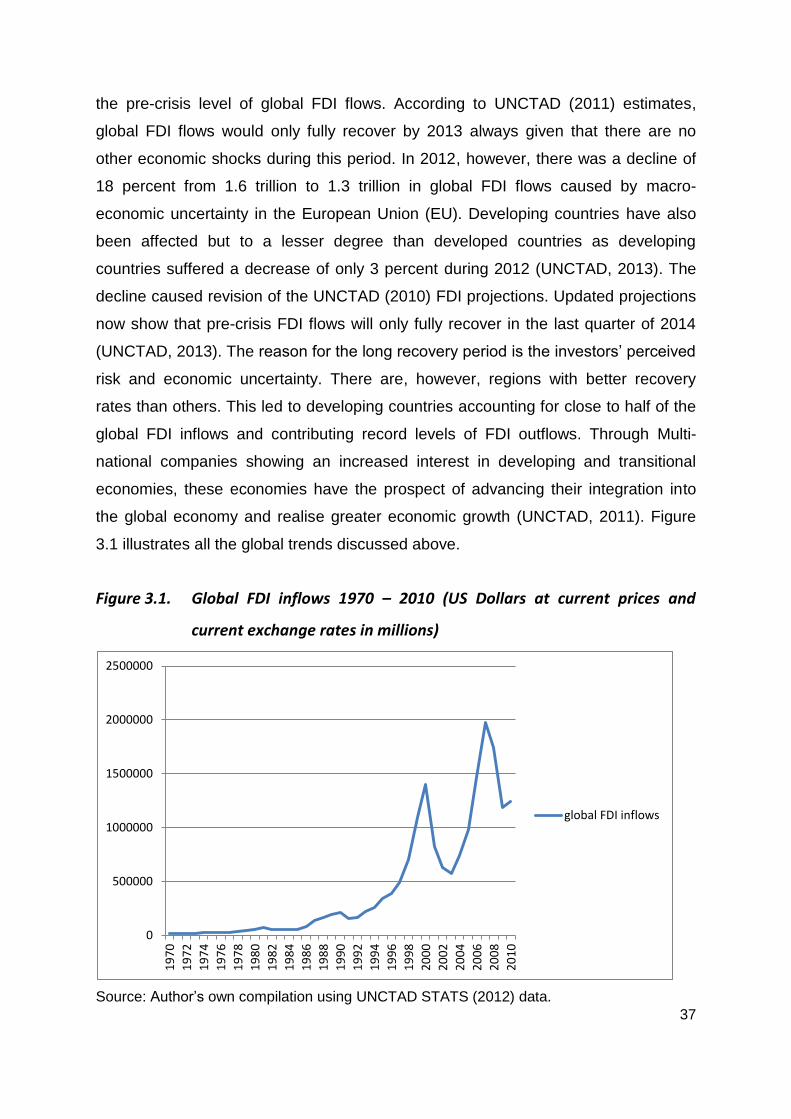
37
the pre-crisis level of global FDI flows. According to UNCTAD (2011) estimates,
global FDI flows would only fully recover by 2013 always given that there are no
other economic shocks during this period. In 2012, however, there was a decline of
18 percent from 1.6 trillion to 1.3 trillion in global FDI flows caused by macro-
economic uncertainty in the European Union (EU). Developing countries have also
been affected but to a lesser degree than developed countries as developing
countries suffered a decrease of only 3 percent during 2012 (UNCTAD, 2013). The
decline caused revision of the UNCTAD (2010) FDI projections. Updated projections
now show that pre-crisis FDI flows will only fully recover in the last quarter of 2014
(UNCTAD, 2013). The reason for the long recovery period is the investors’ perceived
risk and economic uncertainty. There are, however, regions with better recovery
rates than others. This led to developing countries accounting for close to half of the
global FDI inflows and contributing record levels of FDI outflows. Through Multi-
national companies showing an increased interest in developing and transitional
economies, these economies have the prospect of advancing their integration into
the global economy and realise greater economic growth (UNCTAD, 2011). Figure
3.1 illustrates all the global trends discussed above.
Figure 3.1. Global FDI inflows 1970 – 2010 (US Dollars at current prices and
current exchange rates in millions)
Source: Author’s own compilation using UNCTAD STATS (2012) data.
0
500000
1000000
1500000
2000000
2500000
19
70
19
72
19
74
19
76
19
78
19
80
19
82
19
84
19
86
19
88
19
90
19
92
19
94
19
96
19
98
20
00
20
02
20
04
20
06
20
08
20
10
global FDI inflows
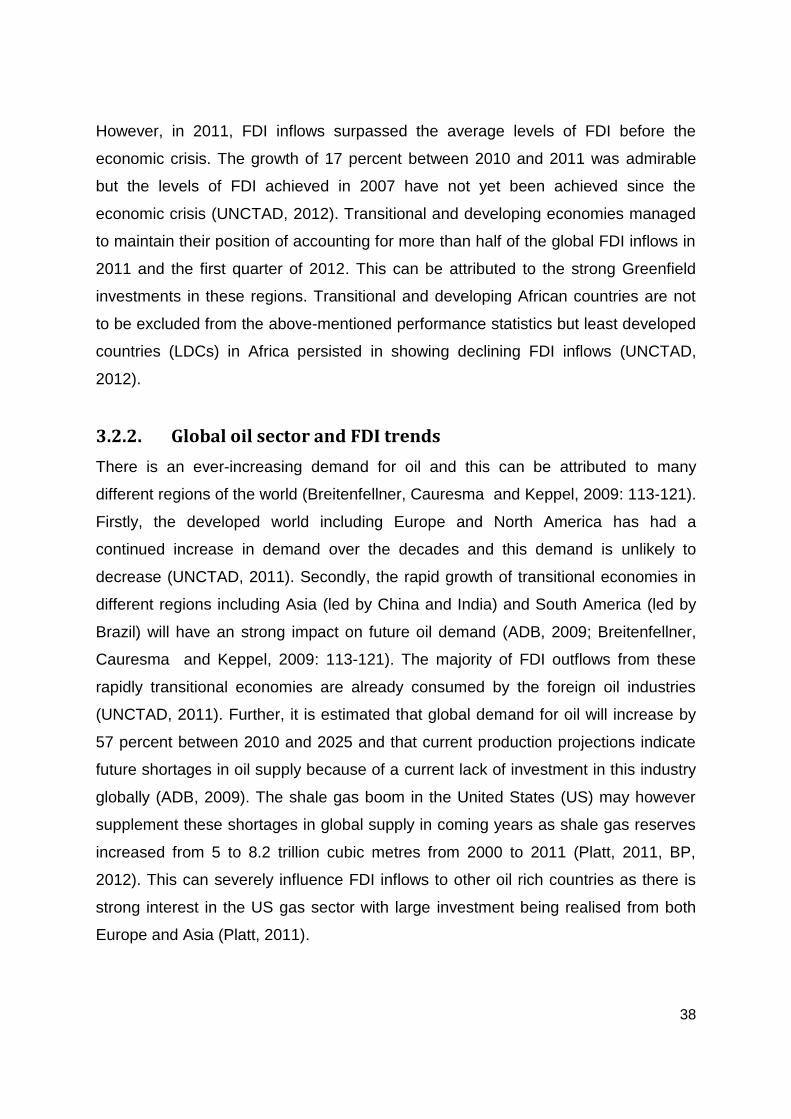
38
However, in 2011, FDI inflows surpassed the average levels of FDI before the
economic crisis. The growth of 17 percent between 2010 and 2011 was admirable
but the levels of FDI achieved in 2007 have not yet been achieved since the
economic crisis (UNCTAD, 2012). Transitional and developing economies managed
to maintain their position of accounting for more than half of the global FDI inflows in
2011 and the first quarter of 2012. This can be attributed to the strong Greenfield
investments in these regions. Transitional and developing African countries are not
to be excluded from the above-mentioned performance statistics but least developed
countries (LDCs) in Africa persisted in showing declining FDI inflows (UNCTAD,
2012).
3.2.2. Global oil sector and FDI trends
There is an ever-increasing demand for oil and this can be attributed to many
different regions of the world (Breitenfellner, Cauresma and Keppel, 2009: 113-121).
Firstly, the developed world including Europe and North America has had a
continued increase in demand over the decades and this demand is unlikely to
decrease (UNCTAD, 2011). Secondly, the rapid growth of transitional economies in
different regions including Asia (led by China and India) and South America (led by
Brazil) will have an strong impact on future oil demand (ADB, 2009; Breitenfellner,
Cauresma and Keppel, 2009: 113-121). The majority of FDI outflows from these
rapidly transitional economies are already consumed by the foreign oil industries
(UNCTAD, 2011). Further, it is estimated that global demand for oil will increase by
57 percent between 2010 and 2025 and that current production projections indicate
future shortages in oil supply because of a current lack of investment in this industry
globally (ADB, 2009). The shale gas boom in the United States (US) may however
supplement these shortages in global supply in coming years as shale gas reserves
increased from 5 to 8.2 trillion cubic metres from 2000 to 2011 (Platt, 2011, BP,
2012). This can severely influence FDI inflows to other oil rich countries as there is
strong interest in the US gas sector with large investment being realised from both
Europe and Asia (Platt, 2011).
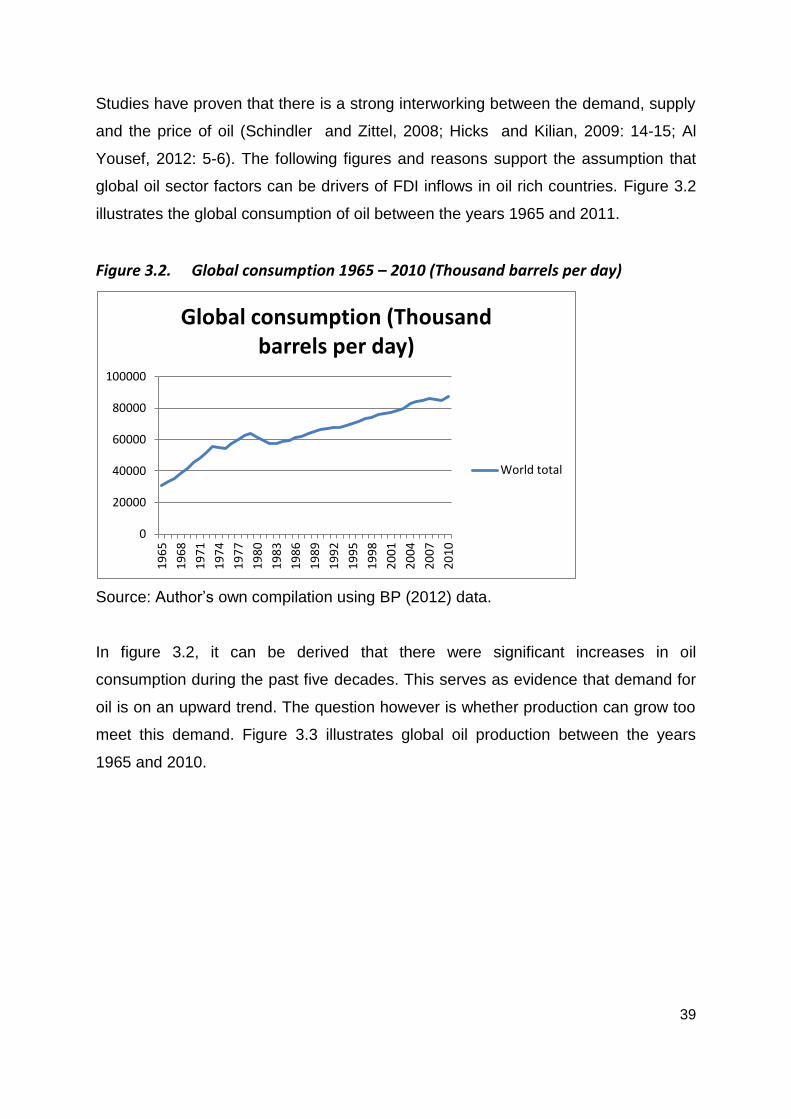
39
Studies have proven that there is a strong interworking between the demand, supply
and the price of oil (Schindler and Zittel, 2008; Hicks and Kilian, 2009: 14-15; Al
Yousef, 2012: 5-6). The following figures and reasons support the assumption that
global oil sector factors can be drivers of FDI inflows in oil rich countries. Figure 3.2
illustrates the global consumption of oil between the years 1965 and 2011.
Figure 3.2. Global consumption 1965 – 2010 (Thousand barrels per day)
Source: Author’s own compilation using BP (2012) data.
In figure 3.2, it can be derived that there were significant increases in oil
consumption during the past five decades. This serves as evidence that demand for
oil is on an upward trend. The question however is whether production can grow too
meet this demand. Figure 3.3 illustrates global oil production between the years
1965 and 2010.
0
20000
40000
60000
80000
100000
19
65
19
68
19
71
19
74
19
77
19
80
19
83
19
86
19
89
19
92
19
95
19
98
20
01
20
04
20
07
20
10
Global consumption (Thousand barrels per day)
World total
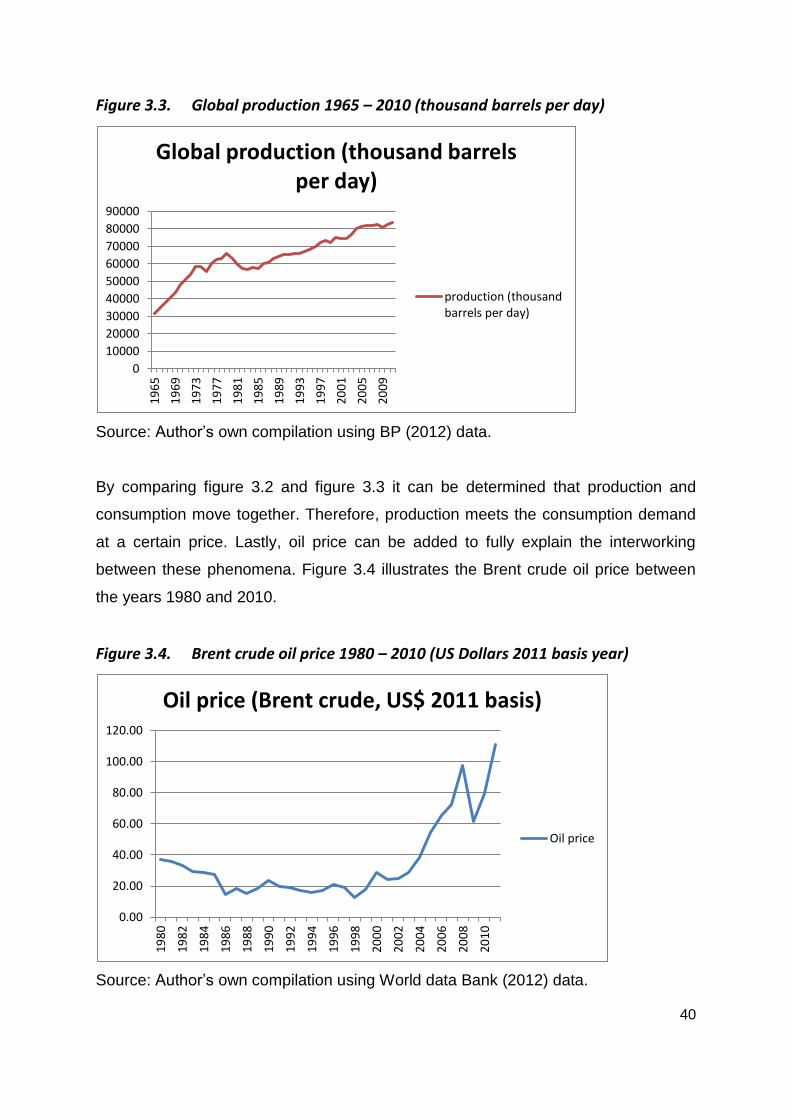
40
Figure 3.3. Global production 1965 – 2010 (thousand barrels per day)
Source: Author’s own compilation using BP (2012) data.
By comparing figure 3.2 and figure 3.3 it can be determined that production and
consumption move together. Therefore, production meets the consumption demand
at a certain price. Lastly, oil price can be added to fully explain the interworking
between these phenomena. Figure 3.4 illustrates the Brent crude oil price between
the years 1980 and 2010.
Figure 3.4. Brent crude oil price 1980 – 2010 (US Dollars 2011 basis year)
Source: Author’s own compilation using World data Bank (2012) data.
0
10000
20000
30000
40000
50000
60000
70000
80000
90000
19
65
19
69
19
73
19
77
19
81
19
85
19
89
19
93
19
97
20
01
20
05
20
09
Global production (thousand barrels per day)
production (thousandbarrels per day)
0.00
20.00
40.00
60.00
80.00
100.00
120.00
19
80
19
82
19
84
19
86
19
88
19
90
19
92
19
94
19
96
19
98
20
00
20
02
20
04
20
06
20
08
20
10
Oil price (Brent crude, US$ 2011 basis)
Oil price
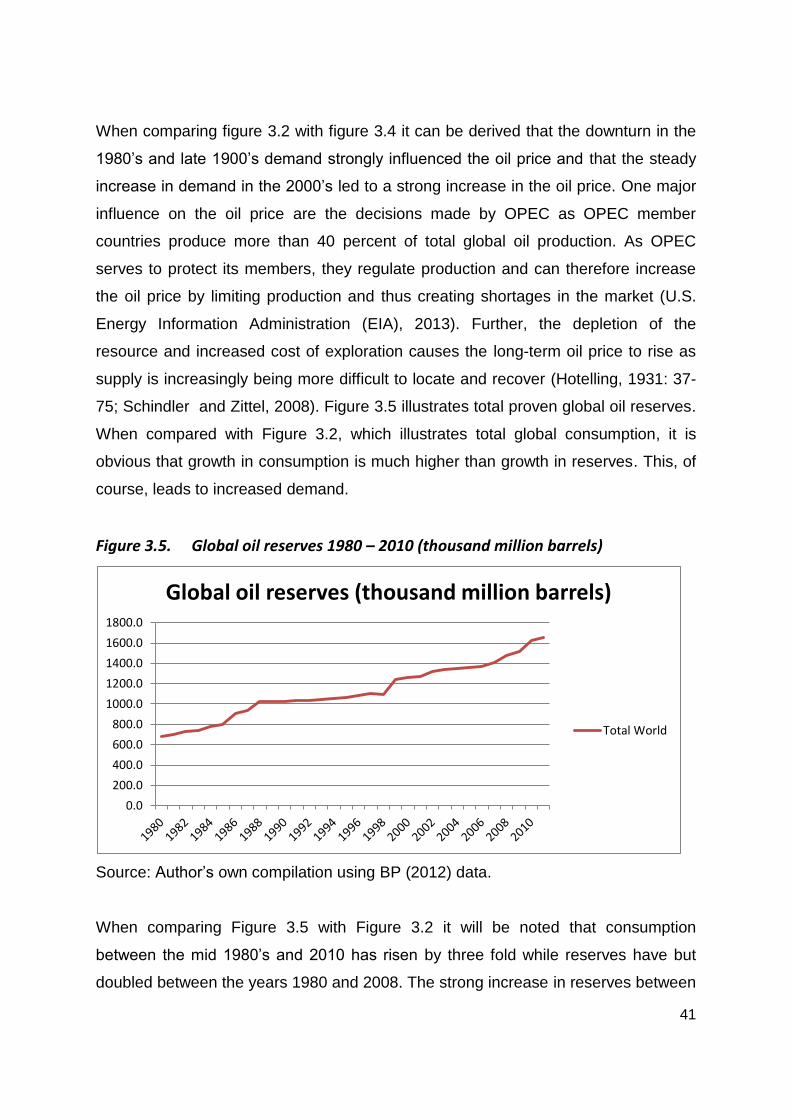
41
When comparing figure 3.2 with figure 3.4 it can be derived that the downturn in the
1980’s and late 1900’s demand strongly influenced the oil price and that the steady
increase in demand in the 2000’s led to a strong increase in the oil price. One major
influence on the oil price are the decisions made by OPEC as OPEC member
countries produce more than 40 percent of total global oil production. As OPEC
serves to protect its members, they regulate production and can therefore increase
the oil price by limiting production and thus creating shortages in the market (U.S.
Energy Information Administration (EIA), 2013). Further, the depletion of the
resource and increased cost of exploration causes the long-term oil price to rise as
supply is increasingly being more difficult to locate and recover (Hotelling, 1931: 37-
75; Schindler and Zittel, 2008). Figure 3.5 illustrates total proven global oil reserves.
When compared with Figure 3.2, which illustrates total global consumption, it is
obvious that growth in consumption is much higher than growth in reserves. This, of
course, leads to increased demand.
Figure 3.5. Global oil reserves 1980 – 2010 (thousand million barrels)
Source: Author’s own compilation using BP (2012) data.
When comparing Figure 3.5 with Figure 3.2 it will be noted that consumption
between the mid 1980’s and 2010 has risen by three fold while reserves have but
doubled between the years 1980 and 2008. The strong increase in reserves between
0.0
200.0
400.0
600.0
800.0
1000.0
1200.0
1400.0
1600.0
1800.0
Global oil reserves (thousand million barrels)
Total World
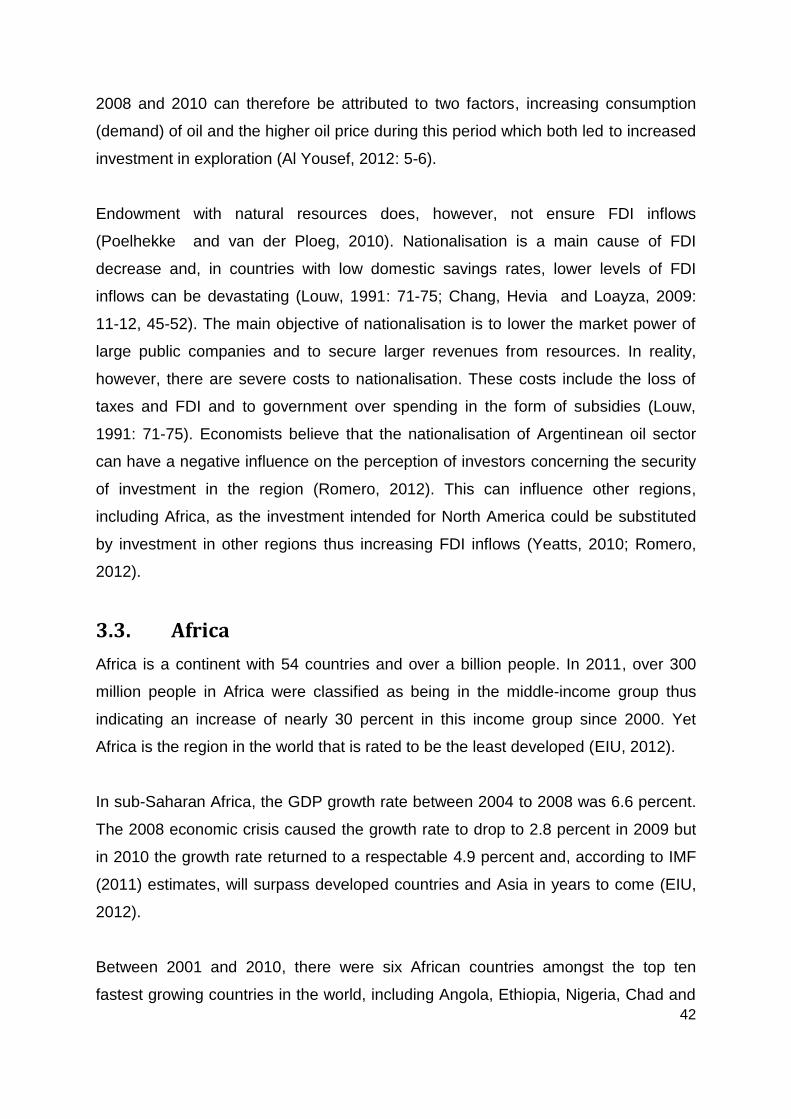
42
2008 and 2010 can therefore be attributed to two factors, increasing consumption
(demand) of oil and the higher oil price during this period which both led to increased
investment in exploration (Al Yousef, 2012: 5-6).
Endowment with natural resources does, however, not ensure FDI inflows
(Poelhekke and van der Ploeg, 2010). Nationalisation is a main cause of FDI
decrease and, in countries with low domestic savings rates, lower levels of FDI
inflows can be devastating (Louw, 1991: 71-75; Chang, Hevia and Loayza, 2009:
11-12, 45-52). The main objective of nationalisation is to lower the market power of
large public companies and to secure larger revenues from resources. In reality,
however, there are severe costs to nationalisation. These costs include the loss of
taxes and FDI and to government over spending in the form of subsidies (Louw,
1991: 71-75). Economists believe that the nationalisation of Argentinean oil sector
can have a negative influence on the perception of investors concerning the security
of investment in the region (Romero, 2012). This can influence other regions,
including Africa, as the investment intended for North America could be substituted
by investment in other regions thus increasing FDI inflows (Yeatts, 2010; Romero,
2012).
3.3. Africa
Africa is a continent with 54 countries and over a billion people. In 2011, over 300
million people in Africa were classified as being in the middle-income group thus
indicating an increase of nearly 30 percent in this income group since 2000. Yet
Africa is the region in the world that is rated to be the least developed (EIU, 2012).
In sub-Saharan Africa, the GDP growth rate between 2004 to 2008 was 6.6 percent.
The 2008 economic crisis caused the growth rate to drop to 2.8 percent in 2009 but
in 2010 the growth rate returned to a respectable 4.9 percent and, according to IMF
(2011) estimates, will surpass developed countries and Asia in years to come (EIU,
2012).
Between 2001 and 2010, there were six African countries amongst the top ten
fastest growing countries in the world, including Angola, Ethiopia, Nigeria, Chad and
43
Mozambique (The Economist, 2011). This growth has contributed strongly to
economic reform in the region. These reforms lead to better, that is lower, inflation
rates, a decrease in budgetary deficits and therefore lower foreign debt, privatisation
of enterprises that were previously state owned leading to better efficiency because
of increased competition, and increasingly open markets (Ernest and Young, 2011).
According to The Economist (2012), the 2008 economic crisis also had a positive
influence on investment in Africa that may yet be realised in the future. This positive
influence lies in the revision of the global risk-return equation as investors tend to
assess the performance of individual countries within Africa rather than the African
continent as a whole. This focus on individual countries allows for these countries to
receive higher FDI inflows and therefor excel in economic growth. This can be
beneficial for the whole region in the long-term (EIU, 2012).
An industry that is receiving increasing attention is the African oil sector. The African regions
have all been influenced by the oil sector during the last decade or longer (Ernest
andYoung, 2011). All African regions have strong oil producing countries including North
Africa with Libya and Algeria, West Africa with Nigeria and Angola, Central Africa with Chad,
Ghana and Gabon, East Africa with Sudan and Southern Africa with Tanzania and
Mozambique (Ernest and Young, 2011). This sector has shown significant growth in recent
years with new oil and additional reserves being discovered in several African countries
(ADB, 2010). It is believed that African oil exploration will lead to vast improvements in
economic grow within the region if revenue from the exploration is well managed and if the
industry is well governed (ADB, 2010; UNCTAD, 2011).
To achieve economic growth and development from the revenues of the oil industry,
the oil rich African countries will however, have to install optimal policies and have a
sound structure wherein other industries are allowed to grow and prosper (ADB,
2010; UNCTAD, 2011). Developing other industries in the oil rich countries lowers
the ultimate dependence on the oil industry (ADB, 2010)
3.3.1. African FDI trends
A cross-country perception survey conducted by Ernest and Young (2011) in 38
countries showed that the perception of African and Asian investors concerning the
44
prospects of African growth is positive with specific regard to the African oil sector.
The developed countries included in the survey (including European and American
countries), however, did not share the perception of the Asian and African
respondents. They do not view Africa as having significant positive prospects in the
short run but do agree that, in the long run, African countries may become more
realistic prospecting investments (Ernest and Young, 2011). Figure 3.2 illustrates
the rapid increase in FDI inflows from the year 2000 and shows a strong indication of
the impact of the 2008 financial crisis.
Figure 3.6. African FDI inflows 1970 – 2010 (US Dollars at current prices
and current exchange rates in millions)
Source: Author’s own compilation using World data Bank (2012) data.
Recently, emerging countries have become increasingly interested in Africa as an
investment destination. The rapid acceleration in FDI inflows to Africa can be
attributed to the restructuring of policies making Africa as a whole a more attractive
investment destination (UNCTAD, 2011). China is a leader on the investment front,
investing almost as much as all the other emerging economies put together.
However, the United States and the European Union are overall still the largest
investors in Africa (AEO, 2011). It can be argued that the investment from emerging
markets is more beneficial than investment made by developed countries as these
emerging countries have a better perception of the developing nature of the African
0
10000
20000
30000
40000
50000
60000
70000
80000
Total African FDI inflows
45
environment (AEO, 2011). The increase in interest from emerging economies in
recent years has also supplemented the assistance given to African countries
through the development of infrastructure, better healthcare, a higher education rate
and better governance (AEO, 2011).
Along with the interest of emerging economies, regional integration is a topic that
draws increasing attention as higher integration may lead to certain benefits (AEO,
2011). The benefits of integration include working together to try to better
development standing rather than competition for FDI and assistance, and to ease
the strain of obtaining the necessary resources from other countries in the region to
better their production efficiency and ultimately global competitiveness (AEO, 2011).
Examples of regional integration in the Africa include the Common Market for
Eastern and Southern Africa (COMESA), the East African Community (EAC), the
Southern African Development Community (SADC) and many more, all aimed at
reducing trade and investment barriers (United Nations Economic Commission for
Africa (UNECA), 2012).
3.3.2 FDI inflows in the African oil sector
The continent of Africa is endowed with vast natural resources. Oil and gas are the
resources at the centre of interest as these resources secure improved economic
growth in the region (ADB, 2010). Oil production in Africa is believed to increase by
an average of 6 percent annually for some years to come (Ernst and Young, 2011).
Currently, there are 19 African countries identified as significant producers of oil.
Most of these countries have shown strong economic growth, partially because of
foreign direct investment in their oil sectors (Ernst and Young, 2011).
The oil industry is the industry in Africa that enjoys the highest FDI inflows
(UNCTAD, 2011) Further, the earlier mentioned survey conducted by Ernst and
Young (2011) shows that the majority of investors were of opinion that the oil
industry and, more specifically, oil exploration have strong potential for growth in
coming years. The increased global demand together with the ever-increasing
proven oil reserves in Africa have given investors good reason to acknowledge the
significance of the continent’s oil riches (Ernest and Young, 2011).
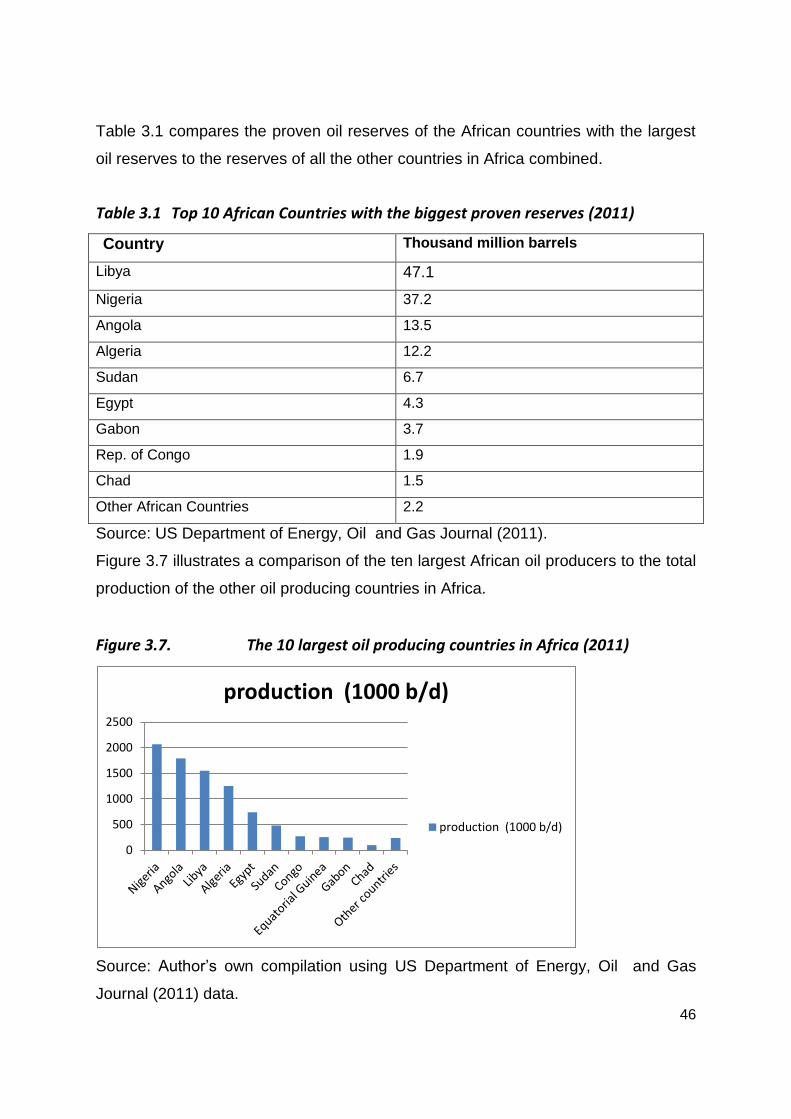
46
Table 3.1 compares the proven oil reserves of the African countries with the largest
oil reserves to the reserves of all the other countries in Africa combined.
Table 3.1 Top 10 African Countries with the biggest proven reserves (2011)
Country
Thousand million barrels
Libya 47.1
Nigeria 37.2
Angola 13.5
Algeria 12.2
Sudan 6.7
Egypt 4.3
Gabon 3.7
Rep. of Congo 1.9
Chad 1.5
Other African Countries 2.2
Source: US Department of Energy, Oil and Gas Journal (2011).
Figure 3.7 illustrates a comparison of the ten largest African oil producers to the total
production of the other oil producing countries in Africa.
Figure 3.7. The 10 largest oil producing countries in Africa (2011)
Source: Author’s own compilation using US Department of Energy, Oil and Gas
Journal (2011) data.
0
500
1000
1500
2000
2500
production (1000 b/d)
production (1000 b/d)
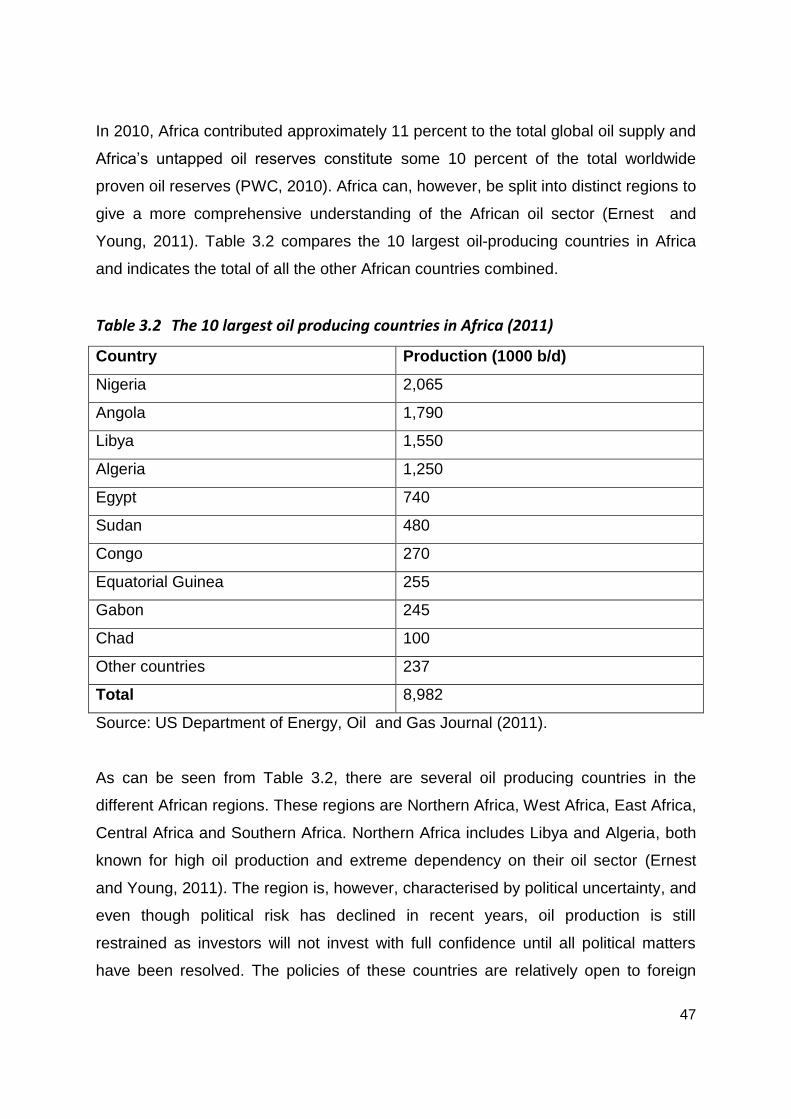
47
In 2010, Africa contributed approximately 11 percent to the total global oil supply and
Africa’s untapped oil reserves constitute some 10 percent of the total worldwide
proven oil reserves (PWC, 2010). Africa can, however, be split into distinct regions to
give a more comprehensive understanding of the African oil sector (Ernest and
Young, 2011). Table 3.2 compares the 10 largest oil-producing countries in Africa
and indicates the total of all the other African countries combined.
Table 3.2 The 10 largest oil producing countries in Africa (2011)
Country Production (1000 b/d)
Nigeria 2,065
Angola 1,790
Libya 1,550
Algeria 1,250
Egypt 740
Sudan 480
Congo 270
Equatorial Guinea 255
Gabon 245
Chad 100
Other countries 237
Total 8,982
Source: US Department of Energy, Oil and Gas Journal (2011).
As can be seen from Table 3.2, there are several oil producing countries in the
different African regions. These regions are Northern Africa, West Africa, East Africa,
Central Africa and Southern Africa. Northern Africa includes Libya and Algeria, both
known for high oil production and extreme dependency on their oil sector (Ernest
and Young, 2011). The region is, however, characterised by political uncertainty, and
even though political risk has declined in recent years, oil production is still
restrained as investors will not invest with full confidence until all political matters
have been resolved. The policies of these countries are relatively open to foreign
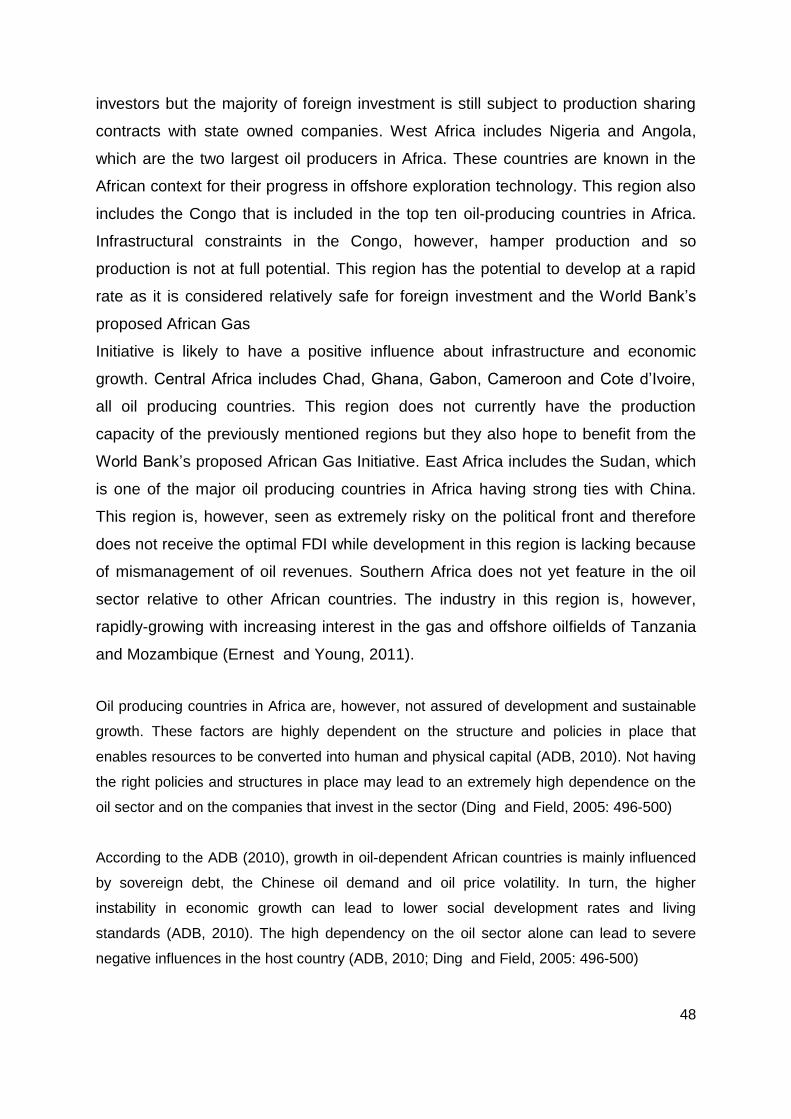
48
investors but the majority of foreign investment is still subject to production sharing
contracts with state owned companies. West Africa includes Nigeria and Angola,
which are the two largest oil producers in Africa. These countries are known in the
African context for their progress in offshore exploration technology. This region also
includes the Congo that is included in the top ten oil-producing countries in Africa.
Infrastructural constraints in the Congo, however, hamper production and so
production is not at full potential. This region has the potential to develop at a rapid
rate as it is considered relatively safe for foreign investment and the World Bank’s
proposed African Gas
Initiative is likely to have a positive influence about infrastructure and economic
growth. Central Africa includes Chad, Ghana, Gabon, Cameroon and Cote d’Ivoire,
all oil producing countries. This region does not currently have the production
capacity of the previously mentioned regions but they also hope to benefit from the
World Bank’s proposed African Gas Initiative. East Africa includes the Sudan, which
is one of the major oil producing countries in Africa having strong ties with China.
This region is, however, seen as extremely risky on the political front and therefore
does not receive the optimal FDI while development in this region is lacking because
of mismanagement of oil revenues. Southern Africa does not yet feature in the oil
sector relative to other African countries. The industry in this region is, however,
rapidly-growing with increasing interest in the gas and offshore oilfields of Tanzania
and Mozambique (Ernest and Young, 2011).
Oil producing countries in Africa are, however, not assured of development and sustainable
growth. These factors are highly dependent on the structure and policies in place that
enables resources to be converted into human and physical capital (ADB, 2010). Not having
the right policies and structures in place may lead to an extremely high dependence on the
oil sector and on the companies that invest in the sector (Ding and Field, 2005: 496-500)
According to the ADB (2010), growth in oil-dependent African countries is mainly influenced
by sovereign debt, the Chinese oil demand and oil price volatility. In turn, the higher
instability in economic growth can lead to lower social development rates and living
standards (ADB, 2010). The high dependency on the oil sector alone can lead to severe
negative influences in the host country (ADB, 2010; Ding and Field, 2005: 496-500)
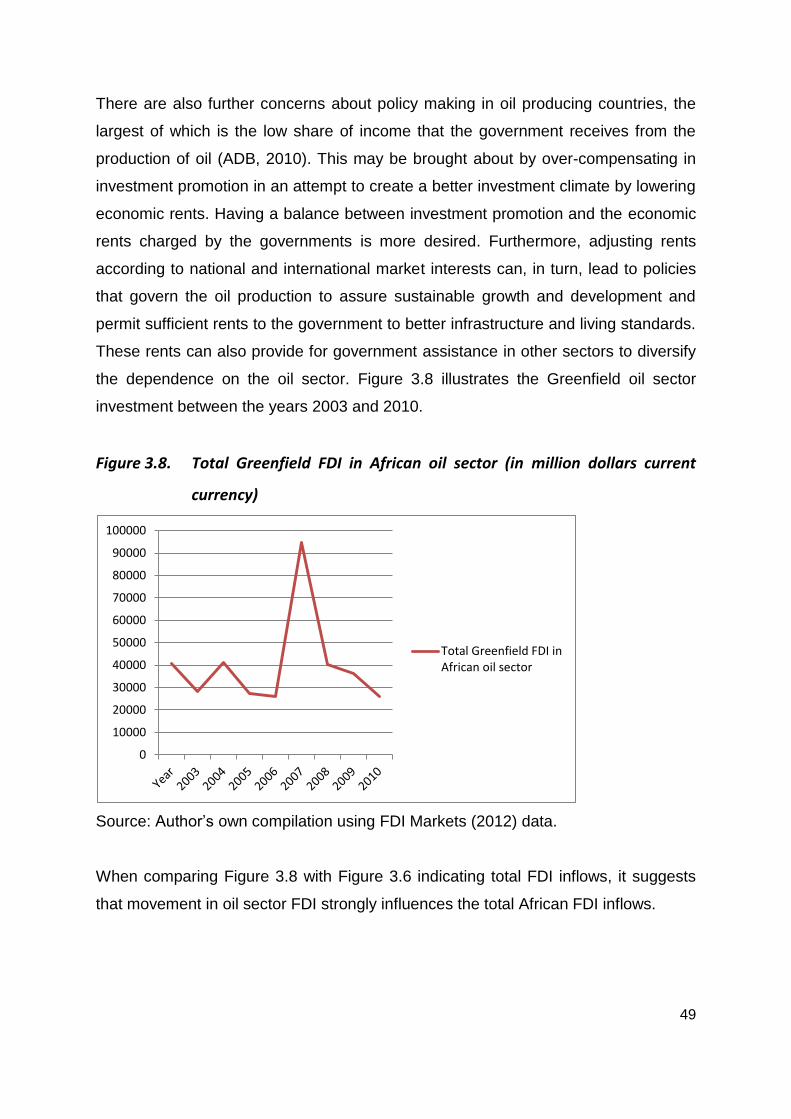
49
There are also further concerns about policy making in oil producing countries, the
largest of which is the low share of income that the government receives from the
production of oil (ADB, 2010). This may be brought about by over-compensating in
investment promotion in an attempt to create a better investment climate by lowering
economic rents. Having a balance between investment promotion and the economic
rents charged by the governments is more desired. Furthermore, adjusting rents
according to national and international market interests can, in turn, lead to policies
that govern the oil production to assure sustainable growth and development and
permit sufficient rents to the government to better infrastructure and living standards.
These rents can also provide for government assistance in other sectors to diversify
the dependence on the oil sector. Figure 3.8 illustrates the Greenfield oil sector
investment between the years 2003 and 2010.
Figure 3.8. Total Greenfield FDI in African oil sector (in million dollars current
currency)
Source: Author’s own compilation using FDI Markets (2012) data.
When comparing Figure 3.8 with Figure 3.6 indicating total FDI inflows, it suggests
that movement in oil sector FDI strongly influences the total African FDI inflows.
0
10000
20000
30000
40000
50000
60000
70000
80000
90000
100000
Total Greenfield FDI inAfrican oil sector
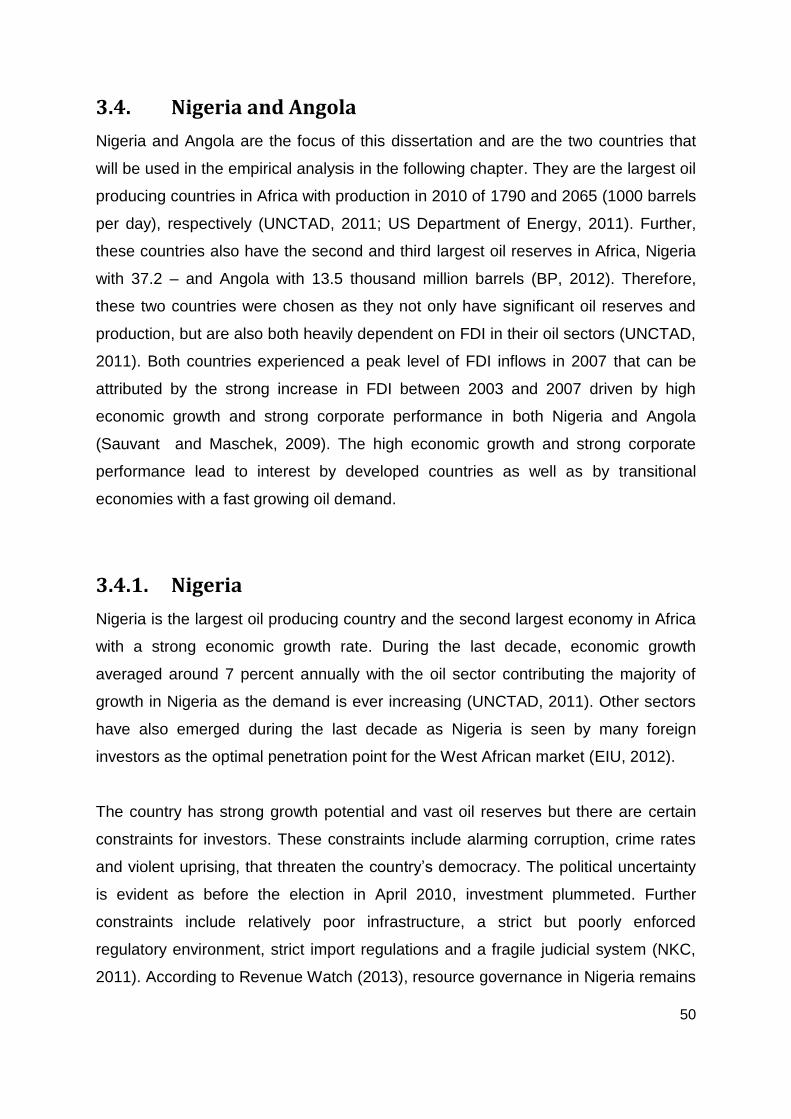
50
3.4. Nigeria and Angola
Nigeria and Angola are the focus of this dissertation and are the two countries that
will be used in the empirical analysis in the following chapter. They are the largest oil
producing countries in Africa with production in 2010 of 1790 and 2065 (1000 barrels
per day), respectively (UNCTAD, 2011; US Department of Energy, 2011). Further,
these countries also have the second and third largest oil reserves in Africa, Nigeria
with 37.2 – and Angola with 13.5 thousand million barrels (BP, 2012). Therefore,
these two countries were chosen as they not only have significant oil reserves and
production, but are also both heavily dependent on FDI in their oil sectors (UNCTAD,
2011). Both countries experienced a peak level of FDI inflows in 2007 that can be
attributed by the strong increase in FDI between 2003 and 2007 driven by high
economic growth and strong corporate performance in both Nigeria and Angola
(Sauvant and Maschek, 2009). The high economic growth and strong corporate
performance lead to interest by developed countries as well as by transitional
economies with a fast growing oil demand.
3.4.1. Nigeria
Nigeria is the largest oil producing country and the second largest economy in Africa
with a strong economic growth rate. During the last decade, economic growth
averaged around 7 percent annually with the oil sector contributing the majority of
growth in Nigeria as the demand is ever increasing (UNCTAD, 2011). Other sectors
have also emerged during the last decade as Nigeria is seen by many foreign
investors as the optimal penetration point for the West African market (EIU, 2012).
The country has strong growth potential and vast oil reserves but there are certain
constraints for investors. These constraints include alarming corruption, crime rates
and violent uprising, that threaten the country’s democracy. The political uncertainty
is evident as before the election in April 2010, investment plummeted. Further
constraints include relatively poor infrastructure, a strict but poorly enforced
regulatory environment, strict import regulations and a fragile judicial system (NKC,
2011). According to Revenue Watch (2013), resource governance in Nigeria remains
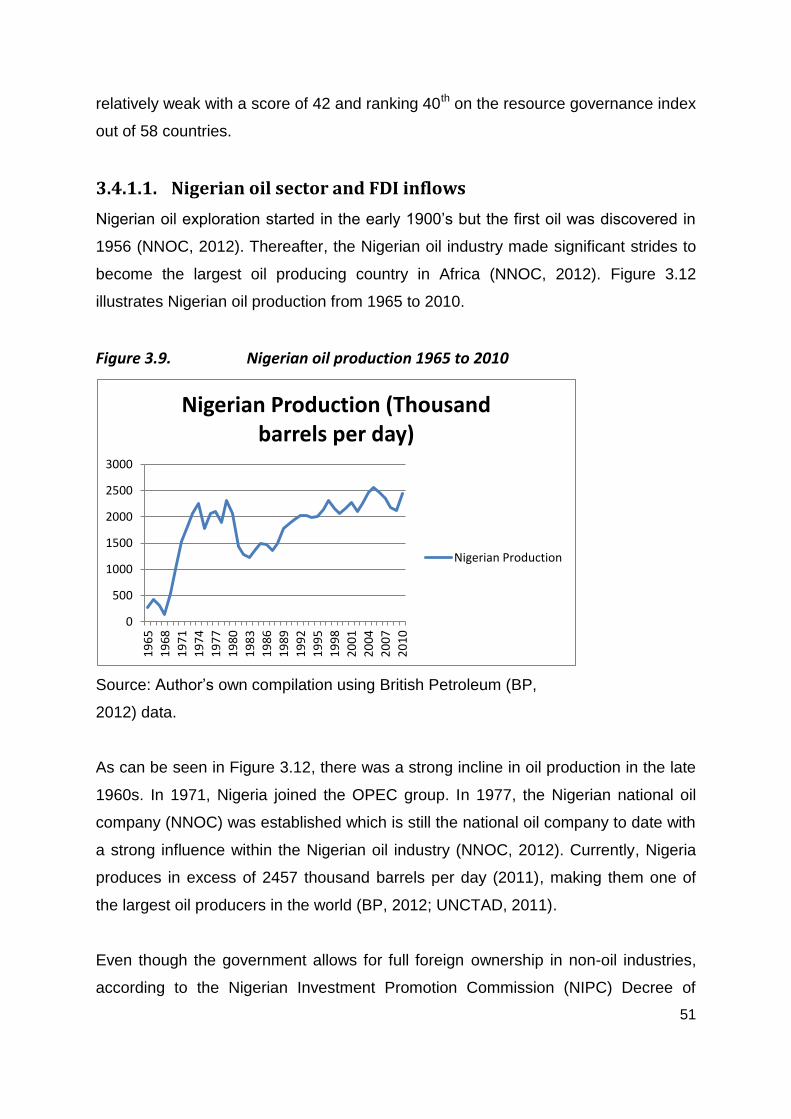
51
relatively weak with a score of 42 and ranking 40th on the resource governance index
out of 58 countries.
3.4.1.1. Nigerian oil sector and FDI inflows
Nigerian oil exploration started in the early 1900’s but the first oil was discovered in
1956 (NNOC, 2012). Thereafter, the Nigerian oil industry made significant strides to
become the largest oil producing country in Africa (NNOC, 2012). Figure 3.12
illustrates Nigerian oil production from 1965 to 2010.
Figure 3.9. Nigerian oil production 1965 to 2010
Source: Author’s own compilation using British Petroleum (BP,
2012) data.
As can be seen in Figure 3.12, there was a strong incline in oil production in the late
1960s. In 1971, Nigeria joined the OPEC group. In 1977, the Nigerian national oil
company (NNOC) was established which is still the national oil company to date with
a strong influence within the Nigerian oil industry (NNOC, 2012). Currently, Nigeria
produces in excess of 2457 thousand barrels per day (2011), making them one of
the largest oil producers in the world (BP, 2012; UNCTAD, 2011).
Even though the government allows for full foreign ownership in non-oil industries,
according to the Nigerian Investment Promotion Commission (NIPC) Decree of
0
500
1000
1500
2000
2500
3000
19
65
19
68
19
71
19
74
19
77
19
80
19
83
19
86
19
89
19
92
19
95
19
98
20
01
20
04
20
07
20
10
Nigerian Production (Thousand barrels per day)
Nigerian Production
52
1995, and these industries are on the rise, FDI inflows in Nigeria are still
predominately received from multi-national oil companies. More than two thirds of
the total FDI inflows to Nigeria are in the oil sector (NKC, 2011). Much like Angola,
Nigeria is heavily dependent on the oil industry that generates more than 90 percent
of their foreign reserves (Central Intelligence Agency (CIA), 2012).
Nigeria is the third largest FDI recipient in Africa after South Africa and Angola with
FDI inflows of $8.65bn in 2009 and $6.1bn in 2010 (UNCTAD, 2011; NKC, 2011).
Figure 3.13 illustrates Nigerian FDI inflows from 1970 to 2010.
Figure 3.10. Total Nigerian FDI inflows between 1970 and 2010 (million
US$)
Source: Author’s own compilation using World data Bank (2012) data.
In 2010, Nigeria experienced a fall in FDI inflows of close to 30 percent. This decline
can be attributed to investors’ uncertainty of the Nigerian oil sector because of the
PIB and political uncertainty caused by the elections (NKC, 2011). After the election
in 2010, however, the NKC (2011) risk rating for Nigerian changed from moderate to
low risk and Nigerian policy makers are pushing for further reform to lower corruption
and improve transparency (NKC, 2011). Figure 3.14 illustrates total Greenfield
investment in the Nigerian oil sector between 2003 and 2010.
-2000
0
2000
4000
6000
8000
10000
19
70
19
73
19
76
19
79
19
82
19
85
19
88
19
91
19
94
19
97
20
00
20
03
20
06
20
09
Nigeria FDI inflows
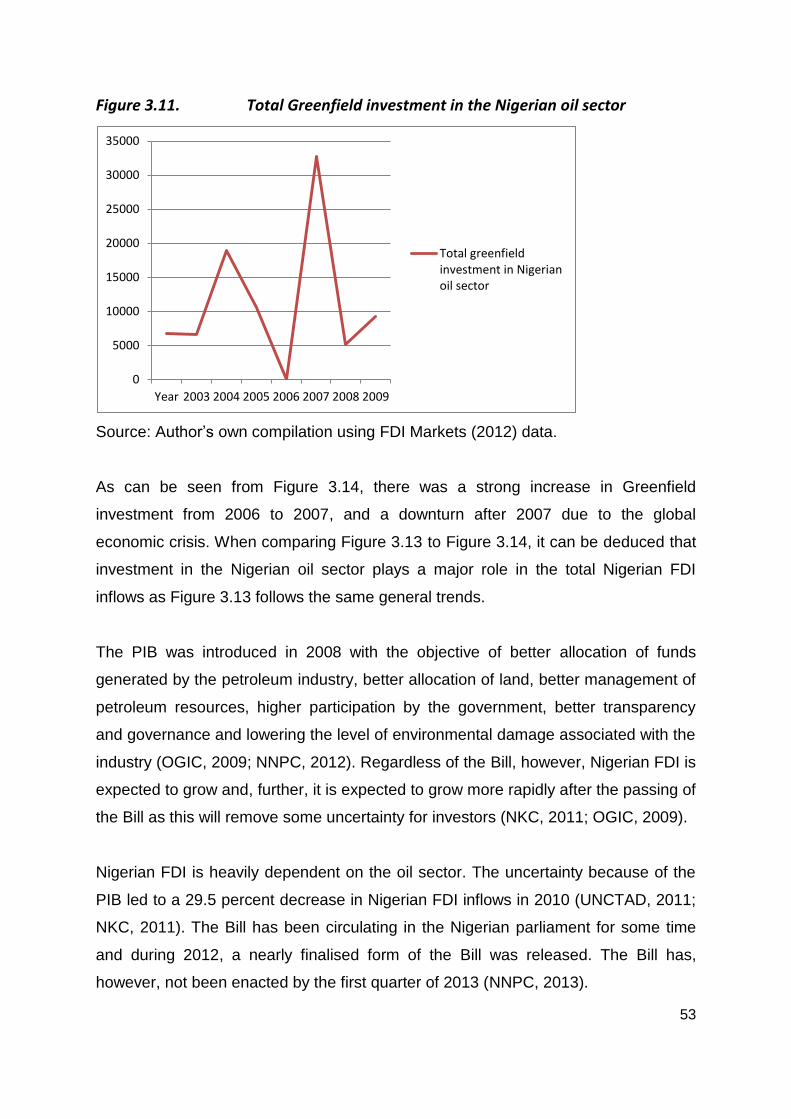
53
Figure 3.11. Total Greenfield investment in the Nigerian oil sector
Source: Author’s own compilation using FDI Markets (2012) data.
As can be seen from Figure 3.14, there was a strong increase in Greenfield
investment from 2006 to 2007, and a downturn after 2007 due to the global
economic crisis. When comparing Figure 3.13 to Figure 3.14, it can be deduced that
investment in the Nigerian oil sector plays a major role in the total Nigerian FDI
inflows as Figure 3.13 follows the same general trends.
The PIB was introduced in 2008 with the objective of better allocation of funds
generated by the petroleum industry, better allocation of land, better management of
petroleum resources, higher participation by the government, better transparency
and governance and lowering the level of environmental damage associated with the
industry (OGIC, 2009; NNPC, 2012). Regardless of the Bill, however, Nigerian FDI is
expected to grow and, further, it is expected to grow more rapidly after the passing of
the Bill as this will remove some uncertainty for investors (NKC, 2011; OGIC, 2009).
Nigerian FDI is heavily dependent on the oil sector. The uncertainty because of the
PIB led to a 29.5 percent decrease in Nigerian FDI inflows in 2010 (UNCTAD, 2011;
NKC, 2011). The Bill has been circulating in the Nigerian parliament for some time
and during 2012, a nearly finalised form of the Bill was released. The Bill has,
however, not been enacted by the first quarter of 2013 (NNPC, 2013).
0
5000
10000
15000
20000
25000
30000
35000
Year 2003 2004 2005 2006 2007 2008 2009
Total greenfieldinvestment in Nigerianoil sector
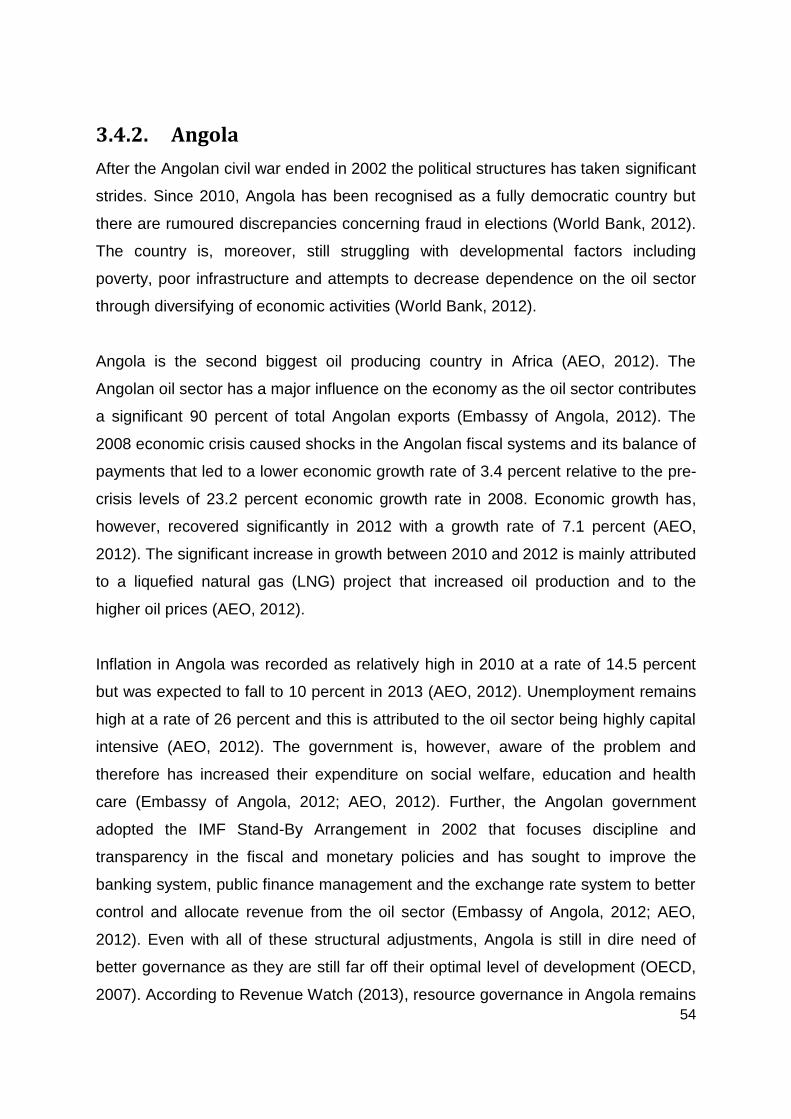
54
3.4.2. Angola
After the Angolan civil war ended in 2002 the political structures has taken significant
strides. Since 2010, Angola has been recognised as a fully democratic country but
there are rumoured discrepancies concerning fraud in elections (World Bank, 2012).
The country is, moreover, still struggling with developmental factors including
poverty, poor infrastructure and attempts to decrease dependence on the oil sector
through diversifying of economic activities (World Bank, 2012).
Angola is the second biggest oil producing country in Africa (AEO, 2012). The
Angolan oil sector has a major influence on the economy as the oil sector contributes
a significant 90 percent of total Angolan exports (Embassy of Angola, 2012). The
2008 economic crisis caused shocks in the Angolan fiscal systems and its balance of
payments that led to a lower economic growth rate of 3.4 percent relative to the pre-
crisis levels of 23.2 percent economic growth rate in 2008. Economic growth has,
however, recovered significantly in 2012 with a growth rate of 7.1 percent (AEO,
2012). The significant increase in growth between 2010 and 2012 is mainly attributed
to a liquefied natural gas (LNG) project that increased oil production and to the
higher oil prices (AEO, 2012).
Inflation in Angola was recorded as relatively high in 2010 at a rate of 14.5 percent
but was expected to fall to 10 percent in 2013 (AEO, 2012). Unemployment remains
high at a rate of 26 percent and this is attributed to the oil sector being highly capital
intensive (AEO, 2012). The government is, however, aware of the problem and
therefore has increased their expenditure on social welfare, education and health
care (Embassy of Angola, 2012; AEO, 2012). Further, the Angolan government
adopted the IMF Stand-By Arrangement in 2002 that focuses discipline and
transparency in the fiscal and monetary policies and has sought to improve the
banking system, public finance management and the exchange rate system to better
control and allocate revenue from the oil sector (Embassy of Angola, 2012; AEO,
2012). Even with all of these structural adjustments, Angola is still in dire need of
better governance as they are still far off their optimal level of development (OECD,
2007). According to Revenue Watch (2013), resource governance in Angola remains
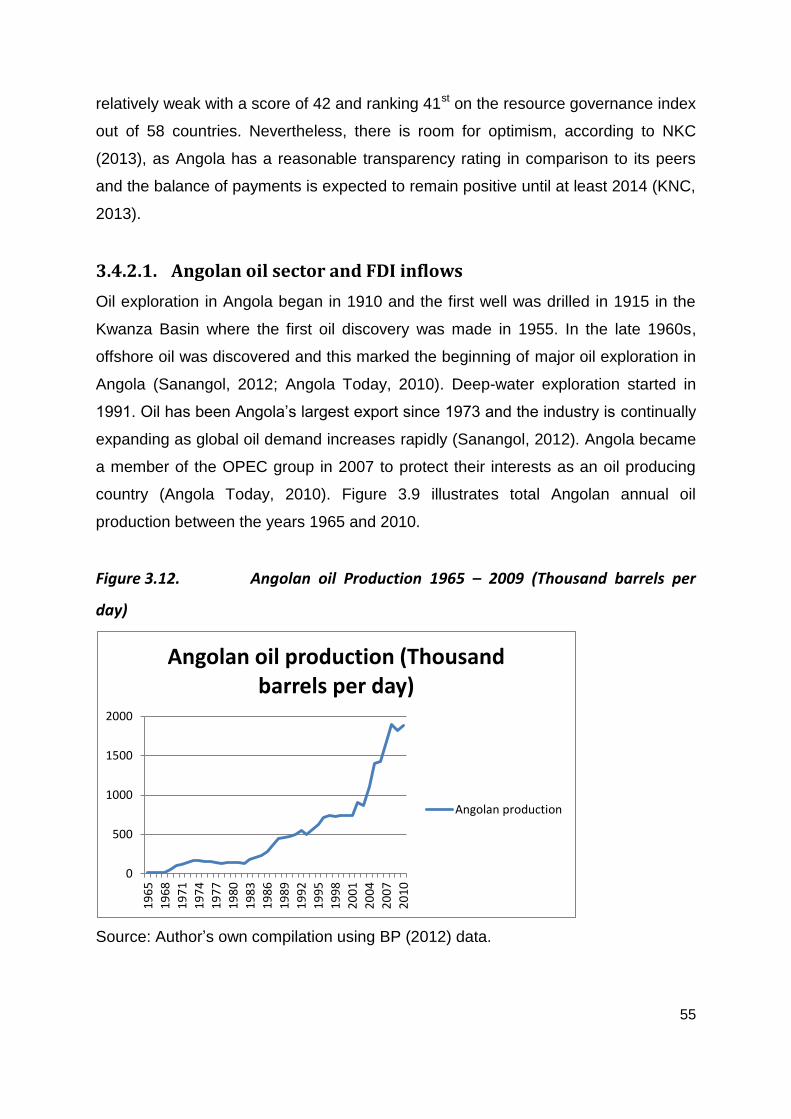
55
relatively weak with a score of 42 and ranking 41st on the resource governance index
out of 58 countries. Nevertheless, there is room for optimism, according to NKC
(2013), as Angola has a reasonable transparency rating in comparison to its peers
and the balance of payments is expected to remain positive until at least 2014 (KNC,
2013).
3.4.2.1. Angolan oil sector and FDI inflows
Oil exploration in Angola began in 1910 and the first well was drilled in 1915 in the
Kwanza Basin where the first oil discovery was made in 1955. In the late 1960s,
offshore oil was discovered and this marked the beginning of major oil exploration in
Angola (Sanangol, 2012; Angola Today, 2010). Deep-water exploration started in
1991. Oil has been Angola’s largest export since 1973 and the industry is continually
expanding as global oil demand increases rapidly (Sanangol, 2012). Angola became
a member of the OPEC group in 2007 to protect their interests as an oil producing
country (Angola Today, 2010). Figure 3.9 illustrates total Angolan annual oil
production between the years 1965 and 2010.
Figure 3.12. Angolan oil Production 1965 – 2009 (Thousand barrels per
day)
Source: Author’s own compilation using BP (2012) data.
0
500
1000
1500
2000
19
65
19
68
19
71
19
74
19
77
19
80
19
83
19
86
19
89
19
92
19
95
19
98
20
01
20
04
20
07
20
10
Angolan oil production (Thousand barrels per day)
Angolan production
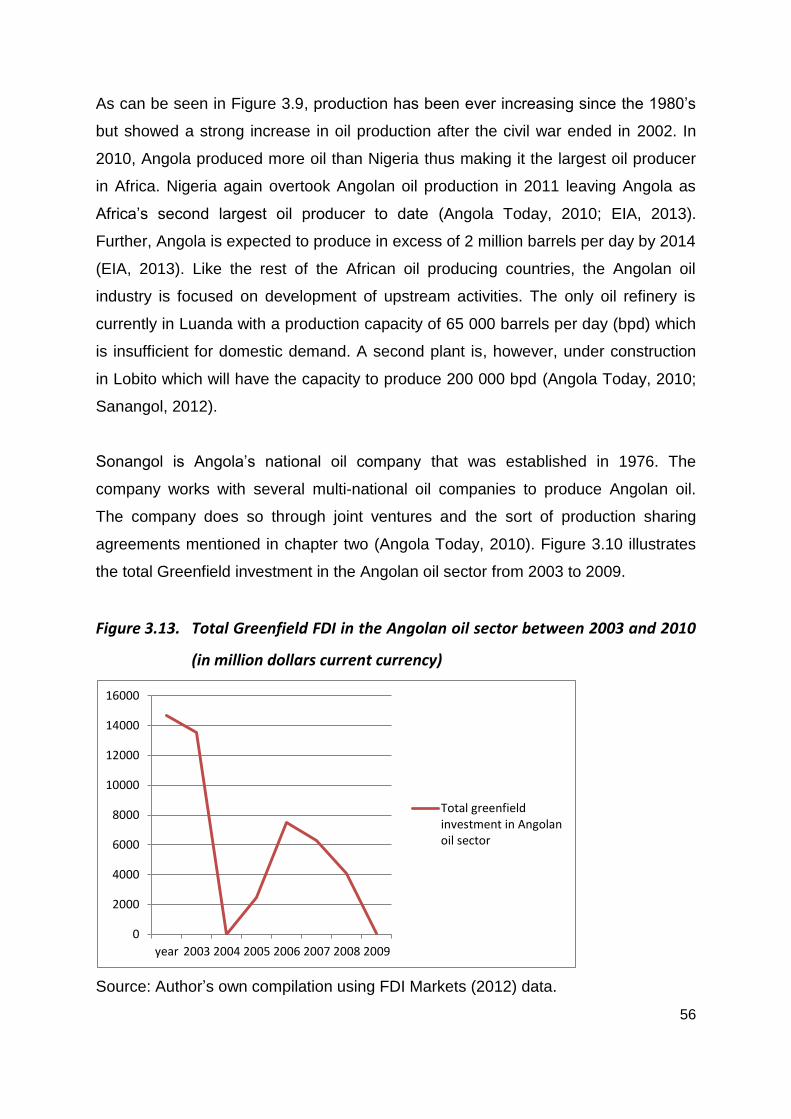
56
As can be seen in Figure 3.9, production has been ever increasing since the 1980’s
but showed a strong increase in oil production after the civil war ended in 2002. In
2010, Angola produced more oil than Nigeria thus making it the largest oil producer
in Africa. Nigeria again overtook Angolan oil production in 2011 leaving Angola as
Africa’s second largest oil producer to date (Angola Today, 2010; EIA, 2013).
Further, Angola is expected to produce in excess of 2 million barrels per day by 2014
(EIA, 2013). Like the rest of the African oil producing countries, the Angolan oil
industry is focused on development of upstream activities. The only oil refinery is
currently in Luanda with a production capacity of 65 000 barrels per day (bpd) which
is insufficient for domestic demand. A second plant is, however, under construction
in Lobito which will have the capacity to produce 200 000 bpd (Angola Today, 2010;
Sanangol, 2012).
Sonangol is Angola’s national oil company that was established in 1976. The
company works with several multi-national oil companies to produce Angolan oil.
The company does so through joint ventures and the sort of production sharing
agreements mentioned in chapter two (Angola Today, 2010). Figure 3.10 illustrates
the total Greenfield investment in the Angolan oil sector from 2003 to 2009.
Figure 3.13. Total Greenfield FDI in the Angolan oil sector between 2003 and 2010
(in million dollars current currency)
Source: Author’s own compilation using FDI Markets (2012) data.
0
2000
4000
6000
8000
10000
12000
14000
16000
year 2003 2004 2005 2006 2007 2008 2009
Total greenfieldinvestment in Angolanoil sector
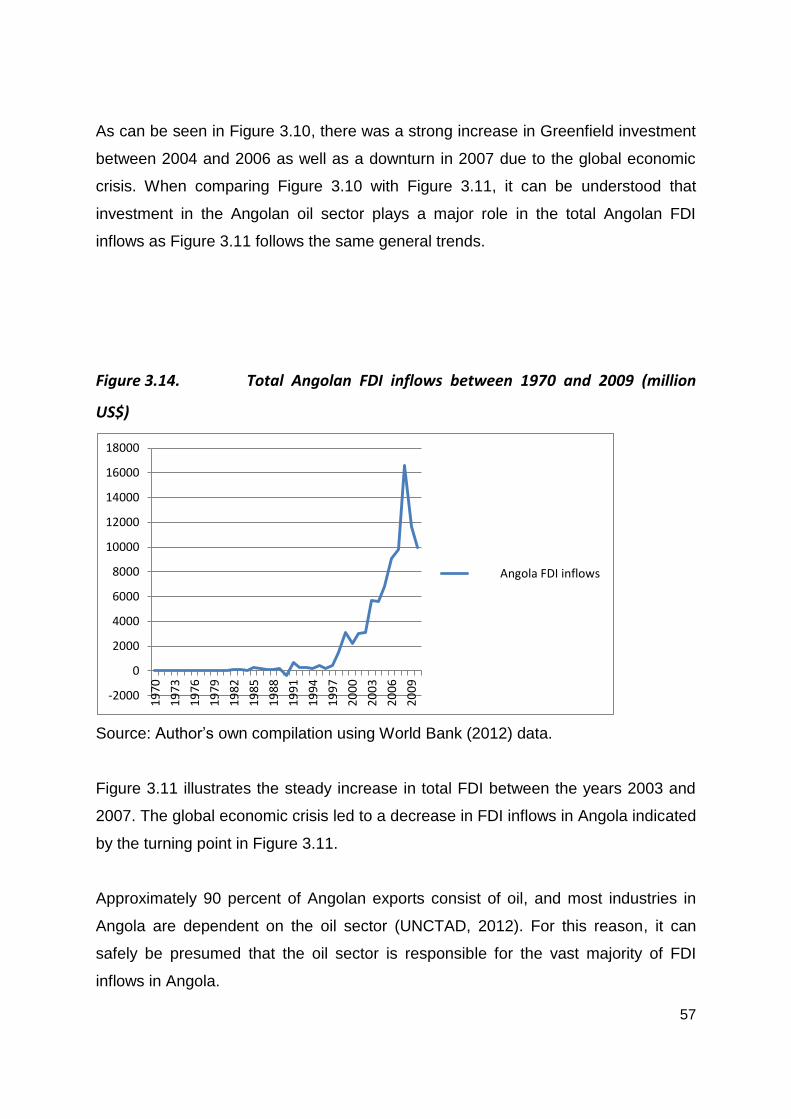
57
As can be seen in Figure 3.10, there was a strong increase in Greenfield investment
between 2004 and 2006 as well as a downturn in 2007 due to the global economic
crisis. When comparing Figure 3.10 with Figure 3.11, it can be understood that
investment in the Angolan oil sector plays a major role in the total Angolan FDI
inflows as Figure 3.11 follows the same general trends.
Figure 3.14. Total Angolan FDI inflows between 1970 and 2009 (million
US$)
Source: Author’s own compilation using World Bank (2012) data.
Figure 3.11 illustrates the steady increase in total FDI between the years 2003 and
2007. The global economic crisis led to a decrease in FDI inflows in Angola indicated
by the turning point in Figure 3.11.
Approximately 90 percent of Angolan exports consist of oil, and most industries in
Angola are dependent on the oil sector (UNCTAD, 2012). For this reason, it can
safely be presumed that the oil sector is responsible for the vast majority of FDI
inflows in Angola.
-2000
0
2000
4000
6000
8000
10000
12000
14000
16000
18000
19
70
19
73
19
76
19
79
19
82
19
85
19
88
19
91
19
94
19
97
20
00
20
03
20
06
20
09
Angola FDI inflows
58
3.5. Summary
Global FDI is highly dependent on the global economic situation and is, therefore,
greatly influenced by economic downturns and booms as can be seen through the
2008 global economic crisis and the influence thereof on global FDI flows. In turn,
global oil supply and demand is somewhat dependent on FDI and the economic
wellbeing. All regions are, however, not influenced equally by economic downturns
for the 2008 global economic crisis did not influence the oil demand or FDI outflows
from Asia as much as it influenced the majority of developed countries.
African FDI inflows have strongly increased during the period 2000 to 2007. This can
be attributed to healthy growth in the region and to the many oil discoveries in
several African countries. The oil industry is the industry in Africa that enjoys the
highest FDI inflows. Many African countries are highly dependent on the oil industry
and would therefore diversification could be advantageous through developing other
industries. Further, oil rich African countries will have to undergo policy changes and
restructuring to realise greater development through oil revenues.
Good examples of African countries that have significant revenues from the oil sector
are Nigeria and Angola. These countries are, however, under-developed and
therefore need restructuring of policies. Nigeria introduced the PIB in 2008 that
intended better vesting of petroleum, better allocation of land, better management of
petroleum resources, higher participation by the government, better transparency
and governance and lowering the level of environmental damage associated with the
industry. The Bill, however, caused disinvestment as it brought uncertainty to the
industry. In the long-term, it is nevertheless thought to be beneficial for the Nigerian
oil industry. Angola has also undergone restructuring by adopting the IMF Stand-By
Arrangement that focuses discipline and transparency in the fiscal and monetary
policies, improvement of the banking system, public finance management and
exchange rate system to better allocate revenue from the oil sector.
In conclusion, the African oil sector and particularly those of Nigeria and Angola,
have much to gain through development of the oil sector and increasing their

59
attractiveness as a safe investment destination. The problems faced by these
countries and the region is, however, the eradication of political uncertainty and
corruption and to restructure policies in such a manner that oil revenues are properly
utilised to promote development.
60
Chapter 4 –Empirical Analysis of oil sector FDI in Nigeria and
Angola
4.1. Introduction of oil sector FDI in Nigeria and Angola
Possible factors that could influence FDI inflows to the Nigerian and Angolan oil
sectors include both domestic and global determinants. Domestic determinants can
again be divided into macro-economic determinants and micro-economic
determinants. Macro-economic determinates exist throughout the whole economy of
the host country and they include political risk, exchange rates, inflation rates,
openness of the market, domestic investment, value of exports and the budgetary
deficit (Naude and Krugell, 2003: 2-12). Micro-economic determinants exist on an
industry level that directly influences the profitability and cost of FDI. They include
growth within the market, the market size, the cost of labour, the policies of the
governments of the host countries and trade barriers. Global determinants on the
other hand are not influenced by any particular country as these determinants are
dependent on global trends (Al Yousef, 2012: 5-6). Global determinants include the
demand for oil, the production or supply thereof and the oil price. The supply of oil is,
however, subject to the limited reserves of oil and, as a result, the procurement of oil
becomes more costly as the reserves become harder to reach (Hotelling, 1931: 37-
75; Schindler and Zittel, 2008).
This chapter firstly considers previous studies to determine what findings research
has delivered in the past to determine which determinants can be used in the
econometric model. Secondly, the data that was compiled through several sources is
defined and the transformation of the data to better suit the model will be described,
together with the function of the model. After the data has been described and
transformed, the best models for each country will be illustrated, the first with
domestic variables and thereafter the second, with global variables. These models
will be interpreted and finally compared on a country against country basis before a
conclusion for this chapter is reached.
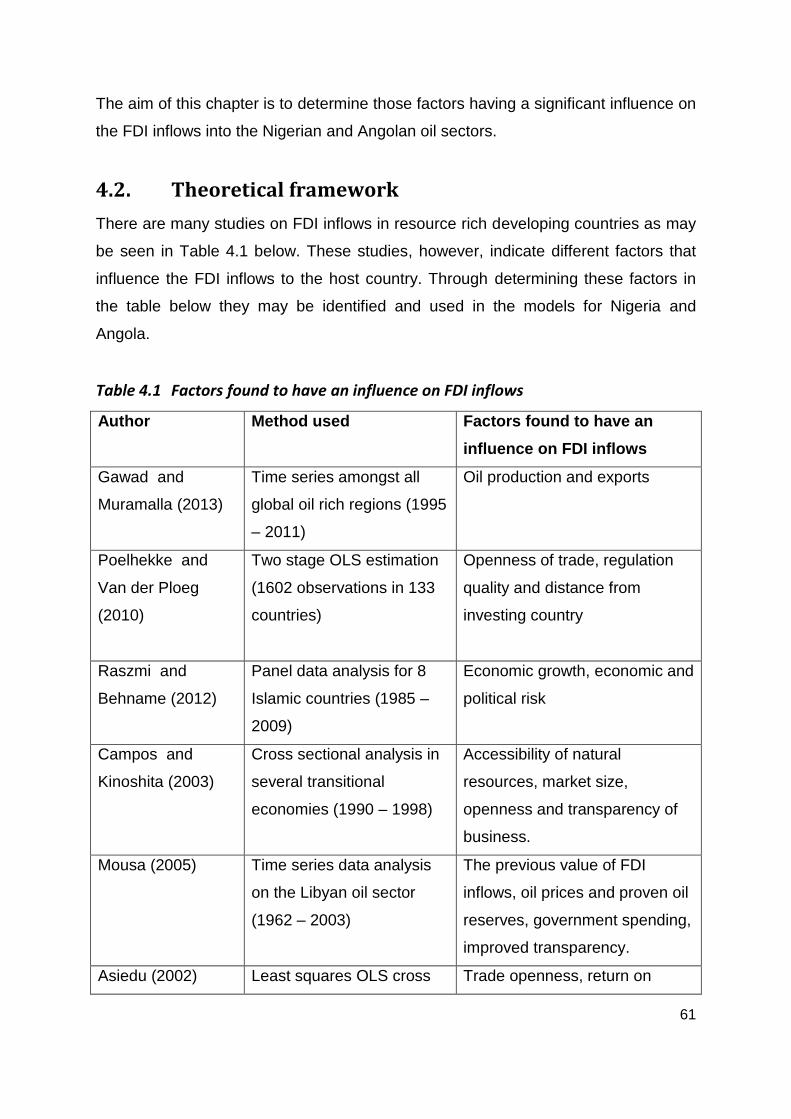
61
The aim of this chapter is to determine those factors having a significant influence on
the FDI inflows into the Nigerian and Angolan oil sectors.
4.2. Theoretical framework
There are many studies on FDI inflows in resource rich developing countries as may
be seen in Table 4.1 below. These studies, however, indicate different factors that
influence the FDI inflows to the host country. Through determining these factors in
the table below they may be identified and used in the models for Nigeria and
Angola.
Table 4.1 Factors found to have an influence on FDI inflows
Author Method used Factors found to have an
influence on FDI inflows
Gawad and
Muramalla (2013)
Time series amongst all
global oil rich regions (1995
– 2011)
Oil production and exports
Poelhekke and
Van der Ploeg
(2010)
Two stage OLS estimation
(1602 observations in 133
countries)
Openness of trade, regulation
quality and distance from
investing country
Raszmi and
Behname (2012)
Panel data analysis for 8
Islamic countries (1985 –
2009)
Economic growth, economic and
political risk
Campos and
Kinoshita (2003)
Cross sectional analysis in
several transitional
economies (1990 – 1998)
Accessibility of natural
resources, market size,
openness and transparency of
business.
Mousa (2005) Time series data analysis
on the Libyan oil sector
(1962 – 2003)
The previous value of FDI
inflows, oil prices and proven oil
reserves, government spending,
improved transparency.
Asiedu (2002) Least squares OLS cross Trade openness, return on
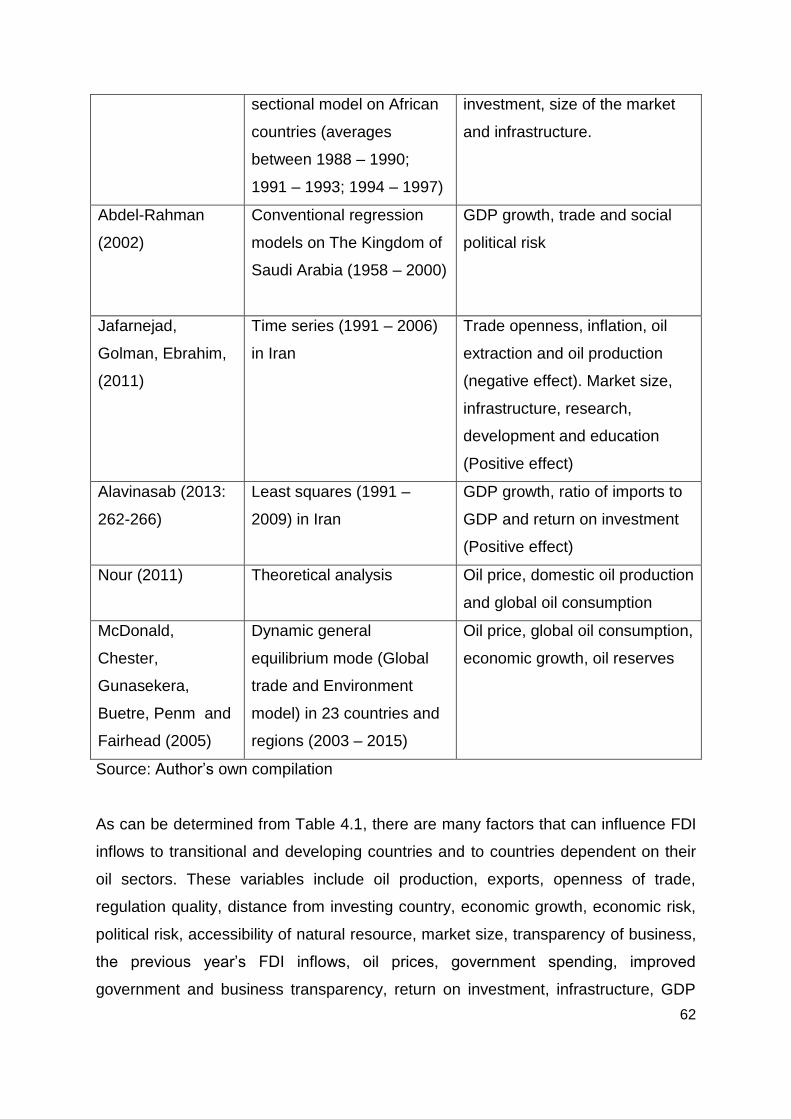
62
sectional model on African
countries (averages
between 1988 – 1990;
1991 – 1993; 1994 – 1997)
investment, size of the market
and infrastructure.
Abdel-Rahman
(2002)
Conventional regression
models on The Kingdom of
Saudi Arabia (1958 – 2000)
GDP growth, trade and social
political risk
Jafarnejad,
Golman, Ebrahim,
(2011)
Time series (1991 – 2006)
in Iran
Trade openness, inflation, oil
extraction and oil production
(negative effect). Market size,
infrastructure, research,
development and education
(Positive effect)
Alavinasab (2013:
262-266)
Least squares (1991 –
2009) in Iran
GDP growth, ratio of imports to
GDP and return on investment
(Positive effect)
Nour (2011) Theoretical analysis Oil price, domestic oil production
and global oil consumption
McDonald,
Chester,
Gunasekera,
Buetre, Penm and
Fairhead (2005)
Dynamic general
equilibrium mode (Global
trade and Environment
model) in 23 countries and
regions (2003 – 2015)
Oil price, global oil consumption,
economic growth, oil reserves
Source: Author’s own compilation
As can be determined from Table 4.1, there are many factors that can influence FDI
inflows to transitional and developing countries and to countries dependent on their
oil sectors. These variables include oil production, exports, openness of trade,
regulation quality, distance from investing country, economic growth, economic risk,
political risk, accessibility of natural resource, market size, transparency of business,
the previous year’s FDI inflows, oil prices, government spending, improved
government and business transparency, return on investment, infrastructure, GDP
63
growth, inflation, domestic oil production and reserves, research and development,
global oil production and consumption.
4.3. Empirical analysis
The empirical analysis consists of a description of the data used, how the data was
transformed to fit the empirical model, the domestic and global models for Nigeria
and Angola and a country-to-country comparison between the findings of these
models.
4.3.1. Factors expected to influence oil sector FDI
Derived from the past studies and literature review, possible factors that may have
an influence on oil sector FDI includes domestic variables: domestic oil production,
domestic oil reserves, inflation rate in the host country, exports of goods and
services, market size, market growth, infrastructure, trade openness, political and
regulatory indicators. At a global level, variables include global oil reserves, global oil
production, global oil consumption, the oil price and global FDI inflows
4.3.2. Data description
Certain variables that have been found to have a significant influence on FDI inflows
in past studies were, however, not considered in the dissertation, as there are
insufficient historical data on the variables in Nigeria and Angola to compile an
econometric model. Additionally, other variables not found in past studies were
included in this dissertation. These variables include global FDI inflows excluding the
host country in question to indicate general FDI inflow trends in every year, global oil
production to indicate the supply of oil in the global market and several public and
political stability indicators including voice and accountability, control of corruption,
government effectiveness, political stability or absents of violence and regulatory
quality.
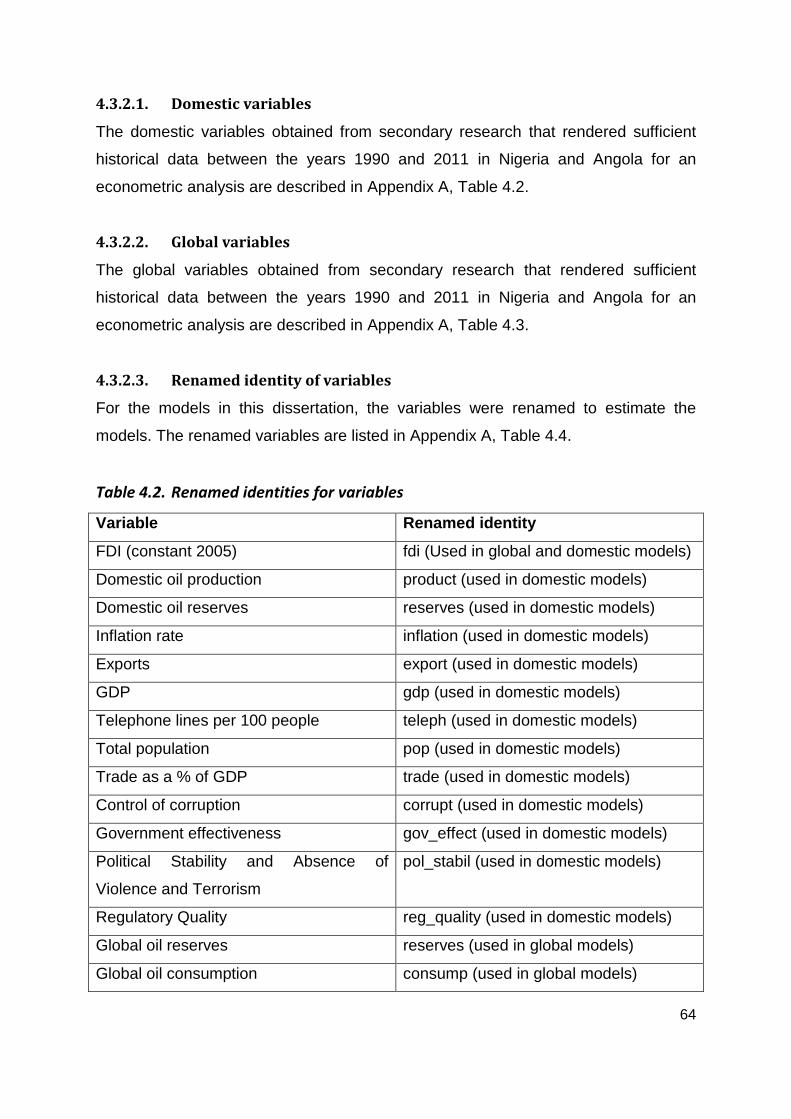
64
4.3.2.1. Domestic variables
The domestic variables obtained from secondary research that rendered sufficient
historical data between the years 1990 and 2011 in Nigeria and Angola for an
econometric analysis are described in Appendix A, Table 4.2.
4.3.2.2. Global variables
The global variables obtained from secondary research that rendered sufficient
historical data between the years 1990 and 2011 in Nigeria and Angola for an
econometric analysis are described in Appendix A, Table 4.3.
4.3.2.3. Renamed identity of variables
For the models in this dissertation, the variables were renamed to estimate the
models. The renamed variables are listed in Appendix A, Table 4.4.
Table 4.2. Renamed identities for variables
Variable Renamed identity
FDI (constant 2005) fdi (Used in global and domestic models)
Domestic oil production product (used in domestic models)
Domestic oil reserves reserves (used in domestic models)
Inflation rate inflation (used in domestic models)
Exports export (used in domestic models)
GDP gdp (used in domestic models)
Telephone lines per 100 people teleph (used in domestic models)
Total population pop (used in domestic models)
Trade as a % of GDP trade (used in domestic models)
Control of corruption corrupt (used in domestic models)
Government effectiveness gov_effect (used in domestic models)
Political Stability and Absence of
Violence and Terrorism
pol_stabil (used in domestic models)
Regulatory Quality reg_quality (used in domestic models)
Global oil reserves reserves (used in global models)
Global oil consumption consump (used in global models)
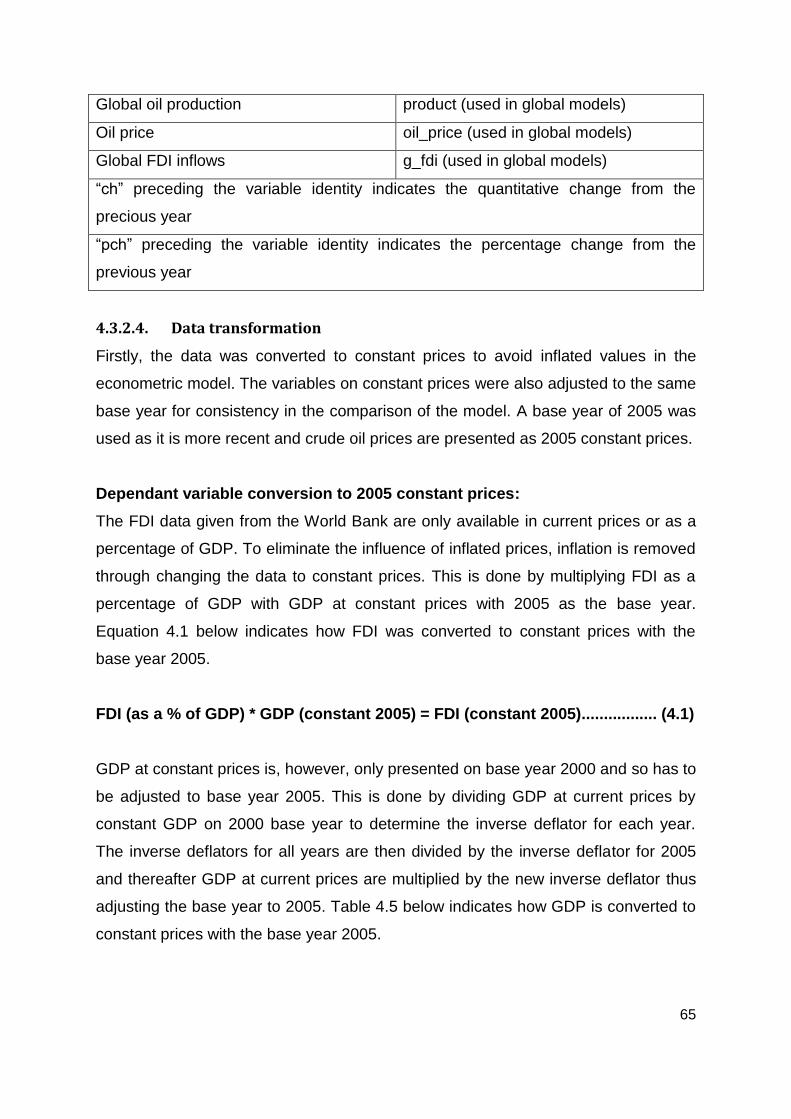
65
Global oil production product (used in global models)
Oil price oil_price (used in global models)
Global FDI inflows g_fdi (used in global models)
“ch” preceding the variable identity indicates the quantitative change from the
precious year
“pch” preceding the variable identity indicates the percentage change from the
previous year
4.3.2.4. Data transformation
Firstly, the data was converted to constant prices to avoid inflated values in the
econometric model. The variables on constant prices were also adjusted to the same
base year for consistency in the comparison of the model. A base year of 2005 was
used as it is more recent and crude oil prices are presented as 2005 constant prices.
Dependant variable conversion to 2005 constant prices:
The FDI data given from the World Bank are only available in current prices or as a
percentage of GDP. To eliminate the influence of inflated prices, inflation is removed
through changing the data to constant prices. This is done by multiplying FDI as a
percentage of GDP with GDP at constant prices with 2005 as the base year.
Equation 4.1 below indicates how FDI was converted to constant prices with the
base year 2005.
FDI (as a % of GDP) * GDP (constant 2005) = FDI (constant 2005)................. (4.1)
GDP at constant prices is, however, only presented on base year 2000 and so has to
be adjusted to base year 2005. This is done by dividing GDP at current prices by
constant GDP on 2000 base year to determine the inverse deflator for each year.
The inverse deflators for all years are then divided by the inverse deflator for 2005
and thereafter GDP at current prices are multiplied by the new inverse deflator thus
adjusting the base year to 2005. Table 4.5 below indicates how GDP is converted to
constant prices with the base year 2005.
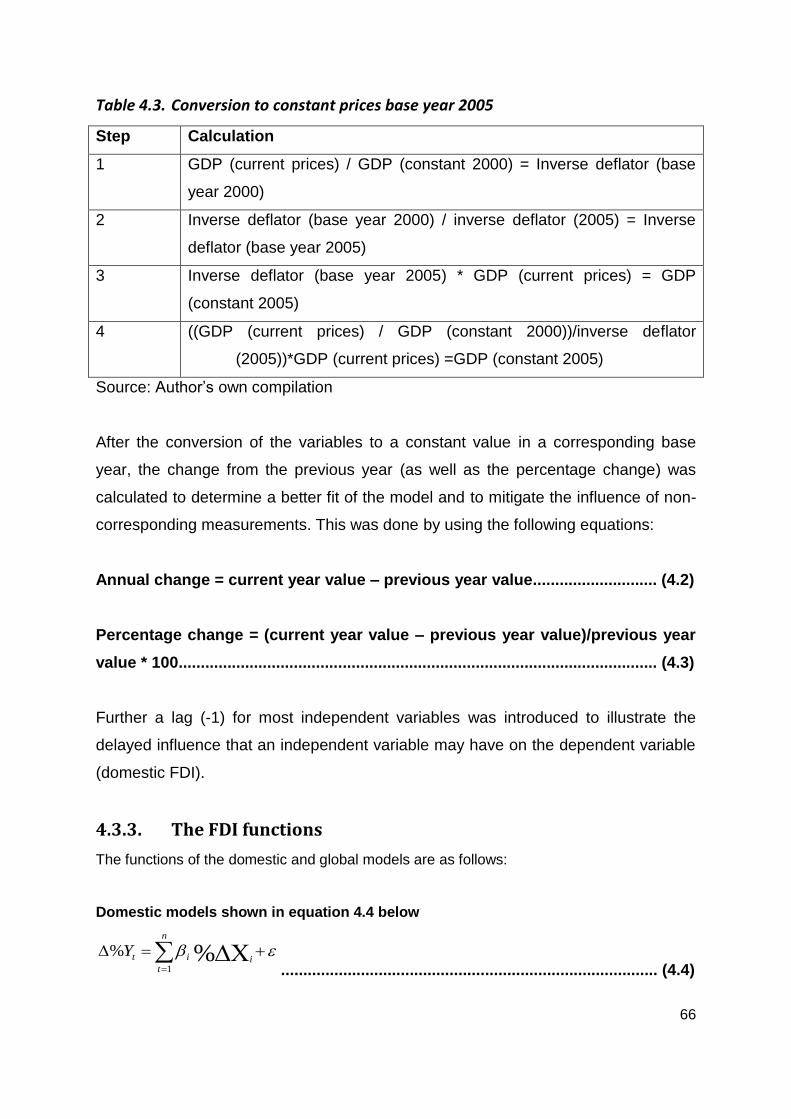
66
Table 4.3. Conversion to constant prices base year 2005
Step Calculation
1 GDP (current prices) / GDP (constant 2000) = Inverse deflator (base
year 2000)
2 Inverse deflator (base year 2000) / inverse deflator (2005) = Inverse
deflator (base year 2005)
3 Inverse deflator (base year 2005) * GDP (current prices) = GDP
(constant 2005)
4 ((GDP (current prices) / GDP (constant 2000))/inverse deflator
(2005))*GDP (current prices) =GDP (constant 2005)
Source: Author’s own compilation
After the conversion of the variables to a constant value in a corresponding base
year, the change from the previous year (as well as the percentage change) was
calculated to determine a better fit of the model and to mitigate the influence of non-
corresponding measurements. This was done by using the following equations:
Annual change = current year value – previous year value............................ (4.2)
Percentage change = (current year value – previous year value)/previous year
value * 100............................................................................................................ (4.3)
Further a lag (-1) for most independent variables was introduced to illustrate the
delayed influence that an independent variable may have on the dependent variable
(domestic FDI).
4.3.3. The FDI functions
The functions of the domestic and global models are as follows:
Domestic models shown in equation 4.4 below
%1
%ii
n
t
tY
..................................................................................... (4.4)
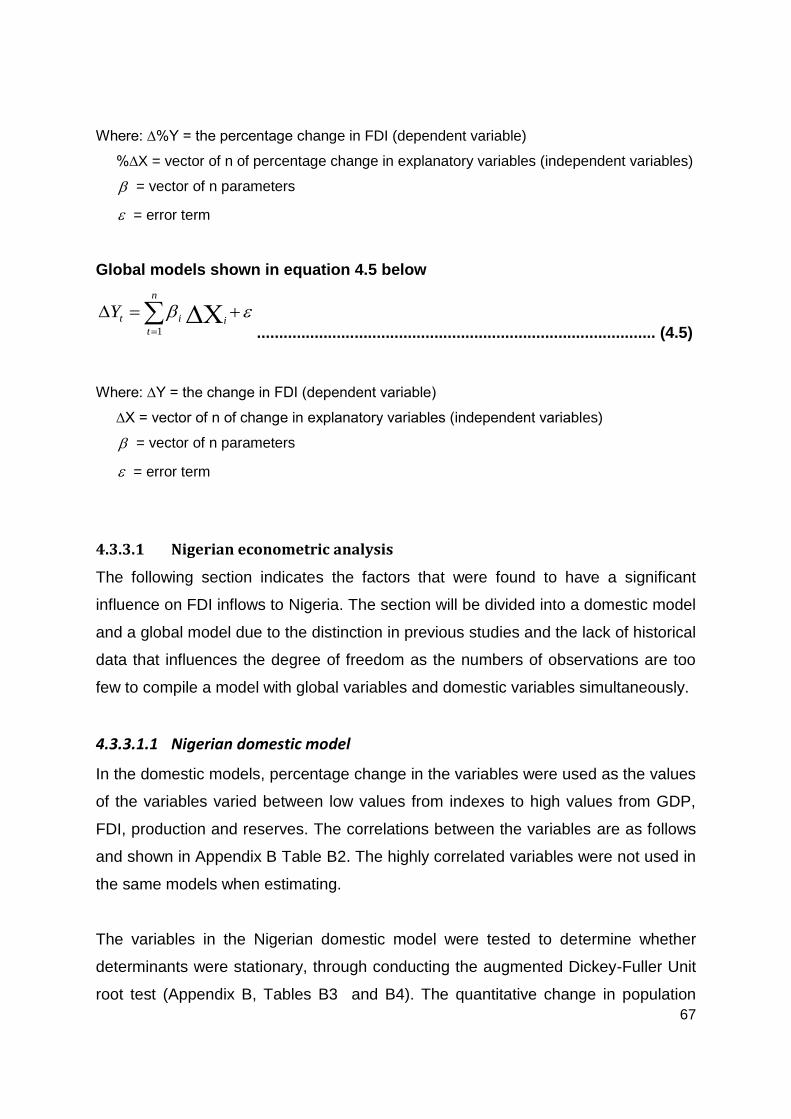
67
Where: ∆%Y = the percentage change in FDI (dependent variable)
%∆X = vector of n of percentage change in explanatory variables (independent variables)
= vector of n parameters
= error term
Global models shown in equation 4.5 below
ii
n
t
tY1 .......................................................................................... (4.5)
Where: ∆Y = the change in FDI (dependent variable)
∆X = vector of n of change in explanatory variables (independent variables)
= vector of n parameters
= error term
4.3.3.1 Nigerian econometric analysis
The following section indicates the factors that were found to have a significant
influence on FDI inflows to Nigeria. The section will be divided into a domestic model
and a global model due to the distinction in previous studies and the lack of historical
data that influences the degree of freedom as the numbers of observations are too
few to compile a model with global variables and domestic variables simultaneously.
4.3.3.1.1 Nigerian domestic model
In the domestic models, percentage change in the variables were used as the values
of the variables varied between low values from indexes to high values from GDP,
FDI, production and reserves. The correlations between the variables are as follows
and shown in Appendix B Table B2. The highly correlated variables were not used in
the same models when estimating.
The variables in the Nigerian domestic model were tested to determine whether
determinants were stationary, through conducting the augmented Dickey-Fuller Unit
root test (Appendix B, Tables B3 and B4). The quantitative change in population
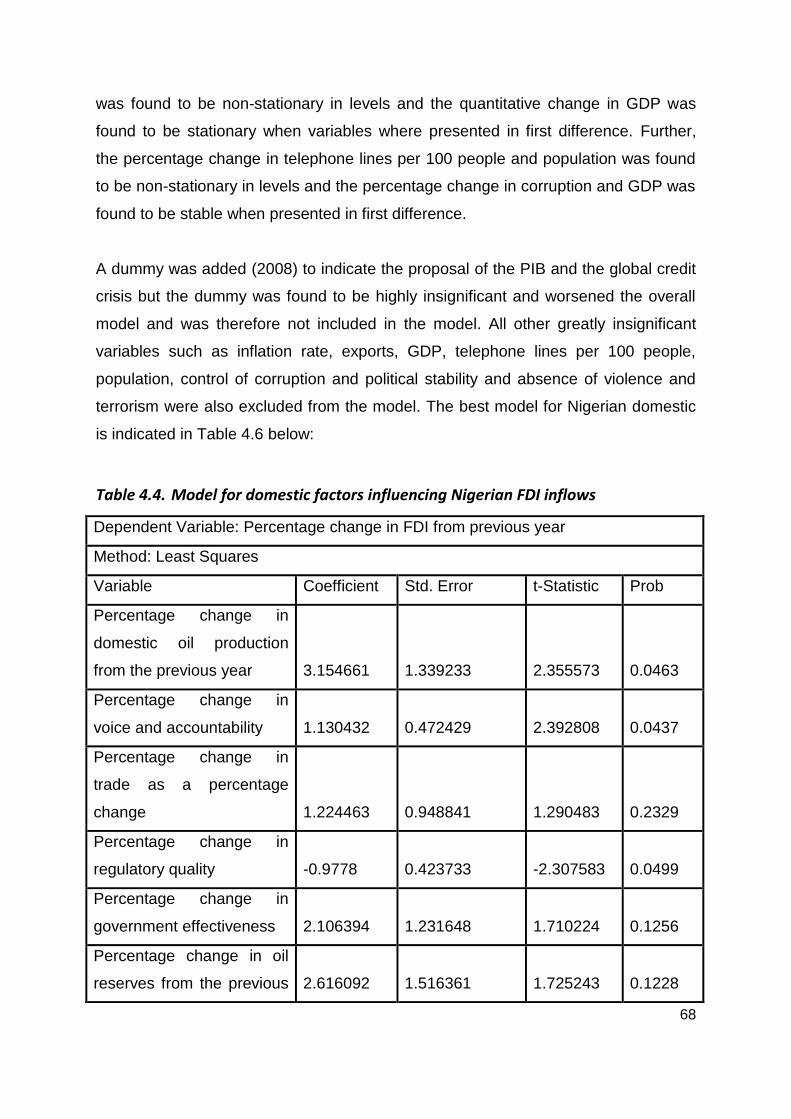
68
was found to be non-stationary in levels and the quantitative change in GDP was
found to be stationary when variables where presented in first difference. Further,
the percentage change in telephone lines per 100 people and population was found
to be non-stationary in levels and the percentage change in corruption and GDP was
found to be stable when presented in first difference.
A dummy was added (2008) to indicate the proposal of the PIB and the global credit
crisis but the dummy was found to be highly insignificant and worsened the overall
model and was therefore not included in the model. All other greatly insignificant
variables such as inflation rate, exports, GDP, telephone lines per 100 people,
population, control of corruption and political stability and absence of violence and
terrorism were also excluded from the model. The best model for Nigerian domestic
is indicated in Table 4.6 below:
Table 4.4. Model for domestic factors influencing Nigerian FDI inflows
Dependent Variable: Percentage change in FDI from previous year
Method: Least Squares
Variable Coefficient Std. Error t-Statistic Prob
Percentage change in
domestic oil production
from the previous year 3.154661 1.339233 2.355573 0.0463
Percentage change in
voice and accountability 1.130432 0.472429 2.392808 0.0437
Percentage change in
trade as a percentage
change 1.224463 0.948841 1.290483 0.2329
Percentage change in
regulatory quality -0.9778 0.423733 -2.307583 0.0499
Percentage change in
government effectiveness 2.106394 1.231648 1.710224 0.1256
Percentage change in oil
reserves from the previous 2.616092 1.516361 1.725243 0.1228
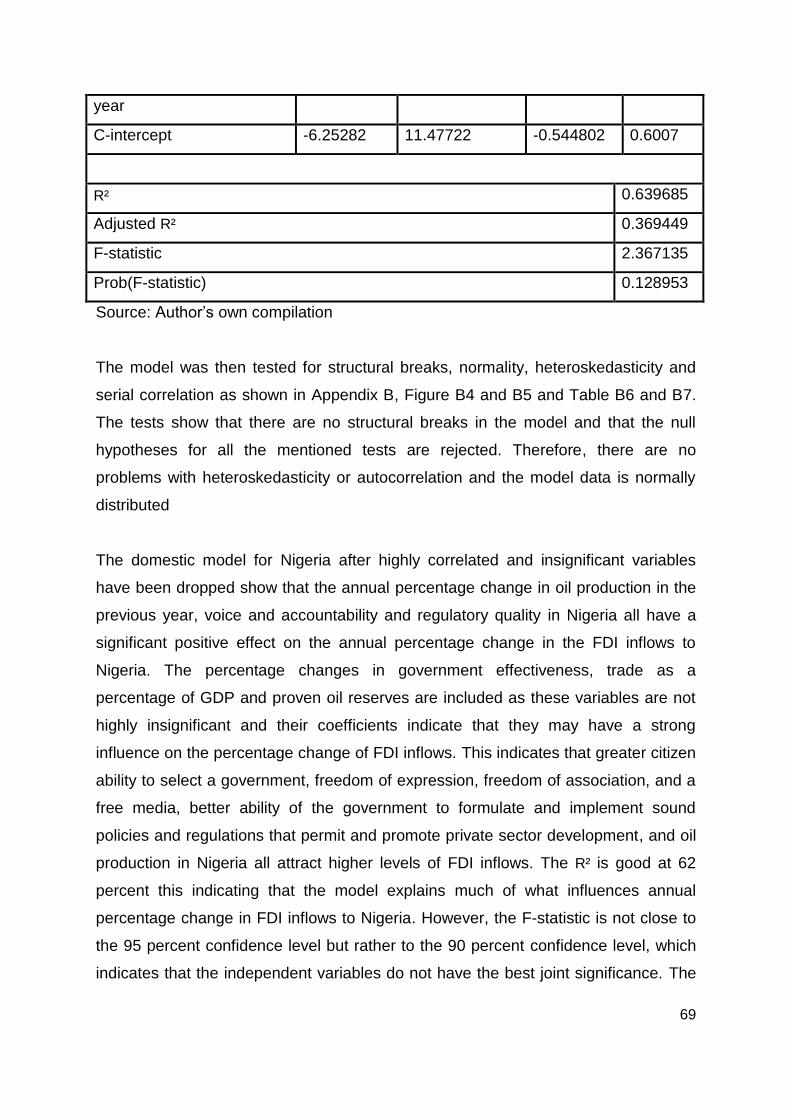
69
year
C-intercept -6.25282 11.47722 -0.544802 0.6007
R² 0.639685
Adjusted R² 0.369449
F-statistic 2.367135
Prob(F-statistic) 0.128953
Source: Author’s own compilation
The model was then tested for structural breaks, normality, heteroskedasticity and
serial correlation as shown in Appendix B, Figure B4 and B5 and Table B6 and B7.
The tests show that there are no structural breaks in the model and that the null
hypotheses for all the mentioned tests are rejected. Therefore, there are no
problems with heteroskedasticity or autocorrelation and the model data is normally
distributed
The domestic model for Nigeria after highly correlated and insignificant variables
have been dropped show that the annual percentage change in oil production in the
previous year, voice and accountability and regulatory quality in Nigeria all have a
significant positive effect on the annual percentage change in the FDI inflows to
Nigeria. The percentage changes in government effectiveness, trade as a
percentage of GDP and proven oil reserves are included as these variables are not
highly insignificant and their coefficients indicate that they may have a strong
influence on the percentage change of FDI inflows. This indicates that greater citizen
ability to select a government, freedom of expression, freedom of association, and a
free media, better ability of the government to formulate and implement sound
policies and regulations that permit and promote private sector development, and oil
production in Nigeria all attract higher levels of FDI inflows. The R² is good at 62
percent this indicating that the model explains much of what influences annual
percentage change in FDI inflows to Nigeria. However, the F-statistic is not close to
the 95 percent confidence level but rather to the 90 percent confidence level, which
indicates that the independent variables do not have the best joint significance. The
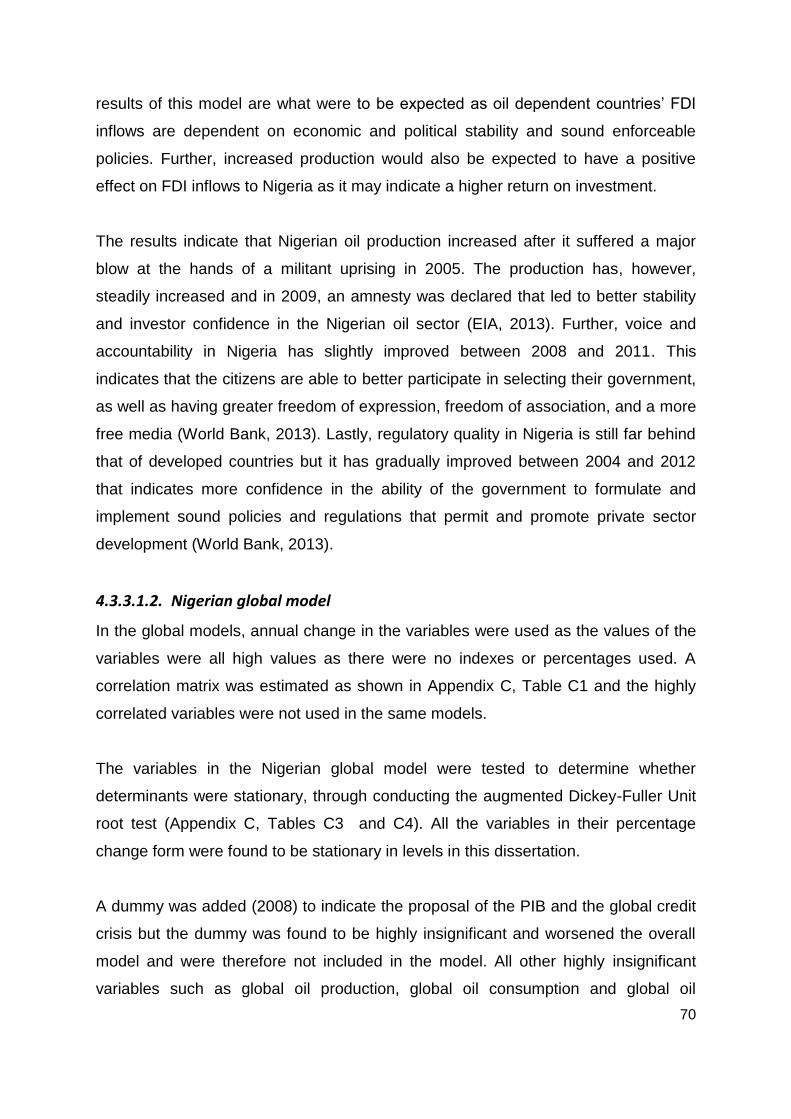
70
results of this model are what were to be expected as oil dependent countries’ FDI
inflows are dependent on economic and political stability and sound enforceable
policies. Further, increased production would also be expected to have a positive
effect on FDI inflows to Nigeria as it may indicate a higher return on investment.
The results indicate that Nigerian oil production increased after it suffered a major
blow at the hands of a militant uprising in 2005. The production has, however,
steadily increased and in 2009, an amnesty was declared that led to better stability
and investor confidence in the Nigerian oil sector (EIA, 2013). Further, voice and
accountability in Nigeria has slightly improved between 2008 and 2011. This
indicates that the citizens are able to better participate in selecting their government,
as well as having greater freedom of expression, freedom of association, and a more
free media (World Bank, 2013). Lastly, regulatory quality in Nigeria is still far behind
that of developed countries but it has gradually improved between 2004 and 2012
that indicates more confidence in the ability of the government to formulate and
implement sound policies and regulations that permit and promote private sector
development (World Bank, 2013).
4.3.3.1.2. Nigerian global model
In the global models, annual change in the variables were used as the values of the
variables were all high values as there were no indexes or percentages used. A
correlation matrix was estimated as shown in Appendix C, Table C1 and the highly
correlated variables were not used in the same models.
The variables in the Nigerian global model were tested to determine whether
determinants were stationary, through conducting the augmented Dickey-Fuller Unit
root test (Appendix C, Tables C3 and C4). All the variables in their percentage
change form were found to be stationary in levels in this dissertation.
A dummy was added (2008) to indicate the proposal of the PIB and the global credit
crisis but the dummy was found to be highly insignificant and worsened the overall
model and were therefore not included in the model. All other highly insignificant
variables such as global oil production, global oil consumption and global oil
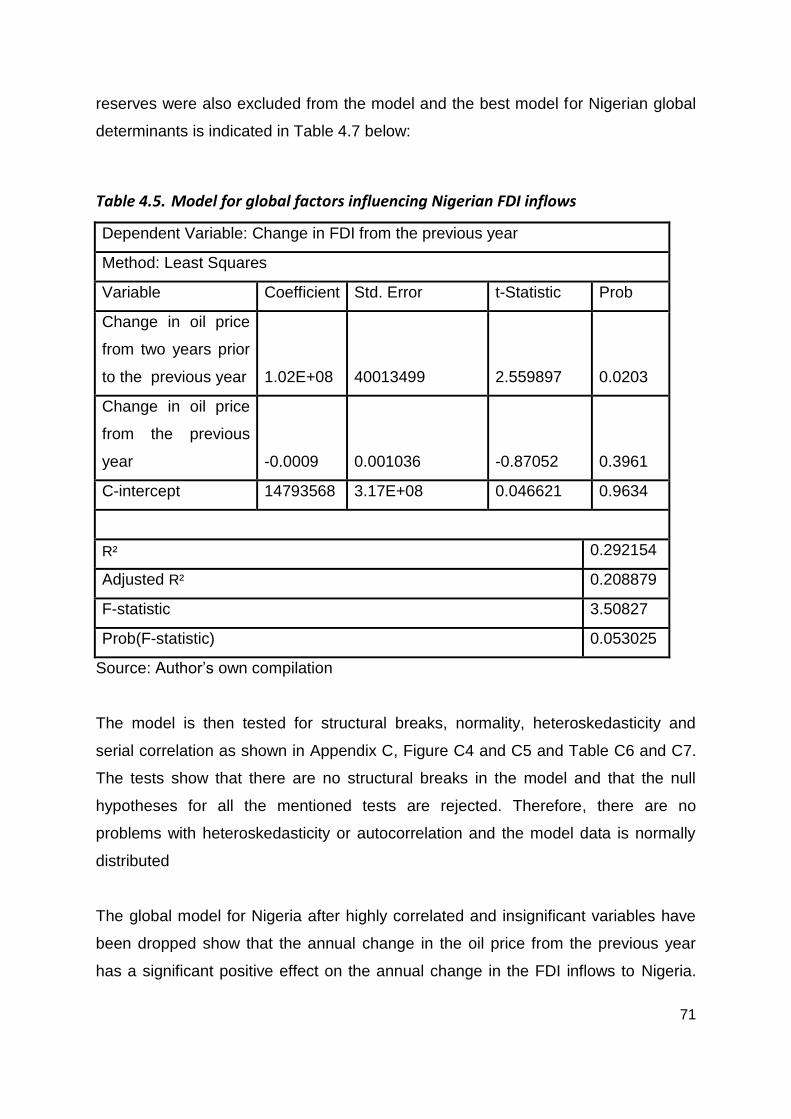
71
reserves were also excluded from the model and the best model for Nigerian global
determinants is indicated in Table 4.7 below:
Table 4.5. Model for global factors influencing Nigerian FDI inflows
Dependent Variable: Change in FDI from the previous year
Method: Least Squares
Variable Coefficient Std. Error t-Statistic Prob
Change in oil price
from two years prior
to the previous year 1.02E+08 40013499 2.559897 0.0203
Change in oil price
from the previous
year -0.0009 0.001036 -0.87052 0.3961
C-intercept 14793568 3.17E+08 0.046621 0.9634
R² 0.292154
Adjusted R² 0.208879
F-statistic 3.50827
Prob(F-statistic) 0.053025
Source: Author’s own compilation
The model is then tested for structural breaks, normality, heteroskedasticity and
serial correlation as shown in Appendix C, Figure C4 and C5 and Table C6 and C7.
The tests show that there are no structural breaks in the model and that the null
hypotheses for all the mentioned tests are rejected. Therefore, there are no
problems with heteroskedasticity or autocorrelation and the model data is normally
distributed
The global model for Nigeria after highly correlated and insignificant variables have
been dropped show that the annual change in the oil price from the previous year
has a significant positive effect on the annual change in the FDI inflows to Nigeria.
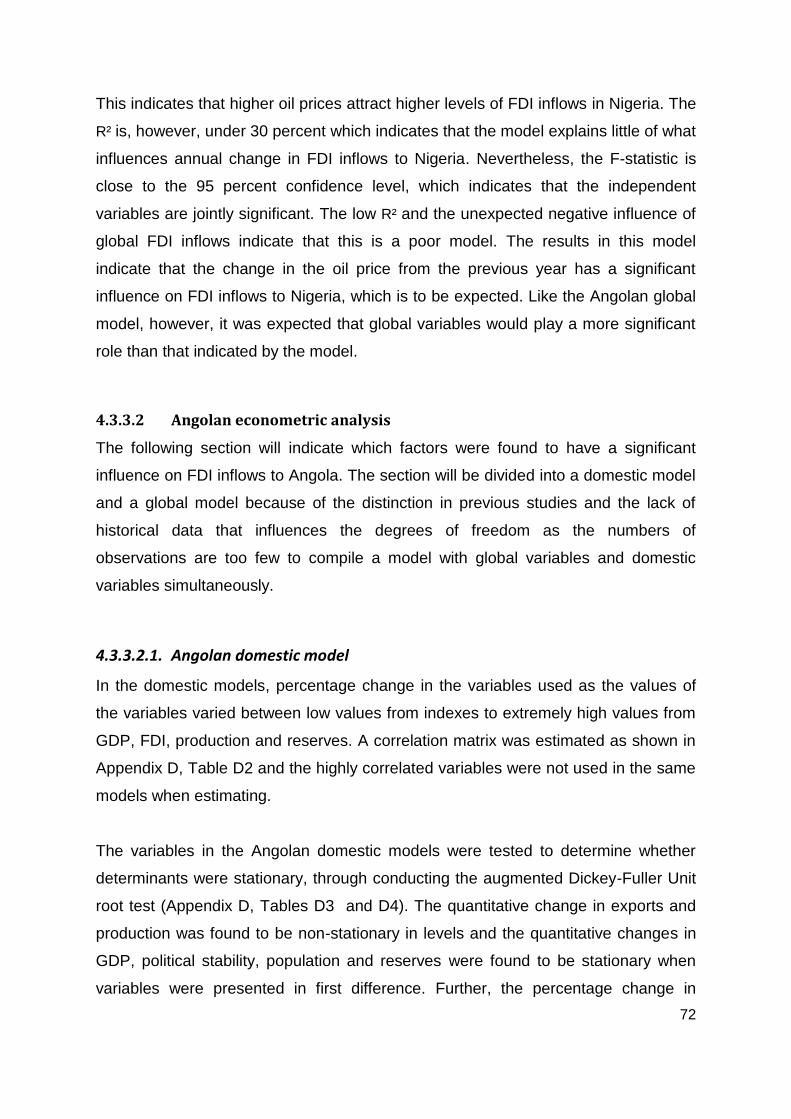
72
This indicates that higher oil prices attract higher levels of FDI inflows in Nigeria. The
R² is, however, under 30 percent which indicates that the model explains little of what
influences annual change in FDI inflows to Nigeria. Nevertheless, the F-statistic is
close to the 95 percent confidence level, which indicates that the independent
variables are jointly significant. The low R² and the unexpected negative influence of
global FDI inflows indicate that this is a poor model. The results in this model
indicate that the change in the oil price from the previous year has a significant
influence on FDI inflows to Nigeria, which is to be expected. Like the Angolan global
model, however, it was expected that global variables would play a more significant
role than that indicated by the model.
4.3.3.2 Angolan econometric analysis
The following section will indicate which factors were found to have a significant
influence on FDI inflows to Angola. The section will be divided into a domestic model
and a global model because of the distinction in previous studies and the lack of
historical data that influences the degrees of freedom as the numbers of
observations are too few to compile a model with global variables and domestic
variables simultaneously.
4.3.3.2.1. Angolan domestic model
In the domestic models, percentage change in the variables used as the values of
the variables varied between low values from indexes to extremely high values from
GDP, FDI, production and reserves. A correlation matrix was estimated as shown in
Appendix D, Table D2 and the highly correlated variables were not used in the same
models when estimating.
The variables in the Angolan domestic models were tested to determine whether
determinants were stationary, through conducting the augmented Dickey-Fuller Unit
root test (Appendix D, Tables D3 and D4). The quantitative change in exports and
production was found to be non-stationary in levels and the quantitative changes in
GDP, political stability, population and reserves were found to be stationary when
variables were presented in first difference. Further, the percentage change in

73
political stability and population was found to be non-stationary in levels and the
percentage change in GDP was found to be stable when presented in first
difference.
Dummy variables were added for 2002 and 2008 to indicate the end of the civil war
in Angola and the global credit crisis, but the dummies were found to be insignificant
and worsened the overall model and were, therefore, not included in the model. All
other highly insignificant variables such as domestic oil production, inflation rate,
exports, GDP, telephone lines per 100 people, population and trade as a percentage
of GDP were also excluded from the model and the best model for Angolan domestic
determinants is indicated in Table 4.8 below:
Table 4.6 Model for domestic factors influencing Angolan FDI inflows
Dependent Variable: Percentage change in FDI from previous year
Method: Least Squares
Variable Coefficient Std. Error t-Statistic Prob
Percentage change
in freedom from
corruption 23.74282 10.47229 2.267204 0.0445
Percentage change
in government
effectiveness 13.2669 5.786513 2.292728 0.0426
Percentage change
in domestic oil
reserves 29.20611 7.153484 4.082782 0.0018
C-intercept -186.2426 131.399 -1.417382 0.1841
R² 0.673115
Adjusted R² 0.583964
F-statistic 7.550318
Prob(F-statistic) 0.00512
Source: Author’s own compilation

74
The model was tested for structural breaks, normality, heteroskedasticity and serial
correlation as shown in Appendix D, Figure D4 and D5 and table D6 and D7. The
tests show that there are no structural breaks in the model and that the null
hypotheses for all the mentioned tests are rejected. Therefore, there are no
problems with heteroskedasticity or autocorrelation and the model data is normally
distributed.
The domestic model for Angola, after highly correlated and insignificant variables
have been dropped, show that the annual percentage change in control of
corruption, government effectiveness and the proven oil reserves in Angola all have
a significant positive effect on the annual percentage change in the FDI inflows to
Angola. This indicates that lower public power to entice private gain, better policies
that are effectively enforced to improve civil and public services, and the proven oil
reserves in Angola attract FDI inflows. The R² is good at 67 percent which indicates
that the model explains much of what influences annual percentage change in FDI
inflows to Angola and the F-statistic is within the 95 percent confidence level which
indicates that the independent variables has a good joint significance making this a
good or feasible model. The results of this model is what was to be expected as oil
dependent countries’ FDI inflows are dependent on economic and political stability
and sound enforceable policies.
The results indicate that even though corruption is reputedly widespread among
government officials at all levels and investigations and although it appears that
government officials are rarely prosecuted, corruption has decreased in recent years
and this has had a positive effect on FDI inflows to Angola (Heritage. 2012). Further,
the Angolan government have been working with the IMF since 2009 in order to
improve policy making which is aimed at bettering the investment climate in Angola
(Keeler, 2013). Angola has also had continuous exploration success in on- and
offshore drilling projects in recent years, all of which further boosts the confidence of
investors in the country’s future in oil production (EIA, 2013)
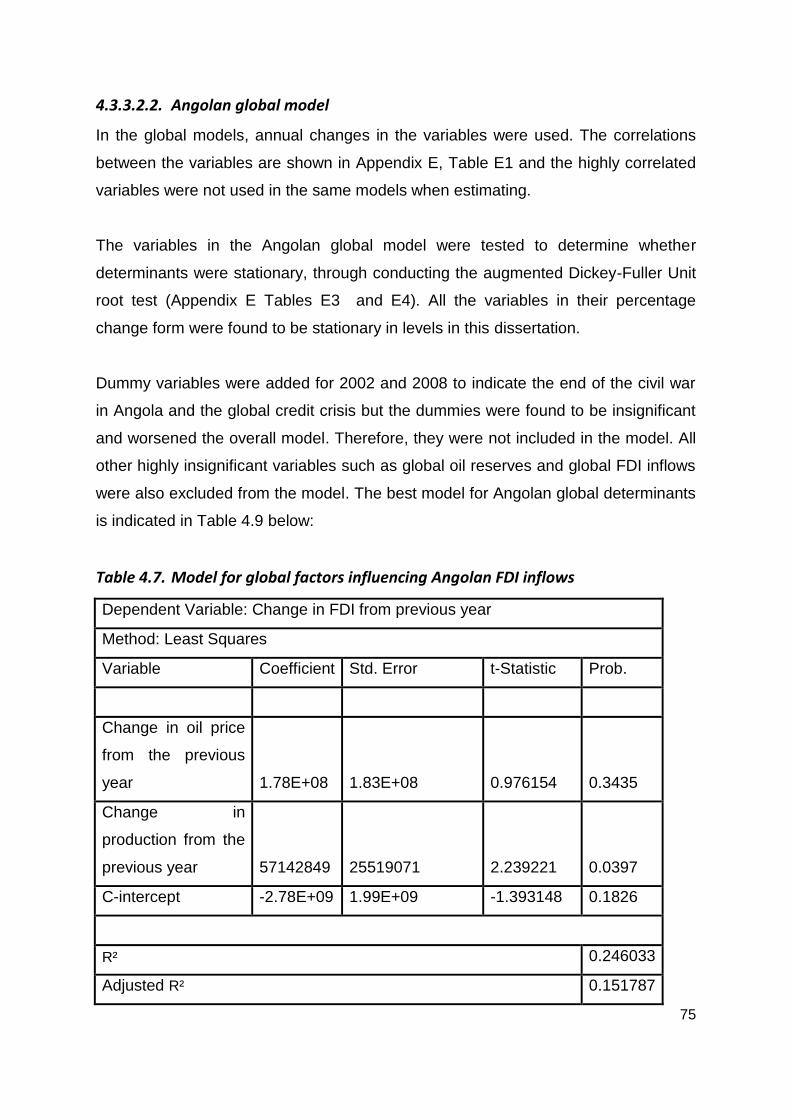
75
4.3.3.2.2. Angolan global model
In the global models, annual changes in the variables were used. The correlations
between the variables are shown in Appendix E, Table E1 and the highly correlated
variables were not used in the same models when estimating.
The variables in the Angolan global model were tested to determine whether
determinants were stationary, through conducting the augmented Dickey-Fuller Unit
root test (Appendix E Tables E3 and E4). All the variables in their percentage
change form were found to be stationary in levels in this dissertation.
Dummy variables were added for 2002 and 2008 to indicate the end of the civil war
in Angola and the global credit crisis but the dummies were found to be insignificant
and worsened the overall model. Therefore, they were not included in the model. All
other highly insignificant variables such as global oil reserves and global FDI inflows
were also excluded from the model. The best model for Angolan global determinants
is indicated in Table 4.9 below:
Table 4.7. Model for global factors influencing Angolan FDI inflows
Dependent Variable: Change in FDI from previous year
Method: Least Squares
Variable Coefficient Std. Error t-Statistic Prob.
Change in oil price
from the previous
year 1.78E+08 1.83E+08 0.976154 0.3435
Change in
production from the
previous year 57142849 25519071 2.239221 0.0397
C-intercept -2.78E+09 1.99E+09 -1.393148 0.1826
R² 0.246033
Adjusted R² 0.151787
76
F-statistic 2.610548
Prob(F-statistic) 0.104428
Source: Author’s own compilation
The model was then tested for structural breaks, normality, heteroskedasticity and
serial correlation as shown in Appendix E, Figure E4 and E5 and Table E6 and E7.
The tests show that there are no structural breaks in the model and that the null
hypotheses for all the mentioned tests are rejected. Therefore, there are no
problems with heteroskedasticity or autocorrelation and the model data is normally
distributed.
The global model for Angola after highly correlated and insignificant variables have
been dropped show that the annual change in global production in the previous year
has a positive effect on the annual change in FDI inflows. The annual change in oil
price from the previous year is, however, kept even though it is insignificant in this
model as it has a high coefficient and, according to literature, has a strong influence
on investment in oil rich countries. The R² is, however, under 30 percent which
indicates that the model explains little of what influences annual change in FDI
inflows to Angola and the F-statistic is not close to the 95 percent confidence level
but rather to the 90 percent confidence level which indicates that the independent
variables does not have the best joint significance. The low R² and the F-statistic
being lower than the 90 percent confidence level indicate that this is a poor model.
This can perhaps be attributed to poor or insufficient data in African countries,
variables that are not quantifiable or variables that were not taken into account in this
dissertation. The results of this model were not expected as it could be expected that
global variables would play a more significant role in FDI inflows to oil dependent
African countries.
4.3.3.3 Model comparison
When comparing the two countries concerning the factors that have a significant
influence on FDI inflows, this dissertation found that even though these countries are
both rich in oil reserves, have substantial oil production, are located in the same
general region and the vast majority of their FDI inflows are contributed by their
77
respected oil sectors, they differ highly in regard to influencing factors regarding FDI
inflows.
According to the domestic models, the variables used that have a significant
influence on FDI inflows in Angola are lower public power to entice private gain,
better policies that are effectively enforced to improve civil and public services, and
the proven oil reserves. This implies that government policy, transparency and their
oil reserves are held in high regard by foreign investors that invest in Angola. In
Nigeria, however, domestic influences of FDI inflows include better citizen ability to
select a government, freedom of expression, freedom of association, and a free
media, better ability of the government to formulate and implement sound policies
and regulations that permit and promote private sector development, and oil
production. This indicates that democracy, government policy and oil production are
held in high regard by foreign investors that invest in Nigeria. Therefore, it can be
argued that even though results for factors influencing FDI inflows differ, there are
similarities as government policy and the oil sector in general influence both
countries, even though the issues in both countries are not necessarily the same.
According to this dissertation, the global factors contrastingly are driven by
completely different factors. According to the global models in the above sections,
Angolan FDI inflows are driven by global oil production (supply) in the previous year
whereas FDI inflows in Nigeria are correlated to the oil price in the previous year.
Both of these models, however, leave much to be desired as they have low R² which
indicates that they explain little of what influences FDI inflows in the countries.
This dissertation, therefore, indicates that FDI inflows in Nigeria and Angola are
more dependent on domestic factors than global factors. This conclusion was not
expected as oil demand is increasing globally.
4.4. Conclusion
The aim of this chapter was to uncover those factors influencing oil sector FDI
inflows to Nigeria and Angola. By comparing past studies on oil rich and resource
dependent developing countries and FDI, as well as oil sector theory, certain
78
influencing factors were identified. Domestic and global variables were then
compiled from available data and were then used in separate domestic and global
models for each country as independent variables. These variables included
domestic production, domestic reserves, inflation, exports, GDP, telephone lines per
100 people, population, trade as a percentage of GDP, control of corruption,
government effectiveness, political stability and absence of violence and terrorism,
regulatory quality, voice and accountability, global oil reserves, global production, oil
price and global FDI inflows. Domestic FDI inflows as a percentage of GDP were
calculated as constant prices on 2005 basis year and used as the dependent
variable for the total FDI inflows in each host country as the vast majority of FDI
inflows is contributed by the oil sector and supporting industries in Nigeria and
Angola.
The models were then interpreted and compared. The findings were that significant
domestic influences of FDI inflows in Angola are lower public power to entice private
gain, better policies that are effectively enforced to improve civil and public services,
and the proven oil reserves. This implies that government policy, transparency and
their oil reserves are held in high regard by foreign investors that invest in Angola. In
Nigeria, however, domestic influences of FDI inflows include greater citizen ability to
select a government, freedom of expression, freedom of association, and a free
media, better ability of the government to formulate and implement sound policies
and regulations that permit and promote private sector development, and oil
production. This indicates that democracy, government policy and oil production are
held in high regard by foreign investors that invest in Nigeria. Therefore, it may be
argued that, even though results for factors influencing FDI inflows differ, there are
similarities for government policy and the oil sector in general influence both
countries even though the issues in both countries are not necessarily the same. The
global factors, on the other hand, are driven by completely different factors.
According to the models, Angolan FDI inflows are driven by global oil production
(supply) in the previous year while FDI inflows in Nigeria are correlated to the oil
price in the previous year. Both of these models, however, leave much to be desired
as they have low R² s indicating that they explain little of what influences FDI inflows
in the countries.
79
All of the models in chapter four produce poor statistical results (except for the
Angolan domestic model). This can be attributed to the lack of sufficient historical
data, the lack of data capturing frequency and inaccurate estimates. Therefore, the
results of the global models were not as expected for it was anticipated that global
variables would play a more significant role in FDI inflows to Nigeria and Angola.
80
Chapter 5 – Summary, Conclusion and Recommendations
5.1. Summary
This dissertation focussed on FDI inflows into the Nigerian and Angolan oil sectors.
The importance of the dissertation lies in the low and insufficient savings rates of
African countries. The low savings rates in African countries lead to lower investment
that result in lower than optimal production growth and therefore lower growth and
development in the countries as a whole. Positive spillovers of FDI can also lead to
better productivity within the host country through new technology being obtained,
easier access into world markets, training of the workforce and skills they obtain as
well as new ideas and procedures. Further, FDI has various indirect effects on the
host country including higher foreign currency reserves, growth in the countries’
production (GDP), job creation and training of the labour force that increases “know-
how” all of which can ultimately lead to higher development. The African oil sector
has, in recent years, enjoyed increasingly high levels of FDI inflows that in some
African countries are greatly (75 percent or more) dependent on their oil sectors for
FDI inflows. Nigeria and Angola are both such countries. They are, respectively, the
top and second largest oil producers in African and are both within the top three
countries with the highest proven oil reserves. It is a popular belief that FDI inflows to
the African oil sector can be an answer to the low African savings rate problem and
that FDI can boost development levels in these countries if the revenues from the oil
sector are utilised in the correct manner to achieve the set development goals.
Therefore this dissertation examines the factors that attract oil sector FDI.
The literature review explained the main concepts of both FDI and the oil sector. The
concepts concerning FDI firstly lie in the definition of FDI that leads to the second
concept, which is the difference between FDI and portfolio investment. FDI is
distinguished by long-term interest and managerial control whereas portfolio
investment is much more volatile as it can easily be divested and is usually shorter in
term. For this reason, FDI is more favourable to developing countries. The third
concept is the categorising of FDI according to the direction of flow (inward or
outward), the type of investment (Greenfield investment or Brownfield investment)
81
and according to the motivation for investment (natural resource seeking, market
seeking or efficiency seeking investment). The fourth concept entails the positive
effects of FDI that are split into direct effects and indirect effects. Direct effects are
the more notable and include higher GDP growth because of FDI supplementing the
local savings rate to achieve optimal investment. Indirect effects are less notable as
they are not as easily measureable as are direct effects but are also welcome
attributes. These effects include the transfer of technology and knowledge, higher
levels of employment, better infrastructure, international safety standards, better
resource allocation and stronger financial markets. The fifth concept is the argument
against the effects of FDI that is split into the crowding out effect and the constraints
in absorption capacity. The crowding out effect entails that foreign firms in the local
market may decrease the market share of local firms in the market and the
constraints in absorption capacity refers to negative attributes of the host country
that may cause FDI to have a less positive effect. Finally, the determinants of FDI
are described by dividing them into micro-economic and macro-economic
determinants. Macro-economic determinants exist throughout whole economy
whereas micro-economic determinants are on the industry level. This directly
influences the profitability and cost of FDI.
The concepts concerning the oil sector include firstly the types of oil reserves that
indicate the probability of extractable oil in the country. The second concept is the
difference between upstream and downstream investment, upstream investment
being the production or extraction of oil and downstream being the refinery and
production of oil by-products. The third concept is the different companies who invest
in the oil industry. These companies include small independent oil companies who
focus on the exploration of oil, national oil companies who also focus mainly on
exploration but their objectives are related to economic wellbeing of the country
rather than an increase in equity and lastly fully integrated multi-national oil
companies who focuses of both upstream and downstream activities as well as the
supply of oil to the public. Another topic discussed is the working of the petroleum
fiscal system that can be distinguished between concessionary and contractual
systems. Contractual systems are further divided into PSCs and service contracts. In
turn, service contracts can be either a pure service contract or a risk service
82
contract. Lastly, the natural resource curse argues that misfortunes in resource rich
developing countries arise because of their focus on natural resources and their
dependency on these natural resources. A review of past studies on the
determinants of FDI inflows in developing and oil producing countries which may be
relevant to the Nigerian and Angolan oil sector FDI inflows shows that the
determinants of oil sector FDI varies between countries and regions. Therefore, the
region for this dissertation and the lack of data on African countries must be
considered when determining the potential determinants.
Current trends in FDI in oil sector on a global, African and country specific level
indicate that global FDI is highly dependent on the global economic situation and is
therefore influenced by economic downturns and booms. This was amply illustrated
by the 2008 global economic crisis and the influence thereof on global FDI flows. In
turn, global oil supply and demand are respectively dependent on FDI and the
economic wellbeing. Not all regions are, however, influenced equally by economic
downturns as the 2008 global economic crisis did not influence the oil demand or
FDI outflows from Asia as much as it did the majority of developed countries. African
FDI inflows have strongly increased during the period 2000 to 2007. This can be
attributed to healthy growth in the region and to frequent oil discoveries in several
African countries. The oil industry is the industry in Africa that enjoys the highest FDI
inflows. Many African countries are, however, highly dependent on the oil industry
and will therefore aim to diversify through developing other industries. Further, oil
rich African countries will have to undergo policy changes and restructuring to realise
greater development utilising oil revenues. Good examples of African countries that
have significant revenues from the oil sector are Nigeria and Angola. These
countries are, however, under developed and therefore need restructuring of
policies. Nigeria introduced the PIB in 2008 that intended better vesting of petroleum,
better allocation of land, better management of petroleum resources, higher
participation by the government, better transparency and governance and lowering
the level of environmental damage associated with the industry. The Bill however
caused investors to divest as it brought uncertainty. In the long-term, it is
nevertheless thought to be beneficial for the Nigerian oil industry. Angola has also
undergone restructuring by adopting the IMF Stand-By Arrangement that focuses
83
discipline and transparency in the fiscal and monetary policies, improvement of the
banking system, public finance management and exchange rate system to better
allocate revenue from the oil sector. The African oil sector, and particularly Nigeria
and Angola, have much to gain through development of the oil sector and increasing
their attractiveness as a safe investment destination. The problems faced by these
countries and the region are, however, to eradicate political uncertainty and
corruption and to restructure policies in such a manner that oil revenues are properly
utilised to promote development.
There are many factors that can influence FDI inflows to transitional and developing
countries and to countries dependent on their oil sectors. These variables include oil
production, exports, openness of trade, regulation quality, distance from investing
country, economic growth, economic risk, political risk, accessibility of natural
resource, market size, transparency of business, the previous year’s FDI inflows, oil
prices, government spending, improved government and business transparency,
return on investment, infrastructure, GDP growth, inflation, domestic oil production
and reserves, research and development, global oil production and consumption.
The empirical analysis consists of a description of the data used, how the data was
transformed to fit the empirical model, the domestic and global models for Nigeria
and Angola and a country-to-country comparison between the findings of these
models. The underlining data of these factors are, however, insufficient or unreliable
in Nigeria and Angola. Therefore, the dissertation is subject to the availability of data
and whether the available data is plausible or not. Certain variables that have been
found to have a significant influence on FDI inflows in past studies were dropped
from the dissertation, as there is insufficient historical data on the variables in Nigeria
and Angola to compile an econometric model. Further, other variables not found in
past studies were added in this dissertation. These variables include global FDI
inflows excluding the host country in question to indicate general FDI inflow trends in
every year, global oil production to indicate the supply of oil in the global market and
several public and political stability indicators including voice and accountability,
control of corruption, government effectiveness, political stability or absents of
violence and regulatory quality.
84
The national and global models were interpreted and compared. The findings were
that domestic influences of FDI inflows in Nigeria are better citizen ability to select a
government, freedom of expression, freedom of association, and a free media, better
ability of the government to formulate and implement sound policies and regulations
that permit and promote private sector development, and oil production. This
indicates that democracy, government policy and oil production are held in high
regard by foreign investors that invest in Nigeria. In Angola, however, domestic
influences on FDI inflows include lower public power to entice private gain, better
policies that are effectively enforced to improve civil and public services, and the
proven oil reserves. This requires that government policy, transparency and their oil
reserves be held in high regard by foreign investors that invest in Angola. Therefore,
it can be postulated that even though the results for factors influencing FDI inflows
differ, there are similarities for government policy and the oil sector in general
influences both countries. This is accurate even though the issues in both countries
are not necessarily the same. The global factors, on the other hand, are driven by
completely different factors. According to the models in this dissertation, Angolan
FDI inflows are driven by global oil production (supply) in the previous year whereas
FDI inflows in Nigeria are correlated to the oil price in the previous year. Both of
these models, however, leave much to be desired as they both have low R² values
indicating that they explain little of what influences FDI inflows in the countries. This
dissertation therefore suggests that FDI inflows in Angola and Nigeria are more
dependent on domestic factors than global factors. This observation was not
expected, particularly as oil demand is increasing globally.
All of the models produce poor statistical results (except for the Angolan domestic
model). The reason for the Angolan model being the only acceptable model may be
because they have a longer history in the oil industry and their reporting is more
plausible than that of Nigeria. However, the insignificance of global factors was
unexpected, as the mere endowment of natural resources seems not to ensure FDI
inflows. The investment climate and competition from other richly endowed countries
play a large role but is not accurately quantifiable. The poor results of the model can
perhaps be attributed to the lack of sufficient historical data, the lack of data
capturing frequency and inaccurate estimates.
85
5.2. Conclusion
There were many factors that can be seen in past studies having a significant
influence on FDI inflows. However, the data of these underlining factors are
insufficient or unreliable for both Nigeria and Angola. Therefore, the dissertation is
subject to the availability of data and the plausibility of the available data. To ensure
more accurate estimates, data collection on an industry and country level must be
more timeous and exact.
The only truly significant deduction that can be made from the models is that
government policy and the oil sector in general influence FDI inflows to both Nigeria
and Angola. Therefore, it can be recommended that the host governments introduce
further investment friendly policies in order to increase FDI inflows.
Considering the problems found during data collection and econometric estimations
of this dissertation leads to certain recommendations to be made for further studies
concerning this topic. Follow-up studies can consider collecting data that is captured
on a more frequent basis for independent variables and basing the dependent
variable on a deal-to-deal basis rather than an annual collective value, if this is
possible. Using data collected on a more frequent basis allows for higher degrees of
freedom and this will make it possible to estimate a combined model with domestic
and global variables.
86
Reference list
Abdel-Rahman, A.M.M. 2002. The determinants of FDI in the Kingdom of Saudi.
Riyadh. Department of Economics. King Saudi University.
Adams, S. 2009. Foreign direct investment, domestic investment, and economic
growth in Sub-Saharan Africa. Journal of policy modelling, 31:939-949.
ADB (African Development Bank and the African Union). 2009. Oil and gas in
Africa. http://www.afdb.org Date of access: 17 Nov. 2012.
ADB (African Development Bank Group). 2010. Crude oil and natural gas
production in Africa and the global market situation. Commodities Brief, 1(4): 1–7.
AEO (African Economic Outlook). 2007. Angola. OECD.
http://www.africaneconomicoutlook.org Date of access: 2 Nov. 2012.
AEO (African Economic Outlook. 2011. Africa and its emerging partners.
http://www.africaneconomicoutlook.org Date of access: 24 Oct. 2012.
AEO African Economic Outlook. 2012. Angola 2012: AfDB, OECD, UNDP, UNECA.
http://www.africaneconomicoutlook.org Date of access: 2 Nov. 2012.
Agasha. N. 2007. Determinants of export growth rates in Uganda: 1987 – 2006.
Kampala: Uganda Revenue Authority.
Aggarwal, A., Berrill, J., Hutson, E., & Kearney, C. 2010. What is a multi-national
corporation? classifying the degree of firm-level multi-nationality. International
business review, 812:1-21.
87
Aitken, B. & Harrison. A.E. 2009. Do domestic dirms benefit from direct foreign
investment?: evidence from Venezuela. American economic review, 89(3): 605 -
617.
Ajayi, S.I. 2006. Foreign direct investment in Sub-Saharan Africa: origins, targets,
impact and potential. http://www.aercafrica.org Date of access: 20 Mar. 2012.
Akello, J. 2010. Africa: small independent companies must expand.
http://www.allafrica.com Date of access: 20 Mar. 2012.
Al Yousef, N. 2012. Determinants of crude oil prices between 1997 and 2011.
Riyadh. King Saud University.
Alavinasab, S.M. 2013. Determinants of foreign direct investment in Iran.
International journal of academic research in business and social science, 3(2).
http://www.hrmars.com/journals Date of access: 29 May 2013.
Alfaro, L. 2003. Foreign direct investment and growth: does the sector matter?
Boston. Harvard Business School.
Alfaro, L., Chanda, A. Kalemli-Ozcan, S.& Sayek, S. 2009. Does foreign direct
investment promote growth?: eExploring the role of financial markets on linkages.
Jouenal of development economics, 91: 242-256.
Angola Today. 2010. Oil and gas: Angola country profile. http://www.angola-
today.com Date of access: 25 Apr. 2012.
Asiedu, E. 2002 . On the determinants of foreigndDirect investment to developing
countries: is Africa different? Journal of world development, 30(1): 107-119.
Azam, M., Khan, H., Hunjra, A.I., Ahmad, H.M, &. Chani, M.I. 2010. Institutional and
macro-economic policy factors on foreign direct investment: South Asian countries
case. African Journal of Business Management, 5(11): 4306-4313.
88
Basu, A. & Srinivasan, K. 2002. Foreign direct investment in Africa: some case
studies. International Monetary Fund. (IMF Working Paper, 02/61).
Bevan, A.A. & Estrin, S. 2000. Determinants of FDI in transition economies.
Sussex. Centre for New and Emerging Market, London Business School. (Working
Paper, 342).
Blomstrom, M., Kokko, A. & Zejan, M. 2000. Foreign direct investment: firm and
host country strategies. Strockholm. Macmillan Press.
Blonigen, B.A. 2005. A review of the empirical literature on FDI determinants.
Cambridge: National bureau of economic research.
Botric, V. & Skuflic, L. 2005. Main determinants of foreign direct investment in the
south east European countries. Zagreb: Institute of Economics.
BP (British Petroleum). 2011. Oil reserves definitions. http://www.bp.com Date of
access: 20 Feb. 2012.
BP (British Petroleum). 2011. Statistical review. http://www.bp.com Date of
access: 20 Feb. 2012.
BP (British Petroleum). 2012. Statistical review. http://www.bp.com Date of access:
20 Feb. 2012.
BP (British Petroleum). 2013. Statistical review. http://www.bp.com Date of
access: 13 Aug. 2013.
Breitenfellner, A., Cauresma, J.C. & Keppel, C. 2009. Determinats of crude oil
prices: supply, demand, cartel or speculation. Vienna. Oesterreichische National
Bank.

89
Campos, N.F. & Kinoshita, Y. 2003. Why does FDI go where it goes?: new evidence
from the transition economies. Newcastle. IMF Working Paper, IMF Institute.
Chang, R., Hevia, C. & Loayza, N. 2009. Privatization and nationalization cycles.
http://econweb.rutgers.edu Date of access: 14 Oct. 2013.
CIA (Central Intelligence Agency). 2012. Nigeria economic overview.
http://www.cia.gov/library Date of access: 15 Feb. 2012.
Clarke, D. 2010. Africa - crude continent: the struggle for Africa’s oil prize. London.
Profile Books.
CRF (Council on Foreign Relations). 2012. Expanding China-Africa oil ties.
http://www.cfr.org Date of access: 12 Oct. 2013.
Dabla-Norris, E., Honda, J., Lahreche, A. & Verdier, G. 2010. FDI flows to low-
income countries: global drivers and growth implications. Washington. International
Monetary Fund. (Working paper, 10/132).
Demirhan, E. & Masca, M. 2008. Determinants of foreign direct investment flows to
developing countries: a cross-sectional analysis. Prague. Afyon Kocatepe
University, Turkey. (Prague economic paper, 4).
Ding, N. & Field, B.C. 2005. Natural resource abundance and economic growth.
Land economics, 81(4): 496–500.
Economist Intelligence Unit Limited. 2012. Into Africa: institutional investor
intentions to 2016. .http://www.investad.com Date of access: 10 Aug. 2012.
ECOSOC (Economic and Social Council). 2000. Financial resources and
mechanisms. United Nations Economic and Social Council. Chapter 23 Agenda 21.
Report of the Secretary General. Commission for Sustainable Development. Eighth
session.
90
EIA (U.S. Energy Information Administration). 2013. Angola full report.
http://www.eia.org Date of access: 22 Feb. 2013.
EIA (U.S. Energy Information Administration). 2013. Nigeria full report.
http://www.eia.org. Date of access: 22 Feb. 2013.
Embassy of Angola. 2013. Angolan economy overview. http://www.angola.org
Date of access: 18 Feb. 2012.
ERNST and YOUNG. 2011. Africa oil and gas: a continent on the move.
http://www.ey.com Date of access: 10 Jan. 2012.
Estrin, S. & Meyer, K.E. 2011. Brownfield acquisitions: a reconceptualization and
extension. http://klausmeyer.co.uk/publications Date of access: 15 Feb. 2012.
E-tech International. 2011. Overview of the oil and gas exploration and production
process. http://www.etechinternational.org Date of access 11 Jul. 2012.
FAO (Food and Agriculture Organisation). 2011. Foreign agricultural investment
country profile: Angola. United Nations Food and Agriculture Organisation.
Fauli-Oller, R., Sandoris, J. & Santamaria, J. 2011. Downstream mergers and
upstream investment. The Manchester School, 79(4): 884-898.
Fliess, B. & Busquets. C. 2006. The role of trade barriers in SME
internationalisation. Paris. (OECD Trade Policy Working Paper, 45).
Froot, K A. & Stein, J.C. 1991. Exchange rates and foreign direct investment: an
imperfect capital markets approach. Quarterly Journal of Economics, 106(4): 1191-
1217.
91
Frynas, J.G. & Paulo, M. 2007. A new scramble for African oil?: historical, political,
and business perspectives. African affairs, 106(423): 229 - 251.
Gawad, G.M.A. & Muramalla, V.S.S.R. 2013. Foreign direct investment (FDI) and
its effects on oil, gas and refinery production and their exports: an applied
dissertation. Journal of Economics and Sustainable Development, 4(1).
http://www.iiste.org Date of access: 20 Apr. 2013.
Goldstein, I. & Razin, A. 2006. An information-based trade-off between foreign
direct investment and foreign portfolio investment. Journal of international
economics 70: 271 - 295. http://www.sciencedirect.com Date of access: 5 Feb.
2012.
Harding, C. 2012. 2011: A broadly successful year for investors in Africa : how we
made it in Africa. http://www.howwemadeitinafrica.com Date of access: 10 Jan.
2012.
Heritage. 2012. 2012 Index of economic freedom: Angola. http://www.heritage.org
Date of access: 6 Jan. 2013.
Hicks, B. & Kilian, L. 2009. Did unexpectedly strong economic growth cause the oil
price shock of 2003 - 2008. Ann Arbor. (CEPR Discussion Paper, 7265).
Hotelling, H. 1931. The economics of exhaustible resources. Journal of political
economics, 39: 37 – 75.
IMF (International Monetary Fund). 1993. Balance of payment manual. 5th
ed.
http://www.imf.org Date of access: 20 Oct. 2012.
IMF (International Monetary Fund). 2011. Regional economic outlook: Sub-Saharan
Africa. http://www.imf.org Date of access: 13 May 2012.
92
Jafarnejad, A., Golman, A. & Ebrahim, N.A. 2009. Determinants of foreign direct
Investment in IRAN: an empirical dissertation using structural equation modelling.
Middle East forum, 1(9):71 - 83.
Jaffe, A.M. & Soligo, R. 2007. The international oil companies. Houston. Japan
petroleum energy centre and the James A. Baker III institute for public policy.
Jent, C. 2007. What is an independent oil and gas company?
http://ezinearticles.com Date of access: 27 May 2012.
Johnston, D. 1994. International petroleum fiscal systems and production sharing
contracts. Tulsa. PennWell Books.
Keeler, D. 2013. Angola country report. http://www.gfmag.com Date of Access:15
Oct. 2013.
Kehl, J.R. 2009. Foreign investment and domestic development: multi-nationals
and the state. Boulder. Lynne Riener Publishers.
Keller, W. 2009. International trade, foreign direct investment and technological
spillovers. Cambridge. National Bureau of Economic Research.
Kenisarin, M.M. & Andrews-Speed, P. 2008. Foreign direct investment in countries
of the former Soviet Union: relationship to governance, economic freedom and
corruption perception. Communist and post-communist studies, 41: 301 – 316.
Khondoker, A.M. 2007. Determinants of foreign direct investment and its impact on
economic growth in developing countries. http://www.mpra.ub.uni-muenchen.de
Date of access: 5 May 2012.
Kingdom Zephyr. 2011. Africa’s local content policies are opening up key sectors
for private equity investors. Kingdom Zephyr: African management.
http://www.kingdomzephyr.com Date of access 11 Mar. 2012.
93
Kirk, H. & Clemens, M. 1999. Genuine Savings Rates in Developing Countries.
World Bank economic review, 13(2): 333 – 356.
Kudina, A. & Jakubiak, M. 2008. Global forum on international investment: the
motives and impediments to FDI in the CIS.Organisation for Economic Co-operation
and Development. http://www.oecd.org Date of access: 27 Feb. 2012.
Lim, E.G. 2001. Determinants of, and the relation between, foreign direct
investment and growth: a summary of the recent literature. Washington. (IMF
working paper, 01/175).
Louw, L. 1991. Truth and fiction in the nationalization vs privatization debate.
Investment analyst journal, 1990/91: 71 – 75.
Lucas, R.E. 1993. On the determinants of foreign direct investment: evidence from
east and southeast Asia. World development, 21: 391 – 406.
Lumbila, K.N. 2005. Risk, FDI and economic growth; a dynamic panel data analysis
of the determents of FDI and its growth impact. Washington, D.C.: World Bank.
Makino,S., Lau, C.M. & Yeh, R.S. 2002. Asset-exploitation versus asset-seeking:
implications for location choice offForeign direct investment from newly industrialized
economies. Journal of International Business Studies, 33(3): 403 – 421.
McArthur, J.W., Schmidt-Traub, G., Kruk, M., Bahadur, C., Faye, M. & McCord G.
2004. Ending Africa’s poverty trap. Brookings papers on economic activity, 1: 117 -
240. http://ejournals.ebsco.com.nwulib.nwu.ac.za Date of access: 10 Feb. 2012.
McDonald, D., Chester, C., Gunasekera, D., Buetre, B., Penm, J. & Fairhead, L.
2005. Impact of oil prices on trade in the APEC region. Canberra. APEC Energy
Working Group. (Report no. APEC 09/2005). (ABARE Research Report 05.3).
94
Meyer, E.K. 2004. Perspectives on multi-national enterprises in eEmerging
economies. Journal of international business studies, 35(4): 259 – 277.
Moosa, I.A. & Cardak, B.A. 2006. The determinants of FDI: an extreme bound
analysis. Journal of multi-national financial management, 16: 199 – 211.
Moran, T. 1998. Foreign direct investment and development: the new policy agenda
for developing countries and economies in transition. , Washington, D.C.: Institute
for International Economics.
Moses, C. 2011. Oil and nonoil FDI and economic growth in Nigeria. Journal of
emerging trends in economics and management sciences, 2(4): 333 – 343.
Moussa, M.S.A. 2005. An eclectic approach to the determinants of foreign direct
investment inflows to the Libyan oil and gas sector. Newcastle. Nothumbria
University.
Münchau, W. 2010. The meltdown years: unfolding of the global economic crisis.
New York. Mc Graw Hill.
Musonera, E. 2008. Country risk factors: an empirical dissertation of FDI
determinants in SSA. Journal of international management studies, 3(1): 1-9.
Naude, W.A. & Krugell, W.F. 2003. Developing human resources to attract foreign
direct investment in Africa. Management dynamics, 12(3): 2 – 12.
NCEMA (National Centre for Economic Management and Administration). 2003.
Structural adjustment programme in Nigeria: causes, processes and outcomes.
Abuja. National Centre for Economic Management and Administration.
Ndikumana, L. & Verick, S. 2008. The linkages between FDI and domestic
investment: unravelling the developmental impact of foreign investment in Sub-
95
Saharan Africa. Amherst. University of Massachusetts (IZA Discussion Papers,
3296).
Neuhaus, M., 2006. The impact of FDI on economic growth: an analysis for the
transition countries of central and eastern Europe. Heidelberg: Physica-Verlag.
NKC (Noelani King Conradie: independant economists). 2011. Nigeria country
profile.. South Africa. http://www.nkc.co.za Date of access: 2 Feb. 2012.
NKC (Noelani King Conradie: independant economists). 2013. Angola quarterly
update: February 2013. South Africa. http://www.nkc.co.za Date of access: 20 Mar.
2013.
NKC (Noelani King Conradie: independant economists). 2011. Country profile:
Nigeria. South Africa. http://www.nkc.co.za Date of access:10 Mar. 2012.
NNPC (Nigerian National Petroleum Corporation). 2012. About NNPC.
http://www.nnpcgroup.com Date of access: 28 Apr. 2012.
NNPC (Nigerian National Petroleum Corporation). 2012. NNPC Business.
http://www.nnpcgroup.com Date of access: 28 Apr. 2012.
Nocke, V. & Yeaple, S. 2006. Globalization and endogenous firm scope.
http://www.acedemia.edu. Date of access: 12 Sep. 2012. (NBER Working Paper
W1232).
Nour, S.S.O.M. 2011. Assessment of the impact of oil: opportunities and challenges
for economic development in Sudan. African review of economics and finance, 2(2):
122-148.
Nunes, C., L., Oscategui, J. &Peschiera, J. 2006. Determinants of FDI in Latin
America. http://www.pucp.edu.pe/economia Date of access: 11 Nov. 2012.

96
Obasi, N.K. 2003. Foreign participation in the Nigerian oil and gas industry.
http://www.onlinenigeria.com Date of Access: 1 Mar. 2012.
OECD (Organisation for Economic Co-operation and Development). 1996. OECD
benchmark definition for foreign direct investment 3rd ed. http://www.oecd.org Date
of access: 20 Feb. 2012.
OECD (Organisation for Economic Co-operation and Development). 2002. Foreign
direct investment: maximising benefits, minimizing cost.organisation for economic
co-operation and development. http://www.apec.org.au Date of access: 25 Feb.
2012.
OECD (Organisation for Economic Co-operation and Development). 2007. Chapter
2: trends and recent development in foreign direct investment. International
Investment Perspectives: Freedom of Investment in a Changing World.
http://www.oecd.org Date of access: 26 Sep. 2012.
OGIC (Oil and gas sector reform implementation committee). 2009. 2009 Report:
industry reforms. Nigeria.
OGIC (Oil and gas sector reform implementation committee). 2009. The Petroleum
Industry Draft Bill. Nigeria.
Omorogbe, Y. 1997. The oil and gas industry: exploration and production contracts.
Lagos: Malthouse Press.
Onyeiwu S. & Shrestha H. 2004. Determinants of foreign direct investment in
Africa. Journal of developing societies, 20: 89-106.
OPEC (Organization of the Petroleum Exporting Countries). 2010 . Annual report
2010. Public Relations and Information Department. http://www.opec.org Date of
access: 23 Apr. 2012.
97
OPEC (Organization of the Petroleum Exporting Countries). 2011. A brief history.
http://www.opec.org Date of access: 10 Mar. 2012.
OPEC (Organization of the Petroleum Exporting Countries). 2011. Annual statistics
bulletin. Available from: www.opec.org. Date of access: 28 February 2012.
Paull, E . 2008. The environmental and economic impacts of Brownfields
redevelopment. http://www.nemw.org Date of access: 6 Mar. 2012.
Perkins, D.H., Radelet, S. & Lindauer D.L. 2006. Economics of development. 6th ed.
New York. Norton.
Petro Strategies. 2011. Industry players. http://www.petrostrategies.org Date of
access:19 Mar. 2012.
Pirog, R. 2007. The role of national oil companies in the international oil market.
Washington: Congress Research Service.
Platt, G. 2011. M and A: US shale gas boom attracts FDI. global finance.
http://www.gfmag.com Date of access: 29 Jan. 2013
Poelhekke, S. & Van der Ploeg. F. 2010. Do natural resources attract FDI?:
evidence from non-stationary sector level data. Amsterdam. De Nederlandsche
Bank. (Working paper, 266).
PriceWaterhouseCoopers. 2010. Energy and utilities - the oil and gas survey 2010.
http://www.pwc.com Date of access: 3 Feb. 2012.
Qiu, L.D. & Wang, S. 2011. FDI policy, Greenfield Investment and cross-border
mergers. Review of International Economics, 19(5): 836–851.
http://onlinelibrary.wiley.com Date of Access: 6 Mar. 2011.
98
Raghavan, C. 2000. FDI useful only when used to regulate. South-North
development monitor, 6: 27 – 29.
Raszmi, M.J. & Behname, M. 2012. FDI determinants and oil effects in foreign
direct investment: evidence from Islamic countries. Advances in management and
applied economics, 2(4): 261-270.
Resmini, L. 2000. The determinants of foreign direct investment in the CEECs.
Economics of transition, 8(3): 665 – 689.
Revenue Watch Institute. 2013. The 2013 resource governance index: a measure
of transparency and accountability in the oil gas and mining sector.
http://www.revenuewatch.org/rgi Date of access: 25 Aug. 2012.
Reuters. 2013. China oil imports to overtake U.S. by 2017. http://www.reuters.com
Date of access: 12 Oct. 2013.
Romero, S. 2012. In Brazil and elsewhere, dismay at Argentina’s nationalization
move. http://www.nytimes.com Date of access: 14 Feb. 2013.
Rutherford, Thomas F. 1995. Extension of GAMS for complementarity problems
arising in applied economic analysis. Journal of economic dynamics and control,
19(8): 1299 – 1324.
Sanangol. 2012. About Sanangol. http://www.sonangol.co.ao Date of access: 15
Apr. 2012.
Sanangol. 2012. Angola. http://www.sonangol.co.ao Date of access: 16 Apr. 2012.
Sanangol. 2012. Areas of activity. http://www.sonangol.co.ao Date of access: 15
Apr. 2012.
99
Schindler, J. & Zittel, W. 2008. Crude oil: the supply outlook.
http://www.energywatch.com.au Date of access: 14 Feb. 2013.
Seim, L.T. 2009. FDI and openness: differences in response across countries.
Berlin. Ludwig-Boelkow-Foundation.
Simtowe, F. & Kinkingninhoun-Medagbe, F. M. 2011. The impact of HIV/AIDS on
labor markets, productivity and welfare in Southern Africa: a critical review and
analysis. African journal of agricultural research, 6(10): 2118 – 2131.
Singh, H. & Jun, K.W. 1995. Some new evidence on determinants of foreign direct
investment in developing countries. International Finance Division, International
Economics Department and The World Bank.
Sjoholm, F. 1999. Technology gap, competition and spillovers from direct foreign
investment: evidence from establishment data. Journal of development studies,
36(1): 53 – 73.
Smith, E.E., Dzienkowski, J.S., Anderson, O.L., Conine, G.B., Lowe, J.S. & Kramer,
B.M. 2000. International petroleum t ransactions. 2nd ed. Colorado: Rocky
Mountain Mineral Law Foundation.
Southall, R. & Melber, H. 2009. The new scramble for Africa: imperialism,
investment and development. Durban. University of Kwazulu Natal Press.
SPC & WPC (Society of petroleum engineers and The world petroleum congress).
2004. The SPE/WPC reserves definition..http://www.petrobjects.com Date of
access:19 Ma. 2012.
Surge, C., Muhammad, A., Tamwesigire, C. & Mugisha, F. 2008. Determinants of
FDI inflows into Rwanda: 1971 – 2003. International journal of financial services
management, 3(2): 200 – 212.
100
Te Velde, D.W. 2001. Government policies towards inward foreign direct
investment in developing countries: implications for human capital formation and
income inequality. Paris: OECD.
The Economist 2012. Foreign direct investment 2012. http://www.economist.com
Date of access: 4 Nov. 2012.
The Economist. 2011. Africa’s impressive growth. The Economist,6 January 2011.
http://www.economist.com Date of access: 10 Aug. 2012.
Udosen, C., Etok, A.S. & George, I.N. 2009. Fifty years of oil exploration in Nigeria:
the paradox of plenty. Global journal of social sciences, 8(2): 37 – 47.
UNECA (United Nations Economic Commission for Africa). 2012. Economic report
on Africa: unleashing Africa’s potential as a pole of global growth. Addis Ababa.
UNCTAD (United Nations Conference on Trade and Development). 1999. Foreign
direct investment in Africa: performance and potential. New York: United Nations.
UNCTAD (United Nations Conference on Trade and Development). 2005.
Economic development in Africa – rethinking the role of foreign direct investment.
New York: United Nations.
UNCTAD (United Nations Conference on Trade and Development). 2005. World
investment report :trends and determinants. New York: United Nations.
UNCTAD (United Nations Conference on Trade and Development). 2007. World
investment report: transitional corporations, extractive industries and development.
New York: United Nations.
UNCTAD (United Nations Conference on Trade and Development). 2008. World
investment report: transitional corporations and the infrastructural challenges. New
York: United Nations.
101
UNCTAD (United Nations Conference on Trade and Development). 2010. World
investment report: investing in a low carbon economy. New York: United Nations.
UNCTAD (United Nations Conference on Trade and Development). 2011. World
investment report: non-equity modes of international production and development.
New York: United Nations.
UNCTAD (United Nations Conference on Trade and Development). 2011. World
investment report: trends and determinants. New York: United Nations.
UNCTAD (United Nations Conference on Trade and Development). 2012. Global
flows of foreign direct investment exceeding pre-crisis levels in 2011, despite turmoil
in the global economy. Global investment trends monitor, 8:1-8.
UNCTAD (United Nations Conference on Trade and Development). 2012. UNCTAD
stats. http://unctadstat.unctad.org Date of access: 13 May 2012.
UNCTAD (United Nations Conference on Trade and Development). 2013. Global
FDI recovery derails. Global investment trends monitor,11: 1-8.
Urata, S. & Kawai, H. 2000. The determinants of the location of foreign direct
investment by Japanese small and medium sized enterprises. Small business
economics, 15: 79 – 103.
Victor, N.M. 2007. On measuring the performance of national oil companies
(NOCs). Stanford. Stanford University. Program on Energy and Sustainable
Development. (Working paper, 64).
Vines, A., Wong, L., Weimer, M. & Campos, I. 2009. Thirst for African oil: Asian
national oil companies in Nigeria and Angola. http://www.chathamhouse.org.uk
Date of access: 2 Feb. 2012.
102
WEF (World Bank and African Development Bank) . 2011. African development
report 2011. Washington.
Wladkich, A., Nunnenkamp, P. & Alatorre Bremont, J .2009. FDI in Mexico: an
empirical assessment of employment effects. Journal of development studies, 45(7):
1165 – 1183.
World Bank. 2011. Fostering technology absorption in Southern African enterprises.
http://elibrary.worldbank.org Date of access: 4 Jan. 2013.
World Bank. 2011. Nigeria. http//databank.worldbank.org Date of access: 8 Mar.
2012.
World Bank . 2013. World Data Bank. http://databank.worldbank.org Date of access:
12 October 2012
World Bank Group. 2012. Angola: economic overview. http://www.worldbank.org
Date of access: 20 Feb. 2013.
Yeatts, G. 2010. Subsoil oil and gas privatization: private wealth for the common
good: Message for Latin America. http://www.masterresource.org Date of Access 14
Feb. 2013.
Yousaf, M.M., Hussain, Z. & Ahmad, Z. 2008. Economic evaluation of foreign direct
investment in Pakistan. Pakistan economic and social review, 46(1): 35 – 56.
Zarsky, L. 2002. Stuck in the mud?: nation-states, globalization, and the
environment. International trade and sustainable development, 2002: 19 – 44.
Zhao, H. 2007. China’s oil venture into Africa. Springer Science. East Asia, 24: 399
– 415.
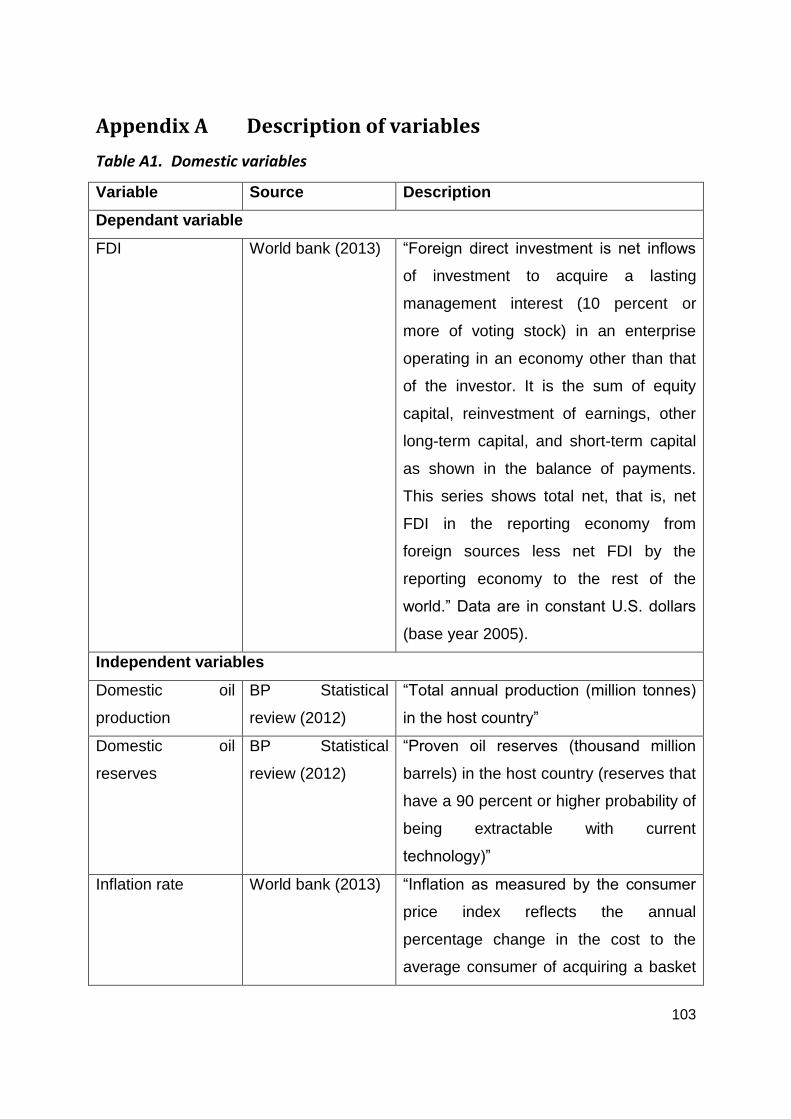
103
Appendix A Description of variables
Table A1. Domestic variables
Variable Source Description
Dependant variable
FDI World bank (2013) “Foreign direct investment is net inflows
of investment to acquire a lasting
management interest (10 percent or
more of voting stock) in an enterprise
operating in an economy other than that
of the investor. It is the sum of equity
capital, reinvestment of earnings, other
long-term capital, and short-term capital
as shown in the balance of payments.
This series shows total net, that is, net
FDI in the reporting economy from
foreign sources less net FDI by the
reporting economy to the rest of the
world.” Data are in constant U.S. dollars
(base year 2005).
Independent variables
Domestic oil
production
BP Statistical
review (2012)
“Total annual production (million tonnes)
in the host country”
Domestic oil
reserves
BP Statistical
review (2012)
“Proven oil reserves (thousand million
barrels) in the host country (reserves that
have a 90 percent or higher probability of
being extractable with current
technology)”
Inflation rate World bank (2013) “Inflation as measured by the consumer
price index reflects the annual
percentage change in the cost to the
average consumer of acquiring a basket
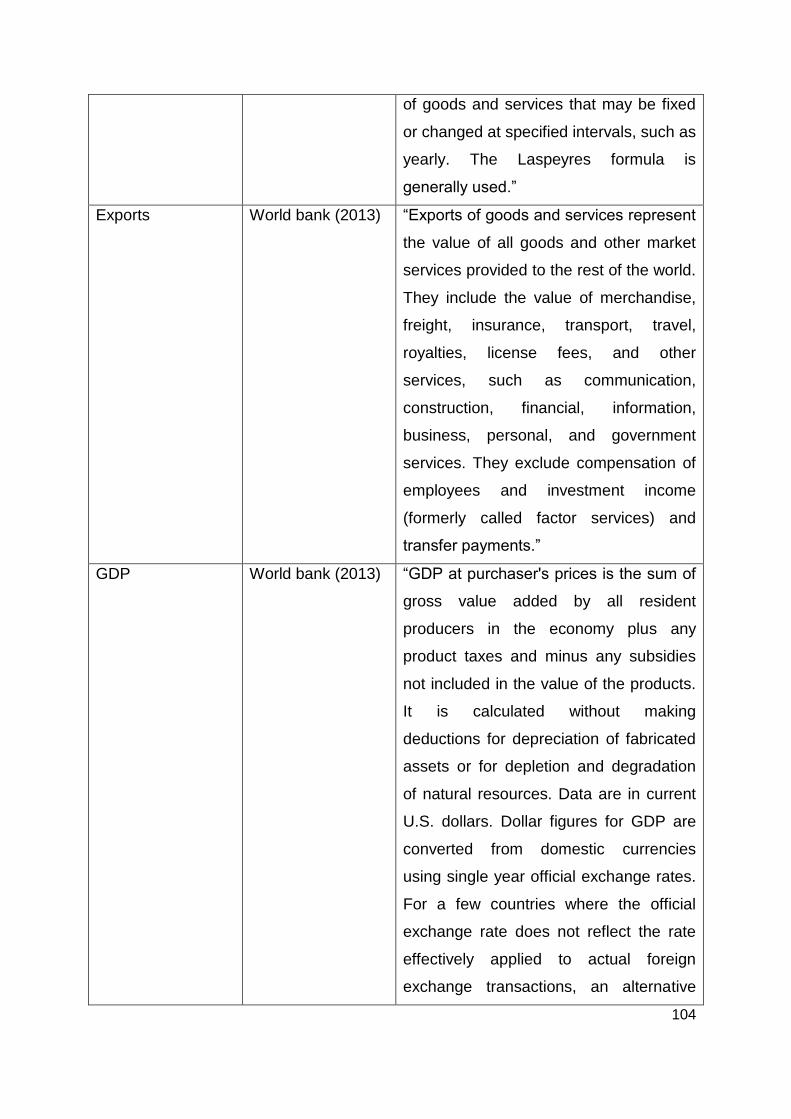
104
of goods and services that may be fixed
or changed at specified intervals, such as
yearly. The Laspeyres formula is
generally used.”
Exports World bank (2013) “Exports of goods and services represent
the value of all goods and other market
services provided to the rest of the world.
They include the value of merchandise,
freight, insurance, transport, travel,
royalties, license fees, and other
services, such as communication,
construction, financial, information,
business, personal, and government
services. They exclude compensation of
employees and investment income
(formerly called factor services) and
transfer payments.”
GDP World bank (2013) “GDP at purchaser's prices is the sum of
gross value added by all resident
producers in the economy plus any
product taxes and minus any subsidies
not included in the value of the products.
It is calculated without making
deductions for depreciation of fabricated
assets or for depletion and degradation
of natural resources. Data are in current
U.S. dollars. Dollar figures for GDP are
converted from domestic currencies
using single year official exchange rates.
For a few countries where the official
exchange rate does not reflect the rate
effectively applied to actual foreign
exchange transactions, an alternative
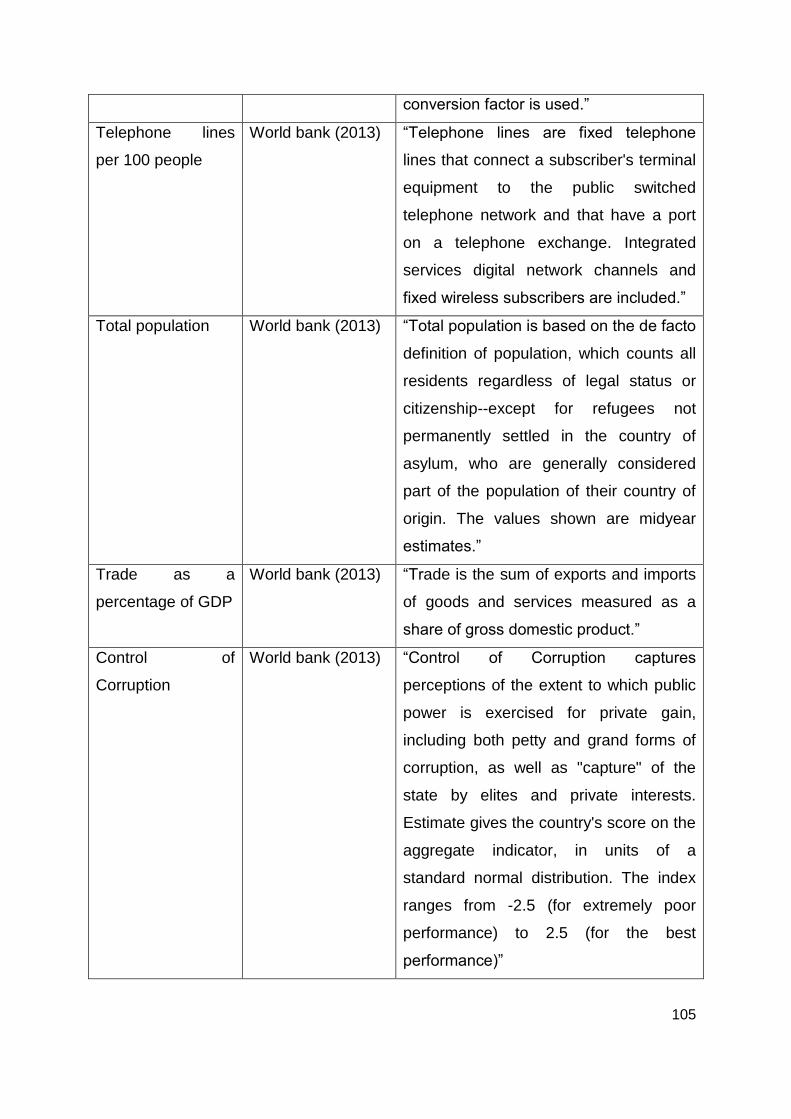
105
conversion factor is used.”
Telephone lines
per 100 people
World bank (2013) “Telephone lines are fixed telephone
lines that connect a subscriber's terminal
equipment to the public switched
telephone network and that have a port
on a telephone exchange. Integrated
services digital network channels and
fixed wireless subscribers are included.”
Total population World bank (2013) “Total population is based on the de facto
definition of population, which counts all
residents regardless of legal status or
citizenship--except for refugees not
permanently settled in the country of
asylum, who are generally considered
part of the population of their country of
origin. The values shown are midyear
estimates.”
Trade as a
percentage of GDP
World bank (2013) “Trade is the sum of exports and imports
of goods and services measured as a
share of gross domestic product.”
Control of
Corruption
World bank (2013) “Control of Corruption captures
perceptions of the extent to which public
power is exercised for private gain,
including both petty and grand forms of
corruption, as well as "capture" of the
state by elites and private interests.
Estimate gives the country's score on the
aggregate indicator, in units of a
standard normal distribution. The index
ranges from -2.5 (for extremely poor
performance) to 2.5 (for the best
performance)”
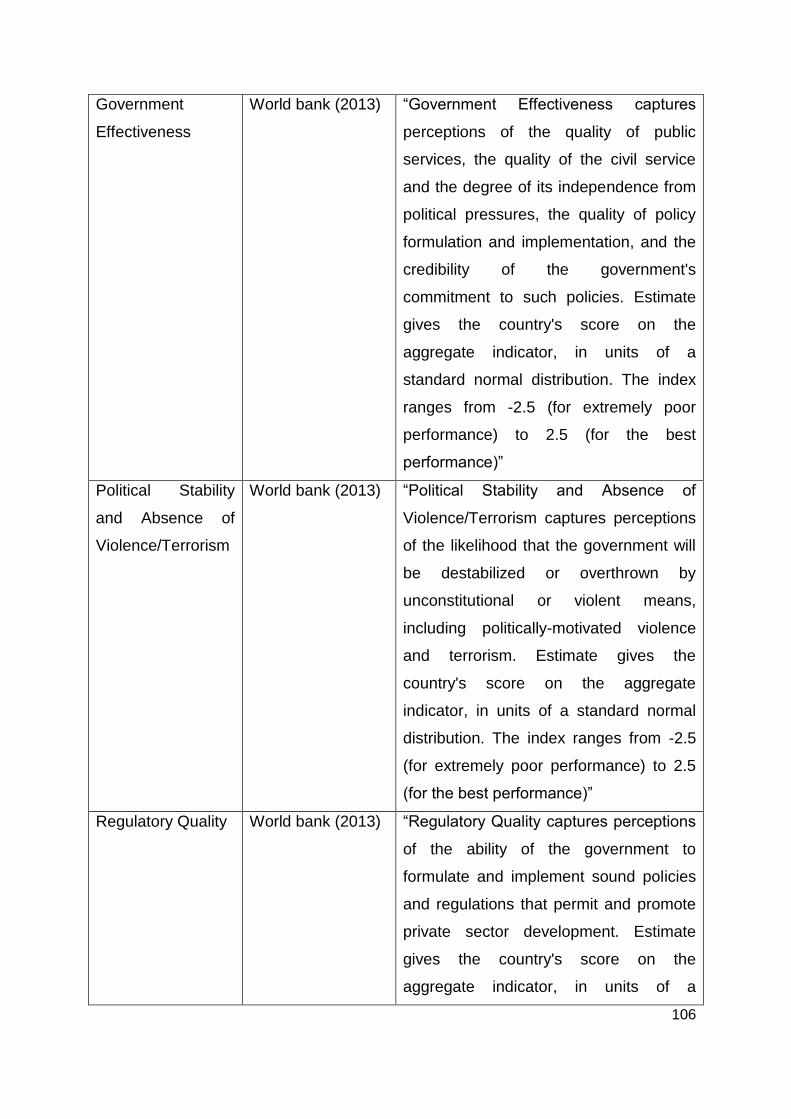
106
Government
Effectiveness
World bank (2013) “Government Effectiveness captures
perceptions of the quality of public
services, the quality of the civil service
and the degree of its independence from
political pressures, the quality of policy
formulation and implementation, and the
credibility of the government's
commitment to such policies. Estimate
gives the country's score on the
aggregate indicator, in units of a
standard normal distribution. The index
ranges from -2.5 (for extremely poor
performance) to 2.5 (for the best
performance)”
Political Stability
and Absence of
Violence/Terrorism
World bank (2013) “Political Stability and Absence of
Violence/Terrorism captures perceptions
of the likelihood that the government will
be destabilized or overthrown by
unconstitutional or violent means,
including politically-motivated violence
and terrorism. Estimate gives the
country's score on the aggregate
indicator, in units of a standard normal
distribution. The index ranges from -2.5
(for extremely poor performance) to 2.5
(for the best performance)”
Regulatory Quality World bank (2013) “Regulatory Quality captures perceptions
of the ability of the government to
formulate and implement sound policies
and regulations that permit and promote
private sector development. Estimate
gives the country's score on the
aggregate indicator, in units of a
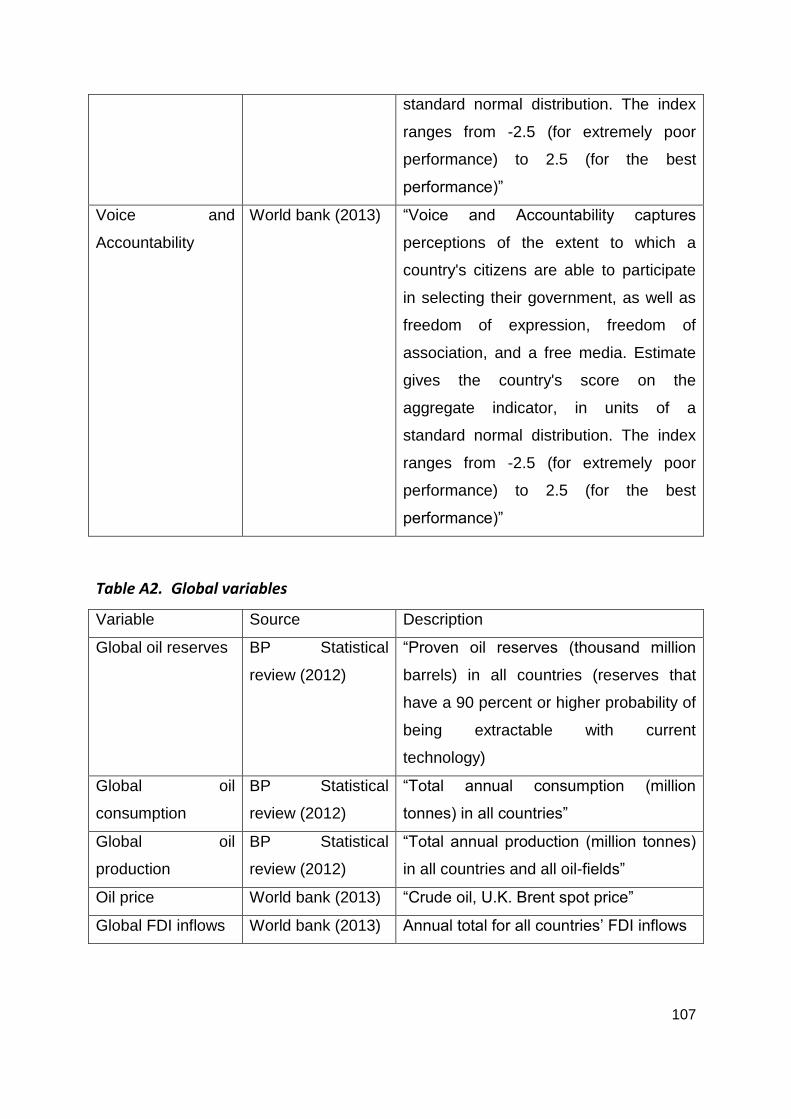
107
standard normal distribution. The index
ranges from -2.5 (for extremely poor
performance) to 2.5 (for the best
performance)”
Voice and
Accountability
World bank (2013) “Voice and Accountability captures
perceptions of the extent to which a
country's citizens are able to participate
in selecting their government, as well as
freedom of expression, freedom of
association, and a free media. Estimate
gives the country's score on the
aggregate indicator, in units of a
standard normal distribution. The index
ranges from -2.5 (for extremely poor
performance) to 2.5 (for the best
performance)”
Table A2. Global variables
Variable Source Description
Global oil reserves BP Statistical
review (2012)
“Proven oil reserves (thousand million
barrels) in all countries (reserves that
have a 90 percent or higher probability of
being extractable with current
technology)
Global oil
consumption
BP Statistical
review (2012)
“Total annual consumption (million
tonnes) in all countries”
Global oil
production
BP Statistical
review (2012)
“Total annual production (million tonnes)
in all countries and all oil-fields”
Oil price World bank (2013) “Crude oil, U.K. Brent spot price”
Global FDI inflows World bank (2013) Annual total for all countries’ FDI inflows
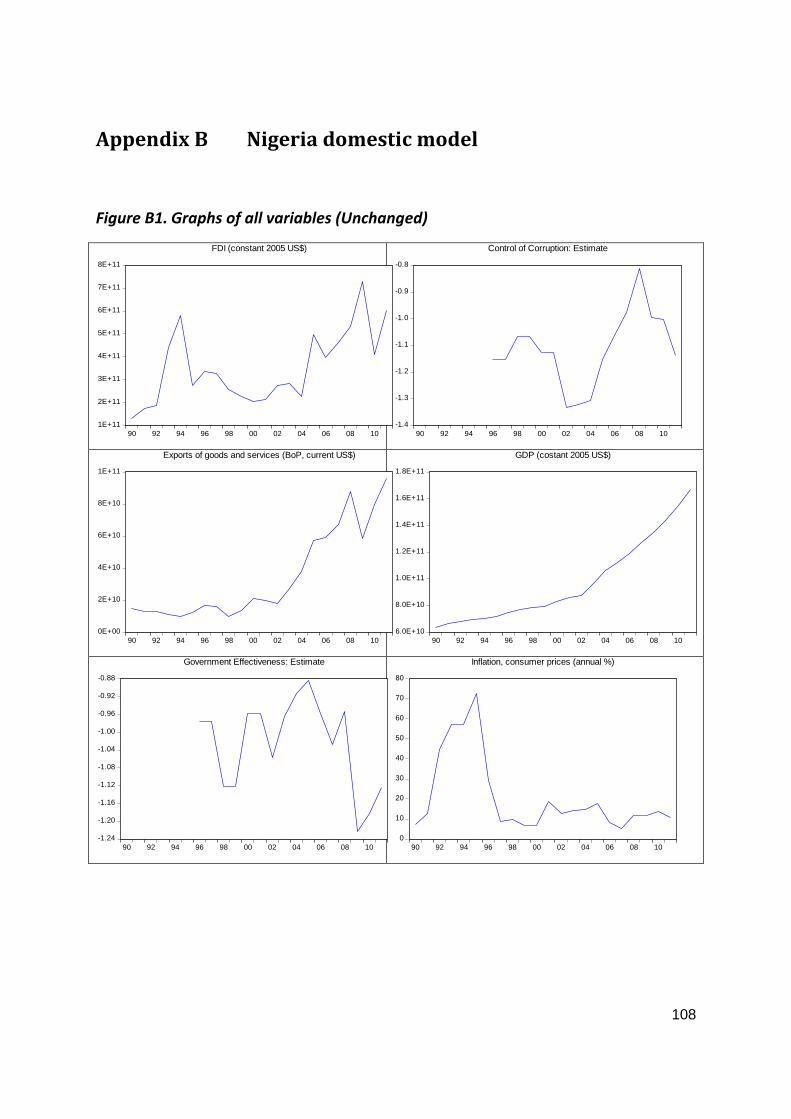
108
Appendix B Nigeria domestic model
Figure B1. Graphs of all variables (Unchanged)
1E+11
2E+11
3E+11
4E+11
5E+11
6E+11
7E+11
8E+11
90 92 94 96 98 00 02 04 06 08 10
FDI (constant 2005 US$)
-1.4
-1.3
-1.2
-1.1
-1.0
-0.9
-0.8
90 92 94 96 98 00 02 04 06 08 10
Control of Corruption: Estimate
0E+00
2E+10
4E+10
6E+10
8E+10
1E+11
90 92 94 96 98 00 02 04 06 08 10
Exports of goods and services (BoP, current US$)
6.0E+10
8.0E+10
1.0E+11
1.2E+11
1.4E+11
1.6E+11
1.8E+11
90 92 94 96 98 00 02 04 06 08 10
GDP (costant 2005 US$)
-1.24
-1.20
-1.16
-1.12
-1.08
-1.04
-1.00
-0.96
-0.92
-0.88
90 92 94 96 98 00 02 04 06 08 10
Government Effectiveness: Estimate
0
10
20
30
40
50
60
70
80
90 92 94 96 98 00 02 04 06 08 10
Inflation, consumer prices (annual %)
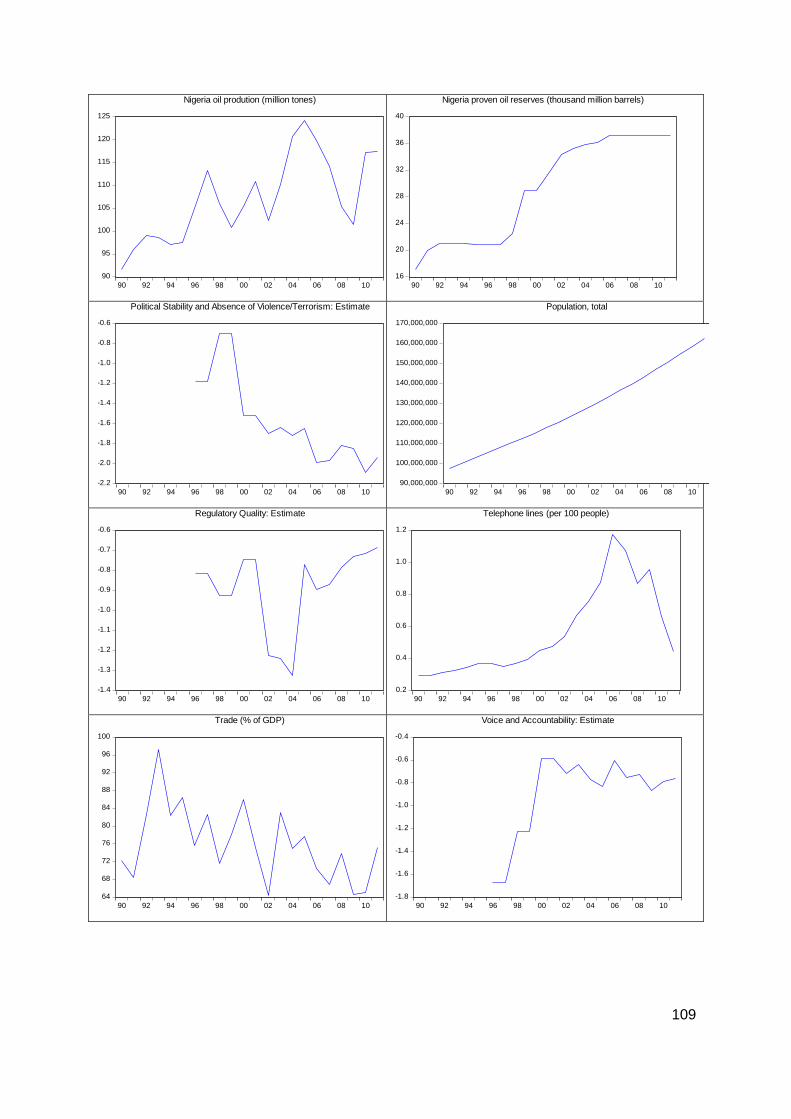
109
90
95
100
105
110
115
120
125
90 92 94 96 98 00 02 04 06 08 10
Nigeria oil prodution (million tones)
16
20
24
28
32
36
40
90 92 94 96 98 00 02 04 06 08 10
Nigeria proven oil reserves (thousand million barrels)
-2.2
-2.0
-1.8
-1.6
-1.4
-1.2
-1.0
-0.8
-0.6
90 92 94 96 98 00 02 04 06 08 10
Political Stability and Absence of Violence/Terrorism: Estimate
90,000,000
100,000,000
110,000,000
120,000,000
130,000,000
140,000,000
150,000,000
160,000,000
170,000,000
90 92 94 96 98 00 02 04 06 08 10
Population, total
-1.4
-1.3
-1.2
-1.1
-1.0
-0.9
-0.8
-0.7
-0.6
90 92 94 96 98 00 02 04 06 08 10
Regulatory Quality: Estimate
0.2
0.4
0.6
0.8
1.0
1.2
90 92 94 96 98 00 02 04 06 08 10
Telephone lines (per 100 people)
64
68
72
76
80
84
88
92
96
100
90 92 94 96 98 00 02 04 06 08 10
Trade (% of GDP)
-1.8
-1.6
-1.4
-1.2
-1.0
-0.8
-0.6
-0.4
90 92 94 96 98 00 02 04 06 08 10
Voice and Accountability: Estimate
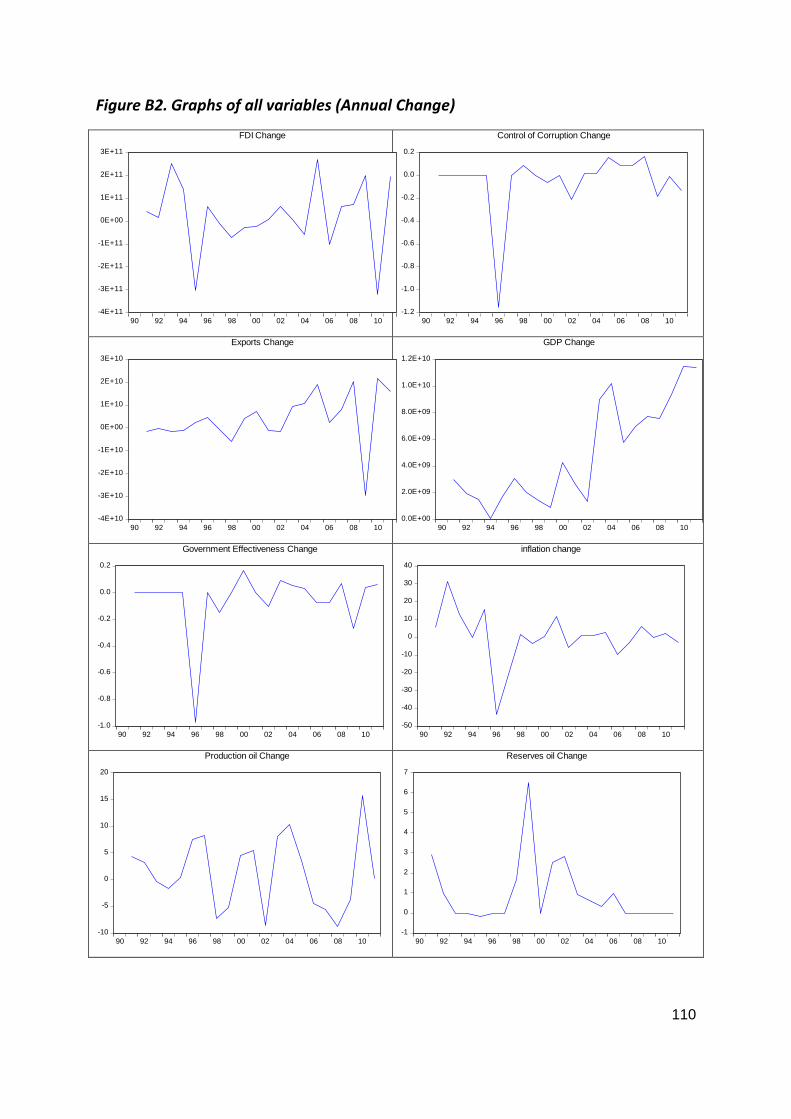
110
Figure B2. Graphs of all variables (Annual Change)
-4E+11
-3E+11
-2E+11
-1E+11
0E+00
1E+11
2E+11
3E+11
90 92 94 96 98 00 02 04 06 08 10
FDI Change
-1.2
-1.0
-0.8
-0.6
-0.4
-0.2
0.0
0.2
90 92 94 96 98 00 02 04 06 08 10
Control of Corruption Change
-4E+10
-3E+10
-2E+10
-1E+10
0E+00
1E+10
2E+10
3E+10
90 92 94 96 98 00 02 04 06 08 10
Exports Change
0.0E+00
2.0E+09
4.0E+09
6.0E+09
8.0E+09
1.0E+10
1.2E+10
90 92 94 96 98 00 02 04 06 08 10
GDP Change
-1.0
-0.8
-0.6
-0.4
-0.2
0.0
0.2
90 92 94 96 98 00 02 04 06 08 10
Government Effectiveness Change
-50
-40
-30
-20
-10
0
10
20
30
40
90 92 94 96 98 00 02 04 06 08 10
inflation change
-10
-5
0
5
10
15
20
90 92 94 96 98 00 02 04 06 08 10
Production oil Change
-1
0
1
2
3
4
5
6
7
90 92 94 96 98 00 02 04 06 08 10
Reserves oil Change
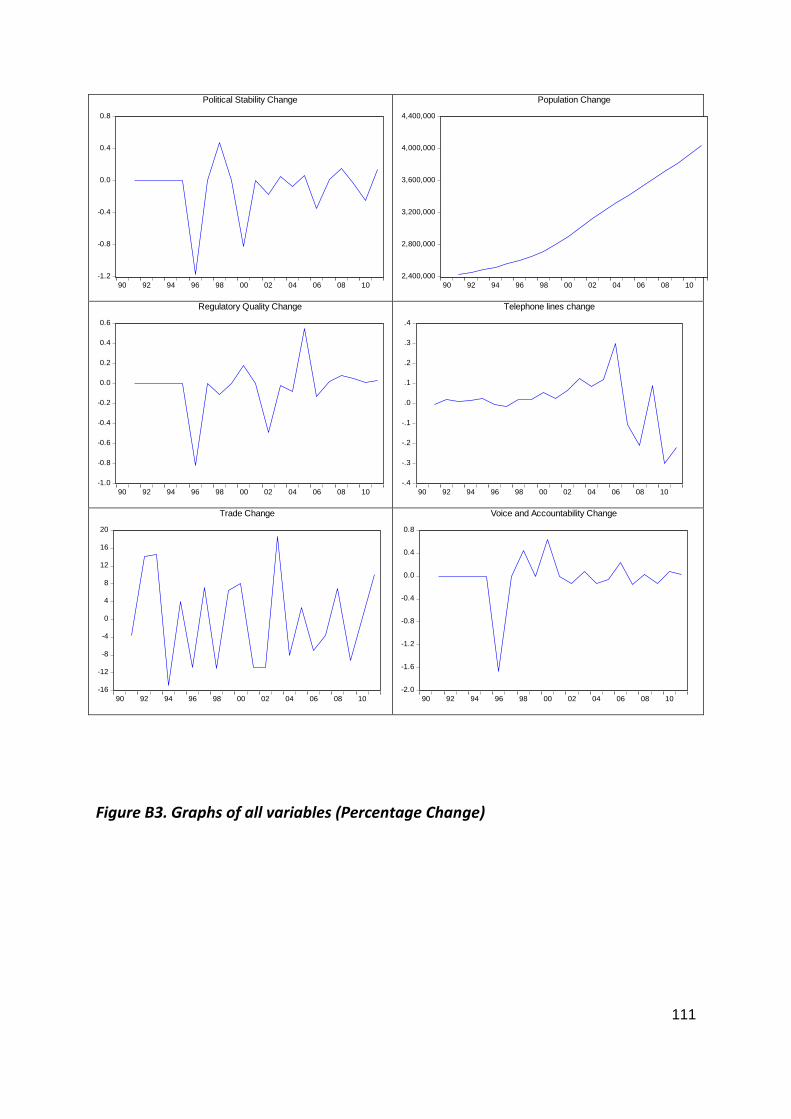
111
Figure B3. Graphs of all variables (Percentage Change)
-1.2
-0.8
-0.4
0.0
0.4
0.8
90 92 94 96 98 00 02 04 06 08 10
Political Stability Change
2,400,000
2,800,000
3,200,000
3,600,000
4,000,000
4,400,000
90 92 94 96 98 00 02 04 06 08 10
Population Change
-1.0
-0.8
-0.6
-0.4
-0.2
0.0
0.2
0.4
0.6
90 92 94 96 98 00 02 04 06 08 10
Regulatory Quality Change
-.4
-.3
-.2
-.1
.0
.1
.2
.3
.4
90 92 94 96 98 00 02 04 06 08 10
Telephone lines change
-16
-12
-8
-4
0
4
8
12
16
20
90 92 94 96 98 00 02 04 06 08 10
Trade Change
-2.0
-1.6
-1.2
-0.8
-0.4
0.0
0.4
0.8
90 92 94 96 98 00 02 04 06 08 10
Voice and Accountability Change
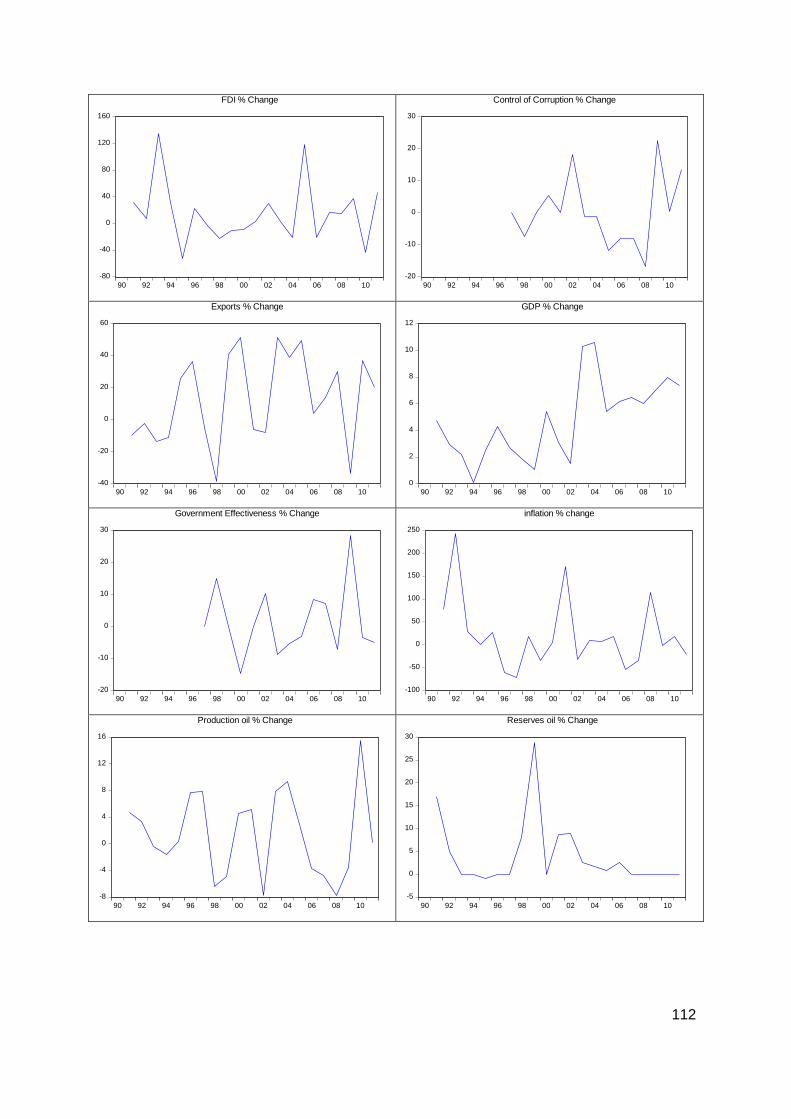
112
-80
-40
0
40
80
120
160
90 92 94 96 98 00 02 04 06 08 10
FDI % Change
-20
-10
0
10
20
30
90 92 94 96 98 00 02 04 06 08 10
Control of Corruption % Change
-40
-20
0
20
40
60
90 92 94 96 98 00 02 04 06 08 10
Exports % Change
0
2
4
6
8
10
12
90 92 94 96 98 00 02 04 06 08 10
GDP % Change
-20
-10
0
10
20
30
90 92 94 96 98 00 02 04 06 08 10
Government Effectiveness % Change
-100
-50
0
50
100
150
200
250
90 92 94 96 98 00 02 04 06 08 10
inflation % change
-8
-4
0
4
8
12
16
90 92 94 96 98 00 02 04 06 08 10
Production oil % Change
-5
0
5
10
15
20
25
30
90 92 94 96 98 00 02 04 06 08 10
Reserves oil % Change
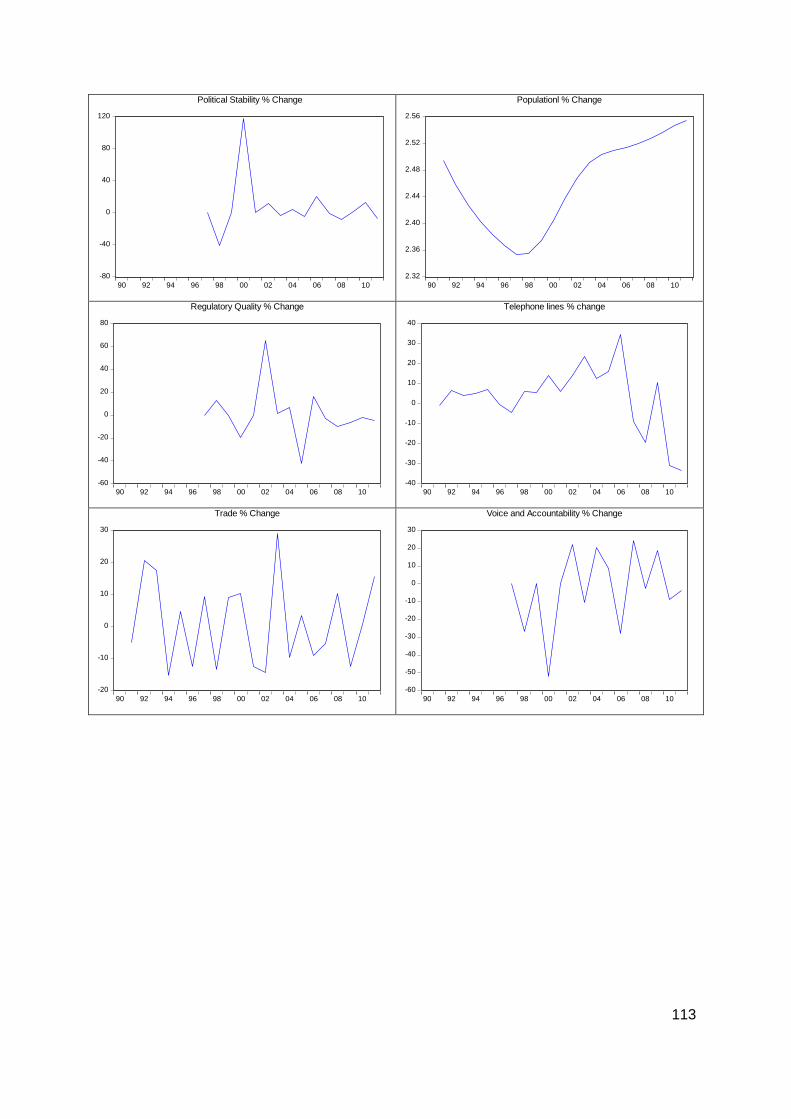
113
-80
-40
0
40
80
120
90 92 94 96 98 00 02 04 06 08 10
Political Stability % Change
2.32
2.36
2.40
2.44
2.48
2.52
2.56
90 92 94 96 98 00 02 04 06 08 10
Populationl % Change
-60
-40
-20
0
20
40
60
80
90 92 94 96 98 00 02 04 06 08 10
Regulatory Quality % Change
-40
-30
-20
-10
0
10
20
30
40
90 92 94 96 98 00 02 04 06 08 10
Telephone lines % change
-20
-10
0
10
20
30
90 92 94 96 98 00 02 04 06 08 10
Trade % Change
-60
-50
-40
-30
-20
-10
0
10
20
30
90 92 94 96 98 00 02 04 06 08 10
Voice and Accountability % Change
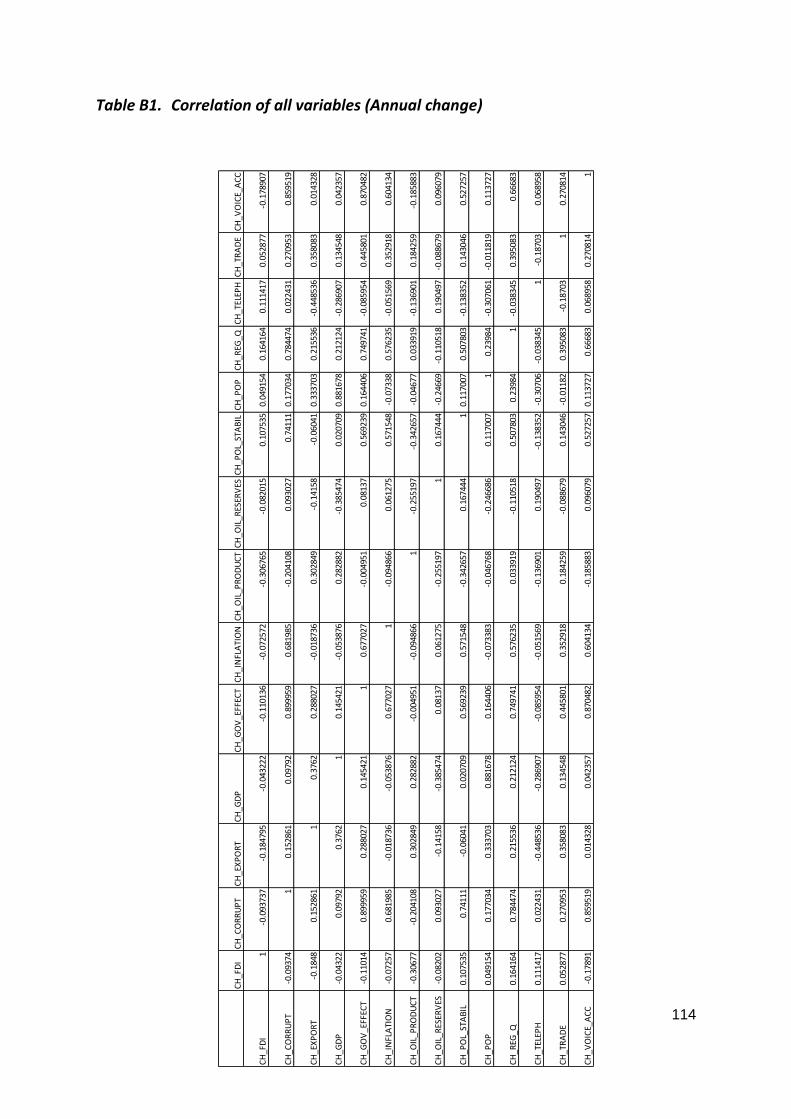
114
Table B1. Correlation of all variables (Annual change)
CH
_FD
IC
H_C
OR
RU
PT
CH
_EX
PO
RT
CH
_GD
PC
H_G
OV
_EFF
ECT
CH
_IN
FLA
TIO
NC
H_O
IL_P
RO
DU
CT
CH
_OIL
_RES
ERV
ESC
H_P
OL_
STA
BIL
CH
_PO
PC
H_R
EG_Q
CH
_TEL
EPH
CH
_TR
AD
EC
H_V
OIC
E_A
CC
CH
_FD
I1
-0.0
9373
7-0
.184
795
-0.0
4322
2-0
.110
136
-0.0
7257
2-0
.306
765
-0.0
8201
50.
1075
350.
0491
540.
1641
640.
1114
170.
0528
77-0
.178
907
CH
_CO
RR
UP
T-0
.093
741
0.15
2861
0.09
792
0.89
9959
0.68
1985
-0.2
0410
80.
0930
270.
7411
10.
1770
340.
7844
740.
0224
310.
2709
530.
8595
19
CH
_EX
PO
RT
-0.1
848
0.15
2861
10.
3762
0.28
8027
-0.0
1873
60.
3028
49-0
.141
58-0
.060
410.
3337
030.
2155
36-0
.448
536
0.35
8083
0.01
4328
CH
_GD
P-0
.043
220.
0979
20.
3762
10.
1454
21-0
.053
876
0.28
2882
-0.3
8547
40.
0207
090.
8816
780.
2121
24-0
.286
907
0.13
4548
0.04
2357
CH
_GO
V_E
FFEC
T-0
.110
140.
8999
590.
2880
270.
1454
211
0.67
7027
-0.0
0495
10.
0813
70.
5692
390.
1644
060.
7497
41-0
.085
954
0.44
5801
0.87
0482
CH
_IN
FLA
TIO
N-0
.072
570.
6819
85-0
.018
736
-0.0
5387
60.
6770
271
-0.0
9486
60.
0612
750.
5715
48-0
.073
380.
5762
35-0
.051
569
0.35
2918
0.60
4134
CH
_OIL
_PR
OD
UC
T-0
.306
77-0
.204
108
0.30
2849
0.28
2882
-0.0
0495
1-0
.094
866
1-0
.255
197
-0.3
4265
7-0
.046
770.
0339
19-0
.136
901
0.18
4259
-0.1
8588
3
CH
_OIL
_RES
ERV
ES-0
.082
020.
0930
27-0
.141
58-0
.385
474
0.08
137
0.06
1275
-0.2
5519
71
0.16
7444
-0.2
4669
-0.1
1051
80.
1904
97-0
.088
679
0.09
6079
CH
_PO
L_ST
AB
IL0.
1075
350.
7411
1-0
.060
410.
0207
090.
5692
390.
5715
48-0
.342
657
0.16
7444
10.
1170
070.
5078
03-0
.138
352
0.14
3046
0.52
7257
CH
_PO
P0.
0491
540.
1770
340.
3337
030.
8816
780.
1644
06-0
.073
383
-0.0
4676
8-0
.246
686
0.11
7007
10.
2398
4-0
.307
061
-0.0
1181
90.
1137
27
CH
_REG
_Q0.
1641
640.
7844
740.
2155
360.
2121
240.
7497
410.
5762
350.
0339
19-0
.110
518
0.50
7803
0.23
984
1-0
.038
345
0.39
5083
0.66
683
CH
_TEL
EPH
0.11
1417
0.02
2431
-0.4
4853
6-0
.286
907
-0.0
8595
4-0
.051
569
-0.1
3690
10.
1904
97-0
.138
352
-0.3
0706
-0.0
3834
51
-0.1
8703
0.06
8958
CH
_TR
AD
E0.
0528
770.
2709
530.
3580
830.
1345
480.
4458
010.
3529
180.
1842
59-0
.088
679
0.14
3046
-0.0
1182
0.39
5083
-0.1
8703
10.
2708
14
CH
_VO
ICE_
AC
C-0
.178
910.
8595
190.
0143
280.
0423
570.
8704
820.
6041
34-0
.185
883
0.09
6079
0.52
7257
0.11
3727
0.66
683
0.06
8958
0.27
0814
1
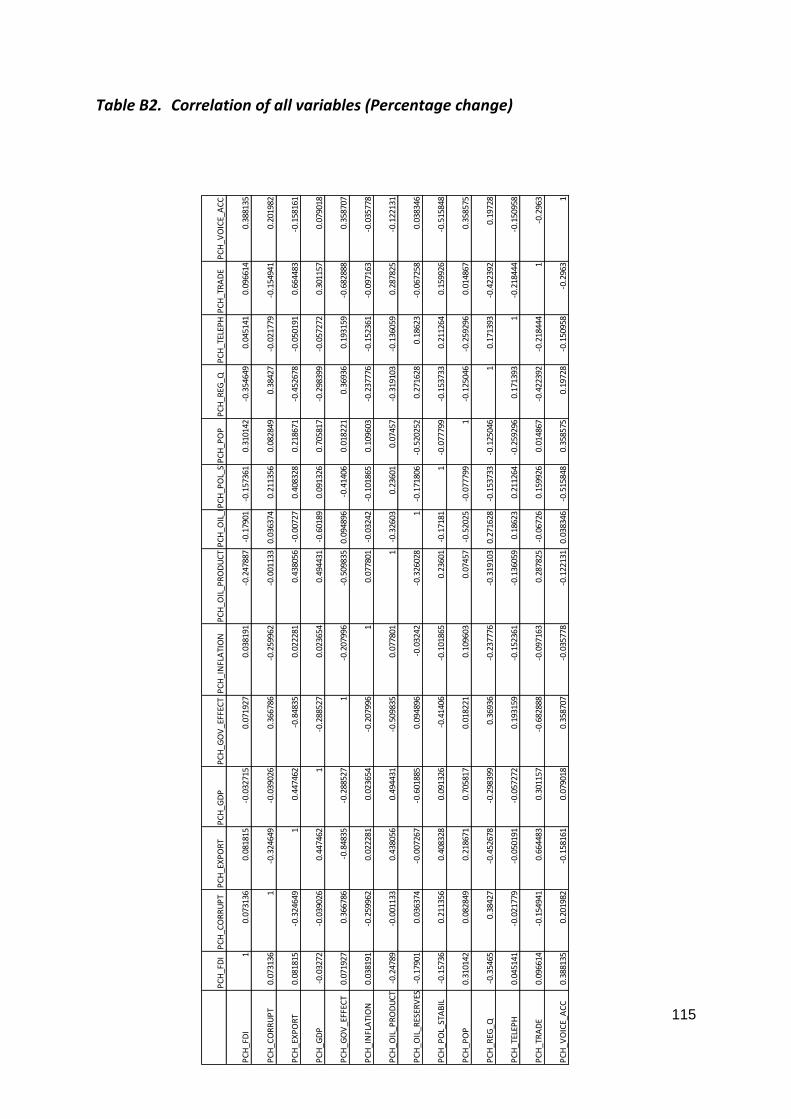
115
Table B2. Correlation of all variables (Percentage change)
PC
H_F
DI
PC
H_C
OR
RU
PT
PC
H_E
XP
OR
TP
CH
_GD
PP
CH
_GO
V_E
FFEC
TP
CH
_IN
FLA
TIO
NP
CH
_OIL
_PR
OD
UC
TP
CH
_OIL
_RES
ERV
ESP
CH
_PO
L_ST
AB
ILP
CH
_PO
PP
CH
_REG
_QP
CH
_TEL
EPH
PC
H_T
RA
DE
PC
H_V
OIC
E_A
CC
PC
H_F
DI
10.
0731
360.
0818
15-0
.032
715
0.07
1927
0.03
8191
-0.2
4788
7-0
.179
01-0
.157
361
0.31
0142
-0.3
5464
90.
0451
410.
0966
140.
3881
35
PC
H_C
OR
RU
PT
0.07
3136
1-0
.324
649
-0.0
3902
60.
3667
86-0
.259
962
-0.0
0113
30.
0363
740.
2113
560.
0828
490.
3842
7-0
.021
779
-0.1
5494
10.
2019
82
PC
H_E
XP
OR
T0.
0818
15-0
.324
649
10.
4474
62-0
.848
350.
0222
810.
4380
56-0
.007
270.
4083
280.
2186
71-0
.452
678
-0.0
5019
10.
6644
83-0
.158
161
PC
H_G
DP
-0.0
3272
-0.0
3902
60.
4474
621
-0.2
8852
70.
0236
540.
4944
31-0
.601
890.
0913
260.
7058
17-0
.298
399
-0.0
5727
20.
3011
570.
0790
18
PC
H_G
OV
_EFF
ECT
0.07
1927
0.36
6786
-0.8
4835
-0.2
8852
71
-0.2
0799
6-0
.509
835
0.09
4896
-0.4
1406
0.01
8221
0.36
936
0.19
3159
-0.6
8288
80.
3587
07
PC
H_I
NFL
ATI
ON
0.03
8191
-0.2
5996
20.
0222
810.
0236
54-0
.207
996
10.
0778
01-0
.032
42-0
.101
865
0.10
9603
-0.2
3777
6-0
.152
361
-0.0
9716
3-0
.035
778
PC
H_O
IL_P
RO
DU
CT
-0.2
4789
-0.0
0113
30.
4380
560.
4944
31-0
.509
835
0.07
7801
1-0
.326
030.
2360
10.
0745
7-0
.319
103
-0.1
3605
90.
2878
25-0
.122
131
PC
H_O
IL_R
ESER
VES
-0.1
7901
0.03
6374
-0.0
0726
7-0
.601
885
0.09
4896
-0.0
3242
-0.3
2602
81
-0.1
7180
6-0
.520
252
0.27
1628
0.18
623
-0.0
6725
80.
0383
46
PC
H_P
OL_
STA
BIL
-0.1
5736
0.21
1356
0.40
8328
0.09
1326
-0.4
1406
-0.1
0186
50.
2360
1-0
.171
811
-0.0
7779
9-0
.153
733
0.21
1264
0.15
9926
-0.5
1584
8
PC
H_P
OP
0.31
0142
0.08
2849
0.21
8671
0.70
5817
0.01
8221
0.10
9603
0.07
457
-0.5
2025
-0.0
7779
91
-0.1
2504
6-0
.259
296
0.01
4867
0.35
8575
PC
H_R
EG_Q
-0.3
5465
0.38
427
-0.4
5267
8-0
.298
399
0.36
936
-0.2
3777
6-0
.319
103
0.27
1628
-0.1
5373
3-0
.125
046
10.
1713
93-0
.422
392
0.19
728
PC
H_T
ELEP
H0.
0451
41-0
.021
779
-0.0
5019
1-0
.057
272
0.19
3159
-0.1
5236
1-0
.136
059
0.18
623
0.21
1264
-0.2
5929
60.
1713
931
-0.2
1844
4-0
.150
958
PC
H_T
RA
DE
0.09
6614
-0.1
5494
10.
6644
830.
3011
57-0
.682
888
-0.0
9716
30.
2878
25-0
.067
260.
1599
260.
0148
67-0
.422
392
-0.2
1844
41
-0.2
963
PC
H_V
OIC
E_A
CC
0.38
8135
0.20
1982
-0.1
5816
10.
0790
180.
3587
07-0
.035
778
-0.1
2213
10.
0383
46-0
.515
848
0.35
8575
0.19
728
-0.1
5095
8-0
.296
31

116
Table B3. Unit root tests for all variables (Annual change)
Table B3.1. Level Unit root tests
Null Hypothesis: CH_FDI has a unit root
Exogenous: Constant
Lag Length: 0 (Automatic - based on SIC, maxlag=4)
t-Statistic Prob.*
Augmented Dickey-Fuller test statistic -6.40731 0
Test critical values: 1% level -3.80855
5% level -3.02069
10% level -2.65041
Null Hypothesis: CH_CORRUPT has a unit root
Exogenous: Constant
Lag Length: 0 (Automatic - based on SIC, maxlag=4)
t-Statistic Prob.*
Augmented Dickey-Fuller test statistic -4.38613 0.0029
Test critical values: 1% level -3.80855
5% level -3.02069
10% level -2.65041
Null Hypothesis: CH_EXPORT has a unit root
Exogenous: Constant
Lag Length: 0 (Automatic - based on SIC, maxlag=4)
t-Statistic Prob.*
Augmented Dickey-Fuller test statistic -5.48302 0.0003
Test critical values: 1% level -3.80855
5% level -3.02069
10% level -2.65041

117
Null Hypothesis: CH_GDP has a unit root
Exogenous: Constant
Lag Length: 2 (Automatic - based on SIC, maxlag=4)
t-Statistic Prob.*
Augmented Dickey-Fuller test statistic 0.336464 0.9735
Test critical values: 1% level -3.85739
5% level -3.04039
10% level -2.66055
Null Hypothesis: CH_GOV_EFFECT has a unit root
Exogenous: Constant
Lag Length: 0 (Automatic - based on SIC, maxlag=4)
t-Statistic Prob.*
Augmented Dickey-Fuller test statistic -4.64683 0.0017
Test critical values: 1% level -3.80855
5% level -3.02069
10% level -2.65041
Null Hypothesis: CH_INFLATION has a unit root
Exogenous: Constant
Lag Length: 4 (Automatic - based on SIC, maxlag=4)
t-Statistic Prob.*
Augmented Dickey-Fuller test statistic -5.30635 0.0007
Test critical values: 1% level -3.92035
5% level -3.06559
10% level -2.67346

118
Null Hypothesis: CH_OIL_PRODUCT has a unit root
Exogenous: Constant
Lag Length: 1 (Automatic - based on SIC, maxlag=4)
t-Statistic Prob.*
Augmented Dickey-Fuller test statistic -4.6956 0.0016
Test critical values: 1% level -3.83151
5% level -3.02997
10% level -2.65519
Null Hypothesis: CH_OIL_RESERVES has a unit root
Exogenous: Constant
Lag Length: 0 (Automatic - based on SIC, maxlag=4)
t-Statistic Prob.*
Augmented Dickey-Fuller test statistic -3.79032 0.0104
Test critical values: 1% level -3.80855
5% level -3.02069
10% level -2.65041
Null Hypothesis: CH_POL_STABIL has a unit root
Exogenous: Constant
Lag Length: 1 (Automatic - based on SIC, maxlag=4)
t-Statistic Prob.*
Augmented Dickey-Fuller test statistic -4.99552 0.0009
Test critical values: 1% level -3.83151
5% level -3.02997
10% level -2.65519

119
Null Hypothesis: CH_POP has a unit root
Exogenous: Constant
Lag Length: 3 (Automatic - based on SIC, maxlag=4)
t-Statistic Prob.*
Augmented Dickey-Fuller test statistic -0.07738 0.9374
Test critical values: 1% level -3.88675
5% level -3.05217
10% level -2.66659
Null Hypothesis: CH_REG_Q has a unit root
Exogenous: Constant
Lag Length: 0 (Automatic - based on SIC, maxlag=4)
t-Statistic Prob.*
Augmented Dickey-Fuller test statistic -4.69319 0.0015
Test critical values: 1% level -3.80855
5% level -3.02069
10% level -2.65041
Null Hypothesis: CH_TELEPH has a unit root
Exogenous: Constant
Lag Length: 3 (Automatic - based on SIC, maxlag=4)
t-Statistic Prob.*
Augmented Dickey-Fuller test statistic -3.24236 0.035
Test critical values: 1% level -3.88675
5% level -3.05217
10% level -2.66659
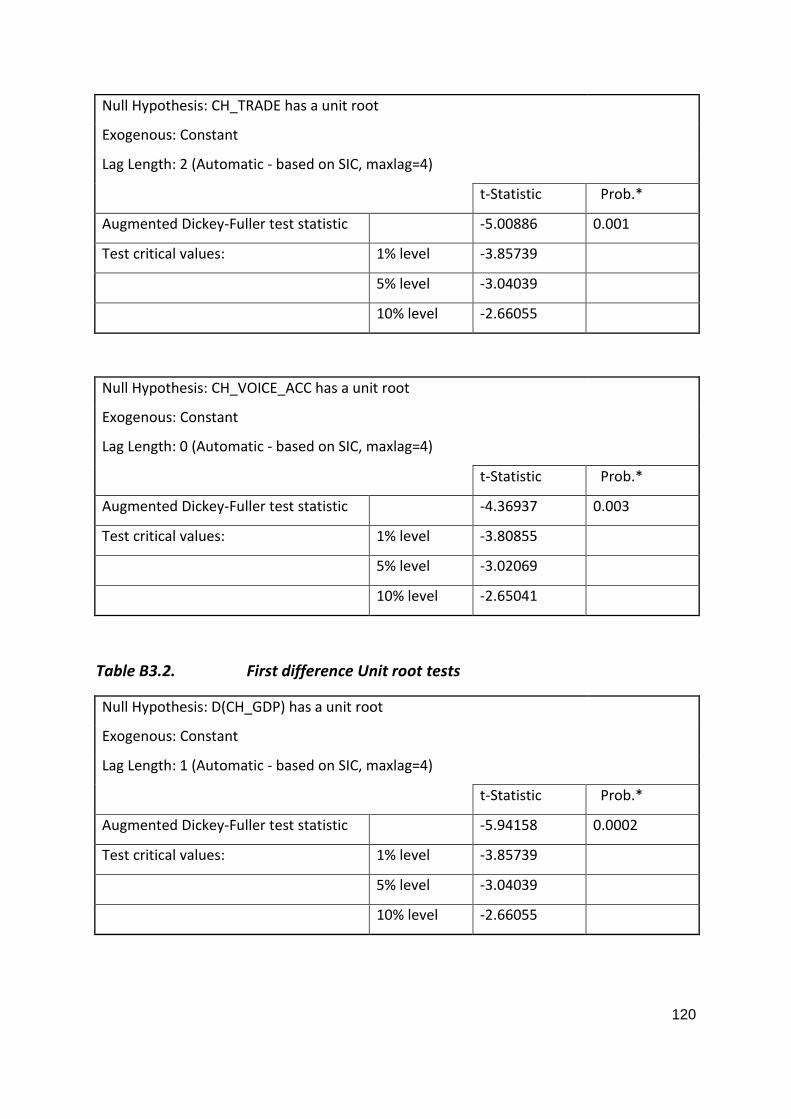
120
Null Hypothesis: CH_TRADE has a unit root
Exogenous: Constant
Lag Length: 2 (Automatic - based on SIC, maxlag=4)
t-Statistic Prob.*
Augmented Dickey-Fuller test statistic -5.00886 0.001
Test critical values: 1% level -3.85739
5% level -3.04039
10% level -2.66055
Null Hypothesis: CH_VOICE_ACC has a unit root
Exogenous: Constant
Lag Length: 0 (Automatic - based on SIC, maxlag=4)
t-Statistic Prob.*
Augmented Dickey-Fuller test statistic -4.36937 0.003
Test critical values: 1% level -3.80855
5% level -3.02069
10% level -2.65041
Table B3.2. First difference Unit root tests
Null Hypothesis: D(CH_GDP) has a unit root
Exogenous: Constant
Lag Length: 1 (Automatic - based on SIC, maxlag=4)
t-Statistic Prob.*
Augmented Dickey-Fuller test statistic -5.94158 0.0002
Test critical values: 1% level -3.85739
5% level -3.04039
10% level -2.66055
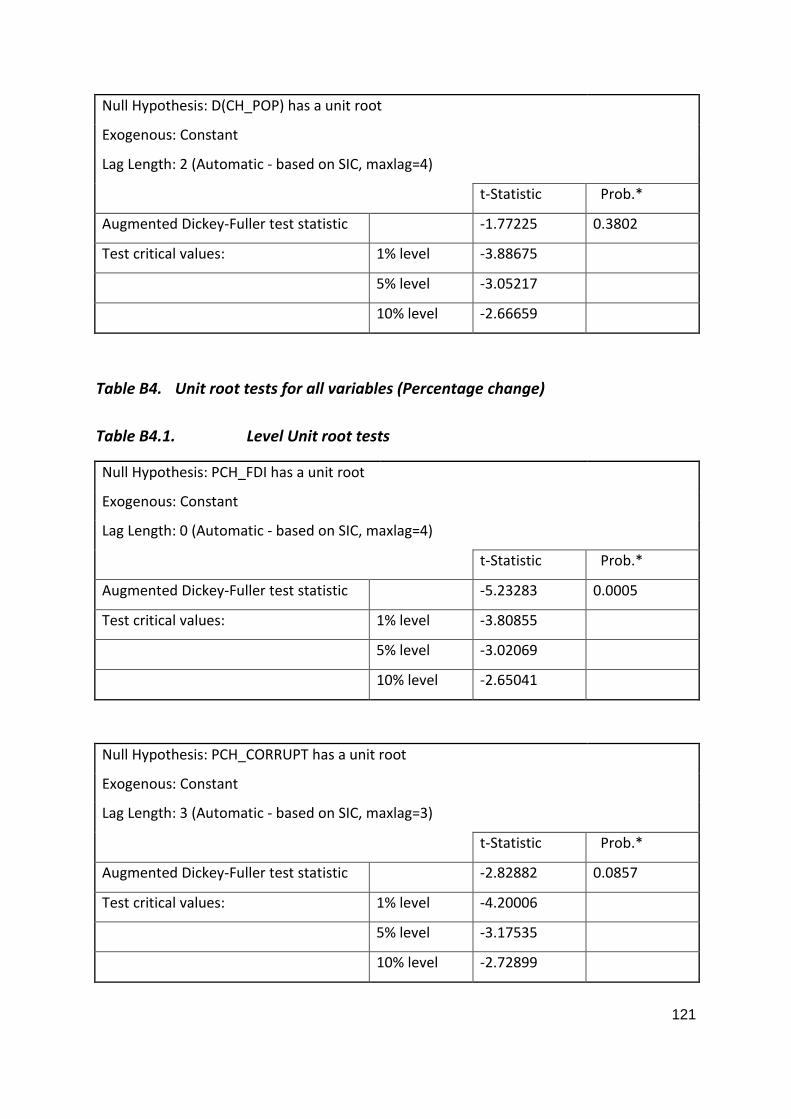
121
Null Hypothesis: D(CH_POP) has a unit root
Exogenous: Constant
Lag Length: 2 (Automatic - based on SIC, maxlag=4)
t-Statistic Prob.*
Augmented Dickey-Fuller test statistic -1.77225 0.3802
Test critical values: 1% level -3.88675
5% level -3.05217
10% level -2.66659
Table B4. Unit root tests for all variables (Percentage change)
Table B4.1. Level Unit root tests
Null Hypothesis: PCH_FDI has a unit root
Exogenous: Constant
Lag Length: 0 (Automatic - based on SIC, maxlag=4)
t-Statistic Prob.*
Augmented Dickey-Fuller test statistic -5.23283 0.0005
Test critical values: 1% level -3.80855
5% level -3.02069
10% level -2.65041
Null Hypothesis: PCH_CORRUPT has a unit root
Exogenous: Constant
Lag Length: 3 (Automatic - based on SIC, maxlag=3)
t-Statistic Prob.*
Augmented Dickey-Fuller test statistic -2.82882 0.0857
Test critical values: 1% level -4.20006
5% level -3.17535
10% level -2.72899

122
Null Hypothesis: PCH_EXPORT has a unit root
Exogenous: Constant
Lag Length: 1 (Automatic - based on SIC, maxlag=4)
t-Statistic Prob.*
Augmented Dickey-Fuller test statistic -4.17567 0.0049
Test critical values: 1% level -3.83151
5% level -3.02997
10% level -2.65519
Null Hypothesis: PCH_GDP has a unit root
Exogenous: Constant
Lag Length: 2 (Automatic - based on SIC, maxlag=4)
t-Statistic Prob.*
Augmented Dickey-Fuller test statistic -0.85621 0.7779
Test critical values: 1% level -3.85739
5% level -3.04039
10% level -2.66055
Null Hypothesis: PCH_GOV_EFFECT has a unit root
Exogenous: Constant
Lag Length: 0 (Automatic - based on SIC, maxlag=3)
t-Statistic Prob.*
Augmented Dickey-Fuller test statistic -4.31089 0.0058
Test critical values: 1% level -4.00443
5% level -3.0989
10% level -2.69044
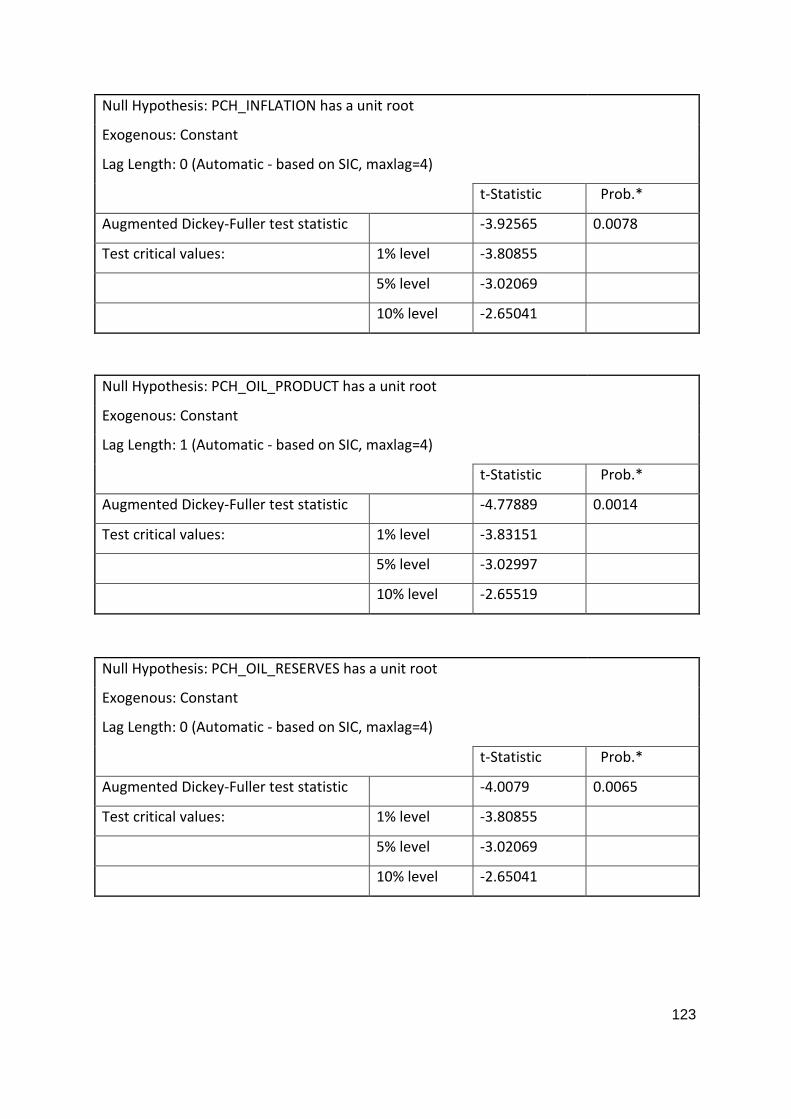
123
Null Hypothesis: PCH_INFLATION has a unit root
Exogenous: Constant
Lag Length: 0 (Automatic - based on SIC, maxlag=4)
t-Statistic Prob.*
Augmented Dickey-Fuller test statistic -3.92565 0.0078
Test critical values: 1% level -3.80855
5% level -3.02069
10% level -2.65041
Null Hypothesis: PCH_OIL_PRODUCT has a unit root
Exogenous: Constant
Lag Length: 1 (Automatic - based on SIC, maxlag=4)
t-Statistic Prob.*
Augmented Dickey-Fuller test statistic -4.77889 0.0014
Test critical values: 1% level -3.83151
5% level -3.02997
10% level -2.65519
Null Hypothesis: PCH_OIL_RESERVES has a unit root
Exogenous: Constant
Lag Length: 0 (Automatic - based on SIC, maxlag=4)
t-Statistic Prob.*
Augmented Dickey-Fuller test statistic -4.0079 0.0065
Test critical values: 1% level -3.80855
5% level -3.02069
10% level -2.65041

124
Null Hypothesis: PCH_POL_STABIL has a unit root
Exogenous: Constant
Lag Length: 0 (Automatic - based on SIC, maxlag=3)
t-Statistic Prob.*
Augmented Dickey-Fuller test statistic -3.69987 0.0173
Test critical values: 1% level -4.00443
5% level -3.0989
10% level -2.69044
Null Hypothesis: PCH_POP has a unit root
Exogenous: Constant
Lag Length: 3 (Automatic - based on SIC, maxlag=4)
t-Statistic Prob.*
Augmented Dickey-Fuller test statistic -1.91014 0.3201
Test critical values: 1% level -3.88675
5% level -3.05217
10% level -2.66659
Null Hypothesis: PCH_REG_Q has a unit root
Exogenous: Constant
Lag Length: 0 (Automatic - based on SIC, maxlag=3)
t-Statistic Prob.*
Augmented Dickey-Fuller test statistic -3.90344 0.012
Test critical values: 1% level -4.00443
5% level -3.0989
10% level -2.69044

125
Null Hypothesis: PCH_TELEPH has a unit root
Exogenous: Constant
Lag Length: 3 (Automatic - based on SIC, maxlag=4)
t-Statistic Prob.*
Augmented Dickey-Fuller test statistic -2.02461 0.2745
Test critical values: 1% level -3.88675
5% level -3.05217
10% level -2.66659
Null Hypothesis: PCH_TRADE has a unit root
Exogenous: Constant
Lag Length: 1 (Automatic - based on SIC, maxlag=4)
t-Statistic Prob.*
Augmented Dickey-Fuller test statistic -4.7591 0.0014
Test critical values: 1% level -3.83151
5% level -3.02997
10% level -2.65519
Null Hypothesis: PCH_VOICE_ACC has a unit root
Exogenous: Constant
Lag Length: 0 (Automatic - based on SIC, maxlag=3)
t-Statistic Prob.*
Augmented Dickey-Fuller test statistic -4.46531 0.0044
Test critical values: 1% level -4.00443
5% level -3.0989
10% level -2.69044
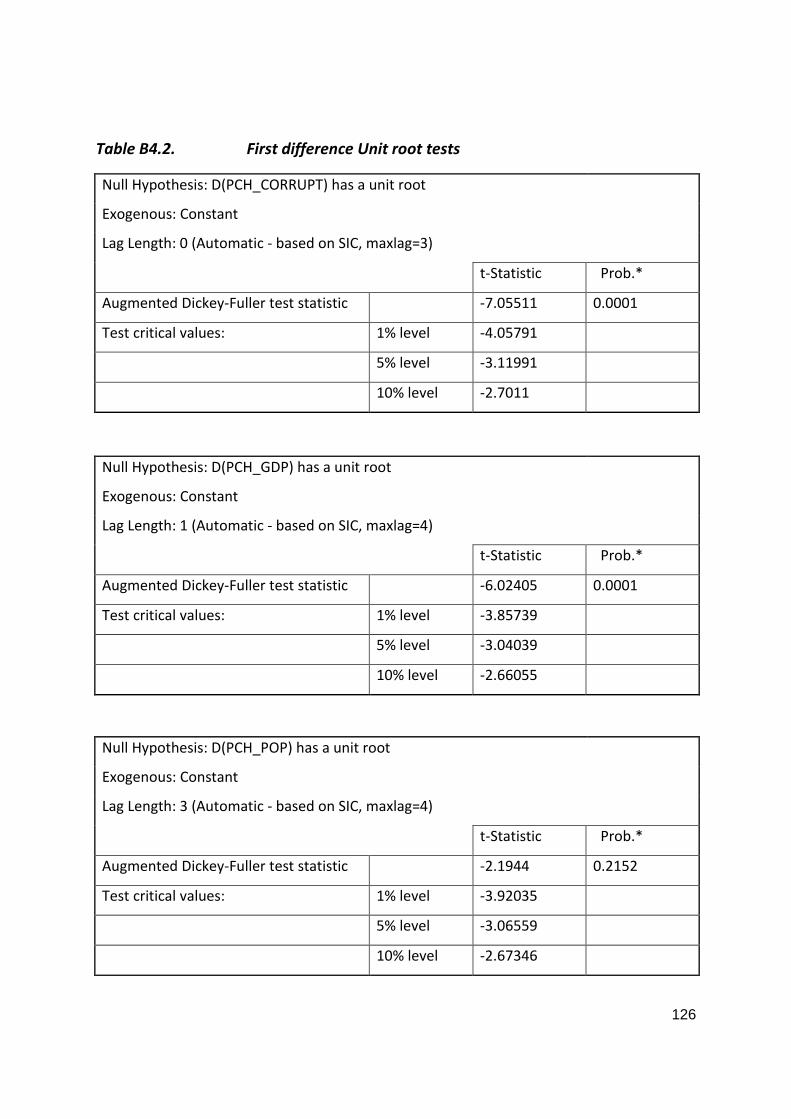
126
Table B4.2. First difference Unit root tests
Null Hypothesis: D(PCH_CORRUPT) has a unit root
Exogenous: Constant
Lag Length: 0 (Automatic - based on SIC, maxlag=3)
t-Statistic Prob.*
Augmented Dickey-Fuller test statistic -7.05511 0.0001
Test critical values: 1% level -4.05791
5% level -3.11991
10% level -2.7011
Null Hypothesis: D(PCH_GDP) has a unit root
Exogenous: Constant
Lag Length: 1 (Automatic - based on SIC, maxlag=4)
t-Statistic Prob.*
Augmented Dickey-Fuller test statistic -6.02405 0.0001
Test critical values: 1% level -3.85739
5% level -3.04039
10% level -2.66055
Null Hypothesis: D(PCH_POP) has a unit root
Exogenous: Constant
Lag Length: 3 (Automatic - based on SIC, maxlag=4)
t-Statistic Prob.*
Augmented Dickey-Fuller test statistic -2.1944 0.2152
Test critical values: 1% level -3.92035
5% level -3.06559
10% level -2.67346
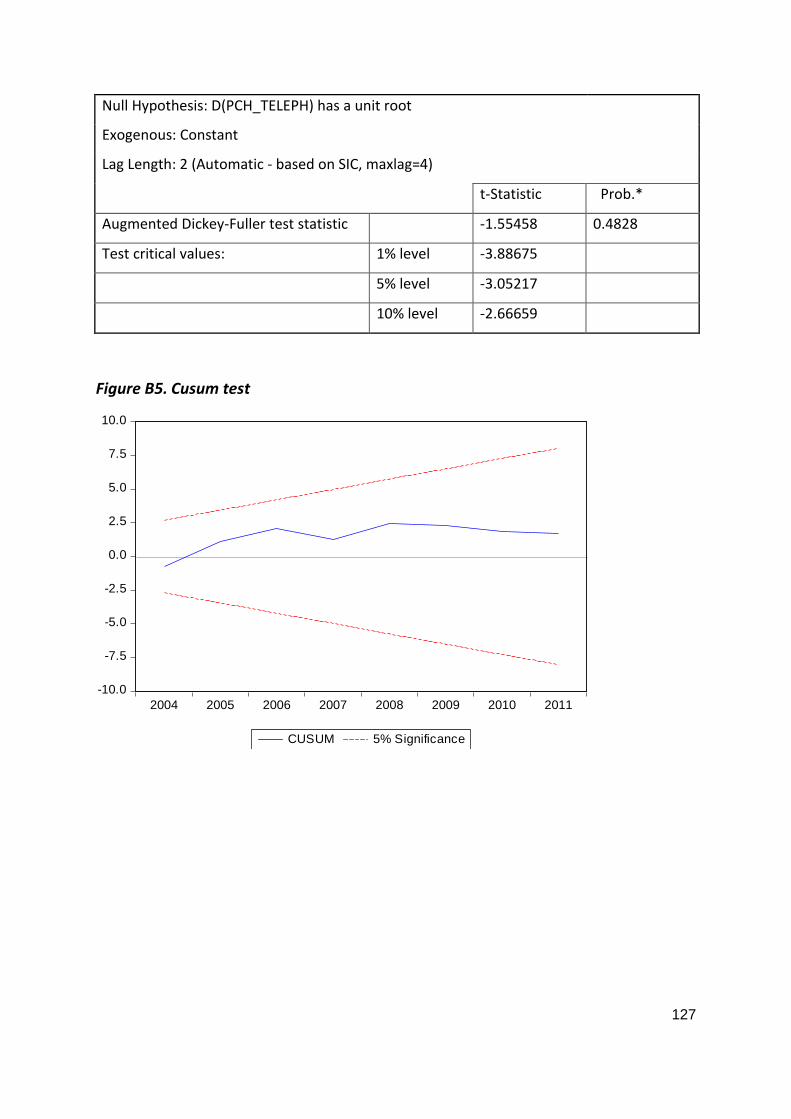
127
Null Hypothesis: D(PCH_TELEPH) has a unit root
Exogenous: Constant
Lag Length: 2 (Automatic - based on SIC, maxlag=4)
t-Statistic Prob.*
Augmented Dickey-Fuller test statistic -1.55458 0.4828
Test critical values: 1% level -3.88675
5% level -3.05217
10% level -2.66659
Figure B5. Cusum test
-10.0
-7.5
-5.0
-2.5
0.0
2.5
5.0
7.5
10.0
2004 2005 2006 2007 2008 2009 2010 2011
CUSUM 5% Significance

128
Figure B6. Normality test
Table B7. Hetroskedasticity test
Heteroskedasticity Test: Breusch-Pagan-Godfrey
F-statistic 1.178447 Prob. F(6,8) 0.4032
Obs* R² 7.037521 Prob. Chi-Square(6) 0.3174
Scaled explained SS 1.348062 Prob. Chi-Square(6) 0.9689
Table B8. Serial correlation test
Breusch-Godfrey Serial Correlation LM Test:
F-statistic 0.330471 Prob. F(2,6) 0.7309
Obs* R² 1.4884 Prob. Chi-Square(2) 0.4751
0
1
2
3
4
5
-40 -30 -20 -10 0 10 20 30 40 50
Series: ResidualsSample 1997 2011Observations 15
Mean 5.03e-15Median -4.166383Maximum 43.05724Minimum -38.90044Std. Dev. 23.41660Skewness 0.263683Kurtosis 2.346861
Jarque-Bera 0.440441Probability 0.802342
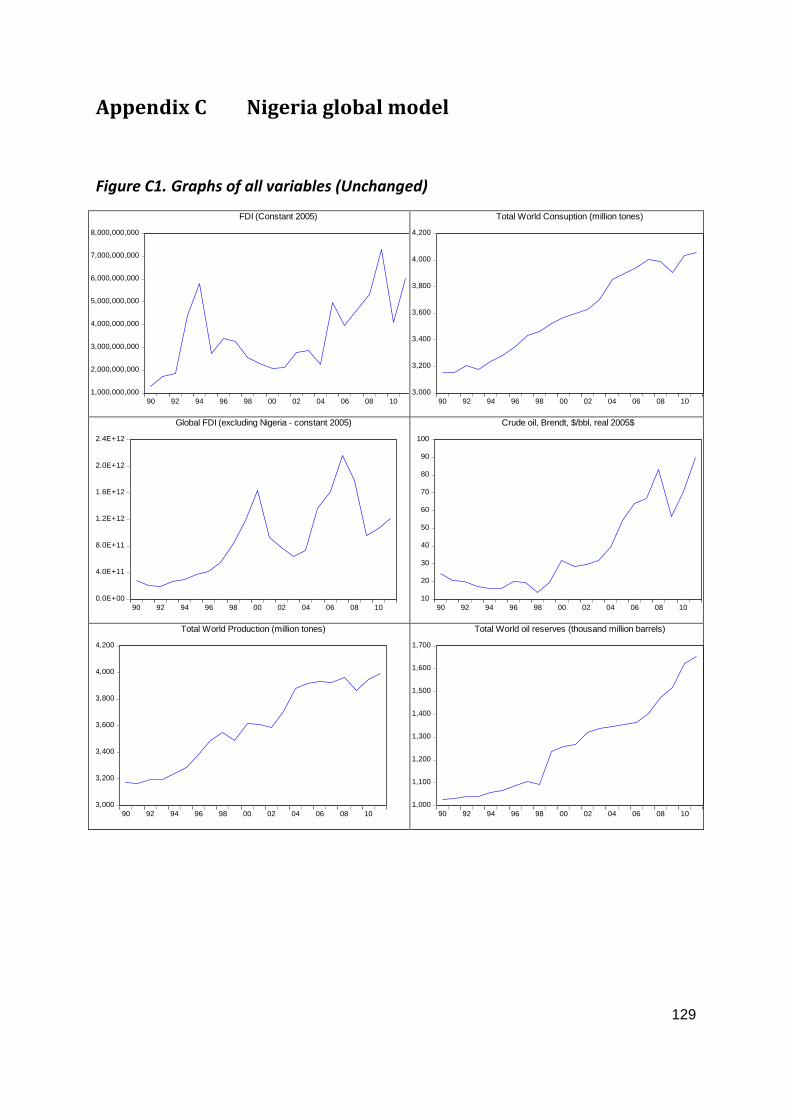
129
Appendix C Nigeria global model
Figure C1. Graphs of all variables (Unchanged)
1,000,000,000
2,000,000,000
3,000,000,000
4,000,000,000
5,000,000,000
6,000,000,000
7,000,000,000
8,000,000,000
90 92 94 96 98 00 02 04 06 08 10
FDI (Constant 2005)
3,000
3,200
3,400
3,600
3,800
4,000
4,200
90 92 94 96 98 00 02 04 06 08 10
Total World Consuption (million tones)
0.0E+00
4.0E+11
8.0E+11
1.2E+12
1.6E+12
2.0E+12
2.4E+12
90 92 94 96 98 00 02 04 06 08 10
Global FDI (excluding Nigeria - constant 2005)
10
20
30
40
50
60
70
80
90
100
90 92 94 96 98 00 02 04 06 08 10
Crude oil, Brendt, $/bbl, real 2005$
3,000
3,200
3,400
3,600
3,800
4,000
4,200
90 92 94 96 98 00 02 04 06 08 10
Total World Production (million tones)
1,000
1,100
1,200
1,300
1,400
1,500
1,600
1,700
90 92 94 96 98 00 02 04 06 08 10
Total World oil reserves (thousand million barrels)
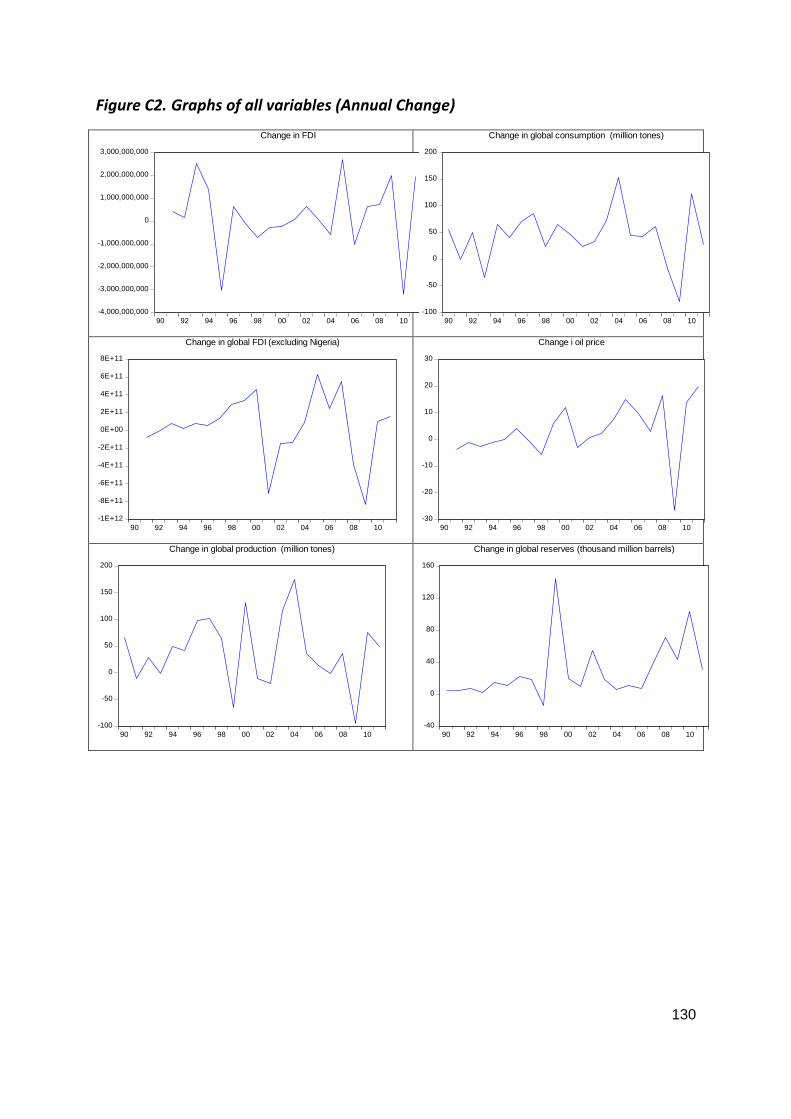
130
Figure C2. Graphs of all variables (Annual Change)
-4,000,000,000
-3,000,000,000
-2,000,000,000
-1,000,000,000
0
1,000,000,000
2,000,000,000
3,000,000,000
90 92 94 96 98 00 02 04 06 08 10
Change in FDI
-100
-50
0
50
100
150
200
90 92 94 96 98 00 02 04 06 08 10
Change in global consumption (million tones)
-1E+12
-8E+11
-6E+11
-4E+11
-2E+11
0E+00
2E+11
4E+11
6E+11
8E+11
90 92 94 96 98 00 02 04 06 08 10
Change in global FDI (excluding Nigeria)
-30
-20
-10
0
10
20
30
90 92 94 96 98 00 02 04 06 08 10
Change i oil price
-100
-50
0
50
100
150
200
90 92 94 96 98 00 02 04 06 08 10
Change in global production (million tones)
-40
0
40
80
120
160
90 92 94 96 98 00 02 04 06 08 10
Change in global reserves (thousand million barrels)
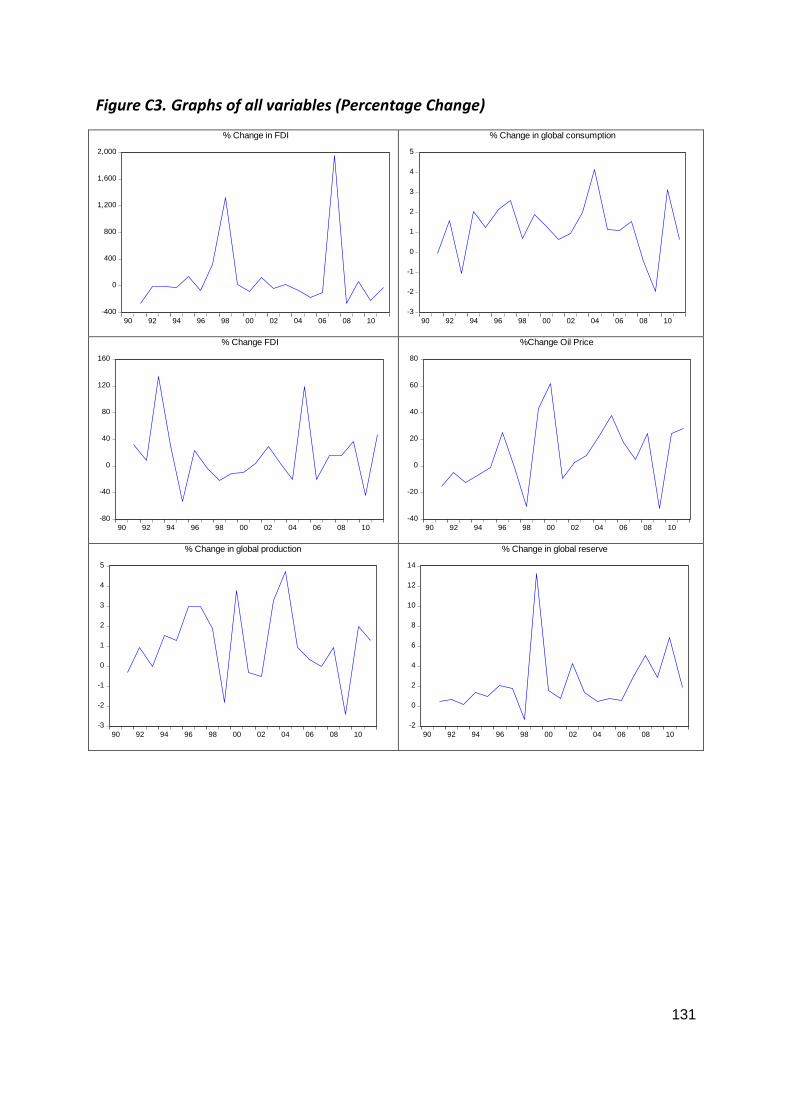
131
Figure C3. Graphs of all variables (Percentage Change)
-400
0
400
800
1,200
1,600
2,000
90 92 94 96 98 00 02 04 06 08 10
% Change in FDI
-3
-2
-1
0
1
2
3
4
5
90 92 94 96 98 00 02 04 06 08 10
% Change in global consumption
-80
-40
0
40
80
120
160
90 92 94 96 98 00 02 04 06 08 10
% Change FDI
-40
-20
0
20
40
60
80
90 92 94 96 98 00 02 04 06 08 10
%Change Oil Price
-3
-2
-1
0
1
2
3
4
5
90 92 94 96 98 00 02 04 06 08 10
% Change in global production
-2
0
2
4
6
8
10
12
14
90 92 94 96 98 00 02 04 06 08 10
% Change in global reserve
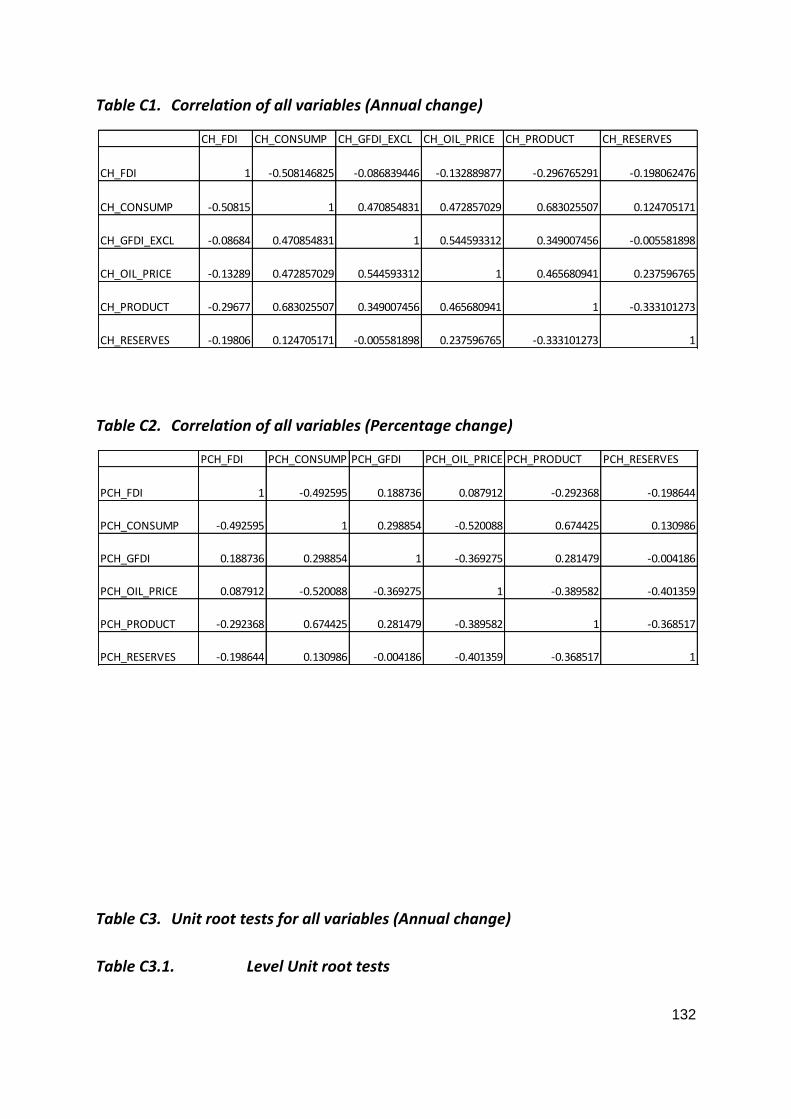
132
Table C1. Correlation of all variables (Annual change)
Table C2. Correlation of all variables (Percentage change)
Table C3. Unit root tests for all variables (Annual change)
Table C3.1. Level Unit root tests
CH_FDI CH_CONSUMP CH_GFDI_EXCL CH_OIL_PRICE CH_PRODUCT CH_RESERVES
CH_FDI 1 -0.508146825 -0.086839446 -0.132889877 -0.296765291 -0.198062476
CH_CONSUMP -0.50815 1 0.470854831 0.472857029 0.683025507 0.124705171
CH_GFDI_EXCL -0.08684 0.470854831 1 0.544593312 0.349007456 -0.005581898
CH_OIL_PRICE -0.13289 0.472857029 0.544593312 1 0.465680941 0.237596765
CH_PRODUCT -0.29677 0.683025507 0.349007456 0.465680941 1 -0.333101273
CH_RESERVES -0.19806 0.124705171 -0.005581898 0.237596765 -0.333101273 1
PCH_FDI PCH_CONSUMP PCH_GFDI PCH_OIL_PRICE PCH_PRODUCT PCH_RESERVES
PCH_FDI 1 -0.492595 0.188736 0.087912 -0.292368 -0.198644
PCH_CONSUMP -0.492595 1 0.298854 -0.520088 0.674425 0.130986
PCH_GFDI 0.188736 0.298854 1 -0.369275 0.281479 -0.004186
PCH_OIL_PRICE 0.087912 -0.520088 -0.369275 1 -0.389582 -0.401359
PCH_PRODUCT -0.292368 0.674425 0.281479 -0.389582 1 -0.368517
PCH_RESERVES -0.198644 0.130986 -0.004186 -0.401359 -0.368517 1
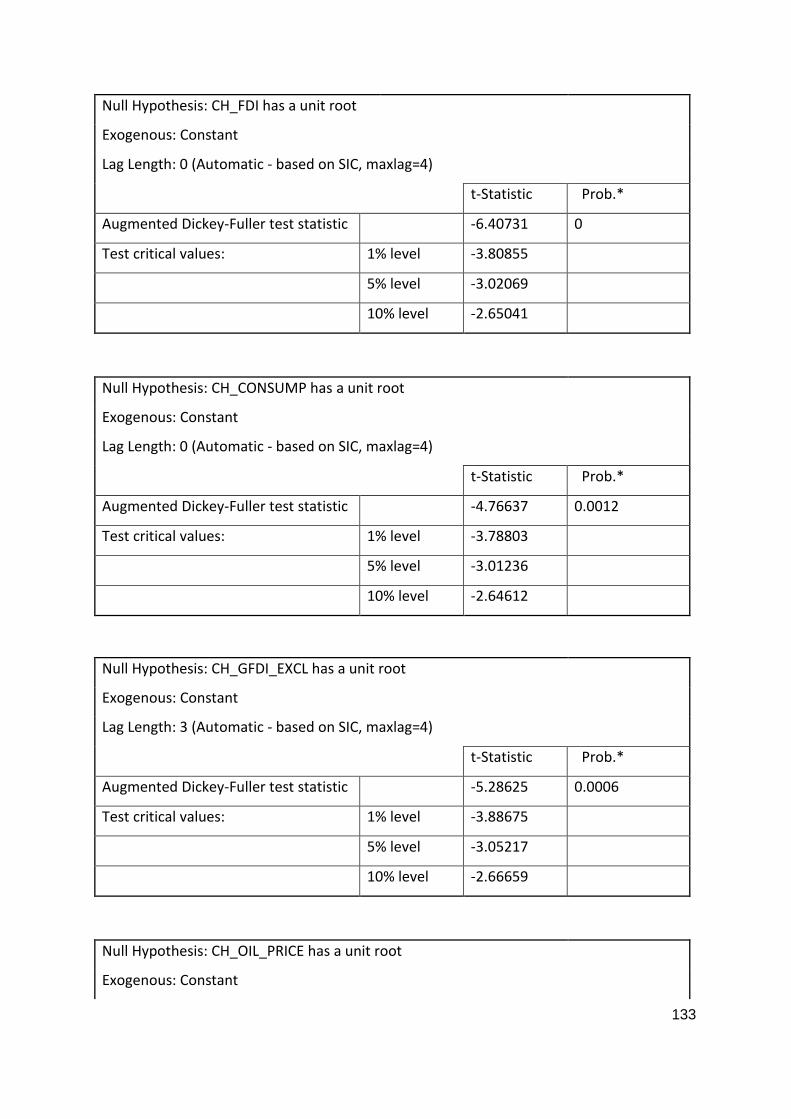
133
Null Hypothesis: CH_FDI has a unit root
Exogenous: Constant
Lag Length: 0 (Automatic - based on SIC, maxlag=4)
t-Statistic Prob.*
Augmented Dickey-Fuller test statistic -6.40731 0
Test critical values: 1% level -3.80855
5% level -3.02069
10% level -2.65041
Null Hypothesis: CH_CONSUMP has a unit root
Exogenous: Constant
Lag Length: 0 (Automatic - based on SIC, maxlag=4)
t-Statistic Prob.*
Augmented Dickey-Fuller test statistic -4.76637 0.0012
Test critical values: 1% level -3.78803
5% level -3.01236
10% level -2.64612
Null Hypothesis: CH_GFDI_EXCL has a unit root
Exogenous: Constant
Lag Length: 3 (Automatic - based on SIC, maxlag=4)
t-Statistic Prob.*
Augmented Dickey-Fuller test statistic -5.28625 0.0006
Test critical values: 1% level -3.88675
5% level -3.05217
10% level -2.66659
Null Hypothesis: CH_OIL_PRICE has a unit root
Exogenous: Constant
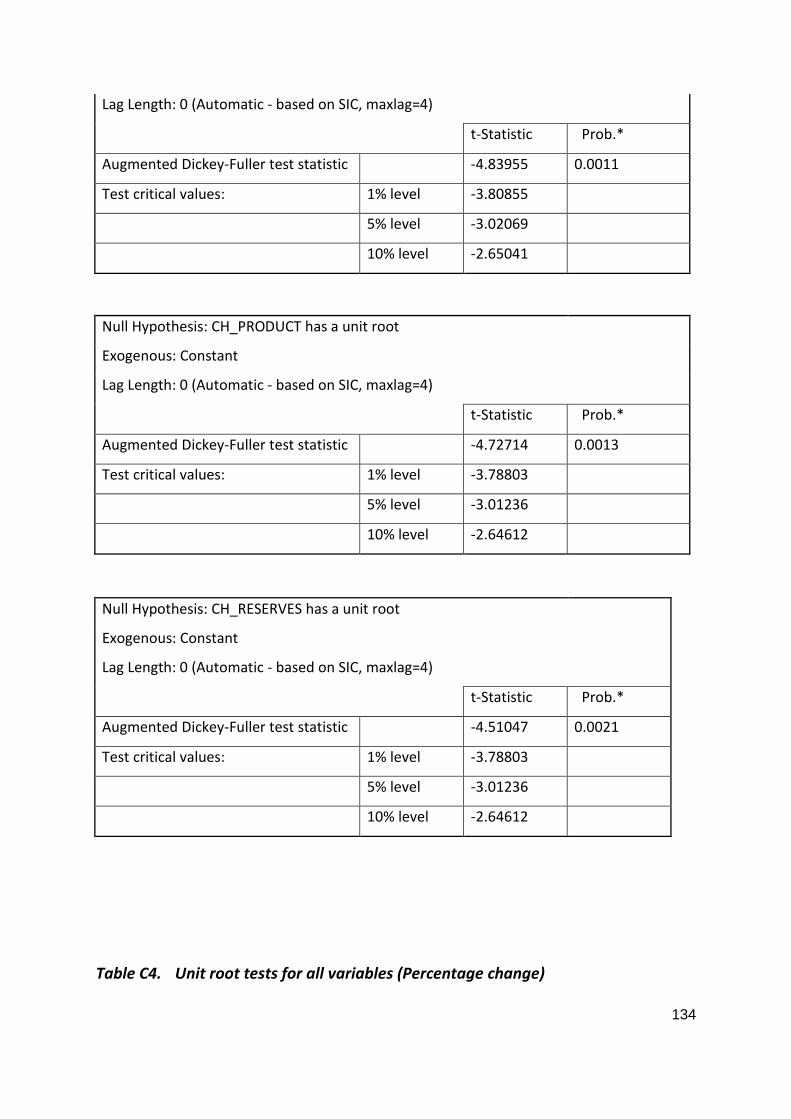
134
Lag Length: 0 (Automatic - based on SIC, maxlag=4)
t-Statistic Prob.*
Augmented Dickey-Fuller test statistic -4.83955 0.0011
Test critical values: 1% level -3.80855
5% level -3.02069
10% level -2.65041
Null Hypothesis: CH_PRODUCT has a unit root
Exogenous: Constant
Lag Length: 0 (Automatic - based on SIC, maxlag=4)
t-Statistic Prob.*
Augmented Dickey-Fuller test statistic -4.72714 0.0013
Test critical values: 1% level -3.78803
5% level -3.01236
10% level -2.64612
Null Hypothesis: CH_RESERVES has a unit root
Exogenous: Constant
Lag Length: 0 (Automatic - based on SIC, maxlag=4)
t-Statistic Prob.*
Augmented Dickey-Fuller test statistic -4.51047 0.0021
Test critical values: 1% level -3.78803
5% level -3.01236
10% level -2.64612
Table C4. Unit root tests for all variables (Percentage change)
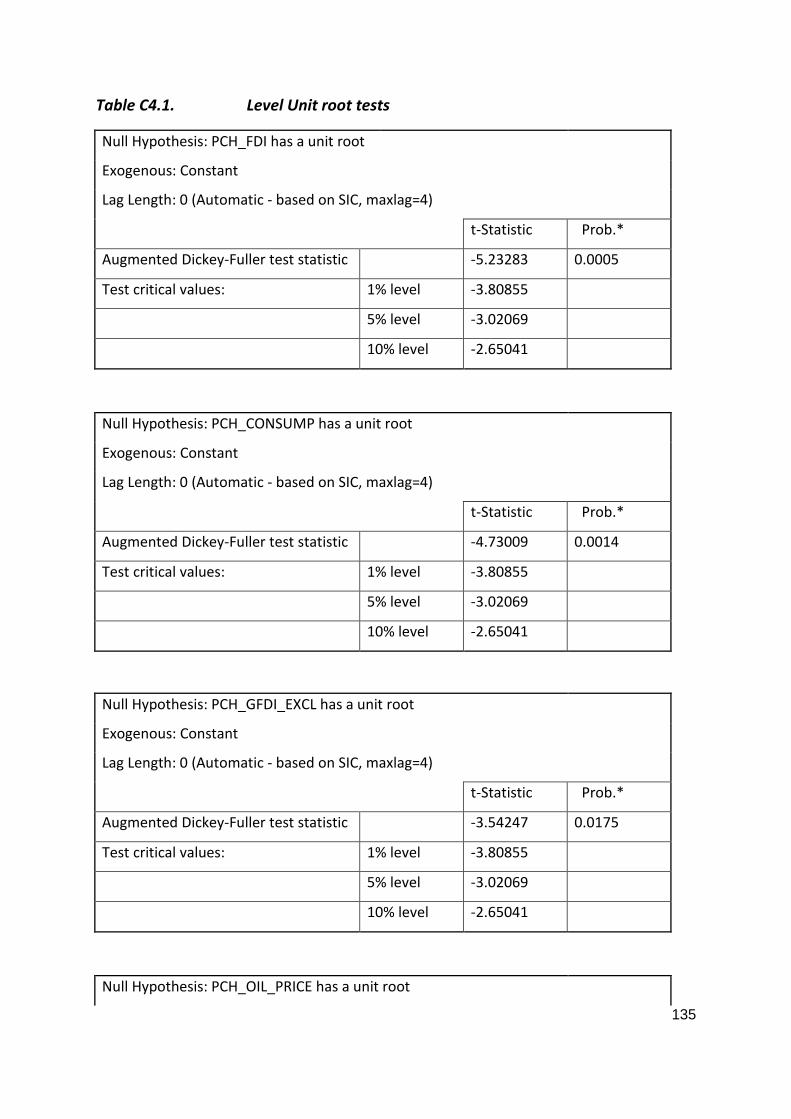
135
Table C4.1. Level Unit root tests
Null Hypothesis: PCH_FDI has a unit root
Exogenous: Constant
Lag Length: 0 (Automatic - based on SIC, maxlag=4)
t-Statistic Prob.*
Augmented Dickey-Fuller test statistic -5.23283 0.0005
Test critical values: 1% level -3.80855
5% level -3.02069
10% level -2.65041
Null Hypothesis: PCH_CONSUMP has a unit root
Exogenous: Constant
Lag Length: 0 (Automatic - based on SIC, maxlag=4)
t-Statistic Prob.*
Augmented Dickey-Fuller test statistic -4.73009 0.0014
Test critical values: 1% level -3.80855
5% level -3.02069
10% level -2.65041
Null Hypothesis: PCH_GFDI_EXCL has a unit root
Exogenous: Constant
Lag Length: 0 (Automatic - based on SIC, maxlag=4)
t-Statistic Prob.*
Augmented Dickey-Fuller test statistic -3.54247 0.0175
Test critical values: 1% level -3.80855
5% level -3.02069
10% level -2.65041
Null Hypothesis: PCH_OIL_PRICE has a unit root
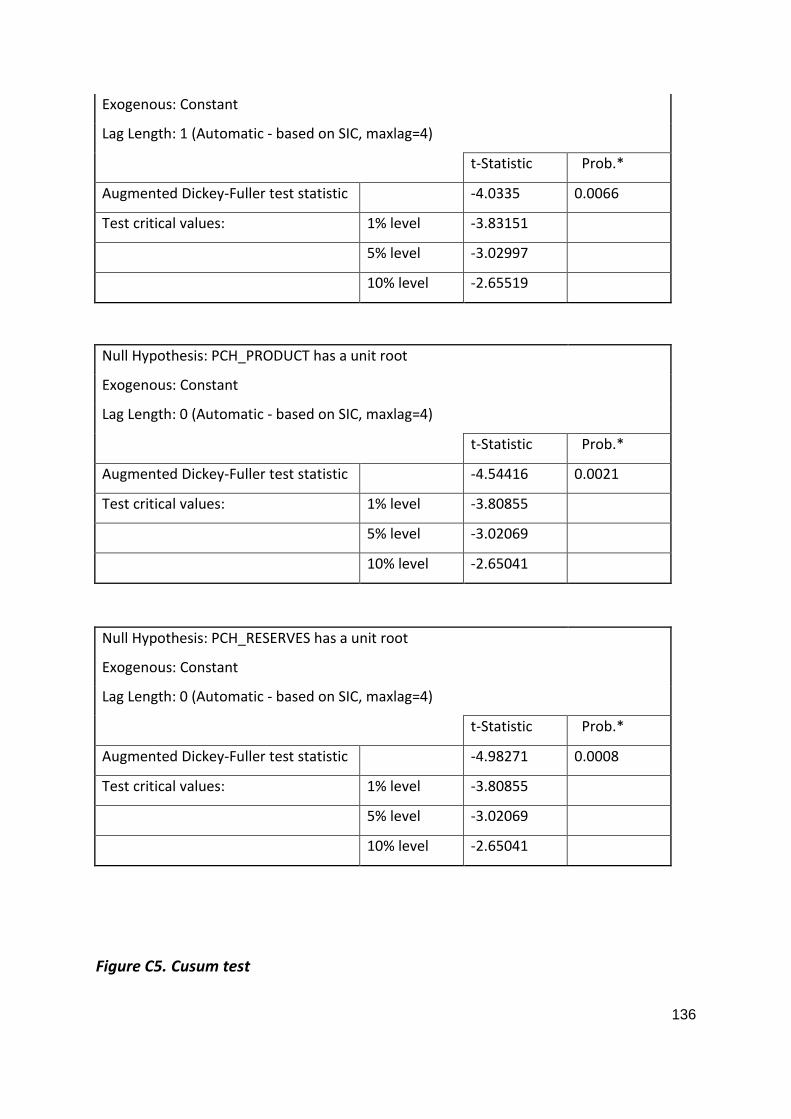
136
Exogenous: Constant
Lag Length: 1 (Automatic - based on SIC, maxlag=4)
t-Statistic Prob.*
Augmented Dickey-Fuller test statistic -4.0335 0.0066
Test critical values: 1% level -3.83151
5% level -3.02997
10% level -2.65519
Null Hypothesis: PCH_PRODUCT has a unit root
Exogenous: Constant
Lag Length: 0 (Automatic - based on SIC, maxlag=4)
t-Statistic Prob.*
Augmented Dickey-Fuller test statistic -4.54416 0.0021
Test critical values: 1% level -3.80855
5% level -3.02069
10% level -2.65041
Null Hypothesis: PCH_RESERVES has a unit root
Exogenous: Constant
Lag Length: 0 (Automatic - based on SIC, maxlag=4)
t-Statistic Prob.*
Augmented Dickey-Fuller test statistic -4.98271 0.0008
Test critical values: 1% level -3.80855
5% level -3.02069
10% level -2.65041
Figure C5. Cusum test
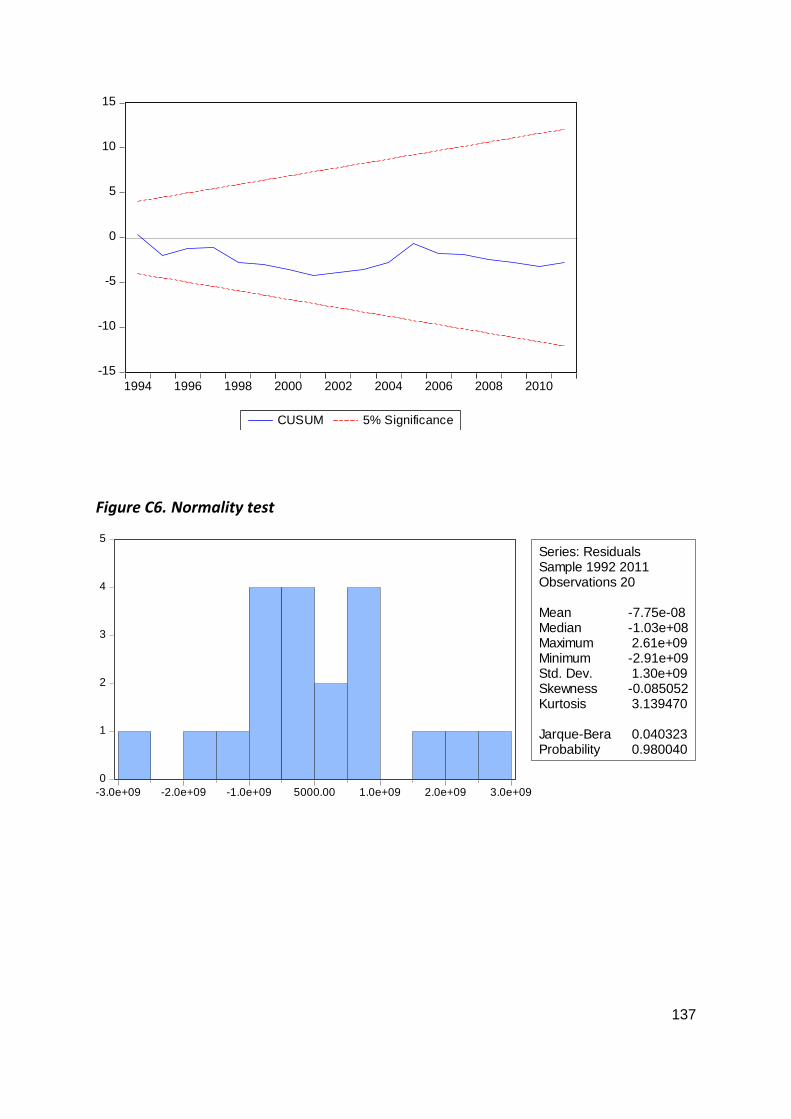
137
Figure C6. Normality test
-15
-10
-5
0
5
10
15
1994 1996 1998 2000 2002 2004 2006 2008 2010
CUSUM 5% Significance
0
1
2
3
4
5
-3.0e+09 -2.0e+09 -1.0e+09 5000.00 1.0e+09 2.0e+09 3.0e+09
Series: ResidualsSample 1992 2011Observations 20
Mean -7.75e-08Median -1.03e+08Maximum 2.61e+09Minimum -2.91e+09Std. Dev. 1.30e+09Skewness -0.085052Kurtosis 3.139470
Jarque-Bera 0.040323Probability 0.980040
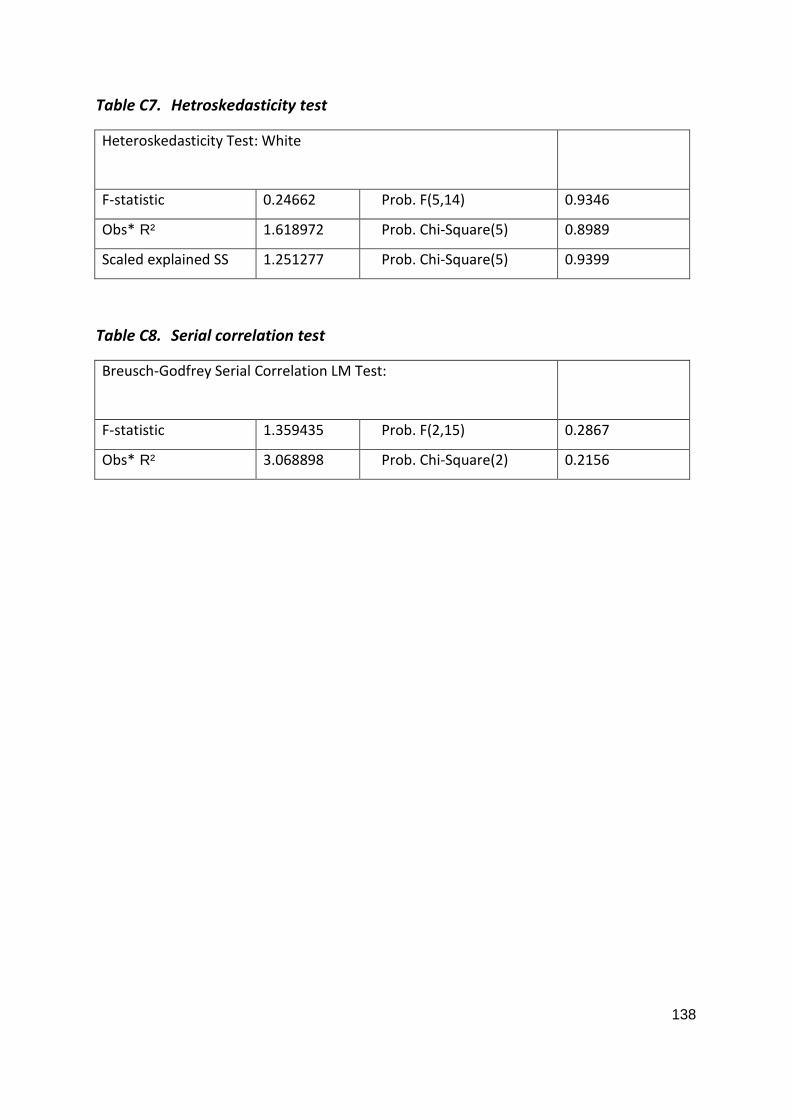
138
Table C7. Hetroskedasticity test
Heteroskedasticity Test: White
F-statistic 0.24662 Prob. F(5,14) 0.9346
Obs* R² 1.618972 Prob. Chi-Square(5) 0.8989
Scaled explained SS 1.251277 Prob. Chi-Square(5) 0.9399
Table C8. Serial correlation test
Breusch-Godfrey Serial Correlation LM Test:
F-statistic 1.359435 Prob. F(2,15) 0.2867
Obs* R² 3.068898 Prob. Chi-Square(2) 0.2156
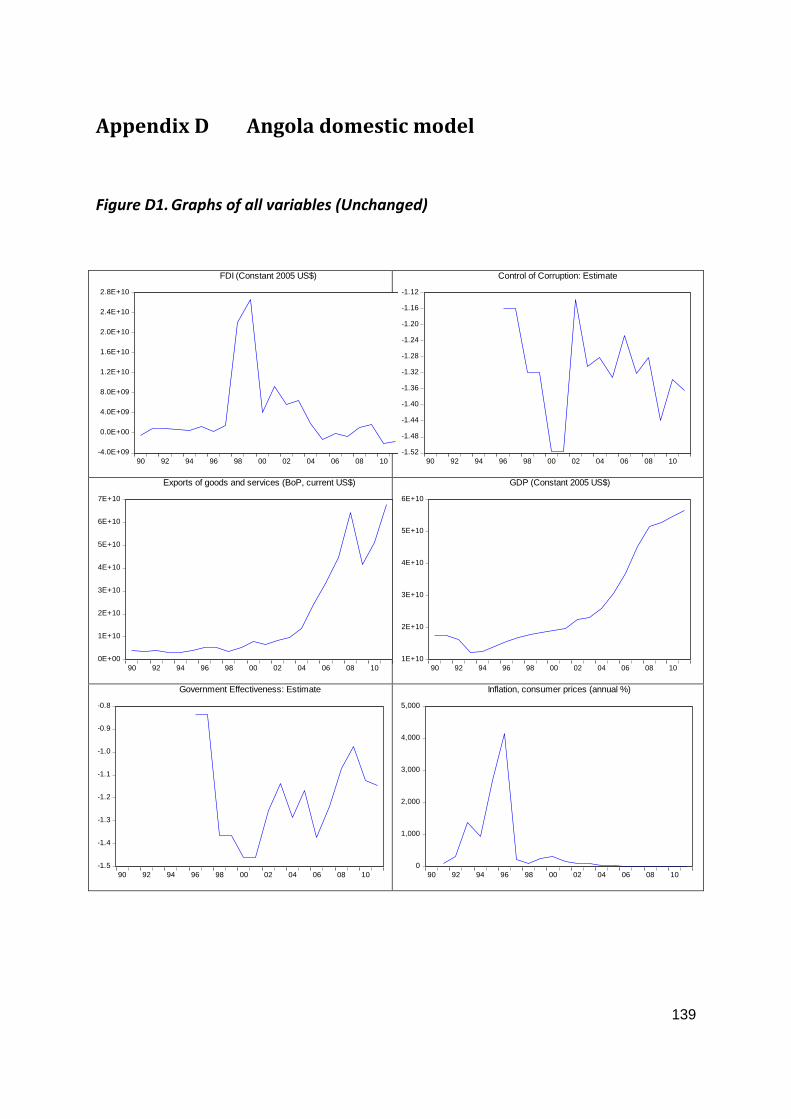
139
Appendix D Angola domestic model
Figure D1. Graphs of all variables (Unchanged)
-4.0E+09
0.0E+00
4.0E+09
8.0E+09
1.2E+10
1.6E+10
2.0E+10
2.4E+10
2.8E+10
90 92 94 96 98 00 02 04 06 08 10
FDI (Constant 2005 US$)
-1.52
-1.48
-1.44
-1.40
-1.36
-1.32
-1.28
-1.24
-1.20
-1.16
-1.12
90 92 94 96 98 00 02 04 06 08 10
Control of Corruption: Estimate
0E+00
1E+10
2E+10
3E+10
4E+10
5E+10
6E+10
7E+10
90 92 94 96 98 00 02 04 06 08 10
Exports of goods and services (BoP, current US$)
1E+10
2E+10
3E+10
4E+10
5E+10
6E+10
90 92 94 96 98 00 02 04 06 08 10
GDP (Constant 2005 US$)
-1.5
-1.4
-1.3
-1.2
-1.1
-1.0
-0.9
-0.8
90 92 94 96 98 00 02 04 06 08 10
Government Effectiveness: Estimate
0
1,000
2,000
3,000
4,000
5,000
90 92 94 96 98 00 02 04 06 08 10
Inflation, consumer prices (annual %)
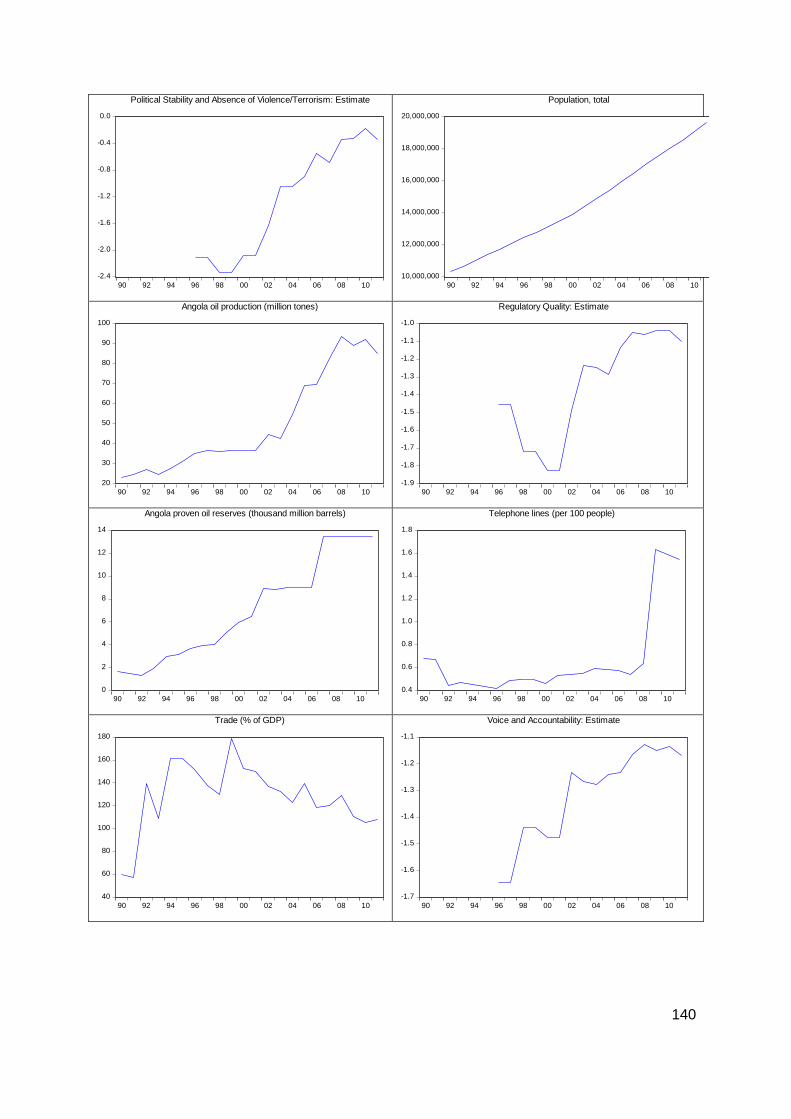
140
-2.4
-2.0
-1.6
-1.2
-0.8
-0.4
0.0
90 92 94 96 98 00 02 04 06 08 10
Political Stability and Absence of Violence/Terrorism: Estimate
10,000,000
12,000,000
14,000,000
16,000,000
18,000,000
20,000,000
90 92 94 96 98 00 02 04 06 08 10
Population, total
20
30
40
50
60
70
80
90
100
90 92 94 96 98 00 02 04 06 08 10
Angola oil production (million tones)
-1.9
-1.8
-1.7
-1.6
-1.5
-1.4
-1.3
-1.2
-1.1
-1.0
90 92 94 96 98 00 02 04 06 08 10
Regulatory Quality: Estimate
0
2
4
6
8
10
12
14
90 92 94 96 98 00 02 04 06 08 10
Angola proven oil reserves (thousand million barrels)
0.4
0.6
0.8
1.0
1.2
1.4
1.6
1.8
90 92 94 96 98 00 02 04 06 08 10
Telephone lines (per 100 people)
40
60
80
100
120
140
160
180
90 92 94 96 98 00 02 04 06 08 10
Trade (% of GDP)
-1.7
-1.6
-1.5
-1.4
-1.3
-1.2
-1.1
90 92 94 96 98 00 02 04 06 08 10
Voice and Accountability: Estimate
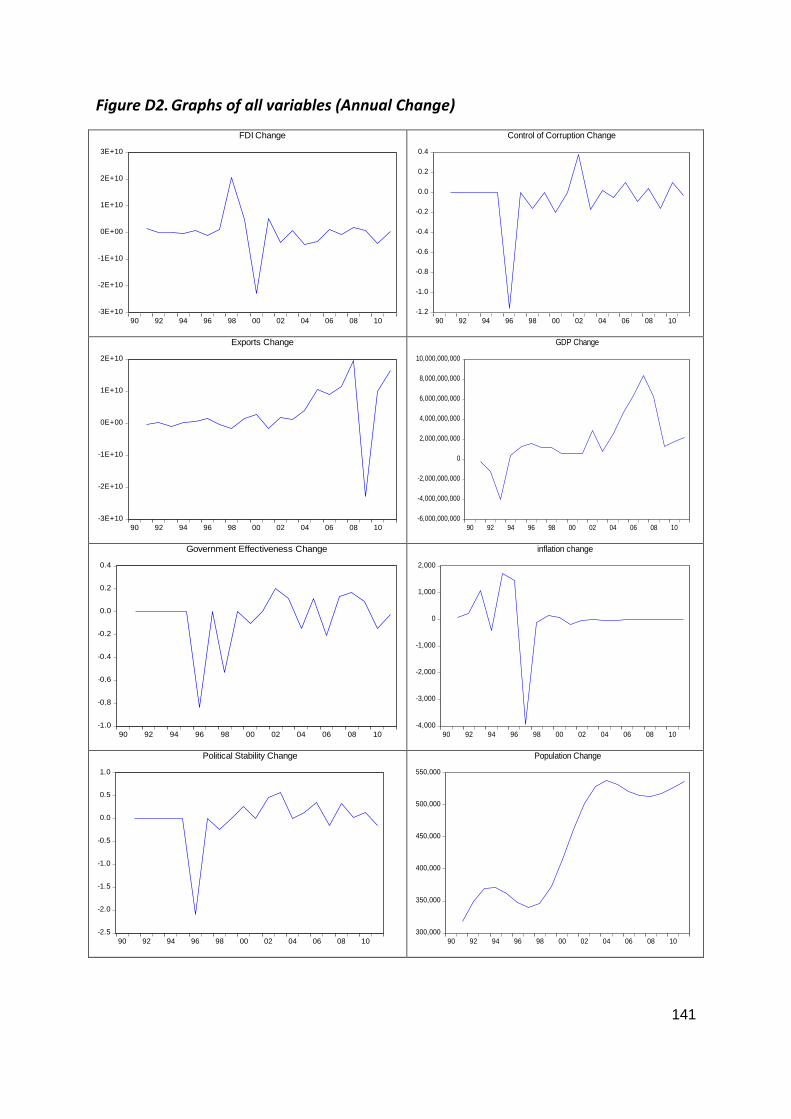
141
Figure D2. Graphs of all variables (Annual Change)
-3E+10
-2E+10
-1E+10
0E+00
1E+10
2E+10
3E+10
90 92 94 96 98 00 02 04 06 08 10
FDI Change
-1.2
-1.0
-0.8
-0.6
-0.4
-0.2
0.0
0.2
0.4
90 92 94 96 98 00 02 04 06 08 10
Control of Corruption Change
-3E+10
-2E+10
-1E+10
0E+00
1E+10
2E+10
90 92 94 96 98 00 02 04 06 08 10
Exports Change
-6,000,000,000
-4,000,000,000
-2,000,000,000
0
2,000,000,000
4,000,000,000
6,000,000,000
8,000,000,000
10,000,000,000
90 92 94 96 98 00 02 04 06 08 10
GDP Change
-1.0
-0.8
-0.6
-0.4
-0.2
0.0
0.2
0.4
90 92 94 96 98 00 02 04 06 08 10
Government Effectiveness Change
-4,000
-3,000
-2,000
-1,000
0
1,000
2,000
90 92 94 96 98 00 02 04 06 08 10
inflation change
-2.5
-2.0
-1.5
-1.0
-0.5
0.0
0.5
1.0
90 92 94 96 98 00 02 04 06 08 10
Political Stability Change
300,000
350,000
400,000
450,000
500,000
550,000
90 92 94 96 98 00 02 04 06 08 10
Population Change

142
Figure D3. Graphs of all variables (Percentage Change)
-8
-4
0
4
8
12
16
90 92 94 96 98 00 02 04 06 08 10
Production Change
-1.6
-1.2
-0.8
-0.4
0.0
0.4
90 92 94 96 98 00 02 04 06 08 10
Regulatory Quality Change
-1
0
1
2
3
4
5
90 92 94 96 98 00 02 04 06 08 10
Reserves Change
-0.4
-0.2
0.0
0.2
0.4
0.6
0.8
1.0
1.2
90 92 94 96 98 00 02 04 06 08 10
Telephone lines change
-40
-20
0
20
40
60
80
100
90 92 94 96 98 00 02 04 06 08 10
Trade Change
-2.0
-1.6
-1.2
-0.8
-0.4
0.0
0.4
90 92 94 96 98 00 02 04 06 08 10
Voice and Accountability Change
-400
0
400
800
1,200
1,600
2,000
90 92 94 96 98 00 02 04 06 08 10
FDI % Change
-30
-20
-10
0
10
20
90 92 94 96 98 00 02 04 06 08 10
Control of Corruption % Change
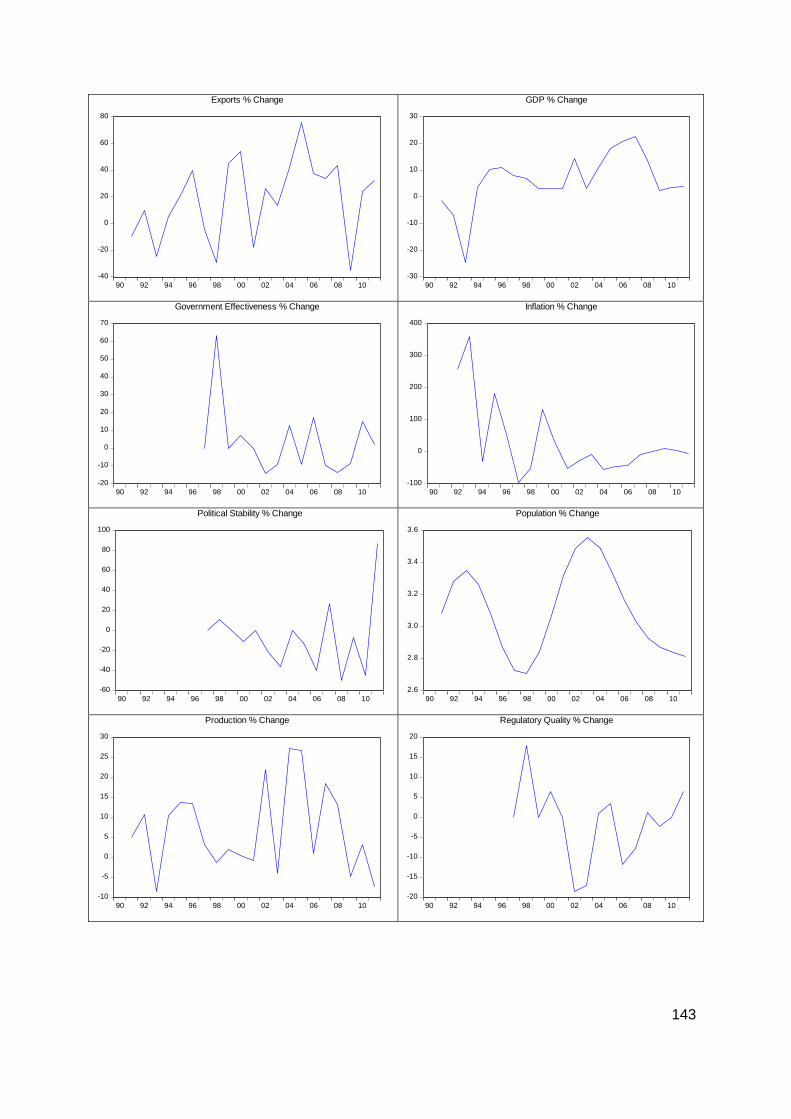
143
-40
-20
0
20
40
60
80
90 92 94 96 98 00 02 04 06 08 10
Exports % Change
-30
-20
-10
0
10
20
30
90 92 94 96 98 00 02 04 06 08 10
GDP % Change
-20
-10
0
10
20
30
40
50
60
70
90 92 94 96 98 00 02 04 06 08 10
Government Effectiveness % Change
-100
0
100
200
300
400
90 92 94 96 98 00 02 04 06 08 10
Inflation % Change
-60
-40
-20
0
20
40
60
80
100
90 92 94 96 98 00 02 04 06 08 10
Political Stability % Change
2.6
2.8
3.0
3.2
3.4
3.6
90 92 94 96 98 00 02 04 06 08 10
Population % Change
-10
-5
0
5
10
15
20
25
30
90 92 94 96 98 00 02 04 06 08 10
Production % Change
-20
-15
-10
-5
0
5
10
15
20
90 92 94 96 98 00 02 04 06 08 10
Regulatory Quality % Change
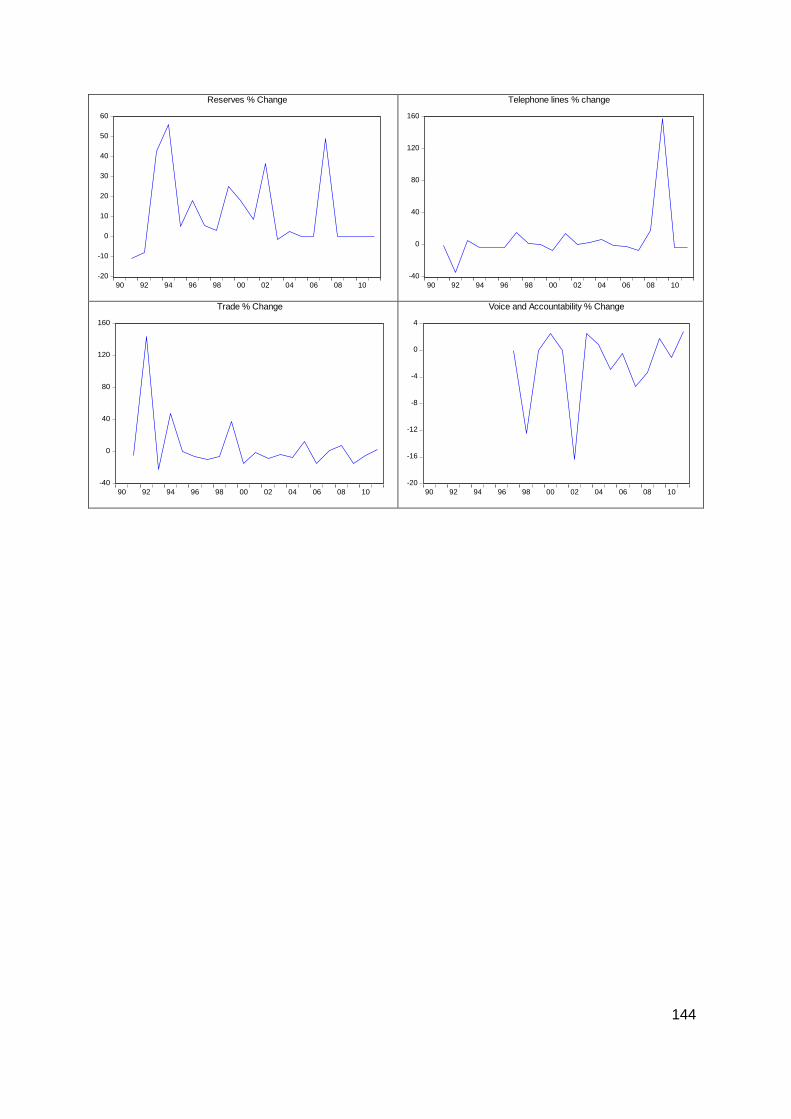
144
-20
-10
0
10
20
30
40
50
60
90 92 94 96 98 00 02 04 06 08 10
Reserves % Change
-40
0
40
80
120
160
90 92 94 96 98 00 02 04 06 08 10
Telephone lines % change
-40
0
40
80
120
160
90 92 94 96 98 00 02 04 06 08 10
Trade % Change
-20
-16
-12
-8
-4
0
4
90 92 94 96 98 00 02 04 06 08 10
Voice and Accountability % Change
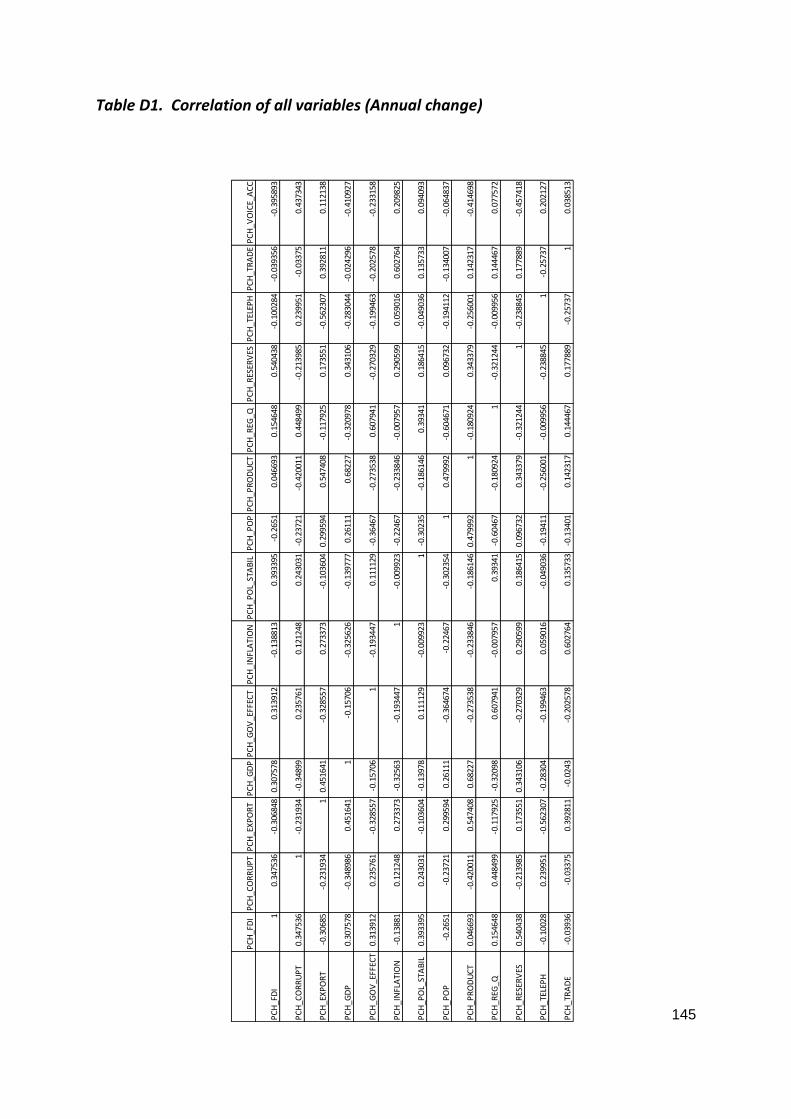
145
Table D1. Correlation of all variables (Annual change)
PC
H_F
DI
PC
H_C
OR
RU
PT
PC
H_E
XP
OR
TP
CH
_GD
PP
CH
_GO
V_E
FFEC
TP
CH
_IN
FLA
TIO
NP
CH
_PO
L_ST
AB
ILP
CH
_PO
PP
CH
_PR
OD
UC
TP
CH
_REG
_QP
CH
_RES
ERV
ESP
CH
_TEL
EPH
PC
H_T
RA
DE
PC
H_V
OIC
E_A
CC
PC
H_F
DI
10.
3475
36-0
.306
848
0.30
7578
0.31
3912
-0.1
3881
30.
3933
95-0
.265
10.
0466
930.
1546
480.
5404
38-0
.100
284
-0.0
3935
6-0
.395
893
PC
H_C
OR
RU
PT
0.34
7536
1-0
.231
934
-0.3
4899
0.23
5761
0.12
1248
0.24
3031
-0.2
3721
-0.4
2001
10.
4484
99-0
.213
985
0.23
9951
-0.0
3375
0.43
7343
PC
H_E
XP
OR
T-0
.306
85-0
.231
934
10.
4516
41-0
.328
557
0.27
3373
-0.1
0360
40.
2995
940.
5474
08-0
.117
925
0.17
3551
-0.5
6230
70.
3928
110.
1121
38
PC
H_G
DP
0.30
7578
-0.3
4898
60.
4516
411
-0.1
5706
-0.3
2562
6-0
.139
777
0.26
111
0.68
227
-0.3
2097
80.
3431
06-0
.283
044
-0.0
2429
6-0
.410
927
PC
H_G
OV
_EFF
ECT
0.31
3912
0.23
5761
-0.3
2855
7-0
.157
061
-0.1
9344
70.
1111
29-0
.364
67-0
.273
538
0.60
7941
-0.2
7032
9-0
.199
463
-0.2
0257
8-0
.233
158
PC
H_I
NFL
ATI
ON
-0.1
3881
0.12
1248
0.27
3373
-0.3
2563
-0.1
9344
71
-0.0
0992
3-0
.224
67-0
.233
846
-0.0
0795
70.
2905
990.
0590
160.
6027
640.
2098
25
PC
H_P
OL_
STA
BIL
0.39
3395
0.24
3031
-0.1
0360
4-0
.139
780.
1111
29-0
.009
923
1-0
.302
35-0
.186
146
0.39
341
0.18
6415
-0.0
4903
60.
1357
330.
0940
93
PC
H_P
OP
-0.2
651
-0.2
3721
0.29
9594
0.26
111
-0.3
6467
4-0
.224
67-0
.302
354
10.
4799
92-0
.604
671
0.09
6732
-0.1
9411
2-0
.134
007
-0.0
6483
7
PC
H_P
RO
DU
CT
0.04
6693
-0.4
2001
10.
5474
080.
6822
7-0
.273
538
-0.2
3384
6-0
.186
146
0.47
9992
1-0
.180
924
0.34
3379
-0.2
5600
10.
1423
17-0
.414
698
PC
H_R
EG_Q
0.15
4648
0.44
8499
-0.1
1792
5-0
.320
980.
6079
41-0
.007
957
0.39
341
-0.6
0467
-0.1
8092
41
-0.3
2124
4-0
.009
956
0.14
4467
0.07
7572
PC
H_R
ESER
VES
0.54
0438
-0.2
1398
50.
1735
510.
3431
06-0
.270
329
0.29
0599
0.18
6415
0.09
6732
0.34
3379
-0.3
2124
41
-0.2
3884
50.
1778
89-0
.457
418
PC
H_T
ELEP
H-0
.100
280.
2399
51-0
.562
307
-0.2
8304
-0.1
9946
30.
0590
16-0
.049
036
-0.1
9411
-0.2
5600
1-0
.009
956
-0.2
3884
51
-0.2
5737
0.20
2127
PC
H_T
RA
DE
-0.0
3936
-0.0
3375
0.39
2811
-0.0
243
-0.2
0257
80.
6027
640.
1357
33-0
.134
010.
1423
170.
1444
670.
1778
89-0
.257
371
0.03
8513
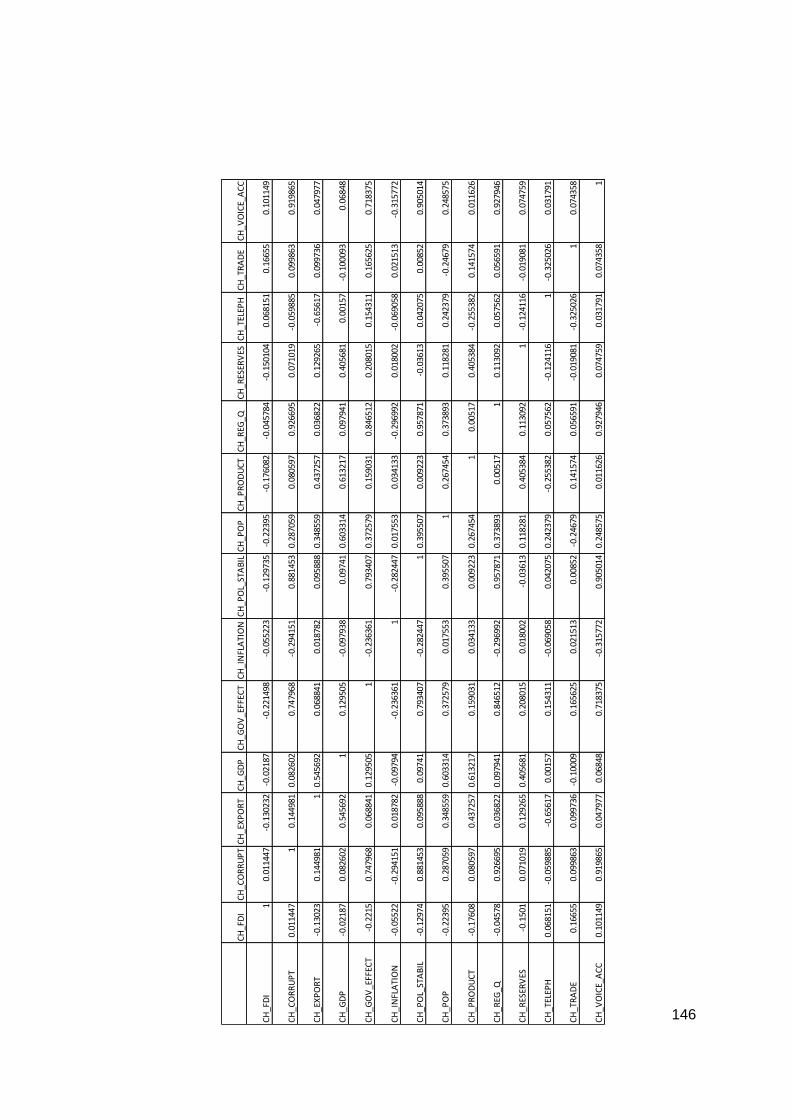
146
CH
_FD
IC
H_C
OR
RU
PT
CH
_EX
PO
RT
CH
_GD
PC
H_G
OV
_EFF
ECT
CH
_IN
FLA
TIO
NC
H_P
OL_
STA
BIL
CH
_PO
PC
H_P
RO
DU
CT
CH
_REG
_QC
H_R
ESER
VES
CH
_TEL
EPH
CH
_TR
AD
EC
H_V
OIC
E_A
CC
CH
_FD
I1
0.01
1447
-0.1
3023
2-0
.021
87-0
.221
498
-0.0
5522
3-0
.129
735
-0.2
2395
-0.1
7608
2-0
.045
784
-0.1
5010
40.
0681
510.
1665
50.
1011
49
CH
_CO
RR
UP
T0.
0114
471
0.14
4981
0.08
2602
0.74
7968
-0.2
9415
10.
8814
530.
2870
590.
0805
970.
9266
950.
0710
19-0
.059
885
0.09
9863
0.91
9865
CH
_EX
PO
RT
-0.1
3023
0.14
4981
10.
5456
920.
0688
410.
0187
820.
0958
880.
3485
590.
4372
570.
0368
220.
1292
65-0
.656
170.
0997
360.
0479
77
CH
_GD
P-0
.021
870.
0826
020.
5456
921
0.12
9505
-0.0
9793
80.
0974
10.
6033
140.
6132
170.
0979
410.
4056
810.
0015
7-0
.100
093
0.06
848
CH
_GO
V_E
FFEC
T-0
.221
50.
7479
680.
0688
410.
1295
051
-0.2
3636
10.
7934
070.
3725
790.
1590
310.
8465
120.
2080
150.
1543
110.
1656
250.
7183
75
CH
_IN
FLA
TIO
N-0
.055
22-0
.294
151
0.01
8782
-0.0
9794
-0.2
3636
11
-0.2
8244
70.
0175
530.
0341
33-0
.296
992
0.01
8002
-0.0
6905
80.
0215
13-0
.315
772
CH
_PO
L_ST
AB
IL-0
.129
740.
8814
530.
0958
880.
0974
10.
7934
07-0
.282
447
10.
3955
070.
0092
230.
9578
71-0
.036
130.
0420
750.
0085
20.
9050
14
CH
_PO
P-0
.223
950.
2870
590.
3485
590.
6033
140.
3725
790.
0175
530.
3955
071
0.26
7454
0.37
3893
0.11
8281
0.24
2379
-0.2
4679
0.24
8575
CH
_PR
OD
UC
T-0
.176
080.
0805
970.
4372
570.
6132
170.
1590
310.
0341
330.
0092
230.
2674
541
0.00
517
0.40
5384
-0.2
5538
20.
1415
740.
0116
26
CH
_REG
_Q-0
.045
780.
9266
950.
0368
220.
0979
410.
8465
12-0
.296
992
0.95
7871
0.37
3893
0.00
517
10.
1130
920.
0575
620.
0565
910.
9279
46
CH
_RES
ERV
ES-0
.150
10.
0710
190.
1292
650.
4056
810.
2080
150.
0180
02-0
.036
130.
1182
810.
4053
840.
1130
921
-0.1
2411
6-0
.019
081
0.07
4759
CH
_TEL
EPH
0.06
8151
-0.0
5988
5-0
.656
170.
0015
70.
1543
11-0
.069
058
0.04
2075
0.24
2379
-0.2
5538
20.
0575
62-0
.124
116
1-0
.325
026
0.03
1791
CH
_TR
AD
E0.
1665
50.
0998
630.
0997
36-0
.100
090.
1656
250.
0215
130.
0085
2-0
.246
790.
1415
740.
0565
91-0
.019
081
-0.3
2502
61
0.07
4358
CH
_VO
ICE_
AC
C0.
1011
490.
9198
650.
0479
770.
0684
80.
7183
75-0
.315
772
0.90
5014
0.24
8575
0.01
1626
0.92
7946
0.07
4759
0.03
1791
0.07
4358
1
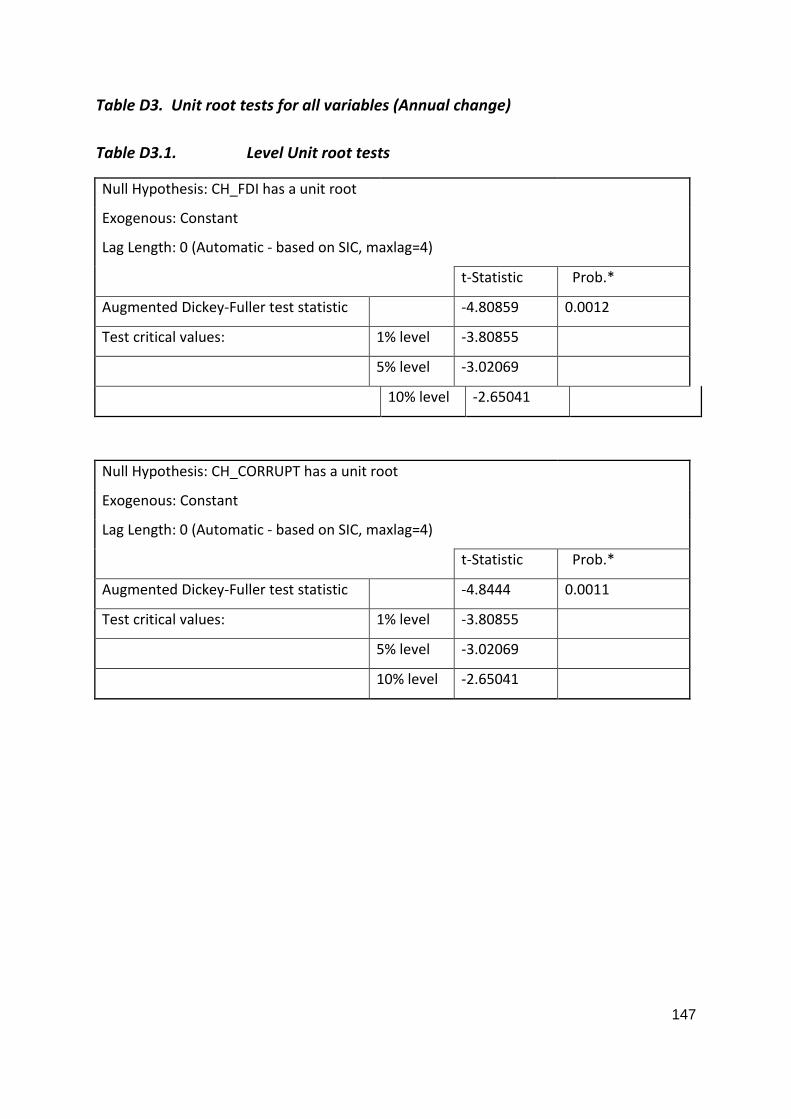
147
Table D3. Unit root tests for all variables (Annual change)
Table D3.1. Level Unit root tests
Null Hypothesis: CH_FDI has a unit root
Exogenous: Constant
Lag Length: 0 (Automatic - based on SIC, maxlag=4)
t-Statistic Prob.*
Augmented Dickey-Fuller test statistic -4.80859 0.0012
Test critical values: 1% level -3.80855
5% level -3.02069
10% level -2.65041
Null Hypothesis: CH_CORRUPT has a unit root
Exogenous: Constant
Lag Length: 0 (Automatic - based on SIC, maxlag=4)
t-Statistic Prob.*
Augmented Dickey-Fuller test statistic -4.8444 0.0011
Test critical values: 1% level -3.80855
5% level -3.02069
10% level -2.65041
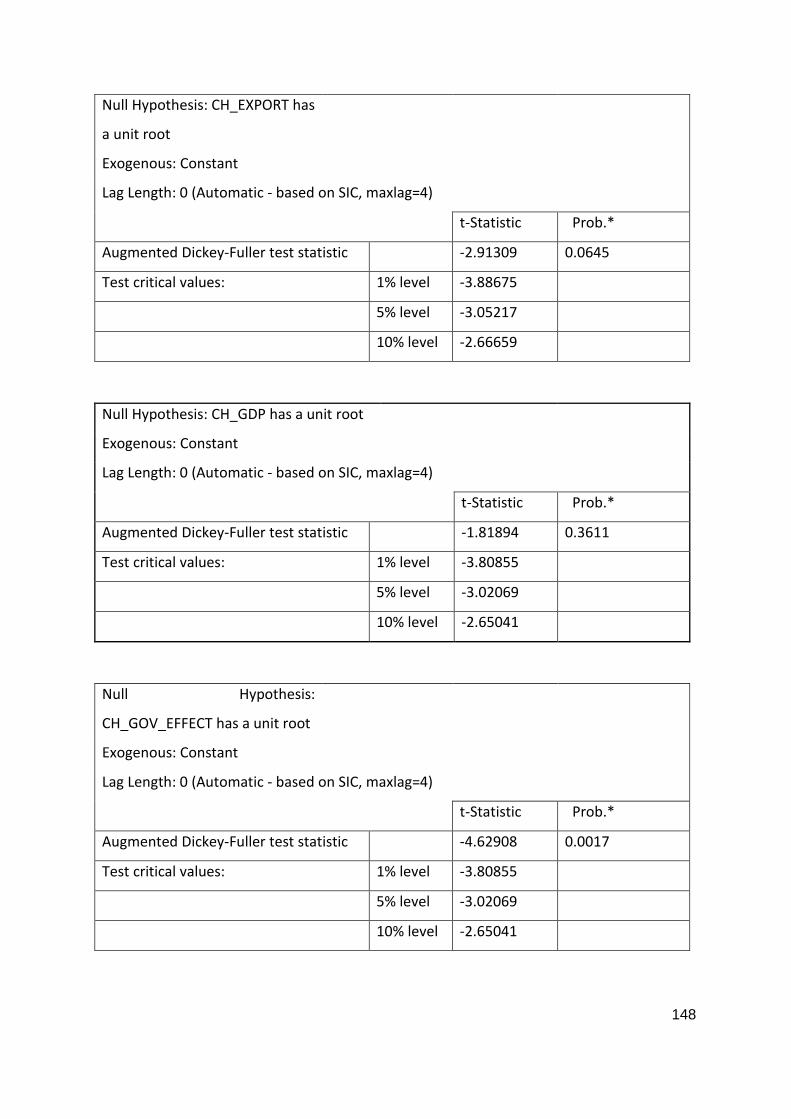
148
Null Hypothesis: CH_EXPORT has
a unit root
Exogenous: Constant
Lag Length: 0 (Automatic - based on SIC, maxlag=4)
t-Statistic Prob.*
Augmented Dickey-Fuller test statistic -2.91309 0.0645
Test critical values: 1% level -3.88675
5% level -3.05217
10% level -2.66659
Null Hypothesis: CH_GDP has a unit root
Exogenous: Constant
Lag Length: 0 (Automatic - based on SIC, maxlag=4)
t-Statistic Prob.*
Augmented Dickey-Fuller test statistic -1.81894 0.3611
Test critical values: 1% level -3.80855
5% level -3.02069
10% level -2.65041
Null Hypothesis:
CH_GOV_EFFECT has a unit root
Exogenous: Constant
Lag Length: 0 (Automatic - based on SIC, maxlag=4)
t-Statistic Prob.*
Augmented Dickey-Fuller test statistic -4.62908 0.0017
Test critical values: 1% level -3.80855
5% level -3.02069
10% level -2.65041

149
Null Hypothesis: CH_INFLATION has a unit root
Exogenous: Constant
Lag Length: 0 (Automatic - based on SIC, maxlag=4)
t-Statistic Prob.*
Augmented Dickey-Fuller test statistic -4.2951 0.0038
Test critical values: 1% level -3.83151
5% level -3.02997
10% level -2.65519
Null Hypothesis: CH_POL_STABIL has a unit root
Exogenous: Constant
Lag Length: 0 (Automatic - based on SIC, maxlag=4)
t-Statistic Prob.*
Augmented Dickey-Fuller test statistic -4.07768 0.0056
Test critical values: 1% level -3.80855
5% level -3.02069
10% level -2.65041
Null Hypothesis: CH_POP has a unit root
Exogenous: Constant
Lag Length: 0 (Automatic - based on SIC, maxlag=4)
t-Statistic Prob.*
Augmented Dickey-Fuller test statistic -1.45606 0.532
Test critical values: 1% level -3.85739
5% level -3.04039
10% level -2.66055
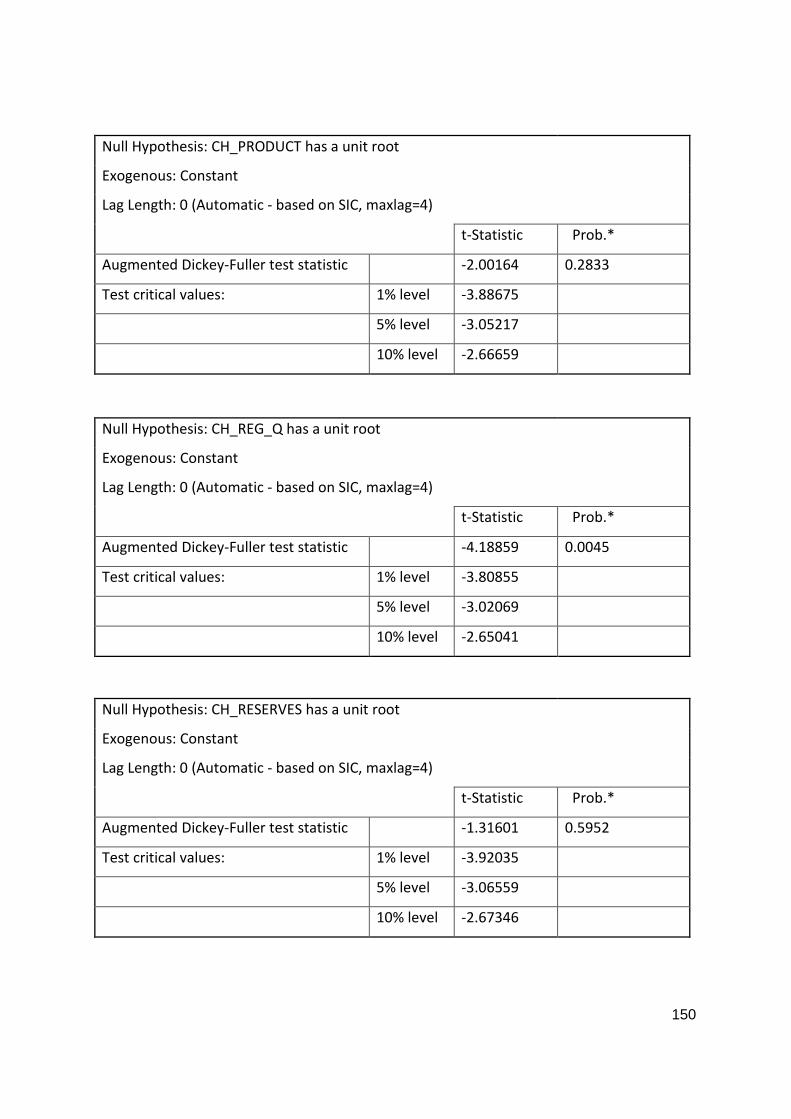
150
Null Hypothesis: CH_PRODUCT has a unit root
Exogenous: Constant
Lag Length: 0 (Automatic - based on SIC, maxlag=4)
t-Statistic Prob.*
Augmented Dickey-Fuller test statistic -2.00164 0.2833
Test critical values: 1% level -3.88675
5% level -3.05217
10% level -2.66659
Null Hypothesis: CH_REG_Q has a unit root
Exogenous: Constant
Lag Length: 0 (Automatic - based on SIC, maxlag=4)
t-Statistic Prob.*
Augmented Dickey-Fuller test statistic -4.18859 0.0045
Test critical values: 1% level -3.80855
5% level -3.02069
10% level -2.65041
Null Hypothesis: CH_RESERVES has a unit root
Exogenous: Constant
Lag Length: 0 (Automatic - based on SIC, maxlag=4)
t-Statistic Prob.*
Augmented Dickey-Fuller test statistic -1.31601 0.5952
Test critical values: 1% level -3.92035
5% level -3.06559
10% level -2.67346
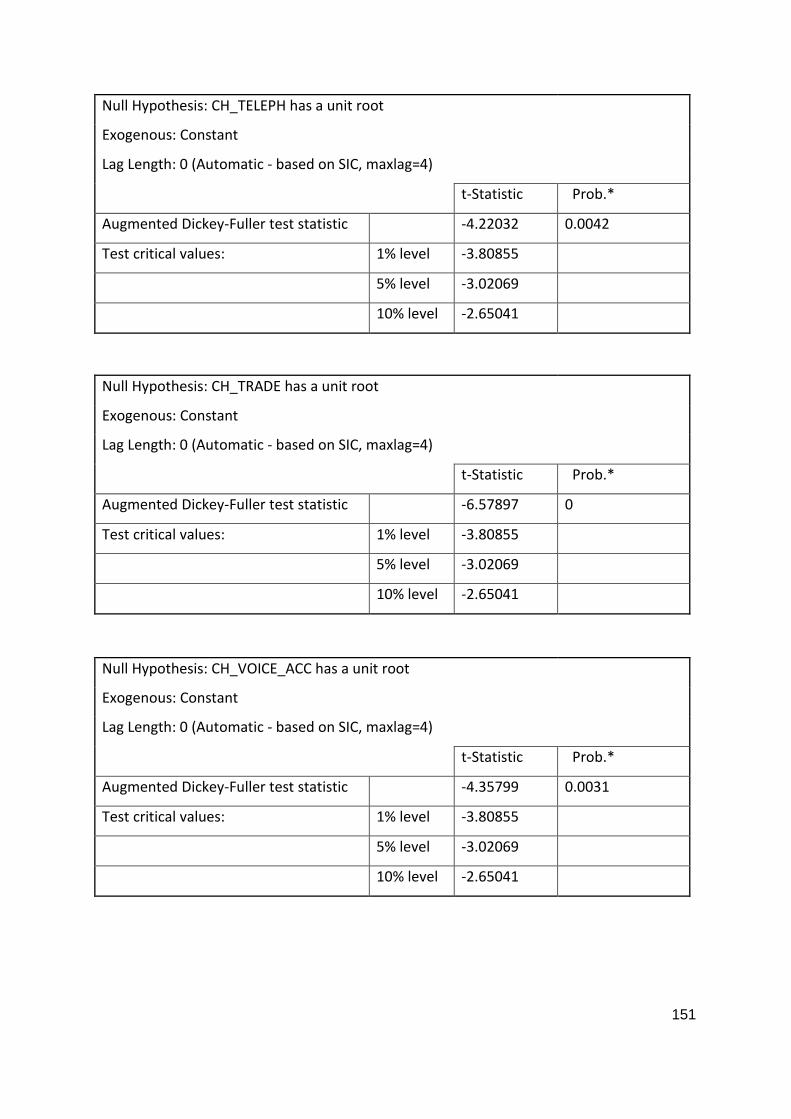
151
Null Hypothesis: CH_TELEPH has a unit root
Exogenous: Constant
Lag Length: 0 (Automatic - based on SIC, maxlag=4)
t-Statistic Prob.*
Augmented Dickey-Fuller test statistic -4.22032 0.0042
Test critical values: 1% level -3.80855
5% level -3.02069
10% level -2.65041
Null Hypothesis: CH_TRADE has a unit root
Exogenous: Constant
Lag Length: 0 (Automatic - based on SIC, maxlag=4)
t-Statistic Prob.*
Augmented Dickey-Fuller test statistic -6.57897 0
Test critical values: 1% level -3.80855
5% level -3.02069
10% level -2.65041
Null Hypothesis: CH_VOICE_ACC has a unit root
Exogenous: Constant
Lag Length: 0 (Automatic - based on SIC, maxlag=4)
t-Statistic Prob.*
Augmented Dickey-Fuller test statistic -4.35799 0.0031
Test critical values: 1% level -3.80855
5% level -3.02069
10% level -2.65041
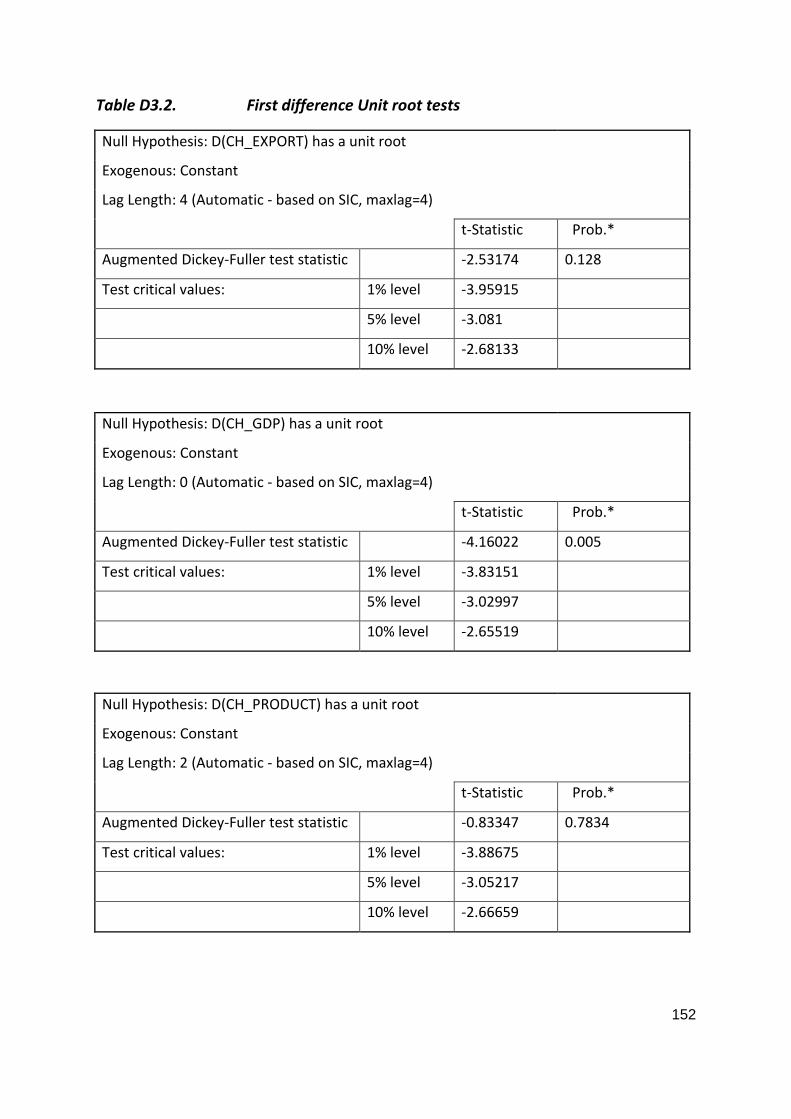
152
Table D3.2. First difference Unit root tests
Null Hypothesis: D(CH_EXPORT) has a unit root
Exogenous: Constant
Lag Length: 4 (Automatic - based on SIC, maxlag=4)
t-Statistic Prob.*
Augmented Dickey-Fuller test statistic -2.53174 0.128
Test critical values: 1% level -3.95915
5% level -3.081
10% level -2.68133
Null Hypothesis: D(CH_GDP) has a unit root
Exogenous: Constant
Lag Length: 0 (Automatic - based on SIC, maxlag=4)
t-Statistic Prob.*
Augmented Dickey-Fuller test statistic -4.16022 0.005
Test critical values: 1% level -3.83151
5% level -3.02997
10% level -2.65519
Null Hypothesis: D(CH_PRODUCT) has a unit root
Exogenous: Constant
Lag Length: 2 (Automatic - based on SIC, maxlag=4)
t-Statistic Prob.*
Augmented Dickey-Fuller test statistic -0.83347 0.7834
Test critical values: 1% level -3.88675
5% level -3.05217
10% level -2.66659
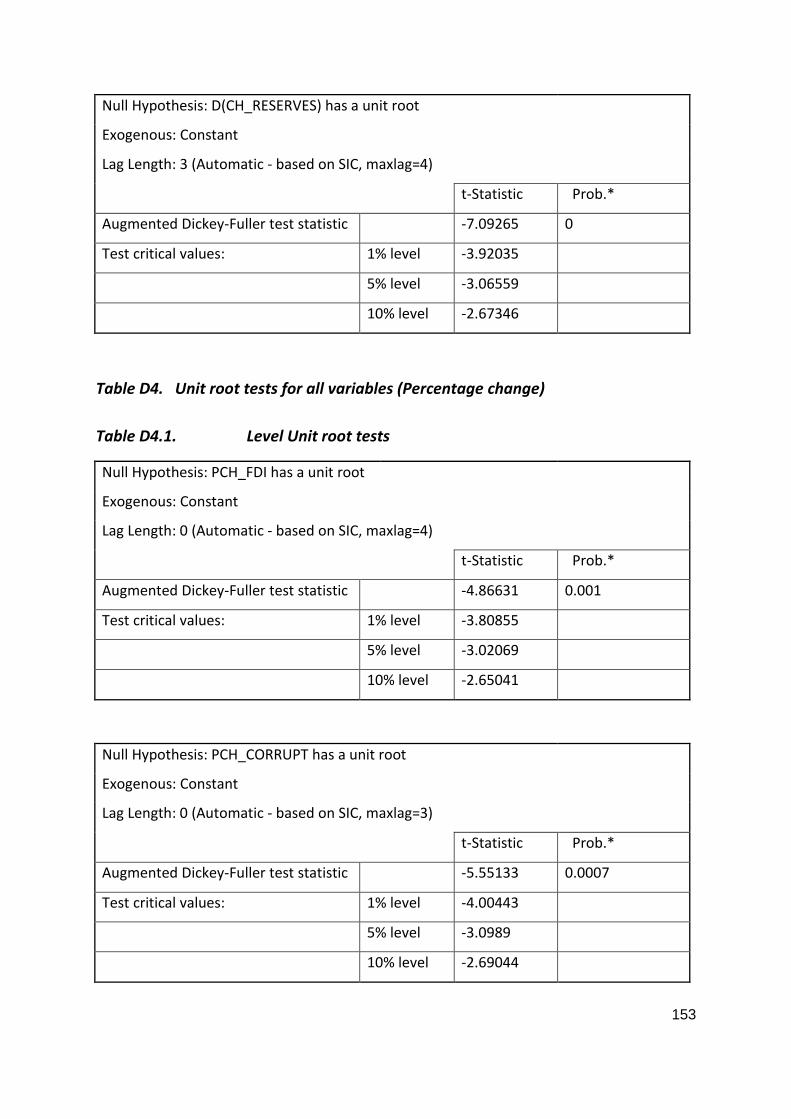
153
Null Hypothesis: D(CH_RESERVES) has a unit root
Exogenous: Constant
Lag Length: 3 (Automatic - based on SIC, maxlag=4)
t-Statistic Prob.*
Augmented Dickey-Fuller test statistic -7.09265 0
Test critical values: 1% level -3.92035
5% level -3.06559
10% level -2.67346
Table D4. Unit root tests for all variables (Percentage change)
Table D4.1. Level Unit root tests
Null Hypothesis: PCH_FDI has a unit root
Exogenous: Constant
Lag Length: 0 (Automatic - based on SIC, maxlag=4)
t-Statistic Prob.*
Augmented Dickey-Fuller test statistic -4.86631 0.001
Test critical values: 1% level -3.80855
5% level -3.02069
10% level -2.65041
Null Hypothesis: PCH_CORRUPT has a unit root
Exogenous: Constant
Lag Length: 0 (Automatic - based on SIC, maxlag=3)
t-Statistic Prob.*
Augmented Dickey-Fuller test statistic -5.55133 0.0007
Test critical values: 1% level -4.00443
5% level -3.0989
10% level -2.69044
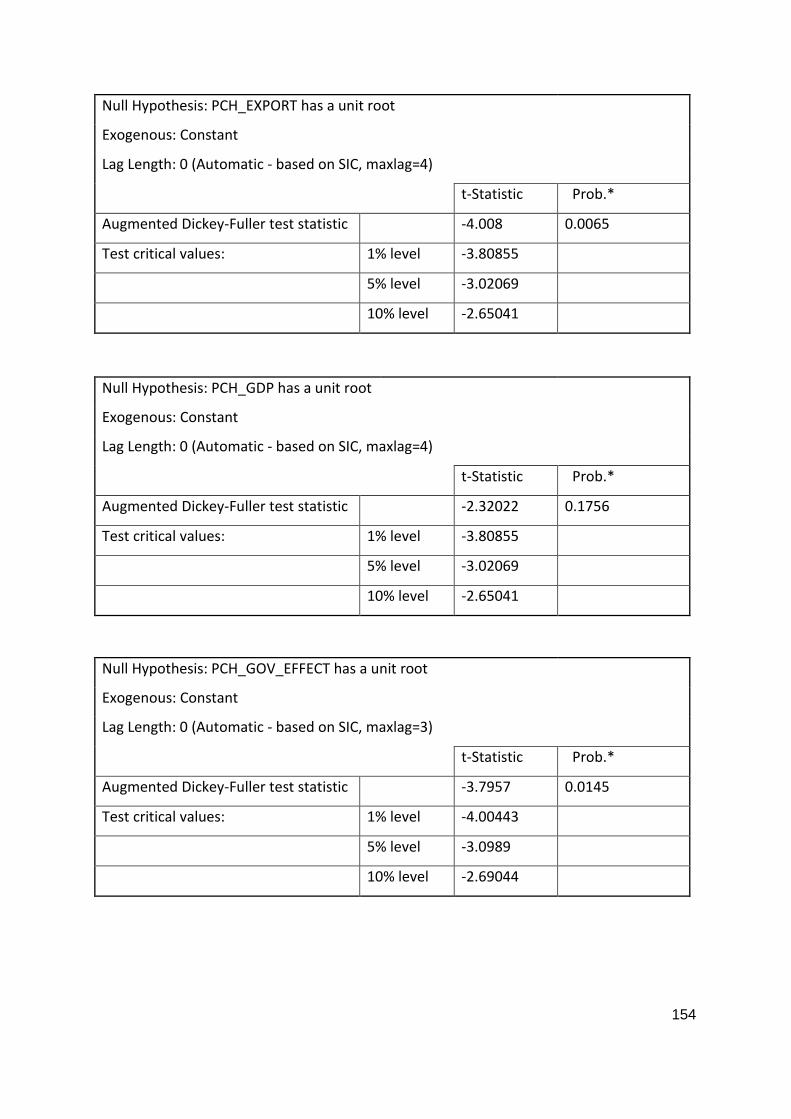
154
Null Hypothesis: PCH_EXPORT has a unit root
Exogenous: Constant
Lag Length: 0 (Automatic - based on SIC, maxlag=4)
t-Statistic Prob.*
Augmented Dickey-Fuller test statistic -4.008 0.0065
Test critical values: 1% level -3.80855
5% level -3.02069
10% level -2.65041
Null Hypothesis: PCH_GDP has a unit root
Exogenous: Constant
Lag Length: 0 (Automatic - based on SIC, maxlag=4)
t-Statistic Prob.*
Augmented Dickey-Fuller test statistic -2.32022 0.1756
Test critical values: 1% level -3.80855
5% level -3.02069
10% level -2.65041
Null Hypothesis: PCH_GOV_EFFECT has a unit root
Exogenous: Constant
Lag Length: 0 (Automatic - based on SIC, maxlag=3)
t-Statistic Prob.*
Augmented Dickey-Fuller test statistic -3.7957 0.0145
Test critical values: 1% level -4.00443
5% level -3.0989
10% level -2.69044

155
Null Hypothesis: PCH_INFLATION has a unit root
Exogenous: Constant
Lag Length: 1 (Automatic - based on SIC, maxlag=4)
t-Statistic Prob.*
Augmented Dickey-Fuller test statistic -5.24196 0.0006
Test critical values: 1% level -3.85739
5% level -3.04039
10% level -2.66055
Null Hypothesis: PCH_POL_STABIL has a unit root
Exogenous: Constant
Lag Length: 3 (Automatic - based on SIC, maxlag=3)
t-Statistic Prob.*
Augmented Dickey-Fuller test statistic -2.25728 0.1995
Test critical values: 1% level -4.20006
5% level -3.17535
10% level -2.72899
Null Hypothesis: PCH_POP has a unit root
Exogenous: Constant
Lag Length: 4 (Automatic - based on SIC, maxlag=4)
t-Statistic Prob.*
Augmented Dickey-Fuller test statistic -1.67183 0.4256
Test critical values: 1% level -3.92035
5% level -3.06559
10% level -2.67346
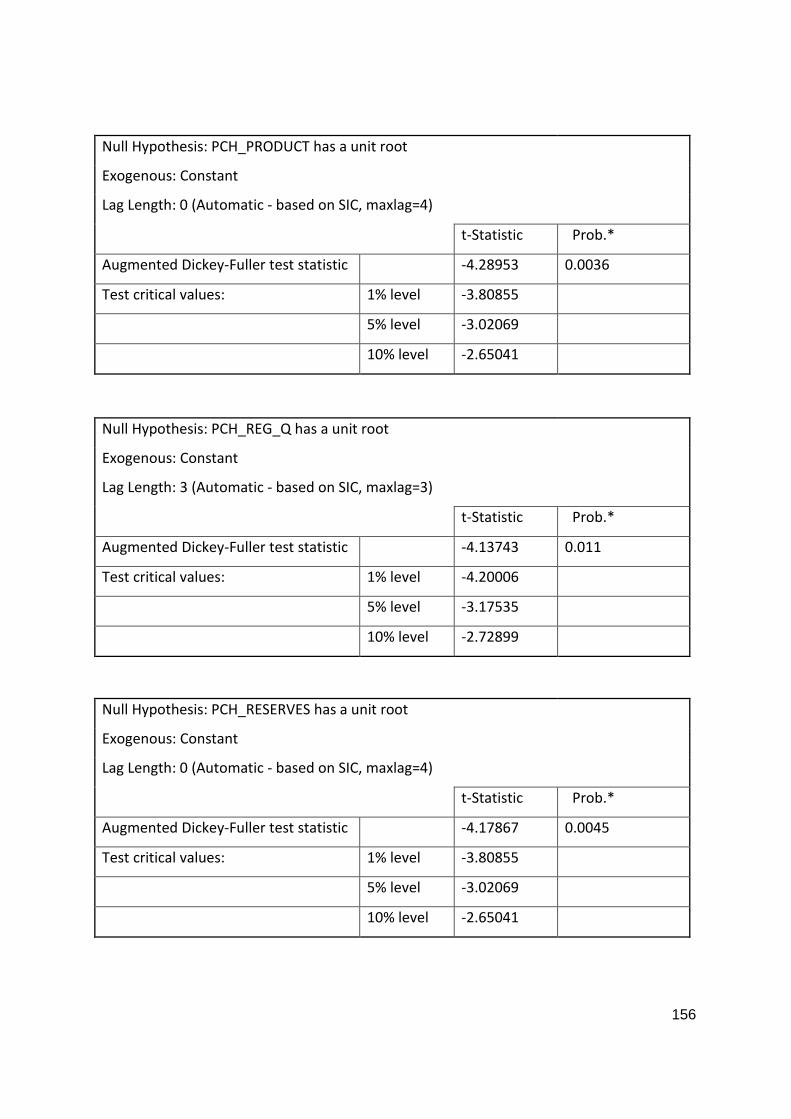
156
Null Hypothesis: PCH_PRODUCT has a unit root
Exogenous: Constant
Lag Length: 0 (Automatic - based on SIC, maxlag=4)
t-Statistic Prob.*
Augmented Dickey-Fuller test statistic -4.28953 0.0036
Test critical values: 1% level -3.80855
5% level -3.02069
10% level -2.65041
Null Hypothesis: PCH_REG_Q has a unit root
Exogenous: Constant
Lag Length: 3 (Automatic - based on SIC, maxlag=3)
t-Statistic Prob.*
Augmented Dickey-Fuller test statistic -4.13743 0.011
Test critical values: 1% level -4.20006
5% level -3.17535
10% level -2.72899
Null Hypothesis: PCH_RESERVES has a unit root
Exogenous: Constant
Lag Length: 0 (Automatic - based on SIC, maxlag=4)
t-Statistic Prob.*
Augmented Dickey-Fuller test statistic -4.17867 0.0045
Test critical values: 1% level -3.80855
5% level -3.02069
10% level -2.65041

157
Null Hypothesis: PCH_TELEPH has a unit root
Exogenous: Constant
Lag Length: 0 (Automatic - based on SIC, maxlag=4)
t-Statistic Prob.*
Augmented Dickey-Fuller test statistic -4.1189 0.0052
Test critical values: 1% level -3.80855
5% level -3.02069
10% level -2.65041
Null Hypothesis: PCH_TRADE has a unit root
Exogenous: Constant
Lag Length: 0 (Automatic - based on SIC, maxlag=4)
t-Statistic Prob.*
Augmented Dickey-Fuller test statistic -5.58562 0.0002
Test critical values: 1% level -3.80855
5% level -3.02069
10% level -2.65041
Null Hypothesis: PCH_VOICE_ACC has a unit root
Exogenous: Constant
Lag Length: 0 (Automatic - based on SIC, maxlag=3)
t-Statistic Prob.*
Augmented Dickey-Fuller test statistic -4.43332 0.0047
Test critical values: 1% level -4.00443
5% level -3.0989
10% level -2.69044
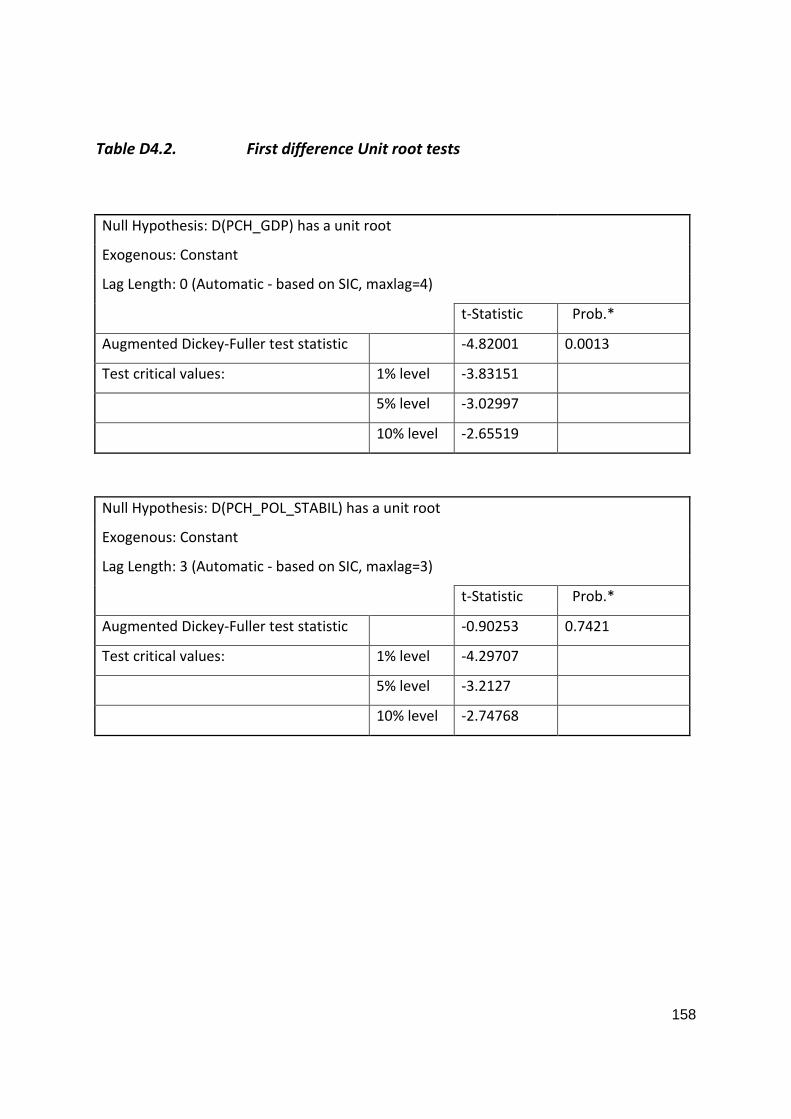
158
Table D4.2. First difference Unit root tests
Null Hypothesis: D(PCH_GDP) has a unit root
Exogenous: Constant
Lag Length: 0 (Automatic - based on SIC, maxlag=4)
t-Statistic Prob.*
Augmented Dickey-Fuller test statistic -4.82001 0.0013
Test critical values: 1% level -3.83151
5% level -3.02997
10% level -2.65519
Null Hypothesis: D(PCH_POL_STABIL) has a unit root
Exogenous: Constant
Lag Length: 3 (Automatic - based on SIC, maxlag=3)
t-Statistic Prob.*
Augmented Dickey-Fuller test statistic -0.90253 0.7421
Test critical values: 1% level -4.29707
5% level -3.2127
10% level -2.74768

159
Null Hypothesis: D(PCH_POP) has a unit root
Exogenous: Constant
Lag Length: 3 (Automatic - based on SIC, maxlag=4)
t-Statistic Prob.*
Augmented Dickey-Fuller test statistic -0.36374 0.894
Test critical values: 1% level -3.92035
5% level -3.06559
10% level -2.67346
Figure D4. Cusum test
-10.0
-7.5
-5.0
-2.5
0.0
2.5
5.0
7.5
10.0
01 02 03 04 05 06 07 08 09 10 11
CUSUM 5% Significance
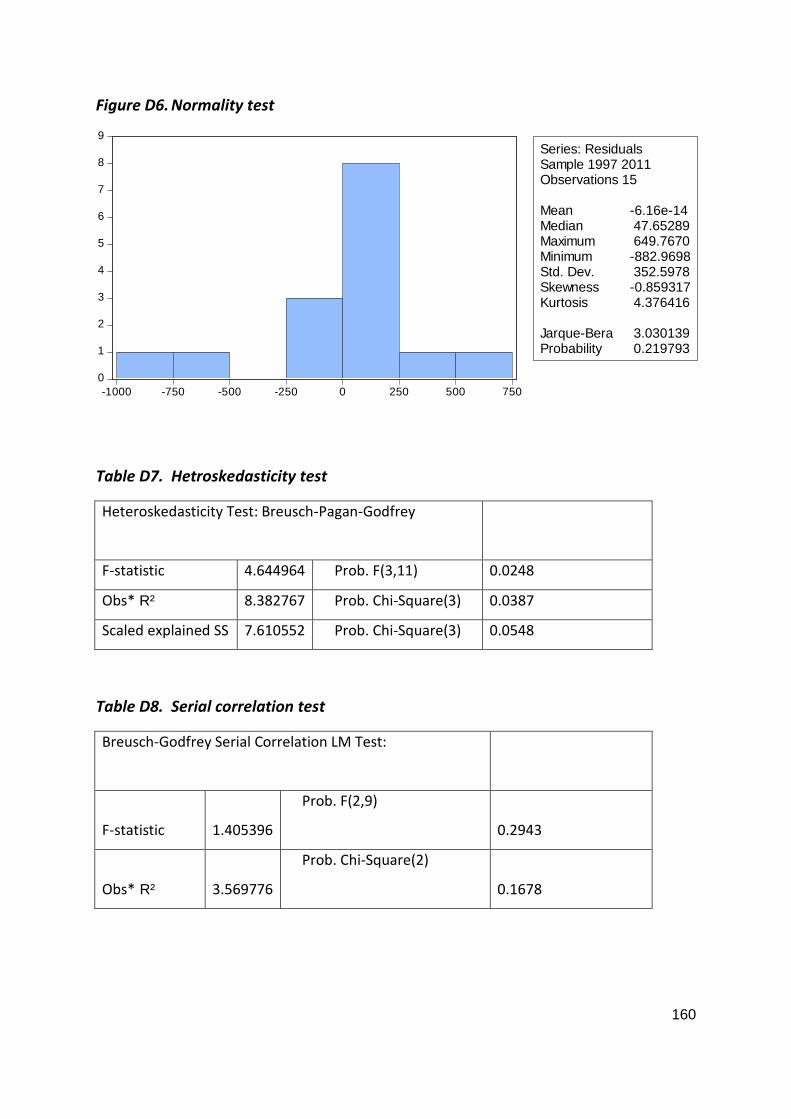
160
Figure D6. Normality test
Table D7. Hetroskedasticity test
Heteroskedasticity Test: Breusch-Pagan-Godfrey
F-statistic 4.644964 Prob. F(3,11) 0.0248
Obs* R² 8.382767 Prob. Chi-Square(3) 0.0387
Scaled explained SS 7.610552 Prob. Chi-Square(3) 0.0548
Table D8. Serial correlation test
Breusch-Godfrey Serial Correlation LM Test:
F-statistic 1.405396
Prob. F(2,9)
0.2943
Obs* R² 3.569776
Prob. Chi-Square(2)
0.1678
0
1
2
3
4
5
6
7
8
9
-1000 -750 -500 -250 0 250 500 750
Series: ResidualsSample 1997 2011Observations 15
Mean -6.16e-14Median 47.65289Maximum 649.7670Minimum -882.9698Std. Dev. 352.5978Skewness -0.859317Kurtosis 4.376416
Jarque-Bera 3.030139Probability 0.219793
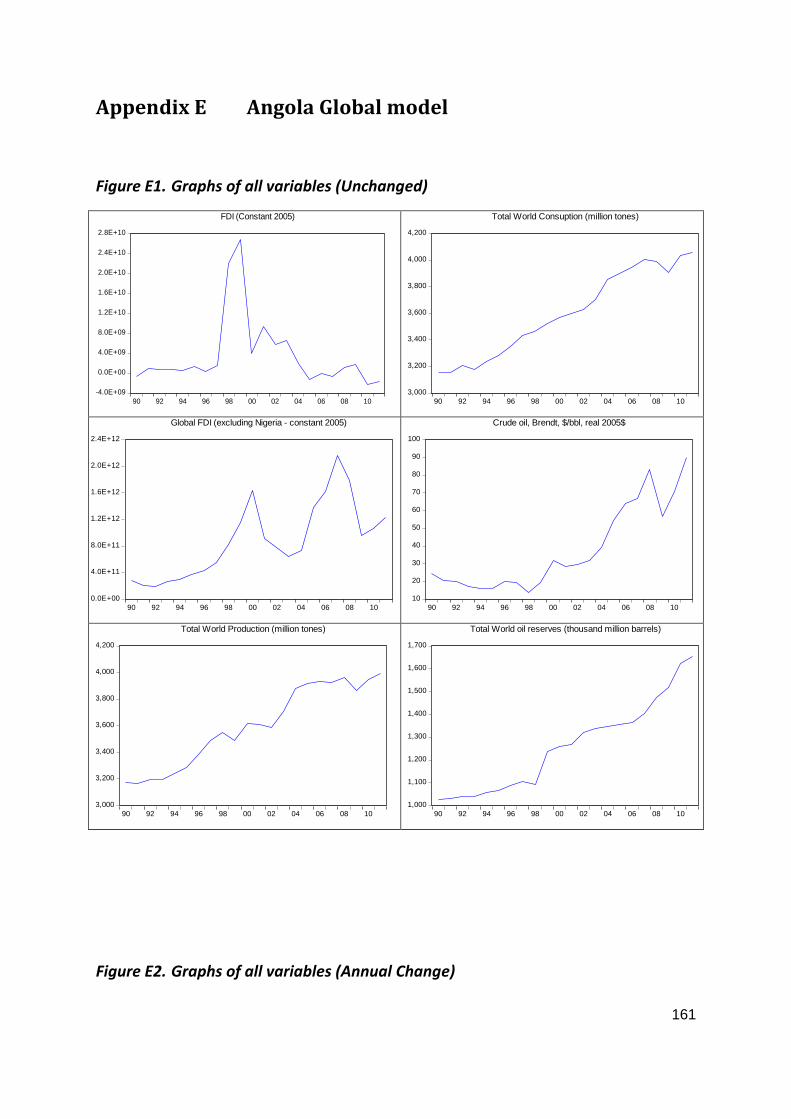
161
Appendix E Angola Global model
Figure E1. Graphs of all variables (Unchanged)
Figure E2. Graphs of all variables (Annual Change)
-4.0E+09
0.0E+00
4.0E+09
8.0E+09
1.2E+10
1.6E+10
2.0E+10
2.4E+10
2.8E+10
90 92 94 96 98 00 02 04 06 08 10
FDI (Constant 2005)
3,000
3,200
3,400
3,600
3,800
4,000
4,200
90 92 94 96 98 00 02 04 06 08 10
Total World Consuption (million tones)
0.0E+00
4.0E+11
8.0E+11
1.2E+12
1.6E+12
2.0E+12
2.4E+12
90 92 94 96 98 00 02 04 06 08 10
Global FDI (excluding Nigeria - constant 2005)
10
20
30
40
50
60
70
80
90
100
90 92 94 96 98 00 02 04 06 08 10
Crude oil, Brendt, $/bbl, real 2005$
3,000
3,200
3,400
3,600
3,800
4,000
4,200
90 92 94 96 98 00 02 04 06 08 10
Total World Production (million tones)
1,000
1,100
1,200
1,300
1,400
1,500
1,600
1,700
90 92 94 96 98 00 02 04 06 08 10
Total World oil reserves (thousand million barrels)
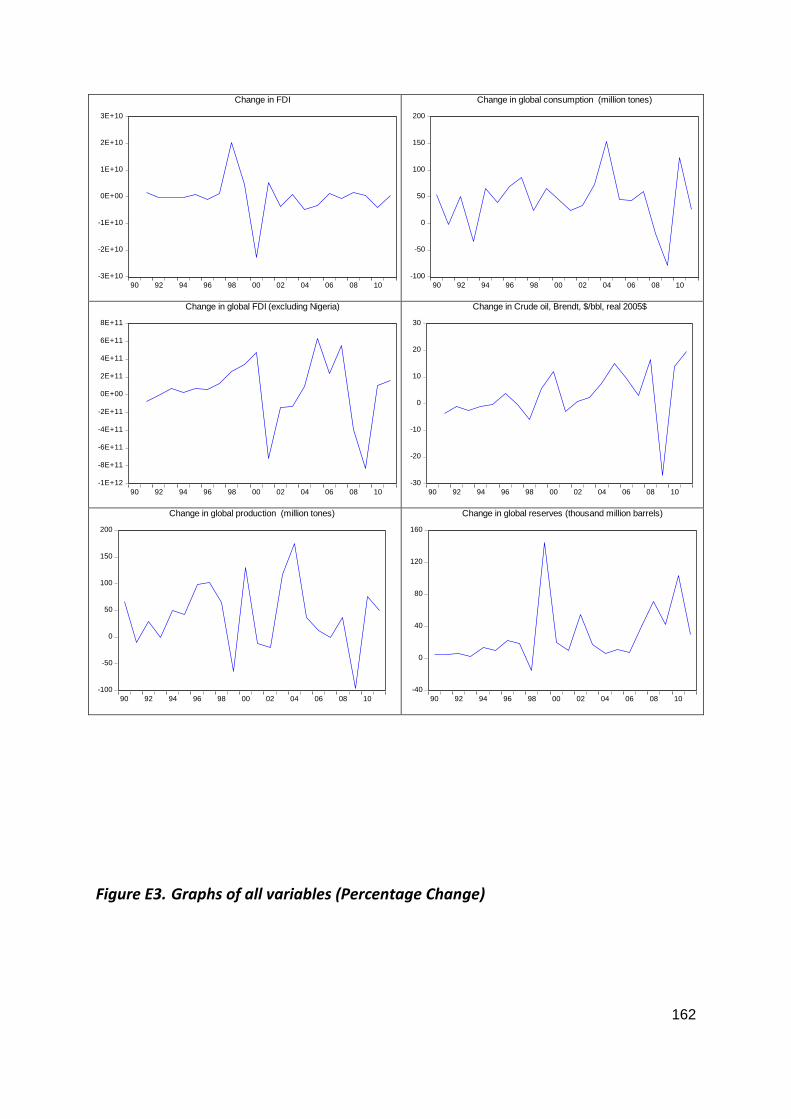
162
Figure E3. Graphs of all variables (Percentage Change)
-3E+10
-2E+10
-1E+10
0E+00
1E+10
2E+10
3E+10
90 92 94 96 98 00 02 04 06 08 10
Change in FDI
-100
-50
0
50
100
150
200
90 92 94 96 98 00 02 04 06 08 10
Change in global consumption (million tones)
-1E+12
-8E+11
-6E+11
-4E+11
-2E+11
0E+00
2E+11
4E+11
6E+11
8E+11
90 92 94 96 98 00 02 04 06 08 10
Change in global FDI (excluding Nigeria)
-30
-20
-10
0
10
20
30
90 92 94 96 98 00 02 04 06 08 10
Change in Crude oil, Brendt, $/bbl, real 2005$
-100
-50
0
50
100
150
200
90 92 94 96 98 00 02 04 06 08 10
Change in global production (million tones)
-40
0
40
80
120
160
90 92 94 96 98 00 02 04 06 08 10
Change in global reserves (thousand million barrels)
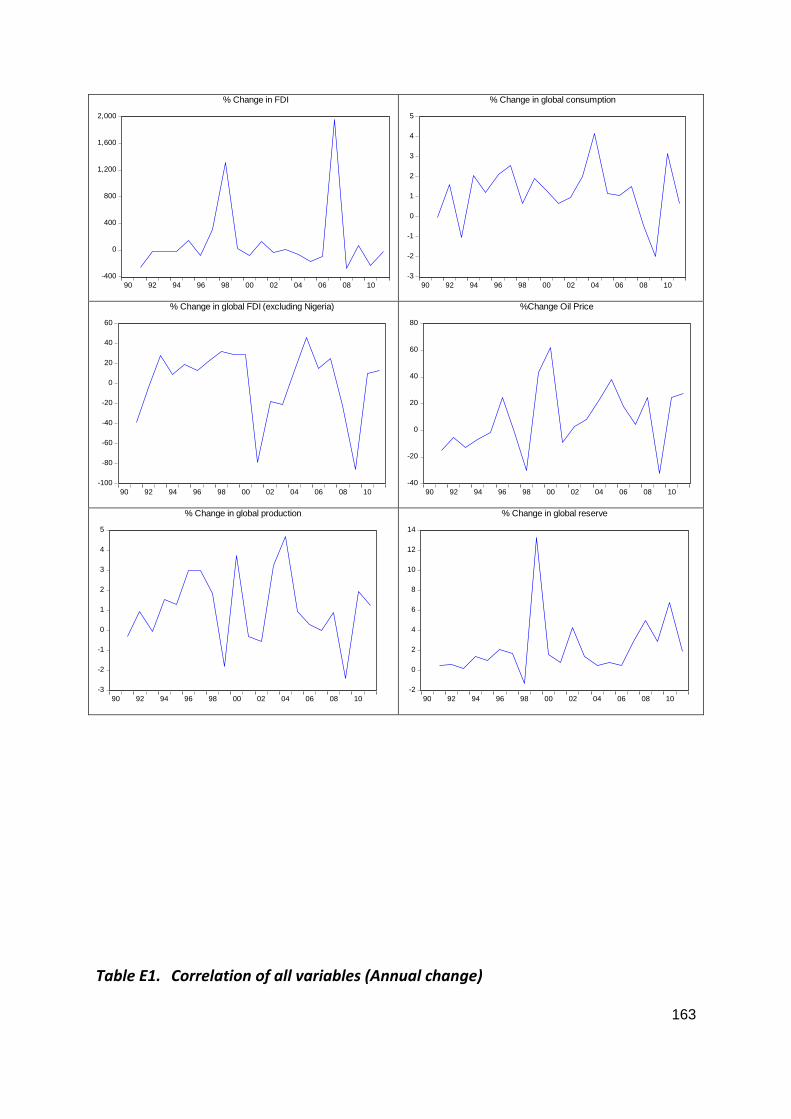
163
Table E1. Correlation of all variables (Annual change)
-400
0
400
800
1,200
1,600
2,000
90 92 94 96 98 00 02 04 06 08 10
% Change in FDI
-3
-2
-1
0
1
2
3
4
5
90 92 94 96 98 00 02 04 06 08 10
% Change in global consumption
-100
-80
-60
-40
-20
0
20
40
60
90 92 94 96 98 00 02 04 06 08 10
% Change in global FDI (excluding Nigeria)
-40
-20
0
20
40
60
80
90 92 94 96 98 00 02 04 06 08 10
%Change Oil Price
-3
-2
-1
0
1
2
3
4
5
90 92 94 96 98 00 02 04 06 08 10
% Change in global production
-2
0
2
4
6
8
10
12
14
90 92 94 96 98 00 02 04 06 08 10
% Change in global reserve
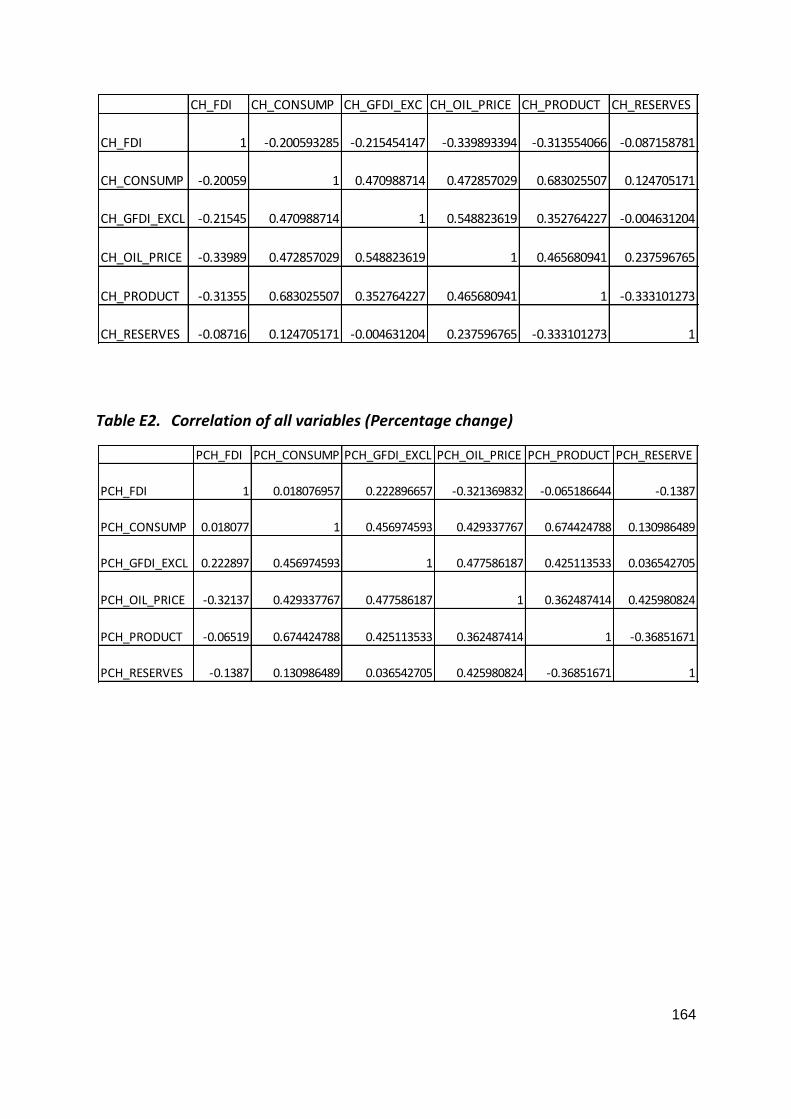
164
Table E2. Correlation of all variables (Percentage change)
CH_FDI CH_CONSUMP CH_GFDI_EXC CH_OIL_PRICE CH_PRODUCT CH_RESERVES
CH_FDI 1 -0.200593285 -0.215454147 -0.339893394 -0.313554066 -0.087158781
CH_CONSUMP -0.20059 1 0.470988714 0.472857029 0.683025507 0.124705171
CH_GFDI_EXCL -0.21545 0.470988714 1 0.548823619 0.352764227 -0.004631204
CH_OIL_PRICE -0.33989 0.472857029 0.548823619 1 0.465680941 0.237596765
CH_PRODUCT -0.31355 0.683025507 0.352764227 0.465680941 1 -0.333101273
CH_RESERVES -0.08716 0.124705171 -0.004631204 0.237596765 -0.333101273 1
PCH_FDI PCH_CONSUMP PCH_GFDI_EXCL PCH_OIL_PRICE PCH_PRODUCT PCH_RESERVE
PCH_FDI 1 0.018076957 0.222896657 -0.321369832 -0.065186644 -0.1387
PCH_CONSUMP 0.018077 1 0.456974593 0.429337767 0.674424788 0.130986489
PCH_GFDI_EXCL 0.222897 0.456974593 1 0.477586187 0.425113533 0.036542705
PCH_OIL_PRICE -0.32137 0.429337767 0.477586187 1 0.362487414 0.425980824
PCH_PRODUCT -0.06519 0.674424788 0.425113533 0.362487414 1 -0.36851671
PCH_RESERVES -0.1387 0.130986489 0.036542705 0.425980824 -0.36851671 1
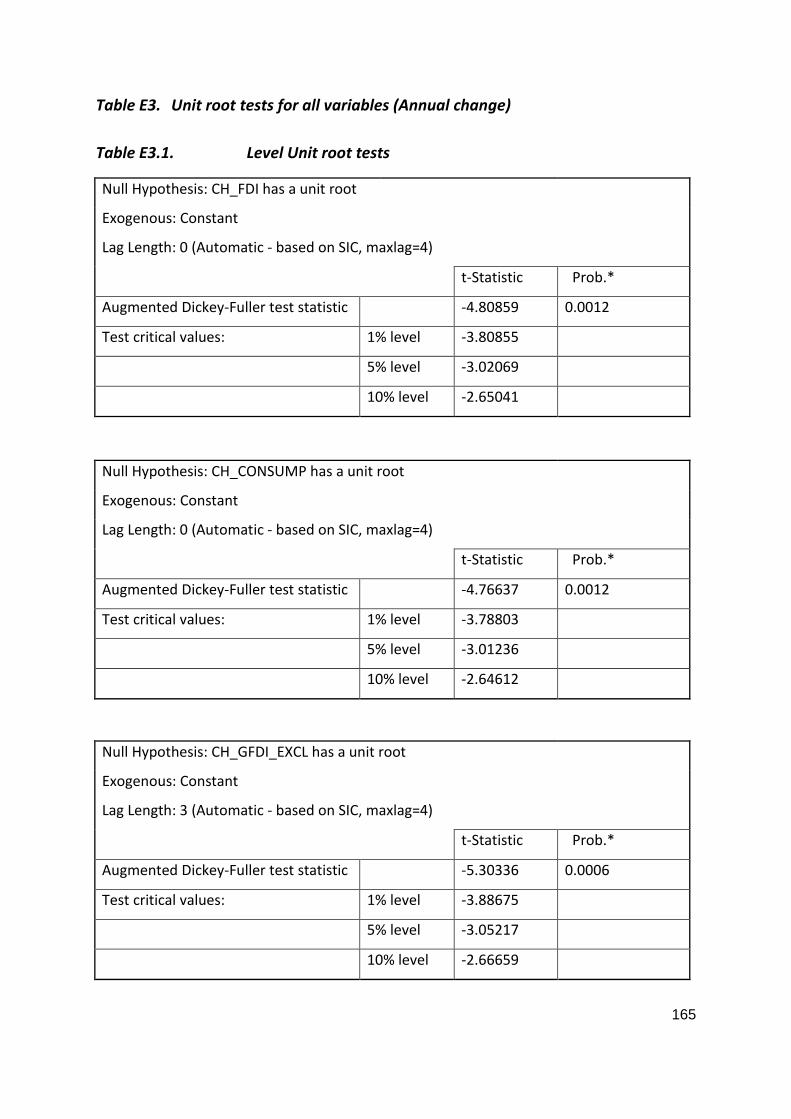
165
Table E3. Unit root tests for all variables (Annual change)
Table E3.1. Level Unit root tests
Null Hypothesis: CH_FDI has a unit root
Exogenous: Constant
Lag Length: 0 (Automatic - based on SIC, maxlag=4)
t-Statistic Prob.*
Augmented Dickey-Fuller test statistic -4.80859 0.0012
Test critical values: 1% level -3.80855
5% level -3.02069
10% level -2.65041
Null Hypothesis: CH_CONSUMP has a unit root
Exogenous: Constant
Lag Length: 0 (Automatic - based on SIC, maxlag=4)
t-Statistic Prob.*
Augmented Dickey-Fuller test statistic -4.76637 0.0012
Test critical values: 1% level -3.78803
5% level -3.01236
10% level -2.64612
Null Hypothesis: CH_GFDI_EXCL has a unit root
Exogenous: Constant
Lag Length: 3 (Automatic - based on SIC, maxlag=4)
t-Statistic Prob.*
Augmented Dickey-Fuller test statistic -5.30336 0.0006
Test critical values: 1% level -3.88675
5% level -3.05217
10% level -2.66659
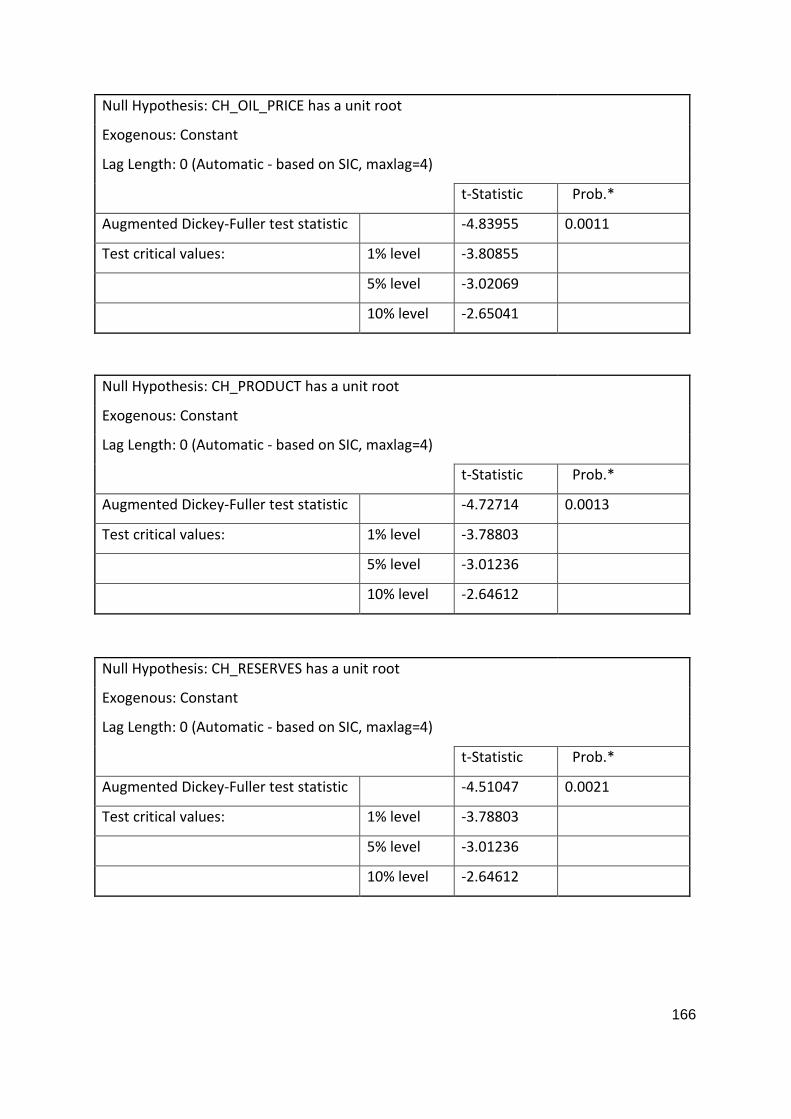
166
Null Hypothesis: CH_OIL_PRICE has a unit root
Exogenous: Constant
Lag Length: 0 (Automatic - based on SIC, maxlag=4)
t-Statistic Prob.*
Augmented Dickey-Fuller test statistic -4.83955 0.0011
Test critical values: 1% level -3.80855
5% level -3.02069
10% level -2.65041
Null Hypothesis: CH_PRODUCT has a unit root
Exogenous: Constant
Lag Length: 0 (Automatic - based on SIC, maxlag=4)
t-Statistic Prob.*
Augmented Dickey-Fuller test statistic -4.72714 0.0013
Test critical values: 1% level -3.78803
5% level -3.01236
10% level -2.64612
Null Hypothesis: CH_RESERVES has a unit root
Exogenous: Constant
Lag Length: 0 (Automatic - based on SIC, maxlag=4)
t-Statistic Prob.*
Augmented Dickey-Fuller test statistic -4.51047 0.0021
Test critical values: 1% level -3.78803
5% level -3.01236
10% level -2.64612
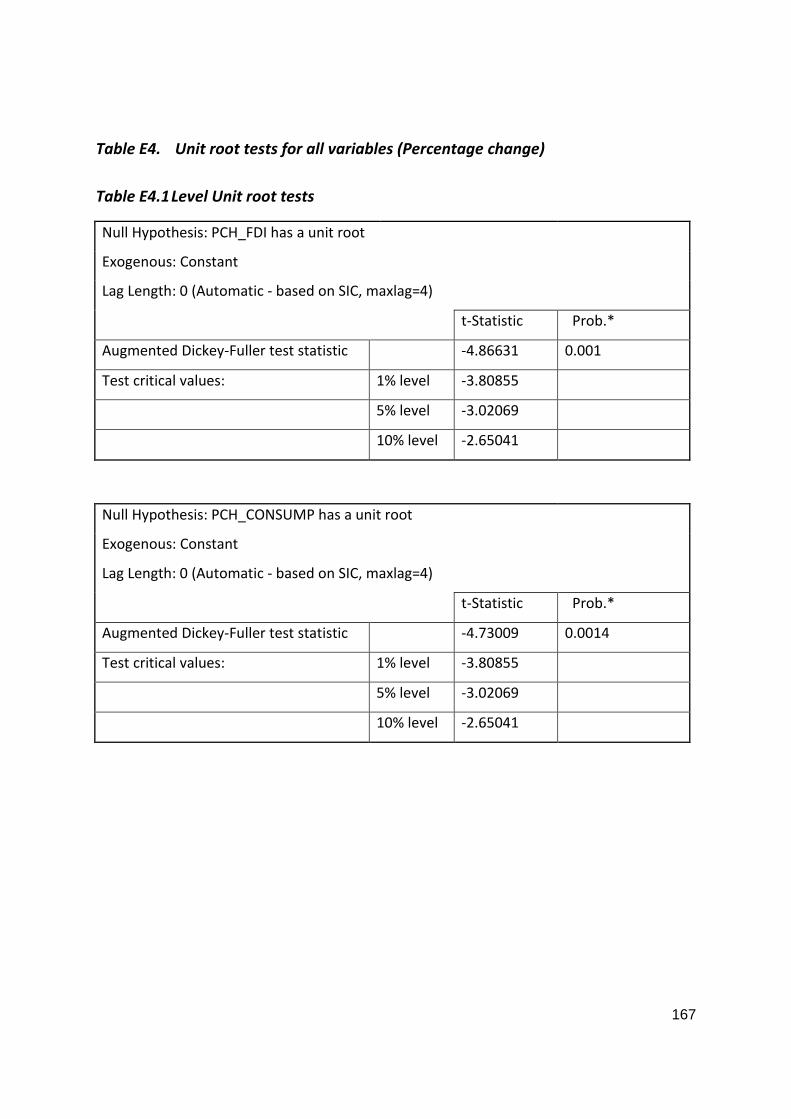
167
Table E4. Unit root tests for all variables (Percentage change)
Table E4.1 Level Unit root tests
Null Hypothesis: PCH_FDI has a unit root
Exogenous: Constant
Lag Length: 0 (Automatic - based on SIC, maxlag=4)
t-Statistic Prob.*
Augmented Dickey-Fuller test statistic -4.86631 0.001
Test critical values: 1% level -3.80855
5% level -3.02069
10% level -2.65041
Null Hypothesis: PCH_CONSUMP has a unit root
Exogenous: Constant
Lag Length: 0 (Automatic - based on SIC, maxlag=4)
t-Statistic Prob.*
Augmented Dickey-Fuller test statistic -4.73009 0.0014
Test critical values: 1% level -3.80855
5% level -3.02069
10% level -2.65041

168
Null Hypothesis: PCH_GFDI_EXCL has a unit root
Exogenous: Constant
Lag Length: 0 (Automatic - based on SIC, maxlag=4)
t-Statistic Prob.*
Augmented Dickey-Fuller test statistic -3.58011 0.0162
Test critical values: 1% level -3.80855
5% level -3.02069
10% level -2.65041
Null Hypothesis: PCH_OIL_PRICE has a unit root
Exogenous: Constant
Lag Length: 1 (Automatic - based on SIC, maxlag=4)
t-Statistic Prob.*
Augmented Dickey-Fuller test statistic -3.9196 0.0083
Test critical values: 1% level -3.83151
5% level -3.02997
10% level -2.65519
Null Hypothesis: PCH_PRODUCT has a unit root
Exogenous: Constant
Lag Length: 0 (Automatic - based on SIC, maxlag=4)
t-Statistic Prob.*
Augmented Dickey-Fuller test statistic -4.54416 0.0021
Test critical values: 1% level -3.80855
5% level -3.02069
10% level -2.65041
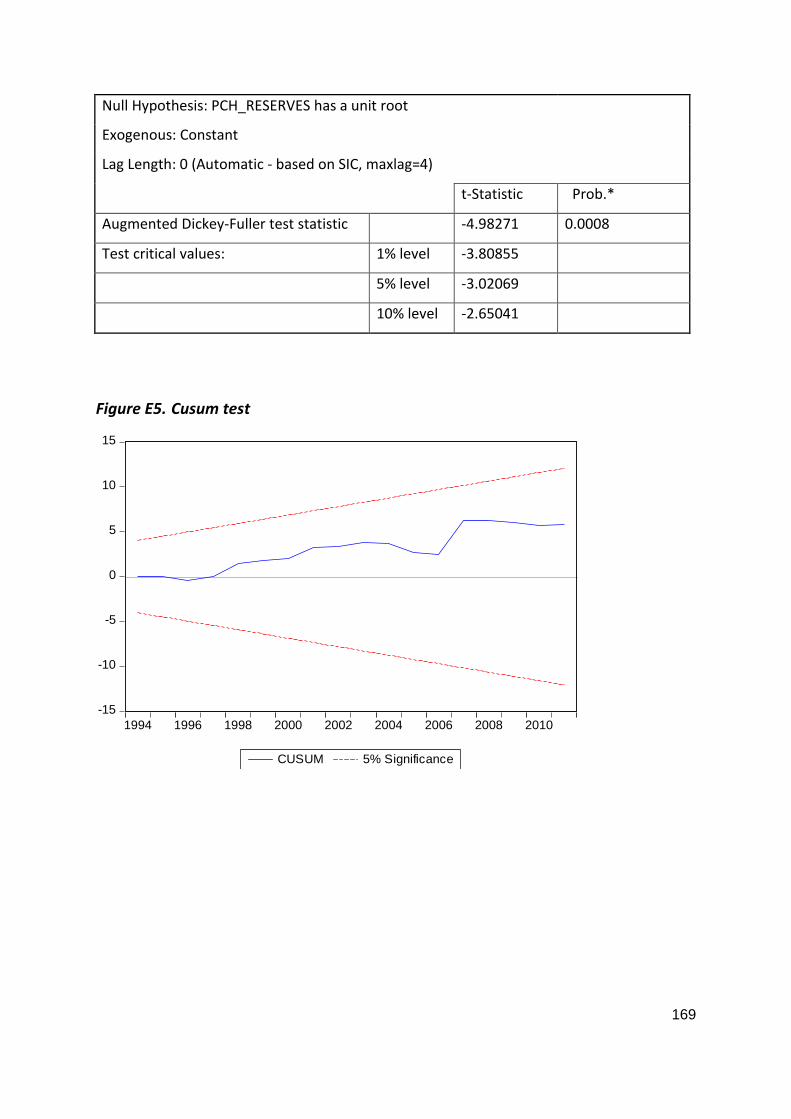
169
Null Hypothesis: PCH_RESERVES has a unit root
Exogenous: Constant
Lag Length: 0 (Automatic - based on SIC, maxlag=4)
t-Statistic Prob.*
Augmented Dickey-Fuller test statistic -4.98271 0.0008
Test critical values: 1% level -3.80855
5% level -3.02069
10% level -2.65041
Figure E5. Cusum test
-15
-10
-5
0
5
10
15
1994 1996 1998 2000 2002 2004 2006 2008 2010
CUSUM 5% Significance

170
Figure E6. Normality test
Table E7. Hetroskedasticity test
Heteroskedasticity Test: White
F-statistic 7.340954
Prob. F(9,10)
0.0022
Obs* R² 17.37079
Prob. Chi-Square(9)
0.0432
Scaled explained SS 13.15087
Prob. Chi-Square(9)
0.1559
Table E8. Serial correlation test
Breusch-Godfrey Serial Correlation LM Test:
F-statistic 1.164239 Prob. F(2,14) 0.3406
Obs* R² 2.852045 Prob. Chi-Square(2) 0.2403
0
1
2
3
4
5
6
-1.5e+10 -1.0e+10 -5.0e+09 25000.0 5.0e+09 1.0e+10 1.5e+10
Series: ResidualsSample 1992 2011Observations 20
Mean 3.81e-07Median 99968619Maximum 1.35e+10Minimum -1.28e+10Std. Dev. 5.94e+09Skewness 0.045900Kurtosis 3.365838
Jarque-Bera 0.118554Probability 0.942446