A Comparative Analysis of Signal Processing Methods for Motion-Based Rate Responsive Pacing
19
A Comparative Analysis of Signal Processing Methods for Motion-Based Rate Responsive Pacing SAUL E. GREENHUT, ERIC A. SHREVE, and CHU-PAK LAU* From the Applied Research Division. Teiectronics Pacing Systems, Englewood, Colorado; and *The Department of Medicine, Queen Mary Hospital, University of Hong Kong, Hong Kong GREENHUT, S.E., ET AL.: A Comparative Analysis of Signal Processing Methods for Motion-Based Rate Responsive Pacing. Pacemakers that augment heart rate (HR) by sensing body motion have been the most frequently prescribed rate responsive pacemakers. Many comparisons between motion-based rate re- sponsive pacemaker models have been published. However, conclusions regarding specific signal pro- cessing methods used for rate response (e.g.. filters and algorithms) can be affected by device-specific fea- tures. To objectively compare commonly used motion sensing filters and algorithms, acceleration and ECG signals were recorded from 16 normal subjects performing exercise and daily living activities. Accel- eration signals were filtered (1-4 or 15-Hz band-pass), then processed using threshold crossing (TC) or in- tegration (IN) algorithms creating four filter/algorithm combinations. Data were converted to an acceler- ation indicated rate and compared to intrinsic HR using root mean square difference (RMSd) and signed RMSd. Overall, the filters and algorithms performed similarly for most activities. The only differences be- tween filters were for walking at an increasing grade (1-4 Hz superior to 15-Hz) and for rocking in a chair (15-Hz superior to 1-4 Hz). The only differences between algorithms were for bicycling (TC superior to IN), walking at an increasing grade (IN superior to TC), and holding a drill (IN superior to TC). Performance of the four filter/algorithm combinations was also similar over most activities. The 1-4/IN (filter [Hz]/al- gorithm) combination performed best for walking at a grade, while the 15/TC combination was best for bi- cycling. However, the 15/TC combination tended to be most sensitive to higher frequency artifact, such as automobile driving, downstairs walking, and hand drilling. Chair rocking artifact was highest for 1-4/IN. The RMSd for bicycling and upstairs walking were large for all combinations, reflecting the nonphysio- logical nature of the sensor. The 1-4/TC combination demonstrated the least intersubject variability, was the only filter/algorithm combination insensitive to changes in footwear, and gave similar RMSd over a large range of amplitude thresholds for most activities. In conclusion, based on overall error performance, the pre- ferred filter/algorithm combination depended upon the type of activity. (PACE 1996; 19:1230-1247) activity, accelerometer, algorithm, filter, rate response, pacemaker Introduction Motion-based pacemakers, although utilizing a nonphysiological parameter for rate response, are currently the most widely used rate responsive pacing systems. Probable reasons for its widespread use include the sensor's relative sim- plicity, reliability, and early introduction. The Address for reprints: Saul E. Greenhut, Ph.D., Research and Technology, Telectronics Pacing Systems, 7400 S. Tucson Way, Englewood, CO 80112, Fax: (303) 799-2213. Received December 19,1994; revision April 29,1995; accepted Inne20, 1995. sensor is characterized by its rapid response at the onset of activity, which has been shown to be faster than more physiological sensors.*'^ For this reason, dual sensor, rate responsive pacemakers have recently been developed that combine phys- iological sensors (QT interval sensing or minute ventilation) with motion sensors.^'* An optimal dual sensor algorithm is depen- dent upon accurate response of individual sen- sors. Therefore, a study was undertaken to com- pare the effectiveness of currently available motion-based algorithms and filters under various exercise, daily living, and potentially artifactual conditions. Commercial pacemaker activity sens- 1230 August 1996 PACE, Vol. 19
-
Upload
independent -
Category
Documents
-
view
3 -
download
0
Transcript of A Comparative Analysis of Signal Processing Methods for Motion-Based Rate Responsive Pacing

A Comparative Analysis of SignalProcessing Methods for Motion-Based RateResponsive Pacing
SAUL E. GREENHUT, ERIC A. SHREVE, and CHU-PAK LAU*
From the Applied Research Division. Teiectronics Pacing Systems, Englewood, Colorado; and*The Department of Medicine, Queen Mary Hospital, University of Hong Kong, Hong Kong
GREENHUT, S.E., ET AL.: A Comparative Analysis of Signal Processing Methods for Motion-Based RateResponsive Pacing. Pacemakers that augment heart rate (HR) by sensing body motion have been the mostfrequently prescribed rate responsive pacemakers. Many comparisons between motion-based rate re-sponsive pacemaker models have been published. However, conclusions regarding specific signal pro-cessing methods used for rate response (e.g.. filters and algorithms) can be affected by device-specific fea-tures. To objectively compare commonly used motion sensing filters and algorithms, acceleration andECG signals were recorded from 16 normal subjects performing exercise and daily living activities. Accel-eration signals were filtered (1-4 or 15-Hz band-pass), then processed using threshold crossing (TC) or in-tegration (IN) algorithms creating four filter/algorithm combinations. Data were converted to an acceler-ation indicated rate and compared to intrinsic HR using root mean square difference (RMSd) and signedRMSd. Overall, the filters and algorithms performed similarly for most activities. The only differences be-tween filters were for walking at an increasing grade (1-4 Hz superior to 15-Hz) and for rocking in a chair(15-Hz superior to 1-4 Hz). The only differences between algorithms were for bicycling (TC superior to IN),walking at an increasing grade (IN superior to TC), and holding a drill (IN superior to TC). Performanceof the four filter/algorithm combinations was also similar over most activities. The 1-4/IN (filter [Hz]/al-gorithm) combination performed best for walking at a grade, while the 15/TC combination was best for bi-cycling. However, the 15/TC combination tended to be most sensitive to higher frequency artifact, such asautomobile driving, downstairs walking, and hand drilling. Chair rocking artifact was highest for 1-4/IN.The RMSd for bicycling and upstairs walking were large for all combinations, reflecting the nonphysio-logical nature of the sensor. The 1-4/TC combination demonstrated the least intersubject variability, was theonly filter/algorithm combination insensitive to changes in footwear, and gave similar RMSd over a largerange of amplitude thresholds for most activities. In conclusion, based on overall error performance, the pre-ferred filter/algorithm combination depended upon the type of activity. (PACE 1996; 19:1230-1247)
activity, accelerometer, algorithm, filter, rate response, pacemaker
Introduction
Motion-based pacemakers, although utilizinga nonphysiological parameter for rate response,are currently the most widely used rate responsivepacing systems. Probable reasons for itswidespread use include the sensor's relative sim-plicity, reliability, and early introduction. The
Address for reprints: Saul E. Greenhut, Ph.D., Research andTechnology, Telectronics Pacing Systems, 7400 S. TucsonWay, Englewood, CO 80112, Fax: (303) 799-2213.
Received December 19,1994; revision April 29,1995; acceptedInne20, 1995.
sensor is characterized by its rapid response at theonset of activity, which has been shown to befaster than more physiological sensors.*'^ For thisreason, dual sensor, rate responsive pacemakershave recently been developed that combine phys-iological sensors (QT interval sensing or minuteventilation) with motion sensors.^'*
An optimal dual sensor algorithm is depen-dent upon accurate response of individual sen-sors. Therefore, a study was undertaken to com-pare the effectiveness of currently availablemotion-based algorithms and filters under variousexercise, daily living, and potentially artifactualconditions. Commercial pacemaker activity sens-
1230 August 1996 PACE, Vol. 19

SIGNAL PROCESSING FOR RATE RESPONSWE PACING
ing algorithms can be divided into two types:threshold crossing (TC) and integration (IN); ascan activity sensing filters: low frequency (filterband-pass centered at < 4 Hz) and high frequency(filter band-pass centered at > 8 Hz). The first ac-tivity-based rate responsive pacemaker''' and sub-sequent generations utilized a high frequencyband-pass filter and TC algorithm. A pacemakerwas introduced several years later, which alsoused a high frequency band-pass filter, but incor-porated an IN algorithm.*^ Low frequency band-pass filtering was introduced more recently in twoaccelerometer-based pacemakers that incorporatean IN algorithm/"'" The differences between mo-tion-based rate responsive pacemakers are moredependent upon the signal processing (e.g., filter-ing and algorithms) than upon the differences insensor technology used to acquire the signal. Inthe absence of filtering, it has been observed thatboth case mounted piezoelectric crystals and cir-cuit board mounted piezoelectric accelerometershave equivalent, flat frequency response over therange of interest."
There is much literature comparing the be-havior of different motion-based pacemakers un-der various conditions.̂ •̂ •'̂ '•'''̂ "•̂ •̂̂ •̂ However,comparison of their specific signal processingmethods are obscured by the individual propertiesof each pacemaker model's motion sensing andprocessing functions, as well as by methods for in-dividual patient programming. In addition, a com-prehensive study examining the four possible mo-tion sensing filter/algorithm combinations, ofthose currently available, has not been previouslyreported. The purpose of tht; present article was tocompare motion-based algorithms and filters us-ing wideband recordings of acceleration signals.In this manner, analysis of individual algorithmsand filters could be isolated, and objectively com-pared by maintaining consistent analysis meth-ods.
MethodsStudy Protocols
The study was divided into two main proto-cols. A total of 16 healthy subjects participated inthe study. Fourteen subjects (9 males, 5 f'emales)aged 39 ± 8 years [mean ± SD) participated in theexercise protocol, while 11 of the same subjects
plus two additional female subjects (9 males, 4 fe-males) aged 39 ± 7 years participated in the dailyliving/artifact (DLA) protocol. The exercise proto-col was designed to test mainly the sensitivity,while the DLA protocol was designed to testmainly the specificity of the filter/algorithm com-binations.
Exercise Protocol
The exercise protocol consisted of five dis-tinct protocols of 10 minutes each separated by 10minutes of rest. Each exercise protocol consistedof five 2-minute stages as follows;
1. Treadl: Increasing treadmill speed withshoes at 0% grade (1.5, 2.0, 2.5, 3.0. and 5.0miles/hour).
2. Tread2: Increasing treadmill speed with-out shoes at 0% grade [1.5, 2.0, 2.5, 3.0, and 5.0miles/hour).
3. Tread3; Increasing treadmill grade withshoes at 2.0 miles/hour [0%, 5%, 10%, 15%, and20% grade).
4. Bikel: Increasing bicycle ergometer work-load [0.7, 0.9, 1.1, 1.3, and 1.5 W/kg of subjectmass).
5. Bike2: Increasing bicycle ergometer revo-lutions/min [RPM) at 0.9 W/kg of subject mass (50,60, 70, 80, and 90 RPM).
Protocols were selected to separate the effectsof treadmill speed and grade, and bicycle work-load and RPM. Protocols 1 and 2 were used to de-termine the consistency of the motion-based rateresponse algorithms and filters to changes infootwear. Stages of the first four protocols were se-lected to have roughly comparable levels of energyexpenditure within a range of 2.2 and 8.8 METS.The MET range for protocol 4 was narrower be-cause bicycle wattage was limited to a minimumof 30 W by the equipment and high wattage levelscaused greater fatigue than during correspondingtreadmill exercise. Treadmill speeds > 3.0 mphand < 5.0 mph were not included to avoid speedsat which some walk and others run. Stepping andpedaling frequency [in steps/min and RPM) wererecorded for each subject during each stage oftreadmill and bicycle activities, respectively.
PACE. Vol. 19 August 1996 1231
GREENHUT, ET AL.
DLA Protocol
The DLA protocol was designed to comparethe response of the motion-based rate response al-gorithms and filters to activities that were knownto cause anomalous behavior for some motionsensing pacemakers. The protocol consisted ofeight stages, with the final seven used for analysis.Rest periods of variable length occurred betweenactivities.
0. Train: Warm-up walk [3 min).1. WalkS: Brisk walk down hall with soft [ath-
letic type) shoes (5 min].2. WalkH: Brisk walk down hall with hard
(dress type) shoes [5 min) [remainder of protocolwith hard shoes).
3. Drive: Automobile driving (approximately10 min).
4. Dnstr: Walk downstairs ten flights.5. Upstr: Walk upstairs ten flights.6. Drill: Holding a working hand drill with
weight attached while seated.7. Rock: Rocking in a chair at 30 RPM.
The warm-up walk was used to familiarizesubjects with the equipment and increase theirhearts to a moderate resting level. Stages 1 and 2were again designed to look at changes in algo-rithm and filter performance with footwear. Alarge number of stair flights were used to allowample data for analysis. The 7.5-cm long rectan-gular weight attached to the drill end weighed 205g and was 3.0 cm from point of attachment to thecenter of mass. A motor speed was used that re-sulted in spinning of the weight of approximately7 Hz.
Signal Acquisition
Acceleration signals were acquired via an En-devco® model 12 (San Juan Capistrano, CA. USA)piezoelectric accelerometer that was mounted tothe circuit board internal to a pacemaker case. Thepacemaker case was securely held to the subject'sleft or right pectus using elastic bandages with theaccelerometer sensitive to anterior-posterior casemovement. The acceleration signal was filtered[0.28-43 Hz) prior to recording to an ambulatoryanalog tape recorder [Model HR-30-G, TEAC®,Montebello, CA, USA). Lead II ECG was simulta-neously recorded to the TEAC recorder with pre-
processing by a Fetrode® (UFI, Morro Bay, CA,USA) amplification and filtering system. Datawere replayed offline (Model R-71, TEAC) anddigitized [CODAS®, Dataq Instruments, Akron,OH. USA) at an effective sampling rate of 125 Hzafter anti-alias Bessel filtering (DC-50 Hz). Datawere transferred to a Sparcstation® 10/30 [SUNMicrosystems, Mountain View, CA, USA) for pro-cessing using software written in GNU C.
Signal Processing
Onset and offset markers for each protocoland stage were identified and the quality of thedata was manually confirmed. The analysis of restperiods was ignored in the current study since theperformance of each algorithm during recovery isdependent only upon its value at the end of exer-cise and the predetermined deceleration time con-stant.
Signal Statistics
Automated analysis divided the data into twostreams by the digital filter type of 1—4 Hz[0.75-5.5 Hz. - 3 dB) or 15-Hz [6-28 Hz, - 3 dB)band-pass, then into a total of four streams by thealgorithm type of TC or integration. Details ofthese algorithms are given below. Subject heartrate (HR) was calculated from the recorded ECGusing standard filtering and threshold techniques.A moving average of the intrinsic HR was thencompared to the calculated acceleration indicatedrates [AIRs) of each filter and algorithm combina-tion using root mean square difference (RMSd)and signed RMSd (SRMSd). A lower value ofRMSd [minimum of 0 beats/min) indicates a bet-ter fit.
SRMSd is a point-by-point summation ofRMSd that have the sign of AIRj-HRi, so that a pos-itive SRMSd value results from an overresponsivesensor and a negative SRMSd value from an un-derresponsive sensor, when compared to the in-trinsic rate. The absolute value of SRMSd is al-ways less than or equal to RMSd. Statistics wereapplied only to the RMSd results, since they rep-resent the absolute error. The equations for RMSdand SRMSd are included in the Appendix.
1232 August 1996 PACE, Vol. 19
SIGNAL PROCESSING FOR RATE RESPONSIVE PACING
HR Baseline Correction
During repeated exercise, the HR during theresting phase between exercises is elevated for aprolonged period of time. This causes the HR dur-ing succeeding exercise periods to be elevatedfrom what it would have been had those exercisesoccurred first in sequence.^'* Since the motion al-gorithms under study do not correct for this phe-nomenon, a procedure to subtract HR increasesdue to repeated exercise was used to prevent biasagainst exercises and activities that occurred laterin each protocol. The acceleration variables werealso adjusted to baseline values to ensure equiva-lent starting points for HR and the AIRs.
This baselining procedure was as follows.The average HR, acceleration count, and accelera-tion integral in the minute preceding the first ex-ercise/activity were calculated. These values weresubtracted from the corresponding average duringthe minute preceding each subsequent exer-cise/activity that showed an HR increase over restand during the minute following each subsequentactivity that showed an HR decrease over rest (e.g.,driving, drilling, rocking). This difference wasthen subtracted from each HR, acceleration count,and acceleration integral data point of the follow-ing [or preceding) exercise/activity.
TC Algorithm
This algorithm consisted of a positive andnegative amplitude threshold at equivalent abso-lute acceleration values. If the filtered accelerationsignal crossed the positive threshold after havingcrossed the negative threshold since the last posi-tive threshold cross, then the threshold counterwas incremented. The TC was processed sepa-rately for ten amplitude thresholds at 5, 10. 20, 30,40. 50. 60, 80, 100. and 200 mg [milli-gravities) asmeasured 0 to peak and following filtering. Thenumber of threshold counts/1.5 s was recorded,moving average filtered over five data points, thendual rate low pass filtered in order to take 0.5 min-utes on onset and 2.5 minutes on recovery to reach90% of their final value.
IN Algorithm
The IN algorithm consisted of accelerationsignal full wave rectification followed by summa-
tion of consecutive digital samples over 1.5-sec-ond intervals. The value at the end of each 1.5-sec-ond interval was input to the five-point movingaverage filter for equivalent filtering as in the TCalgorithm. The integration value was reset each1.5 second. No amplitude threshold was nsed forthe IN algorithm, although an amplitude offset, asdescribed under Conversion to AIR, was imple-mented.
Conversion to AIR
The increasing speed treadmill with shoesprotocol in the exercise protocol [Treadl) and thebrisk walk with hard shoes stage in the DLA pro-tocol (WalkH) were used to set the rate responseslope for each filter/algorithm for the remainderof the respective protocol. The 2-minute, 5.0mile/hour stage was eliminated from Treadl forthe purpose of calculating the acceleration slopeto better simulate common rate response program-ming. The slope was determined for each subject,protocol [exercise and DLA), algorithm, and filterby the following:
max[Hi?) - min(HR) ,slope = , rf. ^ , .,. r [1)
where drfit^] is the dual rate low pass filter valuein counts or mg/1.5 s, which corresponds to thetime of maximal or minimal intrinsic HR. A sub-ject-specific minimum rate was calculated by av-eraging the minute of HR prior to the first activityof the exercise and DLA protocols. The averagecounts and mg/1.5 s during this period were set tocorrespond to the minimum HR representing acount and amplitude offset. The resulting slopevalue and minimum rate {min_rate) were used toconvert algorithm units to the AIR in pulses/minas follows:
i = [slope X acc^ + min_rate, (2)
where acCi are consecutive acceleration algorithmvalues in counts or mg/1.5 s.
Statistical and Graphical Analysis
Processed subject data were transferred to anIBM/PC compatible for statistical [True Epistat) andgraphical (SigmaPlot) analysis. Numerical and
PACE, Vol. 19 August 1996 1233

GREENHUT, ET AL.
<«) 50 60Tims (min)
Figure 1. Time-compressed acceleration (1-4 Hz), HR(beat/min), and marker channel data of the exerciseprotocol of subject number 8. The marker channel indi-cates onset and offset of eacb 10-minute protocol. Seetext for description of each protocol.
graphical data are expressed as mean with standarddeviation. A linear model multiway ANOVA wasused to compare general differences between algo-rithms and filters. A repeated measures ANOVAwith Duncan's correction for multiple comparisonswas used to evaluate significant differences betweenthe four filter/algorithm combinations. Otherwise,Student's paired f-tests were performed where ap-plicable. Coefficients of Variation (CV), which equalstandard deviation divided by the mean, were cal-culated to compare intersubject variability in nor-malized units. In all statistical tests, a P value < 0.05was considered statistically significant.
ResultsAmplitude Threshold Selection
The TC algorithm was evaluated using tenamplitude thresholds from 5-200 mg for each fil-ter. In order to objectively choose a threshold forcomparison to IN algorithms, the RMSd mean overall subjects and activities (including DLA and ex-ercise protocols) was calculated for each thresholdvalue and each filter. The threshold from eachprotocol with minimum RMSd mean was selectedfor further comparison. This procedure resulted inthe 40-mg threshold being selected for the 1-4 Hzfilter and the 10-mg threshold being selected forthe 15-Hz filter.
Exercise Protocol
Example Exercise Protocol
The time-compressed acceleration signal andHR from the exercise protocol of subject number 8are shown in Figure 1.
General Effects ofEilters and Algorithms
The overall results that examined the effectsof algorithm, apart from filter, and vice versa (us-ing the multiway ANOVA), showed four statisticaldifferences for algorithm and one for filter out of atotal of ten trials for each. Differences in resultsbetween signal processing methods dependedupon the exercise. The TC algorithm was shown tohave statistically lower RMSds for bicycling(Bikel and Bike2), while the IN algorithm and1-4-Hz filter were separately superior for walkingat an increasing grade. IN also showed a slight sta-tistical advantage for treadmill walking (Treadl,mean difference - 1.8 beats/min), although thisadvantage was not seen in other walking activities(Tread2, WalkS, and WalkH).
Comparison of Four Eilter/AlgorithmCombinations
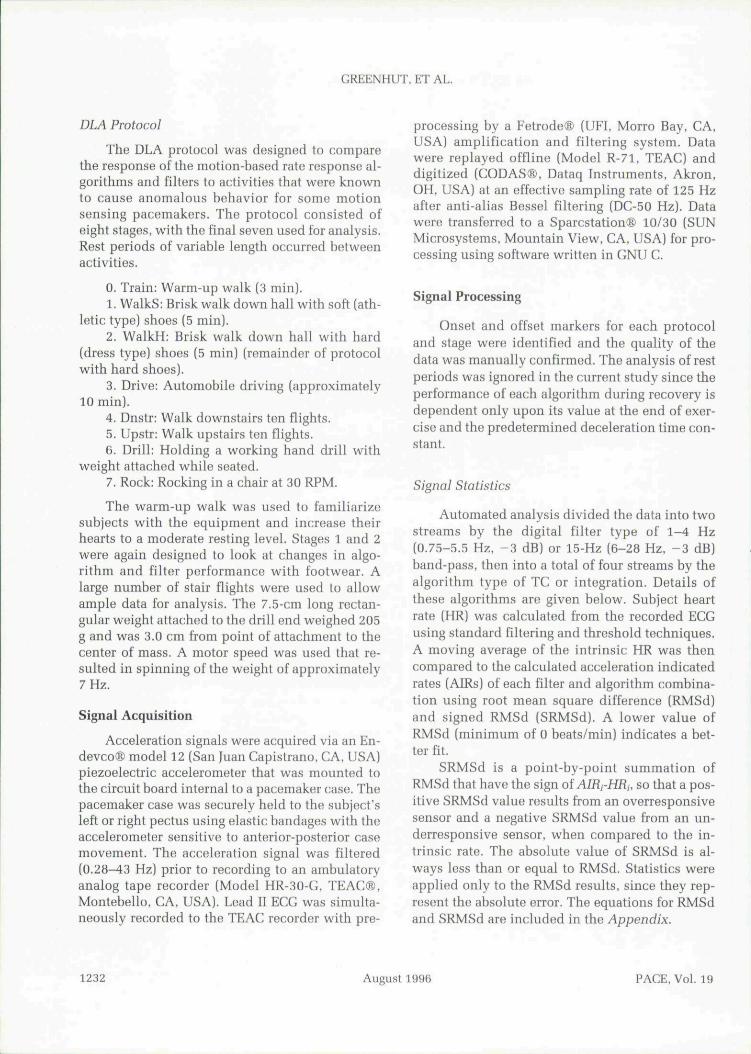
The mean and standard deviations of theRMSd for each exercise and filter/algorithm areshown in Figure 2A. There were only small abso-lute differences between RMSds for level walkingand running (Treadl and Tread2). The RMSd val-ues for Treadl were lower than the values forTread2 since Treadl was used to calibrate the rateresponse slope, while this slope was applied toTread2, as well as the other exercises. The 1-4 Hzfiltered IN signal had the lowest RMSd for in-creasing treadmill grade (Tread3), while 15-Hz fil-tered TC consistently had the greatest RMSd overTreadl, Tread2, and Tread3.
In general, the algorithms performed morepoorly for bicycle than treadmill exercise. The re-sponse of the algorithms to increasing RPM(Bike2) had lower RMSds than the response to in-creasing workload (Bikel). Also, TC had lowerRMSds than IN for Bikel and Bike2, while 15-HzTC performed best. If, however, the 15-Hz TC am-plitude threshold was increased by 10 mg, theRMSd increased by 7 beats/min for both Bikel andBike2. Comparatively, a 10-mg increase in thresh-
1234 Aueust 1996 PACE. Vol. 19
SIGNAL PROCESSING FOR RATE RESPONSIVE PACING
60
50
40
1-4Hz,TC
1-4 Hz, IN
15 Hz, TC
15 Hz, IN
Treadl Tread2 Tread3
Exercise
Bike1 Bike2
B
1-4Hz,TC
1-4 Hz, IN
15Hz,TC
15 Hz, IN
-60
Tread 1 Tread2 TreadS
Exercise
Blke1 Bike2
Figure 2. (A) HMSd versus filter/algorithm combinations for the exercise protocol. (Bj SRMSdversus filter/algorithm combinations for the exercise protocol. IN ̂ IN algorithm: TC = TC algo-rithm.
old for 1-4 Hz resulted in only a 2-3 beat/min in-crease in the RMSd for Bikel and Bike2.
The results of the repeated measures ANOVAon the subject RMSd over each exercise are givenin Table I. The test results indicate which filter/al-gorithm combinations were significantly differentfrom each other. Table I condenses that informa-tion. The filter/algorithm combination is indi-cated by the column and the exercise is indicated
Table I.
Repeated Measures ANOVA RankingsExercise Protocol
ExerciseProtocol
TreadlTread 2Tread3BikelBike2
1-4 Hz,TC
- 1+ 1- 1
00
1-4 Hz,IN
+ 1+ 1+ 3- 3- 2
15 Hz,TC
- 2- 3— 1-t-3+ 3
15 Hz,IN
+ 2- H- 1
0- 1
See text ior protocol abbreviations, IN = Integration algorithm;TC = Threshold crossing algorithm.
by the row. v4 -1-1 in a box indicates that the RMSdof the filter/algorithm in that column was statisti-cally lower than a single other filter/algorithm forthat activity. A -H2 or +3 indicates that the fil-ter/algorithm was better than two or three otherfilter/algorithm combinations. Each positive valuecorresponds to a negative value in each row thathad a statistically greater RMSd than the filter/al-gorithm given the positive value. Therefore, allnumbers in a row must equal zero.
The first row indicates that, for Treadl, 15/IN[filter [Hzl/algorithm) was better (significantlylower RMSd) than 1-4/TC and 15/TC. Also,1—4/IN was better than 15/TC. Other combina-tions not identified were not statistically different.For example, there was no statistical differencebetween 1-4/TC and 1-4/IN. The next row showsthat, for Tread2, 15/TC was worse than the otherthree filter/algorithm combinations which werenot statistically different. For Tread3, 1-4/IN wasbetter than the other three filter/algorithm combi-nations which were not statistically different. Thefourth row indicates that 15/TC was better thanthe other three filter/algorithm combinations and1-4/IN was worse than the other three filter/algo-
PACE, Vol. 19 August 1996 1235

GREENHUT, ET AL.
Stage(mph)
1.52.0
2.53.05.0
Mean
1-4
Treadi(TC/s)
1.31.5
1.81.92.6
Comparison
Hz, ThresholdCrossing
Tread2(TC/s)
1.31.61.7
1.92.7
%Diff
3.30,7
-2 .4
-0.12.1
0.7
1-4
Treadi
(mg)
22
26
313771
Of Shoes
Table II.
vs. No Shoes Treadmill Exercise
Hz, Integration
Tread2
(mg)
24
29
3642
69
%Diff
10*14'
13*13'
-2 .7
9.5
15
Treadi(TC/s)
3.13.74.14.2
7.2
Hz, ThresholdCrossing
Tread2(TC/s)
3.84.2
4.54 67.7
%DJff
25*14*
1010'6.4'
13
15
Treadi
(mg)
4.7
5.87.38.8
24
Hz, Integration
Tread2
(mg)
5.46.5
8.09.7
24
%Diff
13*11*
10*10*
-0.88.6
•P < 0.05.7o Diff = Average percent difference between TC/s or mg for Treadi and TfGad2: mg ^ Average amplitude in milli-gs; mph ^ miles/hour; TC/s = Averagethreshold crossings per second; Treadi = Increasing speed treadmill protocol with shoes exercise protocol; Tread2 = Increasing speed treadmill protocolwithout shoes exercise protocol.
rithm combinations. In addition, 1-4/TC and15/IN were not statistically different. Finally, forBike2,15/TC was again better than the other threefilter/algorithm combinations. In addition, 1-4/INwas also worse than 1-4/TC. In summary, 1-4/TCgave a balanced response to all activities. The1-4/IN combination performed well for increasinggrade (Tread3), but failed dnring bicycle exercise.The 15/TC filter/algoritbm performed best for bi-cycling, but was inferior during level treadmill(Treadi andTread2). The 15/IN results were againfairly balanced across activities, although leveltreadmill exercise was favored.
SRMSd results for tbe exercise protocol aregiven in Figure 2B. These results indicate tbat onaverage the sensor overresponded for all filter/al-gorithm combinations for Treadi and Tread2,while there was underresponse for tbe remaining
exercises.
Change in Footwear
In order to compare tbe difference in algo-ritbms between wearing (athletic type) shoes andno shoes, it was useful to examine the accelerationparameters directly without comparison to intrin-sic HR. The parameters examined were the aver-age counts per second and average amplitude ofeach exercise stage, averaged over all subjects. Thecomparison of all four filter/algorithm combina-tions for the cbange in footwear is shown in Table
II. The 1—4 Hz, TC filter/algorithm is the only com-bination to not have consistently significant dif-ferences for walking witb sboes versus no sboes.The other three filter/algoritbm combinations had4 of 5 stages wbose basic parameters were signifi-cantly different from Treadi to Tread2. The aver-age threshold counts per second for the 15-Hz, TCcombination had consistent overlap betweenTread2 of the lower stage and Treadi of the bigberstage over the first four consecutive stages.
Increasing Treadmill Grade
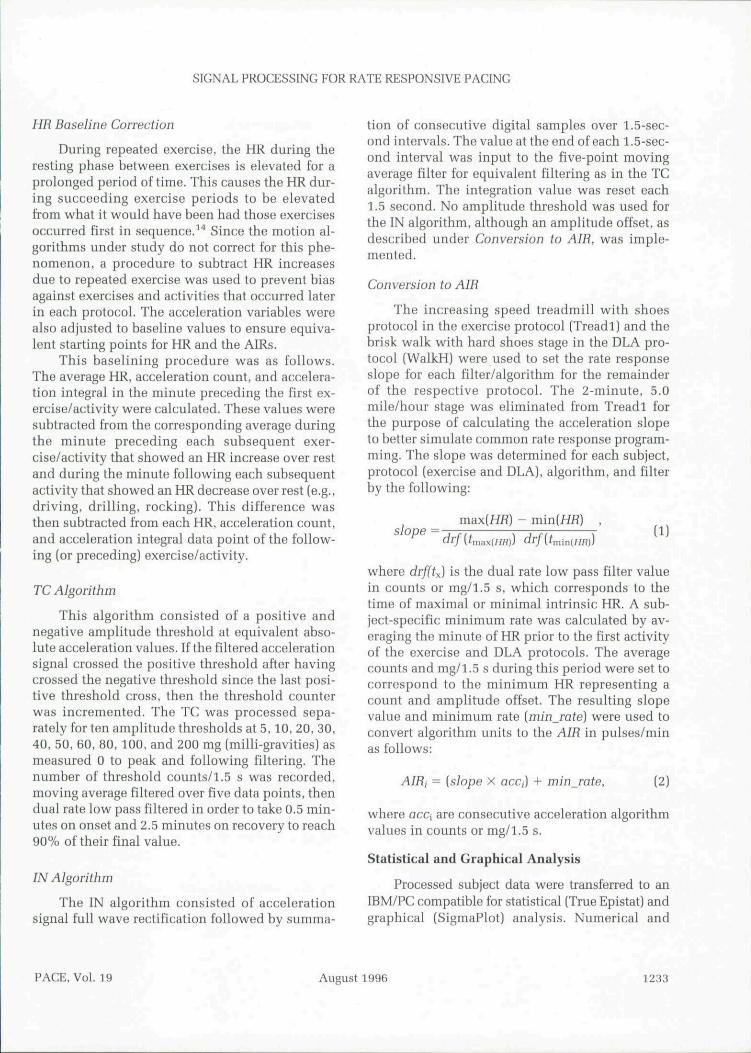
The comparison of average amplitude andcounts per second for tbe treadmill increasinggrade protocol for 1-4 Hz is sbown in Figure 3. ForIN, tbe average amplitude increases consistentlyfrom 0%-20% grade, whereas the average numberof counts per second remains nearly constant be-tween stages. A repeated measures ANOVA wasperformed on the data and tbe increase in averageamplitude for 1-4 Hz was found to be statisticallysignificant for consecutive stages. Tbe increase inaverage amplitude from stage 1 to stage 5 was59%. There were no statistical differences be-tween any stages for the average number of tbresb-old counts per second for tbe 1-4-Hz filter.
The 15-Hz filter increasing grade results wereless clear. Tbe average amplitude for stages 1, 2,and 3 were found to not be statistically different.However, stage 4 was statistically greater tban
1236 August 1996 PACE, Vol. 19
SIGNAL PROCESSING FOR RATE RESPONSIVE PACING
50 -
40 -
30 -
20 '
10 -
0 J
11
~ 1
All p = NS
[ i i -[
All p < 0.05
1.75
- 1.50
- 1.25
-1 .00 •
- 0.75 9=
- 0.50
0.25
0.000% 5% 10% 15% 20%
Stage (% Grade at 2.0 miles/hour)
Figure 3. Average amplitude (circles and left ordinatescale) and average counts per second (squares and rightordinate scale) for progressive stages of the increasinggrade exercise protocol (1-4 Hz filtered data). Averageamplitude increased significantly from each lower tohigher stage, while average counts per second did notincrease significantly between any stage.
stages 1-3 and stage 5 was statistically greaterthan stages 1-4. So, 15-Hz filtered average ampli-tude began to increase significantly only as thegrade reached 15%. The increase in average am-plitude from stage 1 to stage 5 was 21%.
The average TCs per second for the 15-Hz fil-ter showed that stages 2-4 were not statisticallydifferent. Also, stages 1 and 5 had identical meanvalues and were not statistically different. Theonly statistically significant difference that wouldresult in the desired response was the differencebetween stage 5 (20% grade) and stages 2-4.
Although there was an increase in the averageamplitude of the 15/IN combination from stage 1to stage 5, the RMSd of 15/IN for Tread3 (Fig. 2A)was not significantly lower than the RMSds of theTC algorithms and was significantly higher thanthe 1^/IN RMSd.
Bicycle Exercise
In order to determine the mechanism for theimproved bicycling response of TC algorithmsover IN algorithms, recorded acceleration signalswere examined. Acceleration signals filtered from
Threshold Cross = 7Ave Amplitude = 54 mg
Threshold Cross = 15Av© Arpplrtude = 109 mg
Time (sec) B
Threshold Cross = 6Ave Amplitude = 27 mg
Threshoid Cross = 12Ave Amplitude = 34 mg
Time (sec)
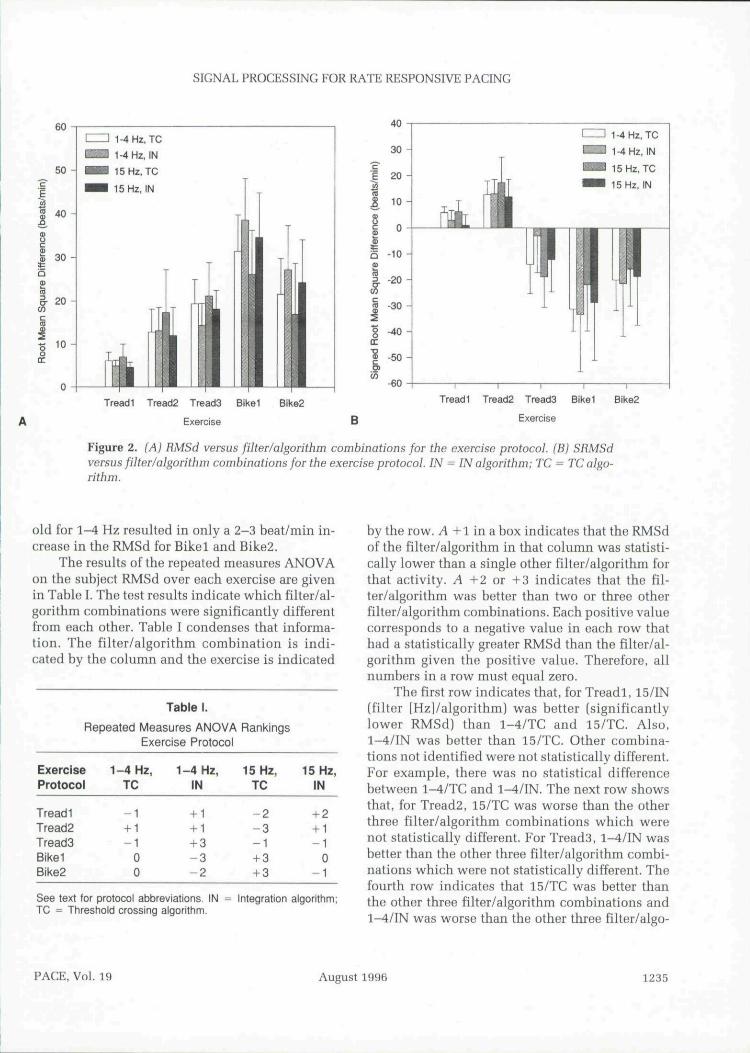
Figure 4. (A) Acceleration signals (filtered 1-4 Hz) for stages 1 and 5 of the treadmill increasingspeed with shoes exercise protocol (Treadl). Both threshold counts per second and average am-plitude approximately doubles from stage 1 to stage 5. (B) Acceleration signals (filtered 1-4 Hz)for stages 1 and 5 of the bicycle increasing workload exercise protocol (Bikel j. Threshold countsper second again doubles, however, average amplitude increases by only 26%. These figuresdemonstrates why the TC algorithms responded more appropriately to increasing bicycle work-load than did the IN algorithms.
PACE. Vol. 19 August 1996 1237

GREENHUT, ET AL.
ExerciseProtocol
TreadlTread3
Intersubject
Table III.
Variability of Filter/Algorithm Combinations
1-4 Hz Band-Pass Filter
Mean AverageAmplitude CV
0.180.23
MeanCounts/Sec CV
0.080.13
15 Hz Band-Pass Filter
Mean AverageAmplitude CV
0.230.16
MeanCounts/Sec CV
0.210.17
CV = Coefficient of Variation; Treadl = Increasing treadmill speed with shoes exercise protocol; Tread3Increasing treadmill grade exercise protocol.
1—4 Hz recorded during the treadmill increasingspeed with shoes protocol (stages 1 and 5) and thebicycling increasing workload protocol (stages 1and 5) are shown in Figures 4A and 4B, respec-tively. The + 40-mg threshold boundaries for theTC algorithm are indicated. Note that, in Figure4A, the number of TCs and average amplitude ap-proximately double from stage 1 to stage 5. In Fig-ure 4B, the number of TCs have again doubled;however, the average amplitude increased by only26%. Thus, during bicycling, the amplitude ap-
peared to increase sufficiently to yield signifi-cantly more TCs, but not sufficiently to increasesubstantially the response of the IN algorithm.
Intersubject Variability
CVs were calculated for the average countsper second (corresponding to the TC algorithm)and average amplitude (corresponding to the INalgorithm) values. This calculation was made foreach stage of the Treadl and Tread3 protocols for
Treadl Tread2 Tread3
Exercise
Bikel Bike2
BTreadl Tread2 Tread3
Exercise
Bikel Bike2
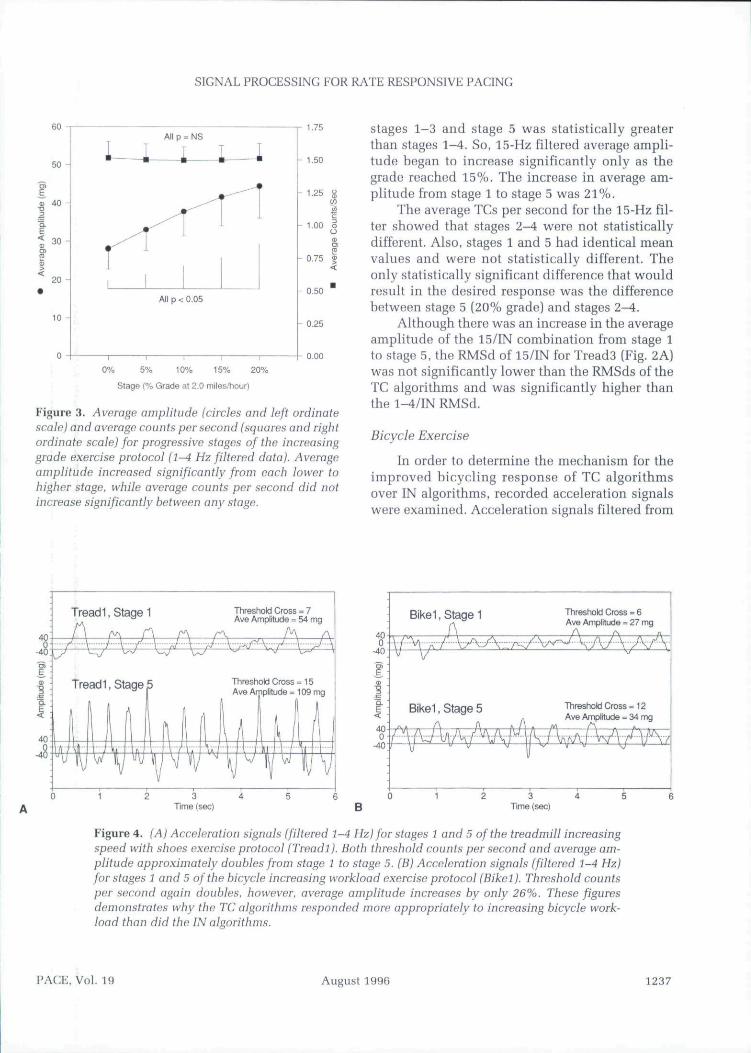
Figure 5. (A) 1-4 Hz filtered TC RMSds versus exercise protocol for amplitude thresholds from10-100 mg. (B) 15-Hz filtered TC RMSds versus exercise protocol for amplitude thresholds from5-60 mg. IN RMSds are included for reference.
1238 August 1996 PACE, Vol. 19
SIGNAL PROCESSING FOR RATE RESPONSIVE PACING
each filter/algorithm combination and over allsubjects. Tbe five CV values (representing eacbstage) for eacb protocol and filter/algoritbm werethen averaged. The resulting values are given inTable III. Note tbat the mean CV values for tbecounts per second witb 1-4-Hz filter (correspond-ing to the 1-4/TC filter/algoritbm combination)for both Treadi and Tread3 are lower tban allotber filter/algorithm combinations. Tbis indi-cates tbat tbere is less intersubject variability be-tween rate response parameters for 1-4/TC. Theredoes not appear to be any marked difference be-tween tbe mean CVs of tbe otber combinations.Tberefore, it is expected that less patient-specificprogramming would be required for a 1-4/TC sys-tem to obtain optimal sensor performance.
Variation in Results with Changing Threshold
Tbe manner in wbicb the TC algorithm RMSdresults varied witb amplitude threshold for the1-4-Hz band-pass filter is sbown in Figure 5A.Tbe IN results are superimposed in Figure 5A forreference. For tbresbolds > 10 mg and < 100 mgtbere was almost no cbange in RMSd for leveltreadmill exercise [Treadi and Tread2). During in-creasing treadmill grade [Tread3), tbere is a slightinverse relationship between tbresbold level andRMSd. During bicycling (Bikel and Bike2) tbere isa steady and large, direct relationship betweentbresbold and RMSd. Tberefore, except for bicycleexercise, tbe RMSd results were similar witbin awide range of tbresbolds for 1-4 Hz.
The corresponding grapb for the 15-Hz band-pass filtered data is sbown in Figure 5B. RMSdsfor amplitude tbresholds up to only 60 mg areshown to correspond to Figure 5A because tbe15-Hz band-pass filter has approximately 40%greater attenuation at peak frequency tban the1-4-Hz filter. Overall, there is greater variabilityin the RMSds for tbe 15-Hz tban for tbe 1-4-Hzfilter, Tbis is partially because of tbe lesser signalamplitude of tbe 15-Hz filtered data apart fromthe filter signal attenuation. The 15-Hz filteredRMSds for Treadi and Tread2 show greater vari-ability tban for tbe corresponding exercises fortbe 1-4-Hz filtered data. Tbe inverse relationshipbetween amplitude tbreshold and RMSd forTread3 is weaker for tbe 15-Hz filter as sometbreshold value RMSds do not follow tbe trend.
The direct relationship for tbe bicycle exercisesseen in the 1-4 Hz data remains in the 15-Hzdata; however, larger differences between RMSdsof consecutive tbreshold levels result at tbresb-olds > 10 mg.
DLA Protocol
Example DLA Protocol
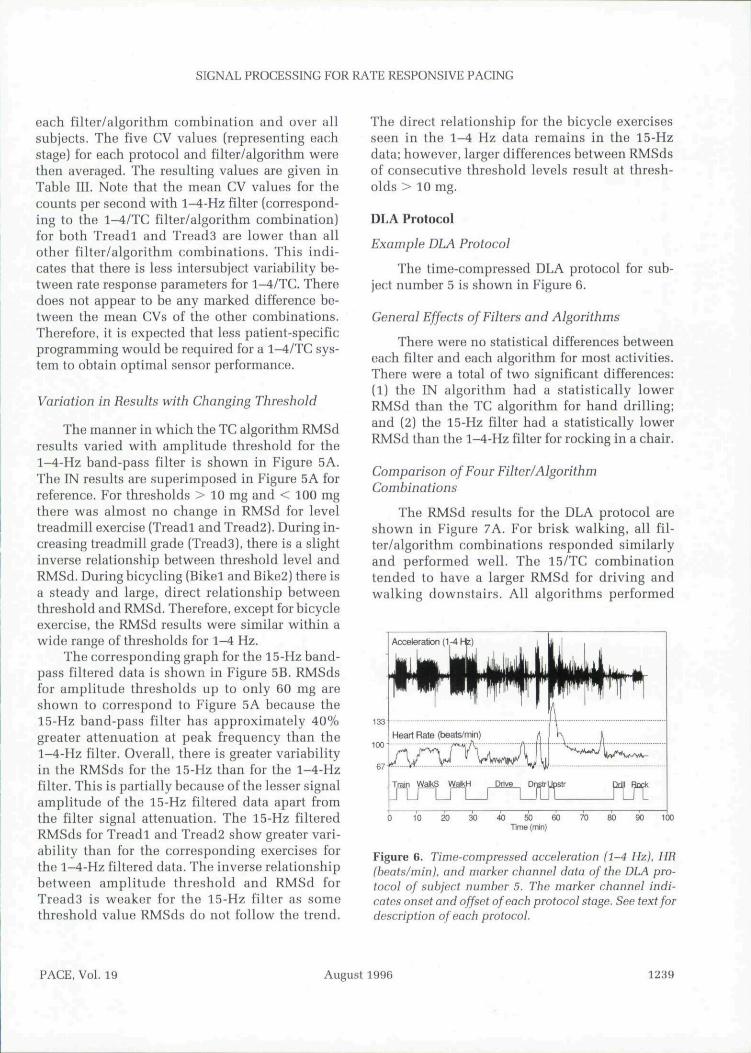
The time-compressed DLA protocol for sub-ject number 5 is sbown in Figure 6.
Ceneral Effects of Filters and Algorithms
Tbere were no statistical differences betweeneach filter and each algorithm for most activities.Tbere were a total of two significant differences:(1) the IN algorithm had a statistically lowerRMSd than the TC algorithm for hand drilling;and (2) tbe 15-Hz filter bad a statistically lowerRMSd tban tbe 1-4-Hz filter for rocking in a cbair.
Comparison of Four Filter/AlgorithmCombinations
Tbe RMSd results for the DLA protocol aresbown in Figure 7A. For brisk walking, all fil-ter/algoritbm combinations responded similarlyand performed well. Tbe 15/TC combinationtended to have a larger RMSd for driving andwalking downstairs. All algorithms performed
0 10 20 30 40 50 60 70
Figure 6. Time-compressed acceleration (1-4 Hz). HR(beats/min), and marker channel data of the DLA pro-tocol of subject number 5. The marker channel indi-cates onset and offset of each protocol stage. See text fordescription of each protocol.
PACE, Vol. 19 August 1996 1239
GREENHUT, ET AL.
1-4Hz,TC
1-4 Hz, IN
15H2,TC
15 Hz, IN
Walks Waikh Drive Dnstr Upstr Drill Rock
Activity B
1-4Hz,TC
1-4 Hz, IN
15Hz,TC
15 Hz, IN
1 1 1— 1 rWalks WaIkH Drive Dnstr Upstr Drill
Activity
Rock
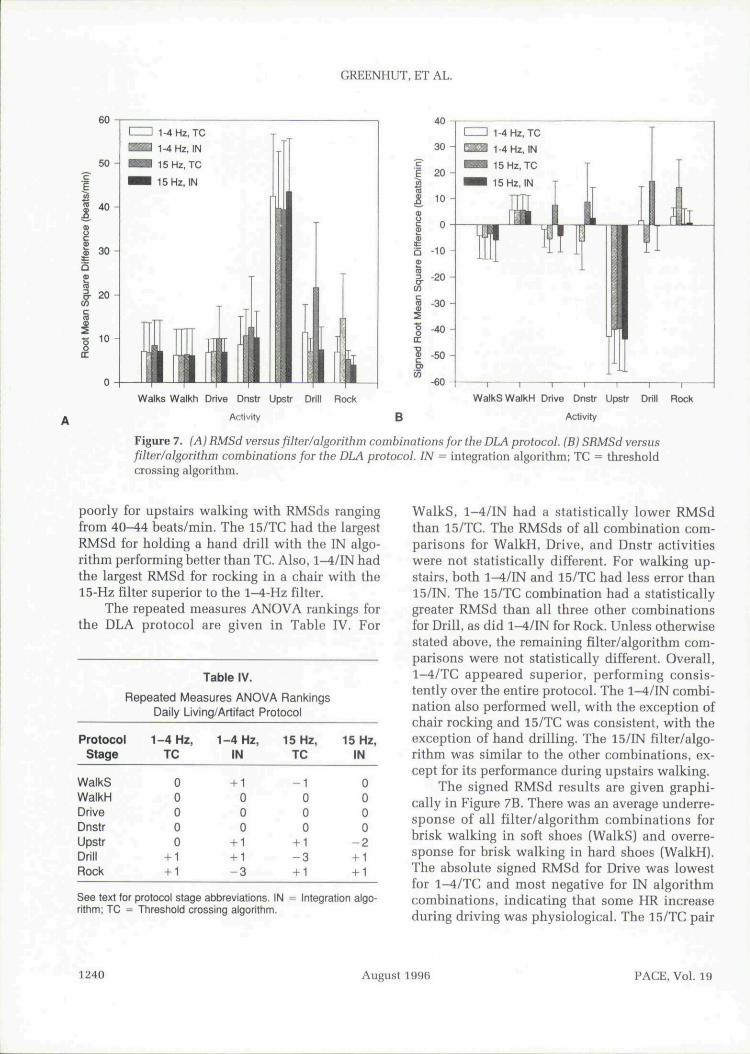
Figure 7. (A) RMSd versus filter/algorithm combinations for the DLA protocol. (B) SRMSd versusfilter/algorithm combinations for the DLA protocol. IN ^ integration algorithm; TC ^ thresholdcrossing algorithm.
poorly for upstairs walking with RMSds rangingfrom 4 0 ^ 4 beats/min. Tbe 15/TC bad tbe largestRMSd for bolding a hand drill with tbe IN algo-rithm performing better than TC. Also, 1^/IN hadthe largest RMSd for rocking in a chair with tbe15-Hz filter superior to the 1-4-Hz filter.
Tbe repeated measures ANOVA rankings fortbe DLA protocol are given in Table IV. For
ProtocolStage
WalksWaIkHDriveDnstrUpstrDrillRock
Table IV.
Repeated Measures ANOVA RankingsDaily Living/Artifact Protocol
1-4 Hz,TC
00000
-1-1+ 1
1-4 Hz,IN
+ 1000
+ 1+ 1- 3
15 Hz,TC
- 1000
+ ^- 3+ 1
15 Hz,IN
0000
— 2+ ^H-I
See text for protocol stage abbreviations. IN = Integration algo-rithm; TC =̂ Threshold crossing algorithm.
Walks, 1-4/IN bad a statistically lower RMSdtban 15/TC. Tbe RMSds of all combination com-parisons for WalkH, Drive, and Dnstr activitieswere not statistically different. For walking up-stairs, botb 1-4/IN and 15/TC bad less error than15/IN. The 15/TC combination had a statisticallygreater RMSd tban all tbree otber combinationsfor Drill, as did 1-4/IN for Rock. Unless otberwisestated above, tbe remaining filter/algorithm com-parisons were not statistically different. Overall,1-4/TC appeared superior, performing consis-tently over tbe entire protocol. Tbe 1-4/IN combi-nation also performed well, witb tbe exception ofcbair rocking and 15/TC was consistent, with theexception of band drilling. The 15/IN filter/algo-ritbm was similar to tbe otber combinations, ex-cept for its performance during upstairs walking.
Tbe signed RMSd results are given grapbi-cally in Figure 7B. Tbere was an average underre-sponse of all filter/algoritbm combinations forbrisk walking in soft shoes (WalkS) and overre-sponse for brisk walking in bard shoes (WalkH).The absolute signed RMSd for Drive was lowestfor 1-4/TC and most negative for IN algoritbmcombinations, indicating tbat some HR increaseduring driving was pbysiological. Tbe 15/TC pair
1240 August 1996 PACE, Vol. 19

SIGNAL PROCESSINC EOR RATE RESPONSIVE PACING
was tbe only combination to overrespond to driv-ing on average, indicating excessive artifact sensi-tivity. The 15/TC combination again had tbe great-est signed RMSd for walking downstairs (Dnstr).Tbe 1^/TC combination signed RMSd for Dnstraveraged to nearly zero, indicating an appropriateaverage response to downstairs walking. All algo-ritbms greatly underresponded to upstairs walk-ing (Upstr). Drilling (Drill) caused 15/TC and chairrocking (Rock) caused 1-4/IN to overrespondmuch more tban tbe remaining filter/algorithmcombinations for these activities.
Change in Footwear
Tbe comparison between average amplitudeand average counts per second for brisk walkingwitb soft (atbletic type) versus bard (dress type)sboes showed tbat 1-4/TC was tbe only filter/al-goritbm combination to not yield a significant dif-ference. The mean percent differences betweenwalking witb differing footwear for tbe four com-binations were: 1.0% for 1^/TC; 6.4% for8.5% for 15/TC; and 9.9% for 15/IN.
Upstairs Versus Downstairs Walking
A similar analysis, comparing tbe average am-plitude and average counts per second betweenupstairs and downstairs walking was made. It wasfound tbat only 1^/IN sbowed an increase in itsrate response parameter from downstairs to up-stairs walking. Tbe percent increase was 32% andfound to be statistically significant. All otber fil-ter/algoritbm combinations showed a decrease intheir respective rate response parameters fromwalking downstairs to walking upstairs. Tbe rangein tbis decrease from downstairs to upstairs was16%-23% and was statistically significant in eachof tbe tbree cases.
Variation in Results with Changing Threshold
Tbe variation in RMSd witb tbresbold for tbeDLA protocol and 1—4-Hz filter is sbown in Figure8A. IN algorithm results are superimposed on Fig-ure 8A for comparison. Tbere was consistency inRMSd among all thresholds for WalkS, WalkH,and Upstr. Threshold RMSds during Dnstr andRock were similar except for a sligbt RMSd in-
Walks WalkH Drive Dnstr Upstr Drill Rock
Activity B
DU -
40 -
30 -
20 -
10 -
0 -
-O- 5mgO 10 mg
- • " 20 mg—•— 30 mg^-^^ 40 mg- • ^ 50 mg
• 60 mg
1
—O— Integration
•• i
/ 1• im
^ 1•••• '11/ 1/ 1j i
\11
\4
Walks WalkH Drive Dnstr Upstr Drill
Activity
Rock
Figure 8. (A) 1- to 4-Hz filtered TC RMSds versus DLA protocol for amplitude thresholds from10-100 mg. (B) 15-tIz filtered TC RMSds versus DLA protocol for amplitude thresholds from 5-60mg. IN RMSds are included for reference.
PACE, Vol. 19 August 1996 1241

GREENHUT, ET AL.
crease for the 10-mg threshold. Automobile driv-ing (Drive) showed a high RMSd for the 10-mgthreshold, which decreased for 20 mg and then be-came similar and minimal for 30-100 mg. Handdrilling (Drill) experienced very high RMSds for10 mg and decreased witb each succeeding leveluntil reaching a minimum at 50 mg. The 15-Hz fil-tered threshold dependent results, shown in Fig-ure 8B, are similar to the 1^-Hz results, but showgenerally greater variability (except for Drive andDrill), which corresponds to that seen in the exer-cise protocol comparison.
Discussion
Summary and Discussion of Results
Overall, the results show that the filters andalgorithms performed similarly for most exercisesand activities. In particular, there were only minordifferences in performance for level walking, themost common type of activity. All filter/algorithmcombinations performed poorly for bicycling andupstairs walking, demonstrating the nonphysio-logical nature of tbe sensor. The response of TC al-gorithms to bicycling could be improved by de-creasing the threshold, but only with theunacceptable cost of increasing artifactual re-sponse to snch activities as driving, hand drilling,and other higher frequency noise sources. It wasobserved that there were interactions between thetype of filter and algorithm in the results obtained.In other words, for certain activities, 1-4/TC and15/IN both had lower RMSds than 1-4/IN and15/TC (Dnstr, Fig. 7A), while the opposite wastrue for other activities (Upstr, Fig. 7A).
The advantages and disadvantages of eacb fil-ter/algorithm combination depended upon thetype of exercise or activity. Root mean square dif-ferences for 15/TC were slightly, but consistentlyhigher than other combinations for most walkingactivities. IN algorithms performed better than TCalgorithms and the 1-4-Hz filter was superior tothe 15-Hz filter for increasing treadmill grade,with the 1-4/IN combination having a statisticallylower RMSd that the other three combinations.Therefore, it is understandable that pacemakersutilizing low frequency centered filters and IN al-gorithms have performed better than other typesof motion-based devices for traditional treadmillexercise testing, which simultaneously increases
treadmill speed and grade to increase workload/'^TC algorithms performed better than IN algo-rithms for bicycling. Here, the 15/TC results weresuperior to the 1-4/TC results, although increas-ing tbe 15-Hz threshold by 10 mg eliminated tbisadvantage, while increases in the 1-4-Hz thresh-old level were not as sensitive. In order for 15/TCto have the lowest RMSd for bicycling, the thresh-old had to be low enough to cause some artifactualresponse in the DLA protocol.
Differences in algorithm parameters (averageamplitude and counts/s), calculated for both exer-cise and DLA protocols, showed that 1-4/TC wasthe only combination to be insensitive to footweartype. The 15/TC combination, on average, overre-sponded to automobile driving, walking down-stairs, and hand drilling more than any otherfilter/algorithm combination. The 15/TC combi-nation relies mainly on sensing vibration, orhigher frequency harmonics of the accelerationsignal. Therefore, this filter/algorithm respondedwith higher AIRs during activities which pro-duced higher frequency, relatively low amplitudevibration, as in driving, downstairs walking, anddrilling. In addition, it was also found that inte-gration was superior to TC for hand drilling. Chairrocking, on the other hand, yields a low frequency(0.5 Hz in the DLA protocol), high amplitude sig-nal which resulted in the 1-4/IN filter/algorithmgiving the greatest overresponse to that activity.Additionally, the 15-Hz filter was statistically bet-ter than tbe 1-4-Hz filter during rocking.
As seen previously for upstairs walking, allfilter/algorithm combinations bad high RMSdswhich signed RMSds showed to be a complete un-derresponse of the sensor. However, it was shownthat while 1-4/TC, 15/TC, and 15/IN all hadhigher average AIRs for downstairs than upstairs,the opposite was true of 1-4/IN. Therefore, only1-4/IN responded in the correct direction to thedifference in stair walking. However, this was notaccomplished by a significantly more accuraterate than the other combinations on walking up-stairs, but by a lower AIR during walking down-stairs. The 1-4-Hz filter and IN algorithm elimi-nated some of the higher frequency noise duringdownstairs walking which resulted in an averageAIR, which was lower than intrinsic HR duringdownstairs walking (see negative signed RMSd fordownstairs walking in Fig. 7B). Contributing to
1242 August 1996 PACE, Vol. 19

SIGNAL PROCESSING FOR RATE RESPONSIVE PACING
this underresponse was that downstairs walkingcommonly resulted in a higher intrinsic HR thanbrisk, level walking. Therefore, the 1-4/IN combi-nation underresponded to downstairs walking,which caused the 1-4/IN upstairs versus down-stairs AIRs to appear to yield a more accurate re-sponse if analyzed in isolation without compari-son to subject intrinsic HR. In addition, it isinteresting to note that the improved response of1-4/IN, as well as the moderate response of 15/IN,to increasing grade during the exercise protocoldid not translate to an improved response for up-stairs walking.
It was shown above that for the 1-to 4-Hz fil-ter, the RMSd results of the TC algorithm for levelwalking were independent of threshold for values> 10 mg and < 100 mg. It seems possible, there-fore, that an appropriately selected nominalthreshold value for the 1-to 4-Hz filter wouldrarely have to be adjusted from nominal. On theother hand, if it were required that the thresholdbe increased from nominal in order to remove theeffect of some external interference, then, basedon the results, the response to walking and run-ning should not be greatly affected, although theresponse to bicycling would be reduced. In gen-eral, the 15/TC combination did not exhibit thesame stability in RMSd results over thresholdvalue, even over a smaller range.
The mechanism by which the TC algorithmresponded more appropriately than the IN algo-rithm to bicycle exercise was shown in Results.The increase in bicycle workload appeared tocause a small increase in acceleration amplitude,which tended to increase the number of countssignificantly, but did not increase the average am-plitude to the same degree. The increase in bicycleRPM appeared to increase the fundamental accel-eration frequency, thereby causing more frequentTCs. A lower threshold value for the TC algorithmtended to favor better bicycle response. There wasan opposite, but subtler effect of threshold on theTC response to increasing grade: as the thresholdincreased, the RMSd decreased. Since there wasan acceleration amplitude increase with increas-ing grade, an increased threshold (> 50 mg) be-came a peak detector, with the threshold countingmore peaks at steeper grades and less peaks atlower grades.
Drill artifact, and to a much lesser extent,
driving artifact, was dependent upon thresholdvalue with higher thresholds causing less artifact.A high artifactual response at low threshold val-ues appeared to completely fade at thresholds ^50 mg for drilling and at thresholds > 30 mg fordriving. Hand drilling was selected for the DLAprotocol because, although not necessarily repre-sentative of pacemaker patient daily living, it wasthought to generate typical, higher frequency, lowamplitude artifact seen during daily living. In thesame manner, chair rocking was thought to be typ-ical of low frequency, high amplitude noise.
Comparison to Literature
Lau et al.'^ and Alt et al.,̂ -̂ *̂ using frequencyanalysis of directly measured acceleration signals,demonstrated that the majority of energy in bodyacceleration in the vertical, horizontal, or lateralaxis is < 4 Hz for walking, bicycling, and other ex-ercise. Lau et al.^'' showed that using the total rootmean square amplitude (tRMS) of the signal (ameasure related to the value of the integral) a bet-ter correlation was achieved for increasing gradetreadmill exercise than with a pacemaker depen-dent on a high frequency, TC filter/algorithm. Lauet al.^^ also found that low pass filtering the tRMSyielded similar results, and would potentially fil-ter artifact that is frequently present at higher fre-quencies. Alt et al.*^ found the peak frequenciesfor exercise activities to he in the 0.5- to 3-Hzrange. Using peak-to-peak amplitude (a measurerelated to the value of the integral), Alt et al.^^showed improved response to graded treadmilland bicycle exercise for acceleration signals lowpass filtered with a 3-Hz cutoff, compared to sig-nals high pass filtered with an 8-Hz cutoff. Theyalso showed that certain artifacts, such as handdrilling and blows to the thorax, had greater en-ergy for frequencies > 8 Hz, than for frequencies <
3 Hz.Although the Alt et al.^^ and Lau et al.̂ ^ arti-
cles indicate that low frequency centered filters [<4 Hz) are preferable to high frequency centered fil-ters (> 8 Hz) for motion-based rate responsive pac-ing, they did not examine the effects of filter plusalgorithm performance and interaction. Only byexamining the four available filter/algorithm com-binations, with otherwise consistent analysis,could conclusions be reached on the relative per-formance of motion sensing filters and algorithms.
PACE. Vol. 19 August 1996 1243

GREENHUT, ET AL.
As mentioned above, comparisons ofcommercial pacemaker models with different mo-tion-based rate response features have been re-ported.̂ •̂ •̂ '̂ '̂ "•̂ •̂̂ ^ As discussed, caution is ad-vised wben making generalized conclusions aboutmotion sensing filtering or algorithms because ofmodel-specific features or differences in deviceprogramming that can alter the results. Given thislimitation, the following discussion compares theresults obtained in the present study to thosewhich examined commercial pacemaker models.
Walking at Increasing Grade
Lau et al.^ found that neither a high frequencyband-pass filter with IN algorithm (HF/IN) devicenor a high frequency band-pass filter with TC al-gorithm (HF/TC) pacemaker had a statistically sig-nificant increase in pacing rate with increasinggrade, although the HF/IN device showed a slightabsolute pacing rate increase. Stangl et al.,^^ onthe other hand, found the response of the HF/INdevice to be significantly greater than the responseof the HF/TC device. Bacharach et al.^ showedthat using a combination increasing speed andgrade protocol that a low frequency band-passwith IN algorithm (LF/IN) pacemaker correlatedbetter to normal subject HR than did an HF/TC de-vice. Tbe results of these studies appear to be con-sistent with results from Tread3 of the exerciseprotocol, as the 1^/IN combination was superiorto the other three combinations, although 15/INappeared to yield some increase in AIR withsteeper grades.
In another study, Lau et al.^° did not find astatistically significant increase in pacing ratewith an increase in grade in an HF/TC or LF/INpacemaker. Tbe reason for the nonsignificant in-crease for the LF/IN pacemaker may be its partic-ular rate response implementation, possibly theapplication of a triphasic rate response curve thatdecreases the rate response during mid-level ac-celerations.
Bicycle Exercise
Lau et al.^ showed better performance for theHF/IN system than the HF/TC system for bicy-cling, while Bacharach et al.^ reported that thepacing rate increase was more appropriate with anLF/IN pacemaker than with an HF/TC pacemaker.
The results of these studies oppose the findingspresented here. The reason for the discrepancy isprobably related to the absolute threshold levelsetting in the HF/TC system tested which is un-known. Although, in the current study, the 15/TCcombination performed best for 5- and 10-mgthresholds, it was found that a 15/TC combinationwith a threshold value of > 20 mg had greaterRMSds than the 15/IN and 1^/IN combinations.
Change in Footwear
Lau et al.̂ °-^^ reported that LF/IN and HF/TCpacemakers had an insignificant difference in ratewitb changing footwear, while an HF/INf and alater generation HF/TC pacemaker showed signif-icant differences in pacing between wearing shoesand not wearing shoes. In the current report, onlythe 1-4/TC combination did not show differenceswith differing footwear. The reason for the LF/INpacemaker not showing the pacing rate differencemay be due to that pacemaker's triphasic rate re-sponse curve, which would tend to minimize ratedifferences during walking. The differences in re-sponse to footwear from the prior to later genera-tion HF/TC device may also be related to imple-mentation differences.
Ascending and Descending Stairs
In the Lau et al. study^ there was no statisticaldifference between the rate achieved on ascendingor descending stairs for either HF/TC or HF/INsystem, although the HF/IN device had a higherrate on ascending than descending, while the op-posite was true of the HF/TC device. Others -̂̂ -̂*^have also shown this paradoxical pacing rate ef-fect of an HF/TC device. The results of Moura etal.^^ for an HF/TC device (downstairs walkingequal to intrinsic HR, while upstairs walking30-50 pulses/min lower than intrinsic HR) weresimilar to those reported here for the 15/TC com-bination.
Although Bacharach et al.^ showed that theLF/IN device had higher and more appropriatepacing rates for upstairs walking, the pacing ratesfor downstairs walking were higher than intrinsicHRs. Also, although the differences in pacing ratesbetween walking up and down stairs showed thecorrect directionality, the differences betweenthese rates were relatively small.
1244 August 1996 PACE, Vol. 19
SIGNAL PROCESSING FOR RATE RESPONSIVE PAGING
In order to ensure sufficient data for analysis,ten flights of stairs were used in the present study,which is more than in previous studies and is anobviously unrealistic number for pacemaker pa-tients. The large workload during upstairs walkingcaused subject HR to become quite high and mayhave overwhelmed any small advantage which1-4/IN may have had over the other combinations.The current study demonstrates that reports docu-menting the relationship between downstairs andupstairs pacing rates without a comparison to nor-mal intrinsic HRs might show what appears to bea correct response, but underestimates downstairswalking, rather than demonstrating a physiologi-cal increase with upstairs walking. The results ofthe present study do seem contradictory to thoseof Bacharach et al.,'' however, who showed higherpacing rates than intrinsic rates for downstairswalking for an LF/IN device.
Response to Artifact
Stangl et al.^^ found no differences betweenHF/TC and HF/IN devices for various forms ofground transportation, although the HF/TC deviceresponded with a higher rate than the HF/IN de-vice to a hammer drill. Others^""^^ have notedonly small responses to various forms of trans-portation for a number of pacemaker models, withthe exception of extreme conditions, helicopter, orsmall airplane transport which gave large artifac-tual responses. In the present study, the 15/TC fil-ter/algorithm comhination tended to respondmost vigorously to the artifactual acceleration sig-nals of automobile driving and drilling.
The influence of rocking chair movement onthe 1-4/IN comhination might indicate increasedsusceptibility to arm motion as well. This artifac-tual response was seen in an HF/IN pacemaker^^and might have been greater in the 1-4/IN comhi-nation because of its lower frequency sensitivity.The effects of arm motion were not tested in thepresent study.
Potential Limitations
One of the potential limitations of the currentstudy was the use of acceleration signals whosesource was strapped on, rather than implanted,motion sensors. Recent publications,*''^'* however,indicate that the response of external motion-
based pacemakers to be equivalent" or closeenough to represent a valid representation^"* toidentically programmed internal units.
The range of ages of subjects used in the pre-sent study (27-54 years) was significantly youngerthan ages of typical pacemaker patients. This lim-itation could have affected the results in twoways: an acceleration signal with different charac-teristics; and a different intrinsic HR at identicalworkloads. Correlation coefficients of variables re-lating to acceleration characteristics and age werecalculated for the 1~4-Hz filtered results ofTreadi. During walking and running, the numberof TCs was related to subject stepping frequency(r̂ = 0.82) and related to walking speed [r̂ ^0.78), but not to subject age (r̂ = 0.11). Also, theaverage amplitude, while related to subject step-ping frequency (r̂ = 0.59) and related to walkingspeed (r̂ = 0.55), was also not related to subjectage (r̂ ^ 0.12). Therefore, given the limited sub-ject age range, there appears to be no relationshipbetween subject age and acceleration signal char-acteristics.
As far as differences in HR with age, and foractivities and exercise at levels less than peak ex-ertion, average HRs have been shown to vary by< 10 beats/min from young to old subjects.^^'^^ Amajority of the activities in the exercise and DLAprotocols in the present study involved suhmaxi-mal exercise.
The correlation coefficient often used to com-pare AIRs to intrinsic HRs was not used in the pre-sent study because of its independence fromchanges in absolute amplitude and rate of changeof amplitude. AIR and intrinsic HR may increaseat a proportional rate to each other and be largelyoffset from each other, and yet have a large corre-lation coefficient.
Dual Sensor Applications
Overall, the preferred filter/algorithm comhi-nation depended upon the type of activity, al-though the 15/TC comhination appeared to he lessdesirable because of its susceptibility to higherfrequency artifact. However, the properties re-quired of a motion sensor when incorporated aspart of a dual sensor system with a physiologicalsensor may be different than those required of a
PACE, Vol. 19 August 1996 1245
GREENHUT, ET AL.
single sensor system. It is suggested that the desir-able properties of a motion sensing system forcombination with a physiological sensor (e.g.,minute ventilation or QT interval) are fast re-sponse, easy and consistent programmability andfnnction, and minimal susceptibility to artifact.Superior proportionality to such activities aswalking at a grade or riding a bicycle are not as vi-tal because the physiological sensor would be ex-pected to control the rate during such activities.Other criteria being fairly equal, the most impor-tant criteria is that of ease and consistency ofprogramming and function, since this helps tominimize the complexity of dual sensor pro-grammability.
All of the four filter/algorithm comhinationsresponded quickly to the onset of activity. The1-4/TC combination performed the most consis-tently across all activities and the most consis-tently with respect to changing footwear andchanging threshold. Also, the 1-4/TC combina-tion showed the least intersubject variability. Allof these factors point to more consistent program-ming within and between subjects with the1-4/TC combination. Therefore, the 1-4/TC com-bination appears to be the filter/algorithm bestsuited for a dual sensor device.
Appendix
Root Mean Square Difference Calculations
Root mean square difference (RMSd) is de-fined by the following equation in which iVis thenumber of data points computed at 1.5-S6cond in-tervals in each protocol or stage.
N(2)
Signed RMSd [SRMSd] is described by the follow-ing equations.
N(3a)S -
else
where AIR is the accelerometer indicated rate andHR is the intrinsic HR.
Acknowledgment: The authors thank Drs. Bruce Steinhaiisand Daniel Cooper for their critical review of this manusr:ript.
References
Sulke AN, Pipilis A, Henderson RA, Comparisonof the normal sinus node with seven types of rateresponsive pacemaker during everyday activity.Br Heart J 1990; 64:25-31. 8.Lau C-F, Butrous GS, Ward DE, et al. Gomparisonof exercise performance of six rate-adaptive rightventricular cardiac pacemakers. Am J Gardiol 9.1989; 63:833-838.Connelly DT, The Topaz Study Group. Initial ex-perience with a new single chamber, dual sensorrate responsive pacemaker. PACE 1993; 10.16;1833-1841.Mianulli M, Benditt DG. Evaluation of a dual-sen-sor rate adaptive pacemaker with a standardizedactivities of daily living protocol—Results of a 11.multicenter study, (abstract) PACE 1994; 17;804.Anderson K, Humen D, Klein GJ, et al. A rate vari-able pacemaker which automatically adjusts forphysical activity, (abstract) PAGE 1983; 6;A-12. 12,Lau G-P, Tse W-S, Camm AJ. Clinical experiencewith Sensolog 703; A new activity sensing rate re-sponsive pacemaker. PACE 1988; 11;1444-1455.Alt E, Matula M. Comparison of two activity- 13.
controlled rate-adaptive pacing principles; Accel-eration versus vibration, Cardiol Glin 1992;10:635-658.Zarling J, Belott P, Brown D, et al. A comparison ofexternal rate responsive pacemakers with identi-cal implanted units, PACE 1992; 15:1886-1889.Bacharach DW, Hilden TS, Millerhagen JO, ot al.Activity-based pacing; Comparison of a device us-ing an accelerometer versus a piezoelectric crys-tal. PAGE 1992; 15;188-196.Lau C-P, Tai Y-T, Fong P-C, et al. Clinical experi-ence with an activity sensing DDDR pacemakerusing an accelerometer sensor. PAGE 1992;15:334-343,Cooper D. Comparison of activity sensors and al-gorithms for rate-responsive pacemakers usingambulatory monitoring. IEEE Gomp Cardiol 1993;851-854.Stangl K, Wirtzfeld A, Lochschmidt O, et al. Phys-ical movement sensitive pacing; Comparison oftwo "activity"-triggered pacing systems. PACE1989; 12;102-110.Johnston SL, Bradding P, Watkins ). A simultane-
1246 August 1996 PACE, Vol. 19

SIGNAL PROCESSING FOR RATE RESPONSIVE PACING
ous, noninvasive comparison with sinus rhythm, 20.of two activity sensing, rate adaptive pacemakers,in an elderly population. PACE 1991; 14;20-27,
14. Astrand I. Aerobic work capacity in men and 21.women. Acta Physiol Scand 1960; 49(Suppl.169):l-92,
15. Lau C-P, Stott JRR, Toff WD, et al. Selective vibra- 22.tion sensing; A new concept for activity-sensingrate-responsive pacing. PAGE 1988; 11;1299-1309. 23.
16. Alt E, Matula M, Theres H, et al. The hasis for ac-tivity controlled rate variable cardiac pacemakers;An analysis of mechanical forces on the humanbody induced by exercise and environment. PAGE 24.1989; 12;1667-1680.
17. Lau G-P. The range of sensors and algorithms usedin rate adaptive cardiac pacing, PACE 1992;15:1177-1211.
18. Moura PJ, Gessman LJ, Lai T, et al, Chronotropic 25.response of an activity sensing pacemaker com-pared with the normal sinus node. PACE 1987;10;78-86. 26.
19. Lau CP, Mehta D, Toff WD, et al. Limitations ofrate response of an activity-sensing rate-respon-sive pacemaker to different forms of activity.PACE 1988; ll;141-150.
Matula M, Alt E, Fotuhi P, et al. Rate adaption ofactivity pacemakers under various types of meansof locomotion, (abstract) Eur JCPE 1992; 2;A49,Toff WD, Leeks C, Joy M. et al. Activity-sensingpacemaker function during air travel, (abstract)PACE 1987; 10;424.Kubish K, Peters W, Chiladakis I, et al. Clinical ex-perience with rate responsive pacemaker Sensolog703. PACE 1988; 11;1829-1833,Alagona P, Greenwald K, Funk R, et al. Gompari-son of vibration vs. accelerometer based rate adap-tive pacemakers during helicopter transport, (ab-stract) Eur JCPE 1992; 2:62,Roberts D, Baxter S, Brennan P, et al. A compari-son of externally strapped versus implanted ac-celerometer or vibration based rate-adaptive pace-makers during daily activities, (abstract) PACE1993; 16:904.Hayes DL, Feldt LV, Higano ST. Standardized in-formal exercise testing for programming rate adap-tive pacemakers. PACE 1991; 14:1772-1776.Stratton JR, Levy WC, Cerqueira MD, Cardiovascu-lar responses to exercise. Effects of aging and ex-ercise training in healthy men. Girculation 1994;89;1648-1655.
PAGE, Vol. 19 August 1996 1247