CUDA Speed Up OPTION (Financial) Pricing By Using Binomial Pricing Tree Method
Upload
independentCategory
view
1download
0
Journal of Economics and Finance • Volume 22 • Numbers 2-3 • Summer/Fall 1998 • Pages 21-41
A Comparative Analysis of Security Pricing Using Factor, Macrovariable and Arbitrage Pricing Models
Suat Teker and Oscar Varela
ABSTRACT
This study compares and contrasts the single factor, three factor,
macrovariable and A P T models, using industry portfolios of all
available firms on CRSPfrom 1980 to 1992. Comparatively, the APT is
best, macrovariable second best and single factor model worse in
pricing securities. Consistently, the market variable is cross sectionally
priced in all models, and two of four APT factors capture the majority
of variance in industry returns. In the latter case, factor three is
consistently related to market returns, and factors two and three are also
associated with risk premiums and exchange rates after 1987. Factor
four is not related to any macrovariable, and term structure and
production are never related to any risk factor.
I. Introduction and Literature
A comprehensive analysis and comparison of the pricing behavior of the single factor, three factor,macrovariable and arbitrage security pricing models, using similar procedures with common samples andtimes, is presented in this paper. Previous studies have most often examined only one or compared only twoof these models, and hence comparisons between them often require reliance on results of multiple studiesthat differ with respect to sample and time. This study aims, by using consistent methods, samples andtimes, to provide the most reliable basis for examining the pricing interrelationships between these modelsand their factors.
Stone (1974) expanded the single factor model by adding an interest rate index, and since then differentversions of the two factor model have been used. The interest rate was replaced by an exchange rate indexin Jorion (1991), and Harris, Marr, and Spivey (1991), to address the international dimension. Choi,Elyasiani and Kopecky (1992) were first to investigate the simultaneous interaction of market returns,interest rates and exchange rates in a three factor model.
Ross (1976) introduced the Arbitrage Pricing Theory (APT), which involves identifying significantlypriced common risk factors influencing asset returns. Factor loading techniques are one way of determining
Suat Teker, Faculty of Management, Istanbul Technical University, Macka, Besiktas, 80680, Istanbul, TurkeyOscar Varela, Department of Economics and Finance, University of New Orleans, New Orleans, LA70148
We wish to thank Gurdip Bakshi and Atsuyuki Naka for helpful comments.Any errors are the responsibility of the authors.
the common systematic risk factors in the APT. Roll and Ross (1980) were first to empirically test the APT,although Shanken (1982) criticized these tests due to the unavailability of a true market portfolio composedof an unlimited number of securities. Ross and Dybvig (1985), however, showed the validity of empiricaltests of the APT.
Chen, Roll and Ross (1986) introduced the macrovariable model, and attempts have been made since toexplain the linkage between statistical common risk factors and known macrovariables. In this regard,Otuteye (1992) used five variables, Chang (1991) used six variables, Chen, Roll and Ross (1986) and Chenand Jordan (1993) used seven variables, and Kim and Wu (1987) used 12 variables. Macrovariables havemost often included production, inflation, exchange rates and the market index, and have been used in levelsand/or unexpected components.
A number of empirical studies have suggested that between three and five common risk factors exist inthe APT, whereas the number of macrovariables has varied between four and twelve. For example,regarding the risk factors, Roll and Ross (1980) suggest that at least three factors are important, Weinsteinand Brown (1985) and Pettway and Jordan (1987) suggest four factors, and Cho, Elton and Gruber (1984)and Chen and Jordan (1993) suggest five factors.
The hypothesis in the present study in their null form may be stated as follows. First, the cross-industrycoefficients for the single factor, three factor, macrovariable, and APT models are not significantly pricedby the market; and second, no model explains stock returns better than any other model. In identifying therelationship between the macrovariables and APT risk factors, the null hypothesis are that no linearrelationships exists between them. This study, of course, investigates for the alternative, namely to examinewhich of the four models explains stock returns best, and whether economic interpretations can be attachedto the unknown APT risk factors, based on linear relationships with macrovariables.
A two-step approach (similar to Fama and MacBeth (1973 and 1974) is used to examine which riskfactors in these models are cross-sectionally priced. The Davidson and Mackinnon (1981), Theil U2 (1966)and residuals tests are used to compare the models. Regression procedures are also used to examine therelation between the macrovariables and the APT common risk factors.
The following sections comprise this study. Section II discusses the data and sample. Section IIIpresents the methodology for pricing risk factors. Section IV describes the statistical tests used to comparethe models. Section V discusses the results. Finally, Section VI summarizes and concludes the study.
II. Data and Sample
The sample consists of all 1,037 firms available in the University of Chicago Center for Research inSecurity Prices (CRSP) tape from January 1, 1980 to December 31, 1992 with no missing dailyobservations, classified into 20 industry groups based on two-digit SIC codes. (In contrast, the most recentstudy, to the authors knowledge, by Chen and Jordan (1993) uses data through 1986.) Table I shows thatthe two largest portfolio groups were Finance and Real Estate (145 firms) and Utilities (122 firms). Thesmallest was Railroads (6 firms) and the next smallest Department Stores (15 firms). The top performingportfolio, in terms of the coefficient of variation (CV), was Petroleum (19 firms) with a CV of 0.884, andthe worse was Primary Metals (31 firms) with a 8.405. Monthly observations are used, by necessity, for themacrovariable model, and consist of the 156 months from January 1980 to December 1992. This periodencompasses a recovery, expansion and recession phase for the U.S. economy. The macrovariable model isalso studied using the 1980-87 and 1988-92 monthly periods to examine for changes in significant riskfactors, and the pricing thereof, before and after the 1987 stock market crash. Both monthly and dailyobservations are used for the single factor, three factor and APT models. The monthly observation periodsare similar to those used for the macrovariable model to provide a basis for comparison. The dailyobservation periods are restricted to two 2-year intervals, 1985-86 and 1991-92, because of SHAZAM’s datacapacity when GLS is used.1 Nevertheless, the observations are still clearly large enough for statisticallyreliable results regarding changes in significant risk factors and/or their pricing based on daily data beforeand after the 1987 stock market crash.
Primary and derived macroeconomic variables and selected descriptive statistics appear in Table II,Panels A and B. The primary variables (Panel A) are the U.S. long-term (20 year) government bond (LTGB)
22 JOURNAL OF ECONOMICS AND FINANCE • Volume 22 • Numbers 2-3 • Summer/Fall 1998

A Comparative Analysis of Security Pricing Using Factor, Macrovariable and Arbitrage Pricing Models 23
and Treasury bill (1 month) rates (TB), the consumer price index (CPI) and index of industrial production(IP), the yield on Standard and Poor’s (SP) Baa low grade rated bonds (LB), and the CRSPequally weightedmarket returns index (Rm) and exchange value of the U.S. dollar (EX) based on the equally weighed valueof the British pound sterling, Canadian dollar, French franc, German mark, Japanese yen and Swiss franc.
The derived variables (Panel B) are the term structure of interest rates (TR) based on the differencebetween the long bond and T-bill rates, the inflation rate (I), the rate of change in industrial production (P),the risk premium (RP) based on the difference between Baa and long bond rates, and the rate of change invalue of the U.S. dollar (X).
In addition, although Chen, Roll and Ross (1986) do not find a significantly priced market returnvariable, Born and Moser (1988) and Wei (1988) demonstrate that the residual market factor is significantlypriced and should be included in the return generating process. The residuals, which may containinformation not captured by macrovariables, are derived as the excess returns from a return generatingmodel (URm).
Finally, other variables are subsequently fitted into an autoregressive process so as to derive theirunexpected values, which are subsequently used in the three-factor and macrovariable models.
III. Methodology for Pricing Risk FactorsA. Security Pricing Models and First Stage Regressions
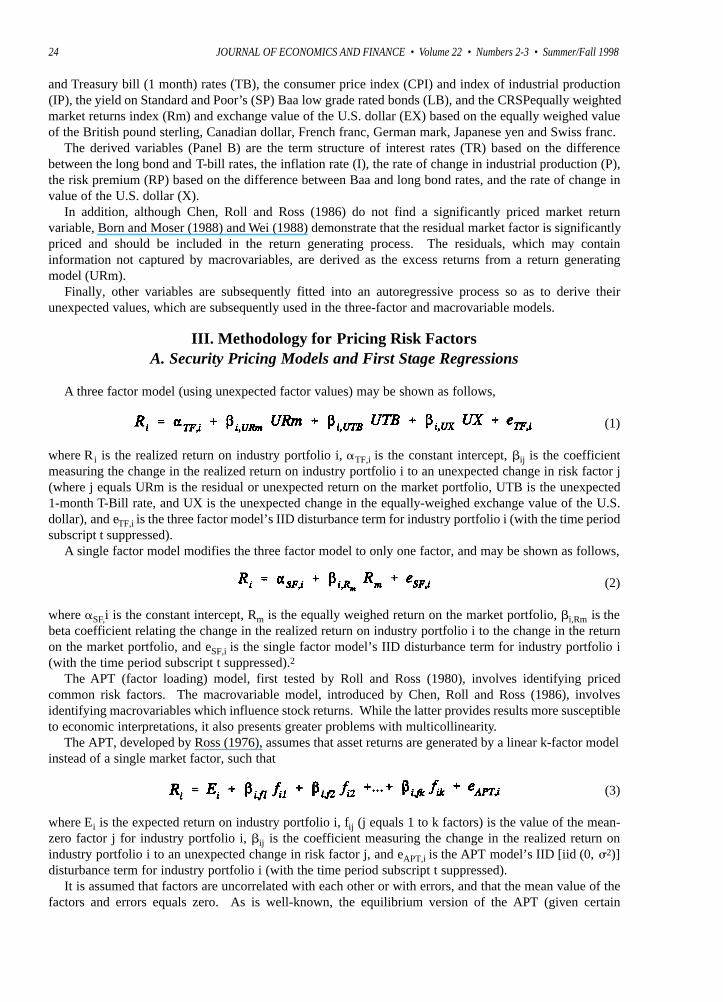
A three factor model (using unexpected factor values) may be shown as follows,
(1)
where R i is the realized return on industry portfolio i, TF,i is the constant intercept, ij is the coefficientmeasuring the change in the realized return on industry portfolio i to an unexpected change in risk factor j(where j equals URm is the residual or unexpected return on the market portfolio, UTB is the unexpected1-month T-Bill rate, and UX is the unexpected change in the equally-weighed exchange value of the U.S.dollar), and eTF,i is the three factor model’s IID disturbance term for industry portfolio i (with the time periodsubscript t suppressed).
A single factor model modifies the three factor model to only one factor, and may be shown as follows,
(2)
where SF,i is the constant intercept, Rm is the equally weighed return on the market portfolio, i,Rm is thebeta coefficient relating the change in the realized return on industry portfolio i to the change in the returnon the market portfolio, and eSF,i is the single factor model’s IID disturbance term for industry portfolio i(with the time period subscript t suppressed).2
The APT (factor loading) model, first tested by Roll and Ross (1980), involves identifying pricedcommon risk factors. The macrovariable model, introduced by Chen, Roll and Ross (1986), involvesidentifying macrovariables which influence stock returns. While the latter provides results more susceptibleto economic interpretations, it also presents greater problems with multicollinearity.
The APT, developed by Ross (1976), assumes that asset returns are generated by a linear k-factor modelinstead of a single market factor, such that
(3)
where Ei is the expected return on industry portfolio i, fij (j equals 1 to k factors) is the value of the mean-zero factor j for industry portfolio i, ij is the coefficient measuring the change in the realized return onindustry portfolio i to an unexpected change in risk factor j, and eAPT,i is the APT model’s IID [iid (0, 2)]disturbance term for industry portfolio i (with the time period subscript t suppressed).
It is assumed that factors are uncorrelated with each other or with errors, and that the mean value of thefactors and errors equals zero. As is well-known, the equilibrium version of the APT (given certain
24 JOURNAL OF ECONOMICS AND FINANCE • Volume 22 • Numbers 2-3 • Summer/Fall 1998

A Comparative Analysis of Security Pricing Using Factor, Macrovariable and Arbitrage Pricing Models 25
orthogonal conditions) may be stated as an exact linear asset pricing relationship, such that3
(4)
where 0 is the risk-free return or the return on the zero-beta asset and j is the risk premium for factor j.4
Finally, the macrovariable model in this study is represented by the following, such that
(5)
where Macro,i is the constant intercept; ij is the coefficient measuring the change in portfolio i’s returnsgiven an unexpected change in macro risk factor j (where j equal URP is the unexpected change in riskpremium, UTR is the unexpected change in term structure of interest rates, UP is the unexpected change inindustrial production, UX is the unexpected change in the equally weighted exchange value of the U.S.dollar, UI is the unexpected change in inflation, and Urm is the residual or unexpected return on the marketportfolio), and eMacro,i is the macrovariable model’s IID disturbance term for industry portfolio i (with thetime period subscript t suppressed).
In contrast to the model presented here, Chen, Roll and Ross (1986) use yearly and monthly industrialproduction indexes, expected and unexpected inflation, risk premia, term structure, consumption, oil pricesand market returns. The latter three are not found to be significantly priced, and multicollinearity problemsare not addressed although a significant incidence is reported. In addition, market returns rather thanresiduals are used, although Born and Moser (1988) demonstrate that its the latter that are linearly dependenton omitted factors.
More recently, Chang (1991) uses yield spread, unanticipated inflation, industrial production,unemployment, default risk, exchange rate and market residuals, with all macrovariables orthogonalizedusing autoregressive processes. Chang finds that market residuals are significantly priced and notes asignificant presence of collinearity.
B. Risk Premiums and Second Stage Regressions
All models are fitted using a version of the Fama-MacBeth (1973 and 1974) two-stage regressionapproach because all models are linear in factor loadings and the factors are measured in time series [seeChen and Jordan (1993)]. In the first stage, OLS time series regressions are performed for each industryportfolio to estimate the sensitivity between the industry portfolio returns and systematic factors. Theseregressions, therefore, follow from the specifications shown above for the three factor and single factormodels [equations (1) and (2)], and macrovariable model [equation (5)].
In the second stage, the factor betas estimated in the first stage are used in pooled cross-section time-series GLS regressions (of the equally weighted industry portfolio returns over time against the factor betas)to obtain coefficients that measure the risk premium pertaining to each factor. Significantly priced cross-sectional regression coefficients (the ’s in the models below) show that the underlying variable isconsidered by the market to be one of the significant risk factors affecting cross-industry portfolio returns.
The second stage pooled cross-section time-series regression for the three-factor model may be shown asfollows,
(6)
where T F, 0 is the constant intercept, the j’s (excluding the intercept) are the regression coefficients definingthe risk premium for each factor beta j ( i j) from the first stage regressions pooled across i industries (where jequals URm, UTB and UX as previously defined), and uT F,all i is the disturbance term. The second stage pooledcross-section time-series regression for the single factor model modifies the three factor model, such that
(7)

where SF,0 is the constant intercept, Rm is the regression coefficient for the cross industry market betas all
i,Rm and uSF,all i is the disturbance term. The second stage regressions for the APT modify the equilibrium pricing relationship shown in equation
[4], such that now a uAPT,i disturbance term would be added to reflect its empirical estimation in a pooledcross-section time series GLS regression.
Finally, the second stage cross-section time-series regression for the macrovariable model may be shownas follows,
(8)
where M a c r o , 0 is the constant intercept, the j’s (excluding the intercept) are the regression coefficients definingthe risk premium for each factor beta j ( i j) from the first stage regressions pooled across industries (where jequals URP, UTR, UP, UX, UI and URm as previously defined), and uMacro,all i is the disturbance term.
C. Unexpected Components and Autoregressive Processes
The use of unexpected components for the variables or factors in multi-factor models provides a solutionfor most multicollinear problems. Moreover, expected values in efficient markets are presumably alreadypriced, so that only unexpected components affect changes in equity returns. Creating othogonal factors isone way to obtain these unexpected values, although Gilberto (1985) shows that this method biases some ofthe estimated parameters and their standard errors. Moreover, problems with this approach have beenexacerbated in recent years by use of even greater numbers of variables in multifactor models. Alternatively,a univariate ARIMA model or AR process may be used to obtain unexpected components of the variables.
Assume that a risk factor RF representing any variable or factor used in the prior models is composed ofexpected and unexpected components, such that
(9)
where ERF represents the expected value of the risk factor and UERF represents its unexpected value(suppressed to period t).
Empirically, an autoregressive process may be fitted to the time series of each RF to estimate itsunexpected value, such that
(10)
where 0 is the constant intercept, k is the coefficient for the k-th lag of the series, and the error term approximately equals the unexpected component. Equation (10) shows an AR(p) process, where p=k,although ARIMA(p,d,q) or ARMA(p,q) processes may work as well. The order of the autoregressionrepresented by Lk may be determined by conventional methods such as Box-Jenkins identification or modelselection criteria.
IV. Comparative Statistical Tests
The four asset pricing models in this study — the single and three factor models, and the APT andmacrovariable models — are compared pair-wise using the Davidson and Mackinnon test, Theil’s U2 testand a residual test. In the Davidson-Mackinnon test, realized industry portfolio returns are cross-sectionallyregressed against two independent variables, namely the predicted industry returns from any two models.For example, using the macrovariable and APT model predictions,
(11)
26 JOURNAL OF ECONOMICS AND FINANCE • Volume 22 • Numbers 2-3 • Summer/Fall 1998

A Comparative Analysis of Security Pricing Using Factor, Macrovariable and Arbitrage Pricing Models 27
where Rit,APT and Rit,MACRO are the industry returns in time t from each model, and the regression coefficientis expected to equal 0.5 if both models are equally powerful in predicting realized industry returns.
However, a significantly greater than 0.5 suggests that the APT is more powerful, since its predictedreturns fit the realized return distribution better, and vice-versa. A similar approach is available for all otherpairs of models considered.
Theil’s U2 test introduces a statistic to measure the improvement of a specific asset pricing model relativeto a naive model (in which predictions are based on a grand mean return for all industries). Theil’s U2 teststatistic, which may also indicate which of various competing models is best, is computed as follows,
(12)
where Ri-bar is the average realized return on industry portfolio i, Ei is the predicted average return onindustry portfolio i based on a specific model and ( Ri-bar)/20 is a naive model’s return, i.e. the averageof the average realized returns on all twenty industry portfolios. A ratio of one shows that a specific modelis no better than a naive model and the fit of a specific model is better the smaller the value of U2.
The residual test requires a cross-section time-series regression of the residuals (pooled across industries)from one asset pricing model regressed against the systematic risk factors (pooled across industries) ofanother model. Significantly priced coefficients indicate that the residuals from a particular model containsystematic information which was not captured by that model. In this case, one conjecture is that thesystematic risk factors in the inferior model do not price all systematic risk, such that some or all of theremaining systematic risk is captured by the superior model. For example, one would expect significant ijcoefficient(s) in the following regression if the residuals from the macrovariable model in equation [5]contain systematic information captured by the APT’s systematic risk factors in equation [3].
(13)
Finally, the relationship between the unknown APT risk factors and the macrovariable model’s variablesis examined through a cross-section time-series regression between each cross-sectionally priced risk factorand the macrovariable time series, such that
(14)
where fk is a cross-sectional APT risk factors, bij is a coefficient relating macrovariable j (where j equalsURP, UTR, UP, UX, UI and URm as previously defined) to APT risk factor k for industry portfolio i, and
i represents the disturbance term (with the time period subscript t suppressed). A set of significantcoefficients for a APTrisk factor suggests that the unknown factor may be identified through its relationshipto the macrovariables.
V. ResultsA. First Stage Regression Results
Tables III through V show the first stage regression’s beta values and significance, and adjusted R2 andF values for the single factor (Table III), three factor (Table IV), and macrovariable models (Table V).5
Table VI shows the values of the coefficients for the top two factors and the contribution of each of fourfactors in explaining the variance of industry returns in the APT.6
Single and Three Factor Models. Table III shows that the monthly and daily single factor model’s betasfor all industries are positive and significant regardless of the period involved. Table IV, Panels A and B,show the monthly and daily three factor model betas. Most noticeable is that the unexpected component ofthe market variable (URm) in the three factor model has positive and significant coefficients across

industries in all periods. Panel A also shows that the coefficients of the unexpected changes in the T-Billrates (UTB) are mostly negative and significant in the 1980-92 and 1980-87 periods, but are positive in the1988-92 period. Panel B shows that these coefficients are mostly negative and significant in 1985-86 andpositive in 1991-92. The coefficients of the unexpected changes in exchange rates (UX) are negative in allperiods, although this variable is the least often significant. The average R2, adjusted for the three factormodel, ranges from 60 to 75 percent for the monthly data, and 42 to 48 percent for the daily data. All Fvalues in both models are high and clearly significant.
Macrovariable Model. Table V, Panels A and B show that the unexpected components of the marketvariable (URm), inflation (UI) and risk premium (URP) are significant for a larger number of industries thanthe other macro-series in the 1980-92 and 1980-87 periods. In contrast, Panel C shows that the unexpectedcomponents of the inflation and risk premium variables are less often significant in the 1988-92 period.Rather, the unexpected components of the term structure (UTR), production (UP) and exchange rate (UX)variables show significance for a higher number of industries than before. This may be explained by therelatively low inflation and interest rates during the 1990-92 recession. The average adjusted R2 values overthese periods range from 60 to 75 percent, and all F values, as before, are significant.
APT Model. Table VI shows that the first two factors in the APT model capture the majority of thevariance in industry returns. Panel A shows the monthly and Panel B the daily data results. The coefficients
28 JOURNAL OF ECONOMICS AND FINANCE • Volume 22 • Numbers 2-3 • Summer/Fall 1998

A Comparative Analysis of Security Pricing Using Factor, Macrovariable and Arbitrage Pricing Models 29
for the top two factor are shown across industries, as are the percentages of the variance in industry returnsexplained by all four factors (SMC or squared multiple correlation column). Also shown at the bottom ofeach panel are the total of the squared factor coefficients for each factor. These values represent the average overall industries of the variance in returns explained by each of the four factors in absolute (the @ values) andpercentage terms (the % values), and their respective cumulative values (the cumulative SMC @ and % rows).
Table VI, Panel A shows that in the 1980-92 period the cumulative SMC was 17.05, and the total of thesquared factor coefficients were 10.28 (69.3 percent), 3.85 (22.6 percent), 2.42 (14.2 percent), and 0.50 (2.9percent) for the factors one through four, respectively. Clearly, the power of the first factor insofar asexplaining the variations in industry returns is the highest, with the fourth providing only marginalexplanatory power. However, the results for the subperiods 1980-87 and 1988-92 in Panel A show a slightlydifferent picture, as the first factor has less (between 34 and 47 percent) and the second factor more (between28 and 32 percent) explanatory power.
Table VI, Panel B shows that in the 1985-86 period the cumulative SMC was 9.38, and the total of thesquared factor coefficient was 6.67 (71.2 percent) for the first factor. The second, third and fourth factorsshow relatively much smaller coefficients with industries, and this can be seen in their relative explanatorypowers (13.8, 14.4 and 3.5 percent, respectively). However, the results for the later 1991-92 period show adifferent picture, as the first factor has substantially less (36.7 percent) and the second factor more (36.2percent) explanatory power.
B. Second Stage Regression ResultsTable VII shows the second stage, pooled cross-section time-series GLS regression results. The
coefficients indicating which risk factors are significantly priced, and Buse’s row moment R2 (an adjustedR2 in GLS), F and Durbin-Watson values for each model in all periods are shown in Panels A through D.7

30 JOURNAL OF ECONOMICS AND FINANCE • Volume 22 • Numbers 2-3 • Summer/Fall 1998

A Comparative Analysis of Security Pricing Using Factor, Macrovariable and Arbitrage Pricing Models 31

Throughout, all F values are high and significant, and the DW statistics are acceptable. Not unexpectedly,the coefficients and Buse’s row moment R2’s are smaller in the daily results when compared to the monthly(because noise influences daily data more).
Single and Three Factor Models. Table VII, Panel A shows the results from the monthly and daily pooledcross-sectional GLS regressions for the single factor model. The results indicate that the single factormodel’s beta is cross-sectionally positively priced in all periods. Buse’s row moment R2 range from 13.19to 15.40 percent for the monthly, and 2.15 to 2.56 percent for the daily cross-sectional regressions.
Table VII, Panel B shows the results for the three factor model. The monthly results show that all factorsare positive and cross-sectionally priced in all periods, except the unexpected changes in the T-bill rates(UTB) in the 1988-92 period. The daily results show that all three factors are positive and cross-sectionallypriced, except the unexpected T-bill and exchange rate variables in the 1991-92 period (significant butnegative). Buse’s row moment R2 range from 11.23 to 11.51 percent for the monthly, and 1.90 to 3.92percent for the daily cross-sectional regressions.
Macrovariable and APT Models. Table VII, Panel C shows the results for the macrovariable model. Inaddition to the unexpected return on the market portfolio (URm), the unexpected risk premium (URP) andunexpected exchange rates (UX) are significantly priced in each period. While the unexpected term
32 JOURNAL OF ECONOMICS AND FINANCE • Volume 22 • Numbers 2-3 • Summer/Fall 1998

A Comparative Analysis of Security Pricing Using Factor, Macrovariable and Arbitrage Pricing Models 33
structure (UTR) was also significantly priced in the 1980-87 period, neither this variable or inflation weresignificantly priced in the 1988-92 period. Hence, the importance for asset pricing of inflation and interest ratesdiminished in the latter period. Buse’s row moment R2 range from 14.36 to 15.04 percent for these regressions.
Table VII, Panel D shows the results for the APT. Multiple cross-sectionally priced factors exist in eachperiod, although all factors are significantly priced only in the 1988-92 period. The first factor is alwayssignificantly priced. The third and fourth factors are also significantly priced in the 1980-92, 1988-92 and1985-86 periods, and only two factors significantly priced in the other periods. Buse’s row moment R2 rangefrom 13.01 to 41.30 percent for the monthly regressions, and equals about 2.8 percent for the daily.
C. Comparison of Models
Davidson-Mackinnon and Theil’s U2 Results. Table VIII, Panels A to F, show the results of the Davidson-Mackinnon pooled cross-sectional GLS regressions, including the Buse row moment R2, F and Durbin-Watson values. The actual returns for each industry are regressed against the estimated returns obtainedfrom any pair of models. In all the regressions, the R2 is generally high, the F values are high andsignificant, and the Durbin-Watson values acceptable. In this test, the magnitude of the coefficients provides

evidence on the superiority of one model over another, as the coefficients should not be statisticallysignificantly different from 0.5 if a pair of models are equally powerful.
The results in Table VIII are consistent in showing evidence on the superiority of one model in eachpairing, supported by significant t and joint F-tests rejecting the hypothesized coefficient values. Panels F,E and D show that the APT is superior to the macrovariable, three factor and single factor models,respectively. Among the latter three models, Panels C and B show that the macrovariable model is superiorto the three factor and single factor models, respectively. Finally, Panel A shows that the three factor modelis superior to the single factor model.
Table IX shows T h e i l ’s U2 ratio test results which, if less than one, represents improvement relative to anaive model. The test results show that the A P T is clearly superior insofar as its U2 ratio is lower than thealternative models in all periods. Further, while the three factor model appears marginally better than the singlef a c t o r, comparison of the U2 ratios of the macrovariable model with these models produces mixed results.
Residual Test Results. Table X shows which risk factors from alternative models are significantly related(at the five percent level) to the residuals from a given model. The test aims to show whether the residualsfrom one model contain systematic information which, although not priced by its own model, may be pricedby another model’s risk factors.
34 JOURNAL OF ECONOMICS AND FINANCE • Volume 22 • Numbers 2-3 • Summer/Fall 1998

A Comparative Analysis of Security Pricing Using Factor, Macrovariable and Arbitrage Pricing Models 35
The single factor residuals are the most frequently priced by the risk factors from the alternative models.All four factors in the A P T significantly price these residuals at one time or another. The unexpected termstructure (UTR) risk factor in the macrovariable model, and the unexpected Treasury bill (UTB) and exchangerate (UX) risk factors in the three factor model, also significantly price the single factor’s residuals.
The three factor model’s residuals are most often (with monthly data only) significantly priced by theAPT’s second risk factor (f2) and the macrovariable model’s unexpected risk premium (URP).

36 JOURNAL OF ECONOMICS AND FINANCE • Volume 22 • Numbers 2-3 • Summer/Fall 1998

A Comparative Analysis of Security Pricing Using Factor, Macrovariable and Arbitrage Pricing Models 37
The APT and macrovariable model’s residuals are least frequently priced by the risk factors from thealternative models. The macrovariable model’s residuals are priced some of the time (with monthly dataonly) by the APT’s first risk factor (f1) and the three factor model’s unexpected Treasury bill (UTB). TheAPT residuals are priced some of the time (with monthly data only) by the macrovariable model’sunexpected industrial production (UP) and unexpected term structure (UTR) risk factors. Neither of theseresiduals are priced by the other model’s risk factors with daily data.
C l e a r l y, the single factor model is inferior to all other models. Its risk factor plays no role in pricing theresiduals from any of the alternative models, and by the same token, its residuals are most frequently priced bythe alternative model’s risk factors. On the other hand, the A P T and macrovariable models are superior in thesense that their residuals are least often priced by the alternative models’ risk factors. Moreover, the A P T i ssuperior to the macrovariable model, consistent with Connor (1995), since it systematically captures informationwith its first common risk factor embedded in the monthly residuals from the macrovariable model.
D. Relation Between APT Factors and Macrovariable Model’s Variables
Table XI shows the results of the cross-sectional regressions [the form is shown in equation (14)] to examinewhether a link exists between the A P T risk factors and the macrovariable model’s variables. The aim is to seeif some economic meaning may be attached to the statistically produced unknown A P T risk factors.
Some immediate observation from this table are that no risk factor is significantly related to theunexpected term structure (UTR) and production (UP) macrovariables, and the fourth factor has norelationship to any macrovariable in any period.
The most consistent relations between factors and macrovariables occur in the 1988-92 period (Panel C).In this period, the second and third factors are significantly negatively related to the unexpected riskpremium (URP) and unexpected market returns (URm), and positively related to unexpected exchange rates(UX). The regressions in both cases show high R2, significant F and acceptable Durbin Watson values.Moreover, the first and fourth factors are unrelated to any macrovariables in this period.
The only consistent trends in the other two periods (Panel A for 1980-92 and Panel B for 1980-87)concerns the first and third factors. In both periods, the first factor is negatively related to URP andpositively related to URm, and the third factor is negatively related to URm. Overall, after the stock marketcrash, the risk premium and exchange rate macrovariables became more important than before in identifyingAPT risk factors two and three. Risk factor three was most consistent in also showing a relation to marketreturns in all three periods. The fourth factor cannot be identified based on the macrovariables, and the termstructure and production are never significant in identifying the risk factors.

VI. Summary and Conclusions
This study compares and contrasts the single factor, three factor, macrovariable and A P T security pricingmodels. It uses a version of the two-step Fama-MacBeth procedure to price risk factors, and the Davidson-Mackinnon, Theil U2 and residual tests to compare the models. Regression analysis is also used to examine therelation between the A P T factors and the macrovariable model’s variables. The sample consists of all 1,037 firmsavailable in the CRSPtape from January 1, 1980 to December 31, 1992 with no missing daily observations.
The beta for the single factor model’s market return variable, and for the three factor and macrovariablemodels’ unexpected component of the market return variable, are positive and significant across allindustries and time periods studied. The single factor model’s market beta and the three factor model’s betafor the unexpected market return variable are also cross-sectionally positively priced in all periods.
The macrovariable model shows that inflation and risk premiums were more important before 1987, andterm structure, production and exchange rates more important after. However, in addition to the beta for theunexpected return on the market portfolio (URm), only the betas for unexpected risk premium (URP) andunexpected exchange rates (UX) were significantly priced in each period.
The APT’s first two factors capture the majority (70 to 90 percent) of the variance in industry returnsacross industries and periods. However, the beta for the first factor is the only one significantly pricedacross all periods, with the third and fourth factors also most often significantly priced.
The Davidson-Mackinnon and Theil’s U2 tests show that the APT is superior to the alternative models.The former also shows that the macrovariable model is superior to the three factor model, which itself issuperior to the single factor model. The latter also shows that the three factor model is marginally betterthan the single factor.
The residual test shows that the single factor model is inferior to all other models. The residual test alsoshows that the APT and macrovariable models are superior, because their residuals are least often priced bythe alternative models’ risk factors. This test, however, suggests that the APT is better than themacrovariable model, because the former’s first common risk factor systematically captures informationwhich is presumably leftover in the latter’s monthly residuals.
Comparisons between the APT’s factors and the macrovariable model’s variables indicate that, after thestock market crash, the risk premium and exchange rate became more important in identifying APT riskfactors two and three. Risk factor three was also most consistent in showing a relation to market returns inall three periods. The fourth factor is never identified in terms of macrovariables, and the term structure andproduction macrovariables are never significant in identifying risk factors.
REFERENCESBorn, J.A. and J.T. Moser, “An Investigation Into the Role of the Market Portfolio in the Arbitrage Pricing
Theory,” Financial Review, Vol.23, No. 3 (August 1988), 287-299.
Chamberlain, G. and M. Rothschild, “Arbitrage Factor Structure, and Mean-Variance Analysis on LargeAsset Markets,” Econometrica, Vol. 51 (1983), 1281-1304.
Chang, S.J., “AStudy of Empirical Return Generating Models: AMarket Model, AMultifactor Model, and AUnified Model,” Journal of Business, Finance and A c c o u n t i n g, Vol. 18, No. 3 (April 1991), 377-391.
Chen, Nai-Fu and Jonathan E. Ingersoll, Jr., “Exact Pricing in Linear Factor Models with Finitely ManyAssets: A Note,” Journal of Finance, Vol. 38, No. 3 (1983), 985-988.
Chen, Nai-Fu, Richard Roll and Stephen A. Ross, “Economic Factors and the Stock Market,” Journal ofBusiness, Vol. 59, No. 3 (July 1986), 383-403.
Chen, Su-Jane and Bradford D. Jordan, “Some Empirical Tests in the Arbitrage Pricing Theory:Macrovariable vs Derived Factors,” Journal of Banking and Finance, Vol. 17 (1993), 65-89.
Cho, D.C. and Edwin J. Elton and Martin J. Gruber, “On the Robustness of Roll and Ross APT,” JournalFinancial and Quantitative Analysis, Vol.19(1), 1984, 1-10.
Choi, Jongmoo Jay and Elyas Elyasiani and Kenneth J. Kopecky, “The Sensitivity of Bank Stock Returnsto Market, Interest and Exchange Rate Risk,” Journal of Banking & Finance, Vol. 16, No. 5(September 1992), 983-1004.
38 JOURNAL OF ECONOMICS AND FINANCE • Volume 22 • Numbers 2-3 • Summer/Fall 1998

A Comparative Analysis of Security Pricing Using Factor, Macrovariable and Arbitrage Pricing Models 39
Connor, Gregory, “AUnified Beta Theory,” Journal of Economic Theory, Vol. 34 (1984), 13-31.
Connor, Gregory, “The Three Types of Factor Models: A Comparison of Their Explanatory Power,”Financial Analysts Journal, Vol. 51, No. 3 (May/June 1995), 42-46.
Davidson, R. and J. Mackinnon, “Several Tests for Model Specification in the Presence of AlternativeHypotheses,” Econometrica, May 1981, 781-793.
Fama, Eugene F. and James D. MacBeth, “Long-term Growth in a Short-term Market,” Journal of Finance,(1974), pp. 857-885.
Fama, Eugene F. and James D. MacBeth, “Risk, Return and Equilibrium: Empirical Tests,” Journal ofPolitical Economy, (1973), pp. 607-636.
Gilberto, Michael, “Interest Rate Sensitivity in the Common Stocks of Financial Intermediaries: A M e t h o d o l o g i c a lNote,” Journal of Financial and Quantitative A n a l y s i s, Vol .20, No. 1 (March 1985), 123-126.
Harris, John M. and M. Wayne Marr and Michael F. Spivey, “Exchange Rate Movements and Stock Returnsof U.S. Commercial Banks,” Journal of Business Research, Vol. 22, No. 3 (May 1991), 233-242.
Ingersoll, Jonathan, “Some Results in the Theory of Arbitrage Pricing,” Journal of Finance, Vol. 39 (1984),1021-1039.
Jorion, Philippe, “The Pricing of Exchange Rate Risk in the Stock Market,” Journal of Financial andQuantitative Analysis, Vol.26, No. 3 (September 1991), 363-376.
Kim, M.K. and C. Wu, “Macro-Economic Factors and Stock returns,” Journal of Financial Research,Vol.10(2), Summer 1987, 87-98.
Otuteye, E., “ABilinear Paradigm Test of the Arbitrage Pricing Theory,” International Review of Economicsand Finance, Vol.1(3), 1992, 203-217.
Pettway, R.H. and B.D. Jordan, “APT vs CAPM Estimates of the Return-Generating Functions Parametersfor Regulated Utilities,” Journal of Financial Research, Vol.10(3), Fall 1987, 227-238.
Roll, Richard and Stephen A. Ross, “An Empirical Investigation of the Arbitrage Pricing Theory,” Journalof Finance, Vol. 35, No. 5 (December 1980), 1073-1103.
Ross, Stephen A., “The Arbitrage Theory of Capital Asset Pricing,” Journal of Economic Theory, Vol.13(1976), 341-360.
Ross, Stephen A., “An Empirical Investigation of the Arbitrage Pricing Theory,” Journal of Finance, Vol.35, No. 5 (1980), 1073-1103.
Ross, Stephen A. and Philip H. Dybvig, “Yes, The APT is Testable,” Journal of Finance, Vol. 40, No. 4(1985), 1173-1188.
Shanken, Jay, “The Arbitrage Pricing Theory: Is it Testable ?,” Journal of Finance, Vol. 37, No. 5(December 1982), 1129-1140.
Stone, Bernell K., “Systematic Interest-Rate Risk in a Two-Index Model of Returns,” Journal of Financialand Quantitative Analysis, Vol. 9 (November 1974), 709-721.
Theil, H., Applied Economic Forecasting (North-Holland, Amsterdam), 1966.
Wei, K.C. John, “An Asset-Pricing Theory Unifying the CAPM and APT,” Journal of Finance, Vol. 63, No.4 (September 1988), 881-892.
Weinstein, Mark I. and Stephen J. Brown, “ANew Approach to Testing Asset Pricing Models: The BilinearParadigm,” Journal of Finance, Vol. 38, No. 3 (1983), 711-743.
Weinstein, Mark I. and Stephen J. Brown, “Derived Factors in Event Studies,” Journal of FinancialEconomics, Vol. 14, No. 3 (1985), 491-495.
NOTES
1. The SHAZAM software can read up to 700 variables at once. However, in pooling cross-sectional GLSregressions each observation point becomes a variable limiting significantly the extent of analysis. Hence, it isnot possible to perform pooling GLS regressions for more than a two-year period of daily observations.

2. The single index model may be shown to be equivalent to the CAPM under certain restrictingconditions, as shown below, such that since the CAPM is
Ri = Rf + iRM (RM-Rf)then
Ri = Rf - iRf + iRMor
Ri = ci + iRM + ei
where the constant intercept ci for industry i is restricted to equal Rf - + i Rf, RM is the equally-weightedreturn on the market portfolio, and ei is the disturbance for industry i (all suppressed at time t). Thisrepresentation of the CAPM also requires removal of the restriction that the covariance of error termsbetween different industries must equal zero, i.e. cov(eiej) need not equal zero.
3. The orthogonal conditions concern the extent of risk and investment involved in a well diversifiedportfolio, and its corresponding returns. Additionally, Ross (1976,1980) and others have shown that withno arbitrage opportunities, if the errors are serially uncorrelated and have bounded variances, then theexpected returns must satisfy the following approximation as the number of assets approaches infinity.
where “ “ represents approximately equal, and 0 is the risk free return on the zero-beta asset and j isthe risk premium for factor j. Chamberlain and Rothschild (1983) and Ingersoll (1984) extend Ross’s APTand show that this equation holds even for an approximate factor structure. The former provide necessaryand sufficient conditions to transfer the approximate pricing relation into an exact pricing relation as shownin equation [4]. The conditions require the existence of a risky well diversified portfolio on the mean-variance efficient frontier.
4. An infinite number of securities and the commonly known number of factors explaining the expectedreturns are the most restrictive assumptions of the APT. Competitive capital markets and a linear assetpricing factor structure are generally viewed as an acceptable reflection of reality. Connor (1984) showsthat as long as the market portfolio is well diversified in a given factor structure, ignoring the infinitenumber of risky asset assumption does not affect the asset pricing relation. Chen and Ingersoll (1983)support Connor’s conclusion by asserting that a well diversified market portfolio exists and that thisportfolio is the optimal portfolio for at least one utility maximizing economic agent.
5. The partial autocorrelation structure of the three factor and macrovariable models’ variables up to 12lags for monthly and daily observations were examined, as were the Q test statistics for up to 24 lags. Alltime series show high autocorrelations in their small lags, and their Q(24) test statistics are higher than thecritical values. After fitting an autoregressive process into each time series, the residuals appear to be to becompletely free of autocorrelations at any lags, and the Q(24) test statistics become much smaller, indicatingthat the autoregressive processes adequately separate the unexpected components from the expected. Theresiduals from the fitted autoregressive process represent the unexpected component of the variables, andare expected to be independent of each other. The correlation matrix for the three factor and macrovariablemodel’s variables, respectively, show no significant multicollinearity, such that use of these generatedregressors will not cause biased estimation.
6. The statistical common risk factors are produced by a computer package, which is available in SASand SHAZAM. Although the number of factors and the kind of rotation on the common risk factors aresomewhat arbitrarily chosen, the empirical results supports the choice of four factors and the VARIMAX
40 JOURNAL OF ECONOMICS AND FINANCE • Volume 22 • Numbers 2-3 • Summer/Fall 1998

A Comparative Analysis of Security Pricing Using Factor, Macrovariable and Arbitrage Pricing Models 41
rotation. By construction the common risk factors are uncorrelated with each other. If the factors are rotatedby an orthogonal transformation, the rotated factors are also uncorrelated. The rotation of the set of factorsdoes not change the statistical explanatory power of the factors such that any rotation is statistically as goodas another. The relevant eigenvalues and the cumulative percentage variation show that the first factor’seigenvalue is 79.449 and the fourth factor’s only .994. The cumulative variation explained by the first factoris 94.3% and with the fourth factor 99.9%. Therefore, extraction of another factor will not add any powerto the model, but will have a reverse effect by including overlapping risk factors. The set of four commonfactors is rotated by using VARIMAX rotation because VARIMAX is the most commonly used rotationmethod in the literature.
7. For the monthly observations, one cross-sectional data set for each month is constructed, and onepooled cross-section time series regression is run for all months in the period. A similar approach on a dailybasis is used for the daily observations. A total of 156 cross-sectional data sets (3120 observations) for thewhole period (1980-92), 96 cross-sectional data sets (1920 observations) for the first subperiod (1980-87),and 60 cross-sectional data sets (1200 observations) for the second subperiod (1988-92) are utilized to runpooled cross-section time-series GLS regressions for the monthly observations. A total of 505 cross-sectional data sets (10,100 observations) for the first period (1985-86), and 507 cross-sectional data sets(10,140 observations) for the second period (1991-92) are utilized to run pooled cross-section time-seriesGLS regressions for the daily observations.

Copyright © 2022 FDOKUMEN