A Comparative Analysis of Dynamic and Static Indicators of Parasympathetic and Sympathetic Nervous...
25
This article was downloaded by: [Dr Robert Potter] On: 23 March 2015, At: 03:40 Publisher: Routledge Informa Ltd Registered in England and Wales Registered Number: 1072954 Registered office: Mortimer House, 37-41 Mortimer Street, London W1T 3JH, UK Click for updates Communication Methods and Measures Publication details, including instructions for authors and subscription information: http://www.tandfonline.com/loi/hcms20 A Comparative Analysis of Dynamic and Static Indicators of Parasympathetic and Sympathetic Nervous System Activation During TV Viewing K. Jacob Koruth a , Annie Lang a , Robert F. Potter a & Rachel L. Bailey b a Institute for Communication Research b Washington State University Published online: 17 Mar 2015. To cite this article: K. Jacob Koruth, Annie Lang, Robert F. Potter & Rachel L. Bailey (2015) A Comparative Analysis of Dynamic and Static Indicators of Parasympathetic and Sympathetic Nervous System Activation During TV Viewing, Communication Methods and Measures, 9:1-2, 78-100, DOI: 10.1080/19312458.2014.999752 To link to this article: http://dx.doi.org/10.1080/19312458.2014.999752 PLEASE SCROLL DOWN FOR ARTICLE Taylor & Francis makes every effort to ensure the accuracy of all the information (the “Content”) contained in the publications on our platform. However, Taylor & Francis, our agents, and our licensors make no representations or warranties whatsoever as to the accuracy, completeness, or suitability for any purpose of the Content. Any opinions and views expressed in this publication are the opinions and views of the authors, and are not the views of or endorsed by Taylor & Francis. The accuracy of the Content should not be relied upon and should be independently verified with primary sources of information. Taylor and Francis shall not be liable for any losses, actions, claims, proceedings, demands, costs, expenses, damages, and other liabilities whatsoever or howsoever caused arising directly or indirectly in connection with, in relation to or arising out of the use of the Content. This article may be used for research, teaching, and private study purposes. Any substantial or systematic reproduction, redistribution, reselling, loan, sub-licensing, systematic supply, or distribution in any form to anyone is expressly forbidden. Terms &
Transcript of A Comparative Analysis of Dynamic and Static Indicators of Parasympathetic and Sympathetic Nervous...
This article was downloaded by: [Dr Robert Potter]On: 23 March 2015, At: 03:40Publisher: RoutledgeInforma Ltd Registered in England and Wales Registered Number: 1072954 Registeredoffice: Mortimer House, 37-41 Mortimer Street, London W1T 3JH, UK
Click for updates
Communication Methods and MeasuresPublication details, including instructions for authors andsubscription information:http://www.tandfonline.com/loi/hcms20
A Comparative Analysis of Dynamic andStatic Indicators of Parasympathetic andSympathetic Nervous System ActivationDuring TV ViewingK. Jacob Korutha, Annie Langa, Robert F. Pottera & Rachel L. Baileyb
a Institute for Communication Researchb Washington State UniversityPublished online: 17 Mar 2015.
To cite this article: K. Jacob Koruth, Annie Lang, Robert F. Potter & Rachel L. Bailey (2015) AComparative Analysis of Dynamic and Static Indicators of Parasympathetic and Sympathetic NervousSystem Activation During TV Viewing, Communication Methods and Measures, 9:1-2, 78-100, DOI:10.1080/19312458.2014.999752
To link to this article: http://dx.doi.org/10.1080/19312458.2014.999752
PLEASE SCROLL DOWN FOR ARTICLE
Taylor & Francis makes every effort to ensure the accuracy of all the information (the“Content”) contained in the publications on our platform. However, Taylor & Francis,our agents, and our licensors make no representations or warranties whatsoever as tothe accuracy, completeness, or suitability for any purpose of the Content. Any opinionsand views expressed in this publication are the opinions and views of the authors,and are not the views of or endorsed by Taylor & Francis. The accuracy of the Contentshould not be relied upon and should be independently verified with primary sourcesof information. Taylor and Francis shall not be liable for any losses, actions, claims,proceedings, demands, costs, expenses, damages, and other liabilities whatsoever orhowsoever caused arising directly or indirectly in connection with, in relation to or arisingout of the use of the Content.
This article may be used for research, teaching, and private study purposes. Anysubstantial or systematic reproduction, redistribution, reselling, loan, sub-licensing,systematic supply, or distribution in any form to anyone is expressly forbidden. Terms &

Conditions of access and use can be found at http://www.tandfonline.com/page/terms-and-conditions
Dow
nloa
ded
by [
Dr
Rob
ert P
otte
r] a
t 03:
40 2
3 M
arch
201
5
Communication Methods and Measures, 9:78–100, 2015Copyright © Taylor & Francis Group, LLCISSN: 1931-2458 print/1931-2466 onlineDOI: 10.1080/19312458.2014.999752
A Comparative Analysis of Dynamic and Static Indicatorsof Parasympathetic and Sympathetic Nervous System
Activation During TV Viewing
K. Jacob Koruth, Annie Lang, and Robert F. PotterInstitute for Communication Research
Rachel L. BaileyWashington State University
The goal of this paper is to examine the relative validity of a set of psychophysiological measuresas psychological correlates of attention and arousal when watching moving audio/visual messages.To do this, participants watched film clips selected to vary on three media variables known to influenceboth attention and arousal: structural pacing (slow or fast), valence of emotion (pleasant, unpleas-ant), and level of arousing content (calm, arousing). Heart rate and skin conductance were measuredtime-locked to the presentation of each film clip. A variety of analysis techniques for each of thesemeasures, some dynamic and some static, were compared with one another on their ability to performin a manner suggested by general theoretical predictions. Strengths and weaknesses of each measureare identified based on these comparisons and recommendations about best practices are made.
INTRODUCTION
Media researchers have long been in search of reliable and valid, covert, real-time indicators ofthe level of attention and arousal elicited in media users by messages. The goal of this paperis to compare the relative validity of a set of psychophysiological measures as psychologicalcorrelates of attention and arousal when watching moving audio/visual messages. Strengths andweaknesses of each measure are identified and, based on these comparisons, recommendationsabout best practices are made. To conduct these comparisons, we asked participants to watch filmclips selected to vary on three media variables known to influence both attention and arousal:structural pacing (slow or fast), valence of emotion (pleasant or unpleasant), and level of arousingcontent (calm or arousing). Heart rate and skin conductance were measured time-locked to thepresentation of each film clip. A variety of analysis techniques for each of these measures, some
This paper is a distillation of K. Jacob Koruth’s dissertation. Jacob received his doctorate in Mass Communication atIndiana University in 2010. Jacob died suddenly in 2012 before publishing this work. We hope Jacob is pleased that hiswork will live on.
Correspondence should be addressed to Robert F. Potter, Institute for Communication Research, The Media School,Indiana University, 1229 E. Seventh Street, Bloomington, IN 47405. E-mail: [email protected]
Dow
nloa
ded
by [
Dr
Rob
ert P
otte
r] a
t 03:
40 2
3 M
arch
201
5
COMPARATIVE INDICATORS OF PNS AND SNS DURING TV VIEWING 79
dynamic and some static, were carried out and their ability to perform in a manner suggested bygeneral theoretical predictions compared.
THEORETICAL PROPOSITIONS
To assess the strengths and weaknesses of different psychophysiological measurements, we beginwith three general claims about the expected impact of variables known to affect cognition andemotion in audiences. We suggest the following general propositions based on the results of manystudies—from multiple theoretical perspectives—that examine the influence of these variables onattention and arousal:
Proposition 1: Arousing content is thought to increase both arousal and attention (Bolls, Lang,& Potter, 2001; Everett & Palmgreen, 1995; Grabe, Zhou, Lang, & Bolls, 2000; Lang, Dhillon, &Dong, 1995; Stephenson & Palmgreen, 2001; Wirth & Schramm, 2005).
Proposition 2: Structural pacing is thought to increase both arousal and attention (Detenber,Simons, & Bennett, 1998; Grabe, Zhou, Lang, & Bolls, 1998; Hitchon, Thorson, & Duckler,1994; Kang, Cappella, & Fishbein, 2006; Palmgreen, Stephenson, Evertt, Baseheart, & Francies,2002; Simons, Detenber, Roedema, & Reiss, 1999; Thorson, Reeves, & Schleuer, 1985; Thorson,Reeves, & Schleuder, 1986).
Proposition 3: Compared with rational or neutral messages, emotional messages are alsothought to increase attention and arousal, and the predominance of evidence suggests that negativemessages are more compelling (i.e., elicit more attention) than positive and that they are alsogenerally more arousing (Brosius, 1993; Friestad & Thorson, 1986; Lapinski, Neuberger, Gore,Muter, & Van der Heide, 2013; Newhagen & Reeves, 1992; Reeves, Newhagen, Maibach, Basil,& Kurz, 1991; Shoemaker, 1996; Wirth & Schramm, 2005).
Of course, the picture is not as simple as the propositions suggest. Interactive effects may occuramong these independent variables on both attention and arousal measured using physiologicalvariables. Still, one would hope that valid autonomic measures of attention and arousal wouldfrequently produce significant main effects of the independent variables in directions predictedby these general propositions.
At the same time, we would expect cross validation with behavioral variables thought to cor-relate with attention and arousal. Self-reported arousal and valence should relate to the level ofarousal and direction of valence in the content, and recognition memory for message contentshould be related to attention. Comparing the extent to which each indicator, self-reported andphysiological, matches theoretical expectations and produces results similar to those produced bythe other indicators will allow us to determine relative levels of validity for the set of indicatorsand analytical techniques under review. In addition, we may find that some measures providebetter indicators of attention and/or arousal when addressing some of these propositions but notfor others.
Physiology and Psychophysiological Measures of Attention And Arousal
Psychophysiological measures, according to Cacioppo, Tassinary, and Bernstson (2007), are,from a scientific and measurement point of view, “monstrosities” (p. 20). This is because there isnot a one-to-one correspondence between psychological measures and physiological measures.At any given time a physiological measure is being determined by a myriad of factors, including
Dow
nloa
ded
by [
Dr
Rob
ert P
otte
r] a
t 03:
40 2
3 M
arch
201
5
80 K. J. KORUTH ET AL.
physical activity, emotional state, stress, context, and thinking (Lang, Potter, & Bolls, 2009).Further, a single measure can be related to several different psychological variables of interestand the degree of correlation may depend on context (e.g., startle potentiation and inhibition isused as an indicator of aversive motivational activation in some contexts and of attention in oth-ers; Lang, Bradley, & Cuthbert, 1997). For this reason one cannot simply take a physiologicalmeasure validated in one context and plunk it down in another and expect to get the same results.Instead one must do a certain number of studies aimed at detecting similarities and differences inthe pattern of relationships between the measure and the psychological correlate in the differentcontexts (Cacioppo et al., 2007).
A great deal of the psychophysiological research being done in mediated contexts today ismodeled on the methodological paradigm developed for still pictures by Peter Lang and his col-leagues at the NIMH Center for the Study of Emotion and Attention (Lang, Greenwald, Bradley,& Hamm, 1993; Bradley & Lang, 2000a; Bradley, Codispoti, Cuthbert, & Lang, 2001) . This workuses normalized sets of still pictures presented for six seconds as stimuli that elicit both attentionand emotion. The underlying theoretical approach is a dimensional emotion theory based on adual system motivational theory. The normalized pictures are organized along the two primarydimensions of emotion, valence—or the pleasantness or unpleasantness of the stimulus—andarousal—the extent to which the stimulus is exciting and arousing (Bradley & Lang, 2000a).Specifically, it is theorized that emotional stimuli automatically activate the underlying biologicalappetitive (approach) and aversive (avoid) systems (Cacioppo, Bernston, Larsen, Poehlmann, &Ito, 2000). This activation of motivational systems leads to both attention and arousal (Bradley &Lang, 2000b) and is supported by the two branches of the autonomic nervous system (ANS): theparasympathetic nervous system (PNS) and the sympathetic nervous system (SNS). Of impor-tance to this study, the PNS is thought to generally activate in support of attention while theSNS is thought to generally activate in support of behavior (approach and avoid). For somepsychophysiological indicators the substrates being measured are primarily innervated by theSNS while some are primarily innervated by the PNS and some are innervated by both systems(Cacioppo et al., 2007; Potter & Bolls, 2012).
Of interest here are findings that describe how heart rate (HR) and skin conductance (SC)are related to arousal and attention (Lang et al., 1993). SC is innervated solely by the SNS andis thought to be a pure measure of SNS activation (Lykken & Venables, 1971; Stern, Ray, &Quigley, 2001). HR, on the other hand, is innervated by both the PNS and the SNS. This meansthat HR slows down in response to PNS activation and speeds up in response to SNS activation(Lang, 1994; Potter & Bolls, 2012). Some stimuli compel attention and elicit arousal, resulting inboth PNS and SNS activation. Depending on the context and stimuli, however, one system maydominate resulting in a relationship with either attention or arousal but not both.
Relationships between a stimulus and psychophysiological responses are inherently dynamic.They begin at stimulus onset and are best measured continuously during stimulus presentation.As a result, relationships are expressed as patterns of response rather than as differences betweenmeans (Potter & Bolls, 2012). Increases and decreases in a measure over time are reflectiveof increases and decreases in activation of the PNS and the SNS. It should also be noted thatpsychophysiological measures do not give a metric of activation in the systems but rather showrelative differences in the level of activation for different types of stimuli.
A great deal of research, which is well summarized in Lang et al. (1993), has shown that theinitial heart rate response to the presentation of brief emotional stimuli tends to be deceleratory,resulting in a decrease in HR measured in beats-per-minute. This deceleration, which is larger
Dow
nloa
ded
by [
Dr
Rob
ert P
otte
r] a
t 03:
40 2
3 M
arch
201
5
COMPARATIVE INDICATORS OF PNS AND SNS DURING TV VIEWING 81
for more arousing stimuli, is caused by PNS activation and related to orienting/attention. Overthe course of a six-second stimulus presentation, HR has been shown to increase in response topleasant and decrease in response to unpleasant messages. So, in this paradigm the initial heartrate response is related to attention and is influenced by the level of arousing content. Later HRchange is related to the valence of the stimulus and self-reported pleasantness.
SC on the other hand is related to the level of arousing content in the stimuli and participant’sself-reported arousal and interest. Continuous measures of SC, called skin conductance level(SCL), show an initial increase in response to message onset, the height and duration of whichis influenced by the level of arousing content (Lang et al., 1993). Two static or whole-messageindicators can also be calculated based on the phasic or short-term properties of the skin conduc-tance response (SCR). These are skin conductance frequency (SCF) equal to the number of SCRsin a message and skin conductance amplitude (SCA) equal to the largest SCR amplitude in themessage (Dawson, Schell, & Fillion, 2000). To sum up, increases in SC are likely due to increasesin SNS activation and decreases in SC are likely due to decreases in SNS activation. Thus, whilethe contextual variables that impact the SNS must be rigorously accounted for (making sure thesubject is not moving around and there is nothing in the environment other than the stimulus thatelicits SNS activation), the fact that SC is measured via activity in sweat glands solely innervatedby the SNS allows for a nearer supposition of a one-to-one correspondence.
The HR story, however, is not so simple and nicely demonstrates the “monstrosity” problem(Cacioppo et al., 2000). We see that initially the HR is reflecting increased PNS activation andthat we get more such activation for more arousing messages (Lang et al., 1993). In addition,because we know from the SC results that the SNS also activates for arousing messages, we canconclude from the overall deceleration of HR that the PNS activation is dominating the SNSactivation early in the message. Later in the message, we see faster HR for positive comparedto negative messages which may be due either to lower PNS, higher SNS, or a combination ofthe two.
Validating the Picture Paradigm for Moving Audio Visual Stimuli
A series of studies was done by communication researchers based on this paradigm to determineif the basic relationships established in still image processing held when stimuli were movingaudio/visual images (e.g., television) of much longer duration (Bolls, Lang, & Potter, 2001; A.Lang, 1990, 1994; A. Lang, Bolls, Potter, & Kawahara, 1999; A. Lang, Chung, Lee, & Schwartz,2002; A. Lang, Dhillon, & Dong, 1995; A. Lang, Newhagen, & Reeves, 1996; A. Lang, Zhou,Schwartz, Bolls, & Potter, 2000). Results of this research demonstrated that, in general, HR wasrelated to attention, with slower HR indicating increased attention (A. Lang, 1990, 1994). As inthe picture paradigm, more arousing content resulted in slower HR, usually lasting over the entirecourse of the message (A. Lang et al., 1999). Very little indication of a relationship between HRand valence was seen. This is likely because of the different nature of the stimuli (Bolls, Lang,& Potter, 2001). Still pictures do not change; so once there is an initial deceleration related toarousing content, HR can change based on the content of the static image. HR may be increasingfor positive static images because they are less compelling, in other words due to a decrease inPNS, or because they are more arousing than negative pictures, in other words an increase inSNS, or both. Moving pictures, on the other hand, are continuously changing and the level ofemotion elicited is waxing and waning over time. In this situation it is likely that the changing
Dow
nloa
ded
by [
Dr
Rob
ert P
otte
r] a
t 03:
40 2
3 M
arch
201
5
82 K. J. KORUTH ET AL.
stimulus continues to prompt motivationally driven attentional responses resulting in dominationof the PNS over the SNS even when the material is arousing.
For skin conductance, higher levels of skin conductance are found for more arousing messagesas was seen in the picture paradigm (A. Lang, 1990; Reeves et al., 1999; A. Lang, Chung, Lee, &Schwartz, 2002). This is true both for SCL (A. Lang et al., 1999) and for measures of SCF andSCA (Reeves et al., 1999; Lang et al., 2000). The primary difference is that over the course ofa television message skin conductance tends to fall continuously. However, it falls more slowlyfor arousing messages and more quickly for less arousing messages (Potter & Bolls, 2012). SC isalso related to self-reported arousal and is a good predictor of memory.
Based on this research, it is reasonable to interpret relative SCL, SCF and SCA as indicatorsof arousal with higher level, frequency, or amplitude indicative of more SNS activation and morearousal. Similarly, it is reasonable to interpret the depth and length of HR deceleration as anindicator of the relative level of attention with steeper, deeper, and longer deceleratory patternsindicative of greater attention compared to the shallower, slower, shorter patterns.
But Is This Really So? Heart Rate Variability
About a decade ago, Ravaja (2004a) published a review article stating that “psychophysiology isa formidable research tool” for measuring many concepts important in communication, such asemotion, arousal, and attention (p. 195). Facial EMG was pegged as a good measure of valenceand SC as a good measure of arousal. But Ravaja expressed concern with using HR as a measureof attention or arousal due to its dual innervation. He concluded that “. . . HR is not unequiv-ocally attributable to any single source, which may entail interpretative difficulties” (p. 201).He suggested that communication researchers should rely on measures of heart rate variability(HRV).
Because the activity of the heart is determined from moment to moment by a large numberof variables, the amount of time between beats is continuously changing. It is the variance inthe data vector formed by these successive inter-beat intervals that provides the simplest defi-nition of Heart Rate Variability (HRV; Allen, Chambers, & Towers, 2007). Psychophysiologistshave developed many different ways to quantify this variability. Even more time has been spentattempting to determine the physiological (PNS, SNS) and psychological (e.g., attention, arousal,interest) meaning of the various measures. For the purposes of comparing different metrics inorder to develop best practices we selected Respiratory Sinus Arrhythmia (RSA) and CardiacVagal Index (CVI) as indicators of PNS activation and the Cardiac Sympathetic Index (CSI) asan indicator of SNS activity. All three indices were computed using the CMetX software (Allen,et al., 2007).
RSA. Heart rate slightly increases when we breathe in and slightly decreases when we breatheout. This variability is thought to be under the control of the vagus nerve which is part of thePNS (Berntson et al., 1997). Pharmacological blockades of vagal synapses at the sino-atrial nodeof the heart nearly abolish this coupling of heart rate and respiration, whereas interruption of thecardiac sympathetic inputs via beta-adrenergic blockade does not (Berntson et al., 1997). RSAcan be estimated as the natural log of the variance in the 0.12 to 0.40 Hz bandwidth resultingfrom a Fast Fourier Transform (FFT) of the IBI time series (Allen et al., 2007). Measures of RSAhave therefore been used to index the level of PNS control of the heart and the PNS correlates ofattention, mental effort or mental load. This is likely why Ravaja (2004a) referred to RSA as “the
Dow
nloa
ded
by [
Dr
Rob
ert P
otte
r] a
t 03:
40 2
3 M
arch
201
5
COMPARATIVE INDICATORS OF PNS AND SNS DURING TV VIEWING 83
most promising selective noninvasive index of the PNS activity” for communication researchers(p. 221).
CVI and CSI. These measures were developed by Toichi, Sugiura, Murai, and Sengoku(1997) in an attempt to create measures that did not require FFTs to be conducted on the data.CVI and CSI are calculated by plotting the value of each inter-beat interval on the x-axis withthe value of the next inter-beat interval on the y-axis. The resulting figure, called a Lorenz Plot,produces two values called the transverse (T) and the longitudinal (L) distance. The CSI is equalto L/T and the CVI is the log10(LxT). CVI is a measure of PNS activity and CSI is a measure ofSNS activity (Toichi et al., 1997; Allen et al., 2007).
HRV in Media Processing Studies
Perhaps not surprisingly, a search of the literature reveals Ravaja and colleagues as the onlycommunication researchers who have used HRV, specifically RSA, as a direct physiologicalmeasure during media use (Ravaja, 2004b; Ravaja & Kallinen, 2004; Ravaja, Kallinen, Saari,& Keltikangas-Jarvinen, 2004). Ravaja (2004b) created 32 television news stories about finan-cial topics, varying them in content valence and arousal across a 2 x 2 design. Subjects saw allfour stories of a single valence/arousal combination as a sequence resembling a news bulletin.This allowed for another manipulation; namely, whether the face delivering the news moved orremained static. As predicted, PNS activity, indexed by RSA, increased in the movement con-dition. Ravaja et al. (2004c) used the same stories with a full-motion newscaster, delivered assingle stories rather than blocked. Into each story was inserted a single video frame of a humanface. The faces varied along four levels (angry, happy, neutral, and no face) completely crossedas emotional primes. Ravaja et al (2004c) found that the newscasts with subliminal human faceprimes resulted in more attention, and hence more PNS activation than those without. However,his prediction that emotional face primes would elicit more PNS than neutral face primes was notsupported.
Ravaja and Kallinen (2004) and Kallinen and Ravaja (2007) used RSA as a measure of atten-tion in response to audio stimuli. In one study (Kallinen & Ravaja, 2007), four positive-arousingfinancial news stories were read by a female newscaster while a still image of a news anchorappeared on a computer screen. The 1-minute news stories were heard either through headphonesor computer speakers. Contrary to their prediction, there was no effect for audio delivery methodon RSA levels. However, there was an interaction between individual difference measures (e.g.,‘sociability’ and ‘impatience’) and audio delivery method. Those categorized as highly socia-ble and highly impatient exhibited increased PNS activity when listening to the newscasts onspeakers compared to headphones. The opposite was true of those low in the individual differ-ence measures: PNS activity was lower during the headphone condition compared to the speakercondition. In Ravaja and Kallinen (2004), participants read six financial news stories of approx-imately equal word lengths while background music was played simultaneously. The mediatedindependent variable was whether or not the background music contained natural startle probes(kettledrum fortissimos) in the middle of the piece. The prediction was for a main effect of thestartling musical fortissimos on RSA. While this prediction was not supported, once again thestartle/no-startle music factor was found to interact with individual differences measured usingBIS/BAS—although not in the manner predicted.
Dow
nloa
ded
by [
Dr
Rob
ert P
otte
r] a
t 03:
40 2
3 M
arch
201
5
84 K. J. KORUTH ET AL.
HRV and Dynamic Media Stimuli
Although in theory utilizing RSA as a direct psychophysiological measure of parasympatheticresponse to mediated stimuli seems promising, the results obtained to date have provided farfrom definitive evidence of RSA as a measure of attention during media use. One of the moti-vations for making the comparisons in this article was the possibility that the unclear results inprevious RSA studies may be due to the way the measure has been computed. In all of the studiesreported above, RSA was calculated across the entire stimulus interval. Indeed, best practicesfor computing the indices suggest that to pick up the frequency characteristics of interest timeperiods of one to three minutes are required.1 However, this completely ignores the dynamicnature of the information in the message and the interaction between the message and the audi-ence member. Ravaja (2004b, figure 3) did conduct one analysis where he broke the newscastinto three 1-minute segments. When he did this he found an unpredicted interaction of valenceand time. Specifically he found no change in PNS activation during positive news stories butincreased PNS activation suggesting increased attention during negative news stories. Indeed,Ravaja (2004a) suggested in his review article that “alterations in RSA over time might be ofparticular interest in the psychophysiological studies on media, given that media stimuli are notoften homogeneous across time” (p. 222).
Therefore, for the purpose of our comparisons we collected HR and SC continuously over thecourse of each stimulus message. We examined HR and SCL averaged over five second periods(hereafter: continuous dynamic measures). We then computed whole message valves for HR andSC (hereafter, static measures). For SC we computed SCF and SCA over the entire message.From the HR data we also computed the HRV indices of CVI, CSI, and RSA using data from theentire message and using data from only the last 120 seconds of the message. And then followingRavaja’s suggestion we computed the three HRV indices over each of the first four 30-secondepochs. This allowed comparisons of the value of static and dynamic indicators of SC, HR, andHRV in response to our three independent variables (production pacing, arousing content, andvalence). It is interesting to note here that while the presence of arousing content and valence canchange dynamically they could also be relatively stable over the course of a message. Productionpacing, on the other hand, is inherently time based, each structural feature occurs at a single pointin time and it is the frequency with which they occur that is being manipulated.
METHOD
Design and Stimuli
The experimental design was a 2 (arousing content: calm, arousing) X 2 (valence: positive, neg-ative) X 2 (production pacing: slow, fast) X 3 (message) mixed experimental design. The stimuli
1Although a standard recording period of five minutes has been recommended for HRV analyses in a clinical setting(Task Force, 1996), close reading of these guidelines suggest a duration of at least 10 times the wavelength of the lowerfrequency bound of the investigated component or item of interest should be collected (Berntson et al., 1997). This wasrecently confirmed by Berntson and Barbanera (2014), particularly for HRV indices of parasympathetic innervation suchas RSA. However, also see Toichi et al. (1997) who obtained predicted sympathetic results in the CSI measure using threeminutes of data.
Dow
nloa
ded
by [
Dr
Rob
ert P
otte
r] a
t 03:
40 2
3 M
arch
201
5
COMPARATIVE INDICATORS OF PNS AND SNS DURING TV VIEWING 85
were film clips, each lasting between 4 and 5 minutes. There were three messages in each arousingcontent by valence by production pacing condition for a total of 24 messages.
Valence and arousal were within subjects factors both with two levels, positive/negative andcalm/arousing respectively. Messages were selected for each level of these independent variablesbased on pretest data collected on a pool of 119 film clips. Each clip was viewed by at least fortysubjects demographically similar to those who participated in the final experiment. Three separate9-point scales were used to rate arousal, positive valance, and negative valence. Selected positivemessages had mean pretest values greater than five (the midpoint) on the 9-point positivity scaleand below three on the negativity scale. Negative messages had mean negativity ratings greaterthan five and mean positivity ratings below three. Arousing messages had mean arousal ratingsabove five and calm messages had pretest arousal ratings below five.
Production pacing was also a within-subject variable with two levels. Slow paced clips had, onaverage, five camera changes per 30 seconds across the five-minute messages. Fast-paced clipshad an average of 10.86 camera changes per 30-second segment.
Participants
There were 98 participants (n = 45 male) who took part in the study individually in exchange forcourse credit at a large Midwest university. Each provided informed consent prior to participation,which was approved by the university’s Institutional Review Board. Due to technical difficultiesthere are different numbers of subjects with usable data for the various analyses. Specifically: SCamplitude and frequency n = 75; HR n = 73; HRV whole message variables n = 78; SCL n = 66;recognition n = 98; HRV on 120 seconds, n = 71. A subset of 40 participants data were used forthe dynamic HRV analysis across the first two minutes of the message.
Procedure
After arriving at the lab, the participant was told that the purpose of the study was to inves-tigate how human beings cognitively and emotionally respond to selected scenes from popularmovies. The nature and purpose of the psychophysiological electrodes were briefly explained andthe participant’s questions were answered. Electrodes were placed for the recording of SC andHR. Physiological data collection was controlled by VPM software (Cook, 2009), and stimuluspresentation was controlled by MediaLab (Jarvis, 2008). Participants first completed a pictureviewing task (not reported here). Next they viewed and rated two practice film clips. Any ques-tions were addressed and then they viewed the 24 film clips in random order. After viewing eachclip participants rated how arousing, how negative, and how positive it made them feel usingthe same 9-point self-report scales from the pretest. After all clips had been viewed participantscompleted a speeded recognition test.
Dependent Variables
Inter-beat Intervals (IBIs)
Cardiac activity was recorded as milliseconds between beats. Three standard Beckman Ag-AgCl electrodes filled with conducting cardiac electrode gel were placed on the left and right
Dow
nloa
ded
by [
Dr
Rob
ert P
otte
r] a
t 03:
40 2
3 M
arch
201
5
86 K. J. KORUTH ET AL.
forearms below the elbow. The third electrode was placed above the wrist of the non-dominantarm as a ground/common mode rejection. The ECG signal was passed to a Coulbourn bioam-plifier with a 60 hz notch filter. A Schmidt trigger was set to identify the QRS spike in order torecord the IBI intervals.
The IBIs were inspected and cleaned using VPMEvent (Cook, 2009) and then converted bythe same program into HR in beats-per-minute/second. These values where then averaged overfive-second intervals for the first two minutes of each clip for the dynamic HR analysis. IBIs weresubmitted to the CMetX software program (Allen et al., 2007), which computed parasympatheticand sympathetic metrics. The following indices were calculated: (1) Toichi’s Cardiac Vagal Index(CVI) (Toichi et al., 1997), (2) estimate of RSA and (3) Toichi’s Caridac Sympathetic Index (CSI)(Toichi et al., 1997). This was done first over the entire length of each message, then for the last120 seconds of each message for the static analyses and then for the first four, 30-second timeperiods in each messages.
SC
SC was measured using a pair of standard Beckman Ag-AgCl electrodes filled with a non-conductive medium. Before attachment, the palmar area of the nondominant hand was cleanedwith distilled water to control hydration. The electrodes were then attached to the palm surface.The analog signal from the electrodes was sampled at 50 Hz and passed to a Coulbourn skinconductance module and from there to the analog input of the A/D board. The signals weredigitized and stored.
For the static analyses frequency and amplitude of the SCR were computed off line. SCRsgreater than 0.1 micro Siemens were tallied to obtain the frequency of SCRs per message and thevalue of the largest SC amplitude was also scored for each segment. This provided two indicatorsof SC: the frequency of SCRs per clip (SCF) and the largest amplitude SCR (SCA) per clip. Forthe dynamic analysis, SC was averaged over five second periods for the first two minutes of themessage.
Emotional Experience
Following each message, participants were asked to rate how positive, how negative, and howaroused they felt while watching the clip. Ratings were made on 9-point scales. The arousal scalewas anchored by 1 = not at all aroused, excited, awake and 9 = extremely aroused, excited,awake. The positivity scale was anchored by 1 = not at all positive or happy and 9 = extremelypositive, happy. The negativity scale was anchored by 1 = not at all negative, unhappy or annoyedand 9 = extremely negative, unhappy, annoyed.
Visual Recognition
A speeded visual recognition test was used to assess encoding, and this was measured usinga “yes – no,” forced choice test administered by computer. There were four targets and fourfoils per film clip for a total of 192 recognition prompts. To minimize fatigue and order effectsMediaLab/DirectRT (Jarvis, 2008) software was used to generate random orders of the question
Dow
nloa
ded
by [
Dr
Rob
ert P
otte
r] a
t 03:
40 2
3 M
arch
201
5
COMPARATIVE INDICATORS OF PNS AND SNS DURING TV VIEWING 87
sets for each subject. Both the foils and targets were still images selected using the criteria detailedbelow. Foils satisfying the criteria were selected from the unseen portions of the movie.
Selection of targets from the movie clips was done as follows. One target each was selectedfrom the first, second, third, and fourth 30-second period which, together would make up the last120 seconds of each stimuli clip. The actual point in time for capturing the target image wasselected randomly for each of the thirty-second segments of each clip using a random numberfrom 1 to 30, which was generated by using a computer software program (Segobit Software,2008). However, while using this method, if the point in time selected was within two secondsof a camera change (before or after), the selected location was shifted forward away from thecamera change by the minimum number of seconds required to meet this criteria. In cases whereanother camera change was seen in two seconds in the forward direction, the selection was shiftedbackward. This procedure was adopted to avoid any effect of orienting response caused by thecamera change on the recognition memory test.
Each recognition prompt remained on the screen for a period of 250 milliseconds. Followingeach image’s brief display on the screen participants indicated if they had seen or not seen theimage earlier in the experiment by pressing the “1” key or the “2” key, respectively, on the com-puter’s keyboard. The answer was recorded and the next image did not appear until either of thesekeys was pressed. To assess recognition, the “yes” and “no” responses were used to calculate theproportion of correct identification.
Analysis
SCF, SCA and CVI, CSA, RSA computed over entire messages and the final 120 secondswere submitted to a 2(arousing content) x 2(production pacing) x 6(message) repeated measuresANOVA. The dynamic HR and SC data included a time factor consisting of 25 five-second peri-ods in each message. The Dynamic HRV measures had a time factor consisting of four periodseach equal to a 30-second epoch during the first two minutes of the film clip.
RESULTS
The results relating to the three propositions are presented first for arousal and then for attention.For each proposition, results for the relevant context variables are presented first (self-reportedemotional experience and recognition), followed by SC or HR results and then HRV results.
Proposition 1: Arousing Content Is Thought to Increase Arousal
Here, if our measures are valid, we expect to see larger values of our physiological indicatorsof SNS activation (CSI, SCF, SCA, SCL) and self-reported arousal during arousing messagescompared to calm messages.
There was a significant main effect of arousing content on self-reported arousal ratings F(1, 109) = 613.44, p < .001, ηp
2 = .849. Arousing messages elicited greater self-reported arousal(M = 6.31, SE = .11) from viewers compared with calm messages (M = 4.09, SE = .10).
There were significant main effects of arousing content on skin conductance frequency F(1, 73) = 40.29, p < .001, ηp
2 = .356, and amplitude F (1, 74) = 4.30, p < .042, ηp2 = .056.
Dow
nloa
ded
by [
Dr
Rob
ert P
otte
r] a
t 03:
40 2
3 M
arch
201
5
88 K. J. KORUTH ET AL.
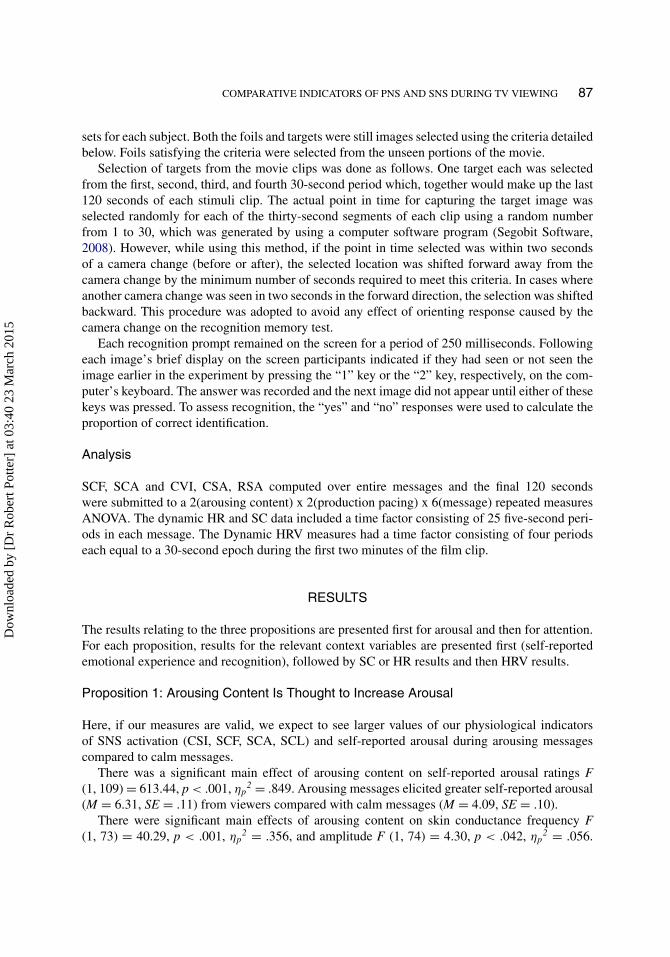
Messages with arousing content elicited a higher frequency of SCRs (M = 8.02, SE = .44) thanmessages with calm content (M = 6.66, SE = .39) and the largest amplitude was bigger forarousing (M = 2.04, SE = .15) compared to calm (M = 1.90, SE = .13) messages.
There was a significant arousing content by time interaction F (23, 1472) = 5.59, p < .001,ηp
2 = .090 on SCL change scores shown in Figure 1. Arousing content resulted in a slowerdecrease in skin conductance compared to calm content over time.
There was also a significant arousing content by pacing by time interaction F (23, 1472) =6.92, p < .001, ηp
2 = .10 shown in Figure 2. Here we see calm slow and arousing fast messageshaving slower decreases in SCL than calm fast and arousing slow in the middle of the message.At the end, however, we see arousing fast and slow with higher SCL compared to calm fast andslow messages.
–0.65
–0.55
–0.45
–0.35
–0.25
–0.15
–0.05
0.05
0.15
0.25
1 2 3 4 5 6 7 8 9 10 11 12 13 14 15 16 17 18 19 20 21 22 23 24
SC
L C
ha
ng
e
Arousing Calm
FIGURE 1 Arousing content by time interaction on SCL data.
–0.65
–0.55
–0.45
–0.35
–0.25
–0.15
–0.05
0.05
0.15
0.25
1 2 3 4 5 6 7 8 9 10 11 12 13 14 15 16 17 18 19 20 21 22 23 24
SC
L C
ha
ng
e
Arousing Slow Arousing Fast
Calm Slow Calm Fast
FIGURE 2 Arousing content x production pacing x time interaction onSCL data.
Dow
nloa
ded
by [
Dr
Rob
ert P
otte
r] a
t 03:
40 2
3 M
arch
201
5
COMPARATIVE INDICATORS OF PNS AND SNS DURING TV VIEWING 89
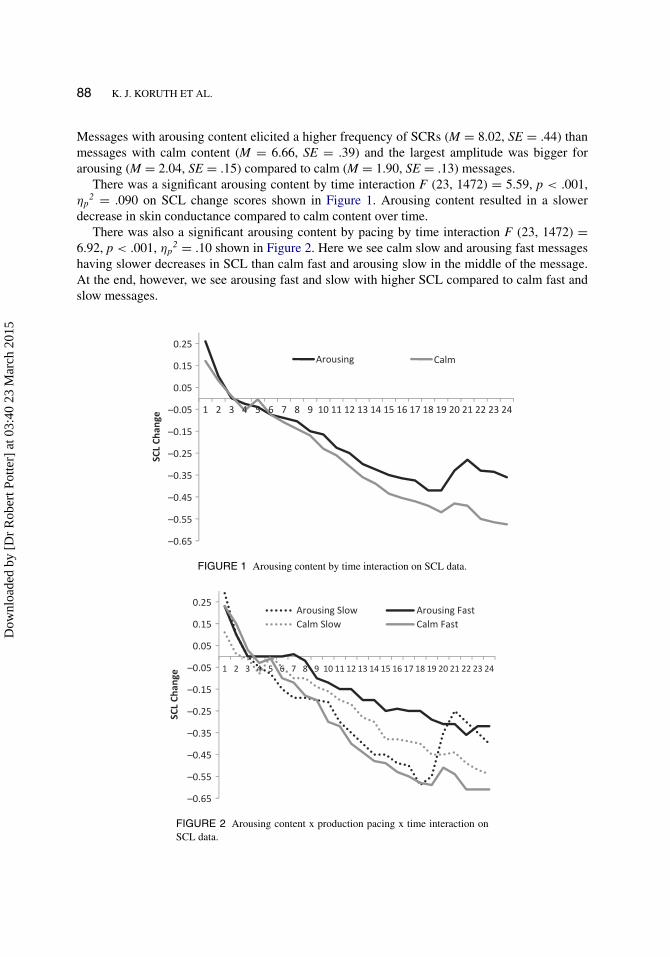
There were no main effects of arousing content on CSI or on CSI-120. There was, however, asignificant arousing content by pacing interaction F (1, 76) = 7.246, p < .019, ηp
2 = .070 on CSIcalculated across the entire message. The CSI values for arousing messages were not significantlydifferent from calm messages when production pacing was fast. But, when production pacing wasslow, contrary to the first proposition, CSI was significantly larger for calm (M = 2.522, SE =0.085) compared to arousing (M = 2.465, SE = 0.088) content (t (76) = 2.27, p < 0.013).
The arousing content by pacing by time interaction found to be statistically significant in theSCL analysis approached significance in the CSI analysis over the first four 30-second epochs,F (3,120) = 2.60, p < .07, ηp
2 = .06. This is shown in Figure 3. When compared to Figure 2 wesee the results for the first proposition differ somewhat depending upon whether the dependentvariable is SCL or 4-point CSI. In the middle of the message, rather than calm slow and arousingfast messages being more arousing than calm fast and arousing slow as demonstrated in SCL(Figure 2), the 4-point CSI analysis identifies calm slow messages as being more arousing thanthe other three conditions (Figure 3). There is also a difference at the end of the message wherethe SCL analysis picked up a fairly large rise during arousing slow messages resulting in bothslow-and fast-paced messages with arousing content being more arousing than calm messages.The four-point CSI index did not catch that increase and has the arousing slow-paced messagesas the least arousing at the end of two minutes.
Proposition 2: Structural Pacing Is Thought to Increase Arousal
Given this proposition we should see more arousal or SNS activation during fast- compared toslow-paced messages.
There was a significant pacing main effect on self-reported arousal F (1, 109) = 16.98,p < .001, ηp
2 = .135. Participants reported feeling more aroused during fast paced (M = 5.34,SE = .10 than slow paced (M = 5.07, SE = .11) messages.
1.8
1.9
2
2.1
2.2
2.3
2.4
2.5
2.6
1 2 3 4
CSI
Arousal x Pacing x Time
Calm/Slow
Calm/Fast
Arousing/Slow
Arousing/Fast
FIGURE 3 Arousal X production pacing x time interaction on four-pointCSI data.
Dow
nloa
ded
by [
Dr
Rob
ert P
otte
r] a
t 03:
40 2
3 M
arch
201
5
90 K. J. KORUTH ET AL.
There was no main effect of pacing on SCL. The main effect of pacing on SCF approachedsignificance F (1, 73) = 3.50, p < 0.065, ηp
2 = .046. Messages with fast pacing elicited morefrequent skin conductance responses (M = 7.45, SE = .42) compared with slow-paced messages(M = 7.19, SE = .40).
The main effect of pacing on the amplitude of the largest SCR approached significance, F(1, 73) = 3.25, p < .076, ηp
2 = .043; however, it was in the direction opposite the prediction withslow messages eliciting larger skin conductance amplitude (M = 2.03, SE = .14) compared tofast messages (M = 1.90, SE = .15).
The main effect of pacing on CSI was not significant though means were in the predicteddirection. Again, the pacing by arousing content interaction was significant for CSI F (1, 76) =7.246, p < .019, ηp
2 = .070. The differences between pacing conditions were not statisticallydifferent when the content was calm. However, when the content was arousing, CSI significantlyincreased, t (77) = 2.78, p < 0.003, as production pacing increased from slow (M = 2.406,SE = .092) to fast (M = 2.534, SE = .090).
Proposition 3: Negative Messages Are Thought to Be More Arousing Than PositiveMessages
Here we expect to see higher self-reported arousal, higher SC, and higher CSI for negativecompared to positive messages.
The main effect of valence did not have a significant main effect on self-reported arousal.The pacing by valence interaction approached significance, F (1,71) = 2.86, p<.095, ηp
2 = .04.The interaction shows that arousal ratings are larger only for negative messages when they arefast-paced. There are no differences among the other three conditions.
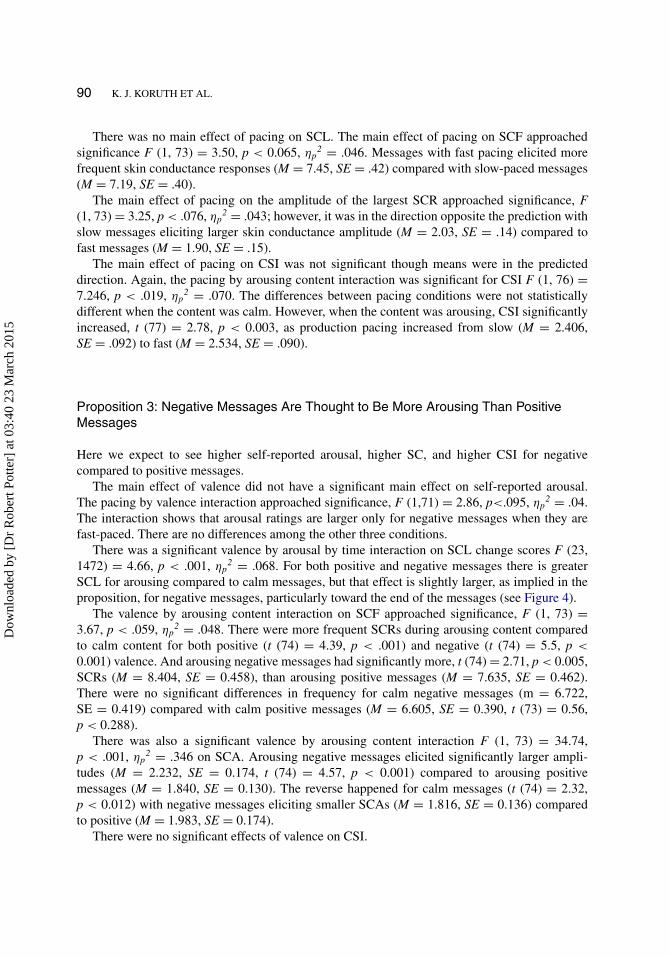
There was a significant valence by arousal by time interaction on SCL change scores F (23,1472) = 4.66, p < .001, ηp
2 = .068. For both positive and negative messages there is greaterSCL for arousing compared to calm messages, but that effect is slightly larger, as implied in theproposition, for negative messages, particularly toward the end of the messages (see Figure 4).
The valence by arousing content interaction on SCF approached significance, F (1, 73) =3.67, p < .059, ηp
2 = .048. There were more frequent SCRs during arousing content comparedto calm content for both positive (t (74) = 4.39, p < .001) and negative (t (74) = 5.5, p <
0.001) valence. And arousing negative messages had significantly more, t (74) = 2.71, p < 0.005,SCRs (M = 8.404, SE = 0.458), than arousing positive messages (M = 7.635, SE = 0.462).There were no significant differences in frequency for calm negative messages (m = 6.722,SE = 0.419) compared with calm positive messages (M = 6.605, SE = 0.390, t (73) = 0.56,p < 0.288).
There was also a significant valence by arousing content interaction F (1, 73) = 34.74,p < .001, ηp
2 = .346 on SCA. Arousing negative messages elicited significantly larger ampli-tudes (M = 2.232, SE = 0.174, t (74) = 4.57, p < 0.001) compared to arousing positivemessages (M = 1.840, SE = 0.130). The reverse happened for calm messages (t (74) = 2.32,p < 0.012) with negative messages eliciting smaller SCAs (M = 1.816, SE = 0.136) comparedto positive (M = 1.983, SE = 0.174).
There were no significant effects of valence on CSI.
Dow
nloa
ded
by [
Dr
Rob
ert P
otte
r] a
t 03:
40 2
3 M
arch
201
5
COMPARATIVE INDICATORS OF PNS AND SNS DURING TV VIEWING 91
–0.6
–0.5
–0.4
–0.3
–0.2
–0.1
0
0.1
0.2
1 2 3 4 5 6 7 8 9 10 11 12 13 14 15 16 17 18 19 20 21 22 23 24 25
SC
L C
ha
ng
e
Positive Calm Positive Arousing
Negative Calm Negative Arousing
FIGURE 4 Valence x arousal x time interaction on SCL change data.
Proposition 1: Arousing Content Is Thought to Increase Attention
Here we would expect to see better recognition, slower HR, and larger RSA and CVI duringarousing compared with calm content.
There was a significant main effect of arousing content on recognition F (1, 96) = 48.66, p <
.001, ηp2 = .336. Memory was better for messages with arousing (M = .80, SE = .01) compared
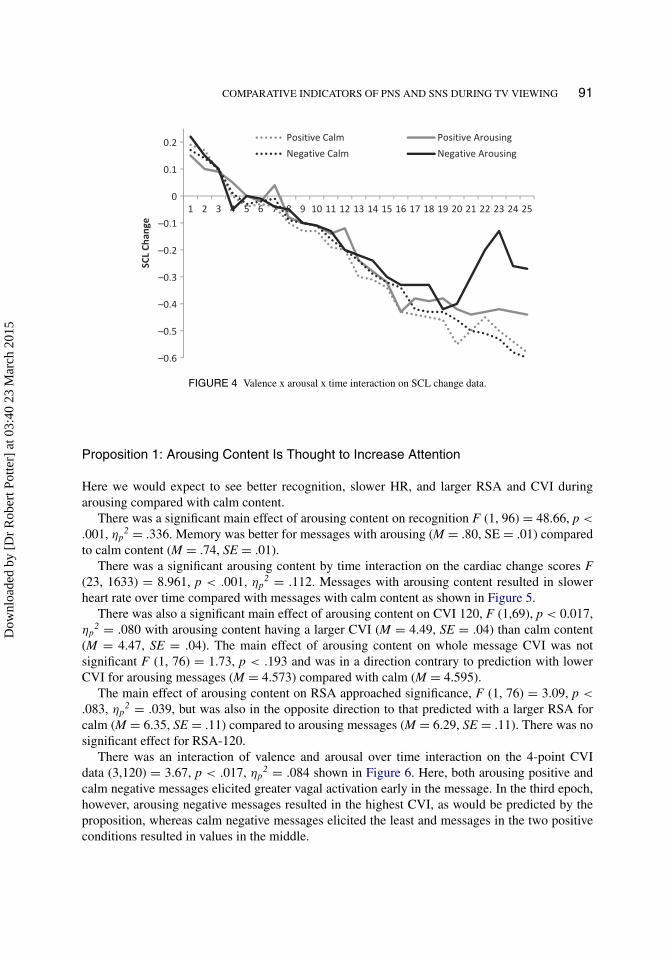
to calm content (M = .74, SE = .01).There was a significant arousing content by time interaction on the cardiac change scores F
(23, 1633) = 8.961, p < .001, ηp2 = .112. Messages with arousing content resulted in slower
heart rate over time compared with messages with calm content as shown in Figure 5.There was also a significant main effect of arousing content on CVI 120, F (1,69), p < 0.017,
ηp2 = .080 with arousing content having a larger CVI (M = 4.49, SE = .04) than calm content
(M = 4.47, SE = .04). The main effect of arousing content on whole message CVI was notsignificant F (1, 76) = 1.73, p < .193 and was in a direction contrary to prediction with lowerCVI for arousing messages (M = 4.573) compared with calm (M = 4.595).
The main effect of arousing content on RSA approached significance, F (1, 76) = 3.09, p <
.083, ηp2 = .039, but was also in the opposite direction to that predicted with a larger RSA for
calm (M = 6.35, SE = .11) compared to arousing messages (M = 6.29, SE = .11). There was nosignificant effect for RSA-120.
There was an interaction of valence and arousal over time interaction on the 4-point CVIdata (3,120) = 3.67, p < .017, ηp
2 = .084 shown in Figure 6. Here, both arousing positive andcalm negative messages elicited greater vagal activation early in the message. In the third epoch,however, arousing negative messages resulted in the highest CVI, as would be predicted by theproposition, whereas calm negative messages elicited the least and messages in the two positiveconditions resulted in values in the middle.
Dow
nloa
ded
by [
Dr
Rob
ert P
otte
r] a
t 03:
40 2
3 M
arch
201
5
92 K. J. KORUTH ET AL.
–9
–8
–7
–6
–5
–4
–31 2 3 4 5 6 7 8 9 10 11 12 13 14 15 16 17 18 19 20 21 22 23 24
BP
M C
ha
ng
e
Arousing Calm
FIGURE 5 Arousing content by time interaction on HR.
4.25
4.3
4.35
4.4
4.45
4.5
4.55
4.6
4.65
4.7
1 2 3 4
CVI
Arousal x Valence x Time
Calm/Positive
Calm/Negative
Arousing/Positive
Arousing/Negative
FIGURE 6 Arousal x valence x time interaction on CVI data.
Proposition 2: Structural Pacing Is Thought to Increase Attention
Here we expect to see better recognition, slower HR and larger CVI and RSA during fast-pacedcompared with slow-paced messages.
The main effect of pacing on recognition was significant, F (1, 96) = 3.99, p < .049, ηp2
= .040. Subjects had better recognition memory for fast-paced messages (M = .779, SE =.009) compared to slow-paced (M = .762, S. E. = .009).
Dow
nloa
ded
by [
Dr
Rob
ert P
otte
r] a
t 03:
40 2
3 M
arch
201
5
COMPARATIVE INDICATORS OF PNS AND SNS DURING TV VIEWING 93
–16
–15
–14
–13
–12
–11
–10
–9
–8
–7
–6
1 2 3 4 5 6 7 8 9 10 11 12 13 14 15 16 17 18 19 20 21 22 23 24
BP
M C
ha
ng
e
Fast Slow
FIGURE 7 Structural pacing by time interaction on HR.
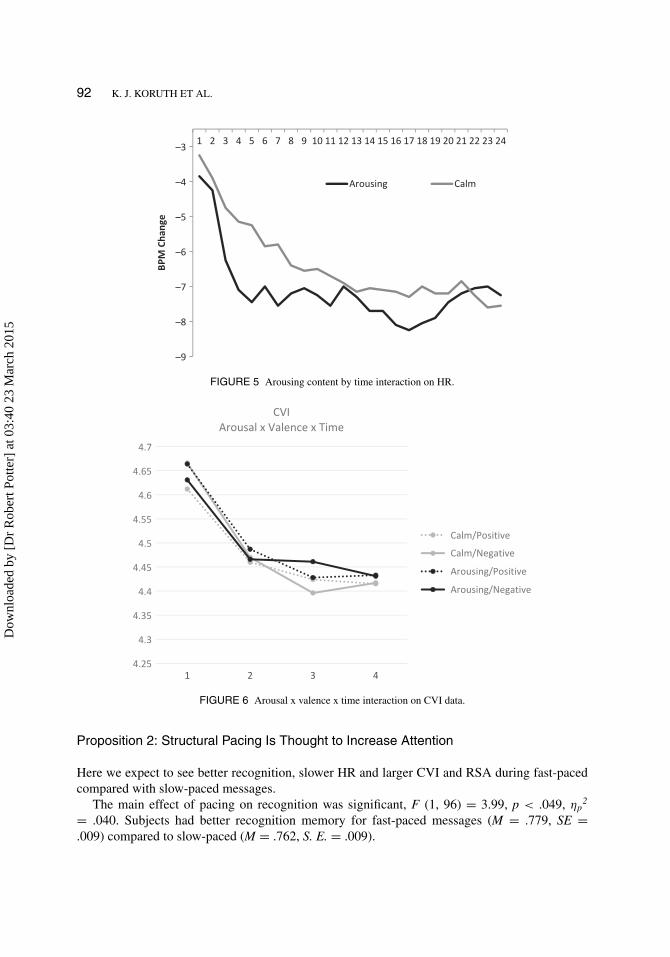
There was a significant pacing by time interaction F (23,1633) = 3.38, p < .001, ηp2 = .045 on
heart rate change scores and messages with fast pacing eliciting a greater deceleration in heartrate over time compared with messages with slow pacing as seen in Figure 7.
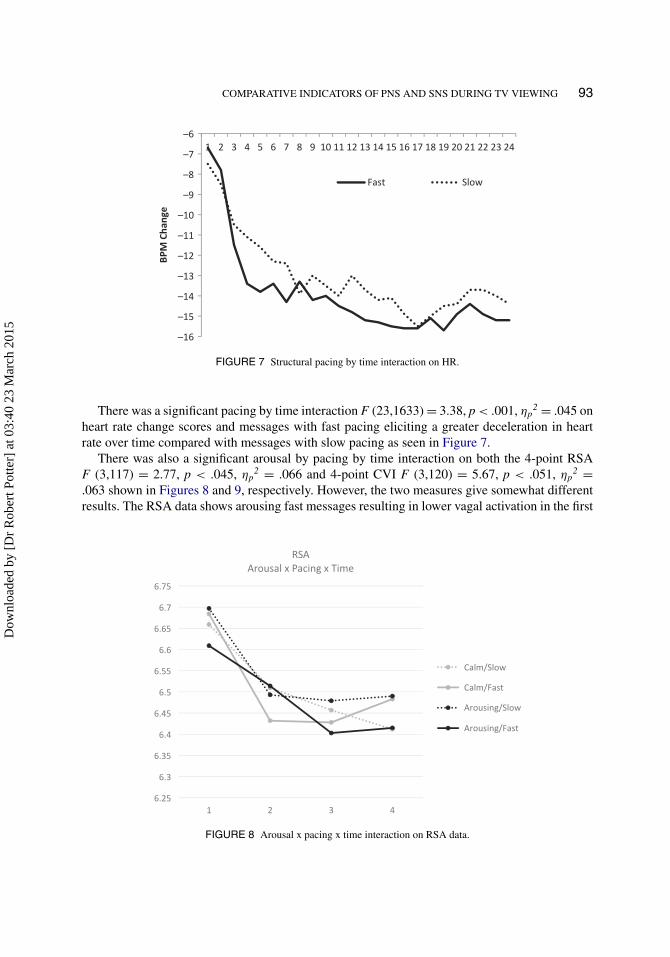
There was also a significant arousal by pacing by time interaction on both the 4-point RSAF (3,117) = 2.77, p < .045, ηp
2 = .066 and 4-point CVI F (3,120) = 5.67, p < .051, ηp2 =
.063 shown in Figures 8 and 9, respectively. However, the two measures give somewhat differentresults. The RSA data shows arousing fast messages resulting in lower vagal activation in the first
6.25
6.3
6.35
6.4
6.45
6.5
6.55
6.6
6.65
6.7
6.75
1 2 3 4
RSA
Arousal x Pacing x Time
Calm/Slow
Calm/Fast
Arousing/Slow
Arousing/Fast
FIGURE 8 Arousal x pacing x time interaction on RSA data.
Dow
nloa
ded
by [
Dr
Rob
ert P
otte
r] a
t 03:
40 2
3 M
arch
201
5
94 K. J. KORUTH ET AL.
4.25
4.3
4.35
4.4
4.45
4.5
4.55
4.6
4.65
4.7
1 2 3 4
CVI
Arousal x Pacing x Time
Calm/Slow
Calm/Fast
Arousing/Slow
Arousing/Fast
FIGURE 9 Arousal x pacing x time interaction on CVI data.
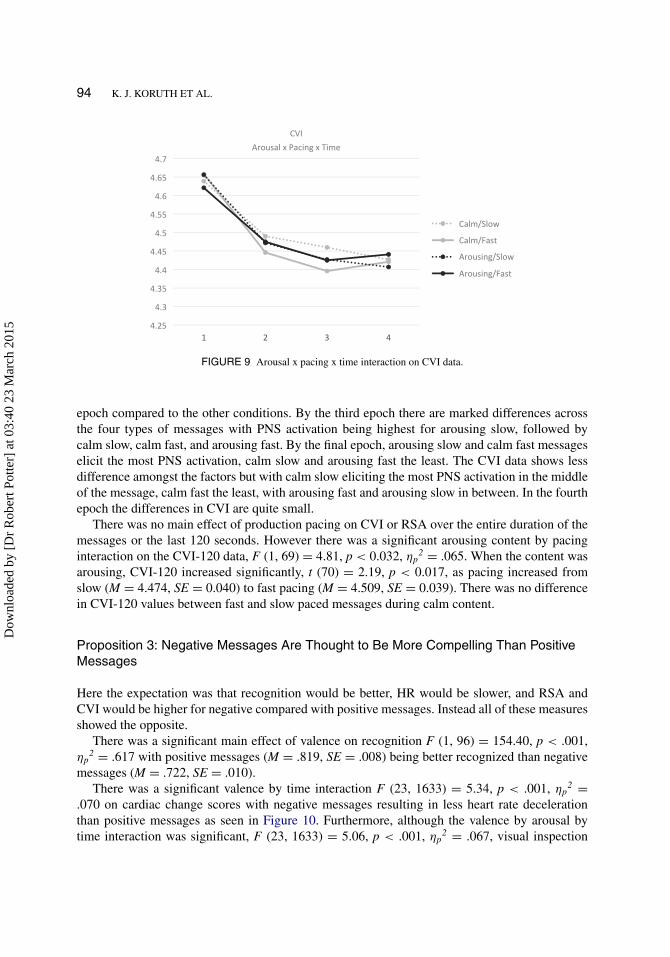
epoch compared to the other conditions. By the third epoch there are marked differences acrossthe four types of messages with PNS activation being highest for arousing slow, followed bycalm slow, calm fast, and arousing fast. By the final epoch, arousing slow and calm fast messageselicit the most PNS activation, calm slow and arousing fast the least. The CVI data shows lessdifference amongst the factors but with calm slow eliciting the most PNS activation in the middleof the message, calm fast the least, with arousing fast and arousing slow in between. In the fourthepoch the differences in CVI are quite small.
There was no main effect of production pacing on CVI or RSA over the entire duration of themessages or the last 120 seconds. However there was a significant arousing content by pacinginteraction on the CVI-120 data, F (1, 69) = 4.81, p < 0.032, ηp
2 = .065. When the content wasarousing, CVI-120 increased significantly, t (70) = 2.19, p < 0.017, as pacing increased fromslow (M = 4.474, SE = 0.040) to fast pacing (M = 4.509, SE = 0.039). There was no differencein CVI-120 values between fast and slow paced messages during calm content.
Proposition 3: Negative Messages Are Thought to Be More Compelling Than PositiveMessages
Here the expectation was that recognition would be better, HR would be slower, and RSA andCVI would be higher for negative compared with positive messages. Instead all of these measuresshowed the opposite.
There was a significant main effect of valence on recognition F (1, 96) = 154.40, p < .001,ηp
2 = .617 with positive messages (M = .819, SE = .008) being better recognized than negativemessages (M = .722, SE = .010).
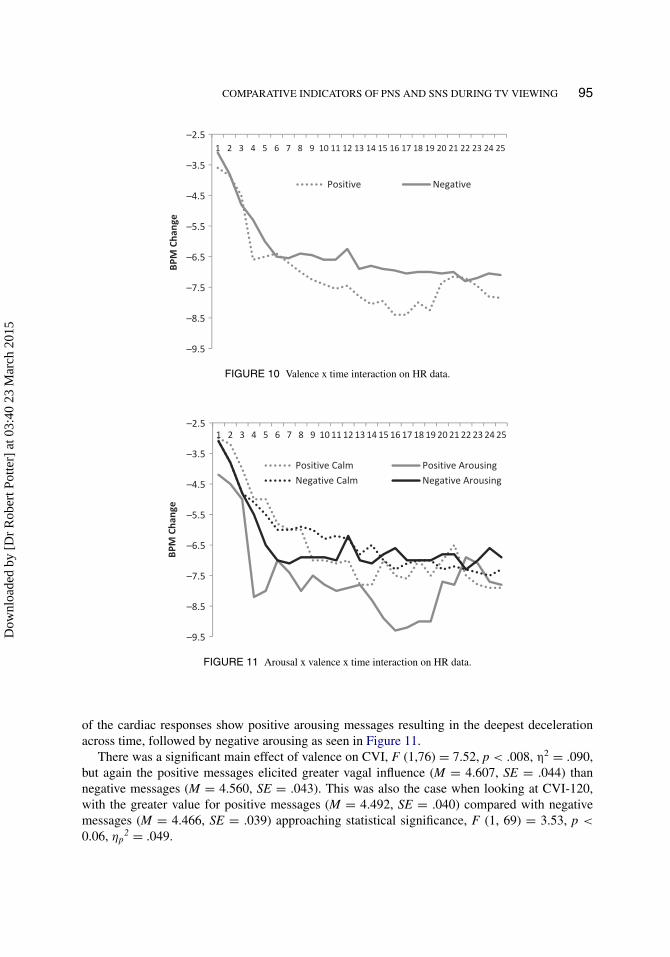
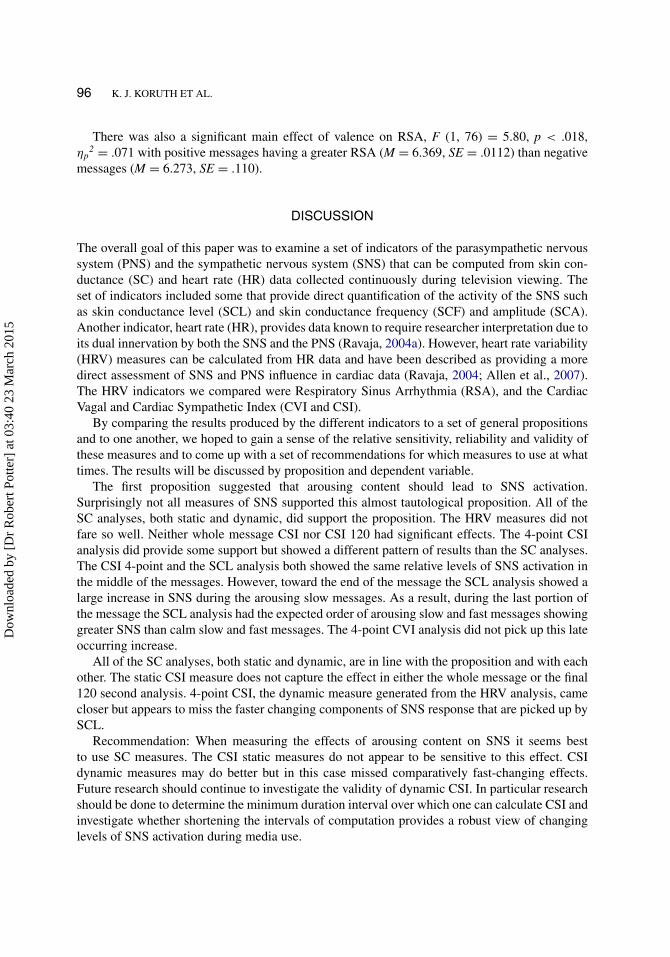
There was a significant valence by time interaction F (23, 1633) = 5.34, p < .001, ηp2 =
.070 on cardiac change scores with negative messages resulting in less heart rate decelerationthan positive messages as seen in Figure 10. Furthermore, although the valence by arousal bytime interaction was significant, F (23, 1633) = 5.06, p < .001, ηp
2 = .067, visual inspection
Dow
nloa
ded
by [
Dr
Rob
ert P
otte
r] a
t 03:
40 2
3 M
arch
201
5
COMPARATIVE INDICATORS OF PNS AND SNS DURING TV VIEWING 95
–9.5
–8.5
–7.5
–6.5
–5.5
–4.5
–3.5
–2.5
1 2 3 4 5 6 7 8 9 10 11 12 13 14 15 16 17 18 19 20 21 22 23 24 25
BP
M C
ha
ng
e
Positive Negative
FIGURE 10 Valence x time interaction on HR data.
–9.5
–8.5
–7.5
–6.5
–5.5
–4.5
–3.5
–2.5
1 2 3 4 5 6 7 8 9 10 11 12 13 14 15 16 17 18 19 20 21 22 23 24 25
BP
M C
ha
ng
e
Positive Calm Positive Arousing
Negative Calm Negative Arousing
FIGURE 11 Arousal x valence x time interaction on HR data.
of the cardiac responses show positive arousing messages resulting in the deepest decelerationacross time, followed by negative arousing as seen in Figure 11.
There was a significant main effect of valence on CVI, F (1,76) = 7.52, p < .008, η2 = .090,but again the positive messages elicited greater vagal influence (M = 4.607, SE = .044) thannegative messages (M = 4.560, SE = .043). This was also the case when looking at CVI-120,with the greater value for positive messages (M = 4.492, SE = .040) compared with negativemessages (M = 4.466, SE = .039) approaching statistical significance, F (1, 69) = 3.53, p <
0.06, ηp2 = .049.
Dow
nloa
ded
by [
Dr
Rob
ert P
otte
r] a
t 03:
40 2
3 M
arch
201
5
96 K. J. KORUTH ET AL.
There was also a significant main effect of valence on RSA, F (1, 76) = 5.80, p < .018,ηp
2 = .071 with positive messages having a greater RSA (M = 6.369, SE = .0112) than negativemessages (M = 6.273, SE = .110).
DISCUSSION
The overall goal of this paper was to examine a set of indicators of the parasympathetic nervoussystem (PNS) and the sympathetic nervous system (SNS) that can be computed from skin con-ductance (SC) and heart rate (HR) data collected continuously during television viewing. Theset of indicators included some that provide direct quantification of the activity of the SNS suchas skin conductance level (SCL) and skin conductance frequency (SCF) and amplitude (SCA).Another indicator, heart rate (HR), provides data known to require researcher interpretation due toits dual innervation by both the SNS and the PNS (Ravaja, 2004a). However, heart rate variability(HRV) measures can be calculated from HR data and have been described as providing a moredirect assessment of SNS and PNS influence in cardiac data (Ravaja, 2004; Allen et al., 2007).The HRV indicators we compared were Respiratory Sinus Arrhythmia (RSA), and the CardiacVagal and Cardiac Sympathetic Index (CVI and CSI).
By comparing the results produced by the different indicators to a set of general propositionsand to one another, we hoped to gain a sense of the relative sensitivity, reliability and validity ofthese measures and to come up with a set of recommendations for which measures to use at whattimes. The results will be discussed by proposition and dependent variable.
The first proposition suggested that arousing content should lead to SNS activation.Surprisingly not all measures of SNS supported this almost tautological proposition. All of theSC analyses, both static and dynamic, did support the proposition. The HRV measures did notfare so well. Neither whole message CSI nor CSI 120 had significant effects. The 4-point CSIanalysis did provide some support but showed a different pattern of results than the SC analyses.The CSI 4-point and the SCL analysis both showed the same relative levels of SNS activation inthe middle of the messages. However, toward the end of the message the SCL analysis showed alarge increase in SNS during the arousing slow messages. As a result, during the last portion ofthe message the SCL analysis had the expected order of arousing slow and fast messages showinggreater SNS than calm slow and fast messages. The 4-point CVI analysis did not pick up this lateoccurring increase.
All of the SC analyses, both static and dynamic, are in line with the proposition and with eachother. The static CSI measure does not capture the effect in either the whole message or the final120 second analysis. 4-point CSI, the dynamic measure generated from the HRV analysis, camecloser but appears to miss the faster changing components of SNS response that are picked up bySCL.
Recommendation: When measuring the effects of arousing content on SNS it seems bestto use SC measures. The CSI static measures do not appear to be sensitive to this effect. CSIdynamic measures may do better but in this case missed comparatively fast-changing effects.Future research should continue to investigate the validity of dynamic CSI. In particular researchshould be done to determine the minimum duration interval over which one can calculate CSI andinvestigate whether shortening the intervals of computation provides a robust view of changinglevels of SNS activation during media use.
Dow
nloa
ded
by [
Dr
Rob
ert P
otte
r] a
t 03:
40 2
3 M
arch
201
5
COMPARATIVE INDICATORS OF PNS AND SNS DURING TV VIEWING 97
The second part of proposition one is that arousing content should lead to increased attentionand increased PNS activation. The context variable, recognition, was higher for arousing com-pared with calm messages as would be expected if people are paying more attention to arousingmessages. The HR data and the CVI-120 data both showed arousing content eliciting greater PNSactivation compared to calm content. The CVI whole message data approached significance butthe means were in the opposite direction to that suggested by the proposition. The 4-point CVIdata, however, showed an arousal by valence interaction in which the highest PNS activation waselicited by arousing negative messages and the lowest by calm negative messages. The two posi-tive messages were in between and did not differ much from one another providing some supportfor the proposition.
Recommendation: here the best results are provided by dynamic measures. Heart rate andthe four-point CVI data seem to be sensitive to the effects suggested by the proposition. Wholemessage CVI and RSA do not seem to capture the effect of arousing content on PNS activation.
Proposition two suggests that production pacing should also increase SNS activation. Here, thestatic context variable self-reported arousal supported the general proposition. Static SC analysesonly approach significance with means being in the right direction for SCF and in the wrongdirection for SCA. SCL, CSI whole message, and 4-point CSI all show the same pattern of resultswith fast-paced messages being more arousing than slow-paced messages during arousing but notduring calm messages. Based on this it seems that static SC measures are not a particularly goodchoice for studying pacing, though SCF does better than SCA. Because SCA is essentially asingle moment measure, it is prone to result in invalid conclusions if one point in the messageis quite different from the rest of the message. The CSI measure was the only static measure tocapture the result.
Recommendation: when effects of pacing on arousing content are being studied dynamic SCLand either static or dynamic CSI seem to be equally good choices. SCA and SCF seem to be lessgood choices.
The second half of proposition two states that faster production pacing should lead to increasedattention. Again, the context variable recognition is higher during fast-paced compared to slow-paced messages. HR finds the predicted effect of slower heart rate for fast compared to slow-pacedmessages. The static measures CVI and RSA show no effects of pacing. CVI-120, on the otherhand, has an arousing by pacing interaction. The results show that fast paced messages elicit morePNS than slow paced messages but only for arousing content. The dynamic measures 4-pointRSA and 4-point CVI have interactions of arousing content and pacing over time. The 4-pointCVI measure showed the most differentiation between the messages in the third epoch with calmslow messages having the greatest PNS activation and the calm fast messages the least. The 4-point RSA analysis also showed the most differentiation during the third time period, but witharousing slow messages showing the most PNS activation followed by calm slow, calm fast, andarousing fast showing the least. Unlike the 4-point CVI which did not differentiate the messagesin the fourth epoch, the 4-point RSA showed a clear distinction between calm fast and arousingslow which had greater PNS activation than calm slow and arousing fast.
Recommendation: static measures do not seem to do a good job capturing the effect of pro-duction pacing on attention. This may be because, unlike arousal and valence, the events whichcreate production pacing occur at single moments in time and it is their accumulation that leads toclassification as fast pace. As a result, they are inherently phasic or short-term events. All of the
Dow
nloa
ded
by [
Dr
Rob
ert P
otte
r] a
t 03:
40 2
3 M
arch
201
5
98 K. J. KORUTH ET AL.
dynamic measures did a pretty good job picking up this effect, though 4-point RSA and 4-pointCVI analyses did not produce exactly the same results.
Proposition three proposes that negative messages are more arousing than positive messagesand will elicit more SNS activation. Here we find that all the indicators, both static and dynamicof SC as well as the context variable self-reported arousal support the proposition. Only CSI bothstatic and dynamic does not.
Recommendation: it seems clear that if the effects of valence on SNS are of interest CSI isprobably not a good choice but that all of the SC variables work.
Proposition three also proposes that negative messages are more compelling than positivemessages and should elicit more PNS activation. The context variable and most of the indicatorsof PNS were significant and all showed a result opposite to the proposition. Recognition wasbetter for positive compared with negative messages, HR was slower for positive compared tonegative messages and CVI, CVI-120, and RSA-120 all showed positive messages to be elicitingmore PNS activation than negative messages. There were no significant effects for the RSA 4-point or CVI 4-point analyses.
These results are surprisingly at odds with general expectations about compelling negativematerial. However, at least two previous studies have suggested and demonstrated that positivemessages can elicit better memory and attention when arousing content is controlled (Bolls, Lang,& Potter, 2001; Bradley, Greenwald, Petry, & Lang, 1993). In this study there was no main effectof valence on self-reported positivity ratings, though there were main effects of valence on thephysiological indicators of SNS. Self-reported arousal data showed that the negative arousingmessages were significantly different from the other three valence arousal conditions. In addition,the SNS data also suggest that the negative messages were more arousing than any of the othermessages. It may be the case that these messages were sufficiently arousing to lead to defensiveprocessing which has been shown to reduce memory (Bradley & Lang, 2000).
Recommendation: all measures except the dynamic RSA and CVI measures seem to do a goodjob assessing PNS activation in response to valence.
The overall results of this study suggest that different independent variables may influence theSNS and PNS in different ways and that different analytical approaches of continuous HR andSC data can lead to very different findings. The continuously collected data has the advantage oftracking the ongoing interaction between the viewer and the message in real time which provides awindow into relative change in the measures in response to the same message by condition. Morestatic measures rarely seem to produce as much information but may also be indexing the largermore continuous aspects of subject response. Additional research should continue to examineHRV indicators over shorter durations in response to various types of independent variables.In addition, it would be worthwhile to consider whether a variable is essentially a conglomerationof individual features (like production pacing) or a relatively continuously existing feature of amessage (like emotion) when selecting measures.
REFERENCES
Allen, J. J. B., Chambers, A. S., & Towers, D. N. (2007). The many metrics of cardiac chronotropy: A pragmatic primerand a brief comparison of metrics. Biological Psychology, 74(2), 243–262.
Berntson, G. G., & Barbanera, G. (2014, September). Heart rate variability: Mechanisms, methods and interpretation.Paper presented at the Society for Psychophysiological Research, Atlanta, GA.
Dow
nloa
ded
by [
Dr
Rob
ert P
otte
r] a
t 03:
40 2
3 M
arch
201
5
COMPARATIVE INDICATORS OF PNS AND SNS DURING TV VIEWING 99
Berntson, G. G., Bigger, J., Eckberg, D. L., Grossman, P., Kaufmann, P., Malik, G., . . . van Der Molen, M.W. (1997). Heart rate variability: Origins, methods, and interpretive caveats. Psychophysiology, 34(6), 623–648.doi:10.1111/j.1469-8986.1997.tb02140.x
Bolls, P. D., Lang, A., & Potter, R. F. (2001). The effects of message valence and listener arousal on attention, memory,and facial muscular responses to radio advertisements. Communication Research, 28(5), 627–651.
Bradley, M. M., & Lang, P. J. (2000a). Affective reactions to acoustic stimuli. Psychophysiology, 37(2), 204–215.Bradley, M. M., & Lang, P. J. (2000b). Measuring emotion: Behavior, feeling, and physiology. In R. D. Lane & L. Nadel
(Eds.), Cognitive neuroscience of emotion (pp. 242–276). New York, NY: Oxford University Press.Bradley, M. M., Greenwald, M. M., Petry, M. C., & Lang, P. J. (1992). Remembering pictures: Pleasure and arousal in
memory. Journal of Experimental Psychology: Learning, Memory, and Cognition, 18(2), 379–390.Bradley, M. M., Codispoti, M., Cuthbert, B. N., & Lang, P. J. (2001). Emotion and motivation I: Defensive and appetitive
reactions in picture processing. Emotion, 1(3), 276–298. doi:10.1037/1528-3542.1.3.276Brosius, H. B. (1993). The effects of emotional pictures in television news. Communication Research, 20(1), 105–124.Cacioppo, J. T., Tassinary, L. G., & Bernstson, G. G. (Eds.). (2007). Handbook of psychophysiology. Cambridge, UK:
Cambridge University Press.Cacioppo, J. T., Berntson, G. G., Larsen, J. T., Poehlmann, K. M., & Ito, T. A. (2000). The psychophysiology of emotion.
In M. Lewis & J. M. Haviland-Jones (Eds.), Handbook of emotion (pp. 173–192). New York, NY: The GuildfordPress.
Cook, E. W. I. (2009). VPM reference manual. Birmingham, AL: Author.Dawson, M. E., Schell, A. M., & Filion, D. L. (2000). The electrodermal system. In J. T. Cacioppo & L. G. Tassinary
(Eds.), Handbook of psychophysiology (2nd ed., pp. 200–223). New York, NY: Cambridge University Press.Detenber, B. H., Simons, R. F., & Bennett, G. G. (1998). Roll ‘em!: The effects of picture motion on emotional responses.
Journal of Broadcasting & Electronic Media, 42(1), 113–127.Everett, M. W., & Palmgreen, P. (1995). Influences of sensation seeking, message sensation value, and program context
on effectiveness of anticocaine public-service announcements. Health Communication, 7(3), 225–248.Friestad, M., & Thorson, E. (1986). Emotion-eliciting advertising—effects on long-term memory and judgment. Advances
in Consumer Research, 13, 111–116.Grabe, M. E., Zhou, S., Lang, A., & Bolls, P. (1998, August). The effects of tabloid and standard television news on
viewer evaluations, memory and arousal. Paper presented at the Association for Education in Journalism and MassCommunication, Annual Conference, Baltimore, MD.
Grabe, M. E., Zhou, S. H., Lang, A., & Bolls, P. D. (2000). Packaging television news: The effects of tabloid oninformation processing and evaluative responses. Journal of Broadcasting & Electronic Media, 44(4), 581–598.
Hitchon, J., Thorson, E., & Duckler, P. (1994). Effects of ambiguity and complexity on consumer response to music videocommercials. Journal of Broadcasting and Electronic Media, 38(3), 289–306.
Jarvis, B. (2008). Media lab (Version 2004.2.1). New York, NY: Empirisoft.Kallinen, K., & Ravaja, N. (2007). Comparing speakers versus headphones in listening to news from a computer
– individual differences and psychophysiological responses. Computers in Human Behavior, 23(1), 303–317.doi:10.1016/j.chb.2004.10.014
Kang, Y. H., Cappella, J., & Fishbein, M. (2006). The attentional mechanism of message sensation value: Interactionbetween message sensation value and argument quality on message effectiveness. Communication Monographs,73(4), 351–378.
Lang, A. (1990). Involuntary attention and physiological arousal evoked by structural features and emotional content inTV commercials. Communication Research, 17(3), 275–299.
Lang, A. (1994). What can the heart tell us about thinking? In A. Lang (Ed.), Measuring psychological responses to mediamessages. LEA’s communication series (pp. 99–111). Hillsdale, NJ: Erlbaum.
Lang, A., Potter, R. F., & Bolls, P. D. (2009). Where psychophysiology meets the media: Taking the effects out of mediaresearch. In J. Bryant & M.B. Oliver (Eds.), Media effects: Advances in theory and research (pp. 185–206). NewYork, NY: Routledge.
Lang, A., Bolls, P., Potter, R. F., & Kawahara, K. (1999). The effects of production pacing and arousing content on theinformation processing of television messages. Journal of Broadcasting and Electronic Media, 43(4), 451–475.
Lang, A., Chung, Y., Lee, S., & Schwartz, N. (2002, July). Processing anti-drug public service announcements:Production pacing, arousing content, and adolescents. Paper presented at the International CommunicationAssociation, Seoul, South Korea.
Lang, A., Dhillon, K., & Dong, Q. W. (1995). The effects of emotional arousal and valence on television viewers cognitivecapacity and memory. Journal of Broadcasting & Electronic Media, 39(3), 313–327.
Dow
nloa
ded
by [
Dr
Rob
ert P
otte
r] a
t 03:
40 2
3 M
arch
201
5
100 K. J. KORUTH ET AL.
Lang, A., Newhagen, J., & Reeves, B. (1996). Negative video as structure: Emotion, attention, capacity, and memory.Journal of Broadcasting and Electronic Media, 40(4), 460–477.
Lang, A., Zhou, S., Schwartz, N., Bolls, P., & Potter, R. F. (2000). The effects of edits on arousal, attention, and memoryfor television messages: When an edit is an edit can an edit be too much? Journal of Broadcasting and ElectronicMedia, 44(1), 94–109.
Lang, P. J., Bradley, M. M., & Cuthbert, B. N. (1997). Motivated attention: Affect, activation, and action. In P. J. Lang,R. F. Simons, & M. T. Balaban (Eds.), Attention and orienting: Sensory and motivational processes. Hillsdale, NJ:Erlbaum.
Lang, P. J., Greenwald, M. K., Bradley, M. M., & Hamm, A. O. (1993). Looking at pictures — affective, facial, visceral,and behavioral reactions. Psychophysiology, 30(3), 261–273.
Lapinski, M. K., Neuberger, L., Gore, M. L., Muter, B. A., & Van der Heide, B. (2013). Shark bytes: Message sensationvalue and emotional appeals in shark diving websites. Journal of Risk Research, 16(6), 733–751.
Lykken, D. T., & Venables, P. H. (1971). Direct measurement of skin conductance: A proposal for standardization.Psychophysiology, 13, 554–562.
Newhagen, J. E., & Reeves, B. (1992). The evenings bad news — effects of compelling negative television news imageson memory. Journal of Communication, 42(2), 25–41.
Palmgreen, P., Stephenson, M. T., Everett, M. W., Baseheart, J. R., & Francies, R. (2002). Perceived message sensationvalue (PMSV) and the dimensions and validation of a PMSV scale. Health Communication, 14(4), 403–428.
Potter, R. F., & Bolls, P.D. (2012). Psychophysiological measurement and meaning: Cognitive and emotional processingof media. New York, NY: Routledge.
Ravaja, N. (2004a). Contributions of psychophysiology to media research: Review and recommendations. MediaPsychology, 6(2), 193–235.
Ravaja, N. (2004b). Effects of image motion on a small screen on emotion, attention, and memory: Moving-face versusstatic-face newscaster. Journal of Broadcasting & Electronic Media, 48(1), 108–133.
Ravaja, N., & Kallinen, K., (2004). Emotional effects of startling background music during reading news reports: Themoderating influence of dispositional BIS and BAS sensitivities. Scandinavian Journal of Psychology, 45, 231–238.
Ravaja, N., Kallinen, K., Saari, T., & Keltikangas-Jarvinen, L. (2004c). Suboptimal exposure to facial expressions whenviewing video messages from a small screen: Effects on emotion, attention, and memory. Journal of ExperimentalPsychology-Applied, 10(2), 120–131.
Reeves, B. R., Newhagen, J., Maibach, E., Basil, M., & Kurz, K. (1991). Negative and positive television messages —effects of message type and context on attention and memory. American Behavioral Scientist, 34(6), 679–694.
Software, S. (2008). Random Number Generator Pro. Retrieved from http://download.cnet.com/Random-Number-Generator-Pro/3000-2053_4-10052275.html
Shoemaker, P. J. (1996). Hardwired for news: Using biological and cultural evolution to explain the surveillance function.Journal of Communication, 46(3), 32–47.
Simons, R. F., Detenber, B. H., Roedema, T. M., & Reiss, J. E. (1999). Emotion processing in three systems: The mediumand the message. Psychophysiology, 36(5), 619–627.
Stephenson, M. T., & Palmgreen, P. (2001). Sensation seeking, perceived message sensation value, personal involvement,and processing of anti-marijuana PSAs. Communication Monographs, 68(1), 49–71.
Stern, R. M., Ray, W. J., & Quigley, K. S. (2001). Psychophysiological recording (2nd ed.). New York, NY: OxfordUniversity Press.
Task Force Guidelines. (1996). Heart rate variability: Standards of measurement, physiological interpretation, and clinicaluse. European Heart Journal, 17, 354–381.
Thorson, E., Reeves, B., & Schleuder, J. (1985). Message complexity and attention to television. CommunicationResearch, 12, 427–454.
Thorson, E., Reeves, B., & Schleuder, J. (1986). Attention to local and global complexity in television messages. In M.L. McLaughlin (Ed.), Communication yearbook 10 (pp. 366–383). Beverly Hills, CA: Sage.
Toichi, M., Sugiura, T., Murai, T., & Sengoku, A. (1997). A new method of assessing cardiac autonomic function andits comparison with spectral analysis and coefficient of variation of R-R interval. Journal of the Autonomic NervousSystem, 62(1–2), 79–84.
Wirth, W., & Schramm, H. (2005). Media and emotions. Communication Research Trends, 24(3).
Dow
nloa
ded
by [
Dr
Rob
ert P
otte
r] a
t 03:
40 2
3 M
arch
201
5