Reusable e-learning development: Case studies, practices ...
Upload
khangminh22Category
view
0download
0
Rochester Institute of Technology Rochester Institute of Technology
RIT Scholar Works RIT Scholar Works
Theses
1998
A Comparative analysis of a returnable/reusable packaging A Comparative analysis of a returnable/reusable packaging
system system
Susan Starks
Follow this and additional works at: https://scholarworks.rit.edu/theses
Recommended Citation Recommended Citation Starks, Susan, "A Comparative analysis of a returnable/reusable packaging system" (1998). Thesis. Rochester Institute of Technology. Accessed from
This Thesis is brought to you for free and open access by RIT Scholar Works. It has been accepted for inclusion in Theses by an authorized administrator of RIT Scholar Works. For more information, please contact [email protected].
A COMPARATIVE ANALYSIS OF A
RETURNABLE/REUSABLE PACKAGING SYSTEM
by
Susan E. Starks
A Thesis
Submitted to the
Department ofPackaging Science
College ofApplied Science and Technology
in partial fulfillment of the requirements
for the degree of
MASTER OF SCIENCE
Rochester Institute ofTechnology
1998
Department ofPackaging ScienceCollege of Applied Science and Technology
Rochester Institute of TechnologyRochester, New York
Certificate of Approval
M.S. DEGREE THESIS
The M.S. Degree thesis of Susan E. Starkshas been examined and approved
by the thesis committee as satisfactoryfor the thesis requirements for the
Master of Science Degree.
Dan Goodwin
David Olsson
Deanna M. Jacobs
October 22, 1998
A Comparative Analysis of aRetumableIReusable Packaging System
I, Susan E. Starks, hereby grant limited permission to the Wallace Library ofthe Rochester Institute of Technology to reproduce my thesis in whole or in part. Anyreproduction will not be for commercial use or profit. All persons or organizationsrequesting copies shall be listed below.
ACKNOWLEDGEMENT
I would like to thank those people that have helped to me in completing this
document. First of all, I would like to thank the formerMasland Industries and Terry
Shank for allowing me to conduct this research. I would also like to thank the
Department ofPackaging Science at RIT for helping me through the process; especially
Deanna Jacobs, David Olsson, and Daniel Goodwin
It is also important to thank my family for their encouragement and patience during
the trying times ofgetting my degree. The missed weekends and no-questions-asked chill
time made all the difference.
Finally, I would like to thank my friends who pushed me to make it ultimately
happen. Beck - thanks for the support, the shoulder to cry on, the dinners and a
place to crash. Without your generosity and caring, I never could have made it this
far. D. - without your concern, questioning, prodding, reassurance and motivation,
this would still be sitting in a box with a "someday"
post-it on top. You are the
straw that made me finally finish this thing. There are no words that can fully express
the gratitude and thanks you deserve.
I would like to dedicate this to my grandparents.
They have always inspired me to try to be a better person.
PROLOGUE
At the time this study was conducted, Masland Industries was a publicly traded tier
one automotive supplier. A tier one supplier sells components directly to the automotive
company, rather than selling parts as a sub-supplier (tier two). Approximately one year
after the conclusion of the study, ownership of the company changed hands. It was
purchased by Lear Corporation in 1996 in a $384.8 million dollar stock buy back. At that
time the company became theMasland Division ofLear Corporation. Currently, the
former company is known as the Floor Systems Division ofLear Corporation. All
manufacturing and fabrication plants have remained in the same locations. Almost all
corporate support personnel have relocated to offices in Southfield and Plymouth,
Michigan.
A Comparative Analysis of a
Returnable/Reusable Packaging System
by
Susan E. Starks
1998
ABSTRACT
The primary objective of this study was to determine if the implementation of a
returnable/reusable container system was financially viable for a specific company. The
study attempted to document all cost parameters involved in making a capital budgetingdecision regarding returnable containers. The specific cost parameters applicable to this
project were then identified. The actual cost associated with each parameter was then
obtained either through quotation or calculation. Several capital budget decision making
cost analysis methods were presented. One method which best represented the project's
qualifying factors was then chosen. The analysis was completed and the results were
presented. The results of this study determined that it would be a financially viable
decision to implement a returnable container system at this company.

TABLE OF CONTENTS
Page
List ofTables ix
List ofFigures
Chapter 1 - Introduction and Review 1
Material Savings 2
Product Quality 3
Solid Waste Reduction 3
Housekeeping 5
Ergonomics 5
Key System Features 6
Examples 7
Purpose 9
Chapter 2 - Project Parameters 10
Corporate Background 10
Product Parameters 11
Package Parameters 12
Distribution Environment 13
Manufacturing Procedure 13
Areas for Current System Improvements 15
Proposed Packaging Alternatives 16
Chapter 3 - ResearchMethods 19
Cost Components for Consideration 19
Distribution System StepsWhich Generate Cost 21
Methodology 22
Chapter 4 - Data Analysis -25
Chapter 5 - Discussion and Conclusions 48
Conclusion 48
Recommendations for Future Study 50
Appendix A 52
Appendix B 59
References Consulted 61
vni
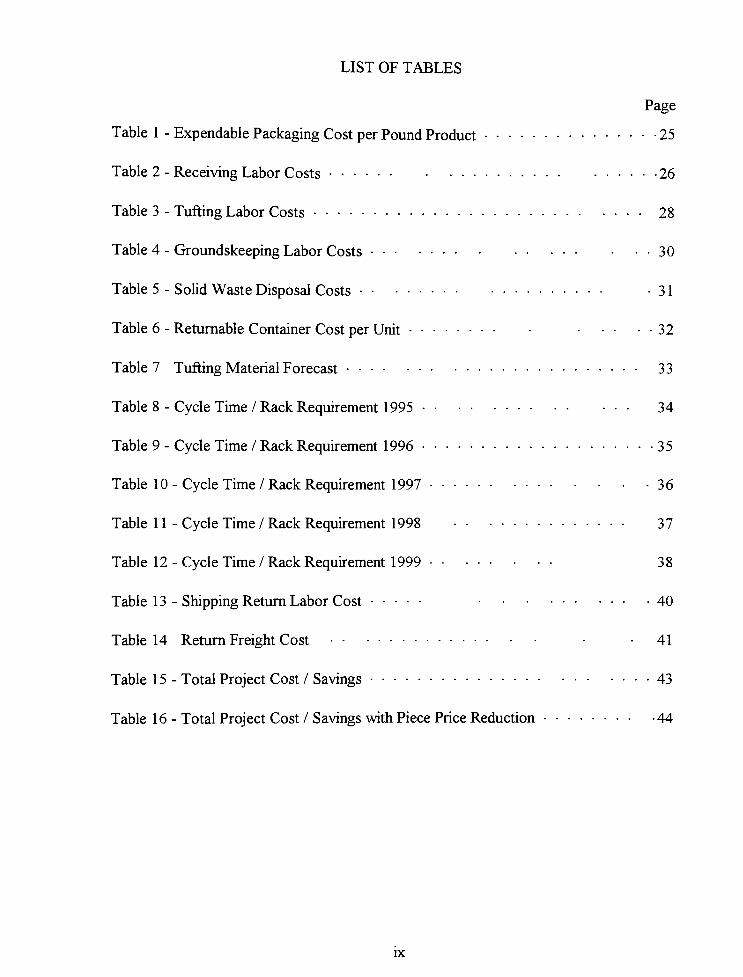
LIST OF TABLES
Page
Table 1 - Expendable Packaging Cost per Pound Product 25
Table 2 -
Receiving Labor Costs 26
Table 3 -
Tufting Labor Costs 28
Table 4 -
Groundskeeping Labor Costs 30
Table 5 - Solid Waste Disposal Costs -31
Table 6 - Returnable Container Cost per Unit 32
Table 7 TuftingMaterial Forecast 33
Table 8 -Cycle Time /Rack Requirement 1995 34
Table 9 -Cycle Time /Rack Requirement 1996 35
Table 10 -Cycle Time /Rack Requirement 1997 36
Table 11 -Cycle Time / Rack Requirement 1998 37
Table 12 -Cycle Time /Rack Requirement 1999 38
Table 13 - Shipping Return Labor Cost 40
Table 14 Return Freight Cost 41
Table 15 -Total Project Cost /Savings 43
Table 16 - Total Project Cost / Savings with Piece Price Reduction 44
IX
LIST OF FIGURES
Page
Figure 1 - Cone ofFiber 11
Figure 2 - Current Unit Load Package 12
Figure 3 - Representation ofProposed Package 18
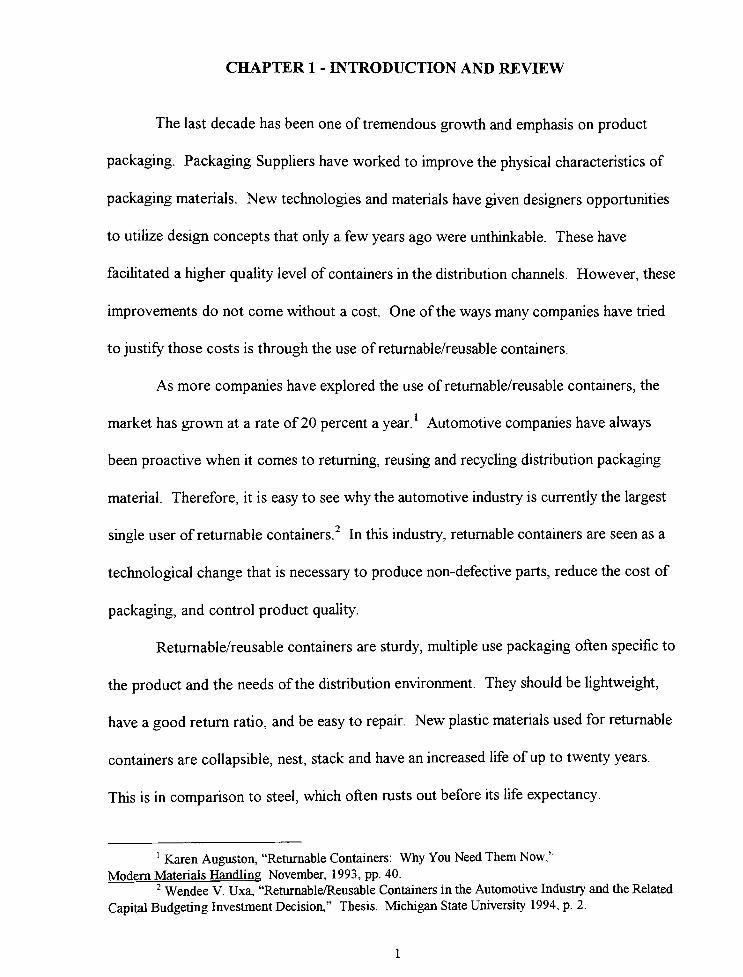
CHAPTER 1 - INTRODUCTION AND REVIEW
The last decade has been one of tremendous growth and emphasis on product
packaging- Packaging Suppliers have worked to improve the physical characteristics of
packaging materials. New technologies and materials have given designers opportunities
to utilize design concepts that only a few years ago were unthinkable. These have
facilitated a higher quality level of containers in the distribution channels. However, these
improvements do not come without a cost. One of the ways many companies have tried
to justify those costs is through the use of returnable/reusable containers.
As more companies have explored the use of returnable/reusable containers, the
market has grown at a rate of20 percent ayear.1
Automotive companies have always
been proactive when it comes to returning, reusing and recycling distribution packaging
material. Therefore, it is easy to see why the automotive industry is currently the largest
single user of returnablecontainers.2
In this industry, returnable containers are seen as a
technological change that is necessary to produce non-defective parts, reduce the cost of
packaging, and control product quality.
Returnable/reusable containers are sturdy, multiple use packaging often specific to
the product and the needs of the distribution environment. They should be lightweight,
have a good return ratio, and be easy to repair. New plastic materials used for returnable
containers are collapsible, nest, stack and have an increased life ofup to twenty years.
This is in comparison to steel, which often rusts out before its life expectancy.
1Karen Auguston, "Returnable Containers: Why You Need Them
Now,'
ModernMaterials Handling November, 1993, pp. 40.2Wendee V. Uxa, "Returnable/Reusable Containers in the Automotive Industry and the Related
Capital Budgeting InvestmentDecision,"
Thesis. Michigan State University 1994, p. 2.
MATERIAL SAVINGS
Returnable container systems can reduce packaging material costs over time when
compared to one-way expendable container systems. That is because returnable
containers are designed to last for many trips. The result is a significant savings in
packaging material replacement and disposal costs. While the initial investment is high,
most container systems typically pay for themselves over a long life cycle. In many cases,
the containers themselves outlive the product they carry. Similarly, lightweight plastic
containers have many benefits over expendable corrugated boxes. The principal benefits
are savings in packaging purchase costs and disposal costs.
Some people would argue that plastic containers really won't save money. The
point they make is that the container is nothing more than a tool. The secret to saving
money is to redesign the parts or product delivery system. Reusable containers are a part
of that redesign, but so are automatic data collection, ergonomics, employee
empowerment and otherfactors.3
Therefore, implementation requires planning, adequate
justification, management approval and backing, coordination between manufacturer and
customer and appropriate follow up. However, since containers are easier to quantify,
they often get all the focus when implementing a new returnable container system. There
are also many other areas that require consideration and influence in justifying a returnable
container system.
3Clyde E. Witt, "Plastic Containers Won't Save You
Money,"
Material Handling Engineering, October, 1994, pp. 20.
PRODUCT QUALITY
Returnable containers may also offer other savings in terms ofdecreased product
damage due to low cost, low quality generic packaging. In the past, distribution packages
have been relatively standard containers that the product is made to fit into. Research has
shown that returnable packaging can be more efficiently tailored to fit specific products
and their distribution systems. This inherently allows the package to fit the specific quality
requirements of the product. Similarly, a key element in the container's design is
maintaining the integrity of the product to be shipped. With an astute design, a single
container can function as an in-line tote, a product assembly platform, a fixture to hold
parts, and a returnable container that nests or folds flat for returnshipping.4
SOLID WASTE REDUCTION
The Environmental Protection Agency (EPA) has outlined three approaches to solid
waste reduction. The first two deal with reduced packaging per unit, and increased product
life cycles. The third approach is substituting single-use"disposable"
products with reusable
products. It states that reusable products should be engineered to increase the number of
times that an item may bereused.5
This approach can be applied to the packaging as well as
the product. High volume products should be the center of attention for waste reduction
because they contribute the most tomunicipal solid waste
stream.6
This fits into many
corporate policies which believe there is an obligation to protect the environment
4
Auguston, p. 41.5United States Environmental Protection Agency, Resource Recovery andWaste Reduction, third
report to Congress by the Office of SolidWasteManagement Programs (Washington D.C., 1974) p. 16.
6Mark A. Plezia, "An Energy Comparison Between Polycarbonate and Glass Half-Gallon Milk
Bottles Used in a Returnable RefillableSystem,"
Thesis. Rochester Institute ofTechnology 1991, p. 4.
Reusable containers reduce the waste a company generates. This is one of the
most important benefits of a returnable container system. Less trash means less labor
required to collect and clean. Less trash also equals lower dumping fees which equals better
numbers on the bottom line. That ismeasurable.7
It is also one of the many benefits the
automotive industry has taken note of:
With the advent of environmental awareness, the cost ofdisposal has soared.
Knowledgeable groups are projecting a continued rise in these costs. Traditional
methods of disposal - landfill and incineration - are becoming more costly or
simply unavoidable. In some areas, landfill and incineration operations have been
banned by legislation. In other areas, landfills require separation and sorting of
materials or even restrict certain types ofwaste altogether. As a result, waste
disposal is no longer just an environmental issue but an economic one aswell.8
There are many examples ofhow seriously this issue has been taken. General
Motors set a goal ofzero-landfill for packaging material by 1994 for eight of its midsize
auto assembly plants. It set specific guidelines for suppliers whether they are shipping in
expendable or reusable containers. "Wasteful, excessive, and non-recyclable packaging
will not beacceptable"9
This policy was strictly enforced and expanded over time to
additional assembly plants. Chrysler was able to eliminate 209 tons per day of expendable
packaging solid waste by switching to 100 percent returnable containers at oneplant.10
The estimated savings of $8 million/year only included a reduction in packaging material
expense. It did not include savings from elimination ofwaste disposal.
7
Witt, p. 20.8David N. Koenck, "Many Happy
Returns,"
Actionline, September, 1993, p. 25.9Tom Andel, "New Ways to Take Out the
Trash,"
Transportation and Distribution.
May, 1993, p. 25.10Helen Richardson, "Cutting Packaging Also Cuts
Costs,'
Transportation and Distribution, October, 1989, p. 26.
HOUSEKEEPING
One of the many intangible benefits of returnable packaging systems is visual
management. They allow for a neater, less cluttered production area. Returnable
containers also tend to increase visibility and identification ofparts. Another advantage is
that if the containers are plastic, they hold up extremely well in a variety of environmental
conditions. The containers are waterproof, resist chemicals and rust, and do not absorb
liquids or odors from previous loads. All of these items lead to improved housekeeping.
ERGONOMICS
Another less-visible savings attributed to returnable containers are ergonomic
benefits. The premise is that reusable containers make ergonomic sense, not because they
are plastic or metal, but because they are reusable. It is possible to build ergonomic
features into returnables when they are designed. This is due to the fact that reusable
containers are part of a system. For instance, when a system is designed, an engineer
reviews how containers are presented to the assembly worker. Weight, height and
presentation of standard-sized containers are all considerations that help reduce injuries
and enhanceproductivity.11
Also, less direct labor may be required in handling, opening,
and moving the containers. This elimination of labor allows for production efficiencies to
be gained. Other features of returnable systems are also considered crucial to
implementation success.
11
Witt, p. 20.
KEY SYSTEM FEATURES
When evaluating what products may lend themselves to a returnable packaging
system, there are several features which can be the key to success. According to the 1991
Ford Packaging Guidelines, "Economic factors that influence the use of the returnable
packaging include: material, quality, labor, freight, cleaning, disposal, recycling and
toolingcosts."1
These are certainly all important areas which should be considered.
Ideally, a manufacturer should be in a closed-loop distribution system with its
suppliers. Creating a system requires commitment from Purchasing, Information
Management, Manufacturing, and Shipping/Receiving departments. A program's success
is dependent on the involvement ofall partners and/or suppliers. They have to be
committed to the process. All partners in this venture should understand that some
economical method of returning the containers is at the core of the system. Accurate
tracking and return along the loop are also critical components of the system.
Another consideration is that returnable containers are not really a direct substitute
for expendable packaging. Unlike expendable packaging, returnable containers typically
require a high initial capital investment. In order to protect that investment, some type of
control system is necessary to ensure that the containers remain captive in the distribution
system.13
Without this feature in place, creating a successful returnable system would be
extremely difficult.
It is also essential to determine the necessary number of returnable containers
required for one cycle. Distance between supplier and manufacturer is the first important
12FordManufacturing andMaterial Handling Engineering Standards Department, Ford
Packaging Guidelines for Production Parts, February, 1991, p. 12.13
Auguston, p. 40.
variable. It determines the cycle time between shipments. Cycle time is important because
the longer the cycle time, the more containers areneeded.14
When more containers are
needed, the capital investment increases, and the chance for a successful payback period
declines. While no one wants to underestimate product distribution cycle times (and risk
running out of containers) it becomes a detriment to the implementation economics if
cycle times are inflated beyond what is required.
These considerations fall in line with the thoughts of a just-in-time distribution
system. When this concept is in use, it creates an excellent environment for savings from
implementation of a returnable container distribution system. Dedicated shipping routes,
shorter delivery distances, shortened delivery time, smaller inventories, and a partnership
relationship between manufacturer and a smaller number of suppliers all contribute to the
ideal setting for the use of returnable shippingcontainers.15
There are many examples of
successful returnable systems in place in the automotive industry.
EXAMPLES
In reviewing the options ofone time investment for returnable packaging versus
the spending ofvariable dollars for expendable packagingover the life of the model,
Chrysler material handling engineering showed a payback in less than one year. Savings
are realized by suppliers eliminating purchase of expendable paperboard cartons and wood
pallets and passing the savings on to Chrysler. Additionally the plant saves the cost of
disposing of the expendablepackaging.16
Recordable benefits at Chrysler include
,4Uxa,p. 13.15
Uxa, p. 7.16"ChryslerDoes It
Again,"
ModernMaterials Handling, January, 1993, p. 45.
improvements in part quality, packaging quality, and cost reductions including packaging
material, handling costs, inventory, and disposal. Intangible benefits include visual
management (neat house), decrease in use of forktrucks, and better visibility and
identification ofparts. There were some negative aspects of retumables at Chrysler as
well. These included sudden volume shifts causing container shortages, varied
manufacturing plant locations, limited supplier resources, part engineering changes
requiring increased package development, cleaning and firehazard problems, and
inadequate container control.
At Toyota MotorManufacturing's Georgetown, Kentucky assembly plant, over
91 percent ofparts are received in returnable containers. Dedicated route carriers make
deliveries from suppliers up to 16 times per day. Dunnage (internal packaging) is left
inside the return container forre-use.17
This allows Toyota to be able to plan consistent
transportation routes, reduce material handling, and reduce costs associated with
assembly and disposal of expendable packaging.
Taking the concept to the next level was GeneralMotor's Saturn plant in Spring
Hill, Tennessee. The plant was designed with a concept of 100 percent returnable
containers. Components remain in the containers and move directly from staging to the
assembly line. Reusables also reduced the space usually dedicated to handling disposable
containers, packaging and trash.
17"Container System Saves Millions In
Transport,"
Transportation and Distribution.
September, 1992, p. 101.18"Reusable Containers Keep Assembly Line Moving At
Saturn,"
Material Handling
Engineering, December, 1993, p. 72.
PURPOSE
While these are all excellent examples of returnable/reusable container systems that
worked for each individual company it would be difficult to make general assumptions
based on their outcome. A comprehensive study would be more successful if it were
based on specific circumstances. The results from a case study would be beneficial in
understanding which returnable system variables were critical to a new container
implementation. That is, discovering which variables would generate the most savings,
and which would create the greatest risk for failure. An evaluation of distribution system
costs should be done to compare expendable containers with returnable containers for
both costs and benefits. Packaging material expense and freight costs are the two most
obvious factors to include in a cost justification, but there are many other considerations.
A complete analysis will also improve the probability that the predicted results are
consistent with the actual results.
This information demonstrates a need for further study in the area of
returnable/reusable container systems. It specifically shows that continued work to
increase the database of case studies for economic justification of returnable containers is
critical in understanding and quantifying whichimplementation parameters are key to a
systems success. In this context, an analysis was completed utilizing the specific
circumstances of a corporation within the automotive industry. The results of that analysis
are described and presented in this thesis.
CHAPTER 2 - PROJECT PARAMETERS
CORPORATE BACKGROUND
Masland Industries is a leading designer and manufacturer of interior systems and
components for the North American automotive industry. Its primary manufacturing
facility of in-process materials is located in Carlisle, Pennsylvania. This facility
manufactures both tufted and non-woven carpet products in roll form. This material is
then sent to one of seven fabrication plants throughout North America to be made into
finished automotive carpet. Masland is considered a "tierone"
supplier in the automotive
industry, producing over two million automotive carpets per year.
In order to manufacture tufted carpet, the company relies on receiving several raw
materials from outside suppliers. These materials include the fiber product, weaving
substrate and backing material. One of the key materials is the actual fiber product. The
fiber may be one of several materials such as nylon, polypropylene, or bulk continuous
fiber (BCF). These materials are currently purchased from one key supplier with two
backup suppliers. CAMAC Corporation in Bristol, Virginia currently supplies 80 percent
of the fiber product used byMasland. Both companies have entered into a"partnership"
to help foster cooperation and increase manufacturing efficiencies. Brainstorming sessions
were held and one of the ideas brought forth was to make improvements in the packaging
ofCAMAC s products. It was believed that this would be beneficial to both parties.
10
11
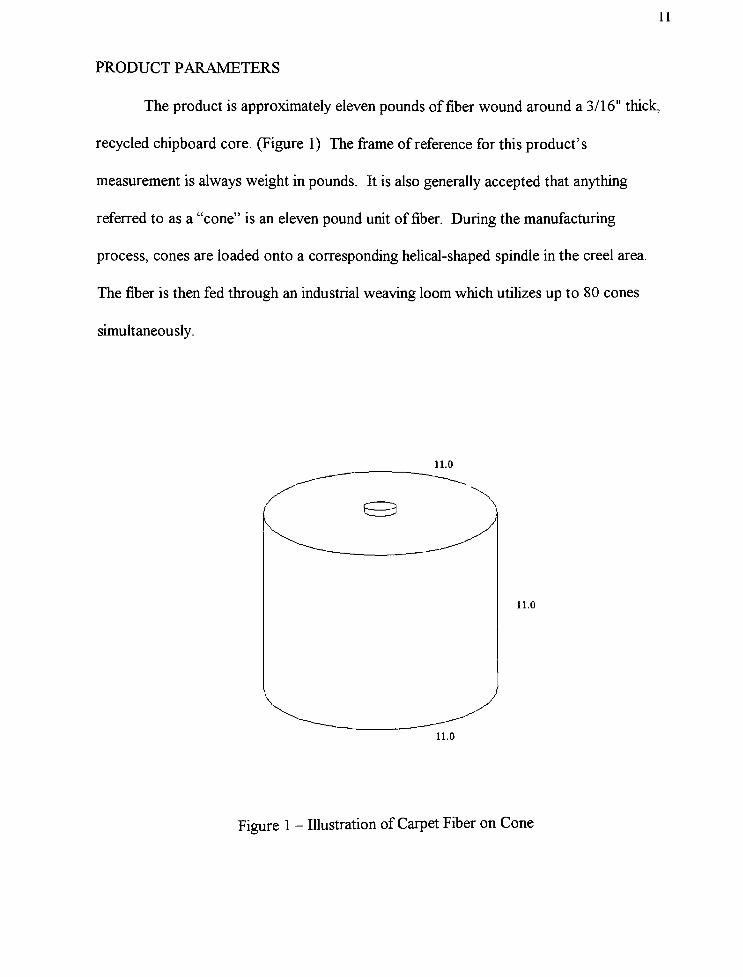
PRODUCT PARAMETERS
The product is approximately eleven pounds of fiber wound around a3/16"
thick,
recycled chipboard core. (Figure 1) The frame of reference for this product's
measurement is always weight in pounds. It is also generally accepted that anything
referred to as a"cone"
is an eleven pound unit of fiber. During the manufacturing
process, cones are loaded onto a corresponding helical-shaped spindle in the creel area.
The fiber is then fed through an industrial weaving loom which utilizes up to 80 cones
simultaneously.
11.0
n.o
11.0
Figure 1 - Illustration ofCarpet Fiber on Cone

12
PACKAGE PARAMETERS
Currently this product is shipped in a one-way expendable package. This package
consists of a bottom tray with4"
sides made out of200# kraft corrugated paperboard.
Nine cones of fiber are placed on the tray in a 3 x 3 configuration. A 200# kraft
corrugated layer pad is placed on the cones and nine more cones are placed on the layer
pad. This is repeated until there are four layers of cones. On top of the fourth layer, a top
tray with4"
sides made out of200# kraft corrugated is placed on the cones. This entire
"package"
is then stretch wrapped with approximately two layers of 80 gauge linear low
density polyethylene (LLDPE) applied with a 150 percent pre-stretch. (Figure 2)
Figure 2 - Expendable Shipping Package for Fiber
13
DISTRIBUTION ENVIRONMENT
The outside dimensions of the unit load package are34"
x34"
x45"
The unit
load is loaded onto a trailer by a clamp truck in a bundled unit format: no pallets are used.
The bundled units are double stacked. A typical full truck load contains 72 units and
carries between 30,000-34,000 pounds ofmaterial. The sales contract has a clause that
states if the outbound weight is greater than 30,000 pounds, CAMAC will pay for the
freight charges. If the outbound weight is less than 30,000 pounds, Masland must pay for
the freight charges. This was put in place to ensure that Masland ordered in full truck load
quantities whenever possible.Masland'
s procurement personnel will typically pull forward
their forecasted requirements in order to fulfill this requirement.
All shipments are received byMasland at an off-site warehouse. The bundled units
are unloaded by a clamp truck driver. They are then placed on pallets, logged into
inventory, and placed in a warehouse location. Material is then sent in a"milkrun"
format
to the production receiving area in quantities sufficient to support the following eight
hours ofproduction.
MANUFACTURTNG PROCEDURE
Material requests are sent by the tufting machine operator to the production
receiving area. Once the material arrives from the off-site warehouse, it is transported by
forklift to the tufting machine area. It is received on a pallet in a bundled (stretch
wrapped) unit of36 cones. The assistant machine operator must then remove the stretch
wrap and reload the cones into a "creelcart."
The creel carts are large steel bins on
wheels that resemble old fashioned coal mining carts.
14
The creel is a large frame that holds up to 160 cones of fiber at one time. It is
made up of eight rows separated by narrow aisles. Only one halfof the cones are being
used at any one time. The other halfof the cones are loaded so that the material can be
spliced in so that production does not need to stop. Due to the delicate nature of the fiber
material, and the size of the machine, space is very limited. The aisles between the creel
rows are only29-V4" wide. The bundles of cones are too wide to fit through the creel
aisles. That is why the cones must be reloaded into the creel carts. The carts were
specially fabricated in house to fit between the creel rows. They are on wheels to help
facilitate easier movement up and down the aisles. However, in order to minimize the
number of trips made back to the bundles, the carts were made40"
tall(37"
ofbucket,3"
ofwheels). This creates ergonomic problems due to the bending required and the
awkward position encountered when lifting the bottom layer of cones. It is also an
extremely inefficient use of time for the assistant operator to constantly have to reload the
carts to refill the creel. Typically, the creel needs to be refilled once in an eight hour shift
Once a unit load ofproduct has been unloaded, assistant operators are responsible
for clean-up. They place the stretch wrap and any miscellaneous refuse into a garbage
can. The kraft corrugated is then stacked off to the side in a pile for pick-up by the
groundskeeper. Finally, the pallets are stacked for pickup by the production receiving area
lift truck driver. The operators are only allowed to manually stack them four pallets high
to reduce any safety concerns. The pallets are then collected by the lift truck driver when
the next load ofmaterial is brought out to the line. They are then sent back over to the
off-site warehouse for reuse by the clamp truck driver when offloading trailer loads.
15
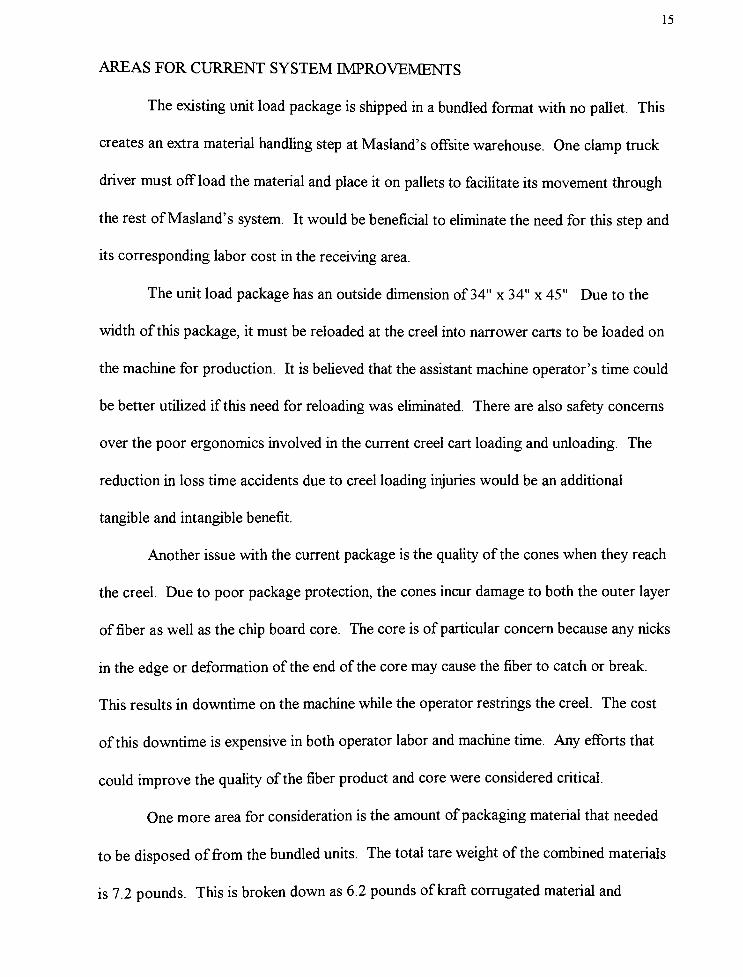
AREAS FOR CURRENT SYSTEM IMPROVEMENTS
The existing unit load package is shipped in a bundled format with no pallet. This
creates an extra material handling step atMasland's offsite warehouse. One clamp truck
driver must offload the material and place it on pallets to facilitate its movement through
the rest ofMasland's system. It would be beneficial to eliminate the need for this step and
its corresponding labor cost in the receiving area.
The unit load package has an outside dimension of34"
x34"
x45"
Due to the
width of this package, it must be reloaded at the creel into narrower carts to be loaded on
the machine for production. It is believed that the assistant machine operator's time could
be better utilized if this need for reloading was eliminated. There are also safety concerns
over the poor ergonomics involved in the current creel cart loading and unloading. The
reduction in loss time accidents due to creel loading injuries would be an additional
tangible and intangible benefit.
Another issue with the current package is the quality of the cones when they reach
the creel. Due to poor package protection, the cones incur damage to both the outer layer
of fiber as well as the chip board core. The core is ofparticular concern because any nicks
in the edge or deformation of the end of the core may cause the fiber to catch or break.
This results in downtime on the machine while the operator restrings the creel. The cost
of this downtime is expensive in both operator labor and machine time. Any efforts that
could improve the quality of the fiber product and core were considered critical.
One more area for consideration is the amount ofpackaging material that needed
to be disposed of from the bundled units. The total tare weight of the combined materials
is 7.2 pounds. This is broken down as 6.2 pounds ofkraft corrugated material and
16
approximately one pound of stretch wrap and any miscellaneous refuse. It has been
determined that material disposed of from the tufting area represented 75 percent of all
material disposed of from Masland at this location. It requires one groundskeeping person
in this area for approximately one hour per day just to collect this packaging material. The
kraft corrugated layer pads and caps are sent to the bailer to be prepared for recycling.
The stretch wrap and other materials are placed in solid waste disposal containers for
pickup. Any reduction in the volume ofpackaging waste from the current bundled unit is
considered a cost benefit for both groundskeeping labor and material disposal. There are
also safety concerns in having the operators stack the pallets and kraft corrugated
materials. Many minor injuries are a result of this action and could be avoided if this
material were eliminated or reduced.
PROPOSED PACKAGINGALTERNATIVES
Several options have been suggested that would help address the areas of concern
with the current expendable packaging. These include redesigning the package into a
more user friendly expendable format, and redesigning the package into a
returnable/reusable container. The option which seems to have the most merit proposes a
system which would utilize a returnable/reusable container. However, before any of these
options are put in place, it is believed that a comparative financial analysis must be
conducted. This analysis would present quantified cost information for both container
systems from which a conclusion as to which is more cost efficient can be made. Also, it
17
is generally accepted that an economic study be done before any major project is
undertaken.19
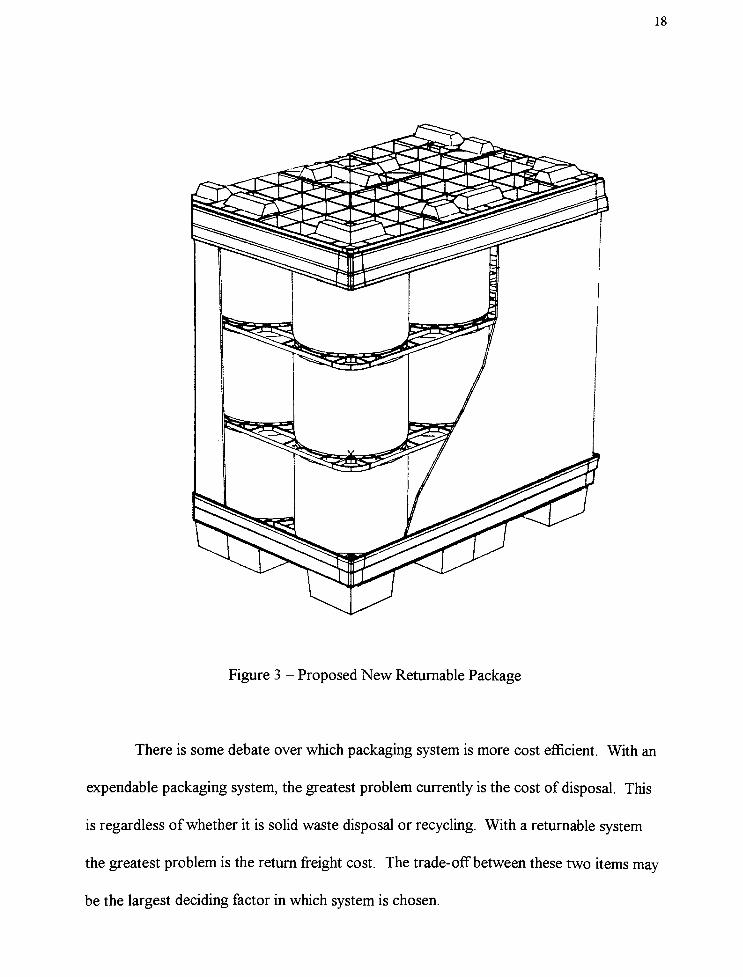
The returnable system proposed would consist of a bottom pallet molded out of
high density polyethylene (HDPE) with an interlocking pocket design. A single sided plug
separator would then be laid on the pallet. Six cones ofproduct would be loaded onto the
corresponding plug in a 2 x 3 configuration. A double sided plug separator would then be
placed on top of the cones, and the next layer of six cones would be loaded. This is
repeated until there are four layers of cones. A single sided plug separator would then be
places on the top layer. A top pallet, identical to the bottom pallet, would be placed
upside down over the top layer. The entire unit is then stretch wrapped with
approximately two layers of 80 gauge LLDPE applied with a 150 percent pre-stretch.
(Figure 3)
19Edmund A. Leonard, Managing the Packaging Side of the Business.
(New York: AMACOM, 1977) p. 42.
18
Figure 3 - Proposed New Returnable Package
There is some debate over which packaging system is more cost efficient. With an
expendable packaging system, the greatest problem currently is the cost of disposal. This
is regardless ofwhether it is solid waste disposal or recycling. With a returnable system
the greatest problem is the return freight cost. The trade-offbetween these two items may
be the largest deciding factor in which system is chosen.
CHAPTER 3 - RESEARCHMETHODS
COST COMPONENTS FOR CONSIDERATION
There are six elements ofpackaging costs:
1 . Development costs, which include design, models,
cost estimating, and evaluating samples.
2. One time costs, which include tooling for
production.
3. Material costs, which include cost ofprimary
pack, transport of the packaging supplies, storage
and handling, losses due to damage/pilferage, and
inspection.
4. Packaging machinery, which involve service and
maintenance, alone with utility costs.
5. Packaging process costs, which include direct and
indirect labor, overhead expenses, and incidental
materials.
6. Distribution costs, which include storage and
warehousing of finished goods, transportation to the
customer, and the cost of quality (protecting against,
replacing, or loss of sales from, damagedgoods).3
3Edmund A. Leonard, Packaging: Specification. Purchasing, and Quality Control.
(New York: M.Dekker, 1987) p. 24-25.
19
20
Three of these elements will be eliminated from consideration because it is believed
that their effects on the outcome of this analysis are negligible. This is due to the inherent
similarities ofboth systems. These elements are development, machinery, and one time
costs. The three remaining elements, material, packaging process, and distribution costs,
will be further broken down into individual cost steps and analyzed.
21
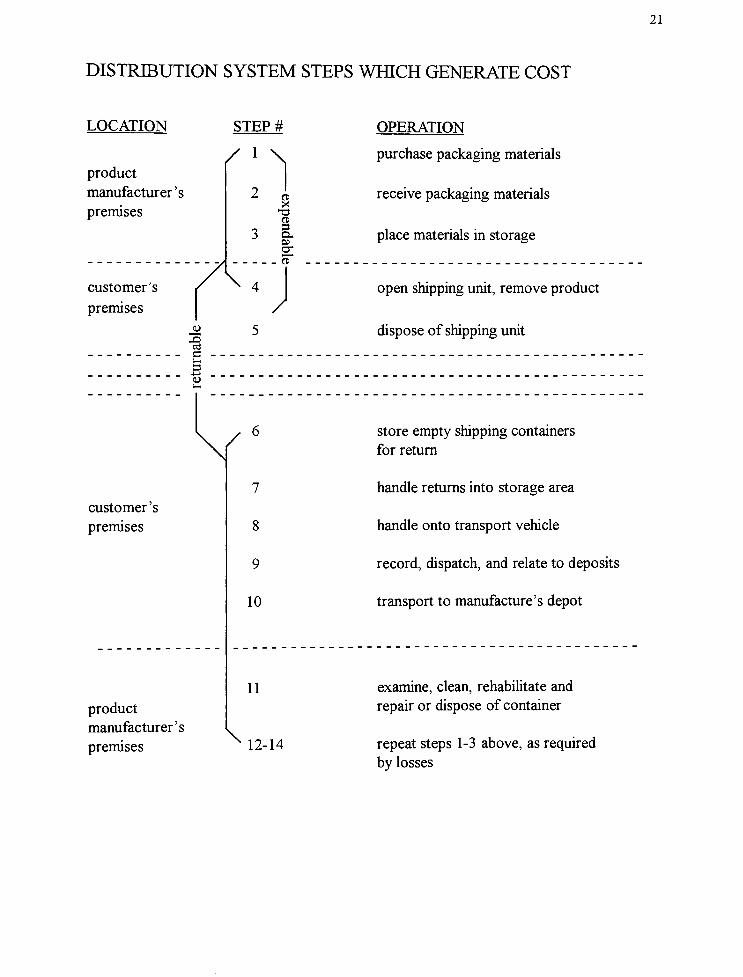
DISTRIBUTION SYSTEM STEPS WHICH GENERATE COST
LOCATION
product
manufacturer's
premises
STEP#
/ 1 \
customer s
premises
2 n
x
a
3 a.
cr
nT
\
/
c:
3^
U
premises
OPERATION
purchase packaging materials
receive packaging materials
place materials in storage
open shipping unit, remove product
dispose of shipping unit
\(6 store empty shipping containers
for return
1 handle returns into storage area
customer's
premises 8 handle onto transport vehicle
9 record, dispatch, and relate to deposits
10 transport to manufacture's depot
product
manufacturer's
11 examine, clean, rehabilitate and
repair or dispose of container
by losses
22
METHODOLOGY
The first step in analyzing a task of this scope is proper documentation of the
current expendable packaging system. This documentation will include the item
generating cost, the type of cost associated with it, and the method used to establish the
actual cost figure.
1 . Manufacturing of containers -
material costs. Current expendable packaging is
purchased by the supplier, CAMAC. This cost is rolled into the piece price
they charge Masland per pound ofmaterial. This information was considered
proprietary by the supplier and would not be provided. Therefore the package,
as it arrived at Masland, was taken apart into its component pieces. Basic
material specifications were then written and sent to Masland's suppliers for
quotation.
2. Receipt ofproduct at warehouse - labor costs. A time study will be done to
determine the labor charges incurred due to the type ofpackage used. The
procedure documented by the time study is shown in Appendix A.
3 . Internal requirements for reloading ofproduct- labor costs. A time study will
be done to determine the labor charges incurred due to the reloading of
product from the shipping package to another container for use at the creel.
The procedure documented by the time study is shown in Appendix A.
4. Disposal of containers - labor and disposal cost. The labor charges incurred
from the collection and preparation of the packaging material for disposal will
be determined. Also, the current disposal costs will be calculated by
determining the average tonnage ofpackaging material currently being
23
disposed of. This will be done by taking the weight of the current container
and multiplying it by the annual production volume of the product line. This
figure will then be used with the cost per ton ofboth solid waste disposal, and
recycling fees, to determine the total disposal cost.
The second step is proper documentation of the proposed returnable packaging
system. This documentation will include the item generating cost, the type of cost
associated with it, and the method used to establish the actual cost figure. Only items that
are unique to the returnable system will be documented.
1. Manufacturing of containers- material costs. These figures will be obtained
by competitively quoting the new packaging items through the Purchasing
Department
2. Unitization of containers for return shipment - labor costs. A time study will
be done to determine the labor incurred due to the need to unitize the
containers for return to the supplier location.
3. Transportation of returning containers -shipping costs. This will be
determined by using the annual weight/volume of the containers shipped and
applying it with the current negotiated contractsfor less than truckload (LTL)
shipments.
The third step in the process will be todocument all of the intangible benefits
and/or detriments to using either system.These items may include worker safety, good
housekeeping, user friendliness ofpackage, and employee perception towards their
contribution in the solution. While most of these items are not "quantifiable", an attempt

24
will be made to determine their impact on the possible implementation of a new packaging
system.
Using all of the cost figure information, a decision matrix will be set up to help
facilitate choosing a course of action. The output information will show which is the most
economical method to package the fiber product.
CHAPTER 4 - DATA ANALYSIS
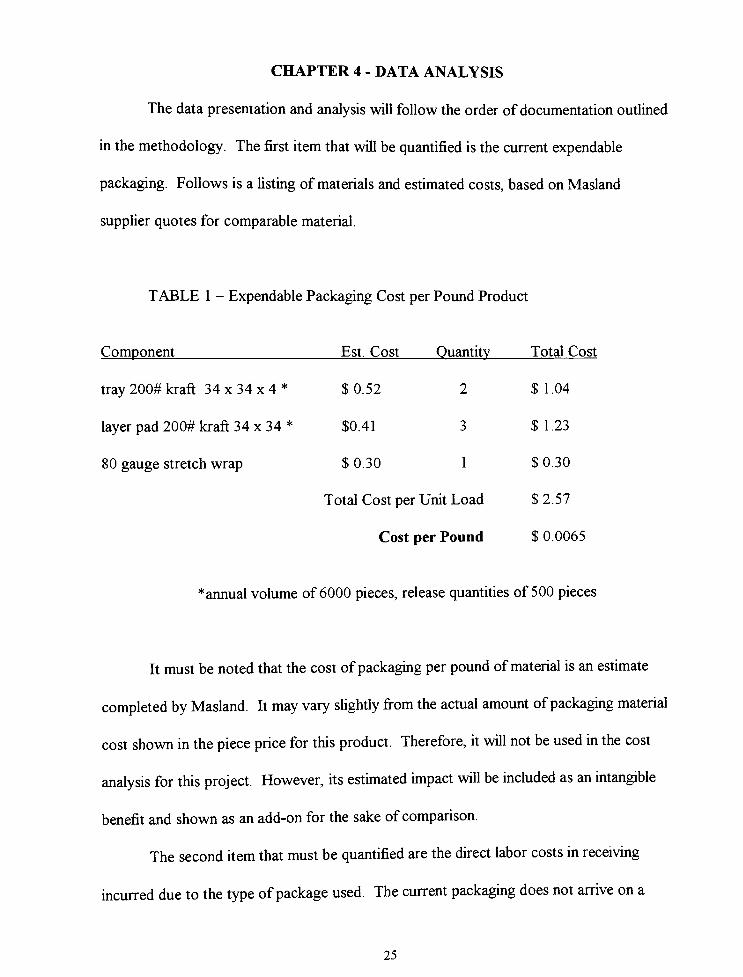
The data presentation and analysis will follow the order ofdocumentation outlined
in the methodology. The first item that will be quantified is the current expendable
packaging. Follows is a listing ofmaterials and estimated costs, based onMasland
supplier quotes for comparable material.
TABLE 1 - Expendable Packaging Cost per Pound Product
Component Est. Cost Ouantitv Total Cost
$0.52 2 $ 1.04
$0.41 3 $ 1.23
$0.30 1 $0.30
Total Cost pei Unit Load $2.57
Cost per Pound $ 0.0065
tray 200# kraft34x34x4*
layer pad 200# kraft34x34*
80 gauge stretch wrap
*annual volume of 6000 pieces, release quantities of 500 pieces
It must be noted that the cost ofpackaging per pound ofmaterial is an estimate
completed byMasland. It may vary slightly from the actual amount ofpackaging material
cost shown in the piece price for this product. Therefore, it will not be used in the cost
analysis for this project. However, its estimated impact will be included as an intangible
benefit and shown as an add-on for the sake of comparison
The second item that must be quantified are the direct labor costs in receiving
incurred due to the type ofpackage used. The current packaging does not arrive on a
25
26
pallet and must therefore be palletized before it can be received into inventory. A time
study documenting the necessary steps is presented in Appendix A. Labor costs for future
years were calculated using projected hourly wages and forecasted amounts of incoming
materials. The following labor costs are due to this receiving step.

27
<n
Oo
a:
oDO
<
CDZ
>
UJ
o111
a:
UJ_l
m
<i-
(D O)^ t t
to ^ Sjt-
tq in
oo
Id
CO s g $ffl*
^ ^. N
o** m
vyl&m
a>
3r~
00 00 00 00
s -^m in m m m
CD ~^
CD
N CM CM CM CM
o o o o o
03
03- 49- </> to
i__
3
i; O rn O O O O
CD CD
o in in m m
m m m m in
"ca to >/>/> te
,.
E .-~.
rn m m m mi i r r i
ftoo oo oo oo oo
*-*
i
CD ,3. CM CD CO CO
CD0 S 3 *S ID
t-
CO CO
^ co_ CO t- ,-"t55
"E O i-
C\f"
1-
CM CM CM3
(.
"E3
CD CD CD CO CO0 0)05 010)
17) CO CO CO CO CO
^^
^:
t_t-
in 0) m m
CO 0 cnj in co 00
CD <3-_ cm_ in r r-
>.cm
*-
5
-Q
i_ m (0 mo 01CD 0)0)0)0)0)CD O) O) O) O) O) 1>*
""n
28
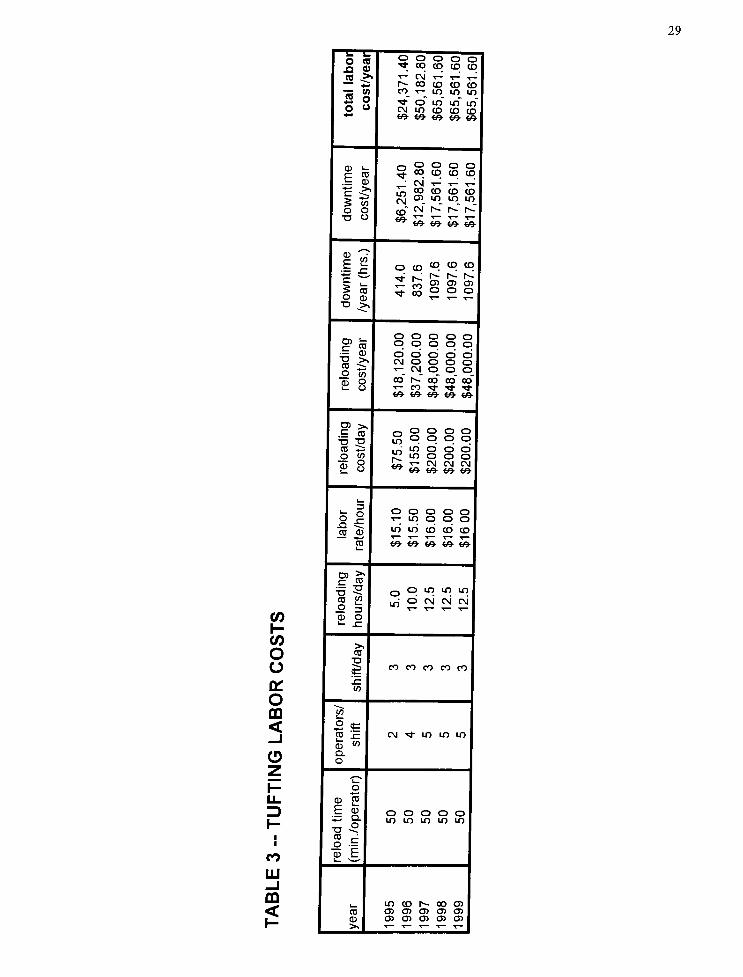
The third item that must be quantified is the direct labor costs in manufacturing-
the tufting department- incurred due to the type ofpackage used. The current packaging
arrives in a unit load configuration that is too large to load directly onto the machine.
Therefore it must be reloaded into a creel cart in order to be moved to the machine for
loading. A time study documenting the necessary steps for reloading is presented in
Appendix A. Labor costs for future years were calculated using projected hourly wages
and forecasted amounts of incoming materials.
Also, there is a considerable amount ofproduct damage that could be avoided by
improving the packaging. This damage causes a sizable amount ofdowntime. All
downtime due to product quality defects incurred because ofpackaging was documented.
The following are labor costs for reloading and machine downtime.
29
o o o
^ OO CO CD CO
(0 >> T-
CM T- ,- t-
"~+*
r- OO CD CD CD
"5 w co t-
in m m
^r o mO <> CM lO CO CO CO^
<& co- to- tO^ CO-
CD l 0o o o o
P CD
. CD^ 00 CD CD CO
CM t^
-^-r^
c J, CO CD CD CD
5 w Jtj o> in in m
o o
to o
^wSSS
^^
i o coco co co
lir-^
Is- Is- i*~
JI X O) O) 0)
5 sO CDTO >n
~-^
o o o o or- CD CD O O O O
CD CD CD CD CDCM O O O Ot-
CM_ 0_ 0_ O
CD O r-T
S: o T-
CO Tt *Tl-
tO- to-to t/ to-
^ CD.-. o o o o
g q q o oTO PCD i:
riO CD CD
f2 m o o o
\a. t- CM CM CMw to- to- to- tO^
o o
"55 Sc o
^
3o o o o o
ElCD CD
T-; in o o o
m m CD CD CD
TO to^ to- to- to- to
O) 2?=
-2
16 1 0 q m m m
cd 52 ^ O CM CM CM
3
CO CD O
r-
*- x:
to>,
oo
CD
TOCO CO CO CO CO
oro
CD 775
< 2 <e
_l2 2CD
<"
cm "fr m in m
OQ.
O
"^*
H O
u_ CD TO
13
d
o o o o o
1- in m in m m
jcd _;
o
coa3 E
UJ
i
i_ 1 U) (D N OO CO
CD 1 Oi Oi Oi (J> o>
CD 1 0)0)0)0)0)1x- r- ,- t-
^|>*l
30
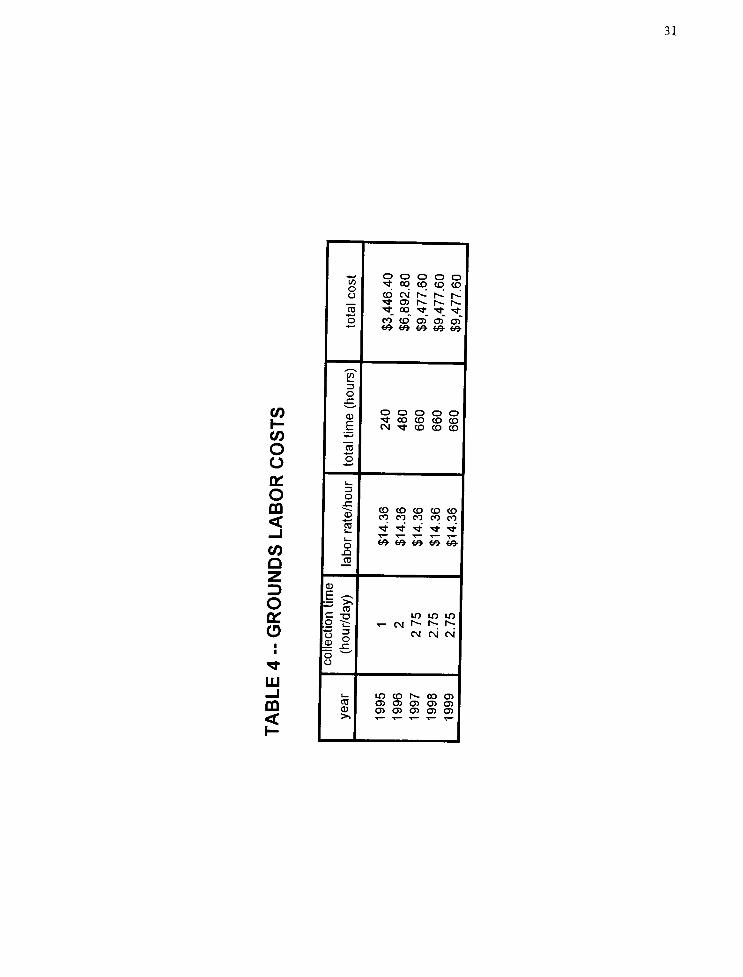
The next item that must be quantified is the direct labor costs incurred in the
building and grounds department due to the type ofpackage used. The current packaging
contains a large amount of corrugated board and a smaller quantity of stretch wrap that
must be collected each day. Labor costs for future years were calculated using projected
hourly wages and forecasted amounts of incoming materials. (Table 4)
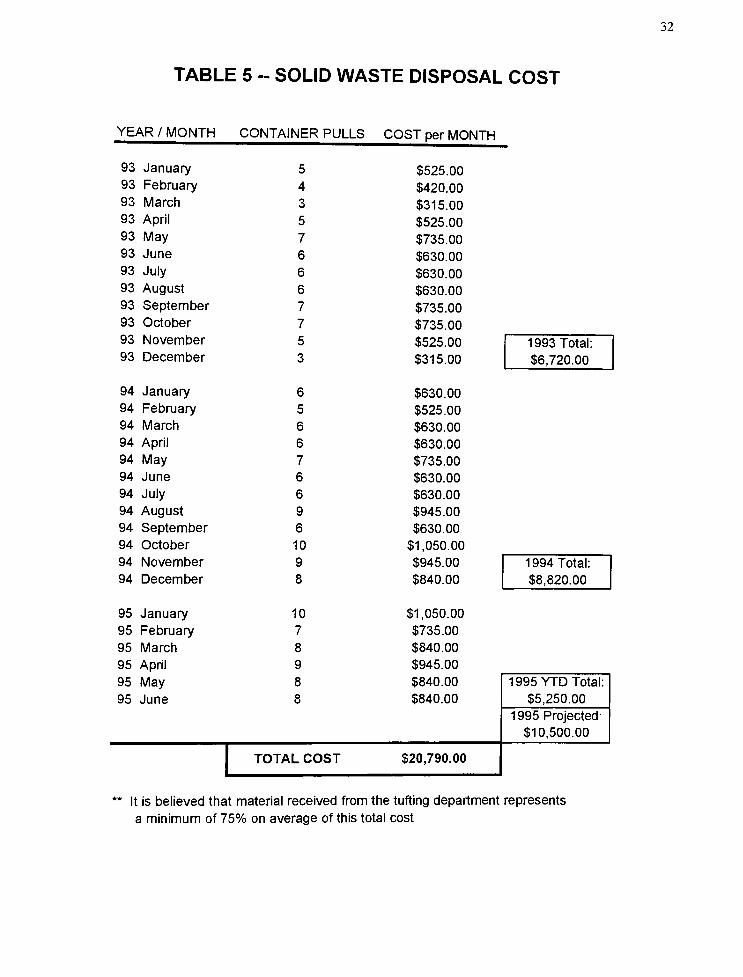
It has also been noted that this packaging material represents 75 percent of all
material disposed of from this plant. The number of container pulls and the annual cost
for solid waste disposal has also been documented. The cost for future years has been
projected using the forecasted amount of incoming material. However, future year cost
was calculated using current price figures, even though it is firmly believed that disposal
prices will continue to increase. (Table 5)
31
o o o o oco
oTf 00 CO CO CO
o (D CM N N N*-
a) i^ i-^ r^
CD<s-
co^i-
^-^-
o CO CD O) O) O)co- to- to- to- to-
^^
co1
3
o
^CO CD
E
o o o o o
r-^ CO CO CD COCM
^-
CO CD CD
co '
o CD
oo
a: I
o3
O
CD2
CO CD CD CD CO
<_i
CO CO CO CO CO
"cdt ^ * *
TJ-
oto- to- to-
to to
CO .a
Q
2
D
O
CD
E
CDC TO rn m m
g "^ t
CM ^ ^ ^
o
0)
3
OCM CM
o
^o
UJi i in cd r^ oo o
COCD 0)0)0)0)0)
UJ3L O) Oi O <J> O)
<1-
32
TABLE 5 - SOLID WASTE DISPOSAL COST
YEAR / MONTH CONTAINER PULLS COST per MONTH
93 January 5 $525.00
93 February 4 $420.00
93 March 3 $315.00
93 April 5 $525.00
93 May 7 $735.00
93 June 6 $630.00
93 July 6 $630.00
93 August 6 $630.00
93 September 7 $735.00
93 October 7
5
$735.00
$525.0093 November 1993 Total:
93 December 3
6
$315.00
$630.00
$6,720.00
94 January
94 February 5 $525.00
94 March 6 $630.00
94 April 6 $630.00
94 May 7 $735.00
94 June 6 $630.00
94 July 6 $630.00
94 August 9 $945.00
94 September 6 $630.00
94 October 10
9
$1,050.00
$945.0094 November 1994 Total:
94 December 8
10
$840.00
$1,050.00
$8,820.00
95 January
95 February 7 $735.00
95 March 8 $840.00
95 April 9
8
$945.00
$840.0095 May 1 995 YTD Total:
95 June 8 $840.00 $5,250.00
1995 Projected:
$10,500.00
TOTAL COST $20,790.00
It is believed that material received from the tufting department represents
a minimum of 75% on average of this total cost
33
$ 26.00 2 $ 52.00
$ 11.70 2 $23.40
$ 12.40 3 $ 37.20
$ 1.25 1 $ 1.25
Total Cost p<er Unit $ 113.85
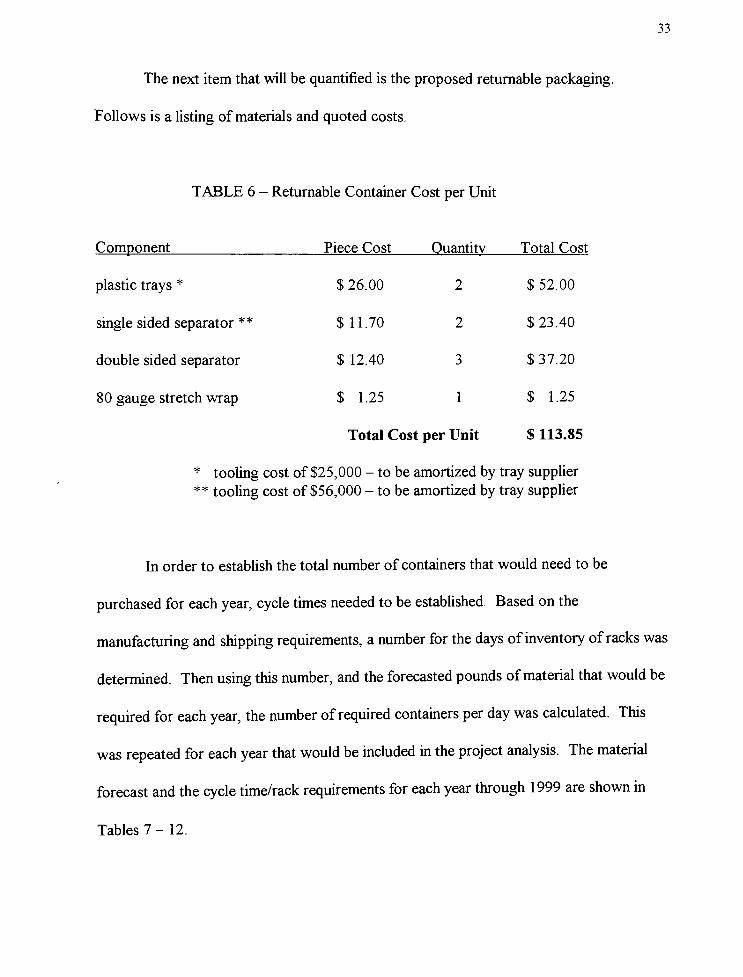
The next item that will be quantified is the proposed returnable packaging.
Follows is a listing ofmaterials and quoted costs.
TABLE 6 - Returnable Container Cost per Unit
Component Piece Cost Quantity Total Cost
plastic trays*
single sided separator**
double sided separator
80 gauge stretch wrap
*
tooling cost of $25,000- to be amortized by tray supplier
**
tooling cost of $56,000- to be amortized by tray supplier
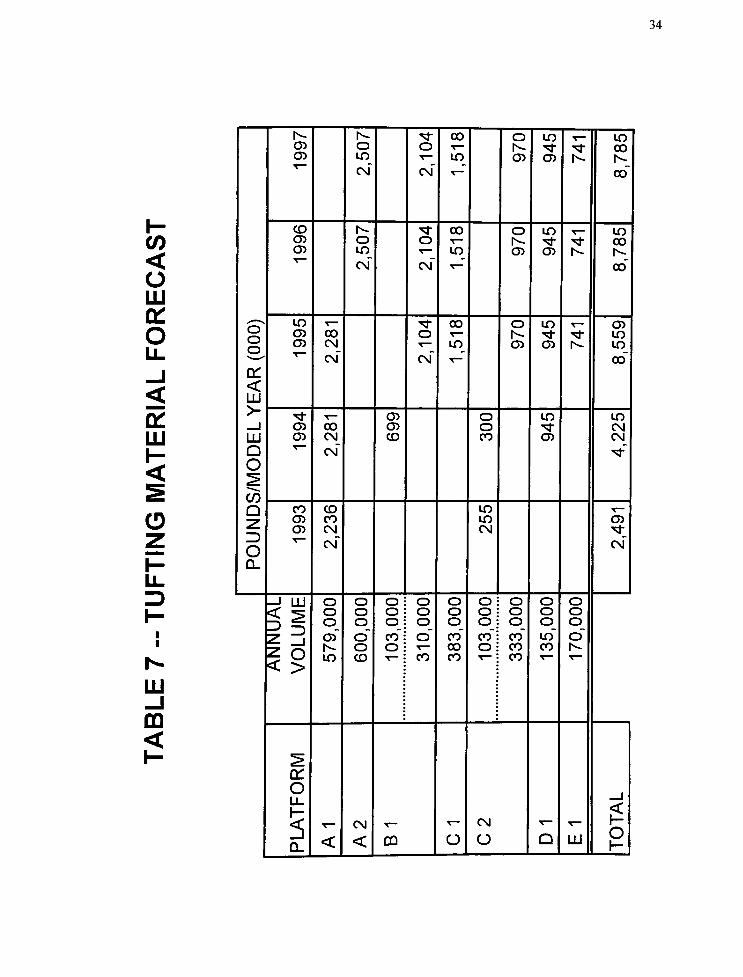
In order to establish the total number of containers that would need to be
purchased for each year, cycle times needed to be established. Based onthe
manufacturing and shipping requirements, anumber for the days of inventory of racks was
determined. Then using this number, and theforecasted pounds ofmaterial that would be
required for each year, the number of required containersper day was calculated. This
was repeated for each year that would be included in the project analysis. The material
forecast and the cycle time/rack requirements for each year through 1999 are shown in
Tables 7 - 12.
34
CO
<oLU
Ou.
-J
<
LUI-
<
O
UJ
CD
<
o
o
rr
<UJ>-
_i
LU
Q
O
^C/5
Q
Oa.
CD
CD
r^
O
10
O
CO
10
Or^.
CD
ID-*-
ID
00
CDCD
CD
r^
0
10
0CO 0
r^
CD
ID5- ID
CO
ID
CD
CD
co
CM
0
CO
10
0
CD
ID
CD r^
CD
ID
ID
CD
CD
00
CM CD
0
0
CO
ID ID
CM
CM
CO
CD
CD
CDCO
CM
in
ID
CM
CD
O
O
O
CD
00
0
0
0
CD
O iO iO :
CO :
O !
0
00
0
CO
00
0
CO
CO
CO
Oi0 iO :
CO :
O :
0
0
0
CO
CO
CO
0
0
0
ID
CO
0
00
0
0
1-
5Q_ <
CM
< CO 0
CM
O Q UJO1-
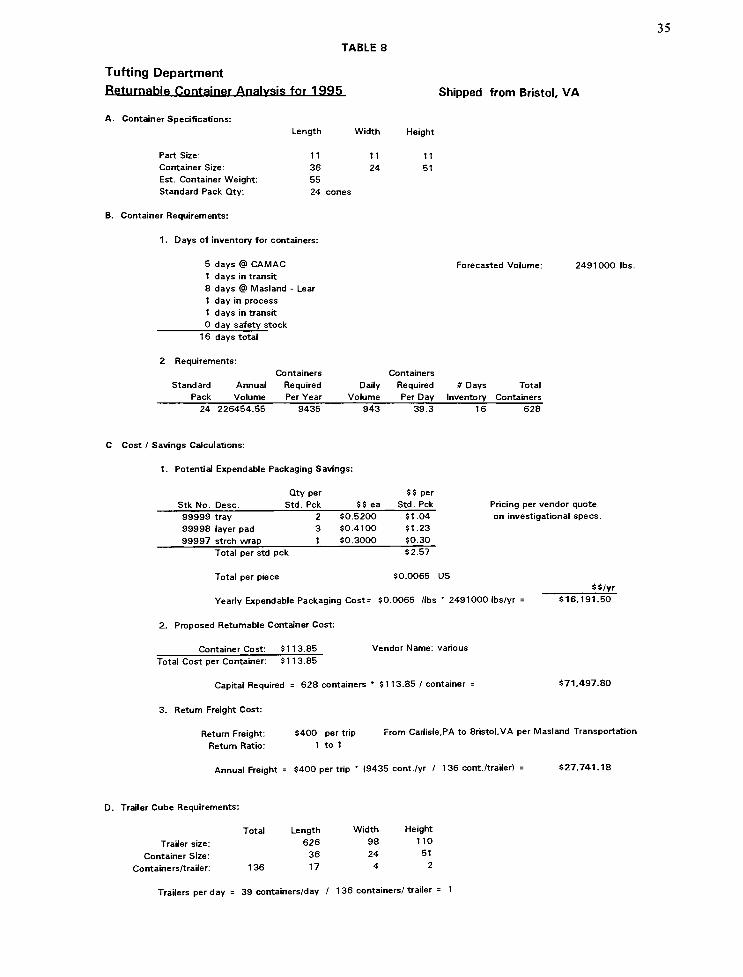
TABLE 8
Tufting Department
Returnahle Container Analysis for 1995
A. Container Specifications:
Length Width
B. Container Requirements:
1. Days of inventory for containers:
5 days @ CAMAC
1 days in transit
8 days @ Masland
1 day in process
1 days in transit
0 day safety stock
Lear
35
Shipped from Bristol, VA
Height
Part Size: 11 11 11
Container Size: 36 24 51
Est. Container Weight: 55
Standard Pack Qty. 24 cones
Forecasted Volume: 2491000 lbs.
16 days total
2. Requirements:
Containers Containers
Standard Annual Required Daily Required # Days Total
Pack Volume Per Year Volume Per Day Inventory Containers
24 226454.55 9435 943 39.3 16 628
C. Cost / Savings Calculations:
1 . Potential Expendable Packaging Savings:
Stk No. Desc.
Qty per
Std. Pck $$ ea
$$ per
Std. Pck
99999 tray
99998 layer pad
99997 strch wrap
50.5200
50.4100
$0.3000
51.04
51.23
50.30
Pricing per vendor quote
on investigational specs.
Total per std pck 52.57
Total per piece $0.0065 US
Yearly Expendable Packaging Cost= 50.0065 /lbs*2491000 Ibs/yr
2. Proposed Returnable Container Cost:
Container Cost: $113.85 Vendor Name: various
55/yr
$16,191.50
Total Cost per Container: 51 1 3.85
Capital Required = 628 containers*
5113.85 / container
3. Return Freight Cost:
571,497.80
5400 per trip
1 to 1
From Carlisle,PA to Bristol,VA per Masland Transportation
Annual Freight = 5400 per trip*
(9435 cont./yr / 136 cont. /trailer) = 527,741.18
Return Freight
Return Ratio
D. Trailer Cube Requirements:
Trailer size:
Container Size:
Containers/trailer:
Total
136
Length Width Height
626 98 110
36 24 51
17 4 2
Trailers per day = 39 containers/day / 1 36 containers/ trailer
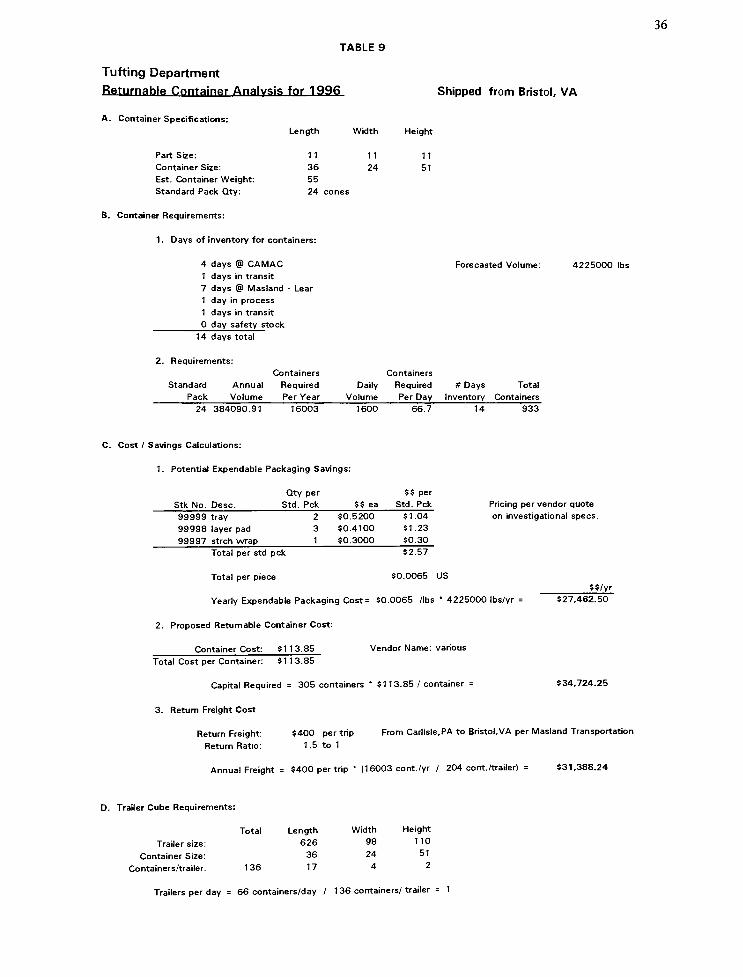
TABLE 9
Tufting Department
Returnahle Container Analysis for 1996
A. Container Specifications:
Length Width
B. Container Requirements:
1. Days of inventory for containers:
4 days @ CAMAC
1 days in transit
7 days @ Masland - Lear
1 day in process
1 days in transit
0 day safety stock
14 days total
2. Requirements:
36
Shipped from Bristol, VA
Height
Part Size: 11 11 11
Container Size: 36 24 51
Est. Container Weight: 55
Standard Pack Qty: 24 cones
Forecasted Volume: 4225000 lbs
Containers Containers
Standard Annual Required Daily Required # Days Total
Pack Volume Per Year Volume Per Day Inventory Containers
24 384090.91 16003 1600 66.7 14 933
C. Cost / Savings Calculations:
1 . Potential Expendable Packaging Savings:
Stk No. Desc.
Qty per
Std. Pck 55 ea
55 per
Std. Pck
99999 tray 2 $0.5200 51.04
99998 layer pad 3 50.4100 51.23
99997 strch wrap 1 50.3000 50.30
Pricing per vendor quote
on investigational specs.
Total per std pck 52.57
Total per piece $0.0065 US
Yearly Expendable Packaging Cost = 50.0065 /lbs*
4225000 Ibs/yr
2. Proposed Returnable Container Cost:
Container Cost: 5113.85 Vendor Name: various
$5/yr
527,462.50
Total Cost per Container: $1 1 3.85
Capital Required = 305 containers*
5113.85 / container
3. Return Freight Cost:
534,724.25
5400 per trip
1 .5 to 1
From Carlisle,PA to Bristol,VA per Masland Transportation
Annual Freight = 5400 per trip (16003 cont./yr / 204 cont./trailerl = 531,388.24
Return Freight
Return Ratio
D. Trailer Cube Requirements:
Trailer size:
Container Size:
Containers/trailer:
Total
136
ngth Width Height
626 98 110
36 24 51
17 4 2
Trailers per day = 66 containers/day / 1 36 containers/ trailer = 1

TABLE 10
Tufting Department
Returnable Container Analysis for 1997
A. Container Specifications:
Length Width
B. Container Requirements:
1. Days of inventory for containers:
3 days @ CAMAC
1 days in transit
6 days @ Masland - Lear
1 day in process
1 days in transit
0 day safety stock
37
Shipped from Bristol, VA
Height
Part Size: 11 11 11
Container Size: 36 24 51
Est. Container Weight: 55
Standard Pack Qty: 24 cones
Forecasted Volume: 8559000 lbs.
1 2 days total
2. Requirements:
Containers Containers
Standard Annual Required Daily Required # Days Total
Pack Volume Per Year Volume Per Day Inventory Containers
24 778090.91 32420 3242 135.1 12 1621
C. Cost / Savings Calculations:
1. Potential Expendable Packaging Savings:
Qty per 5 5 per
Stk No. Desc. Std. Pck 55 ea Std. Pck
99999 tray 2 50.5200 51.04
99998 layer pad 3 50.4100 51.23
99997 strch wrap 1 50.3000 $0.30
Pricing per vendor quote
on investigational specs.
Total per std pck 52.57
Total per piece 50.0065 US
Yearly Expendable Packaging Cost= 50.0065 /lbs*
8559000 Ibs/yr
2. Proposed Returnable Container Cost:
Container Cost: 5113.85 Vendor Name: various
55/yr
$55,633.50
Total Cost per Container: 5113.85
Capital Required = 688 Containers-
5113.85 / Container =
3. Return Freight Cost:
578,328.80
Return Freight
Return Ratio
5400 per trip
3 to 1
From Carlisle,PA to Bristol,VA per Masland Transportation
Annual Freight 5400 per trip*(32420 cont./yr / 408 cont. /trailer) = 531,788.24
D. Trailer Cube Requirements:
Trailer size:
Container Size:
Containers/trailer:
Total
136
Length Width Height
626 98 110
36 24 51
17 4 2
Trailers per day = 1 35 containers/day / 1 36 containers/ trailer 1

TABLE 1 1
Tufting Department
Returnable Container Analysis for 1998
A. Container Specifications:
Length Width
B. Container Requirements:
1. Days of inventory for containers:
3 days @ CAMAC
1 days in transit
6 days @ Masland
1 day in process
1 days in transit
0 day safety stock
Lear
1 2 days total
Requirements:
Containers
Standard Annual Required
Pack Volume Per Year
38
Shipped from Bristol, VA
Height
Part Size: 11 11 11
Container Size: 36 24 51
Est. Container Weight: 55
Standard Pack Qty: 24 cones
Containers
Daily Required
Volume Per Day
Forecasted Volume: 8785000 lbs.
# Days Total
Inventory Containers
24 798636.36 33276 3327 138.6 12 1663
C. Cost / Savings Calculations:
1. Potential Expendable Packaging Savings:
Stk No. Desc.
Qty per
Std. Pck 55 ea
55 per
Std. Pck
99999 tray
99998 layer pad
99997 strch wrap
2
3
1
50.5200
50.4100
50.3000
51.04
51.23
50.30
Pricing per vendor quote
on investigational specs.
Total per std pck 52.57
Total per piece 50.0065 US
Yearly Expendable Packaging Cost= 50.0065 /lbs*8785000 Ibs/yr
2. Proposed Returnable Container Cost:
Container Cost: 5113.85 Vendor Name: various
55/yr
557,102.50
Total Cost per Container: 51 13.85
Capital Required = 42 containers*
5113.85 / container
3. Return Freight Cost:
54,781.70
Return Freight:
Return Ratio:
5400 per trip
3 to 1
From Carlisle,PA to Bristol,VA per Masland Transportation
Annual Freight = 5400 per trip (33276 cont./yr / 408 cont./trailer) = 532,611.76
D. Trailer Cube Requirements:
Trailer size:
Container Size:
Containers/trailer:
Total
136
ngth Width Height
626 98 110
36 24 51
17 4 2
Trailers per day = 138 containers/day / 1 36 containers/ trailer = 2
39
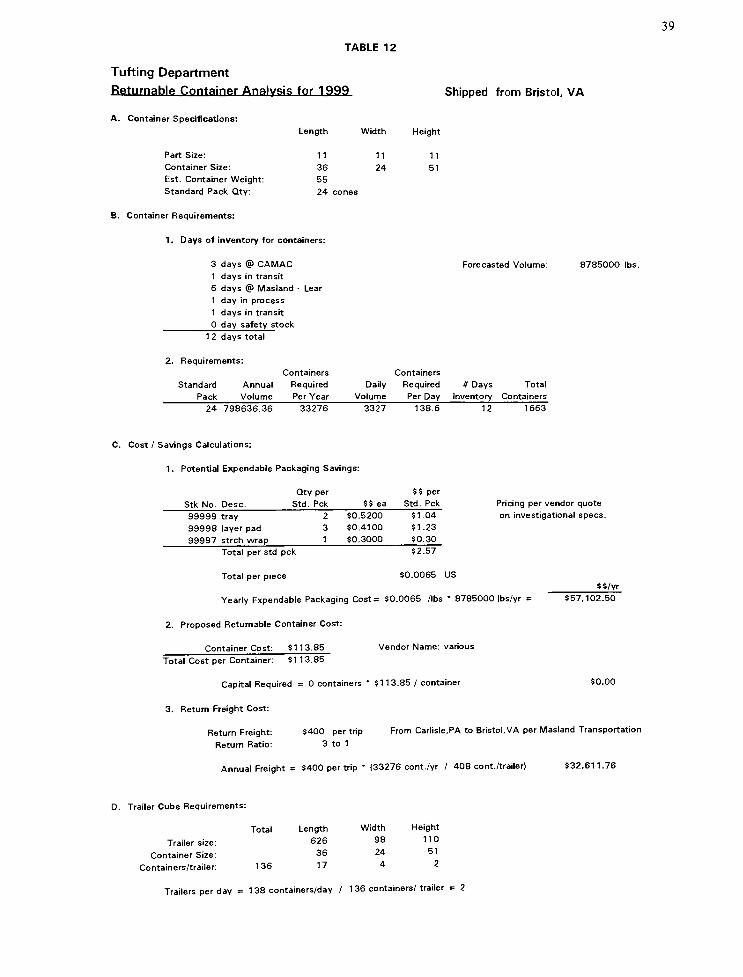
TABLE 12
Tufting Department
Returnable Container Analysis for 1999
A. Container Specifications:
Length Width
B. Container Requirements:
1. Days of inventory for containers:
3 days @ CAMAC
1 days in transit
6 days @ Masland
1 day in process
1 days in transit
0 day safety stock
Lear
1 2 days total
2. Requirements:
Standard
Pack
Shipped from Bristol, VA
Height
Part Size: 11 11 11
Container Size: 36 24 51
Est. Container Weight: 55
Standard Pack Qty: 24 cones
Forecasted Volume: 8785000 lbs,
Containers Containers
Annual Required Daily Required # Days Total
Volume Per Year Volume Per Day Inventory Containers
24 798636.36 33276 3327 138.6 12 1663
C. Cost / Savings Calculations:
1. Potential Expendable Packaging Savings:
Stk No. Desc.
Qty per
Std. Pck 55 ea
55 per
Std. Pck
99999 tray 2 50.5200 51.04
99998 layer pad 3 50.4100 51.23
99997 strch wrap 1 50.3000 50.30
Pricing per vendor quote
on investigational specs.
Total per std pck 52.57
Total per piece 50.0065 US
Yearly Expendable Packaging Cost= 50.0065 /lbs*8785000 Ibs/yr
2. Proposed Returnable Container Cost:
Container Cost: 5113.85 Vendor Name: various
55/yr
557,102.50
Total Cost per Container: 51 13.85
Capital Required = 0 containers*5113.85 / container
3. Return Freight Cost:
50.00
5400 per trip
3 to 1
From Carlisle,PA to Bristol,VA per Masland Transportation
Annual Freight = 5400 per trip (33276 cont./yr / 408 cont./trailer) 532,611.76
Return Freight:
Return Ratio:
D. Trailer Cube Requirements:
Trailer size:
Container Size:
Containers/trailer:
Total
136
Length Width Height
626 98 110
36 24 51
17 4 2
Trailers per day = 1 38 containers/day / 1 36 containers/ trailer = 2
40
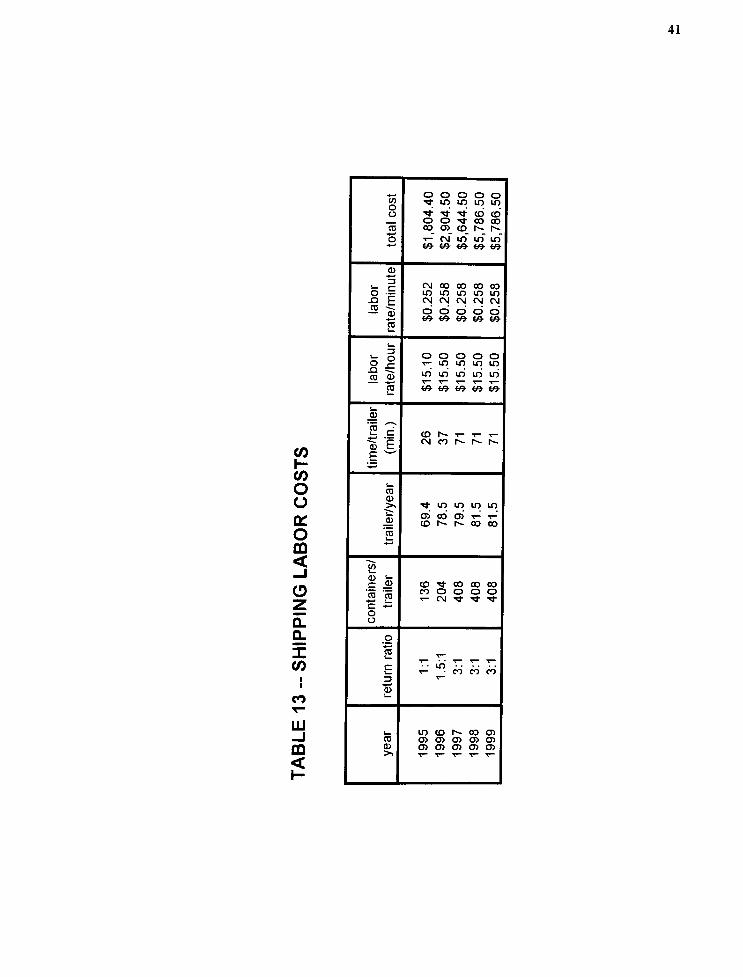
Another item that must be quantified is the direct labor costs associated with the
unitization and loading for return shipment of the returnable containers. It is believed that
the labor involved in moving the containers from the manufacturing area to the off-site
warehouse would be equal to the current labor used in moving the pallets. Therefore it
was not included in the labor calculation. A time study documenting the necessary steps to
load the containers onto a trailer is presented in Appendix A. Labor costs for future years
were calculated using projected hourly wages and forecasted amounts of trailers required
for return shipments. (Table 13)
41
COr-
(fi
oo
VL
OCO
<_J
oz
Q_
Q_
I
CO
CO
UJ-J
CQ
<
* 1 o o o o o
oo
i; in m m m
***() CO_ O O TJ-
OO CO
CD OO (SI (O N N
Ot-
cm m m in
*& /> /* 69-
CD* '
3
iCN OO OO 00 00in m m m m
sCNI C\j CNj CN CN
^ o o o o o
ast& v* t& <& />
!_
sio o o o oi- m m m m
.a i;CO cd
m in m m in-*^
T~~ ^~
TT~*
t
CO *& *& t& v* te-
!_
CD
s 2 cd rr- t- i-
e N CO S N N
.
w
^
u.
CO
CDS* *t m m m m
O) CO O) T~ T-
CO S S CO CO
'COi_"'""'
.
coi_
CD i:C ^ CO * CO CO CO
CO 'coCO o o o ot- CM
*<
*
c *-
oo
o4_,
COL.
T~. u-j T"! T"! T^t- CO CO CO
c1_
3^~
CD^
i_ in co Is- oo o>CO CJ> CD O CT> CXt
CD 0)0)0)0)0)
1
42
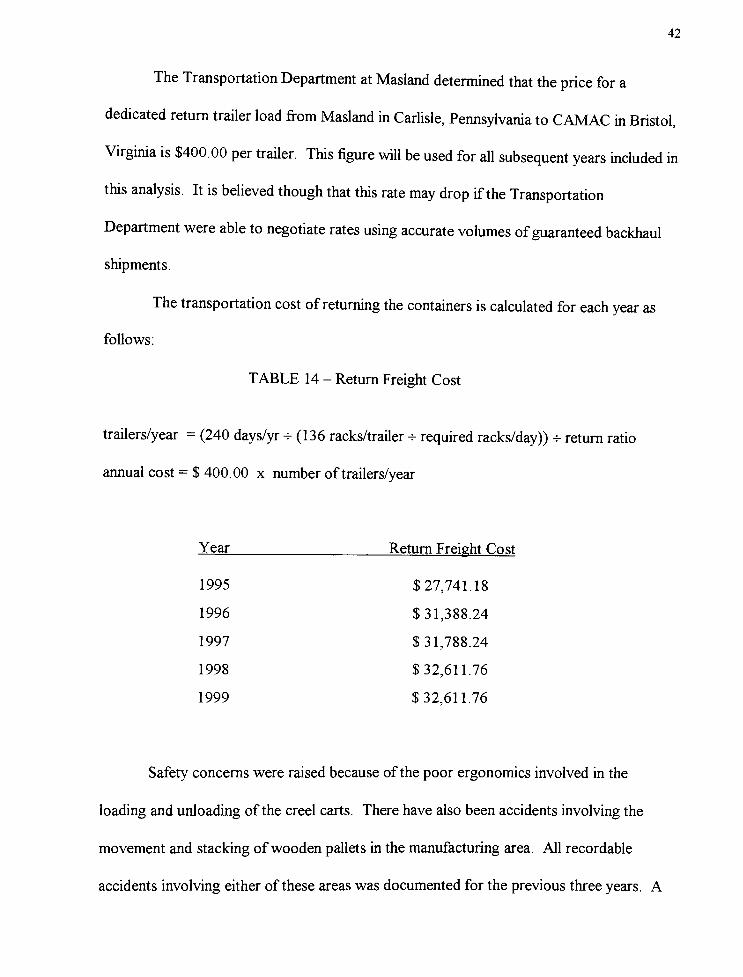
The Transportation Department at Masland determined that the price for a
dedicated return trailer load fromMasland in Carlisle, Pennsylvania to CAMAC in Bristol,
Virginia is $400.00 per trailer. This figure will be used for all subsequent years included in
this analysis. It is believed though that this rate may drop if the Transportation
Department were able to negotiate rates using accurate volumes ofguaranteed backhaul
shipments.
The transportation cost of returning the containers is calculated for each year as
follows:
TABLE 14 - Return Freight Cost
trailers/year = (240 days/yr -h (136 racks/trailer + required racks/day)) * return ratio
annual cost= $ 400.00 x number of trailers/year
Year Return Freight Cost
1995 $27,741.18
1996 $31,388.24
1997 $31,788.24
1998 $32,611.76
1999 $32,611.76
Safety concerns were raised because of the poor ergonomics involved in the
loading and unloading of the creel carts. There have also been accidents involving the
movement and stacking ofwooden pallets in the manufacturing area. All recordable
accidents involving either of these areas was documented for the previous three years. A
43
time study for recordable accidents is on file at Masland for plant tracking purposes. It is
divided into three areas: first aid administered by immediate supervisor, first aid
administered by plant nurse, OSHA recordable incident. This time study is presented in
Appendix A. The costs associated with these accidents are considered intangible and are
not included in the project analysis. However, they are presented in Appendix B for the
sake of documentation.
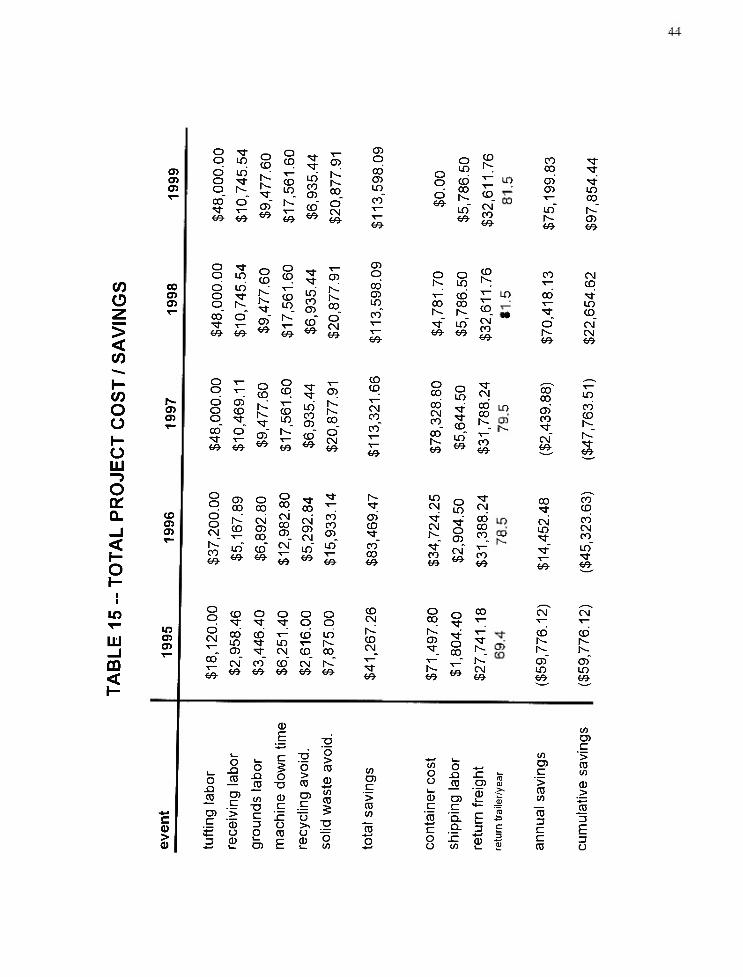
All of the applicable items of cost were then put into the decision matrix. It was
determined that the cost analysis would be completed using a five year period of time.
This length was chosen based on the recommended life span of the returnable containers.
The matrix then calculated both the annualized savings for each year, and the cumulative
savings throughout the period of analysis. These figures are shown in Table 15.
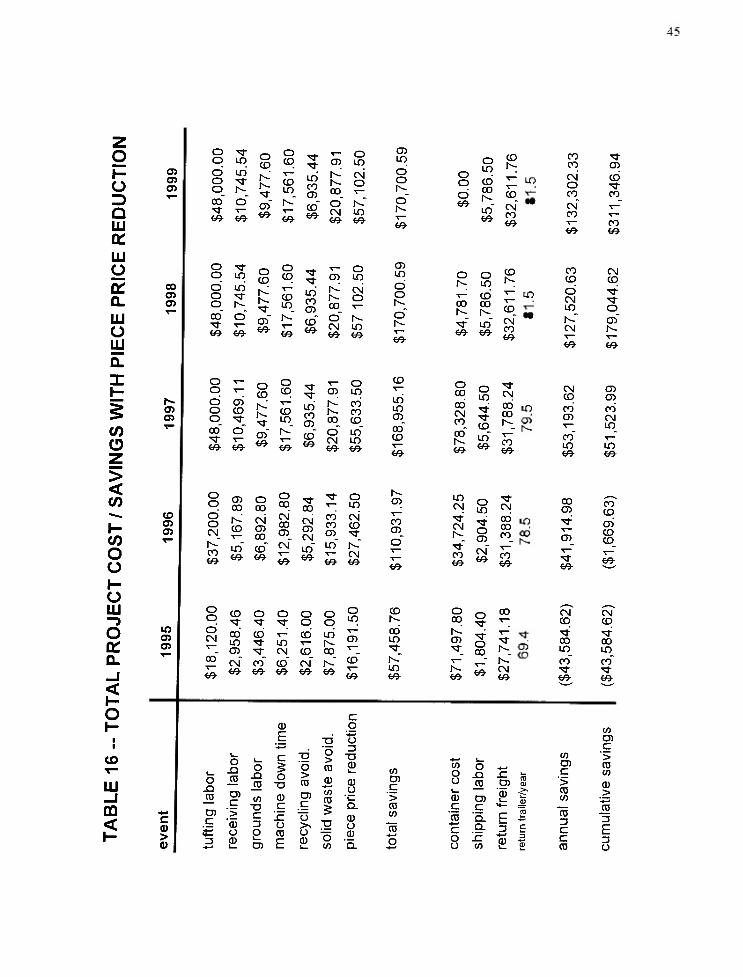
A second matrix was also constructed to include the packaging material savings.
This was merely done to illustrate the potential of the program ifCAMAC were to offer a
piece price reduction on the fiber material. (Table 16)
44
en
en
oo lO
oen
o
CD CD
CD
qdoo
in
CDm
in
CO
m 00
CO
CD
oo
69
o
6969
T
6969
oCN
69
CO
n CD CO
oo
LO 00
CO*""
in CD
ci
69
CON-
CD
ID
69
69
oo
69
CO
CDZ
><CO
CO
en
oo
doo
LO
CO o
69 69
o
CD
CD
69
o
CD
CDin
69
^r
iri
co
CD
69
CD
l<
co
CN
69
CD
O
00CD
in
69
o oh~ in
t-
CDCO CO
69 69
CD
m
CD
CNco
69
CO
co
CO
*-
69
CM
CD
in
CD
CN
69
I-
co
oo
I-
oUJ
en
o
o
doo
CD
oo o-a-
v-
69 69
o
CD
r^
N-
69
o
CO
COin
69
"Cf
iri
co
CD
69
CD
00
CN69
CO
CO
CNCO
69
OCO
CO
CNCO
N-
69
s s
69***69
00
CO
dco
CN
69
m
CO
COr^
"3-
69
o
Q.
_l
<
o
to
en
en
o
o
do
CN
co
69
CD
00
OCO
O00
00
ST
-5f
CD
CNCD
CO
CN00
CT>
CNCD
CN
CO
CO
CD
CD
CD
in COCN
inm co
69 6969
6969
00
69
10o ^
<N S^"
w oo m0X1
o co ~;
co
69***
69
00 CO
CD
CNm^3-
CO
CN
co
^r m
69 69
U)
LU_l
CD
<
en
en
o
o
dCM
69
CD o o o
oOO
00
in
CD
CDm
CN
CO
CD
mr--
00
CM co CO CN N-
w try \JJtjy-
\Jj
CO
CN
co
CM
69
oo
00 CN CNCO
*t
^~~ ^~ T
r^
o00
T,^- d CD
CD ^r r-. h-
*_N- CJ>
CON- r~~
T rN-
69CN m m
69 69 69 69
cCu
>a>
E d
CO
c
o
O
X! o
X)
jCO
w
-a
c
o
CO
C
O>
CO
o>
CO
cu
id
co
T3
CO
c
>
CO
CO
OO
CD
C
w.
o
XI
c
JZ
CD
CD
CO
CO
c
>
COCO
>
COCO
CD
>
CD
c
>
cu
o
c
Oo
CD
CO
ro4-^
CO-
c Q.
C
Z5
2
c3
C
3
E3 CDi E CD O
toO o
o CO~0) "a)
C
CO3
O
45
o
QUJ
UJ
O
OHCL
UJ
oUJ
Q_
z
CO
o
en
en
en
oo
doo
sr
m
in
f--
co
en
en
en
en
oo o
69 69
oo
-3-
m
o mo vr
o h-
"CfT-
69 69
oo
do
o
CD
CD
O
CD
h~
69
O
CD
CDm
r
69
00
69 69
o
CD
h-
69
o
CD
COm
69
iri
co
CD
69
o
COCD
CDm
mCO
CD
CDr~-
69t-t^
69
*-
<r
iri
co
CD
69
T-
Ocd m
oo
CM
CN
o
69 69
t-
Ocn in
CN
o
N-
N-
00
I--
cn m69 69
Oin
co
co
co_
cm in
69 69
CD
oo
m
do
69
CD
in
doIs-
r-.
69
CD
ih
mCD
CO
69
oin
c;
o CD
dCO
69UJ
69
69 69
CDIs-
m
CO
CN
co
69
CO
o o CDIs-
h- in
T
(0^~
en mCDN- Is-
Tf mCN
in
co
69
o "*CO g CM
CO ^ CO id^ ? co ~<
00 T_
^ i2 co
69w
69
CO
CO CD
CN
OCO
CO"3"
CO
CN
CO
69
CO
69
CO
COCN
CD
O
CNin o
Is-
CN
CDIs-
69 69
CN
CD
CD
CD
CO
CDCO
CNm
CO
m
69
m
69
>
<CO
CO
ooI-
oUJ
oa:
_i
<i-
o
CO
UJ_J
m
<
CO
en
en
m
en
en
o
o
do
CN
co
69
oo
dCM
69
CD
CO
O
00
Is- CNCD CDT-
CO
69 69
CD
cb
in
CD
o
dq-
o
oo
CN
COCD
CN
69
o"3-
oo
CMCD
CN
69
oo
in
CN CD
o
m
CO CNCO CDCD
CM69 69
OO
d in
CN CO CO
CO
CN+JJ *r? v7 w VJ
om
CD
CD
69
Is-
CD
CO
CD
69
CDIs-
00
m
m
69
o
XI
m
cn
c
it:3
5 it U
o | 3
o
X!
ro
co
c
'>
CDU
CD
OXI
JO
co
T3
C
3
O
CD
E
c
o
0
C
x:
o
CO
E
go>
CO
CJ)
o
>^
o
CD
O>
CO
toco
CO
c
o
o
3
T3
!_
CDo
CDO
CD
Q. X
to
co
c
>
COto
ro
o
CN g
o00
1^
Is-
69
CN
00
- CDCO^
69CO
69*^
69
O
ooo
69
to
oo
oi
c
CO
c
oo
o
X!
JO
CO
c
Q.
x:to
00
r^ o>
CN69
CD
E ^3
I
00 cocn CO
^r CD\
COCD
CDT
r-
^r 6969
CN CN
CO CD
* sr00 00
in in
sr ^r
w 69
CO
CO
c
to >D) COc CO
> CDCO >to
roCO
3 3
C EC 3CO O
46
One of the more traditional methods for making capital budget decisions is the
"paybackperiod"
This is the amount of time necessary to break even on the initial capital
investment. In order to calculate this, the figure for container investment must be totaled
as though all containers were purchased at the beginning of the analysis time frame. Then
using the annual savings, a break even time is calculated. The total container investment
for the five year period is $189,332.55. When this is put into the equation, the payback
period for the project is 3.70 years. If the piece price reduction is included the payback
period is 2.64 years.
It was believed that this type of financial analysis did not accurately reflect the
viability of implementing the system. That is because calculating a payback period
assumes that the entire capital outlay is made at the beginning of the project. In this case
that assumption would not be appropriate, because the capital investment would be spread
out over several years.
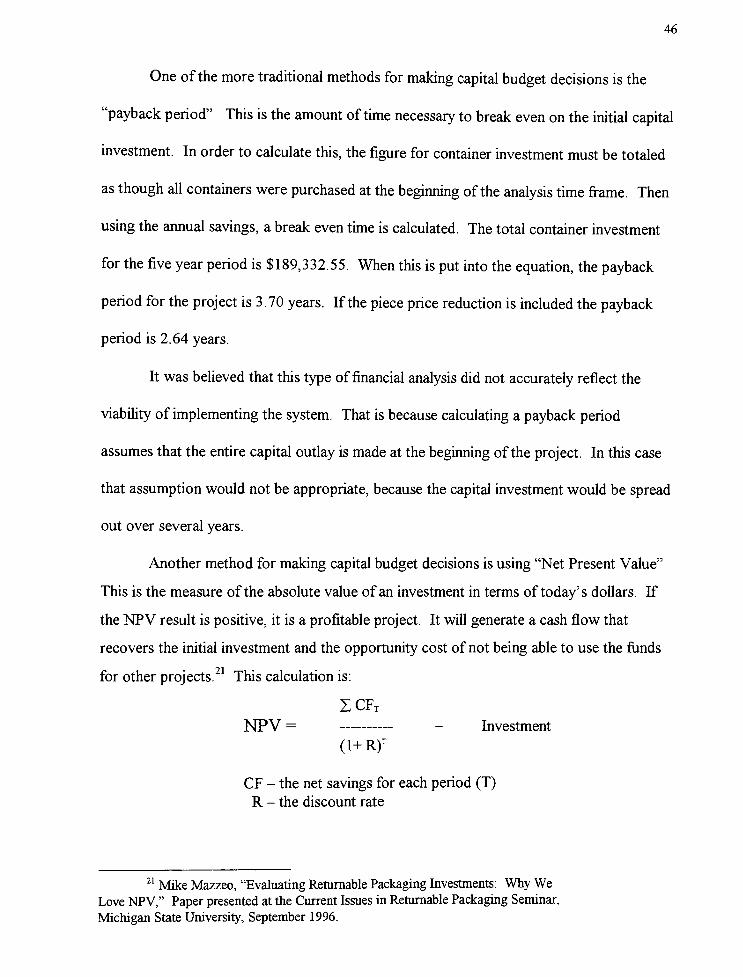
Another method for making capital budget decisions is using "Net PresentValue"
This is the measure of the absolute value of an investment in terms of today's dollars. If
the NPV result is positive, it is a profitable project. It will generate a cash flow that
recovers the initial investment and the opportunity cost of not being able to use the funds
for otherprojects.21
This calculation is:
ZCFT
NPV = - Investment
(i+R)T
CF - the net savings for each period (T)R - the discount rate
21MikeMazzeo, "Evaluating Returnable Packaging Investments: Why We
LoveNPV,"
Paper presented at the Current Issues in Returnable Packaging Seminar,
Michigan State University, September 1996.
47
Using a discount rate of 10 percent, a time period of 1 through 5 years, and an investment
of $189,332.55, the NPV for this project is $17,037.59. When the piece price reduction is
included, theNPV is $170,709.62.
While using NPV is a more comprehensive method of financial analysis than the
traditional payback period, it was believed that it also did not accurately reflect the
feasibility of implementing the system. That is because calculating Net Present Value also
assumes that the entire capital outlay is made at the beginning of the project. In this case
that assumption would not be appropriate, because the capital investment would be spread
out over several years. Since the capital is spread out, the discount rate for funds would
change throughout the life cycle of the project. This change cannot be accounted for in
the calculation.
CHAPTER 5 - DISCUSSION AND CONCLUSION
CONCLUSION
Several methods of analysis were shown. Regardless of the method used,
implementation of a returnable container system for the fiber product appears to be a
financially viable decision.
One of the key contributors to the potential success of this system is the fact that a
closed loop distribution system exists between CAMAC and Masland. This allows for a
more economical return of the containers due to the utilization of the inbound trailers for
the return shipment. It also minimizes the need for any tracking system for the containers.
This function will become inherent to the system through the use of shipping records and
Bills ofLading. This allows for the avoidance of any additional cost to meet this
requirement.
Another contributor to the systems potential success is the relatively short distance
between the supplier and manufacturer. This allows for a predictable cycle time between
shipments. A predictable cycle time is critical in establishing the number of containers
needed to support the distribution channel and manufacturing requirements. In turn,
accurately predicting the number of containers needed is essential to determining the
amount of capital required to implement the system. The capital requirement is often the
critical factor in determining if a returnable system is feasible. Also, any reductions in the
cycle time during the life of the project would directly benefit the speed of recovering the
capital investment.
48
49
This container system would also greatly reduce the direct labor required to load
the creel. Since the unit load is narrow enough to fit between the creel rows it would no
longer be necessary to reload the cones into a cart. A movable base unit would be
constructed to allow rolling movement of the unit load. The cones could then be loaded
directly from the unit load onto the creel. This would improve the ergonomics involved in
the assistant machine operator's job. In turn, it is believed that this would reduce the
number of recordable accidents, and their associated cost. It would also improve operator
morale and offer the potential for higher productivity.
The proposed returnable container system would also help eliminate any product
damage due to poor packaging. The sturdier nature of the container will help protect the
product better through the distribution environment. Also, the design of the separators
used between the layers of cones should eliminate any problems due to core damage of the
cones. This will also help to eliminate down time on the machine and the associated labor
cost due to poor product quality.
Usage of the returnable system would allow for the source reduction of 6.2 pounds
of corrugated per unit load. This eliminates the tipping fees and disposal costs incurred to
recycle the material. It also helps to lessen the environmental impact ofmaterials disposed
of fromMasland. This allowsMasland to rightfully promote itself to both customers and
community as an environmentally conscientiouscorporation. Further, reduction of
packaging waste saves in labor costs to collect and dispose of the material. It also creates
a neater production area and improved housekeeping.
50
RECOMMENDATIONS FOR FUTURE STUDY
Returnable containers have been in use for forty years, however information about
their use has mostly been published within the last ten years. Industry magazine articles,
which account for much of this published information, are merely examples of returnable
containers in use at various companies, or information regarding the containers
themselves. Almost none of the literature outlines the parameters involved or the analysis
needed to determine if implementation of returnable containers is appropriate. This thesis
has attempted to document all parameters involved, determine which parameters are
applicable to this specific project, and outline the financial analysis needed to make a
capital budget decision.
Amajority of the users of returnable container systems are in the automotive
industry. These containers have made an impact within the industry as a means for both
improving product quality and controlling costs. There are many reasons for the
predominance ofuse within this industry. One is the continued upper management
support for returnable containers. Management has recognized the potential benefits of
reduced material costs, ergonomic improvements, and source reduction savings. Also, the
high production volumes within the industry lend themselves to establishing quicker pay
back of capital investments. This makes implementation of returnable systems much more
cost effective. In addition, many automotive suppliershave positioned themselves in
geographically favorable areas relative totheir customers. This increases the chances that
a closed-loop distribution systemcan be put in place. It also allows for minimum cycle
times to be established. These are both critical factors in the success of a returnable
system.
51
It is believed that usage of returnable/reusable containers will continue to increase.
As the long term benefits are documented, their usage will continue to spread into other
industries. Additional studies should be conducted to determine if other cost parameters
are involved and can be cross-referenced by industry. Also, any research which could
document financially viable methods to implement returnable systems in a non-closed-loop
distribution environment would be critical to their continued expansion and usage. Finally,
work should be completed to develop a computer program which could handle all
potential combinations of cost parameters. The program should then correspondingly
utilize the most appropriate method of capital budgeting analysis. This would prove to be
an invaluable asset to the field of returnable/reusable packaging.

52
APPENDIX A
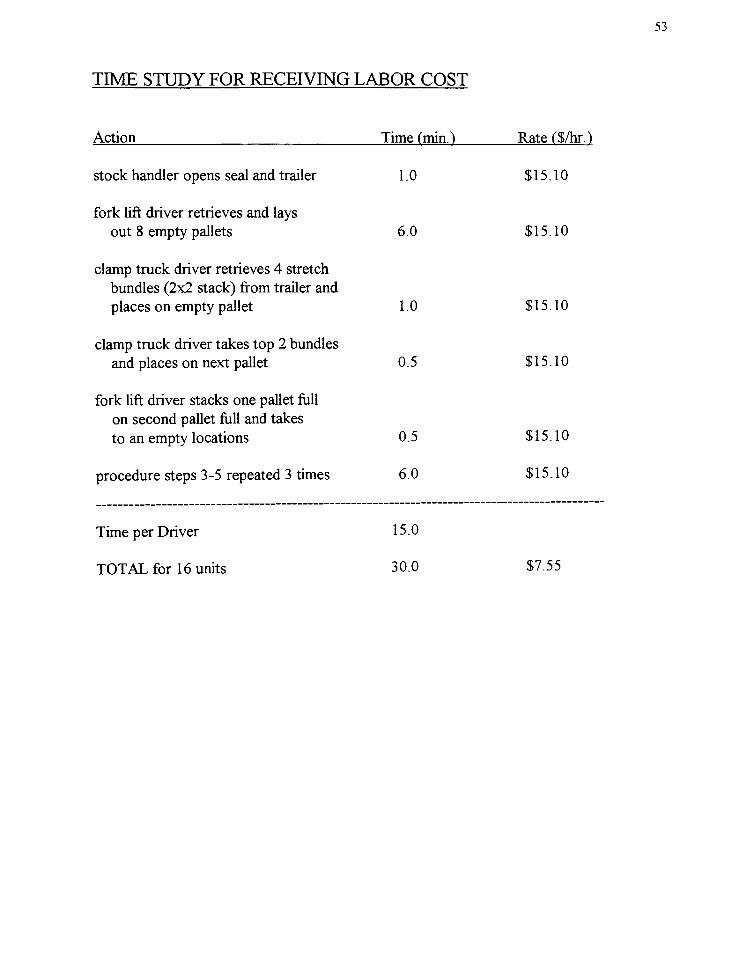
53
TIME STUDY FOR RECEIVING LABOR COST
Action Time (mm.) Rate($/hr.)
stock handler opens seal and trailer 1.0 $15.10
fork lift driver retrieves and lays
out 8 empty pallets 6.0 $15.10
clamp truck driver retrieves 4 stretch
bundles (2x2 stack) from trailer and
places on empty pallet 1.0 $15.10
clamp truck driver takes top 2 bundles
and places on next pallet 0.5 $15.10
fork lift driver stacks one pallet full
on second pallet full and takes
to an empty locations 0.5 $15.10
procedure steps 3-5 repeated 3 times 6.0 $15.10
Time per Driver 15.0
TOTAL for 16 units 30.0 $7.55
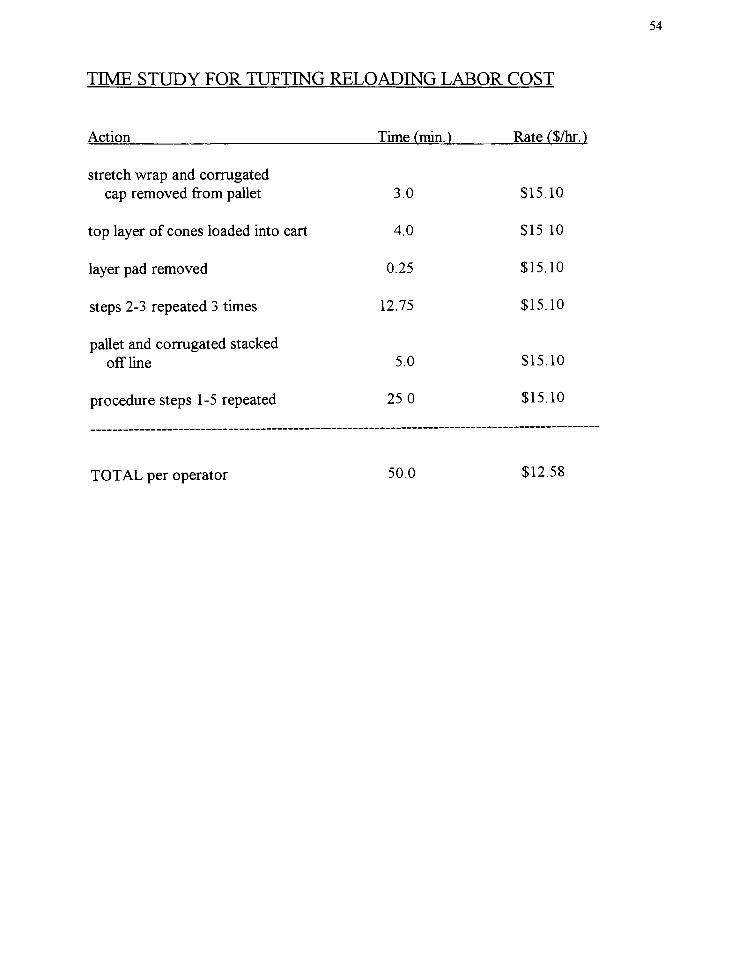
54
TIME STUDY FOR TUFTING RELOADING LABOR COST
Action Time (min.) Rate($/hrJ
stretch wrap and corrugated
cap removed from pallet 3.0 $15.10
top layer of cones loaded into cart 4.0 $15.10
layer pad removed 0.25 $15.10
steps 2-3 repeated 3 times 12.75 $15.10
pallet and corrugated stacked
offline 5.0 $15.10
procedure steps 1-5 repeated 25.0 $15.10
TOTAL per operator 50.0 $12.58
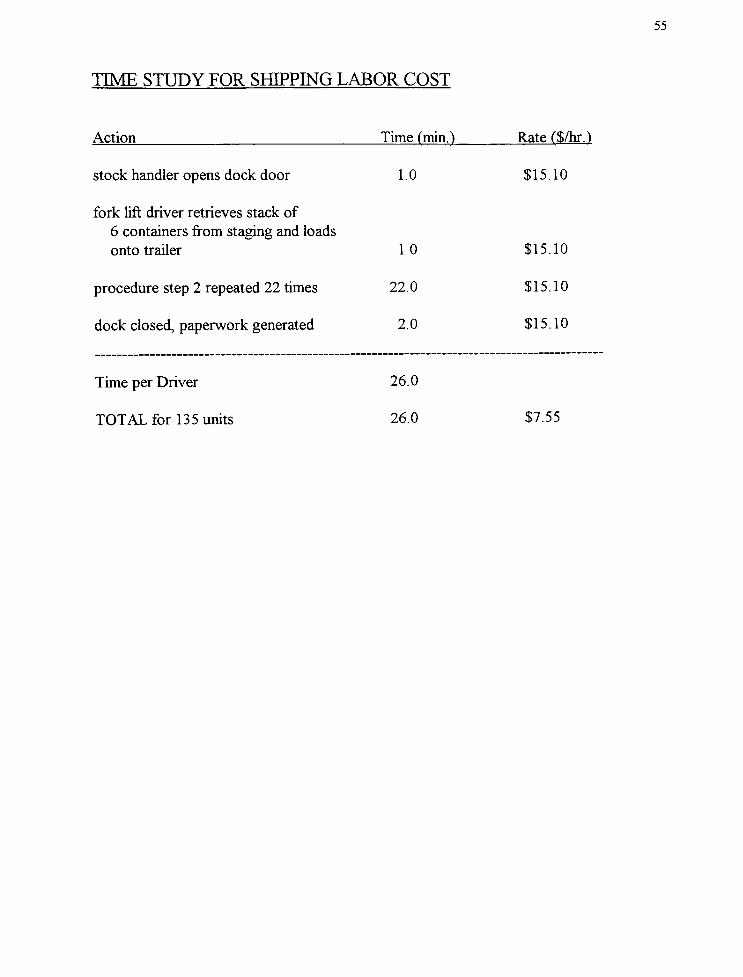
55
TIME STUDY FOR SHIPPING LABOR COST
Action Time (min.) Rate ($/hr.)
stock handler opens dock door 1.0 $15.10
fork lift driver retrieves stack of
6 containers from staging and loads
onto trailer 1.0 $15.10
procedure step 2 repeated 22 times 22.0 $15.10
dock closed, paperwork generated 2.0 $15.10
Time per Driver 26.0
TOTAL for 135 units 26.0 $7.55
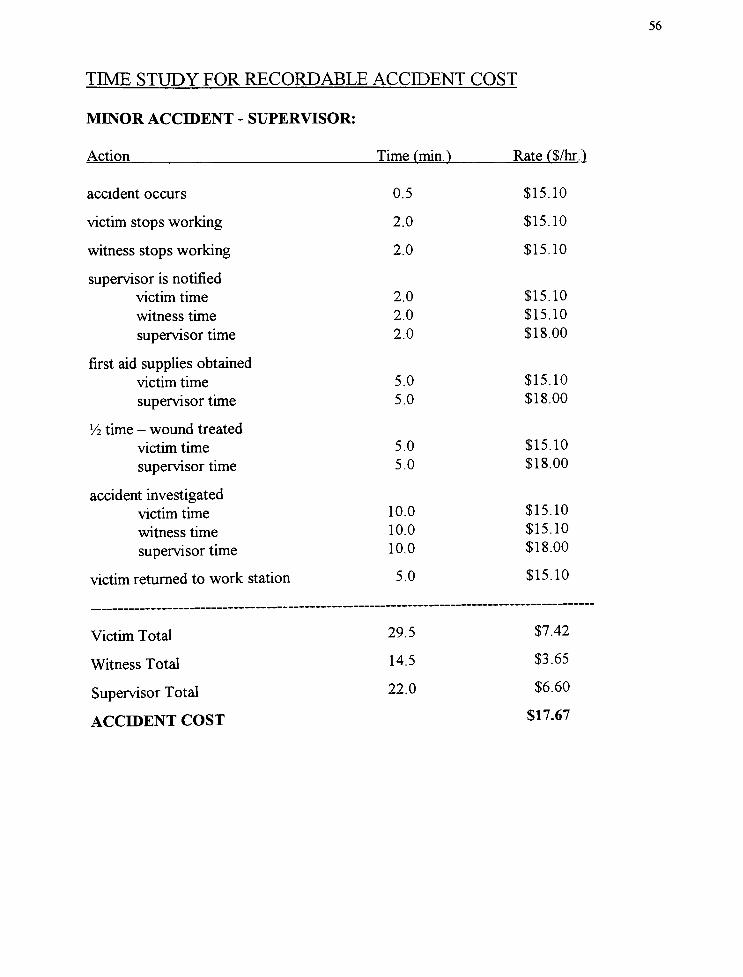
56
TIME STUDY FOR RECORDABLE ACCIDENT COST
MINORACCIDENT - SUPERVISOR:
Action Time (min.) Rate ($/hr.)
accident occurs 0.5 $15.10
victim stops working 2.0 $15.10
witness stops working 2.0 $15.10
supervisor is notified
victim time 2.0 $15.10
witness time 2.0 $15.10
supervisor time 2.0 $18.00
first aid supplies obtained
victim time 5.0 $15.10
supervisor time 5.0 $18.00
V2 time -
wound treated
victim time 5.0 $15.10
supervisor time 5.0 $18.00
accident investigated
victim time 10.0 $15.10
witness time 10.0 $15.10
supervisor time 10.0 $18.00
victim returned to work station 5.0 $15.10
Victim Total 29.5 $7.42
Witness Total 14.5 $3.65
Supervisor Total 22.0 $6.60
ACCD3ENT COST$17.67
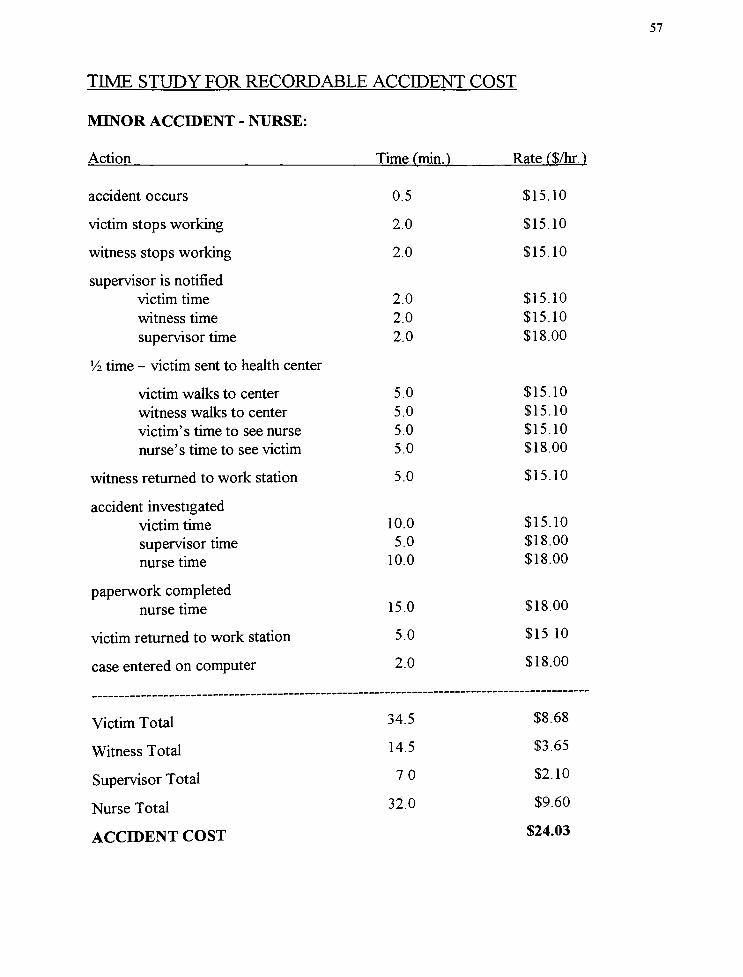
57
TIME STUDY FOR RECORDABLE ACCIDENT COST
MINOR ACCD3ENT - NURSE:
Action Time fmin. ) Rate C$/hr.)
accident occurs 0.5 $15.10
victim stops working 2.0 $15.10
witness stops working 2.0 $15.10
supervisor is notified
victim time
witness time
supervisor time
2.0
2.0
2.0
$15.10
$15.10
$18.00
V% time - victim sent to health center
victim walks to center
witness walks to center
victim's time to see nurse
nurse's time to see victim
5.0
5.0
5.0
5.0
$15.10
$15.10
$15.10
$18.00
witness returned to work station 5.0 $15.10
accident investigated
victim time 10.0 $15.10
5.0 $18.00
10.0 $18.00
supervisor time
nurse time
paperwork completed
nurse time 150 $18.00
victim returned to work station 5.0 $15.10
case entered on computer2.0 $18.00
Victim Total 34.5 $8.68
Witness Total 14-5 $3-65
Supervisor Total
Nurse Total
ACCIDENT COST$2403
7.0 $2.10
32.0 $9.60
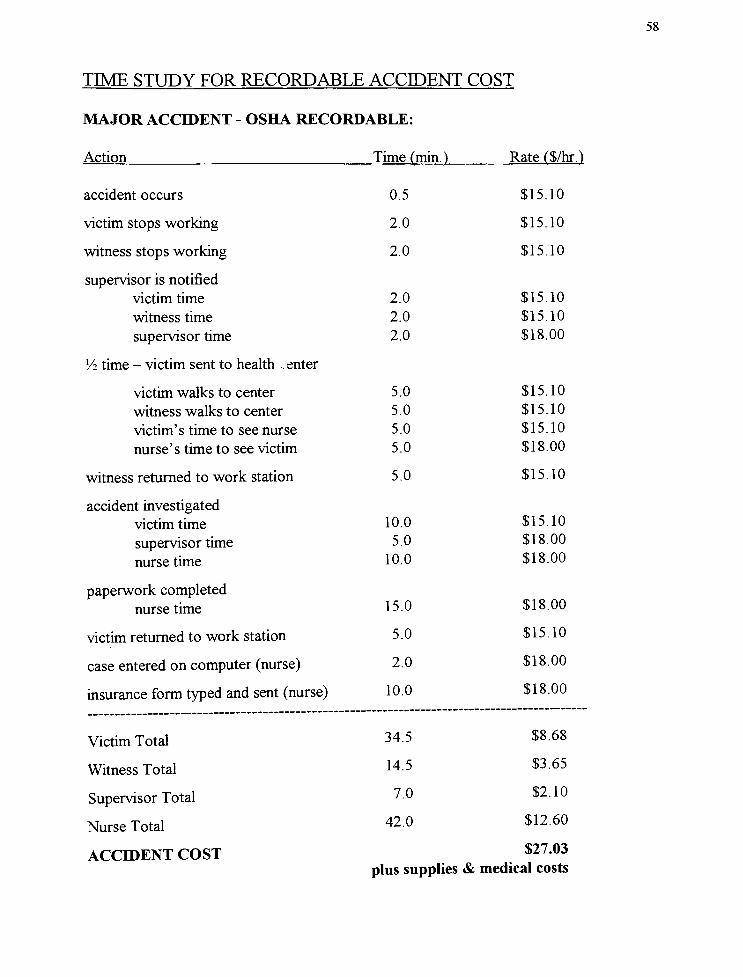
58
TIME STUDY FOR RECORDABLE ACCIDENT COST
MAJOR ACCD3ENT - OSHA RECORDABLE:
Action Time frnin.) Rate ($/hr/)
accident occurs 0.5 $15.10
victim stops working 2.0 $15.10
witness stops working 2.0 $15.10
supervisor is notified
victim time 2.0 $15.10
witness time 2.0 $15.10
supervisor time 2.0 $18.00
Vi time - victim sent to health .enter
victim walks to center 5.0 $15.10
witness walks to center 5.0 $15.10
victim's time to see nurse 5.0 $15.10
nurse's time to see victim 5.0 $18.00
witness returned to work station
accident investigated
victim time
supervisor time
nurse time
paperwork completed
nurse time
victim returned to work station
case entered on computer (nurse)
insurance form typed and sent (nurse)
5.0
10.0
5.0
10.0
15.0
5.0
2.0
10.0
$15.10
$15.10
$18.00
$18.00
$18.00
$15.10
$18.00
$18.00
Victim Total
Witness Total
Supervisor Total
Nurse Total
ACCIDENT COST
34.5 $8.68
14.5 $3.65
7.0 $2.10
42.0 $12.60
$27.03
plus supplies & medical costs

59
APPENDIX B
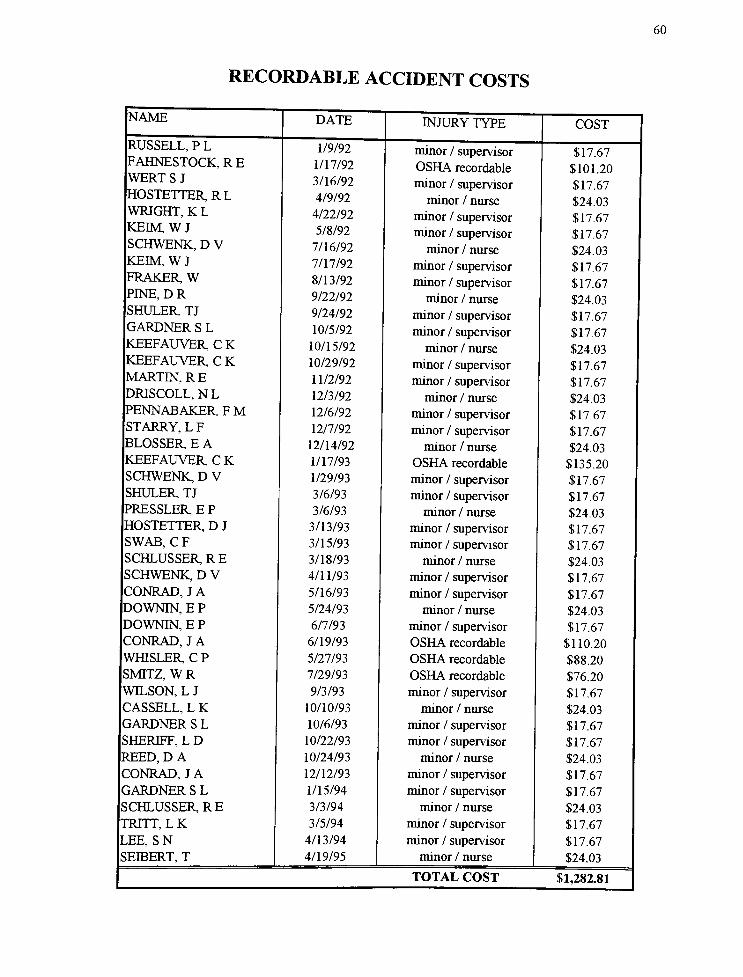
RECORDABLE ACCIDENT COSTS
60
NAME DATE INJURY TYPE COST
RUSSELL, P L 1/9/92 minor / supervisor $17.67FAHNESTOCK,RE 1/17/92 OSHA recordable $101.20WERT S J 3/16/92 minor / supervisor $17.67
HOSTETTER R L 4/9/92 minor / nurse $24.03
WRIGHT, K L 4/22/92 minor / supervisor $17.67
KEIM WJ 5/8/92 minor / supervisor $17.67
SCHWENK, D V 7/16/92 minor / nurse $24.03
KEIM, W J 7/17/92 minor / supervisor $17.67 !FRAKER W 8/13/92 minor / supervisor $17.67PINE,DR 9/22/92 minor / nurse $24.03
SHULER TJ 9/24/92 minor / supervisor $17.67
GARDNER S L 10/5/92 minor / supervisor $17.67
KEEFAUVER C K 10/15/92 minor / nurse $24.03
KEEFAUVER C K 10/29/92 minor / supervisor $17.67
MARTIN, R E 11/2/92 minor / supervisor $17.67
DRISCOLL, NL 12/3/92 minor / nurse $24.03
PENNABAKER F M 12/6/92 minor / supervisor $17.67
STARRY, L F 12/7/92 minor / supervisor $17.67
BLOSSER, E A 12/14/92 minor / nurse $24.03
KEEFAUVER C K 1/17/93 OSHA recordable $135.20
SCHWENK, D V 1/29/93 minor / supervisor $17.67
SHULER TJ 3/6/93 minor / supervisor $17.67
PRESSLER E P 3/6/93 minor / nurse $24.03
HOSTETTER D J 3/13/93 minor / supervisor $17.67
SWAB, C F 3/15/93 minor / supervisor $17.67
SCHLUSSERRE 3/18/93 minor / nurse $24.03
SCHWENK, D V 4/11/93 minor / supervisor $17.67
CONRAD, J A 5/16/93 minor / supervisor $17.67
DOWNIN, E P 5/24/93 minor / nurse $24.03
DOWNTN, E P 6/7/93 minor / supervisor $17.67
CONRAD, J A 6/19/93 OSHA recordable $110.20
WHISLER C P 5/27/93 OSHA recordable $88.20
SMITZ, WR 7/29/93 OSHA recordable $76.20
WILSON, L J 9/3/93 minor / supervisor $17.67
CASSELL, L K 10/10/93 minor / nurse $24.03
GARDNER S L 10/6/93 minor / supervisor $17.67
SHERIFF, L D 10/22/93 minor / supervisor $17.67
REED, D A 10/24/93 minor / nurse $24.03
CONRAD, J A 12/12/93 minor / supervisor $17.67
GARDNER S L 1/15/94 minor / supervisor $17.67
SCHLUSSERRE 3/3/94 minor / nurse $24.03
TRITT,LK 3/5/94 minor / supervisor $17.67
LEE, S N 4/13/94 minor / supervisor $17.67
SEIBERT, T 4/19/95 minor / nurse $24.03
TOTAL COST $1,282.81
61
REFERENCES CONSULTED
Andel, Tom. "New Ways to Take Out theTrash."
Transportation and Distribution
May 1993, p. 25.
Auguston, Karen. "Returnable Containers: Why You Need ThemNow."
ModernMaterials Handling Nov. 1993, p.40-42.
Bakker, Marilyn. The Wilev Encyclopedia ofPackaging Technology.
New York: JohnWiley and Sons, 1986. "Economics ofPackaging,"
by Edmund A. Leonard.
Bischoff, Ernst. "Recycling versus Re-use inPackaging."
Paper Presented at the
EuroboxMarketingMeeting, Zurich 1993.
Bischoff, Ernst. "The Need for aRethink."
BBH, March 1993, p. 68-74.
Bojkow, E. "Basic Considerations on the Calculation of the TrippageNumber of
ReturnableContainers."
Journal ofPackaging Technology and Science. Vol. 4,No. 6, Nov. 1991.
Butlin, John, and Karl Lidgren, eds. Container Costs. Cambridge, England:VanNostrand Reinhold Co. Ltd., 1983.
"Chrysler Does ItAgain."
ModernMaterials Handling. Jan. 1993, p. 44-46.
"Container System SavesMillions InTransport."
Transportation and Distribution.
Sept. 1992, p. 101.
FordManufacturing and Material Handling Engineering Standards Department. Ford
Packaging Guidelines for Production Parts. Feb. 1991.
Koenck, David N. "Many HappyReturns."
Actionline. Sept. 1993, p.25.
Leonard, Edmund A. How to Improve Packaging Costs.
New York: AMACOM, 1981.
Leonard, Edmund A. Managing the Packaging Side ofBusiness
New York: AMACOM, 1977.
Leonard, Edmund A. Packaging: Specification. Purchasing, and Quality Control.
New York: M. Dekker, 1987
62
Luton, David. "Are Returnables for YourFirm?"
ModernMaterials Handling.
Jan. 1998.
Mazzeo, Mike. "Evaluating Returnable Packaging Investments: WhyWe Love NPV"
Paper presented at the Current Issues in Returnable Packaging Seminar,Michigan State University, September 1996.
"Packaging andWasteManagement."
Actionline. Dec. 1993.
Palmer, Caris J. "Managerial Methods ofControlling Product Quality in Distribution:
DamageMeasurement, Analysis, andCorrection."
Thesis. Michigan State
University 1991.
Perry, Allen. "Replacing a Disposable Shipping Container With a Reusable
Packaging System for a Supplier ElectronicAssembly."
Thesis
Rochester Institute ofTechnology 1994.
Plezia, Mark. "An Energy Comparison Between Polycarbonate and Glass
Half-Gallon Milk Bottles Used in a Returnable RefillableSystem."
Thesis.
Rochester Institute ofTechnology 1991.
"Returnable Shipper Offers BigBenefits."
Packaging. Nov. 1993, p. 29
"Reusable Containers Keep Assembly LineMoving AtSaturn."
Material Handling
Engineering. Dec. 1993, p. 72.
Richardson, Helen. "Cutting Packaging Also CutsCosts."
Transportation and
Distribution. Oct. 1989, p. 26.
Scott, Everett. Sr. Packaging Engineer at Delco Electronics.
Interviewed by author, October 1993, Carlisle. Telephone
Selke, Susan E.M. Packaging and the Environment: Alternatives. Trends and Solutions
Lancaster, PA: Technomic Publishing Company, 1990
"Transport Packaging Increases Capacity, Product QualityWithin General
Motors."
Material Handling Engineering. Feb. 1995, p. 65-66.
Twede, Diana. "The Process ofDistribution Packaging Innovation and Its
Relationship to DistributionChannel
Structure."
Dissertation.
Michigan State University 1988.
United States Environmental ProtectionAgency. Resource Recovery andWaste
Reduction. Washington, D.C., 1974.
63
Uxa, Wendee V. "Returnable/Reusable Containers in the Automotive Industryand the Related Capital Budgeting Investment
Decision."
Thesis.
Michigan State University 1994.
Waller, Kent. "Selection of a Returnable ContainerSystem."
IoPP Technical Journal.
Vol. XI, No. 2, Fall 1993, p. 35-38.
Witt, Clyde E. "Plastic ContainersWon't Save YouMoney."
Material Handling Engineering. Oct. 1994, p. 20.
Witt, Clyde E. "Behind the Scenes atNAMHS."
Material Handling Engineering.
June 1994, p. 22.
Copyright © 2022 FDOKUMEN