Comparative study on fees: the packaging waste case
20
Comparative study on fees: the packaging waste case PoVeRE Green policy for packaging waste 1 st International EIMPack Congress 2012 Recycling of Packaging Waste: Considering all the Costs and all the Benefits Portugal - Lisbon - 29, 30 November 2012 1
-
Upload
utaustinportugal -
Category
Documents
-
view
4 -
download
0
Transcript of Comparative study on fees: the packaging waste case
Comparative study on fees: the
packaging waste case
PoVeRE
Green policy for packaging waste
1st International EIMPack Congress 2012
Recycling of Packaging Waste: Considering
all the Costs and all the Benefits
Portugal - Lisbon - 29, 30 November 2012
1
PoVeRE
• Project Team:
Rita Ribeiro, Graça Martinho, Ana Pires, Mafalda Mota
• Financing:
Sociedade Ponto Verde
• Duration:
24 months (start date: May 2012)
November 2012 2

PoVeRE
• Objective
The main objective of PoVeRE is to develop an intelligent software tool,
for calculating an alternative urban waste packaging fee, which
takes in consideration economical, social (e.g. public awareness)
and environmental (e.g. raw material reduction) aspects.
The aim is to contribute to an improved sustainable waste
management policy and also to promote innovation in packaging
design and production with the consequent waste reduction.
November 2012 3
PoVeRE
The first step of this project was to study how Green Dot Fee is
calculated in Portugal and other countries.
These are the results presented here:
November 2012
Comparative study on fees in extended
producer responsibility systems: the
packaging waste case
4
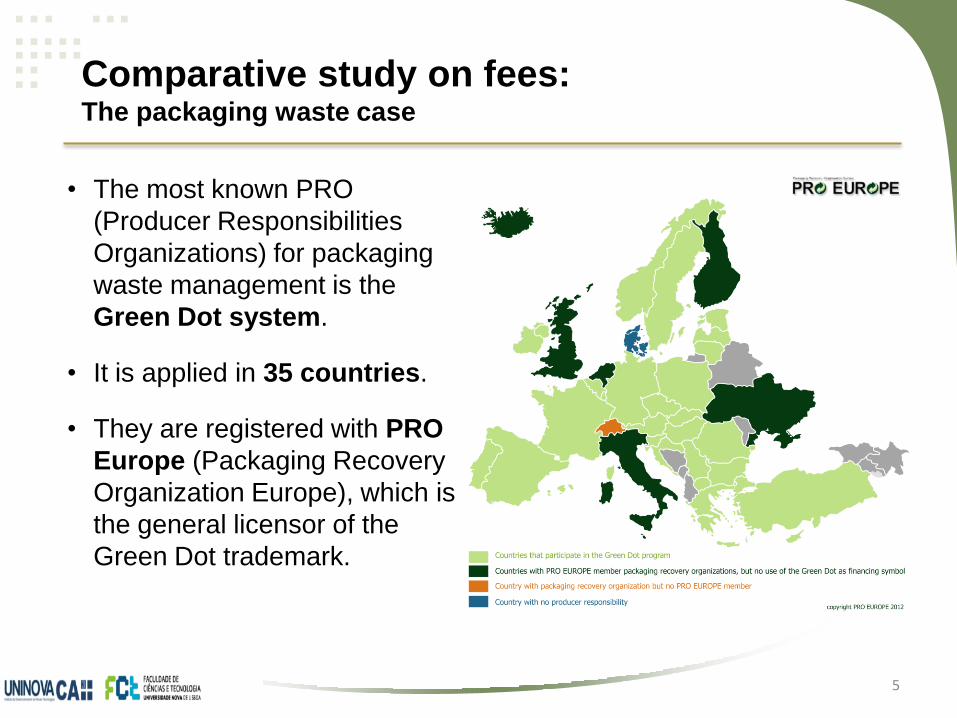
• The most known PRO
(Producer Responsibilities
Organizations) for packaging
waste management is the
Green Dot system.
• It is applied in 35 countries.
• They are registered with PRO
Europe (Packaging Recovery
Organization Europe), which is
the general licensor of the
Green Dot trademark.
November 2012 5
Comparative study on fees: The packaging waste case
The aim of this work is to review how EPR fee could be defined and
applied to packaging waste management, focusing on the Green Dot
system applied in 33 European countries where packaging waste
PRO are PRO Europe members (EU-27 less Denmark plus Croatia,
Iceland, Macedonia, Norway, Serbia, Turkey, and Ukraine).
PRO Europe has been the main source of information and data to
conduct this work.
November 2012 6
Comparative study on fees: The packaging waste case
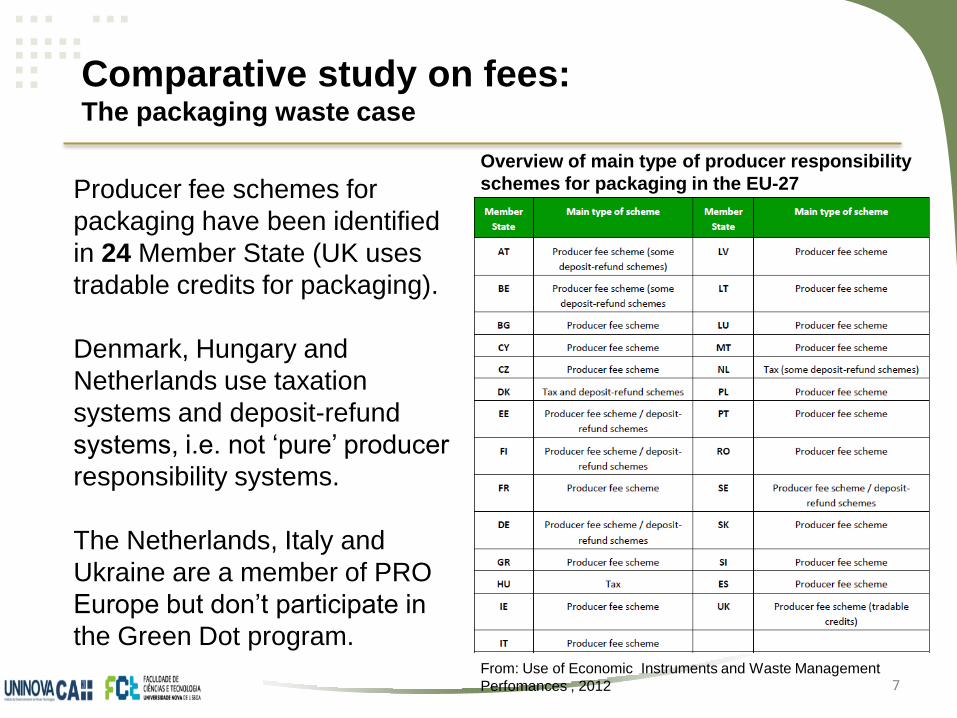
Producer fee schemes for
packaging have been identified
in 24 Member State (UK uses
tradable credits for packaging).
Denmark, Hungary and
Netherlands use taxation
systems and deposit-refund
systems, i.e. not ‘pure’ producer
responsibility systems.
The Netherlands, Italy and
Ukraine are a member of PRO
Europe but don’t participate in
the Green Dot program.
November 2012 7
Overview of main type of producer responsibility
schemes for packaging in the EU-27
Comparative study on fees: The packaging waste case
From: Use of Economic Instruments and Waste Management
Perfomances , 2012
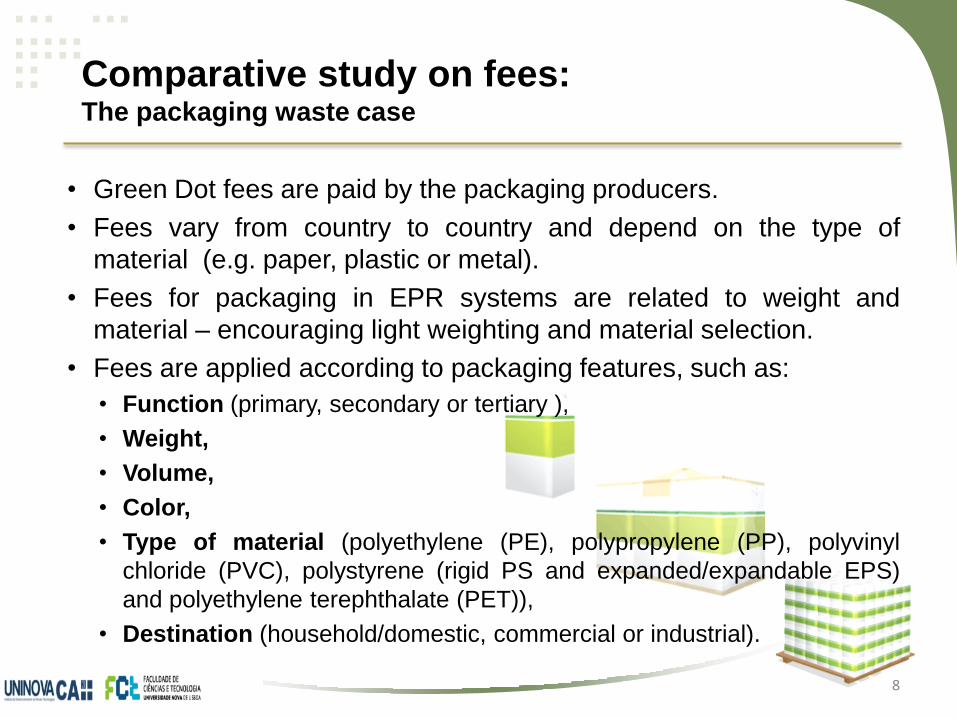
• Green Dot fees are paid by the packaging producers.
• Fees vary from country to country and depend on the type of
material (e.g. paper, plastic or metal).
• Fees for packaging in EPR systems are related to weight and
material – encouraging light weighting and material selection.
• Fees are applied according to packaging features, such as:
• Function (primary, secondary or tertiary ),
• Weight,
• Volume,
• Color,
• Type of material (polyethylene (PE), polypropylene (PP), polyvinyl
chloride (PVC), polystyrene (rigid PS and expanded/expandable EPS)
and polyethylene terephthalate (PET)),
• Destination (household/domestic, commercial or industrial).
November 2012 8
Comparative study on fees: The packaging waste case
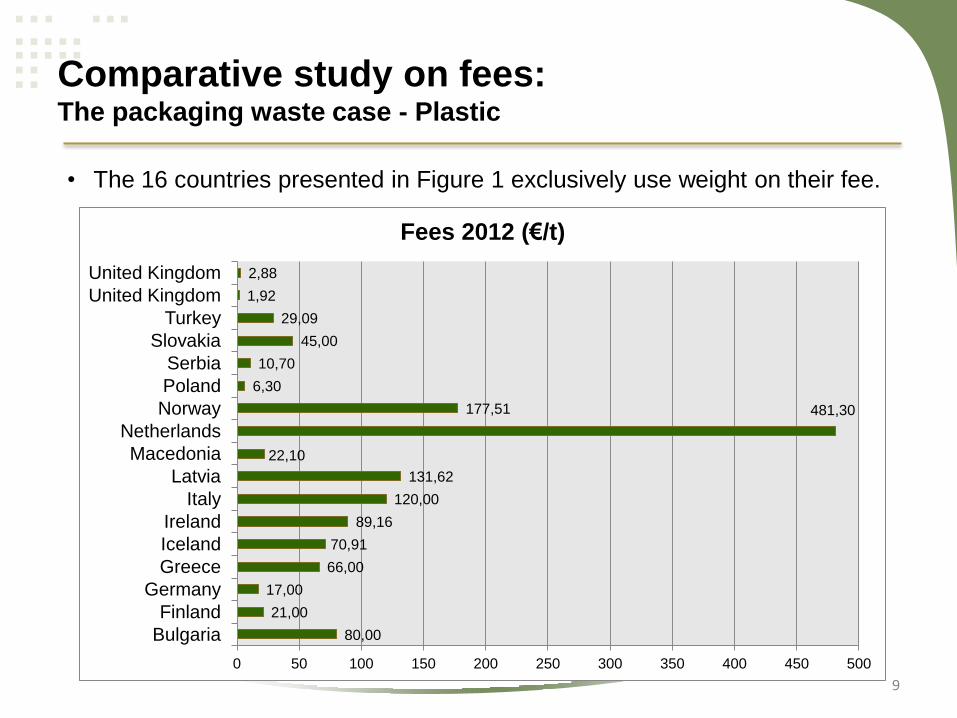
Comparative study on fees: The packaging waste case - Plastic
9
• The 16 countries presented in Figure 1 exclusively use weight on their fee.
80,00
21,00
17,00
66,00
70,91
89,16
120,00
131,62
22,10
481,30 177,51
6,30
10,70
45,00
29,09
1,92
2,88
0 50 100 150 200 250 300 350 400 450 500
Bulgaria
Finland
Germany
Greece
Iceland
Ireland
Italy
Latvia
Macedonia
Netherlands
Norway
Poland
Serbia
Slovakia
Turkey
United Kingdom
United Kingdom
Fees 2012 (€/t)
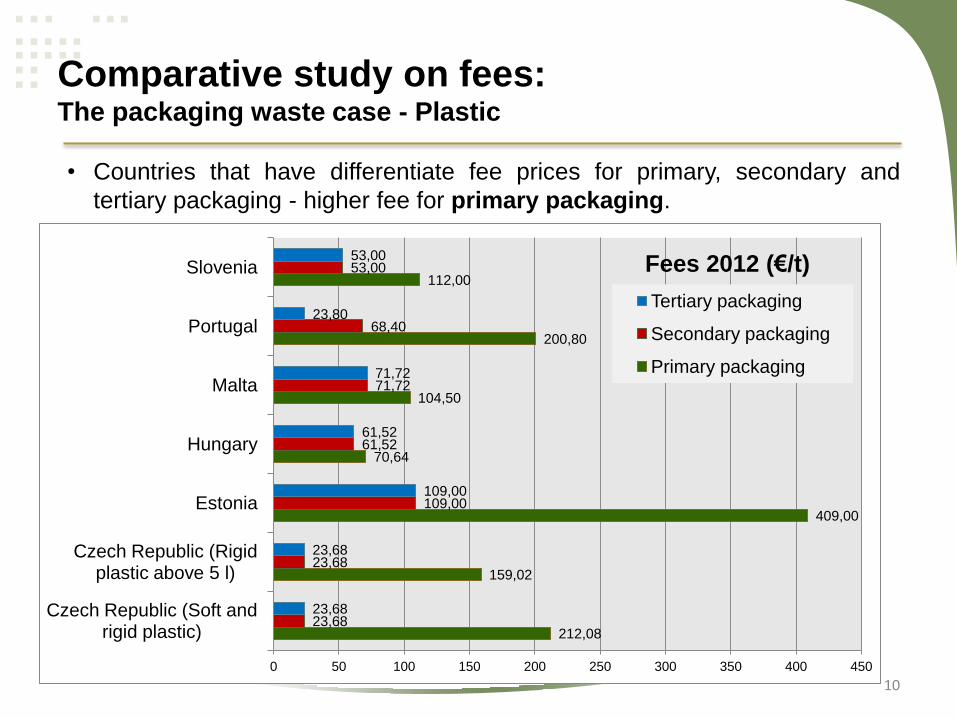
Comparative study on fees: The packaging waste case - Plastic
• Countries that have differentiate fee prices for primary, secondary and
tertiary packaging - higher fee for primary packaging.
10
212,08
159,02
409,00
70,64
104,50
200,80
112,00
23,68
23,68
109,00
61,52
71,72
68,40
53,00
23,68
23,68
109,00
61,52
71,72
23,80
53,00
0 50 100 150 200 250 300 350 400 450
Czech Republic (Soft and rigid plastic)
Czech Republic (Rigid plastic above 5 l)
Estonia
Hungary
Malta
Portugal
Slovenia Fees 2012 (€/t)
Tertiary packaging
Secondary packaging
Primary packaging
11
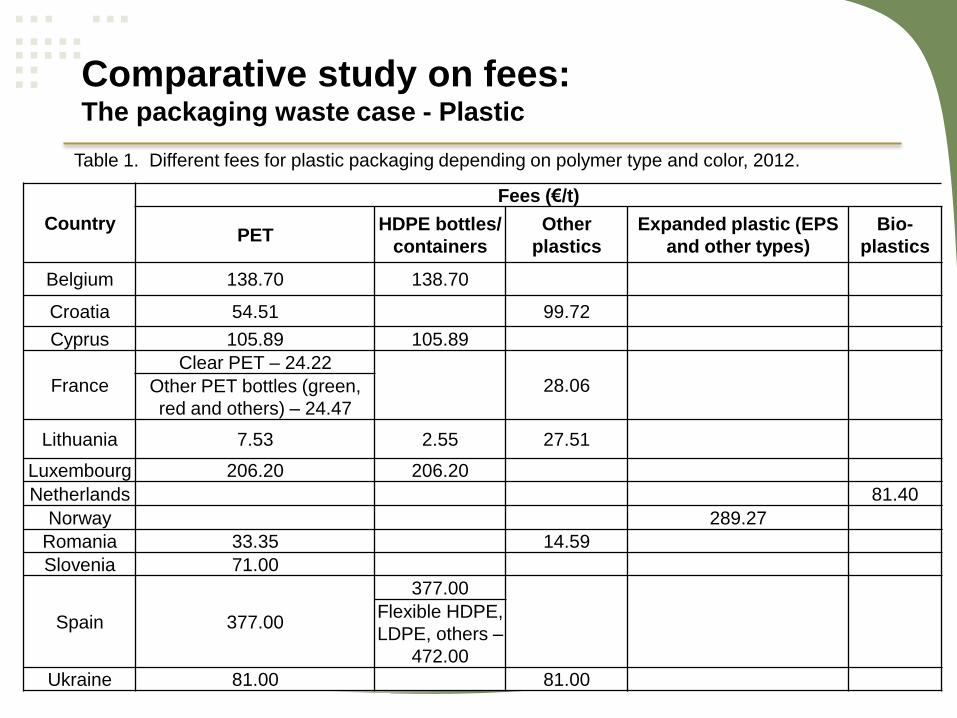
Table 1. Different fees for plastic packaging depending on polymer type and color, 2012.
Country
Fees (€/t)
PET HDPE bottles/
containers
Other
plastics
Expanded plastic (EPS
and other types)
Bio-
plastics
Belgium 138.70 138.70
Croatia 54.51 99.72
Cyprus 105.89 105.89
France
Clear PET – 24.22
28.06 Other PET bottles (green,
red and others) – 24.47
Lithuania 7.53 2.55 27.51
Luxembourg 206.20 206.20
Netherlands 81.40
Norway 289.27
Romania 33.35 14.59
Slovenia 71.00
Spain 377.00
377.00
Flexible HDPE,
LDPE, others –
472.00
Ukraine 81.00 81.00
Comparative study on fees: The packaging waste case - Plastic
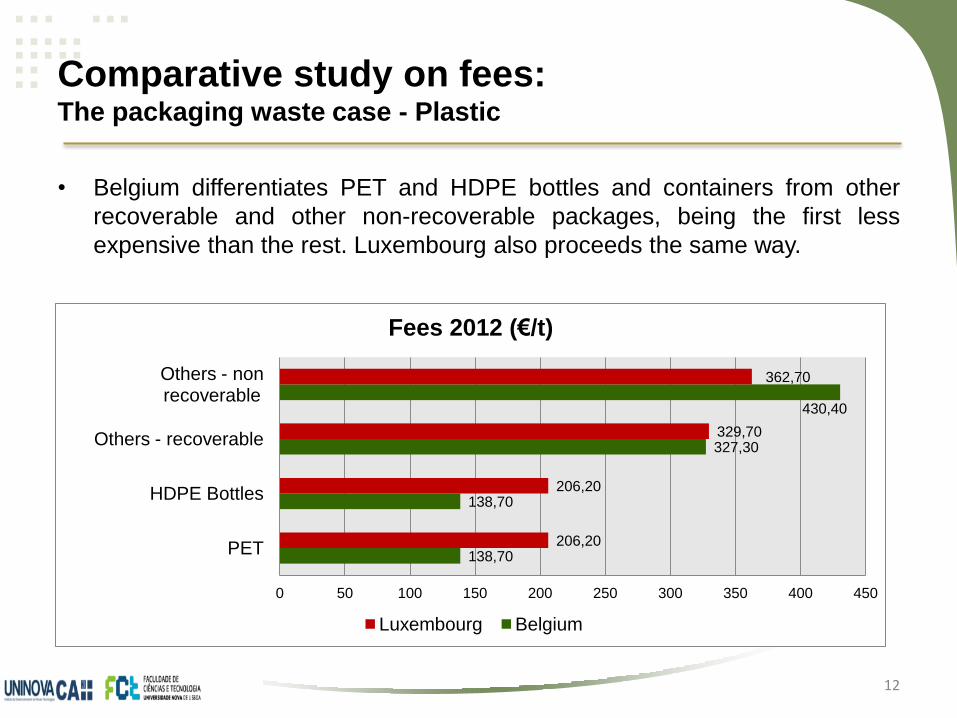
Comparative study on fees: The packaging waste case - Plastic
• Belgium differentiates PET and HDPE bottles and containers from other
recoverable and other non-recoverable packages, being the first less
expensive than the rest. Luxembourg also proceeds the same way.
12
138,70
138,70
327,30
430,40
206,20
206,20
329,70
362,70
0 50 100 150 200 250 300 350 400 450
PET
HDPE Bottles
Others - recoverable
Others - non recoverable
Fees 2012 (€/t)
Luxembourg Belgium
13
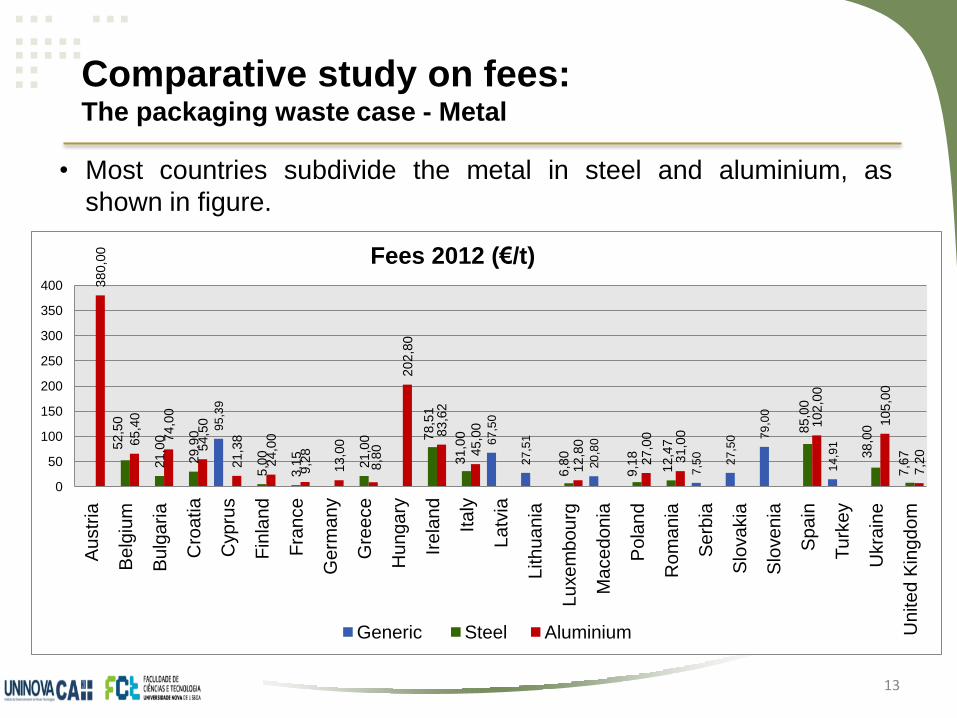
Comparative study on fees: The packaging waste case - Metal
• Most countries subdivide the metal in steel and aluminium, as
shown in figure.
95
,39
67
,50
27
,51
20
,80
7,5
0
27
,50
79
,00
14
,91
52
,50
21,0
0
29,9
0
5,0
0
3,1
5
21,0
0 78,5
1
31,0
0
6,8
0
9,1
8
12,4
7 8
5,0
0
38,0
0
7,6
7
380,0
0
65,4
0
74,0
0
54,5
0
21,3
8
24,0
0
9,2
8
13,0
0
8,8
0
202,8
0
83,6
2
45,0
0
12,8
0
27,0
0
31,0
0 1
02,0
0
105,0
0
7,2
0
0
50
100
150
200
250
300
350
400
Au
str
ia
Be
lgiu
m
Bulg
aria
Cro
atia
Cyp
rus
Fin
lan
d
Fra
nce
Ge
rma
ny
Gre
ece
Hu
ng
ary
Irela
nd
Ita
ly
La
tvia
Lith
ua
nia
Lu
xe
mb
ou
rg
Ma
ce
do
nia
Pola
nd
Ro
ma
nia
Se
rbia
Slo
va
kia
Slo
ve
nia
Sp
ain
Tu
rke
y
Ukra
ine
Un
ite
d K
ing
do
m
Fees 2012 (€/t)
Generic Steel Aluminium
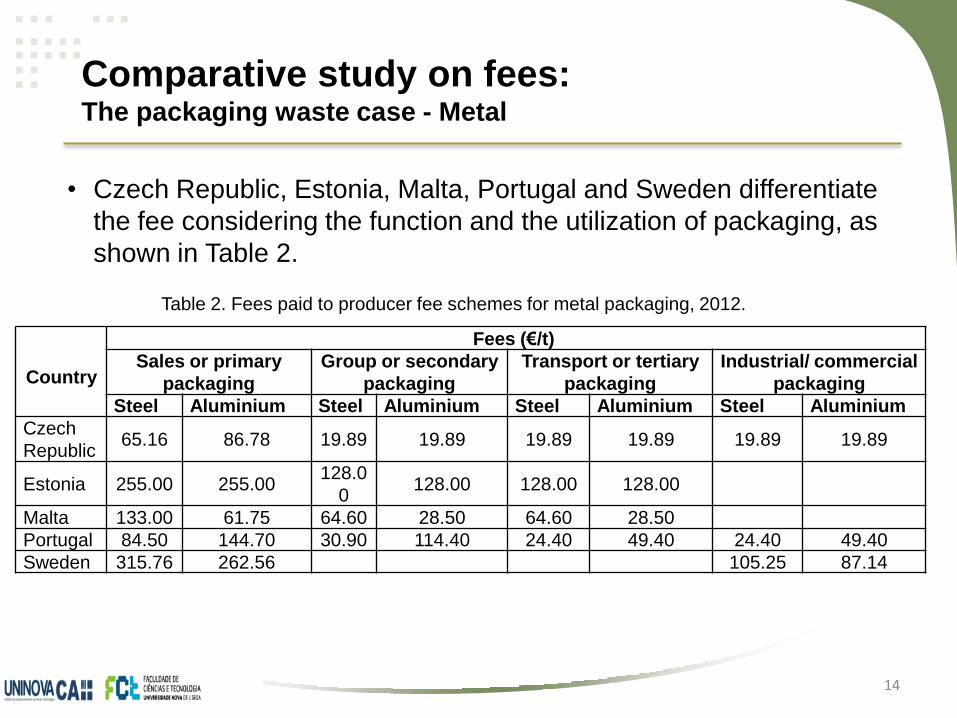
• Czech Republic, Estonia, Malta, Portugal and Sweden differentiate
the fee considering the function and the utilization of packaging, as
shown in Table 2.
November 2012 14
Country
Fees (€/t)
Sales or primary
packaging
Group or secondary
packaging
Transport or tertiary
packaging
Industrial/ commercial
packaging
Steel Aluminium Steel Aluminium Steel Aluminium Steel Aluminium
Czech
Republic 65.16 86.78 19.89 19.89 19.89 19.89 19.89 19.89
Estonia 255.00 255.00 128.0
0 128.00 128.00 128.00
Malta 133.00 61.75 64.60 28.50 64.60 28.50
Portugal 84.50 144.70 30.90 114.40 24.40 49.40 24.40 49.40
Sweden 315.76 262.56 105.25 87.14
Table 2. Fees paid to producer fee schemes for metal packaging, 2012.
Comparative study on fees: The packaging waste case - Metal
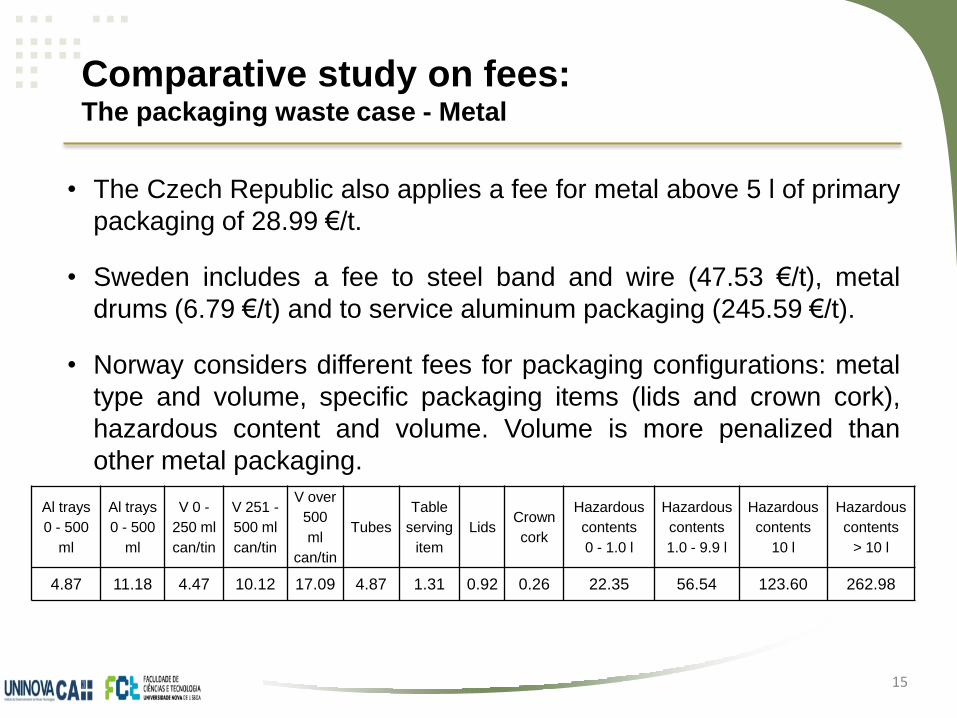
• The Czech Republic also applies a fee for metal above 5 l of primary
packaging of 28.99 €/t.
• Sweden includes a fee to steel band and wire (47.53 €/t), metal
drums (6.79 €/t) and to service aluminum packaging (245.59 €/t).
• Norway considers different fees for packaging configurations: metal
type and volume, specific packaging items (lids and crown cork),
hazardous content and volume. Volume is more penalized than
other metal packaging.
November 2012 15
Al trays
0 - 500
ml
Al trays
0 - 500
ml
V 0 -
250 ml
can/tin
V 251 -
500 ml
can/tin
V over
500
ml
can/tin
Tubes
Table
serving
item
Lids Crown
cork
Hazardous
contents
0 - 1.0 l
Hazardous
contents
1.0 - 9.9 l
Hazardous
contents
10 l
Hazardous
contents
> 10 l
4.87 11.18 4.47 10.12 17.09 4.87 1.31 0.92 0.26 22.35 56.54 123.60 262.98
Comparative study on fees: The packaging waste case - Metal
November 2012 16
We did the same exercise for the following materials:
• Glass
• Paper and Cardboard
• Wood
• Others (beverage cartons, textiles, composites)
And
Comparative study on fees: The packaging waste case
November 2012 17
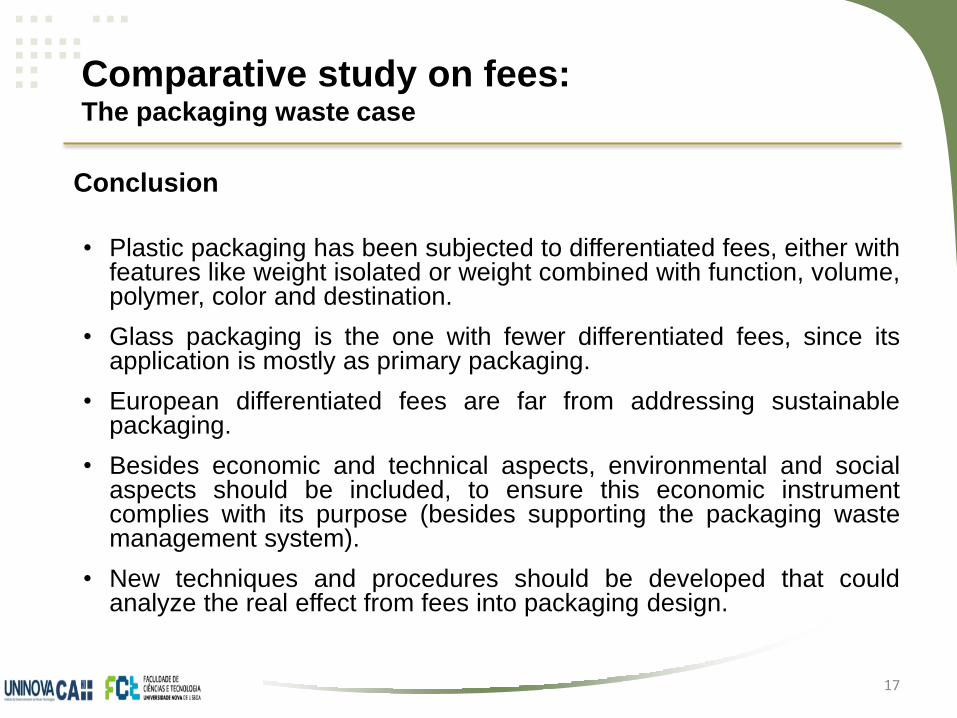
Conclusion
• Plastic packaging has been subjected to differentiated fees, either with features like weight isolated or weight combined with function, volume, polymer, color and destination.
• Glass packaging is the one with fewer differentiated fees, since its application is mostly as primary packaging.
• European differentiated fees are far from addressing sustainable packaging.
• Besides economic and technical aspects, environmental and social aspects should be included, to ensure this economic instrument complies with its purpose (besides supporting the packaging waste management system).
• New techniques and procedures should be developed that could analyze the real effect from fees into packaging design.
Comparative study on fees: The packaging waste case
PoVeRE
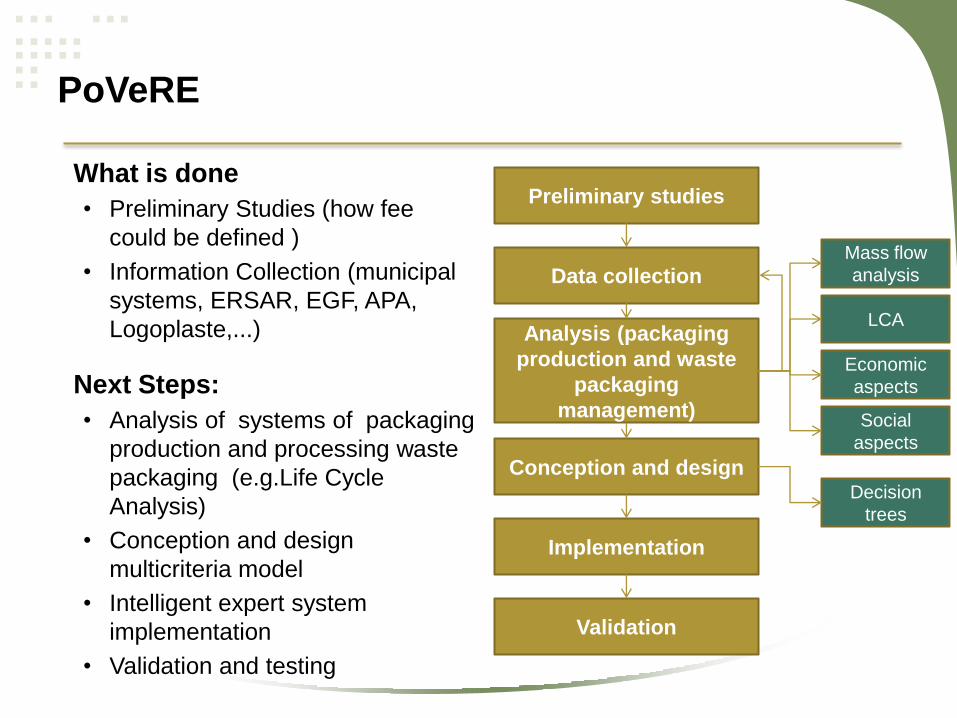
What is done
• Preliminary Studies (how fee
could be defined )
• Information Collection (municipal
systems, ERSAR, EGF, APA,
Logoplaste,...)
Next Steps:
• Analysis of systems of packaging
production and processing waste
packaging (e.g.Life Cycle
Analysis)
• Conception and design
multicriteria model
• Intelligent expert system
implementation
• Validation and testing
Preliminary studies
Data collection
Analysis (packaging
production and waste
packaging
management)
Conception and design
Implementation
Validation
Mass flow
analysis
LCA
Economic
aspects
Social
aspects
Decision
trees
PoVeRE
November 2012 19
Expected results:
• Obtaining a software tool for calculating the sustainable Green Dot
Fee;
• Promotion and incrementing the ecodesign of packaging;
• Development of a prototype for use by SPV that could be used, in
the long term, by packages producers with objective to innovate
the design of packaging.
PoVeRE
November 2012 20
Acknowledges
The authors greatly acknowledge the financial support given to the
PoVeRE project by Sociedade Ponto Verde.
Contacts: Ana Pires [email protected]
Mafalda Mota [email protected]