A chemically-defined screening platform reveals behavioral similarities between primary human...
27
A chemically-defined screening platform reveals behavioral similarities between primary human mesenchymal stem cells and endothelial cells Justin T. Koepsel, Samuel G. Loveland, Michael P. Schwartz, Stefan Zorn, David G. Belair, Ngoc Nhi Le, and William L. Murphy University of Wisconsin, 1550 Engineering Drive Madison Wisconsin 53706, United States, T: 608 262 2224, F: 608 265 9239 Abstract Chemically defined substrates, which rigorously control protein-surface and cell-surface interactions, can be used to probe the effects of specific biomolecules on cell behavior. Here we combined a chemically-defined, array-based format with automated, time-lapse microscopy to efficiently screen cell-substrate interactions. Self-assembled monolayers (SAMs) of alkanethiolates bearing oligo(ethylene glycol) units and reactive terminal groups were used to present cell adhesion peptides while minimizing non-specific protein interactions. Specifically, we describe rapid fabrication of arrays of 1 mm spots, which present varied densities of the integrin- binding ligand Gly-Arg-Gly-Asp-Ser-Pro (GRGDSP). Results indicate that cell attachment, cell spreading, and proliferation exhibit strong dependencies on GRGDSP density for both human mesenchymal stem cells (hMSCs) and human umbilical vein endothelial cells (HUVECs). Furthermore, relative spreading and proliferation over a broad range of GRGDSP densities are similar for both primary cell types, and detailed comparison between cell behaviors identified a 1:1 correlation between spreading and proliferation for both HUVECs and hMSCs. Finally, time- lapse microscopy of SAM arrays revealed distinct adhesion-dependent migratory behaviors for HUVECs and hMSCs. These results demonstrate the benefits of using an array-based screening platform for investigating cell function. While the proof-of-concept focuses on simple cellular properties, the quantitative similarities observed for hMSCs and HUVECs provides a direct example of how phenomena that would not easily be predicted can be shown to correlate between different cell types. Keywords self-assembled monolayers; RGD; mesenchymal stem cells; umbilical vein endothelial cells; array Introduction Understanding how cells respond to specific biomolecules present on a cell culture substrate or a surgical implant surface is critical in scenarios ranging from fundamental cell science to biomaterials design. However, mechanistic details associated with how substrate-bound biomolecules influence even basic cell functions, such as adhesion, remain limited by a lack of systematic approaches aimed at probing cell-surface interactions.[1] On a surface, the challenge of deconstructing specific biomolecule influences on cell function is primarily due to rapid and non-specific protein adsorption to most biomaterials surfaces, which occurs within seconds of contact with biological fluids.[2–4] Thus, biological studies conducted on typical cell culture surfaces in which cells interact with adsorbed protein layers that are difficult to characterize and can denature during the adsorption process, do not allow one to draw clear conclusions about cell-material interactions. To address this challenge, substrates NIH Public Access Author Manuscript Integr Biol (Camb). Author manuscript; available in PMC 2013 December 01. Published in final edited form as: Integr Biol (Camb). 2012 December ; 4(12): . doi:10.1039/c2ib20029e. NIH-PA Author Manuscript NIH-PA Author Manuscript NIH-PA Author Manuscript
-
Upload
independent -
Category
Documents
-
view
1 -
download
0
Transcript of A chemically-defined screening platform reveals behavioral similarities between primary human...
A chemically-defined screening platform reveals behavioralsimilarities between primary human mesenchymal stem cellsand endothelial cells
Justin T. Koepsel, Samuel G. Loveland, Michael P. Schwartz, Stefan Zorn, David G. Belair,Ngoc Nhi Le, and William L. MurphyUniversity of Wisconsin, 1550 Engineering Drive Madison Wisconsin 53706, United States, T:608 262 2224, F: 608 265 9239
AbstractChemically defined substrates, which rigorously control protein-surface and cell-surfaceinteractions, can be used to probe the effects of specific biomolecules on cell behavior. Here wecombined a chemically-defined, array-based format with automated, time-lapse microscopy toefficiently screen cell-substrate interactions. Self-assembled monolayers (SAMs) ofalkanethiolates bearing oligo(ethylene glycol) units and reactive terminal groups were used topresent cell adhesion peptides while minimizing non-specific protein interactions. Specifically, wedescribe rapid fabrication of arrays of 1 mm spots, which present varied densities of the integrin-binding ligand Gly-Arg-Gly-Asp-Ser-Pro (GRGDSP). Results indicate that cell attachment, cellspreading, and proliferation exhibit strong dependencies on GRGDSP density for both humanmesenchymal stem cells (hMSCs) and human umbilical vein endothelial cells (HUVECs).Furthermore, relative spreading and proliferation over a broad range of GRGDSP densities aresimilar for both primary cell types, and detailed comparison between cell behaviors identified a1:1 correlation between spreading and proliferation for both HUVECs and hMSCs. Finally, time-lapse microscopy of SAM arrays revealed distinct adhesion-dependent migratory behaviors forHUVECs and hMSCs. These results demonstrate the benefits of using an array-based screeningplatform for investigating cell function. While the proof-of-concept focuses on simple cellularproperties, the quantitative similarities observed for hMSCs and HUVECs provides a directexample of how phenomena that would not easily be predicted can be shown to correlate betweendifferent cell types.
Keywordsself-assembled monolayers; RGD; mesenchymal stem cells; umbilical vein endothelial cells; array
IntroductionUnderstanding how cells respond to specific biomolecules present on a cell culture substrateor a surgical implant surface is critical in scenarios ranging from fundamental cell science tobiomaterials design. However, mechanistic details associated with how substrate-boundbiomolecules influence even basic cell functions, such as adhesion, remain limited by a lackof systematic approaches aimed at probing cell-surface interactions.[1] On a surface, thechallenge of deconstructing specific biomolecule influences on cell function is primarily dueto rapid and non-specific protein adsorption to most biomaterials surfaces, which occurswithin seconds of contact with biological fluids.[2–4] Thus, biological studies conducted ontypical cell culture surfaces in which cells interact with adsorbed protein layers that aredifficult to characterize and can denature during the adsorption process, do not allow one todraw clear conclusions about cell-material interactions. To address this challenge, substrates
NIH Public AccessAuthor ManuscriptIntegr Biol (Camb). Author manuscript; available in PMC 2013 December 01.
Published in final edited form as:Integr Biol (Camb). 2012 December ; 4(12): . doi:10.1039/c2ib20029e.
NIH
-PA Author Manuscript
NIH
-PA Author Manuscript
NIH
-PA Author Manuscript
designed to limit non-specific protein adsorption and simultaneously present specificbiomolecules can be used to chemically define protein-surface and cell-surface interactions.[1–4] Of these types of defined substrates, self-assembled monolayers (SAMs) on goldformed using alkanethiolates bearing oligo(ethylene glycol) units are particularly well-suitedto efficiently probe cell-biomolecule interactions, as they allow for strict control overbiomolecule presentation and simple functionalization chemistries.[2–9] To date, SAMshave been used to identify unique insights into the effects of specific cell-extracellularmatrix interactions[2–9] as well as the effects of surfaces designed to sequester specificsoluble molecules such as growth factors and proteoglycans[8, 9]. These previous studieshighlight SAMs as unique biological tools.
Here we present a well-defined screening array platform that provides controlled cell-substrate interactions and enables systematic studies of cell behavior. Our approach usessimple elastomeric stencils to form arrays of biomolecules on SAMs formed on goldsurfaces (Figure 1), and uses automated, time-lapse microscopy to track cell behavior withinarray spots. We created arrays containing varying densities of the fibronectin-derived celladhesion peptide Gly-Arg-Gly-Asp-Ser-Pro (GRGDSP)[10–12] and used them to screen foradhesion-dependent changes in cell behavior. Here, we chose to investigate human umbilicalvein endothelial cells (HUVECs) and human mesenchymal stem cells (hMSCs) as theyrepresent two commonly used, but distinct, cell types in regenerative medicine. In particular,HUVECs represent a model cell type that have been used to study endothelial cell roles inblood vessel formation, barrier function, hemostasis, vascular tone, inflammation, leukocyteinteractions, and neoangiogenesis.[13–17] Conversely, hMSCs are a multipotent stem celltype present in a variety of tissues that contribute to tissue and immune system homeostasisvia mechanisms including differentiation into a range of mature cell types[18–22] as well assecretion of a range of soluble factors[23, 24]. Using SAM arrays to investigate these twocell types, our results provide unique insights into the effects of cell adhesion ligand densityon HUVEC and hMSC behaviors, including cell attachment, spreading, proliferation, andmigration. Furthermore, direct comparisons between these two cell types identifycorrelations that could not be obtained without an efficient, array-based approach.
Experimental methodsMaterials
Carboxylic acid-capped hexa(ethylene glycol) undecanethiol (HS-C11-(O-CH2-CH2)6-O-CH2-COOH) (referred to herein as “HS-C11-EG6-COOH”), was purchased from Prochimia(Sopot, Poland). 11-tri(ethylene glycol)-undecane-1-thiol (HS-C11-(O-CH2-CH2)3-OH)(referred to herein as “HS-C11-EG3-OH”) was synthesized as described elsewhere.[25]Fmoc-protected amino acids and Rink amide MBHA peptide synthesis resin were purchasedfrom NovaBiochem (San Diego, CA). Hydroxybenzotriazol (HOBt) was purchased fromAdvanced Chemtech (Louisville, KY). Diisopropylcarbodiimide (DIC) was purchased fromAnaspec (San Jose, CA). N-hydroxysuccinimide (NHS), n-(3-dimethylaminopropyl)-N′-ethylcarbodiimide hydrochloride (EDC), sodium dodecyl sulfate (SDS), trifluoroacetic acid(TFA), diethyl ether, and deionized ultrafiltered water (DIUF H2O) were purchased fromFisher Scientific (Fairlawn, NJ). Triisopropylsilane (TIPS), piperidine, dimethylformamide(DMF), acetone, hexanes, and acetonitrile were purchased from Sigma-Aldrich (St. Louis,MO). Absolute ethanol (EtOH) was purchased from AAPER Alcohol and Chemical Co.(Shelbyville, KY). All purchased items were of analytical grade and used as received. Thinfilms of 100 Å Au <111>, 20 Å Ti on 1″ × 3″ × 0.040″ glass were purchased from PlatypusTechnologies, LLC (Madison, WI. Cat. No. AU.0100.ALSI).
Koepsel et al. Page 2
Integr Biol (Camb). Author manuscript; available in PMC 2013 December 01.
NIH
-PA Author Manuscript
NIH
-PA Author Manuscript
NIH
-PA Author Manuscript
Peptide synthesisStandard solid phase Fmoc-peptide synthesis (Fmoc SPPS) was performed using a 316cautomated peptide synthesizer (C S Bio, Menlo Park, CA). Rink amide MBHA resin wasused as the solid phase, and HOBt and DIC were used for amino acid activation andcoupling. After coupling the final amino acid, a 4-hr incubation in TFA, TIPS, and DIUFH2O (95:2.5:2.5) released the peptide from resin and removed protecting groups. Releasedpeptide was extracted from the TFA/TIPS/DIUF H2O cocktail via precipitation in colddiethyl ether. Lyophilized peptides were analyzed using matrix-assisted laser desorption/ionization-time-of-flight (MALDI-TOF) mass spectrometry with a Bruker Reflex II(Billerica, MA). The purity of synthesized peptides was evaluated via HPLC using a C18analytical column (Shimadzu, Kyoto, Japan) with a gradient of 0–70% H2O + 0.1% TFA/acetonitrile and a flow rate of 0.9 mL/minute. GWGGRGDSP, GWGGRGESP,GWGGIKVAV, and GWGGVKAIV adhesion and mutant peptides were synthesized withtryptophan-bearing spacers to aid in determination of peptide concentration via UV/Vis.Peptide stocks were prepared at 300 μM in PBS at pH 7.4 as determined by absorbance at280 nm using extinction coefficients outlined by Gill and von Hippel.[26] Fluorescently-labeled GGRGDSPK was synthesized as previously described[7] and peptide concentrationwas determined by absorbance of the 5(6)-carboxyfluorescein group at 492 nm using anextinction coefficient of 81,000 cm−1M−1
Fabrication of elastomer wellsElastomeric stencils containing arrays of wells were created using soft lithography.[27, 28]Briefly, master molds containing arrays of 1100 μm diameter posts were fabricated fromSU-8 (Microchem, Newton, MA) spin-coated silicon wafers using conventionalphotolithography techniques. Polydimethylsiloxane (PDMS) (Sylgard 184, Dow Corning,Midland, MI) was prepared by mixing a 10:1 ratio of base/curing agent (w/w) followed bydegassing for ~30 mins. The degassed mixture was cast over the mold and cured for 4 hrs at85 °C. Following curing, PDMS stencils were removed from molds and cleaned in hexanesusing an overnight Soxhlet extraction.[29] After cleaning, stencils were placed in vacuo toremove residual solvent from the Soxhlet extraction process.
Surface preparation and array fabricationGold slides were placed into a 150 mm glass Petri dish, covered with EtOH, and sonicatedfor ~1 min using an ultrasonic bath (Bransonic 1510, Branson, Danbury, CT). Sonicatedgold chips were then rinsed with EtOH and blown dry with N2. SAM arrays were fabricatedas follows: An elastomeric stencil containing arrays of 1.1 mm holes was placed on a baregold surface to form an array of wells on the gold substrate 0Figure 1B, Step 1). Wells werethen filled with 1 mM ethanolic alkanethiolate solution and incubated for 10 minutes in achamber containing a laboratory wipe soaked with ethanol to prevent evaporation duringlocal SAM formation (Figure 1B, Step 2). Alkanethiolate solutions were then aspirated andwells were rinsed with DIUF H2O. Carboxylate groups were then converted to active estergroups by adding a solution of 100 mM NHS and 250 mM EDC in DIUF H2O pH 5.5 towells and incubated for 10 minutes. After an additional rinse with DIUF H2O, 300 μMsolutions of peptide in PBS at pH 7.4 were added to each well and incubated for 1 hr in ahumidity controlled chamber to covalently couple peptides to each array spot (Figure 1B,Step 3). After a final rinse with DIUF H2O, regions surrounding array spots were backfilledwith HS-C11-EG3-OH. This was achieved by submerging the gold substrate and attachedelastomeric stencil in an aqueous 0.1 mM HS-C11-EG3-OH solution (pH 2.0), removing thestencil, and incubating for 10 minutes (Figure 1B, Step 4). Following backfilling, the arraywas rinsed with 0.1 wt% SDS in DIUF H2O, DIUF H2O, and EtOH and then dried under astream of N2. Arrays were stored in sterile DIUF H2O at 4 °C and used within 24 hrs.
Koepsel et al. Page 3
Integr Biol (Camb). Author manuscript; available in PMC 2013 December 01.
NIH
-PA Author Manuscript
NIH
-PA Author Manuscript
NIH
-PA Author Manuscript
In this SAM array approach, each spot was designed to contain the same total molar density(mol/cm2) of peptide from spot to spot. Therefore, control over GRGDSP density wasachieved by mixing GRGDSP with the mutant GRGESP peptide. In a typical SAM array,SAMs were locally formed within spots using an 1 mM alkanethiolate mixture of 95% HS-C11-EG3-OH and 5% HS-C11-EG6-COOH to create surfaces with a total of 5% carboxylategroups for peptide conjugation. Here, “X%” refers to the mole percent of alkanethiolatepresent during SAM formation and subsequently the approximate amount of analkanethiolate present on the surface after SAM formation. Next, to create a spot presenting5% GRGDSP, a 300 μM peptide solution was used during peptide conjugation. Likewise, tocreate a spot with 1.6% GRGDSP, a 300 μM peptide solution with 100 μM GRGDSP and200 μM GRGESP was used during peptide conjugation (Figure 1B, Step 3). In this manner,the amount of GRGDSP peptide could be varied between spots while holding total peptidecontent constant and a three-fold dilution series of GRGDSP into GRGESP was used togenerate arrays with a range of GRGDSP densities such as 5.0, 1.6, 0.6, 0.2, 0.06, 0.02,0.01, and 0% peptide. Likewise, mixtures of IKVAV and the mutant peptide VKAIV weremixed together to generate arrays with a similar set of IKVAV peptide densities.
Cell CulturePassage 2 human umbilical vein endothelial cells were expanded at low density (less than70% confluence) on tissue culture polystyrene to no more than 14 population doublings.During HUVEC expansion and experiments on SAM arrays, HUVECs were cultured inmedium 199 (m199, Mediatech, Manassas, VA) containing 1% penicillin/streptomycin(Hyclone, Logan, UT) and supplemented with Clonetics EGM-2 BullitKit (LonzaWalkersville, Inc., Walkersville, MD) containing hydrocortisone, hFGF-B, VEGF, R3-IGF-1, ascorbic acid, heparin, fetal bovine serum, hEGF, GA-1000 growth supplements.Bone marrow-derived human mesenchymal stem cells (Lonza, Walkersville, MD) wereexpanded at low density on tissue culture polystyrene plates to maintain multipotency asdescribed by Sotiropoulou et al.[30] and used by passage 7. During hMSC expansion andexperiments on SAM arrays, hMSCs were cultured in minimum essential medium, alpha(Mediatech, Manassas, VA) containing 10% MSC qualified fetal bovine serum (Invitrogen,Carlsbad, CA) and 1% penicillin/streptomycin. For simplicity, throughout the methodssection “media” will refer to the respective media used for culture of HUVECs and hMSCs.
Cell Assays on SAM ArrayHUVECs or hMSCs were removed from plastic culture plates using a 0.05% trypsinsolution, resuspended in media, and seeded onto SAM arrays in sterile polystyrene Petridishes at 2,500 and 1,500 cells/cm2, respectively, unless specified otherwise. After allowingcells to attach for ~ 1 hr in a humidified incubator at 37 °C and 5% CO2, arrays were dippedin warm media to remove loosely attached cells and then transferred to a rectangularmultidish (Thermo Scientific/Nunc, Rochester, NY) with warm media and imaged ~4 hrslater serving as “0 hr.” For the initial time point and subsequent time-lapse imaging, arrayswere placed on an incubated stage and each array spot was imaged every 15 mins for 72 hrs.Furthermore, all cell experiments for comparison between HUVECs and hMSCs were runsimultaneously, and thus both cell types were exposed to identical environmental conditionsand monitored at the same experimental time points.
ImmunocytochemistryAt 24 and 72 hr time points during the time-lapse experiment, staining for the actincytoskeleton and focal adhesion markers was performed as directed by the manufacturer(Catalog No. FAK100, Millipore, Billerica, MA). Briefly, cells on arrays were fixed using4% formaldehyde in PBS for 15 minutes. Following fixing, arrays were washed and then
Koepsel et al. Page 4
Integr Biol (Camb). Author manuscript; available in PMC 2013 December 01.
NIH
-PA Author Manuscript
NIH
-PA Author Manuscript
NIH
-PA Author Manuscript
permeabilized using 0.1 % Triton X-100 (MP Biomedicals, Aurora, OH) in PBS for 5minutes. After an additional wash and a blocking step using 1% (w/v) bovine serum albumin(Fisher Scientific, Fairlawn, NJ) arrays were exposed to a PBS solution containing an anti-vinculin primary antibody for 1 hr at room temperature. Arrays were then exposed to a PBSsolution containing a FITC-conjugated secondary antibody and TRITC-conjugatedphalloidin for 60 minutes at room temperature. After a final rinse, arrays were mounted witha cover slip using Prolong Gold Antifade Reagent with DAPI (Invitrogen, Eugene, OR) asindicated by the manufacturer. Integrin staining was performed using a similar protocolexcept primary antibody staining for β1 (Abcam, Cambridge MA) was performed overnightat 4°C and secondary antibody staining was performed for 2 hrs at room temperature.
Array ImagingA GE Healthcare Typhoon Trio Variable Mode Imager was used to scan SAM arrayscontaining fluorescently-labeled peptide and fluorescent intensity was quantified usingImage J (ImageJ, Freeware, NIH, Bethesda, MD) imaging software. Cells in culture onSAM arrays were imaged using a Nikon Eclipse Ti inverted microscope equipped with thePerfect Focus System; filters for FITC, TexasRed, and DAPI; and a TIZ Tokai Hit incubatedstage that was humidified and maintained at 37 °C and 5% CO2. For phase contrast imaging,a 10X PhL objective was used to capture 4 images of each spot, which were automaticallystitched together using the Nikon NIS Elements software. Immunofluorescence images ofeach array spot were acquired at 30X and stitched together from 20 images. Forimmunofluorescence imaging, exposure times for each channel were kept constant fromarray to array.
Analysis, Quantification, and StatisticsRelative cell attachment at 0 hrs was quantified by counting the number of attached cells perspot and normalizing cell numbers to maximal attachment conditions. Normalized cellnumber was calculated by dividing the number of cells per spot at 72 hrs (C72) to the cellnumber observed on the same spot at 0 hrs (C0). Relative proliferation was determined bydividing normalized cell numbers at 72 hrs by the maximum average normalized cellnumber observed across GRGDSP density conditions. Similarly, relative spreading wasdetermined by dividing projected cell areas to the maximum average projected cell areaobserved across GRGDSP density conditions. Analysis of projected cell area was achievedusing Nikon NIS Elements Software (Melville, NY). Briefly, stacked images of array spotswere thresholded and then automated measurements of area and counts were tabulated. Foreach spot, average cell projected area was calculated by dividing the thresholded actinstaining (red channel) by the total number of nuclei in the same spot. For cell tracking, thecell tracking module in NIS Elements was used to monitor single cell migration in timelapse images over 6 hrs starting at ~12 hrs into cell culture experiments. Duringquantification, migration was classified as a single cell that migrated more than an averagedistance of 2 nuclei and did not divide or interact with other cells. Additionally, migrationspeed was only reported for conditions in which more than 15% of single cells weremigrating. To clearly display phase contrast and fluorescence images in the manuscript,adjustments to brightness and contrast were performed in accordance to guidelines outlinedby the Journal of Cell Biology.[31] Statistical analysis of all data sets was performed using atwo-tailed Student’s t-test, where p < 0.05 is used to denote statistical significance.
Results and DiscussionControl Over Peptide Identity and Density in Cell Culture
An elastomeric stencil approach was used to generate SAM arrays with precise spot-to-spotcontrol over peptide composition (Figure 1). The local density of GRGDSP was controlled
Koepsel et al. Page 5
Integr Biol (Camb). Author manuscript; available in PMC 2013 December 01.
NIH
-PA Author Manuscript
NIH
-PA Author Manuscript
NIH
-PA Author Manuscript
by mixing GRGDSP and GRGESP (a non-bioactive mutant peptide) together during peptidecoupling, maintaining a constant total peptide density of 5%. To visualize differences inpeptide density on a typical array, 5(6)-carboxyfluorescein-labeled GRGDSPK was mixedwith GRGESP at varied ratios and coupled to SAM array spots presenting 5% total HS-C11-EG6-COOH (Figure 2A). 5% HS-C11-EG6-COOH density was chosen for this work asprevious results have demonstrated good control over peptide density while limiting non-specific interactions with background functional groups.[6, 7] On SAM arrays, fluorescencewas confined to the array spots and the fluorescence intensity in each spot correlated withthe amount of labeled peptide included in the coupling reaction (Figure 2A). Furthermore,this trend exhibited a linear relationship between fluorescent intensity and peptide density(Figure 2B), indicating control over peptide density that is similar to what we have reportedin a previous SAM array approach.[7] Taken together, fluorescent visualization of peptideincorporation demonstrated control over peptide density between spots and the ability togenerate a range of peptide conditions on a single SAM array.
SAM arrays provide a robust and controllable platform for primary, human cell culture(Figure 3). HUVECs and hMSCs were seeded onto identical SAM arrays presenting varieddensities of GRGDSP, and imaged using time-lapse microscopy over 72 hrs (SeeSupplement Movies 1A–D). Over the course of an experiment, HUVEC and hMSCattachment and growth was limited to SAM regions presenting GRGDSP and there was nocell attachment observed on background oligo (ethylene glycol) regions or on spotscontaining only GRGESP and no GRGDSP (Figure 3A). In long term studies in whichhMSCs were grown for 20 days with repeated media exchange, cells remained confinedwithin GRGDSP-presenting array spots (Figure 3B). Thus, these results demonstrate thatSAM arrays can be used to probe for ligand specific effects on cell behavior and suggest thatarrays can be used for long-term studies such as those aimed at understanding stem celldifferentiation.
The elastomeric stencil approach used here has several advantages over previously describedSAM array approaches developed by us[7] and others[32]. In a previous study[7], we variedthe density of HS-C11-EG6-COOH between spots prior to peptide coupling, resulting invariation in total peptide density across the array. In our current approach we instead variedbiologically active peptide density while holding the total peptide density constant byincluding an inactive (scrambled) peptide. These two approaches both yield SAM arrayswith control over peptide density, similar to the approach described by Orner et al.[32].However, by maintaining constant total peptide density, the current approach limitschemical variation from spot to spot and thus provides a more robust strategy for probing theeffects of a specific peptide sequence. From a practical standpoint, an additional advantageof the current approach is that functionalization does not require localized SAM removal viaUV irradiation[32] or borohydride chemistry[7] and complete cell-seeded arrays can begenerated in less than 2 hrs in a few steps with a standard pipette and PDMS stencil (Figure1B). Additionally, arrays generated on substrates the size of a standard microscope slide (3″× 1″) can contain over 100 spots, each with a different cell-interactive substrate (Figure 1C).Taken together, the approach described here reduces the logistical complexity required torapidly generate SAM arrays with a wide range of peptide densities, enabling systematicinvestigation of chemically-defined cell culture substrates without a need for specificexpertise in organic synthesis or SAMs chemistry.
Cell AttachmentHUVEC and hMSC attachment were each GRGDSP-dependent and both cell types showedsimilar cell attachment trends across conditions (Figure 4), suggesting similar response tochanges in adhesion ligand density. HUVEC and hMSC attachment was similar over 3orders of magnitude of GRGDSP density, and minimal required GRGDSP densities for cell
Koepsel et al. Page 6
Integr Biol (Camb). Author manuscript; available in PMC 2013 December 01.
NIH
-PA Author Manuscript
NIH
-PA Author Manuscript
NIH
-PA Author Manuscript
attachment were also similar (~0.006% GRGDSP) (Figure 4A). The similarities in hMSCand HUVEC attachment to GRGDSP functionalized SAMs is interesting in the context ofprevious studies, which have reported attachment for bovine aortic endothelial cells(BAECs) [33] and hMSCs [6, 7] on SAMs functionalized with cell adhesion ligand. BAECattachment was insensitive to adhesion ligand density above the minimum GRGD densityrequired for adhesion at 0.001%[33] while minimum GRGDSP density required for hMSCattachment has been reported in several studies[5–7] with values ranging from 0.1%[6] to0.0005%[7] GRGDSP. It is unclear whether discrepancies between previous and currentresults for minimal cell attachment conditions are due to subtle differences in cell cultureprotocols, the differing cell adhesion ligand identity (RGD vs. RGDSP), or the differentendothelial cell types used (bovine vs. human derived endothelial cells). However, thedifficulty in directly comparing these studies highlights the utility of standardized platformsthat can probe similarities and differences in cell behavior while minimizing experimentalerrors or differences in experimental conditions. Here, we were able to probe a wide rangeof GRGDSP densities using identical substrate conditions, and thus identify previouslyunreported similarities in the mechanisms governing the initial attachment of these primarycell types to GRGDSP-terminated surfaces.
HUVEC and hMSC attachment to arrays presenting varied densities of the well-knownlaminin-derived cell adhesion ligand Ile-Lys-Val-Ala-Val, IKVAV (Supplement Figure 1)was minimal (less than 5 cells per spot) and equivalent to non-bioactive control or PEG-onlybackground. This result may contrast with previous studies have demonstrated that IKVAVadsorbed onto plastic cell culture plates can support HUVEC attachment. [34, 35] However,several other studies have demonstrated that HUVEC attachment to IKVAV is minimal andsignificantly less than RGD-functionalized materials [36] [37]. Similarly, previous studieshave demonstrated that hMSC spreading on polystyrene-block-poly(ethylene oxide)-copolymer surfaces presenting IKVAV is minimal when compared to RGD.[38] Takentogether, these previous results demonstrate that HUVEC and hMSC attachment to IKVAVis significantly lower that RGD and our current results suggest that when presented in achemically well-defined context, neither cell type adheres to IKVAV. It is noteworthy thatour array-based platform allowed us to efficiently explore 8 distinct IKVAV densities thatspan 3 orders of magnitude, which strongly indicates that these cell types do not adhere toIKVAV.
Expression of Cytoskeletal and Adhesion ComponentsImmunofluorescence was used to visualize f-actin (red, for cytoskeleton) and vinculin(green, a component of focal adhesions) to gain insight about how adhesion ligand densityinduced changes in cell structure (Figure 5). Both cell types had vinculin-containing focaladhesions [39] and well-organized f-actin structure at high GRGDSP densities (5.00% and1.67%). However, HUVECs and hMSCs had distinctly different cytoskeletal structure andfocal adhesion organization at each GRGDSP density. Specifically, at high GRGDSPdensities HUVECs expressed thick f-actin stress fibers terminated by focal adhesionsprominently around the cell perimeter, while hMSCs were more elongated and fibroblastic,with f-actin stress fibers running longitudinally (parallel to the long axis of the cell) throughthe cell and terminated by focal adhesions. As GRGDSP density was decreased, HUVECsbecame more elongated (Figure 5, 0.19%, 0.06% GRGDSP) with stress fibers taking on amore longitudinal orientation and focal adhesions occurring on the ends of the elongated cellbody. Changes for hMSCs were subtler over the intermediate GRGDSP densities, withhMSCs maintaining an elongated shape and longitudinal stress fiber orientation but adoptinga more spindle-shaped morphology. At the lowest GRGDSP density (Figure 5, 0.01%GRGDSP), HUVECs and hMSCs both became morphologically compact with highlycondensed f-actin and vinculin staining throughout the cell that made structure difficult to
Koepsel et al. Page 7
Integr Biol (Camb). Author manuscript; available in PMC 2013 December 01.
NIH
-PA Author Manuscript
NIH
-PA Author Manuscript
NIH
-PA Author Manuscript
distinguish. Quantified focal adhesion density, size, and average staining intensity(Supplemental Figure 2) also exhibited GRGDSP dependent changes in focal adhesionexpression for both cell types, although HUVECs exhibited significantly higher focaladhesion density compared to hMSCs for several GRGDSP densities. These changes inhMSC morphology with respect to GRGDSP density are consistent with those previouslyobserved in our work using SAM substrates.[5–7] Additionally, while there has been littleprevious work done to characterize HUVEC response using RGD presenting SAMsubstrates, the gradual changes in cytoskeletal morphology observed in this work are similarto results observed using other systems to vary the density of RGD on HUVEC culturesurfaces.[40] It is interesting to note that at intermediate GRGDSP densities we couldidentify similarities in morphology and structure between hMSCs and HUVECs (e.g.HUVECs at 0.19% and hMSCs at 0.56%), which is in stark contrast to observations fromhigh adhesion ligand density conditions (5%) or standard culture of these cell types.
Projected cell area was not significantly different for HUVECs and hMSCs at 24 hrs for anyof the conditions investigated, with maximal projected cell areas of greater than 4000 μm2
occurring at 1.6% and 5% GRGDSP (Figure 6A-B). These maximal projected cell areas at24 hrs agree with previous reports of HUVEC spreading on glass substrates[41–43] andhMSC spreading on GRGDSP presenting SAMs.[5–7] Furthermore, both cell typesexhibited GRGDSP density-dependent changes in spreading. In the case of hMSCsspreading with respect to ligand density, results agree well with results from our previouslydescribed SAM array system.[7] Taken together, these spreading results and the initialattachment results (Figure 4A) highlight that, despite differences in cytoskeletal andadhesion component structures (Figure 5 and Supplemental Figure 2), the two different celltypes exhibited remarkably similar attachment and spreading.
While spreading at 24 hrs was similar for HUVECs and hMSCs, changes in spreadingdiffered markedly for the two cell types from 24 to 72 hrs in culture (Figure 6C), withHUVECs increasing their projected cell area for all GRGDSP densities above 0.06% (Figure6D), and hMSCs projected area either decreasing or remaining constant with increasingadhesion ligand density (Figure 6E). Previous studies of cell spreading have typicallyexamined projected cell area at a static 24 hr time point or for changing time over the firstfew hrs to 24 hrs. For example, HUVECs on glass substrates have previously beendocumented to continually increase their projected cell area until maximal spreading isachieved between 3 and 24 hrs.[41–43] However, at 72 hours we observe maximal HUVECspreading reaching 6000 μm2 on 1.67% and 5% GRGDSP as well as a general increase inspreading across several adhesion ligand densities. Conversely, we observed slight decreasesin hMSC projected cell areas from 24 to 72 hrs across several GRGDSP densities (Figure6E). These data suggest that it may be desirable to track cell adhesion over greater than 24hrs to understand dynamics of cell phenotype, as cell spreading has been clearly correlatedto changes in differentiated function of both HUVECs and hMSCs.[44–51] Interestingly,even with temporal changes in spreading, the relative spreading is almost identical for bothcell types at both 24 and 72 hrs (Figure 6F). Therefore, while these results indicate thattemporal changes extend beyond timeframes typically used to characterize cell spreading,they also suggest that cell behavior maintains a similar dependence on adhesion liganddensity over time.
Antibody staining revealed differences in HUVEC and hMSC β1 integrin expression (Figure7). HUVECs and hMSCs have the capacity to attach through a wide range of integrins, witheach expressing a variety of different α and β subunits [52, 53] [54]. However, β1-integrinsare known to facilitate a range of cellular functions such as attachment, spreading, andmigration, and several integrin receptors with β1 subunits are known to bind RGD [10–12,55–57]. Therefore, we compared expression of β1-integrin for HUVECs and hMSCs using
Koepsel et al. Page 8
Integr Biol (Camb). Author manuscript; available in PMC 2013 December 01.
NIH
-PA Author Manuscript
NIH
-PA Author Manuscript
NIH
-PA Author Manuscript
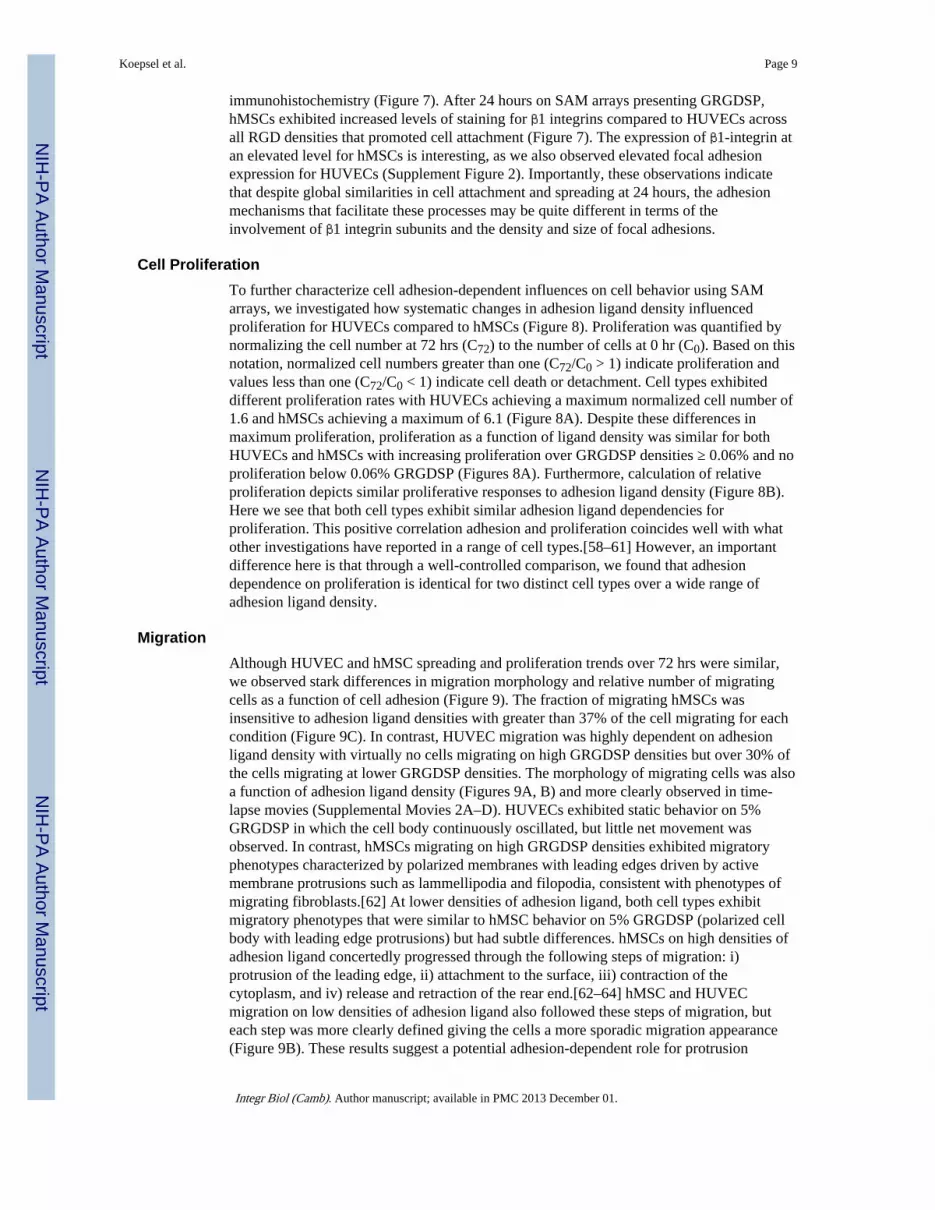
immunohistochemistry (Figure 7). After 24 hours on SAM arrays presenting GRGDSP,hMSCs exhibited increased levels of staining for β1 integrins compared to HUVECs acrossall RGD densities that promoted cell attachment (Figure 7). The expression of β1-integrin atan elevated level for hMSCs is interesting, as we also observed elevated focal adhesionexpression for HUVECs (Supplement Figure 2). Importantly, these observations indicatethat despite global similarities in cell attachment and spreading at 24 hours, the adhesionmechanisms that facilitate these processes may be quite different in terms of theinvolvement of β1 integrin subunits and the density and size of focal adhesions.
Cell ProliferationTo further characterize cell adhesion-dependent influences on cell behavior using SAMarrays, we investigated how systematic changes in adhesion ligand density influencedproliferation for HUVECs compared to hMSCs (Figure 8). Proliferation was quantified bynormalizing the cell number at 72 hrs (C72) to the number of cells at 0 hr (C0). Based on thisnotation, normalized cell numbers greater than one (C72/C0 > 1) indicate proliferation andvalues less than one (C72/C0 < 1) indicate cell death or detachment. Cell types exhibiteddifferent proliferation rates with HUVECs achieving a maximum normalized cell number of1.6 and hMSCs achieving a maximum of 6.1 (Figure 8A). Despite these differences inmaximum proliferation, proliferation as a function of ligand density was similar for bothHUVECs and hMSCs with increasing proliferation over GRGDSP densities ≥ 0.06% and noproliferation below 0.06% GRGDSP (Figures 8A). Furthermore, calculation of relativeproliferation depicts similar proliferative responses to adhesion ligand density (Figure 8B).Here we see that both cell types exhibit similar adhesion ligand dependencies forproliferation. This positive correlation adhesion and proliferation coincides well with whatother investigations have reported in a range of cell types.[58–61] However, an importantdifference here is that through a well-controlled comparison, we found that adhesiondependence on proliferation is identical for two distinct cell types over a wide range ofadhesion ligand density.
MigrationAlthough HUVEC and hMSC spreading and proliferation trends over 72 hrs were similar,we observed stark differences in migration morphology and relative number of migratingcells as a function of cell adhesion (Figure 9). The fraction of migrating hMSCs wasinsensitive to adhesion ligand densities with greater than 37% of the cell migrating for eachcondition (Figure 9C). In contrast, HUVEC migration was highly dependent on adhesionligand density with virtually no cells migrating on high GRGDSP densities but over 30% ofthe cells migrating at lower GRGDSP densities. The morphology of migrating cells was alsoa function of adhesion ligand density (Figures 9A, B) and more clearly observed in time-lapse movies (Supplemental Movies 2A–D). HUVECs exhibited static behavior on 5%GRGDSP in which the cell body continuously oscillated, but little net movement wasobserved. In contrast, hMSCs migrating on high GRGDSP densities exhibited migratoryphenotypes characterized by polarized membranes with leading edges driven by activemembrane protrusions such as lammellipodia and filopodia, consistent with phenotypes ofmigrating fibroblasts.[62] At lower densities of adhesion ligand, both cell types exhibitmigratory phenotypes that were similar to hMSC behavior on 5% GRGDSP (polarized cellbody with leading edge protrusions) but had subtle differences. hMSCs on high densities ofadhesion ligand concertedly progressed through the following steps of migration: i)protrusion of the leading edge, ii) attachment to the surface, iii) contraction of thecytoplasm, and iv) release and retraction of the rear end.[62–64] hMSC and HUVECmigration on low densities of adhesion ligand also followed these steps of migration, buteach step was more clearly defined giving the cells a more sporadic migration appearance(Figure 9B). These results suggest a potential adhesion-dependent role for protrusion
Koepsel et al. Page 9
Integr Biol (Camb). Author manuscript; available in PMC 2013 December 01.
NIH
-PA Author Manuscript
NIH
-PA Author Manuscript
NIH
-PA Author Manuscript
dynamics, with more fan or sheet-like protrusions (lammellipodia) at high RGD densities,but more pronounced spike-like protrusions (filopodia) at low density. Changes in migratoryphenotypes also corresponded to changes in migration speed, with hMSCs exhibitingmaximal migrations speeds below 1.67 % GRGDSP (Figure 9D). Interestingly, HUVECs on0.06% GRGDSP (the only condition with a significant number of cells to track for speed)exhibited migration speeds similar to those observed for hMSCs. This change in migrationmorphology and speed is similar to recent work in which fish keratocytes, a modelmigratory cell type, exhibited two distinct migration regimes when cultured on surfaces withvaried densities of RGD.[65] Here, we see qualitative evidence of differences in migrationphenotypes in two primary human cell types, however a more thorough investigation isrequired to decipher potential differences in migratory mechanisms with respect to adhesionligand density.
Adaptability of SAM arrays to various human cell typesThe SAM array platform described here affords enhanced throughput experimentalmethodologies that not only enable screening a large set of experimental variables, but alsodirect comparison of multiple cell types. In addition to the carbodiimide chemistries used inthis work for peptide immobilization, the SAM array fabrication process described here isalso amenable to other immobilization chemistries such as copper catalyzed azide-alkynecycloadditions previously used in our lab[5, 6] (data not shown) offering several strategiesfor immobilization of a range of different biomolecules (i.e. peptides, nucleic acids,polysaccharides). To date, we have successfully used GRGDSP SAM arrays with primary,immortalized, and pluripotent cell types (Figure 10). Taken together, we demonstrate thatSAM arrays provide a flexible strategy for biomolecule immobilization that is compatiblewith several cell types and has the potential to probe a wide variety of fundamentalbiological questions aimed at deconstructing the influence of the microenvironment on cellfunction.
Implications of similarities between cell typesNumerous studies have linked attachment, spreading, proliferation, and migration to changesin adhesion and have identified strong correlations between them for a given cell type[2, 4,40, 50, 58–61, 66–70], yet comparisons between cell types as a function of systematicallyvaried adhesion[53] ligand density have not typically been investigated. Direct comparisonbetween hMSC and HUVEC attachment and spreading using SAM arrays exposed severalsimilarities between these cell types that would not necessarily be easily predicted. Forexample, initial attachment and spreading at 24 hrs were nearly identical for both cell types,despite substantial differences in cytoskeletal structure (Figures 4–6) and expression of focaladhesions (Supplement Figure 2) and β1-integrin (Figure 7). One possible reason for thesesimilarities may be that both cell types recover from trypsinization at similar rates. Previouswork has shown that buffer conditions and duration of trypsinization significantly impactHUVEC spreading and attachment dynamics over 24 hrs and that cell attachment wasdependent on synthesis of new integrins.[43] Therefore, although we observed differences inβ1 integrin expression (Figure 7), the rates at which other integrins are synthesizedfollowing trypsinization may be similar leading to similar attachment and projected cellareas at 24 hrs. We speculate that after this initial recovery phase, cell behavior may beregulated by additional, perhaps more cell type-dependent, mechanisms that promote theobserved differences in spreading behavior at 72 hrs. However, the relative dependence ofspreading on ligand density at 72 hrs remains similar to that observed at 24 hrs.
Analogous to trends observed for attachment and spreading, proliferation for both cell typesexhibited similar dependencies on RGDSP (Figure 8A). Further, when relative proliferationis compared to relative spreading, both HUVECs and hMSCs exhibit a 1:1 correlation
Koepsel et al. Page 10
Integr Biol (Camb). Author manuscript; available in PMC 2013 December 01.
NIH
-PA Author Manuscript
NIH
-PA Author Manuscript
NIH
-PA Author Manuscript
between spreading and proliferation (Figure 8C), suggesting a similar fundamentalrelationship between these properties across two distinct cell types. In a landmark paper,Folkman and colleagues used poly(2-hydroxyethyl methacrylate) coatings to control theextent to which bovine aortic endothelial cells (BAECs) spread on culture surfaces andfound that proliferation exhibited a positive correlation with cell spreading.[71]Additionally, Ingber and co-workers observed a similar positive correlation between bovinecapillary endothelial cell spreading and proliferation when fibronectin, an extracellularmatrix protein that contains the GRGDSP motif, was adsorbed onto polystyrene surfaces atvaried densities.[40] Since these studies, a range of other studies have investigated thisrelationship [58–61], including approaches that explicitly defined endothelial cell spreadingusing microscale adhesive islands, and implicated cell spreading is the dominating factorinfluencing proliferation.[67–70] The observations in the current manuscript are consistentwith these previous observations of endothelial cell behavior. While there are several studiesinvestigating the relationship between endothelial cell spreading and proliferation, there hasbeen little investigation of this effect in hMSCs. Instead, prior studies have focused oncorrelating changes in cell shape and projected cell area to hMSC differentiation downosteogenic, adipogenic, myogenic, chondrogenic, and neurogenic lineages.[45–51] Here weobserve clear correlations between spreading and proliferation indicating that changes inhMSC proliferation in response to a given cell culture substrate may also need to beconsidered. In addition to identification of this relationship in hMSCs, we believe this is thefirst example in which the influence of cell spreading on proliferation for two distinctprimary human cell types has been shown to follow identical trends, a result that suggests asimilar fundamental adhesion-dependent mechanism.
While attachment and spreading follow similar trends for HUVECs and hMSCs, migrationwas significantly different for several RGD densities. Specifically, at RGD densities above0.06%, a higher fraction of hMSCs were motile and had increased migration speedcompared to HUVECs (Figure 9C–D), a result that may be correlated to differences inexpression of integrins (Figure 7) and focal adhesions (Suppliment Figure 2). Focaladhesions play an important role for migration[72], but maturation leads to a more stationaryphenotype [73–76]. Many previous studies have implicated β1 integrin-containingheterodimers as regulators of cell migration [77, 78]. Additionally, while the increased β1integrin expression observed for hMSCs may play a role in the increased migratoryphenotype compared to HUVECs, there are several integrins that could facilitate motilityand thus further investigation will be required to better understand the specific role forintegrins on RGD-SAMs.
The clear change in HUVEC behavior from static to migratory phenotype at 0.06%GRGDSP (Figure 9C) coincides with several other observations in this work. In particular,the observed induction of migration at 0.06% GRGDSP corresponds with changes incytoskeletal and focal adhesion organization observed in HUVECs at low adhesion liganddensities where cells take on a more elongated phenotype (Figure 5). Furthermore, 0.06%GRGDSP also appears to be a transition point for HUVEC proliferation; above 0.06%HUVECs proliferate to varied extents and below 0.06% HUVECs detach and/or die (Figure8). Therefore, this suggests that HUVECs change between migratory and proliferativephenotypes when cultured on GRGDSP presenting surfaces, while hMSCs may not exhibitthe phenomenon. The ECM-dependent migration data may have implications for function ofthese cell types in vivo. hMSCs and endothelial cells can each migrate into sites of injury,and the changing ECM conditions during wound healing may significantly influence thistype of cell infiltration into a wound site.[79, 80] In addition, recent discoveries that hMSCsexpress markers that are similar to pericytes suggest that these two cell types can migrate tosimilar locations during tissue development and maintenance.[81–83] Further analyses ofECM-dependent migration of these cell types in 3-D and further insights into the ontogeny
Koepsel et al. Page 11
Integr Biol (Camb). Author manuscript; available in PMC 2013 December 01.
NIH
-PA Author Manuscript
NIH
-PA Author Manuscript
NIH
-PA Author Manuscript
of hMSCs in future studies will help to illuminate the importance of their ECM-dependentmigration. Regardless, these results further implicate the adhesive state of a cell as a majordeterminant of cell behavior and highlight the utility of the SAM arrays as a means tointerrogate these dependencies.
In summary, here we used a chemically-defined array-based platform to report the influenceof cell adhesion ligand density on primary human cell behavior. Our results demonstratedthat multiple fundamental cellular properties (attachment, spreading, and proliferation) fortwo distinct primary human cell types (HUVECs and hMSCs) followed virtually identicaltrends across a wide range of cell adhesion conditions. This result was unexpected, as onewould generally predict that distinct cell lineages would display very different responses tothe extracellular environment. However, a series of recent studies suggest an important linkbetween endothelial cells and mesenchymal stem cells. Recent in vivo studies suggest thathMSCs may represent pericytes that surround the endothelium in blood vessels. [81–83] Inaddition, prior in vitro studies have demonstrated that hMSCs can differentiate into anendothelial cell phenotype[84], and HUVECs can transform into an hMSC-like phenotype.[85, 86] While the goal here was not to investigate these phenotypic transitions, emergingevidence suggests their important role in several diseases including fibrosis and heterotopicossification[83, 85, 86]. These prior studies, coupled with the quantitative similaritiesobserved in our current study, suggest interesting phenotypic similarities between thesedistinct cell lineages, and motivate further discovery-based screening to characterizephenotypic similarities and ECM dependencies.
Supplementary MaterialRefer to Web version on PubMed Central for supplementary material.
AcknowledgmentsThe authors would like to acknowledge funding from the National Institutes of Health (R01HL093282 and theBiotechnology Training Program NIGMS 5 T32GM08349) and the National Science Foundation (DMR 0906123).Fluorescent scans were obtained using a GE Healthcare Typhoon Trio Variable Mode Imager at the ScientificInstrumentation Facility of the UW Carbone Cancer Center, Madison, WI.
References1. Dubiel EA, Martin Y, Vermette P. Bridging the Gap Between Physicochemistry and Interpretation
Prevalent in Cell-Surface Interactions. Chemical Reviews. 2011; 111(4):2900–2936. [PubMed:21319750]
2. Mrksich M. Using self-assembled monolayers to model the extracellular matrix. Acta Biomaterialia.2009; 5(3):832–841. [PubMed: 19249721]
3. Hudalla GA, Murphy WL. Chemically well-defined self-assembled monolayers for cell culture:toward mimicking the natural ECM. Soft Matter. 2011; 7(20):9561–9571.
4. Mrksich M. A surface chemistry approach to studying cell adhesion. Chemical Society Reviews.2000; 29(4):267–273.
5. Hudalla GA, Murphy WL. Immobilization of peptides with distinct biological activities onto stemcell culture substrates using orthogonal chemistries. Langmuir. 2010; 26(9):6449–56. [PubMed:20353153]
6. Hudalla GA, Murphy WL. Using “click” chemistry to prepare SAM substrates to study stem celladhesion. Langmuir. 2009; 25(10):5737–46. [PubMed: 19326875]
7. Koepsel JT, Murphy WL. Patterning discrete stem cell culture environments via localized self-assembled monolayer replacement. Langmuir. 2009; 25(21):12825–34. [PubMed: 19856996]
8. Hudalla GA, Koepsel JT, Murphy WL. Surfaces that sequester serum-borne heparin amplify growthfactor activity. Adv Mater. 2011; 23(45):5415–8. [PubMed: 22028244]
Koepsel et al. Page 12
Integr Biol (Camb). Author manuscript; available in PMC 2013 December 01.
NIH
-PA Author Manuscript
NIH
-PA Author Manuscript
NIH
-PA Author Manuscript
9. Hudalla GA, et al. Harnessing endogenous growth factor activity modulates stem cell behavior.Integr Biol (Camb). 2011; 3(8):832–42. [PubMed: 21720642]
10. Pierschbacher MD, Ruoslahti E. Cell Attachment Activity of Fibronectin Can Be Duplicated bySmall Synthetic Fragments of the Molecule. Nature. 1984; 309(5963):30–33. [PubMed: 6325925]
11. Ruoslahti E. RGD and other recognition sequences for integrins. Annual Review of Cell andDevelopmental Biology. 1996; 12:697–715.
12. Ruoslahti E, Pierschbacher MD. New Perspectives in Cell-Adhesion - Rgd and Integrins. Science.1987; 238(4826):491–497. [PubMed: 2821619]
13. Aird WC. Spatial and temporal dynamics of the endothelium. J Thromb Haemost. 2005; 3(7):1392–406. [PubMed: 15892866]
14. Bachetti T, Morbidelli L. Endothelial cells in culture: a model for studying vascular functions.Pharmacol Res. 2000; 42(1):9–19. [PubMed: 10860629]
15. Cines DB, et al. Endothelial cells in physiology and in the pathophysiology of vascular disorders.Blood. 1998; 91(10):3527–61. [PubMed: 9572988]
16. Krishnaswamy G, et al. Human endothelium as a source of multifunctional cytokines: molecularregulation and possible role in human disease. J Interferon Cytokine Res. 1999; 19(2):91–104.[PubMed: 10090394]
17. Michiels C. Endothelial cell functions. J Cell Physiol. 2003; 196(3):430–43. [PubMed: 12891700]
18. Caplan AI, Bruder SP. Mesenchymal stem cells: building blocks for molecular medicine in the 21stcentury. Trends Mol Med. 2001; 7(6):259–64. [PubMed: 11378515]
19. Deans RJ, Moseley AB. Mesenchymal stem cells: biology and potential clinical uses. ExpHematol. 2000; 28(8):875–84. [PubMed: 10989188]
20. Godara P, Nordon RE, McFarland CD. Mesenchymal stem cells in tissue engineering. Journal ofChemical Technology and Biotechnology. 2008; 83(4):397–407.
21. Kolf CM, Cho E, Tuan RS. Mesenchymal stromal cells. Biology of adult mesenchymal stem cells:regulation of niche, self-renewal and differentiation. Arthritis Res Ther. 2007; 9(1):204. [PubMed:17316462]
22. Krampera M, et al. Mesenchymal stem cells for bone, cartilage, tendon and skeletal muscle repair.Bone. 2006; 39(4):678–683. [PubMed: 16765663]
23. Krampera M, et al. Regenerative and immunomodulatory potential of mesenchymal stem cells.Current Opinion in Pharmacology. 2006; 6(4):435–441. [PubMed: 16777484]
24. Caplan AI. What’s in a name? Tissue Eng Part A. 2010; 16(8):2415–7. [PubMed: 20412005]
25. Prime KL, Whitesides GM. Adsorption of Proteins onto Surfaces Containing End-AttachedOligo(Ethylene Oxide) - a Model System Using Self-Assembled Monolayers. Journal of theAmerican Chemical Society. 1993; 115(23):10714–10721.
26. Gill SC, von Hippel PH. Calculation of protein extinction coefficients from amino acid sequencedata. Analytical Biochemistry. 1989; 182(2):319–326. [PubMed: 2610349]
27. Walker GM, Beebe DJ. A passive pumping method for microfluidic devices. Lab on a Chip. 2002;2(3):131–134. [PubMed: 15100822]
28. Jo BH, et al. Three-dimensional micro-channel fabrication in polydimethylsiloxane (PDMS)elastomer. Journal of Microelectromechanical Systems. 2000; 9(1):76–81.
29. Thibault C, et al. Poly(dimethylsiloxane) Contamination in Microcontact Printing and Its Influenceon Patterning Oligonucleotides. Langmuir. 2007; 23(21):10706–10714. [PubMed: 17803329]
30. Sotiropoulou PA, et al. Characterization of the optimal culture conditions for clinical scaleproduction of human mesenchymal stem cells. Stem Cells. 2006; 24(2):462–71. [PubMed:16109759]
31. Rossner M, Yamada KM. What’s in a picture? The temptation of image manipulation. J Cell Biol.2004; 166(1):11–5. [PubMed: 15240566]
32. Orner BP, et al. Arrays for the combinatorial exploration of cell adhesion. J Am Chem Soc. 2004;126(35):10808–9. [PubMed: 15339142]
33. Roberts C, et al. Using Mixed Self-Assembled Monolayers Presenting RGD and (EG)3OH GroupsTo Characterize Long-Term Attachment of Bovine Capillary Endothelial Cells to Surfaces.Journal of the American Chemical Society. 1998; 120(26):6548–6555.
Koepsel et al. Page 13
Integr Biol (Camb). Author manuscript; available in PMC 2013 December 01.
NIH
-PA Author Manuscript
NIH
-PA Author Manuscript
NIH
-PA Author Manuscript
34. Malinda KM, et al. Identification of laminin alpha1 and beta1 chain peptides active for endothelialcell adhesion, tube formation, and aortic sprouting. FASEB J. 1999; 13(1):53–62. [PubMed:9872929]
35. Ponce ML, et al. Identification of endothelial cell binding sites on the laminin gamma 1 chain. CircRes. 1999; 84(6):688–94. [PubMed: 10189356]
36. Jung JP, et al. Co-assembling peptides as defined matrices for endothelial cells. Biomaterials.2009; 30(12):2400–10. [PubMed: 19203790]
37. Grant DS, et al. Interaction of endothelial cells with a laminin A chain peptide (SIKVAV) in vitroand induction of angiogenic behavior in vivo. J Cell Physiol. 1992; 153(3):614–25. [PubMed:1280280]
38. Frith JE, et al. Tailored integrin-extracellular matrix interactions to direct human mesenchymalstem cell differentiation. Stem Cells Dev. 2012; 21(13):2442–56. [PubMed: 22455378]
39. Geiger B, et al. Vinculin, an intracellular protein localized at specialized sites where microfilamentbundles terminate at cell membranes. Proceedings of the National Academy of Sciences of theUnited States of America-Biological Sciences. 1980; 77(7):4127–4131.
40. Ingber DE, et al. Cell shape, cytoskeletal mechanics, and cell cycle control in angiogenesis. Journalof Biomechanics. 1995; 28(12):1471–1484. [PubMed: 8666587]
41. Kopp PM, et al. Studies on the morphology and spreading of human endothelial cells define keyinter- and intramolecular interactions for talin1. European Journal of Cell Biology. 2010; 89(9):661–673. [PubMed: 20605055]
42. Stroka KM, Aranda-Espinoza H. Effects of Morphology vs. Cell-Cell Interactions on EndothelialCell Stiffness. Cell Mol Bioeng. 2011; 4(1):9–27. [PubMed: 21359128]
43. Brown MA, et al. The use of mild trypsinization conditions in the detachment of endothelial cellsto promote subsequent endothelialization on synthetic surfaces. Biomaterials. 2007; 28(27):3928–3935. [PubMed: 17570483]
44. Bischoff J. Cell adhesion and angiogenesis. J Clin Invest. 1997; 100(11 Suppl):S37–9. [PubMed:9413399]
45. McBeath R, et al. Cell shape, cytoskeletal tension, and RhoA regulate stem cell lineagecommitment. Dev Cell. 2004; 6(4):483–95. [PubMed: 15068789]
46. Engler AJ, et al. Matrix elasticity directs stem cell lineage specification. Cell. 2006; 126(4):677–89. [PubMed: 16923388]
47. Rowlands AS, George PA, Cooper-White JJ. Directing osteogenic and myogenic differentiation ofMSCs: interplay of stiffness and adhesive ligand presentation. Am J Physiol Cell Physiol. 2008;295(4):C1037–44. [PubMed: 18753317]
48. Gao L, McBeath R, Chen CS. Stem cell shape regulates a chondrogenic versus myogenic fatethrough Rac1 and N-cadherin. Stem Cells. 2010; 28(3):564–72. [PubMed: 20082286]
49. Kilian KA, et al. Geometric cues for directing the differentiation of mesenchymal stem cells. ProcNatl Acad Sci U S A. 2010; 107(11):4872–7. [PubMed: 20194780]
50. Frith JE, Mills RJ, Cooper-White JJ. Lateral spacing of adhesion peptides influences humanmesenchymal stem cell behaviour. J Cell Sci. 2012
51. Kilian KA, Mrksich M. Directing Stem Cell Fate by Controlling the Affinity and Density ofLigand-Receptor Interactions at the Biomaterials Interface. Angew Chem Int Ed Engl. 2012
52. Short SM, Talbott GA, Juliano RL. Integrin-mediated signaling events in human endothelial cells.Mol Biol Cell. 1998; 9(8):1969–80. [PubMed: 9693360]
53. Baranska P, et al. Expression of Integrins and Adhesive Properties of Human Endothelial Cell LineEA. hy 926. Cancer Genomics - Proteomics. 2005; 2(5):265–269.
54. Prowse AB, et al. Stem cell integrins: implications for ex-vivo culture and cellular therapies. StemCell Res. 2010; 6(1):1–12. [PubMed: 21075697]
55. Danen EHJ, Yamada KM. Fibronectin, integrins, and growth control. Journal of CellularPhysiology. 2001; 189(1):1–13. [PubMed: 11573199]
56. Ruoslahti E. Integrins. Journal of Clinical Investigation. 1991; 87(1):1–5. [PubMed: 1985087]
57. Ruoslahti E. Fibronectin and Its Receptors. Annual Review of Biochemistry. 1988; 57:375–413.
Koepsel et al. Page 14
Integr Biol (Camb). Author manuscript; available in PMC 2013 December 01.
NIH
-PA Author Manuscript
NIH
-PA Author Manuscript
NIH
-PA Author Manuscript

58. Aplin AE, Howe AK, Juliano RL. Cell adhesion molecules, signal transduction and cell growth.Curr Opin Cell Biol. 1999; 11(6):737–44. [PubMed: 10600702]
59. Stupack DG, Cheresh DA. Get a ligand, get a life: integrins, signaling and cell survival. J Cell Sci.2002; 115(Pt 19):3729–38. [PubMed: 12235283]
60. Schwartz MA, Assoian RK. Integrins and cell proliferation: regulation of cyclin-dependent kinasesvia cytoplasmic signaling pathways. J Cell Sci. 2001; 114(Pt 14):2553–60. [PubMed: 11683383]
61. Bacakova L, et al. Modulation of cell adhesion, proliferation and differentiation on materialsdesigned for body implants. Biotechnol Adv. 2011; 29(6):739–67. [PubMed: 21821113]
62. Mogilner A, Keren K. The shape of motile cells. Curr Biol. 2009; 19(17):R762–71. [PubMed:19906578]
63. Lauffenburger DA, Horwitz AF. Cell migration: A physically integrated molecular process. Cell.1996; 84(3):359–369. [PubMed: 8608589]
64. Ridley AJ, et al. Cell migration: integrating signals from front to back. Science. 2003; 302(5651):1704–9. [PubMed: 14657486]
65. Barnhart EL, et al. An adhesion-dependent switch between mechanisms that determine motile cellshape. PLoS Biol. 2011; 9(5):e1001059. [PubMed: 21559321]
66. Mrksich M. Using self-assembled monolayers to understand the biomaterials interface. CurrentOpinion in Colloid & Interface Science. 1997; 2(1):83–88.
67. Huang S, Chen CS, Ingber DE. Control of cyclin D1, p27(Kip1), and cell cycle progression inhuman capillary endothelial cells by cell shape and cytoskeletal tension. Molecular Biology of theCell. 1998; 9(11):3179–3193. [PubMed: 9802905]
68. Huang S, Ingber DE. Shape-dependent control of cell growth, differentiation, and apoptosis:Switching between attractors in cell regulatory networks. Experimental Cell Research. 2000;261(1):91–103. [PubMed: 11082279]
69. Thomas CH, et al. Surfaces designed to control the projected area and shape of individual cells.Journal of Biomechanical Engineering-Transactions of the Asme. 1999; 121(1):40–48.
70. Chen CS, et al. Geometric control of cell life and death. Science. 1997; 276(5317):1425–8.[PubMed: 9162012]
71. Folkman J, Moscona A. Role of Cell-Shape in Growth-Control. Nature. 1978; 273(5661):345–349.[PubMed: 661946]
72. Burridge K, et al. Focal adhesions: transmembrane junctions between the extracellular matrix andthe cytoskeleton. Annu Rev Cell Biol. 1988; 4:487–525. [PubMed: 3058164]
73. Couchman JR, Rees DA. The behaviour of fibroblasts migrating from chick heart explants:changes in adhesion, locomotion and growth, and in the distribution of actomyosin andfibronectin. Journal of Cell Science. 1979 Oct.39:149–165. [PubMed: 575139]
74. Herman IM, Crisona NJ, Pollard TD. Relation between cell activity and the distribution ofcytoplasmic actin and myosin. Journal of Cell Biology. 1981; 90(1):84–91. [PubMed: 7019223]
75. Couchman JR, et al. Fibronectin has a dual role in locomotion and anchorage of primary chickfibroblasts and can promote entry into the division cycle. Journal of Cell Biology. 1982; 93(2):402–410. [PubMed: 6178746]
76. Kolega J, et al. Rapid cellular translocation is related to close contacts formed between variouscultured cells and their substrata. Journal of Cell Science. 1982 Apr.54:23–34. [PubMed: 7076724]
77. Huttenlocher A, Horwitz AR. Integrins in Cell Migration. Cold Spring Harbor Perspectives inBiology. 2011; 3(9)
78. Huttenlocher A, Horwitz AR. Integrins in cell migration. Cold Spring Harb Perspect Biol. 2011;3(9):a005074. [PubMed: 21885598]
79. Karp JM, Leng Teo GS. Mesenchymal stem cell homing: the devil is in the details. Cell Stem Cell.2009; 4(3):206–16. [PubMed: 19265660]
80. Lamalice L, Le Boeuf F, Huot J. Endothelial cell migration during angiogenesis. Circ Res. 2007;100(6):782–94. [PubMed: 17395884]
81. Crisan M, et al. A perivascular origin for mesenchymal stem cells in multiple human organs. CellStem Cell. 2008; 3(3):301–13. [PubMed: 18786417]
Koepsel et al. Page 15
Integr Biol (Camb). Author manuscript; available in PMC 2013 December 01.
NIH
-PA Author Manuscript
NIH
-PA Author Manuscript
NIH
-PA Author Manuscript

82. Nombela-Arrieta C, Ritz J, Silberstein LE. The elusive nature and function of mesenchymal stemcells. Nat Rev Mol Cell Biol. 2011; 12(2):126–31. [PubMed: 21253000]
83. Bautch VL. Stem cells and the vasculature. Nat Med. 2011; 17(11):1437–43. [PubMed: 22064433]
84. Oswald J, et al. Mesenchymal stem cells can be differentiated into endothelial cells in vitro. StemCells. 2004; 22(3):377–84. [PubMed: 15153614]
85. Medici D, et al. Conversion of vascular endothelial cells into multipotent stem-like cells. Nat Med.2010; 16(12):1400–6. [PubMed: 21102460]
86. Piera-Velazquez S, Li Z, Jimenez SA. Role of endothelial-mesenchymal transition (EndoMT) inthe pathogenesis of fibrotic disorders. Am J Pathol. 2011; 179(3):1074–80. [PubMed: 21763673]
Koepsel et al. Page 16
Integr Biol (Camb). Author manuscript; available in PMC 2013 December 01.
NIH
-PA Author Manuscript
NIH
-PA Author Manuscript
NIH
-PA Author Manuscript

Insight, Innovation, Integration
Insight
Our results indicate that human umbilical vein endothelial cells and human mesenchymalstem cells exhibit previously unrealized similarities in attachment, spreading, andproliferation as a function of cell adhesion ligand density, yet stark differences inmigratory behavior.
Innovation
These studies combined a chemically-defined self-assembled monolayer array platformwith automated time-lapse microscopy to screen for the effects of cell adhesion liganddensity (over several orders of magnitude) on several different cell behaviors.
Integration
Investigation of identical sets of conditions for both cell types using a synthetic,chemically defined array allowed us to (i) rigorously compare behaviors within a singlecell type and (ii) compare behaviors between both cell types to identify links between celladhesion and critical cell behaviors.
Koepsel et al. Page 17
Integr Biol (Camb). Author manuscript; available in PMC 2013 December 01.
NIH
-PA Author Manuscript
NIH
-PA Author Manuscript
NIH
-PA Author Manuscript
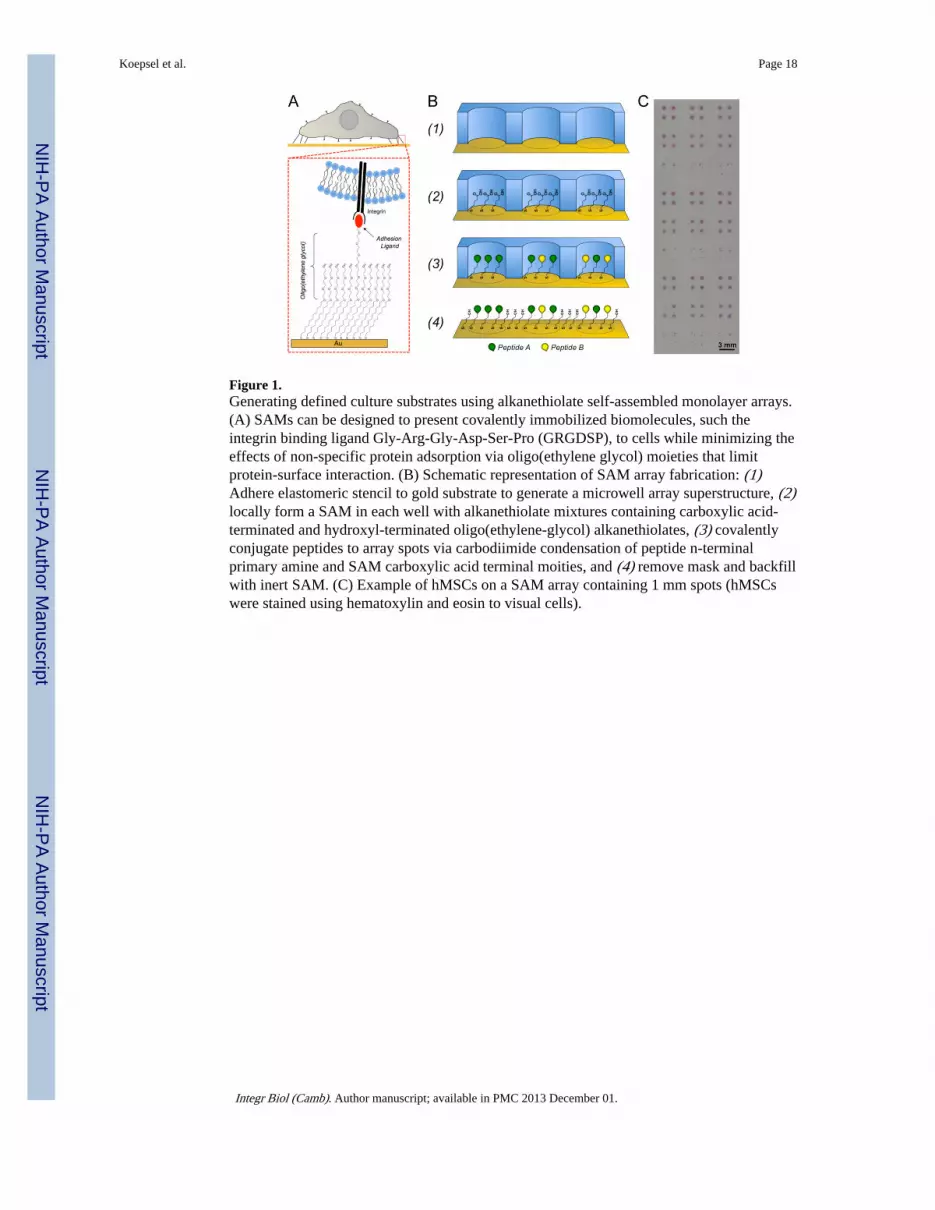
Figure 1.Generating defined culture substrates using alkanethiolate self-assembled monolayer arrays.(A) SAMs can be designed to present covalently immobilized biomolecules, such theintegrin binding ligand Gly-Arg-Gly-Asp-Ser-Pro (GRGDSP), to cells while minimizing theeffects of non-specific protein adsorption via oligo(ethylene glycol) moieties that limitprotein-surface interaction. (B) Schematic representation of SAM array fabrication: (1)Adhere elastomeric stencil to gold substrate to generate a microwell array superstructure, (2)locally form a SAM in each well with alkanethiolate mixtures containing carboxylic acid-terminated and hydroxyl-terminated oligo(ethylene-glycol) alkanethiolates, (3) covalentlyconjugate peptides to array spots via carbodiimide condensation of peptide n-terminalprimary amine and SAM carboxylic acid terminal moities, and (4) remove mask and backfillwith inert SAM. (C) Example of hMSCs on a SAM array containing 1 mm spots (hMSCswere stained using hematoxylin and eosin to visual cells).
Koepsel et al. Page 18
Integr Biol (Camb). Author manuscript; available in PMC 2013 December 01.
NIH
-PA Author Manuscript
NIH
-PA Author Manuscript
NIH
-PA Author Manuscript
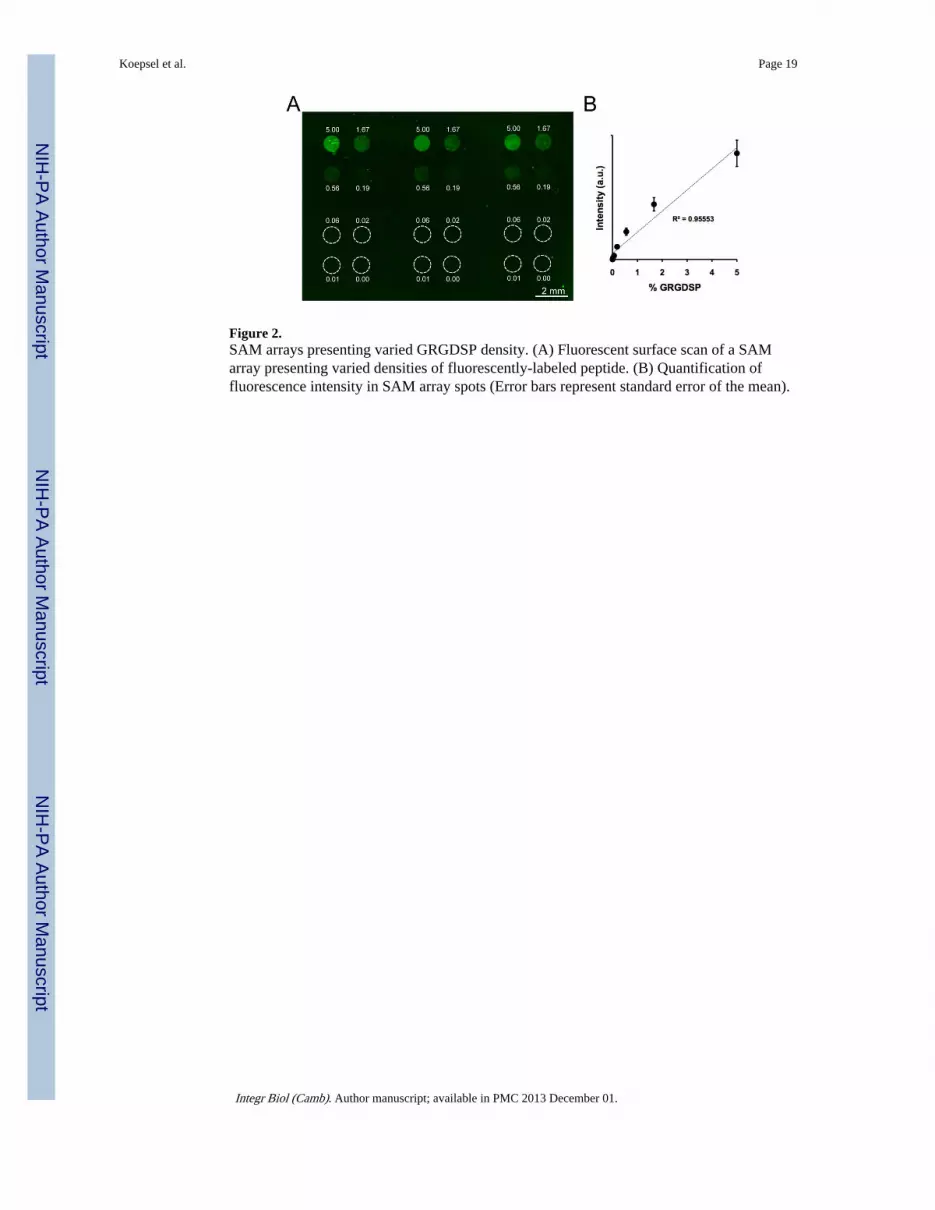
Figure 2.SAM arrays presenting varied GRGDSP density. (A) Fluorescent surface scan of a SAMarray presenting varied densities of fluorescently-labeled peptide. (B) Quantification offluorescence intensity in SAM array spots (Error bars represent standard error of the mean).
Koepsel et al. Page 19
Integr Biol (Camb). Author manuscript; available in PMC 2013 December 01.
NIH
-PA Author Manuscript
NIH
-PA Author Manuscript
NIH
-PA Author Manuscript
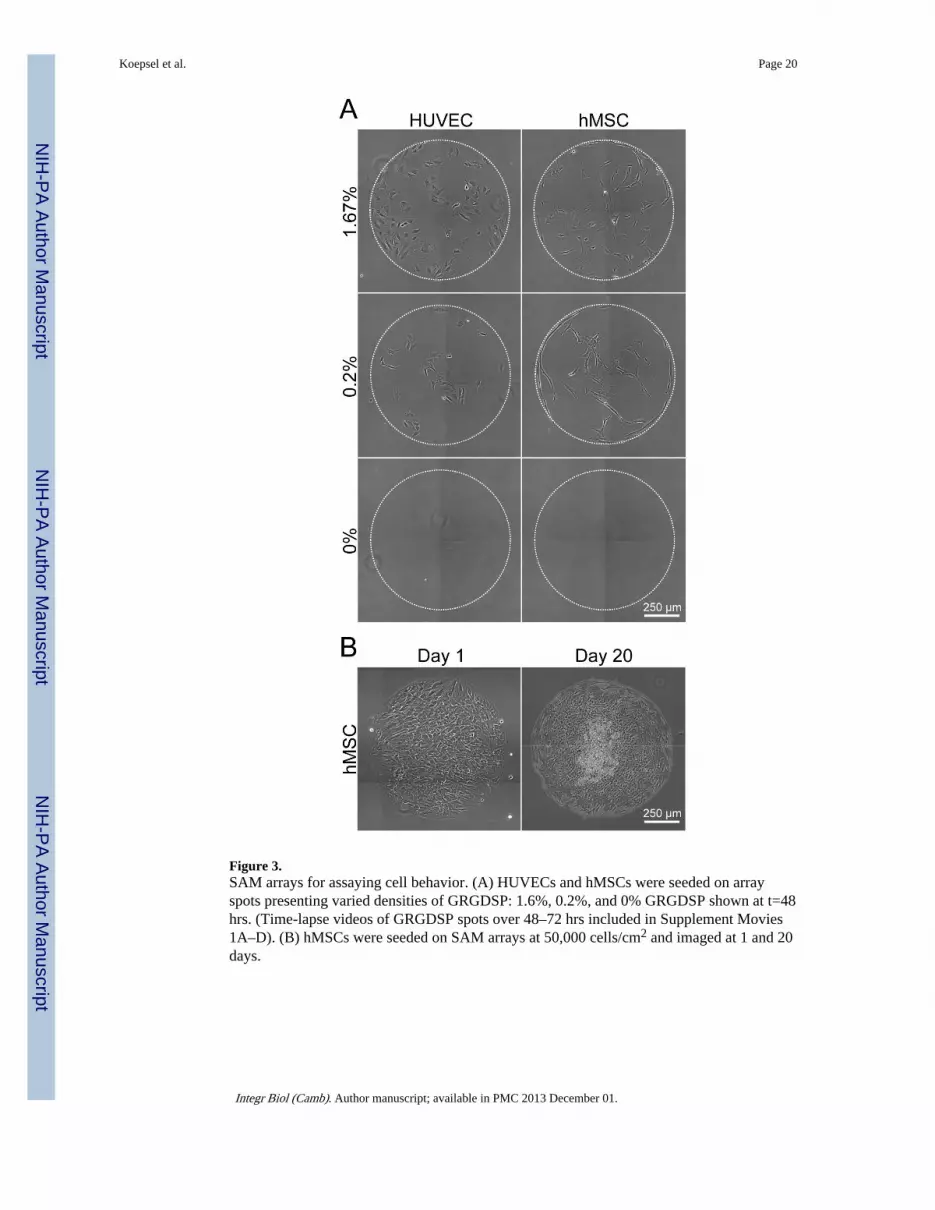
Figure 3.SAM arrays for assaying cell behavior. (A) HUVECs and hMSCs were seeded on arrayspots presenting varied densities of GRGDSP: 1.6%, 0.2%, and 0% GRGDSP shown at t=48hrs. (Time-lapse videos of GRGDSP spots over 48–72 hrs included in Supplement Movies1A–D). (B) hMSCs were seeded on SAM arrays at 50,000 cells/cm2 and imaged at 1 and 20days.
Koepsel et al. Page 20
Integr Biol (Camb). Author manuscript; available in PMC 2013 December 01.
NIH
-PA Author Manuscript
NIH
-PA Author Manuscript
NIH
-PA Author Manuscript
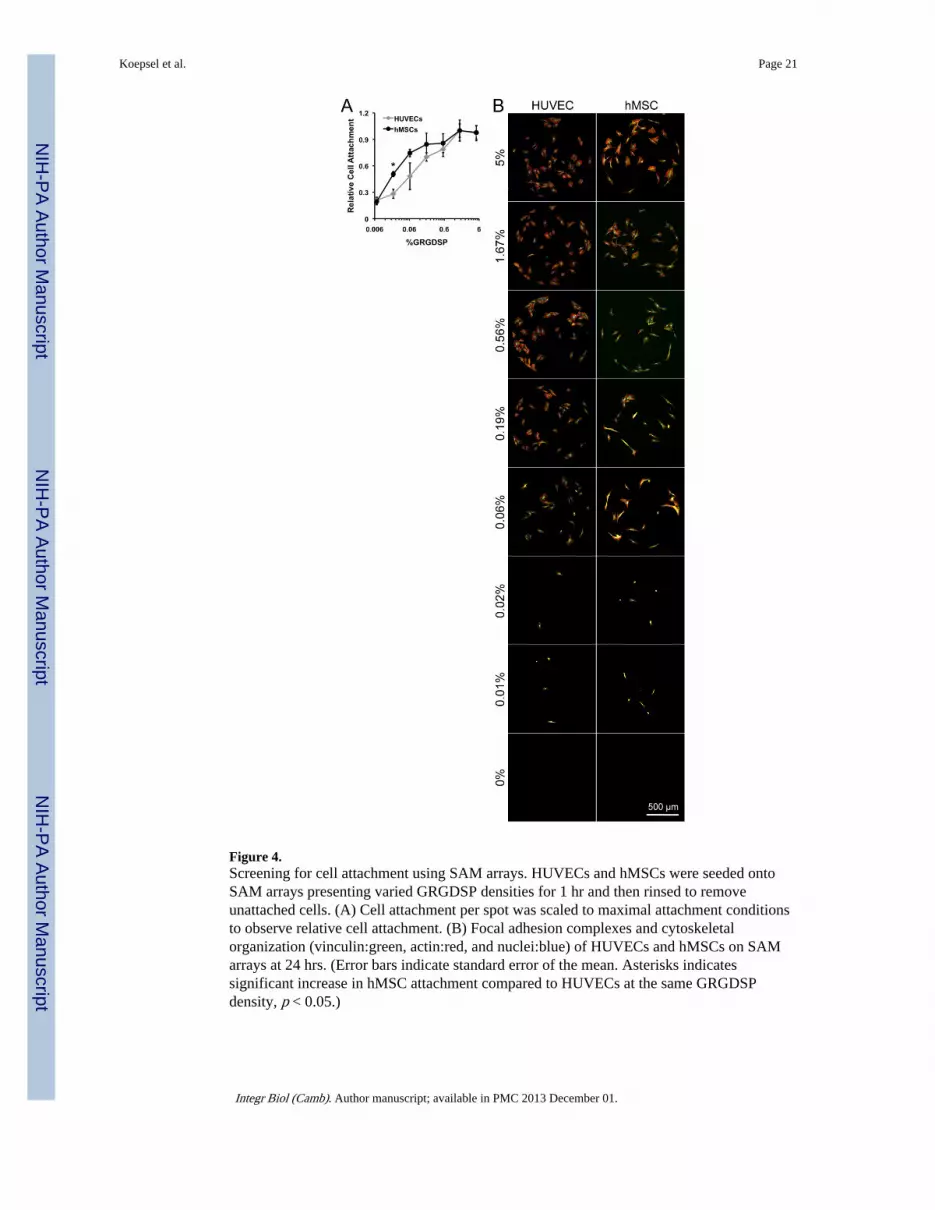
Figure 4.Screening for cell attachment using SAM arrays. HUVECs and hMSCs were seeded ontoSAM arrays presenting varied GRGDSP densities for 1 hr and then rinsed to removeunattached cells. (A) Cell attachment per spot was scaled to maximal attachment conditionsto observe relative cell attachment. (B) Focal adhesion complexes and cytoskeletalorganization (vinculin:green, actin:red, and nuclei:blue) of HUVECs and hMSCs on SAMarrays at 24 hrs. (Error bars indicate standard error of the mean. Asterisks indicatessignificant increase in hMSC attachment compared to HUVECs at the same GRGDSPdensity, p < 0.05.)
Koepsel et al. Page 21
Integr Biol (Camb). Author manuscript; available in PMC 2013 December 01.
NIH
-PA Author Manuscript
NIH
-PA Author Manuscript
NIH
-PA Author Manuscript
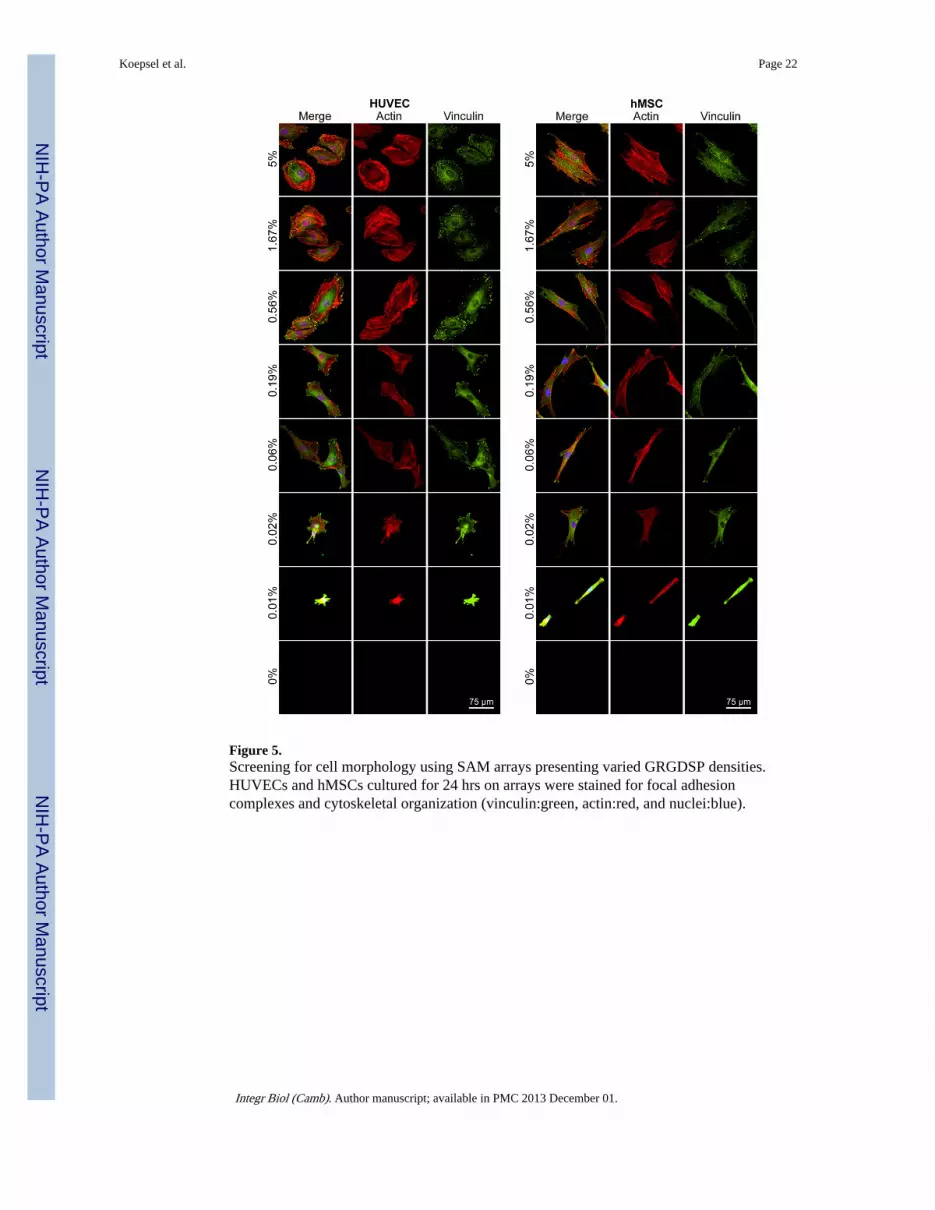
Figure 5.Screening for cell morphology using SAM arrays presenting varied GRGDSP densities.HUVECs and hMSCs cultured for 24 hrs on arrays were stained for focal adhesioncomplexes and cytoskeletal organization (vinculin:green, actin:red, and nuclei:blue).
Koepsel et al. Page 22
Integr Biol (Camb). Author manuscript; available in PMC 2013 December 01.
NIH
-PA Author Manuscript
NIH
-PA Author Manuscript
NIH
-PA Author Manuscript
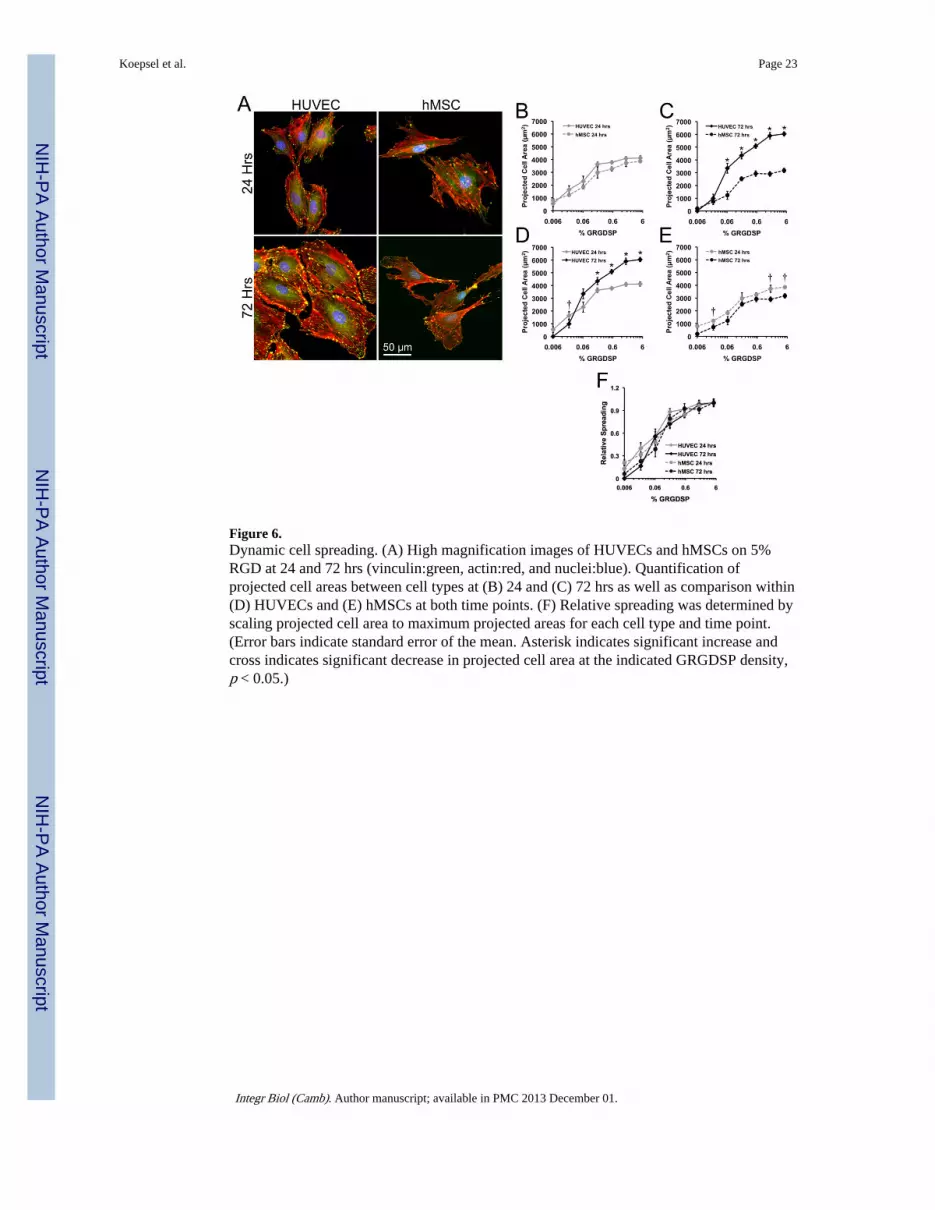
Figure 6.Dynamic cell spreading. (A) High magnification images of HUVECs and hMSCs on 5%RGD at 24 and 72 hrs (vinculin:green, actin:red, and nuclei:blue). Quantification ofprojected cell areas between cell types at (B) 24 and (C) 72 hrs as well as comparison within(D) HUVECs and (E) hMSCs at both time points. (F) Relative spreading was determined byscaling projected cell area to maximum projected areas for each cell type and time point.(Error bars indicate standard error of the mean. Asterisk indicates significant increase andcross indicates significant decrease in projected cell area at the indicated GRGDSP density,p < 0.05.)
Koepsel et al. Page 23
Integr Biol (Camb). Author manuscript; available in PMC 2013 December 01.
NIH
-PA Author Manuscript
NIH
-PA Author Manuscript
NIH
-PA Author Manuscript
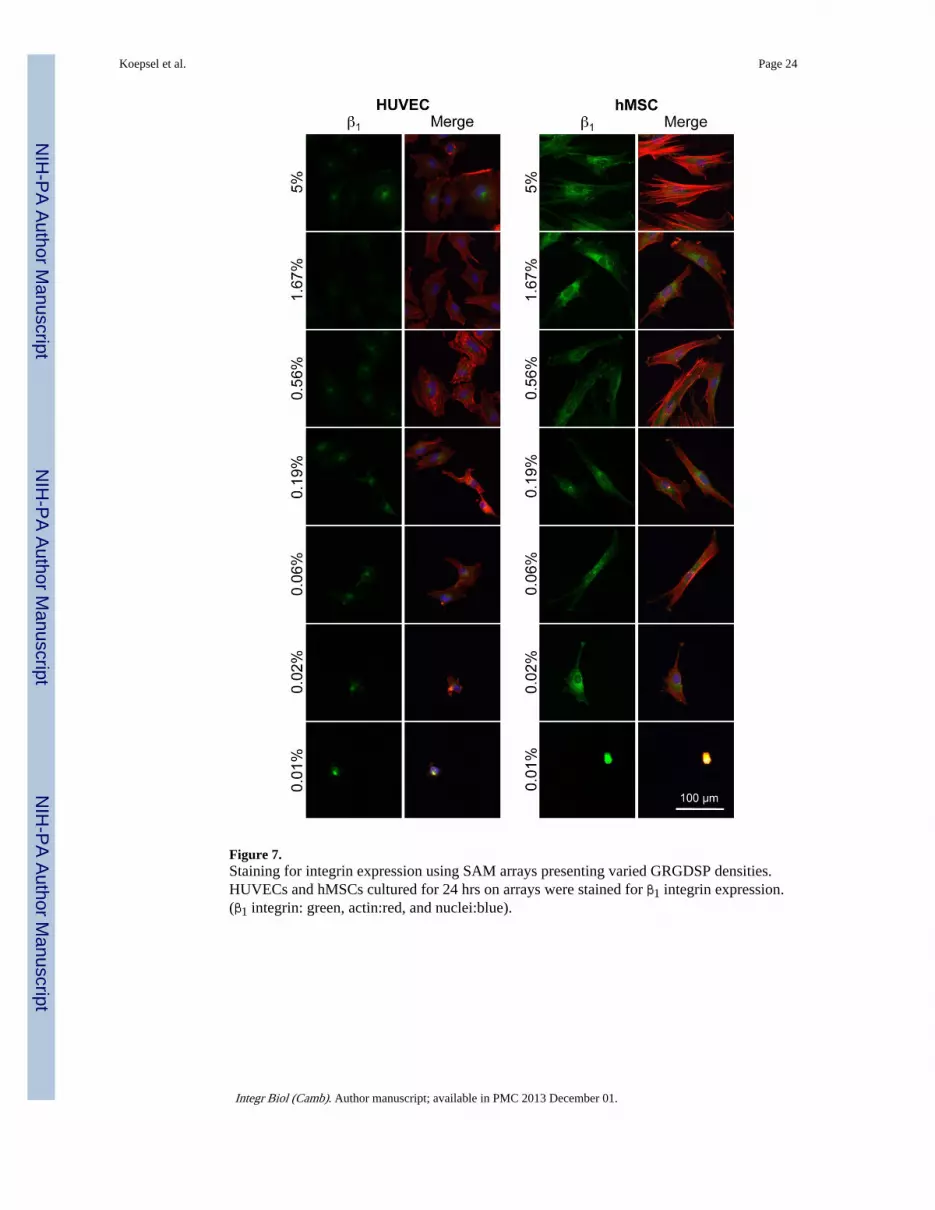
Figure 7.Staining for integrin expression using SAM arrays presenting varied GRGDSP densities.HUVECs and hMSCs cultured for 24 hrs on arrays were stained for β1 integrin expression.(β1 integrin: green, actin:red, and nuclei:blue).
Koepsel et al. Page 24
Integr Biol (Camb). Author manuscript; available in PMC 2013 December 01.
NIH
-PA Author Manuscript
NIH
-PA Author Manuscript
NIH
-PA Author Manuscript
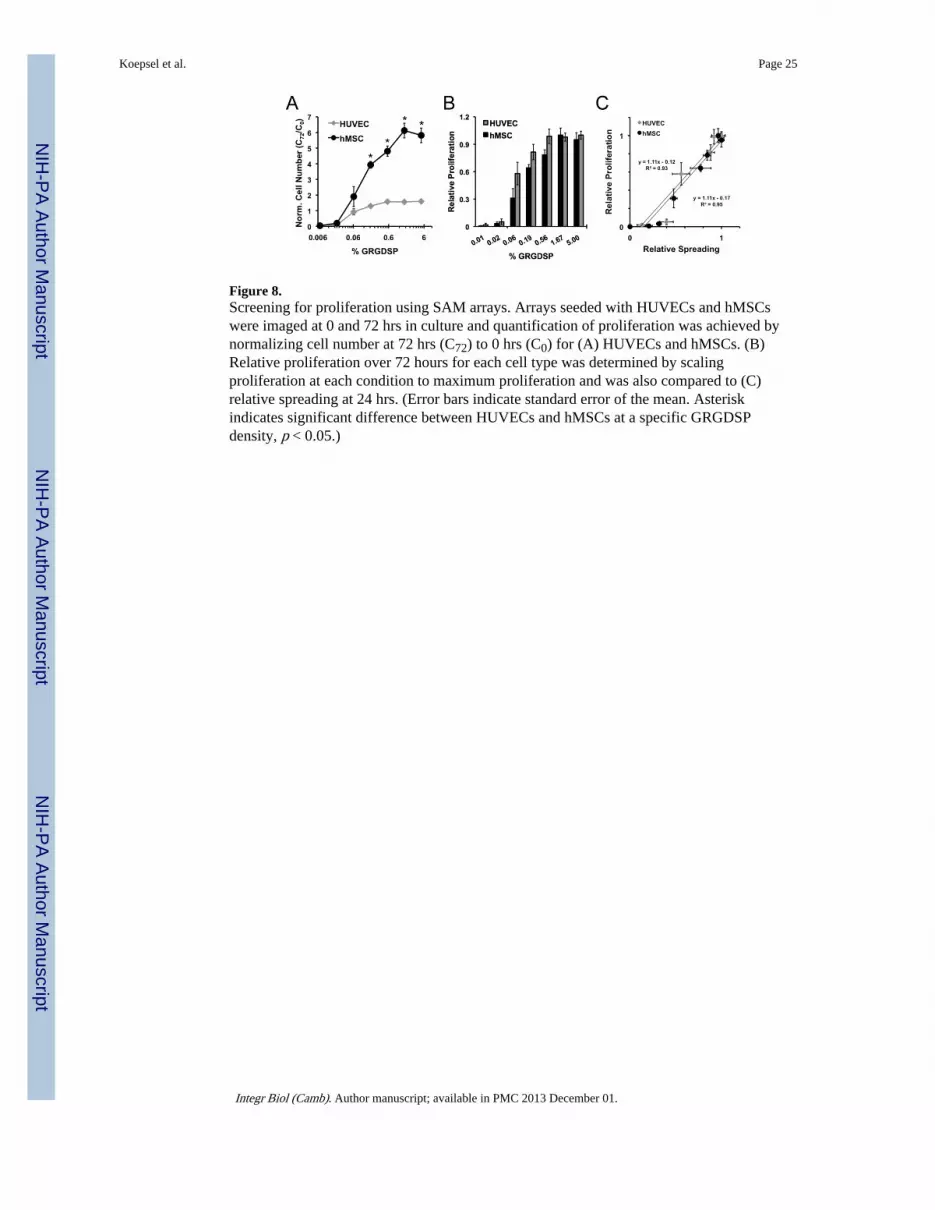
Figure 8.Screening for proliferation using SAM arrays. Arrays seeded with HUVECs and hMSCswere imaged at 0 and 72 hrs in culture and quantification of proliferation was achieved bynormalizing cell number at 72 hrs (C72) to 0 hrs (C0) for (A) HUVECs and hMSCs. (B)Relative proliferation over 72 hours for each cell type was determined by scalingproliferation at each condition to maximum proliferation and was also compared to (C)relative spreading at 24 hrs. (Error bars indicate standard error of the mean. Asteriskindicates significant difference between HUVECs and hMSCs at a specific GRGDSPdensity, p < 0.05.)
Koepsel et al. Page 25
Integr Biol (Camb). Author manuscript; available in PMC 2013 December 01.
NIH
-PA Author Manuscript
NIH
-PA Author Manuscript
NIH
-PA Author Manuscript
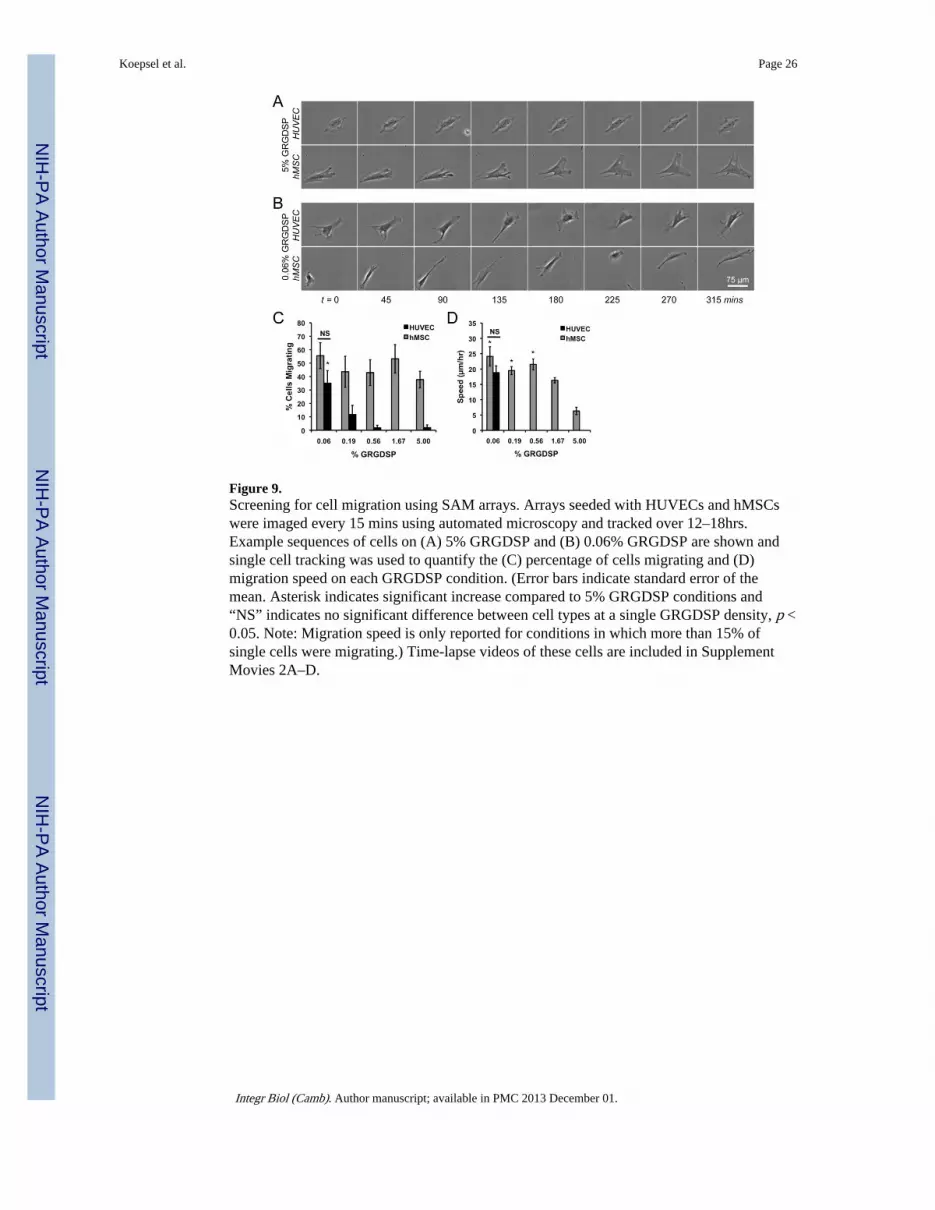
Figure 9.Screening for cell migration using SAM arrays. Arrays seeded with HUVECs and hMSCswere imaged every 15 mins using automated microscopy and tracked over 12–18hrs.Example sequences of cells on (A) 5% GRGDSP and (B) 0.06% GRGDSP are shown andsingle cell tracking was used to quantify the (C) percentage of cells migrating and (D)migration speed on each GRGDSP condition. (Error bars indicate standard error of themean. Asterisk indicates significant increase compared to 5% GRGDSP conditions and“NS” indicates no significant difference between cell types at a single GRGDSP density, p <0.05. Note: Migration speed is only reported for conditions in which more than 15% ofsingle cells were migrating.) Time-lapse videos of these cells are included in SupplementMovies 2A–D.
Koepsel et al. Page 26
Integr Biol (Camb). Author manuscript; available in PMC 2013 December 01.
NIH
-PA Author Manuscript
NIH
-PA Author Manuscript
NIH
-PA Author Manuscript
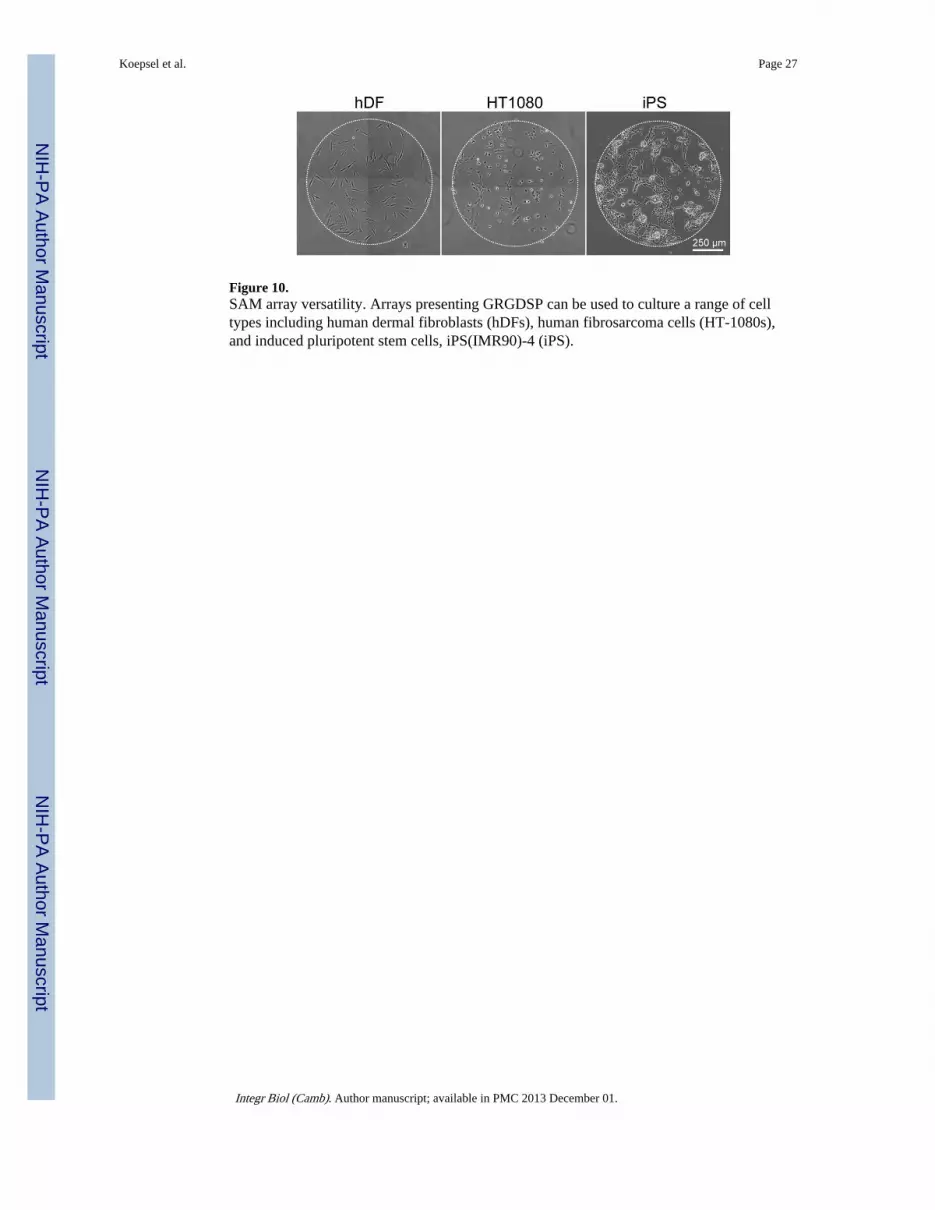
Figure 10.SAM array versatility. Arrays presenting GRGDSP can be used to culture a range of celltypes including human dermal fibroblasts (hDFs), human fibrosarcoma cells (HT-1080s),and induced pluripotent stem cells, iPS(IMR90)-4 (iPS).
Koepsel et al. Page 27
Integr Biol (Camb). Author manuscript; available in PMC 2013 December 01.
NIH
-PA Author Manuscript
NIH
-PA Author Manuscript
NIH
-PA Author Manuscript