
Biosensor signal improvement using current mirror topology ...
A cell-based biosensor system HepG2CDKN1A–DsRed for rapidand simple detection of genotoxic agents
Tanja Blagus a,1, Valerija Zager a,1, Maja Cemazar a,b, Gregor Sersa a, Urska Kamensek a,Bojana Zegura c, Jana Nunic c, Metka Filipic c,n
a Institute of Oncology Ljubljana, Zaloska 2, SI-1000 Ljubljana, Sloveniab Faculty of Health Sciences, University of Primorska, Polje 42, SI-6310 Izola, Sloveniac National Institute of Biology, Vecna pot 111, SI-1000 Ljubljana, Slovenia
a r t i c l e i n f o
Article history:Received 12 February 2014Received in revised form29 April 2014Accepted 2 May 2014Available online 10 May 2014
Keywords:Whole-cell biosensor systemCDKN1A promoterDsRed reporter proteinGenotoxicitySpectrofluorimetry
a b s t r a c t
The regulatory requirements for genotoxicity testing rely on a battery of genotoxicity tests, whichgenerally consist of bacterial and mammalian cell assays for detection of gene mutations andchromosomal aberrations. However, for rapid screening, these methods are not appropriate. We havedeveloped a new cell-based biosensor system that provides rapid and simple detection of genotoxicsubstances. This is based on stable transfection of human hepatoma HepG2 cells with a plasmid thatencodes the red fluorescent protein DsRed2 under the control of the CDKN1A promoter (HepG2CD-KN1A–DsRed cells). As the major downstream target gene of activated TP53, the tumour-suppressorgene CDKN1A is responsible for cell-cycle arrest following DNA damage, and it has been shown to bespecifically up-regulated by genotoxic carcinogens. The assay is optimised for a 96-well microplateformat and spectrofluorimetric quantification of induced DsRed expression. The assay was evaluated bytesting direct-acting and indirect-acting genotoxic compounds with different mechanisms of action,along with non-genotoxic compounds. Out of 25 compounds that are known to be genotoxic in vitro andin vivo, 21 (84%) are detected as positive at non-cytotoxic doses, whereas of 12 compounds notconsidered genotoxic, 11 (92%) are negative. These data indicate the high sensitivity and specificity of ourbiosensor system. Based on its simplicity and sensitivity, this biosensor developed with HepG2CDKN1A–DsRed cells has the potential to become a valuable tool for genotoxicity screening for chemical safetyevaluation, as well as for environmental and occupational monitoring of exposure to genotoxic agentsand their complex mixtures.
& 2014 Elsevier B.V. All rights reserved.
1. Introduction
Exposure to genotoxic compounds is a major health concern, asthese compounds can induce damage to genetic material that isassociated with elevated risk of cancer and other DNA-damage-associated diseases. Therefore, legislation has been establishedthat demands testing of new compounds and products for theirpotential genotoxicity, such as pharmaceuticals, pesticides, foodadditives and cosmetics. The regulatory requirements for geno-toxicity testing rely on a battery of genotoxicity tests, which
generally consist of in-vitro tests for gene mutations in bacteriaand mammalian cells, and in-vivo tests for chromosomal damagein rodent haematopoietic cells (Elespuru et al., 2009). However,these methods are time consuming and expensive, and theyrequire relatively high quantities of the test material. Thus, theyare not suitable for screening purposes when large numbers ofsamples have to be tested in a short period of time; i.e. for newdrug discovery and environmental monitoring.
To overcome these problems, rapid, high-throughput biologicalassays that measure cell responses to induced genetic damage arebeing developed to provide ‘early warning’ of genotoxicity. Manyof these assays are based on the promoter of a DNA-damage-responsive gene as the sensor, which can be fused to a reportergene that codes for a product that can be measured. Bacterialsystems in which genotoxic effects were identified based onchanges in expression of SOS response genes were developedmore than three decades ago (Biran et al., 2010). The sameprinciple was later used for the development of Saccharomycescerevisiae yeast reporter assays in which the RAD54, RAD51 and
Contents lists available at ScienceDirect
journal homepage: www.elsevier.com/locate/bios
Biosensors and Bioelectronics
http://dx.doi.org/10.1016/j.bios.2014.05.0020956-5663/& 2014 Elsevier B.V. All rights reserved.
n Correspondence to: Department of Genetic Toxicology and Cancer Biology,National Institute of Biology, Vecna pot 111, SI-1000 Ljubljana, Slovenia.Tel.: þ386 5 9232861.
E-mail addresses: [email protected] (T. Blagus), [email protected] (V. Zager),[email protected] (M. Cemazar), [email protected] (G. Sersa),[email protected] (U. Kamensek), [email protected] (B. Zegura),[email protected] (J. Nunic), [email protected] (M. Filipic).
1 These authors contributed equally to this study.
Biosensors and Bioelectronics 61 (2014) 102–111

RNR2 promoters were fused to a reporter gene (Afanassiev et al.,2000; Billinton et al., 1998; Walmsley et al., 1997).
In mammalian cells, the tumour-suppressor TP53 has a centralrole in cell responses to DNA damage through its activation of thetranscription of several essential genes that control cell-cyclearrest/DNA repair, and cell senescence, differentiation and apop-tosis (Vogelstein et al., 2000). Several mammalian-cell-basedreporter systems that use TP53-regulated promoters have beendeveloped as sensors of genotoxic stress, including GADD45a(Hastwell et al., 2006; Liu et al., 2009), GADD153 (Zhang et al.,2009), and p53R2 (Mizota et al., 2011; Ohno et al., 2005, 2008;Westerink et al., 2010).
In the present study, we describe the development and validationof a genotoxic biosensor system that is based on human hepatocellularcarcinoma HepG2 cells that are stably transformed with a redfluorescence protein (DsRed2) gene under the control of the cyclin-dependent kinase 1A inhibitor (CDKN1A) promoter. HepG2 cells arechosen as the host cells because they have retained the inducibilityand activities of several phase I and phase II xenobiotic metabolisingenzymes, and they have been shown to be a suitable model fordetection of different classes of indirect-acting genotoxic agents(Knasmuller et al., 2004). HepG2 cells also express the wild-typetumour suppressor TP53 (Bressac et al., 1990), which makes them anappropriate model for detecting P53-regulated responses to DNAdamage at the level of gene transcription and translation (Van Delftet al., 2004). CDKN1A (p21, WAF1, CIP1) is the major downstream targetgene of activated TP53, and it is responsible for cell-cycle arrest andinhibition of DNA replication (Moldovan et al., 2007; Vogelstein et al.,2000). Numerous in-vitro and in-vivo studies have demonstrated thatexposure to genotoxic agents and irradiation can up-regulate theexpression of CDKN1A (Ellinger-Ziegelbauer et al., 2005; Hreljac et al.,2008; Petkovic et al., 2011; Straser et al., 2011; Zegura et al., 2008).These studies have indicated that up-regulation of CDKN1A expressionis a sensitive indicator of cell responses to DNA damage, although theCDKN1A promoter has not been used in reporter assays for genotoxi-city testing so far. In our preliminary study, we transfected HepG2 cellswith a plasmid containing enhanced green fluorescence protein (eGFP)under the control of the CDKN1A promoter; and we demonstrated thatin response to DNA damage induced by direct-acting (i.e. methylmethanesulfonate [MMS], cisplatin [CDDP]) and indirect-acting (benzo(a)pyrene [BaP]) genotoxic compounds, transcription of the CDKN1Apromoter was activated, which led to concurrent accumulation ofeGFP (Zager et al., 2010). However, we noted difficulties in thequantification of the GFP fluorescence that was measured spectro-fluorimetrically. This was due to the overlap of the fluorescencespectrum of GFP with endogenous autofluorescence that could arisefrom cell and growth media components, and also from the com-pounds tested (e.g. with BaP). This is not a problem when thefluorescence signal can be measured using fluorescence microscopyor flow cytometry. However, when the GFP fluorescence is measuredspectrofluorimetrically, this can lead to low signal-to-noise ratios andrestrictions to the detection sensitivity (Billinton and Knight, 2001).Therefore, for the present study, we transfected HepG2 cells with aplasmid in which we replaced the eGFP reporter gene with that ofDsRed2, which has excitation/emission in the red region of thespectrum that does not overlap with cell autofluorescence. Theperformance of this system was then evaluated by testing a series ofnon-genotoxic and genotoxic compounds.
2. Materials and methods
2.1. Cell line
The human hepatocellular carcinoma HepG2 cell line was obtainedfrom the European Collection of Animal Cell Cultures (Wiltshire, UK).
The HepG2 cells were grown in Minimal Essential Medium (MEM, LifeTechnologies, Gibco, Paisley, Grand Island, USA) without phenol redand supplemented with 10% heat-inactivated foetal bovine serum (LifeTechnologies), 1% non-essential amino-acid solution, and 2mML-glutamine (Sigma, St. Louis, USA). The cells were routinely sub-cultured twice per week, and were maintained in a humidifiedatmosphere with 5% CO2 at 37 1C.
2.2. Plasmid construction and cell transfection
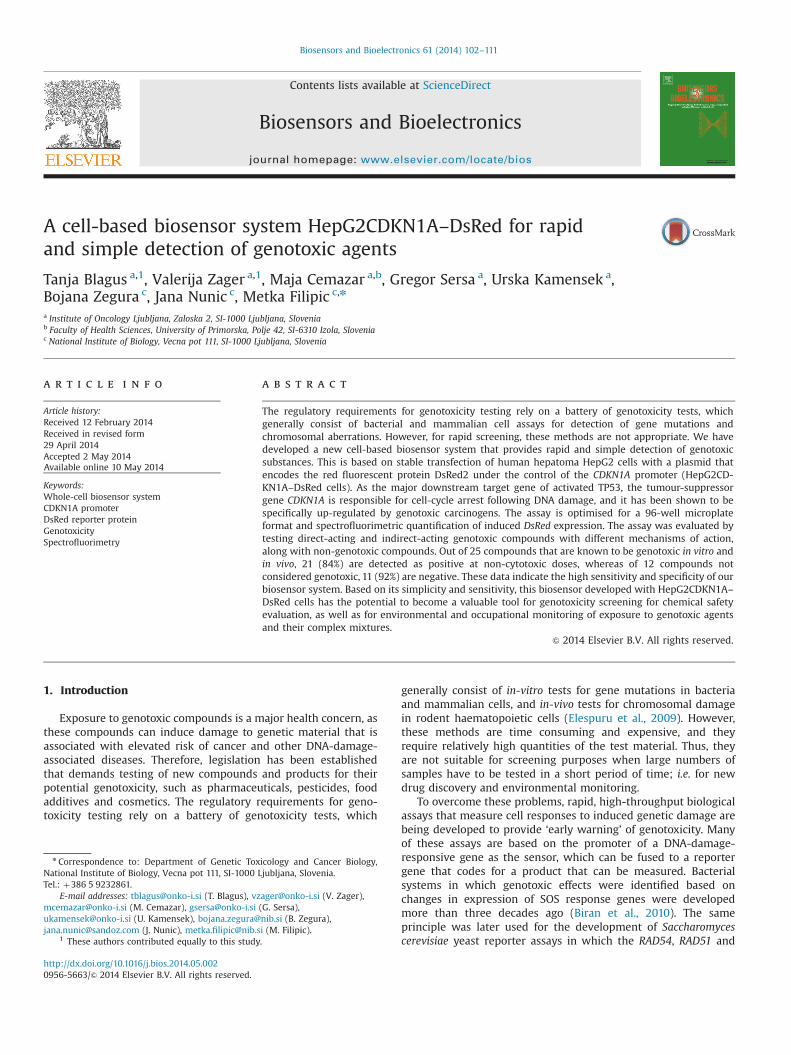
The eukaryotic expression plasmid that encodes the DsRed reportergene under the transcriptional control of the CDKN1A promoter(CDKN1A–DsRed) was prepared using standard molecular biologytechniques of restriction and ligation. The source for the codingsequence of the CDKN1A promoter was the WWP-LUC plasmid, whichwas generously provided by Bert Vogelstein (Johns Hopkins OncologyCenter, Baltimore, Maryland, USA) and was previously cloned into thepEGFPN1 vector for the pp21-EGFP plasmid, as described in our earlierstudy (Zager et al., 2010). The pCLEF35DsRed2 plasmid (InVivoGen,San Diego, USA) was the source of the DsRed2 sequence. In addition,the pORF-mIL12 plasmid (InVivoGen) was used for sub-cloning, toprovide the appropriate restriction sites on each side of the DsRed2sequence. This was achieved by replacing the mIL-12 coding sequencein pORF-mIL12 with DsRed2, to create the pORF-DsRed plasmid.Finally, the CDKN1A–DsRed plasmid was constructed by replacingthe eGFP sequence in pp21-EGFP with the DsRed2 sequence excisedfrom the pORF-DsRed2 plasmid (Fig. 1a). The newly constructedCDKN1A–DsRed plasmid was cloned into the DH5α Escherichia colistrain and isolated using Qiagen Maxi Endo-Free kits (Qiagen, Hilden,Germany), according to manufacturer's instructions.
The purified plasmid DNA was subjected to quality control usingagarose gel electrophoresis (Fig. 1b), and quantity determination usingspectrophotometry. The newly constructed CDKN1A–DsRed plasmidwas cut with three combinations of restriction enzymes that haverestriction sites in different parts of the construct (within the vectorand the insert), and the identity of the plasmid was confirmed bycomparing the pattern of bands on electrophoresis gels with theexpected bands. The CDKN1A–DsRed plasmid was cut with the NcoIrestriction enzyme (expected bands: 4055, 1748, 703 bp), the XhoI andMfeI restriction enzymes (expected bands: 3257, 3249 bp), and the SalIand MfeI restriction enzymes (expected bands: 5679, 827 bp). All ofthe restriction enzymes were obtained from Fermentas (ThermoScientific, Vilnius, Lithuania). The transfection of HepG2 cells withthe CDKN1A–DsRed plasmid was performed by electroporation, asdescribed in recent studies (Towhidi et al., 2012; Zager et al., 2010).The selection of stably transfected clones with low basal DsRedexpression and high inducibility was performed using MMS (Supple-mentary data, Fig. S1), and the selected clone was named asHepG2CDKN1A–DsRed. The stability of the expression of CDKN1Apromoter has been confirmed also in our previous study in which weshowed that it is not inactivated by methylation (Kamensek et al.,2011). The stably transfected cell line was grown in media supple-mented with the geneticin selective antibiotic (G418 sulphate; LifeTechnologies).
2.3. Test compounds and stock solutions
The initial experiments were performed with MMS, CDDP, BaPand vinblastin (VLB). Further validation was performed withadditional 37 compounds that were either known not to begenotoxic, or that belong to different groups with known geno-toxicity and carcinogenicity (Table 1). Fifteen of the selectedcompounds are from the European Centre for the Validation ofAlternative Methods list of compounds recommended for evalua-tion of new genotoxicity assays (Kirkland et al., 2008), whileothers are selected from the Chemical Carcinogenesis Research
T. Blagus et al. / Biosensors and Bioelectronics 61 (2014) 102–111 103
Information System (CCRIS) database and from literature data.According to the solubilities of these compounds, the stocksolutions were prepared in bi-distilled water, dimethylsulphoxideor methanol. Further dilutions were performed in MEM, with thefinal concentration of the vehicle adjusted to 0.5% in all compoundconcentrations. The highest tested concentration of the genotoxiccompounds was set at 1 mM, when this was not limited bysolubility in the solvent or in MEM, or by cytotoxicity (ICH,2011). The highest tested concentration of the soluble non-genotoxic compounds was set at 10 mM.
2.4. Cell treatment
The assays were performed in black, clear-bottomed, 96-wellmicrotitre plates (Greiner Bio-One, Nuernberg, Germany). Aliquots ofHepG2CDKN1A–DsRed cell suspensions (80 mL; 3.75�105 cells mL�1)were distributed into 96 wells of the microtitre plates. The cells wereincubated for 2 h to allow them to attach, and then 20 mL of the testcompounds at the appropriate concentrations (5-fold higher than thefinal concentration) was added to each well, with the plates thenincubated at 37 1C and in 5% CO2. The DsRed fluorescence wasdetermined after 24 h and 48 h of exposure, considering DsRedmaturation time and accumulation in the cytoplasm (Jakobs et al.,2000). The cell viability was determined after 48 h of exposure. Foreach microtitre plate, the tests included two test compounds at fivedifferent concentrations as six parallel analyses, with a positive control(MMS- or BaP-treated cells) and a negative control (vehicle-treatedcells). The scheme of the microplate layout is illustrated in theSupplementary data (Fig. S2).
2.5. Determination of DsRed fluorescence intensity
The induction of the DsRed fluorescence intensity is deter-mined according to the following three analysis systems:
Spectrofluorimetry: The fluorescence intensity of the DsRedprotein was measured using a fluorescence microplate reader witha monochromator (Synergy, BioTek, Winooski, USA) or a filtersystem (Tecan, Männedorf, Switzerland), set at 535 nm (excita-tion) and 590 nm (emission).
Fluorescence microscopy: The expression of the DsRed protein wasfollowed by fluorescence microscopy using an Olympus IX70 invertedmicroscope (Olympus, Tokyo, Japan), equipped with a DP72 digitalcamera (Olympus). Images of each sample were acquired andadditionally processed with the FIJI software (Schindelin et al., 2012).
Flow cytometry: The cells were grown in Petri dishes (10 cm) andwere treated with MMS, CDDP, BaP or VLB for 48 h. The cells werethen harvested by trypsinisation, washed, re-suspended in phosphate-buffered saline to a concentration of 1�105 cells mL�1, and trans-ferred to 5 mL polystyrene round-bottomed tubes (BD Biosciences,San Jose, CA, USA). The DsRed fluorescence intensity was measured onat least 30,000 cells per sample, using a FACSCanto II flow cytometer(BD Biosciences) equipped with a 488-nm laser (aircooled, 20 mWsolid state) and a 585/42-nm band-pass filter. First, the cell populationgate was determined from the bi-parametric logarithmic plot definedby the forward and side scatters to eliminate debris. Secondly, thehistograms of the gated cells against their fluorescence intensity wererecorded and the median of the DsRed fluorescence intensity of thegated cells was determined, using the FACSDiva V6.1.2 software(BD Biosciences).
2.6. Determination of cell viability
The cell viability was determined after 48 h exposure (imme-diately after measurement of the DsRed fluorescence) using thecolorimetric (3-(4,5-dimethylthiazol-2-yl)-5-(3-carboxymethoxy-phenyl)-2-(4-sulfophenyl)-2H-tetrazolium) (MTS; Sigma, St. Louis,USA) assay, as the CellTiter 96 Aqueous One Solution cell prolif-eration assay (Promega, Madison, USA), according to the manu-facturer's instructions. Here, 20 mL MTS solution was added to eachwell of the 96-well microtitre plates. After 2 h of incubation, theabsorbance of the resulting formazan solution was measured at492 nm, using a microplate reader.
2.7. Data collection, statistical analysis and definition of a positiveresult
After the 48 h treatments, the DsRed fluorescence and cellviability data were collected for the microtitre plates. The
Fig. 1. Schematic representation of the CDKN1A–DsRed plasmid construction (a), and confirmation of the successful construction of the plasmid using restriction analysis(b). L, GeneRulertm DNA ladder mix (Fermentas); restriction carried out with the restriction enzymes such as: lane 1, NcoI; lane 2, XhoI and MfeI; and lane 3, SalI and MfeI.
T. Blagus et al. / Biosensors and Bioelectronics 61 (2014) 102–111104
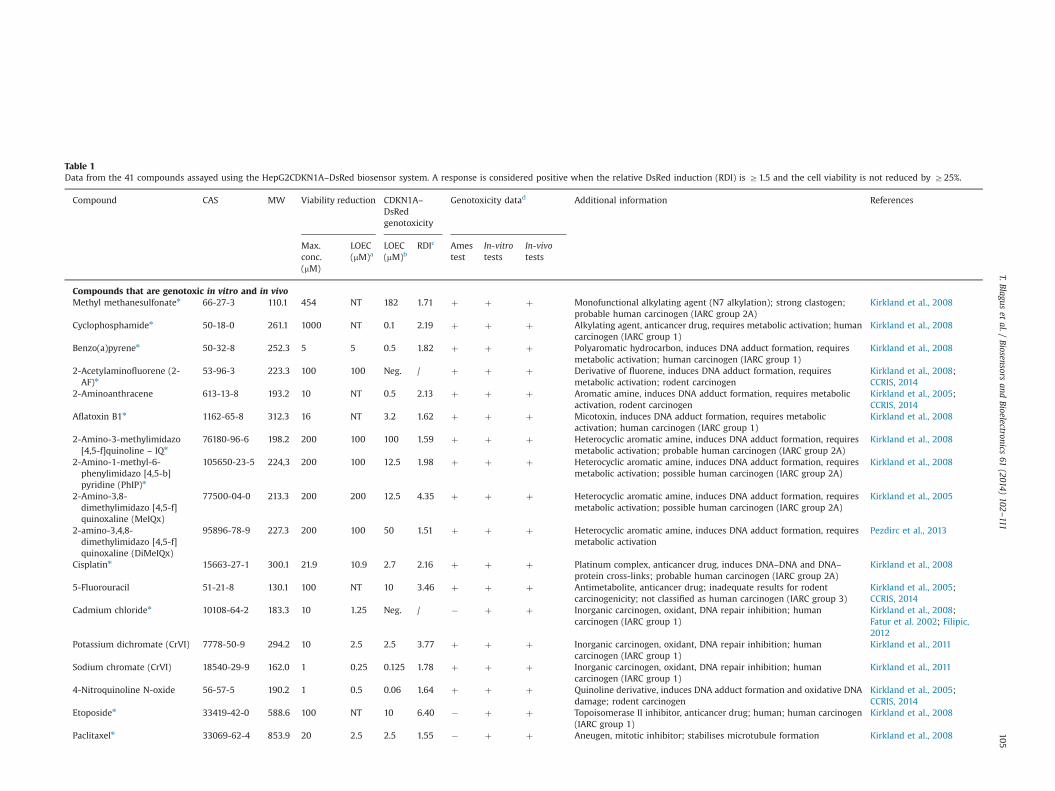
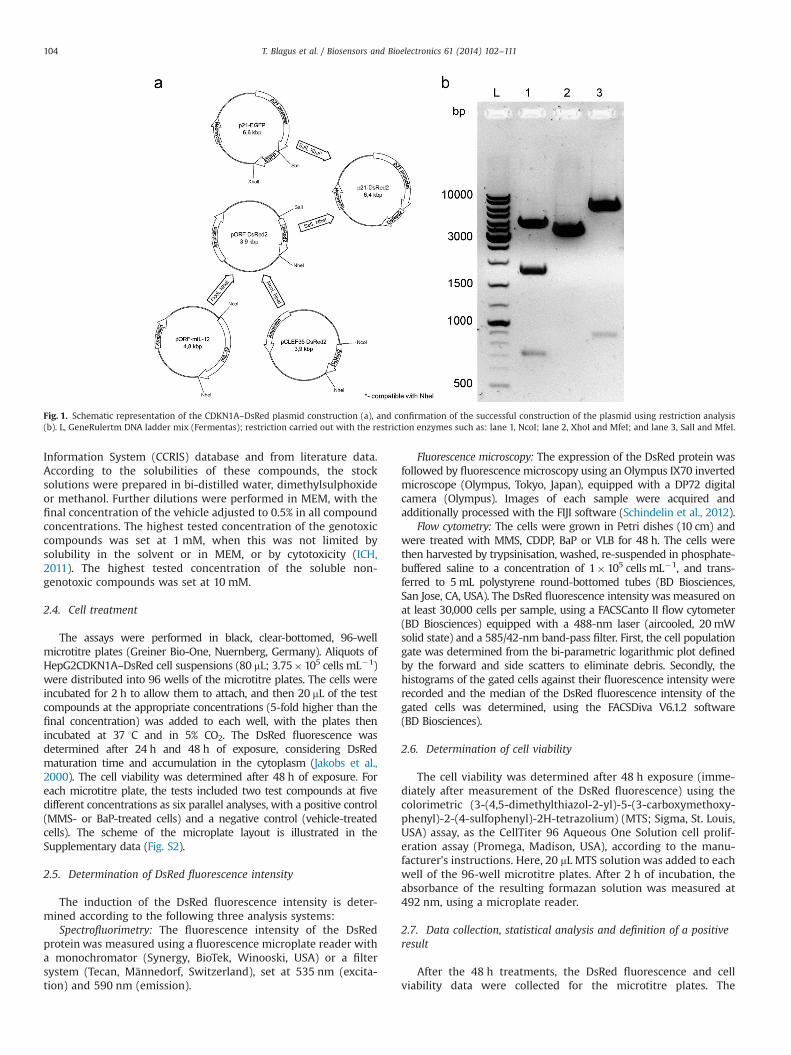
Table 1Data from the 41 compounds assayed using the HepG2CDKN1A–DsRed biosensor system. A response is considered positive when the relative DsRed induction (RDI) is Z1.5 and the cell viability is not reduced by Z25%.
Compound CAS MW Viability reduction CDKN1A–DsRedgenotoxicity
Genotoxicity datad Additional information References
Max.conc.(mM)
LOEC(mM)a
LOEC(mM)b
RDIc Amestest
In-vitrotests
In-vivotests
Compounds that are genotoxic in vitro and in vivoMethyl methanesulfonaten 66-27-3 110.1 454 NT 182 1.71 þ þ þ Monofunctional alkylating agent (N7 alkylation); strong clastogen;
probable human carcinogen (IARC group 2A)Kirkland et al., 2008
Cyclophosphamiden 50-18-0 261.1 1000 NT 0.1 2.19 þ þ þ Alkylating agent, anticancer drug, requires metabolic activation; humancarcinogen (IARC group 1)
Kirkland et al., 2008
Benzo(a)pyrenen 50-32-8 252.3 5 5 0.5 1.82 þ þ þ Polyaromatic hydrocarbon, induces DNA adduct formation, requiresmetabolic activation; human carcinogen (IARC group 1)
Kirkland et al., 2008
2-Acetylaminofluorene (2-AF)n
53-96-3 223.3 100 100 Neg. / þ þ þ Derivative of fluorene, induces DNA adduct formation, requiresmetabolic activation; rodent carcinogen
Kirkland et al., 2008;CCRIS, 2014
2-Aminoanthracene 613-13-8 193.2 10 NT 0.5 2.13 þ þ þ Aromatic amine, induces DNA adduct formation, requires metabolicactivation, rodent carcinogen
Kirkland et al., 2005;CCRIS, 2014
Aflatoxin B1n 1162-65-8 312.3 16 NT 3.2 1.62 þ þ þ Micotoxin, induces DNA adduct formation, requires metabolicactivation; human carcinogen (IARC group 1)
Kirkland et al., 2008
2-Amino-3-methylimidazo[4,5-f]quinoline – IQn
76180-96-6 198.2 200 100 100 1.59 þ þ þ Heterocyclic aromatic amine, induces DNA adduct formation, requiresmetabolic activation; probable human carcinogen (IARC group 2A)
Kirkland et al., 2008
2-Amino-1-methyl-6-phenylimidazo [4,5-b]pyridine (PhIP)n
105650-23-5 224,3 200 100 12.5 1.98 þ þ þ Heterocyclic aromatic amine, induces DNA adduct formation, requiresmetabolic activation; possible human carcinogen (IARC group 2A)
Kirkland et al., 2008
2-Amino-3,8-dimethylimidazo [4,5-f]quinoxaline (MeIQx)
77500-04-0 213.3 200 200 12.5 4.35 þ þ þ Heterocyclic aromatic amine, induces DNA adduct formation, requiresmetabolic activation; possible human carcinogen (IARC group 2A)
Kirkland et al., 2005
2-amino-3,4,8-dimethylimidazo [4,5-f]quinoxaline (DiMeIQx)
95896-78-9 227.3 200 100 50 1.51 þ þ þ Heterocyclic aromatic amine, induces DNA adduct formation, requiresmetabolic activation
Pezdirc et al., 2013
Cisplatinn 15663-27-1 300.1 21.9 10.9 2.7 2.16 þ þ þ Platinum complex, anticancer drug, induces DNA–DNA and DNA–protein cross-links; probable human carcinogen (IARC group 2A)
Kirkland et al., 2008
5-Fluorouracil 51-21-8 130.1 100 NT 10 3.46 þ þ þ Antimetabolite, anticancer drug; inadequate results for rodentcarcinogenicity; not classified as human carcinogen (IARC group 3)
Kirkland et al., 2005;CCRIS, 2014
Cadmium chloriden 10108-64-2 183.3 10 1.25 Neg. / � þ þ Inorganic carcinogen, oxidant, DNA repair inhibition; humancarcinogen (IARC group 1)
Kirkland et al., 2008;Fatur et al. 2002; Filipic,2012
Potassium dichromate (CrVI) 7778-50-9 294.2 10 2.5 2.5 3.77 þ þ þ Inorganic carcinogen, oxidant, DNA repair inhibition; humancarcinogen (IARC group 1)
Kirkland et al., 2011
Sodium chromate (CrVI) 18540-29-9 162.0 1 0.25 0.125 1.78 þ þ þ Inorganic carcinogen, oxidant, DNA repair inhibition; humancarcinogen (IARC group 1)
Kirkland et al., 2011
4-Nitroquinoline N-oxide 56-57-5 190.2 1 0.5 0.06 1.64 þ þ þ Quinoline derivative, induces DNA adduct formation and oxidative DNAdamage; rodent carcinogen
Kirkland et al., 2005;CCRIS, 2014
Etoposiden 33419-42-0 588.6 100 NT 10 6.40 � þ þ Topoisomerase II inhibitor, anticancer drug; human; human carcinogen(IARC group 1)
Kirkland et al., 2008
Paclitaxeln 33069-62-4 853.9 20 2.5 2.5 1.55 � þ þ Aneugen, mitotic inhibitor; stabilises microtubule formation Kirkland et al., 2008
T.Blaguset
al./Biosensors
andBioelectronics
61(2014)
102–111
105
Table 1 (continued )
Compound CAS MW Viability reduction CDKN1A–DsRedgenotoxicity
Genotoxicity datad Additional information References
Max.conc.(mM)
LOEC(mM)a
LOEC(mM)b
RDIc Amestest
In-vitrotests
In-vivotests
Vinblastine 865-21-4 811.0 3 0.6 Neg. / � þ þ Aneugen, mitotic inhibitor; inhibits tubulin polymerisation Kirkland et al., 2011Mitomycin-C 50-07-7 334.3 100 NT 20 2.26 � þ þ DNA cross-linker, anticancer drug; possible human carcinogen (IARC
group 2A)Kirkland et al., 2005;CCRIS, 2014
Bleomycin 11056-06-7 141.6 10 NT 1 1.77 � þ þ Inhibitor of DNA synthesis, anticancer drug; possible human carcinogen(IARC group 2A)
Kirkland et al., 2011
o-toluidine 95-53-4 107.2 100 NT Neg. / � þ þ Monocyclic aromatic amine, induces DNA adduct formation, requiresmetabolic activation; human carcinogen (IARC group 1)
Kirkland et al., 2005;CCRIS, 2014
Microcystin LR 101043-37-2 995.2 1 NT 1 1.75 � þ þnn Cyanobacterial toxin, induces oxidative DNA damage; possible humancarcinogen (IARC group 2A)
Kirkland et al., 2011;Zegura et al., 2008, 2011
Nodularin 118399-22-7 825.0 1.2 NT 0.01 1.86 � þ þnn Cyanobacterial toxin, induces oxidative DNA damage; not classified ashuman carcinogen (IARC group 3)
Zegura et al., 2011
Cylindrospermopsin 143545-90-8 415.5 1.2 NT 0.12 1.53 � þ þnn Cyanobacterial toxin, induces DNA adduct formation, requiresmetabolic activation
Straser et al., 2011
Compounds that are genotoxic in vitro, with negative or no data on in vivo genotoxicity8-Hydroxyquinoline 148-24-3 145.1-
6100 10 Neg. / þ þ � Antioxidant, ion chelator; not classified as human carcinogen (IARC
group 3)Kirkland et al., 2005;CCRIS, 2014
Propidium iodide 2553516-4 668.4 200 NT 12.5 3.26 þ þ N/A Intercalating agent; widely used laboratory reagent GENETOX, 2014Sodium azide 26628-22-8 650.1 615 NT 615 3.78 þ � N/A Azide, specific bacterial and plant mutagen Owais and Kleinhofs,
1988; CCRIS, 2014Imatinib mesilate 220127-57-1 493.6 20.2 20.2 1.02 1.64 þ N/A N/A Protein kinase inhibitor, anticancer drug Fabarius et al., 2007;
Pichler et al., 2014Compounds that are considered as non-genotoxicMannitoln 69-65-8 182. 2 10000 NT Neg. / � � � Six�carbon sugar alcohol or polyol; used as sugar replacement;
negative in rodent carcinogenicity studiesKirkland et al., 2008
EDTAn 60-00-4 292.2 10000 2800 350 2.10 � � N/A Polyamine carboxylic acid; acts as ion chelator Kirkland et al., 2008Ampicilinn 69-53-4 349.4 22.9 NT Neg. / � � � Beta lactam antibiotic; not classified as human carcinogen (IARC group 3) Kirkland et al., 2008Urean 57-13-6 60.1 10000 NT Neg. / � � N/A Negative in rodent carcinogenicity studies Kirkland et al., 2008Xanthohumol 6754-58-1 354.4 20 NT Neg. / � � N/A Prenylated flavonoid, antioxidant, antigenotoxic activity Plazar et al., 2007Boric acid 10043-35-3 61.8 10000 1000-
0Neg. / � � � Weak acid of boron, antiseptic, insecticide; negative in rodent
carcinogenicity studiesEFSA, 2013; CCRIS, 2014
Sucrose 57-50-1 342.3 10000 NT Neg. / � � N/A Kirkland et al., 2011N,N-Dimethylformamide 68-12-2 73.1 10000 NT Neg. / � � � Aliphatic amine; used as solvent; hepatotoxin; not classified as human
carcinogen (IARC group 3)CCRIS, 2014
NaCl 7647-14-5 58.4 10000 NT Neg. / � � N/A Acts as tumour promoter CCRIS, 2014Ethanol 67-17-5 46.1 10000 NT Neg. / � � N/A Acts as tumour promoter Kirkland et al., 2005;
CCRIS, 2014Chromic nitrate (CrIII) 13548-38-4 400.2 100 NT Neg. / N/A � N/A Chromium(III) compounds do not induce genotoxic effects in the
majority of studies with intact cells and are not carcinogenicBeyersmann and Hartwig,2008
Chromic nitrate/ EDTAcomplex
NA 340.2 100 NT Neg. / N/A N/A N/A Chromium(III) compound complexed with EDTA, no data ongenotoxicity
Beyersmann and Hartwig,2008
NT, Non-toxic: within the tested concentration range, cell viability is not reduced by Z25%, compared to the solvent-treated control.N/A, data not available.Neg., negative (RDIo1.5 at all tested concentrations).
a Lowest effective concentrations (LOEC) that reduce cell viability by Z25%, compared to the solvent-treated control.b Lowest effective concentrations (LOEC) that induce Z1.5-fold increase in relative DsRed fluorescence, over the solvent-treated control.c Relative DsRed fluorescence induction (RDI) detected at LOEC.d Published data from bacterial reverse mutation assay (Ames test), genotoxicity in vitro (chromosomal aberrations, micronucleus and/or mouse lymphoma assay), genotoxicity in vivo (chromosomal aberrations and/or
micronucleus).n Compounds listed by the European Centre for the Validation of Alternative Methods in their recommended list of genotoxic and non-genotoxic chemicals for assessment of new genotoxicity tests ADDIN EN.CITE ADDIN EN.
CITE.DATA (Kirkland et al., 2008).nn in vivo comet assay data.
T.Blaguset
al./Biosensors
andBioelectronics
61(2014)
102–111
106

fluorescence data of each well was divided by its formazanabsorbance data to obtain the mean DsRed fluorescence per viablecell. These values were then normalised to the vehicle-treatedcontrol, as a measure of relative DsRed induction (RDI). Therelative cell viability was calculated by dividing the formazanabsorbance of the treated cells by the absorbance of the controlcells. Where the DsRed induction was measured also after 24 h ofexposure, the cell viability data determined after the 48 h expo-sure were used for the normalisation of the DsRed fluorescencereadout.
Statistical analysis was performed using the SigmaStat software(Systat Software, Inc., Richmond CA, USA). All of the data were firsttested for normality with the Kolmorogov–Smirnov normality test.The significance between control and treated cells was determinedusing one-way analysis of variance (ANOVA) and two-tailedStudents' t-tests. The significance of the differences in the RDIbetween the control and treated cells was determined within eachexperiment (n¼6), and between repeated independent experi-ments (n¼3). Within the experiments po0.001 and between theexperiments po0.05 values were considered significant.
A threshold for the determination a positive genotoxicity resultfor our test system was established based on the calculations ofmeans and standard deviations of the DsRed fluorescence of thevehicle and the actively treated cells, as described by Hastwellet al. (2006). The threshold for a positive genotoxicity result wasset at RDI Z1.5, which was greater than three standard deviationsof the vehicle mean DsRed fluorescence.
Another threshold for data acceptance was set for the reductionin the cell viability caused by the tested compounds. At cytotoxicdoses, the breakdown of cell integrity can lead to non-specific DNAdamage. In addition, in our test system, reduced cell density caninterfere with the optical measurements, due to the differences inbackground reflectance and microplate absorbance, and this maygive unreliable results for the fluorescence measurements. Toavoid possible misinterpretations of the genotoxicity results, weset the threshold for genotoxicity data rejection as when therelative cell viability was reduced by 425%.
3. Results and discussion
In this study, we aimed to optimise a newly developedbiosensor system that uses HepG2 cells that were stably
transfected with CDKN1A-dependent DsRed reporter gene(HepG2CDKN1A–DsRed cells) for the detection of genotoxicagents, and to determine the applicability of this biosensor systemto the detection of genotoxic agents with different mechanisms ofaction.
3.1. Optimisation of the HepG2CDKN1A–DsRed biosensor system
Four genotoxic compounds with different mechanisms of actionwere used to optimise the performance of the assay. MMS is an sn-2alkylating agent that forms methyl adducts in DNA (Beranek, 1990).CDDP is a platinum-based alkylating agent that forms DNA–DNA andDNA–protein cross-links that block DNA replication and transcription(Corda et al., 1993). BaP is an indirect-acting genotoxic carcinogenthat is metabolised by cytochrome P450 enzymes to the diol epoxide,which forms bulky DNA adducts (Perlow et al., 2002). VLB is a mitoticspindle inhibitor that does not directly interact with the DNAmolecule, but prevents polymerisation of microtubules during mito-sis (Owellen et al., 1976). These four compounds have also beenshown to activate TP53 and its downstream regulated genes (Jaiswaland Narayan, 2002; Pabla et al., 2008; Sadikovic and Rodenhiser,2006; Tishler et al., 1995).
To determine the optimal exposure time for measurement ofthe induction of the DsRed signal, we measured DsRed fluores-cence intensity 24 h and 48 h after exposure, using a spectro-fluorimeter. During the 24 h exposure, only BaP induced asignificant increase in DsRed fluorescence, while in cells exposedto MMS, CDDP and VLB, an increase in DsRed fluorescence wasdetected after 48 h of exposure (Fig. 2). The most potent inducer ofCDKN1A-dependent DsRed expression was BaP, with the lowesteffective concentration (LOEC) of 0.5 mM. At the highest non-cytotoxic concentration of BaP (2 mM), there was a nearly 5-foldincrease in DsRed fluorescence over the control (RDI¼4.9). TheLOEC of CDDP was 2.7 mM, and at its highest non-cytotoxicconcentration (5.5 mM), the RDI was 5.05. MMS showed muchlower potential, with the LOEC at 182 mM and an RDI of 6.3 at thehighest tested concentration (454 mM). VLB was negative accord-ing to the criterion we set for considering a tested compound asgenotoxic; RDI Z1.5 was detected at concentrations that reducedcell viability by more than 25%.
Like these spectrofluorimetric measurements of DsRed fluores-cence intensity, fluorescence microscopic images also showeddose-dependent increases in DsRed fluorescence in cells exposed
Fig. 2. Relative cell viability after 48 h exposure (top panels) and relative DsRed (reporter protein) induction (RDI) after 24 h and 48 h exposures (bottom panels) ofHepG2CDKN1A–DsRed cells to the initial four genotoxic compounds with different mechanisms of action. MMS, methyl methanesulfonate; CDDP, cisplatin; BaP, benzo(a)pyrene; VLB, vinblastine. Dashed lines, 25% cell viability reduction threshold (top) and RDI 1.5 genotoxicity threshold (bottom). Data are means7standard deviations fromthree independent experiments. Logarithmic scale is used to display data on the x-axis.
T. Blagus et al. / Biosensors and Bioelectronics 61 (2014) 102–111 107
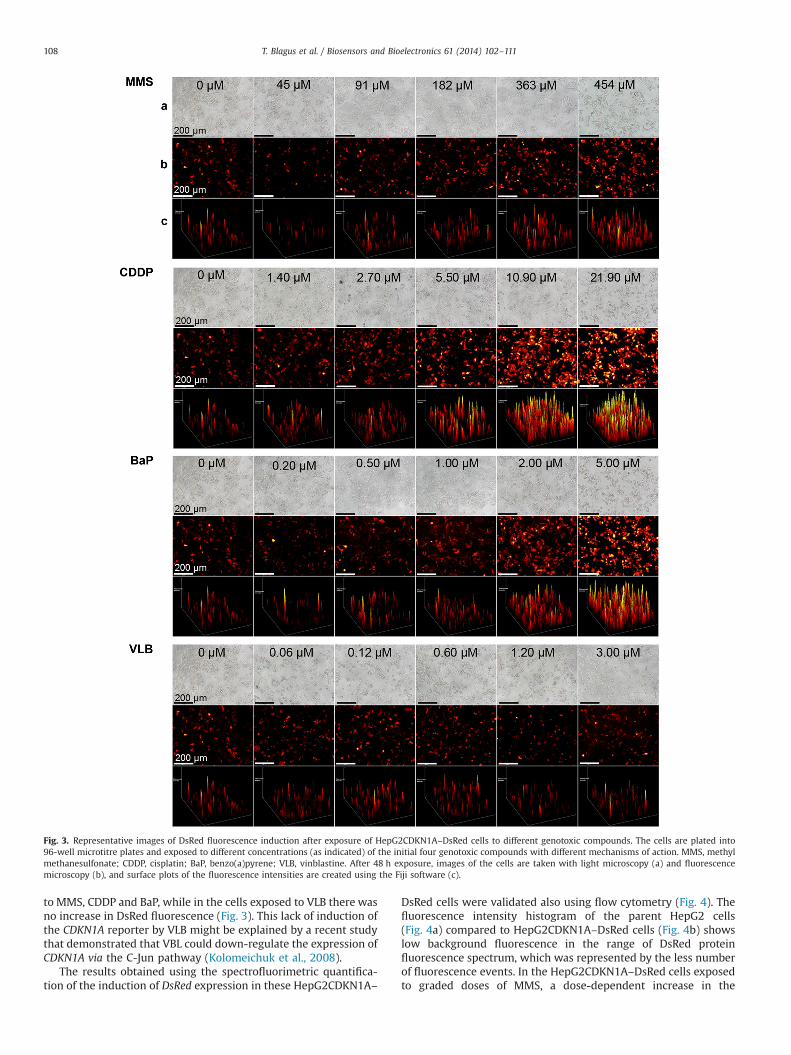
to MMS, CDDP and BaP, while in the cells exposed to VLB there wasno increase in DsRed fluorescence (Fig. 3). This lack of induction ofthe CDKN1A reporter by VLB might be explained by a recent studythat demonstrated that VBL could down-regulate the expression ofCDKN1A via the C-Jun pathway (Kolomeichuk et al., 2008).
The results obtained using the spectrofluorimetric quantifica-tion of the induction of DsRed expression in these HepG2CDKN1A–
DsRed cells were validated also using flow cytometry (Fig. 4). Thefluorescence intensity histogram of the parent HepG2 cells(Fig. 4a) compared to HepG2CDKN1A–DsRed cells (Fig. 4b) showslow background fluorescence in the range of DsRed proteinfluorescence spectrum, which was represented by the less numberof fluorescence events. In the HepG2CDKN1A–DsRed cells exposedto graded doses of MMS, a dose-dependent increase in the
Fig. 3. Representative images of DsRed fluorescence induction after exposure of HepG2CDKN1A–DsRed cells to different genotoxic compounds. The cells are plated into96-well microtitre plates and exposed to different concentrations (as indicated) of the initial four genotoxic compounds with different mechanisms of action. MMS, methylmethanesulfonate; CDDP, cisplatin; BaP, benzo(a)pyrene; VLB, vinblastine. After 48 h exposure, images of the cells are taken with light microscopy (a) and fluorescencemicroscopy (b), and surface plots of the fluorescence intensities are created using the Fiji software (c).
T. Blagus et al. / Biosensors and Bioelectronics 61 (2014) 102–111108

fluorescence events can be seen as a displacement of the peak to ahigher fluorescence intensity (Fig. 4c). Fig. 4d shows that themeasurements of the DsRed fluorescence intensity with flowcytometry and spectrofluorimetry provide comparable results forBaP, MMS and VLB, while for the fluorescence intensity of theCDDP-exposed cells, the higher measurements at the highestconcentrations are observed using spectrofluorimetry. At this doseof CDDP, the cell viability is reduced by 45%, and so the differencehere can be explained by the overestimation of RDI using thenormalisation to viable cells.
3.2. Determination of the sensitivity and specificity of theHepG2CDKN1A–DsRed cell-based biosensor system
For determination of the sensitivity and specificity of thisHepG2CDKN1A–DsRed biosensor system, additional 37 com-pounds were tested. Among all of 41 compounds tested, thegathered information from previous sources indicated that 25compounds were genotoxic in vitro and in vivo, four compoundswere genotoxic in vitro with in vivo data on genotoxicity eithernegative or not available, and 12 of the compounds were notgenotoxic (Table 1; Supplementary data, Figs. S3–S5).
In the test system of the present study, positive genotoxicityresults were obtained with the compounds that were known to bein-vitro and in-vivo genotoxins, which included polyaromatichydrocarbons and aromatic amines that form bulky adducts,alkylating agents, an antimetabolite, a topoisomerase II inhibitor,DNA cross-linkers, and chromium(VI) salts, and the three cyano-bacterial toxins (microcystin-LR, nodularin, cylindrospermopsin).Four compounds that have been shown to be genotoxic in vitro
and in vivo and to be rodent carcinogens are not detected asgenotoxic here such as 2-acetylaminofluorene, o-toluidine, cad-mium chloride and VLB.
8-hydroxyquinoline that induces DNA and chromosomaldamage in vitro, but not in vivo (Kirkland et al., 2005) is negativein our test system. Of the three compounds that are positivein vitro for which in vivo genotoxicity data are not available,positive response is induced by the intercalating agent propidiumiodide, by a model bacterial mutagen sodium azide and by tyrosinekinase inhibitor imatinib mesylate.
Of the 12 compounds that were selected as being considerednot to be genotoxic, only EDTAwas positive (LOEC¼350 mM). Moredetailed explanation on the observed positive and negativeresponses is given in the Supplementary data.
The data in Table 1 show that out of 25 tested compounds thatare reported to be genotoxic in vitro and in vivo, 21 (84%) are seen aspositive in the present study, and of the 12 compounds that arereported to be non-genotoxic, 11 (92%) are negative. Similarsensitivities and specificities have been reported for several otherreporter test systems. The GreenScreenHT assay that employshuman lymphoblastoid TK6 cells expressing the GADD45a-GFPreporter showed 96% sensitivity and 76% specificity (Birrell et al.,2010), while TK6 cells transfected with p53R2-dependent luciferasereporter gene showed 85% sensitivity and 93% specificity (Mizotaet al., 2011). Drawback of test systems employing TK6 cells is theirmetabolic incompetence; thus the use of exogenous metabolicactivation is required for detection of indirect acting genotoxicants.Westerink et al. (2010) developed a test system with metabolicallycompetent HepG2 cells. The cells were stably transfected withluciferase gene under the control of promoter regions of RAD51C,
Fig. 4. Representative fluorescence intensity histograms of parental HepG2 cells (a), non-treated HepG2CDKN1A–DsRed cells (b), and HepG2CDKN1A–DsRed cells exposedto increasing concentrations of MMS for 48 h (c). (d) Comparisons of flow cytometry and spectrofluorimetry measurements of DsRed fluorescence of HepG2CDKN1A–DsRedcells exposed to different concentrations (as indicated) of the initial four genotoxic compounds with different mechanisms of action. MMS, methyl methanesulfonate; CDDP,cisplatin; BaP, benzo(a)pyrene; VLB, vinblastine. Data are means7standard deviation from three independent experiments. Logarithmic scale is used to display data on thex-axis.
T. Blagus et al. / Biosensors and Bioelectronics 61 (2014) 102–111 109

Cystatin A, and t responsive elements of the p53 protein that areindicators of genotoxic stress and Nrf2 responsive elements as anindicator of oxidative stress. The system showed lower sensitivity(74%) and specificity (81%) compared to our test system (84% and92%, respectively).
3.3. Bacterial vs mammalian cell based reporter biosensors forgenotoxicity testing
Numerous genotoxicity assays based on genetically engineeredbacteria have been developed over years (Biran et al., 2010). Theadvantages of bacterial cells for the development of whole cellbiosensors are their rapid growth, ease of culturing and easygenetic manipulation to construct genetically engineered micro-organisms ‘tailored’ to generate quantifiable signal that reflectsgenotoxic potency of the tested sample. Due to their robustnessand sufficient shelf life genetically modified bacteria are success-fully used for the development of devices consisting of immobi-lised bacteria coupled to the appropriate transducer for signalmeasurement (Biran et al., 2010). Using these technologies pro-gress has been recently focused on the development of microbialcell array biochips with multiple reporter cells incorporated into asingle platform that enables simultaneous detection of a broadspectrum of pollutants (Melamed et al., 2012; Ahn and Gu, 2012;Elad and Belkin, 2013). Bacterial biosensors are highly sensitive,rapid and cost effective, which are the desired properties ofbiosensors, particularly in the environmental monitoring for thedetection of genotoxic pollutants.
On the other hand, mammalian cells are compared to bacteriamuch more demanding in terms of cultivation, growth, robustnessas well as genetic manipulation. Consequently the mammalian cellbased biosensors are more time consuming and less cost effective.However, mammalian cells reflect toxicological, physiological andcellular responses relevant for humans and animals, which cir-cumvent the limitations compared to those of bacterial biosensors.Thus, when the genotoxicity data are used for the prediction ofin vivo genotoxicity and potential carcinogenicity of chemicals forhumans, biosensors based on engineered human cell are moreappropriate. Therefore, the strengths and weaknesses of humancell and bacterial cell based biosensors for genotoxicity detectionshould be regarded in terms of their applications. The performanceof biosensors for applications in environmental monitoring isjudged by their high sensitivity and rapid acquisition of theresults; therefore for such purposes bacterial biosensors are moreappropriate. On the other hand, the performance of biosensorsapplied for the prediction of in vivo genotoxicity and potentialcarcinogenicity for humans should be judged by their accuratepredictability; hence human cells biosensor should be used forsuch applications.
4. Conclusions
The data from the present study show that this new biosensorsystem with HepG2 cells stably transfected with the DsRed2 redfluorescent protein reporter gene under the control of the CDKN1Apromoter efficiently detects different types of genotoxic agents.The main advantages of this biosensor system are two-fold: (i) theuse of metabolically competent human cells that allow the detec-tion of most of the indirect-acting genotoxic compounds withoutthe use of exogenous metabolic activation; and (ii) the use ofspectrofluorimetric measurements of the fluorescent DsRed repor-ter protein in microplates, which provides easy handling and dataacquisition. The validation of the test carried out here demon-strates the high sensitivity and specificity of this biosensor system.We believe that this genotoxicity assay can be a valuable tool with
potential applications in the fields of chemicals safety evaluationand environmental and occupational monitoring of exposure togenotoxic agents and their complex mixtures.
Acknowledgement
The study was supported by the Slovenian Ministry of DefenceProjects M1-0031 and M1-0151, and the Slovenian ResearchAgency, Projects J3-9580, P3-0003 and J3-4259. The help ofMira Lavric, Ales Sedlar, Jaka Lavrencak and Andreja Brozic isgratefully acknowledged.
Appendix A. Supporting information
Supplementary data associated with this article can be found inthe online version at http://dx.doi.org/10.1016/j.bios.2014.05.002.
References
Afanassiev, V., Sefton, M., Anantachaiyong, T., Barker, G., Walmsley, R., Wolfl, S.,2000. Mutat. Res.: Genet. Toxicol. Environ. 464, 297–308.
Ahn, J.M., Gu, M.B., 2012. Appl. Biochem. Biotechnol. 168, 752–760.Beranek, D.T., 1990. Mutat. Res. 231, 11–30.Beyersmann, D., Hartwig, A., 2008. Arch. Toxicol. 82, 493–512.Billinton, N., Barker, M.G., Michel, C.E., Knight, A.W., Heyer, W.D., Goddard, N.J.,
Fielden, P.R., Walmsley, R.M., 1998. Biosens. Bioelectron. 13, 831–838.Billinton, N., Knight, A.W., 2001. Anal. Biochem. 291, 175–197.Biran, A., Yagur-Kroll, S., Pedahzur, R., Buchinger, S., Reifferscheid, G., Ben-Yoav, H.,
Shacham-Diamand, Y., Belkin, S., 2010. Microbiol. Biotechnol. 3, 412–427.Birrell, L., Cahill, P., Hughes, C., Tate, M., Walmsley, R.M., 2010. Mutat. Res.: Genet.
Toxicol. Environ. 695, 87–95.Bressac, B., Galvin, K.M., Liang, T.J., Isselbacher, K.J., Wands, J.R., Ozturk, M., 1990.
Proc. Natl. Acad. Sci. USA 87, 1973–1977.Corda, Y., Job, C., Anin, M.F., Leng, M., Job, D., 1993. Biochemistry 32, 8582–8588.CCRIS, 2014. US National Library of Medicine Toxicology Data Network (TOXNET),
Chemical Carcinogenesis Research Information System. ⟨http://toxnet.nlm.nih.gov/cgi-bin/sis/htmlgen?⟩ CCRIS (accessed January 2014.).
EFSA A.N.S. Panel (EFSA Panel on Food Additives and Nutrient Sources Added toFood), 2013. EFSA J. 11 (10), 523407, 52.
Elad, T., Belkin, S., 2013. Water Res. 47, 3782–3790.Elespuru, R.K., Agarwal, R., Atrakchi, A.H., Bigger, C.A.H., Heflich, R.H., Jagannath, D.
R., Levy, D.D., Moore, M.M., Ouyang, Y.L., Robison, T.W., Sotomayor, R.E., Cimino,M.C., Dearfield, K.L., 2009. Toxicol. Sci. 109, 172–179.
Ellinger-Ziegelbauer, H., Stuart, B., Wahle, B., Bomann, W., Ahr, H.J., 2005. Mutat.Res.: Fundam. Mol. Mech. 575, 61–84.
Fabarius, A., Giehl, M., Frank, O., Spiess, B., Zheng, C., Muller, M.C., Weiss, C.,Duesberg, P., Hehlmann, R., Hochhaus, A., Seifarth, W., 2007. Brit. J. Haematol.138, 369–373.
Fatur, T., Tusek, M., Falnoga, I., Scancar, J., Lah, T.T., Filipic, M., 2002. Food Chem.Toxicol. 40, 1069–1076.
Filipic, M., 2012. Mutat. Res.: Fundam. Mol. Mech. 733, 69–77.GENETOX, 2014. US National Library of Medicine Toxicology Data Network
(TOXNET) Chemical Carcinogenesis Research Information System. ⟨http://toxnet.nlm.nih.gov/cgi-bin/sis/search⟩ (accessed January 2014.).
Hastwell, P.W., Chai, L.L., Roberts, K.J., Webster, T.W., Harvey, J.S., Rees, R.W.,Walmsley, R.M., 2006. Mutat. Res.: Genet. Toxicol. Environ. 607, 160–175.
Hreljac, I., Zajc, I., Lah, T., Filipic, M., 2008. Environ. Mol. Mutagen. 49, 360–367.ICH, 2011 Guidance on Genotoxicity Testing and Data Interpretation for Pharma-
ceuticals Intended for Human Use. S2(R1). ⟨http://www.ich.org/fileadmin/Public_Web_Site/ICH_Products/Guidelines/Safety/S2_R1/Step4/S2R1_Step4.pdf⟩(accessed January 2014.).
Jaiswal, A.S., Narayan, S., 2002. Mutat. Res. 500, 17–30.Jakobs, S., Subramaniam, V., Schonle, A., Jovin, T.M., Hell, S.W., 2000. FEBS Lett. 479,
131–135.Kamensek, U., Sersa, G., Vidic, S., Tevz, G., Kranjc, S., Cemazar, M., 2011. Mol.
Imaging Biol. 13, 43–52.Kirkland, D., Aardema, M., Henderson, L., Muller, L., 2005. Mutat. Res.: Genet.
Toxicol. Environ. 584, 1–256.Kirkland, D., Kasper, P., Muller, L., Corvi, R., Speit, G., 2008. Mutat. Res.: Genet.
Toxicol. Environ. 653, 99–108.Kirkland, D., Reeve, L., Gatehouse, D., Vanparys, P., 2011. Mutat. Res.: Genet. Toxicol.
Environ. 721, 27–73.Knasmuller, S., Mersch-Sundermann, V., Kevekordes, S., Darroudi, F., Huber, W.W.,
Hoelzl, C., Bichler, J., Majer, B.J., 2004. Toxicology 198, 315–328.Kolomeichuk, S.N., Bene, A., Upreti, M., Dennis, R.A., Lyle, C.S., Rajasekaran, M.,
Chambers, T.C., 2008. Mol. Pharmacol. 73, 128–136.Liu, X., Kramer, J.A., Hu, Y., Schmidt, J.M., Jiang, J., Wilson, A.G., 2009. Int. J. Toxicol.
28, 162–176.
T. Blagus et al. / Biosensors and Bioelectronics 61 (2014) 102–111110

Melamed, S., Elad, T., Belkin, S., 2012. Curr. Opin. Biotechnol. 23, 2–8.Mizota, T., Ohno, K., Yamada, T., 2011. Mutat. Res.: Genet. Toxicol. Environ. 724,
76–85.Moldovan, G.L., Pfander, B., Jentsch, S., 2007. Cell 129, 665–679.Ohno, K., Tanaka-Azuma, Y., Yoneda, Y., Yamada, T., 2005. Mutat. Res.: Genet.
Toxicol. Environ. 588, 47–57.Ohno, K., Ishihata, K., Tanaka-Azuma, Y., Yamada, T., 2008. Mutat. Res.: Genet.
Toxicol. Environ. 656, 27–35.Owais, W.M., Kleinhofs, A., 1988. Mutat. Res. 197, 313–323.Owellen, R.J., Hartke, C.A., Dickerson, R.M., Hains, F.O., 1976. Cancer Res. 36,
1499–1502.Pabla, N., Huang, S., Mi, Q.S., Daniel, R., Dong, Z., 2008. J. Biol. Chem. 283,
6572–6583.Perlow, R.A., Kolbanovskii, A., Hingerty, B.E., Geacintov, N.E., Broyde, S., Scicchitano,
D.A., 2002. J. Mol. Biol. 321, 29–47.Petkovic, J., Zegura, B., Stevanovic, M., Drnovsek, N., Uskokovic, D., Novak, S., Filipic,
M., 2011. Nanotoxicology 5, 341–353.Pezdirc, M., Zegura, B., Filipic, M., 2013. Food Chem. Toxicol. 59, 386–394.Pichler, C., Filipic, M., Kundi, M., Rainer, B., Knasmueller, S., Misik, M., 2014.
Chemosphere, http://dx.doi.org/10.1016/j.chemosphere.2014.01.010, in press.Plazar, J., Zegura, B., Lah, T.T., Filipic, M., 2007. Mutat. Res.: Genet. Toxicol. Environ.
632, 1–8.
Sadikovic, B., Rodenhiser, D.I., 2006. Toxicol. Appl. Pharmacol. 216, 458–468.Schindelin, J., Arganda-Carreras, I., Frise, E., Kaynig, V., Longair, M., Pietzsch, T.,
Preibisch, S., Rueden, C., Saalfeld, S., Schmid, B., Tinevez, J.Y., White, D.J.,Hartenstein, V., Eliceiri, K., Tomancak, P., Cardona, A., 2012. Nat. Methods 9,676–682.
Straser, A., Filipic, M., Zegura, B., 2011. Arch. Toxicol. 85, 1617–1626.Tishler, R.B., Lamppu, D.M., Park, S., Price, B.D., 1995. Cancer Res. 55, 6021–6025.Towhidi, L., Firoozabadi, S.M., Mozdarani, H., Miklavcic, D., 2012. Radiol. Oncol. 46,
119–125.Vogelstein, B., Lane, D., Levine, A.J., 2000. Nature 408, 307–310.Van Delft, J.H.M., van Agen, E., van Breda, S.G.J., Herwijnen, M.H., Staal, Y.C.M.,
Kleinjans, J.C.S., 2004. Carcinogenesis 25, 1265–1276.Walmsley, R.M., Billinton, N., Heyer, W.D., 1997. Yeast 13, 1535–1545.Westerink, W.M.A., Stevenson, J.C.R., Horbach, G.J., Schoonen, W., 2010. Mutat. Res.:
Genet. Toxicol. Environ. 696, 21–40.Zager, V., Cemazar, M., Hreljac, I., Lah, T.T., Sersa, G., Filipic, M., 2010. Radiol. Oncol.
44, 42–51.Zegura, B., Zajc, I., Lah, T.T., Filipic, M., 2008. Toxicon 51, 615–623.Zegura, B., Straser, A., Filipic, M., 2011. Mutat. Res. Rev. Mutat. 727, 16–41.Zhang, R., Niu, Y.J., Do, H.R., Cao, X.W., Shi, D., Hao, Q.L., Zhou, Y.L., 2009. Toxicol.
in vitro 23, 158–165.
T. Blagus et al. / Biosensors and Bioelectronics 61 (2014) 102–111 111
Copyright © 2022 FDOKUMEN


![Anguilla anguilla L. Biochemical and Genotoxic Responses to Benzo[ a]pyrene](https://static.fdokumen.com/doc/165x107/631d4597f26ecf94330a787a/anguilla-anguilla-l-biochemical-and-genotoxic-responses-to-benzo-apyrene.jpg)