A Case Study of Malindi–Ungwana Bay, Kenya - MDPI
18
Citation: Fondo, E.N.; Omukoto, J.O.; Wambiji, N.; Okemwa, G.M.; Thoya, P.; Maina, G.W.; Kimani, E.N. Diversity of Shallow-Water Species in Prawn Trawling: A Case Study of Malindi–Ungwana Bay, Kenya. Diversity 2022, 14, 199. https:// doi.org/10.3390/d14030199 Academic Editors: Thomas J. Trott and Bert W. Hoeksema Received: 4 February 2022 Accepted: 6 March 2022 Published: 9 March 2022 Publisher’s Note: MDPI stays neutral with regard to jurisdictional claims in published maps and institutional affil- iations. Copyright: © 2022 by the authors. Licensee MDPI, Basel, Switzerland. This article is an open access article distributed under the terms and conditions of the Creative Commons Attribution (CC BY) license (https:// creativecommons.org/licenses/by/ 4.0/). diversity Article Diversity of Shallow-Water Species in Prawn Trawling: A Case Study of Malindi–Ungwana Bay, Kenya Esther N. Fondo 1, * , Johnstone O. Omukoto 1,2 , Nina Wambiji 1 , Gladys M. Okemwa 1 , Pascal Thoya 1 , George W. Maina 3 and Edward N. Kimani 1, * 1 Kenya Marine and Fisheries Research Institute, Mombasa P.O. Box 81651-80100, Kenya; [email protected] (J.O.O.); [email protected] (N.W.); [email protected] (G.M.O.); [email protected] (P.T.) 2 Lancaster Environment Centre, Lancaster University, Lancaster LA1 4YQ, UK 3 The Nature Conservancy, Africa Regional Office, Nairobi P.O. Box 19738-00100, Kenya; [email protected] * Correspondence: [email protected] (E.N.F.); [email protected] (E.N.K.) Abstract: Bottom trawling is a common fishing method that targets bottom-dwelling fisheries re- sources. It is non-selective and large amounts of by-catch are discarded, raising serious sustainability and ecosystem conservation concerns. In this study, a shallow-water bottom-trawl fishery was evalu- ated using logbook catch data between 2011 and 2019 and the species composition data collected by fisheries observers between 2016 and 2019. The logbook data showed a twenty-fold increase in the annual catches with a ten-fold increase in fishing effort and an increase in the proportion of retained catch from 2011 to 2019. The observer data showed that for prawn, the by-catch ratio ranged from 1:3 to 1:9 during the four years. Multivariate analysis revealed significant differences between the compositions of retained and discarded catches mainly attributed to Pellona ditchela, Nematopalaemon tenuipes, and Secutor insidiator. There was no significant decline in species diversity and the trophic level of the catches over the 4-year observer period indicating no marked impact of trawling on the stock at the current level of fishing effort. This study provides baseline information on the prawn trawl fishery against which the performance of the management regulations may be evaluated towards the Ecosystem Approach to Fisheries management. Keywords: shell-fish; fish; by-catch; discards; species composition 1. Introduction Bottom trawling and dredging contribute a significant part to capturing finfish and shellfish worldwide. Global evaluation of the contribution of bottom trawling and dredging to capture fisheries indicate approximately 28% [1], while long-term FAO data show that trawling has contributed about 25% of capture fisheries between 1950 and 2018 [2]. However, evaluation shows that bottom trawling generates the most waste in fisheries, accounting for nearly 60% of the fish dumped back into the ocean [1]. The sustainability and conservation concerns of bottom trawl fisheries have attracted attention in the past [1,3–5]. Trawling is considered a wasteful and destructive fishing method associated with large amounts of discarded by-catch leading to changes in trophic structure and loss of fishery resources [6,7]. Changes in the trophic structure and function of benthic communities have im- portant implications on primary production and the wider functioning of the marine ecosystem [8,9]. Ecological studies on bottom trawling have focused on ecosystem impacts through widespread physical disturbance of the bottom substrate, excessive removal of juveniles, and the potential of modifying ecosystems’ trophic structure [10,11]. There are claims that any trawl fishery is unsustainable due to its environmental and ecosystem im- pacts [12,13], and there have been suggestions for bans on some types of trawling [3,14,15]. However, bottom trawling continues to be one of the most common fishing methods and Diversity 2022, 14, 199. https://doi.org/10.3390/d14030199 https://www.mdpi.com/journal/diversity
-
Upload
khangminh22 -
Category
Documents
-
view
2 -
download
0
Transcript of A Case Study of Malindi–Ungwana Bay, Kenya - MDPI

�����������������
Citation: Fondo, E.N.; Omukoto, J.O.;
Wambiji, N.; Okemwa, G.M.; Thoya,
P.; Maina, G.W.; Kimani, E.N.
Diversity of Shallow-Water Species in
Prawn Trawling: A Case Study of
Malindi–Ungwana Bay, Kenya.
Diversity 2022, 14, 199. https://
doi.org/10.3390/d14030199
Academic Editors: Thomas J. Trott
and Bert W. Hoeksema
Received: 4 February 2022
Accepted: 6 March 2022
Published: 9 March 2022
Publisher’s Note: MDPI stays neutral
with regard to jurisdictional claims in
published maps and institutional affil-
iations.
Copyright: © 2022 by the authors.
Licensee MDPI, Basel, Switzerland.
This article is an open access article
distributed under the terms and
conditions of the Creative Commons
Attribution (CC BY) license (https://
creativecommons.org/licenses/by/
4.0/).
diversity
Article
Diversity of Shallow-Water Species in Prawn Trawling: A CaseStudy of Malindi–Ungwana Bay, KenyaEsther N. Fondo 1,* , Johnstone O. Omukoto 1,2 , Nina Wambiji 1 , Gladys M. Okemwa 1 , Pascal Thoya 1 ,George W. Maina 3 and Edward N. Kimani 1,*
1 Kenya Marine and Fisheries Research Institute, Mombasa P.O. Box 81651-80100, Kenya;[email protected] (J.O.O.); [email protected] (N.W.); [email protected] (G.M.O.);[email protected] (P.T.)
2 Lancaster Environment Centre, Lancaster University, Lancaster LA1 4YQ, UK3 The Nature Conservancy, Africa Regional Office, Nairobi P.O. Box 19738-00100, Kenya; [email protected]* Correspondence: [email protected] (E.N.F.); [email protected] (E.N.K.)
Abstract: Bottom trawling is a common fishing method that targets bottom-dwelling fisheries re-sources. It is non-selective and large amounts of by-catch are discarded, raising serious sustainabilityand ecosystem conservation concerns. In this study, a shallow-water bottom-trawl fishery was evalu-ated using logbook catch data between 2011 and 2019 and the species composition data collectedby fisheries observers between 2016 and 2019. The logbook data showed a twenty-fold increasein the annual catches with a ten-fold increase in fishing effort and an increase in the proportionof retained catch from 2011 to 2019. The observer data showed that for prawn, the by-catch ratioranged from 1:3 to 1:9 during the four years. Multivariate analysis revealed significant differencesbetween the compositions of retained and discarded catches mainly attributed to Pellona ditchela,Nematopalaemon tenuipes, and Secutor insidiator. There was no significant decline in species diversityand the trophic level of the catches over the 4-year observer period indicating no marked impact oftrawling on the stock at the current level of fishing effort. This study provides baseline informationon the prawn trawl fishery against which the performance of the management regulations may beevaluated towards the Ecosystem Approach to Fisheries management.
Keywords: shell-fish; fish; by-catch; discards; species composition
1. Introduction
Bottom trawling and dredging contribute a significant part to capturing finfish andshellfish worldwide. Global evaluation of the contribution of bottom trawling and dredgingto capture fisheries indicate approximately 28% [1], while long-term FAO data showthat trawling has contributed about 25% of capture fisheries between 1950 and 2018 [2].However, evaluation shows that bottom trawling generates the most waste in fisheries,accounting for nearly 60% of the fish dumped back into the ocean [1]. The sustainability andconservation concerns of bottom trawl fisheries have attracted attention in the past [1,3–5].Trawling is considered a wasteful and destructive fishing method associated with largeamounts of discarded by-catch leading to changes in trophic structure and loss of fisheryresources [6,7].
Changes in the trophic structure and function of benthic communities have im-portant implications on primary production and the wider functioning of the marineecosystem [8,9]. Ecological studies on bottom trawling have focused on ecosystem impactsthrough widespread physical disturbance of the bottom substrate, excessive removal ofjuveniles, and the potential of modifying ecosystems’ trophic structure [10,11]. There areclaims that any trawl fishery is unsustainable due to its environmental and ecosystem im-pacts [12,13], and there have been suggestions for bans on some types of trawling [3,14,15].However, bottom trawling continues to be one of the most common fishing methods and
Diversity 2022, 14, 199. https://doi.org/10.3390/d14030199 https://www.mdpi.com/journal/diversity

Diversity 2022, 14, 199 2 of 18
contribute a significant part of demersal fish and shallow and deep-water crustaceans inmany parts of the world’s oceans [1].
Bottom trawling within the Western Indian Ocean contributes significantly to indus-trial shallow-water prawn fisheries in South Africa, Mozambique, Tanzania, Kenya, andMadagascar. The few recent reports on bottom trawling in the region indicate sustainabilityand conservation challenges. Prawn trawling around Bagamoyo/Sadani and the RufijiDelta in southern Tanzania, landed between 400 and 1000 tons by 16–26 vessels annu-ally [16–18]. In Mozambique, trawling at the Sofala Bank region yielded 6000 to 9000 tonsannually, landed by between 50 and 90 vessels between 1980 and 2014 [19]. There was amarked decline in the catches to 1800 tons after 2012 [20]. A relatively small prawn trawlfishery operates in the Thukela Bank in South Africa, landing a total of 350 tons [21,22].Prawn trawling in the northern and west coast of Madagascar undertaken by a maximumof 77 vessels in 1996 declined to 53 in 2007, whereas landings varied between 2600 and4000 tons annually [23]. In Kenya, between 5 and 20 trawlers operated annually within theMalindi–Ungwana Bay, landing between 334 and 640 tons of shallow-water prawns annu-ally during the last few decades [21,23–25]. These fisheries have continued to contribute tocoastal economic activities, but with little scientific information on the ecosystem impactsto support their sustainable management.
Conflicts between prawn trawlers and small-scale fishers, as well as environmentalconcerns in the Malindi–Ungwana Bay (Kenya), resulted in the suspension of the trawlfishery in 2006 by the government pending the development of a management plan toaddress the social as well as the environmental issues in the fishery [26]. The managementplan for the fishery was developed through extensive stakeholder consultations, andregulations for the fishery were enacted in 2010 [27]. The key regulations prescribed in themanagement plan included restricting the number of vessels to a maximum of four, themandatory use of turtle excluder devices, regulation on mesh sizes, zoning of fishing area,seasonal bans, restricting trawling time, and submission of a business plan as part of theapplication for a trawl fishing license. To address environmental concerns, the plan requireddetails for full use of by-catch to be part of the business plan. The plan also introduced afisheries observer program to collect scientific data and information to evaluate the statusof the fishery to support reviews of the regulations in the plan. The fisheries observerprogram began by deploying observers on four trawlers in 2016 providing an opportunityto evaluate the impacts of the fishery on the ecosystem.
In this study, the catch and effort data (2011–2019) from the fishery and the retainedand discarded by-catch data between 2016 and 2019 reported by observers, was evaluatedto determine changes in the catch and species composition over time, and the impactsof fishing on the trophic structure of the fish stocks. The results provide information tosupport the management and planning of fishery to guide sustainable use of the resource.
2. Materials and Methods2.1. Study Area
The industrial prawn trawl fisheries operate within the Malindi–Ungwana Bay be-tween latitudes 3◦30′ S and 2◦30′ S and longitudes 40◦00′ N and 41◦00′ N, covering theMalindi and Ungwana Bay Complex (Figure 1). The bay is shallow with a wide continentalshelf, extending between 15 and 60 km offshore. It is one of the areas suitable for trawlingalong the Kenyan coast due to the wide continental shelf and absence of coral reefs [28,29].The benthic habitats are muddy and sandy, some with seagrasses and seaweeds and somerocky areas. The mean depth at high spring tide is 12 m at 1.5 nm and 18.0 m at 6.0 nm.The depth increases rapidly to 100 m after 7 nm and generally decreases northwards. Thesub-stratum of the whole of Malindi–Ungwana Bay is mainly composed of siliciclasticsediments [30]. The area has one of the most productive marine fisheries in Kenya as aresult of the mangroves forests surrounding the bay, topography of the continental shelf inthe bay, and the runoff from the two rivers Sabaki and Tana that drain from a large part ofthe central and eastern regions of Kenya [31,32] (Figure 1).

Diversity 2022, 14, 199 3 of 18
Diversity 2022, 14, x FOR PEER REVIEW 3 of 18
Kenya as a result of the mangroves forests surrounding the bay, topography of the conti-nental shelf in the bay, and the runoff from the two rivers Sabaki and Tana that drain from a large part of the central and eastern regions of Kenya [31,32] (Figure 1).
Figure 1. Map of Kenya (inset) and the Kenyan coastline showing the location of Malindi and Ungwana Bays, the Sabaki and Tana rivers, and the trawling observations in Malindi–Ungwana Bay from 2016–2019.
The bay is influenced by two dominant offshore current regimes: the Northeast mon-soon (NEM) and the Southeast monsoon (SEM). During the SEM, which occurs between April and October, the current circulation is dominated by the northward flow of the East African Coastal Current. During this season, the bay also receives the heaviest river dis-charge from the Tana and Sabaki Rivers [32]. During the NEM, between November and March, the northward-flowing East African Coastal Current meets the southward-flowing Somali Current to form the Equatorial Counter Current, which flows east into the Indian Ocean [33].
Figure 1. Map of Kenya (inset) and the Kenyan coastline showing the location of Malindi andUngwana Bays, the Sabaki and Tana rivers, and the trawling observations in Malindi–Ungwana Bayfrom 2016–2019.
The bay is influenced by two dominant offshore current regimes: the Northeastmonsoon (NEM) and the Southeast monsoon (SEM). During the SEM, which occurs betweenApril and October, the current circulation is dominated by the northward flow of the EastAfrican Coastal Current. During this season, the bay also receives the heaviest riverdischarge from the Tana and Sabaki Rivers [32]. During the NEM, between November andMarch, the northward-flowing East African Coastal Current meets the southward-flowingSomali Current to form the Equatorial Counter Current, which flows east into the IndianOcean [33].
2.2. Data Collection
Fisheries and observer data collected on four industrial trawlers licensed to fish in theMalindi–Ungwana Bay during the prawn fishing season between 1 April and 31 Octoberevery year from 2016–2019 were used in this study. The trawlers are all Kenyan flagged,with one smaller trawler being 22 m long, 9 m wide, and with a gross registered tonnage

Diversity 2022, 14, 199 4 of 18
of 117. The three others were 25 m long, 9.3 m wide, and with a gross registered tonnageof 140. All the trawlers had an engine capacity of 300 HP and were fitted with doublerigged trawl nets with a mesh size of 55–60 mm and 40–45 mm at the funnel and cod end,respectively. The trawl type was steel beam, with square doors opening 6–15 m, footropelength of 38–200 m, with a net mouth vertical opening of 3–6 m and horizontal opening of6–20 m, and bottom-line armor of chain. During the shallow-water trawl fishing operations,trawling duration ranged between 2 to 3 h. The captain used GPS and a fish finder installedin the vessel to locate the fishing ground. The observer was positioned on the upper deck ofthe vessel where he could observe and record the catch and discards following the observerprotocol. The catch from each haul was emptied onto a steel sorting table on the deck, largelive animals mainly sharks, rays, and turtles were quickly returned to the sea to optimizetheir chances of survival. These large animals were recorded by the observer. The prawnswere collected, graded, cleaned, treated, and packed into 2-kg cartons and blast frozen.The fish were sorted into species to be retained and discarded. The retained fish wereput in 25-kg plastic crates, cleaned using pressurized seawater, packed into labeled 5-kgcartons, and blast frozen. As the retained fish were separated from the catch, the remainingunwanted catch was discarded into the sea. The catch that was discarded included small-sized and low-value species. The vessel captains kept a record of the fishing operation andthe catch for each haul and sent a weekly report to the Kenya Fisheries Service (KeFS).
Logbook catch data were used to evaluate the catches and fishing effort, between2011 and 2019. The data consisted of details on each fishing event, including the start andend times and the GPS positions of each haul, catch weights for prawns, finfish, octopus,squids, lobsters, crabs, and others. The catch composition data were collected by scientificobservers from the Kenya Marine and Fisheries Research Institute (KMFRI), followingsampling protocols adopted from Athayde [34]. At the beginning of each observer trip,the vessel and fishing gear information was recorded. For each fishing event, the start andend fishing positions and times were recorded. Large individuals, including fish, sharks,and rays were first removed from the catch, identified, and recorded. The prawns weresorted from the catch and weighed (kg) on a top-loading balance. The remaining catchwas then separated into retained and discards. The retained catch and discards for eachhaul were weighed and sub-samples for identification were collected. The individuals inthe samples were separated into species following standard species identification guidesfor the region [35–38], counted, and weighed. The catch composition was obtained bymultiplying the sample data with the raising factor (i.e., number of portions of which maincatch was divided), using the catch composition estimation method. The total catch weightwas obtained, by adding the total weight of non-random samples (large fish put aside) andthe scaled-up weights obtained from the samples. The data were recorded in a standarddata sheet developed for the observer program.
On disembarking from a completed observer trip, an observer coordinator verifiedthe data during a debriefing session with the observer to correct any mistakes before thedata were entered into a spreadsheet. The data were cleaned by making sure that all namesof species were correct, and the dates, times, GPS positions, and weights were correctlyentered in standard units.
2.3. Coverage of Fishery Observers
Thirty-seven observers were deployed between 2016 and 2019 and recorded a total of1371 hauls. Observations were undertaken in all the months of the shallow-water prawnfishing season in 2017, while a few months of the fishing season were not observed in 2016,2018, and 2019 (Table 1). Overall, between 11% and 19% of the fishery was observed everyyear. The trawling observations taken from 2016 to 2019 are shown in Figure 1.
Diversity 2022, 14, 199 5 of 18
Table 1. Number of observers, deployments, and hauls during the study period.
Year Months Observed Number ofObservers
Number ofDeployments
Total Number ofTrawls
Units of TrawlsRecorded
% ObservedTrawls
2016 Jun, July, Aug, Sept, Oct 7 9 1843 318 17.32017 Apr, May, Jun, Jul, Aug, Sep, Oct 6 10 1963 376 19.22018 May, Jun, Jul, Aug, Oct 6 7 2400 281 11.72019 Aug, May, Jun, Jul, Aug, Sep, Oct 9 11 2325 396 17.0
2.4. Data Analysis
The variation in the nominal total catch, discarded, and retained catch was evaluatedusing time-series graphs. Nominal catches were used to allow comparisons with previousstudies, which also used nominal catches. The species composition of the retained anddiscarded catches was described using two metrics: species diversity (Shannon) and meantrophic level. The trophic level for each species was obtained from FISHBASE [39]. Themean trophic level was calculated as:
TLL =n
∑i=1
Yi · TLi/YL (1)
where Yi is the catch of species i, TL is the trophic level of species i.The Mann–Whitney U-test was then used to compare the differences in species di-
versity and the mean trophic level of the total catch in the two bays for the four years(2016–2019).
The species composition of the catches was investigated using nonmetric multidimen-sional scaling (nMDS) ordination on standardized and square root transformed data tocompare differences between the months, years, and retained vs. discarded species. A hier-archical group-average clustering based on a Bray–Curtis similarity matrix was overlaid toelucidate similarities between seasons, depth, and sites [40]. The relative distance of thedata points provided a measure of similarity. A posterior analysis of similarity (ANOSIM)test was applied to check for significant differences in the species composition betweenyears, retained and discarded species, followed by a similarity of percentage (SIMPER)analysis, which identified species that contributed most to dissimilarities between the years,retained and discarded species. The statistical analyses were conducted using STATISTICA(StatSoft, Inc., Tulsa, OK, USA) and PRIMER [41].
3. Results3.1. Catch and Effort
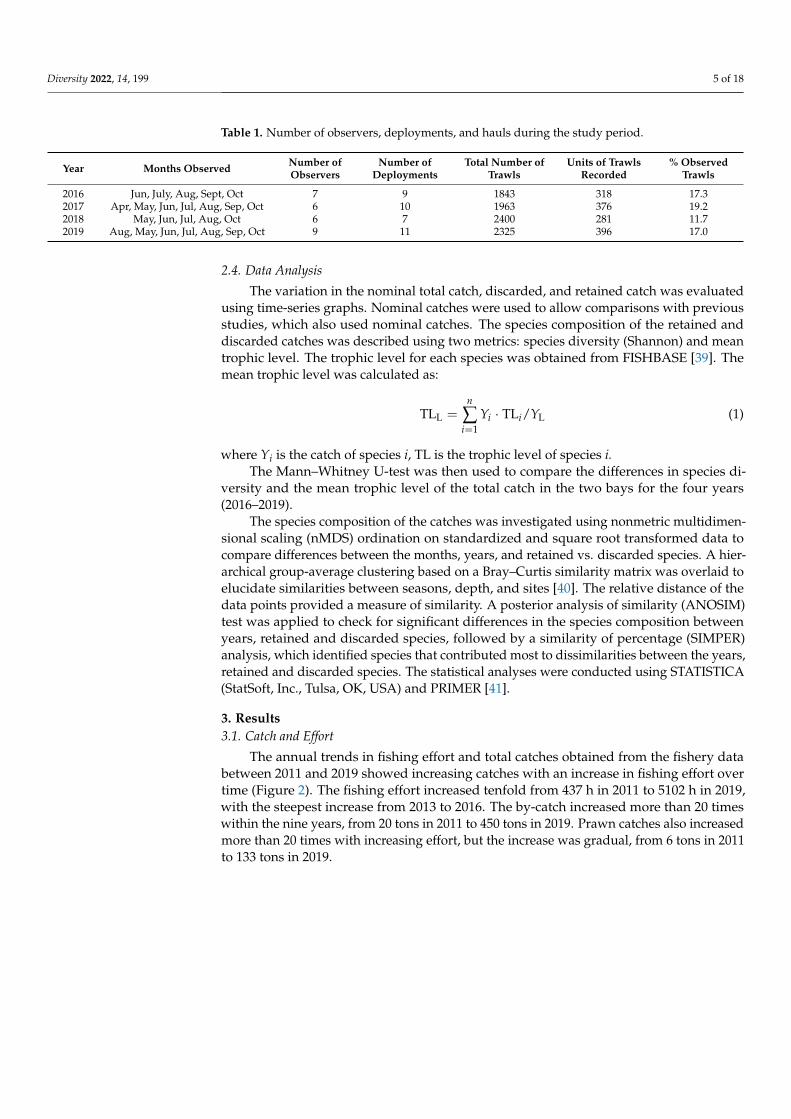
The annual trends in fishing effort and total catches obtained from the fishery databetween 2011 and 2019 showed increasing catches with an increase in fishing effort overtime (Figure 2). The fishing effort increased tenfold from 437 h in 2011 to 5102 h in 2019,with the steepest increase from 2013 to 2016. The by-catch increased more than 20 timeswithin the nine years, from 20 tons in 2011 to 450 tons in 2019. Prawn catches also increasedmore than 20 times with increasing effort, but the increase was gradual, from 6 tons in 2011to 133 tons in 2019.
Diversity 2022, 14, 199 6 of 18Diversity 2022, 14, x FOR PEER REVIEW 6 of 18
Figure 2. Annual trends in trawl catch and effort (±SE) in Malindi–Ungwana Bay in the 2011–2019 period.
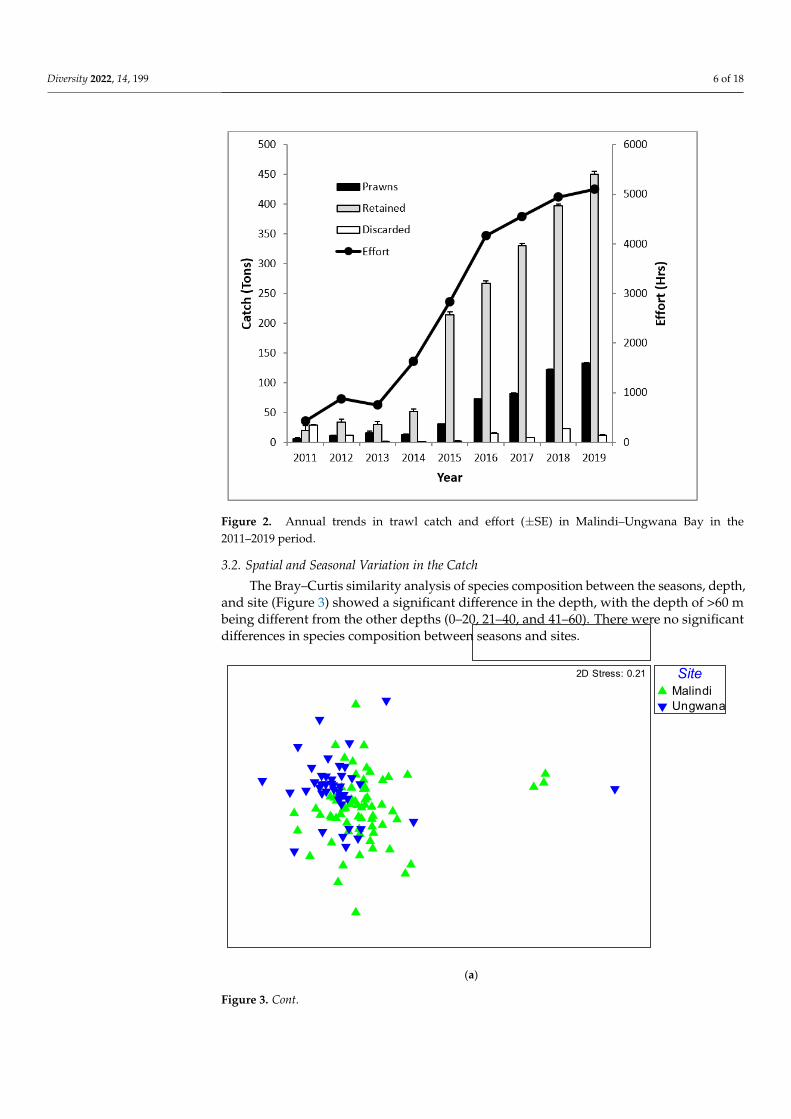
3.2. Spatial and Seasonal Variation in the Catch The Bray–Curtis similarity analysis of species composition between the seasons,
depth, and site (Figure 3) showed a significant difference in the depth, with the depth of >60 m being different from the other depths (0–20, 21–40, and 41–60). There were no sig-nificant differences in species composition between seasons and sites.
(a)
SiteMalindiUngwana
2D Stress: 0.21
Figure 2. Annual trends in trawl catch and effort (±SE) in Malindi–Ungwana Bay in the2011–2019 period.
3.2. Spatial and Seasonal Variation in the Catch
The Bray–Curtis similarity analysis of species composition between the seasons, depth,and site (Figure 3) showed a significant difference in the depth, with the depth of >60 mbeing different from the other depths (0–20, 21–40, and 41–60). There were no significantdifferences in species composition between seasons and sites.
Diversity 2022, 14, x FOR PEER REVIEW 6 of 18
Figure 2. Annual trends in trawl catch and effort (±SE) in Malindi–Ungwana Bay in the 2011–2019 period.
3.2. Spatial and Seasonal Variation in the Catch The Bray–Curtis similarity analysis of species composition between the seasons,
depth, and site (Figure 3) showed a significant difference in the depth, with the depth of >60 m being different from the other depths (0–20, 21–40, and 41–60). There were no sig-nificant differences in species composition between seasons and sites.
(a)
SiteMalindiUngwana
2D Stress: 0.21
Figure 3. Cont.

Diversity 2022, 14, 199 7 of 18Diversity 2022, 14, x FOR PEER REVIEW 7 of 18
(b)
(c)
Figure 3. Bray–Curtis similarity plots of species composition between the (a) sites, (b) depth, and (c) seasons.
3.3. Variation in Diversity and Trophic Levels There were no significant differences in the species diversity between the two bays
and the years (Mann–Whitney U-test, U = 8, P = 1.00). The annual Shannon diversity index for both bays together ranged from 2.6 (±0.10 SE) in 2018 to 3.0 (±0.1 SE) in 2017. Malindi
Depth21-40m0-20m41-60m>60m
2D Stress: 0.21
SeasonNEMSEM
2D Stress: 0.21
Figure 3. Bray–Curtis similarity plots of species composition between the (a) sites, (b) depth, and(c) seasons.
3.3. Variation in Diversity and Trophic Levels
There were no significant differences in the species diversity between the two bays andthe years (Mann–Whitney U-test, U = 8, P = 1.00). The annual Shannon diversity index forboth bays together ranged from 2.6 (±0.10 SE) in 2018 to 3.0 (±0.1 SE) in 2017. Malindi Bayhad the highest species diversity of 3.1 (±0.15 SE) in 2017 and the lowest species diversityof 2.6 (±0.12 SE) in 2018 (Figure 4). Ungwana Bay had the highest species diversity(2.9 ± 0.13 SE) in 2017 and 2019.

Diversity 2022, 14, 199 8 of 18
Diversity 2022, 14, x FOR PEER REVIEW 8 of 18
Bay had the highest species diversity of 3.1 (±0.15 SE) in 2017 and the lowest species di-versity of 2.6 (±0.12 SE) in 2018 (Figure 4). Ungwana Bay had the highest species diversity (2.9 ± 0.13 SE) in 2017 and 2019.
The results of the Mann–Whitney U-test on the mean trophic levels showed no sig-nificant differences between the two bays and the years (Mann–Whitney U-test, U = 6, P = 0.739). The annual mean trophic level for both bays combined from 2016 to 2019 ranged from 3.5 (±0.03 SE) to 3.9 (±0.02 SE). The highest mean trophic level was in 2018. The mean trophic levels of the two bays were similar from 2016 to 2019 with Ungwana Bay having slightly higher mean trophic levels than Malindi Bay. Both bays had a high mean trophic level in 2018 (Figure 4).
Figure 4. Annual mean trophic level and mean species diversity: general and on each bay. Error bars: SE.
3.4. Retained and Discarded Catch The relative amounts of catch recorded by observers showed that retained catch in-
creased between 2016 and 2019 (Figure 5). The discarded catch was highest in 2017 but gradually decreased in 2018 and 2019. The overall target prawn: total by-catch ratio was 1:9 from 2017 to 2019 compared to 1:3 during 2016. The prawn: discarded catch ranged from 1:1.7 (2016) to 1:3.3 (2017). The trends in the target catch, retained by-catch, and dis-carded by-catch indicated a relative reduction in target catch (Figure 5). On average the total catch comprised 16% target, 59% retained, and 25% discards. The proportion of the target prawns was highest in 2016 but declined through the other years (Figure 5).
Figure 4. Annual mean trophic level and mean species diversity: general and on each bay. Errorbars: SE.
The results of the Mann–Whitney U-test on the mean trophic levels showed no sig-nificant differences between the two bays and the years (Mann–Whitney U-test, U = 6,P = 0.739). The annual mean trophic level for both bays combined from 2016 to 2019 rangedfrom 3.5 (±0.03 SE) to 3.9 (±0.02 SE). The highest mean trophic level was in 2018. The meantrophic levels of the two bays were similar from 2016 to 2019 with Ungwana Bay havingslightly higher mean trophic levels than Malindi Bay. Both bays had a high mean trophiclevel in 2018 (Figure 4).
3.4. Retained and Discarded Catch
The relative amounts of catch recorded by observers showed that retained catchincreased between 2016 and 2019 (Figure 5). The discarded catch was highest in 2017 butgradually decreased in 2018 and 2019. The overall target prawn: total by-catch ratio was 1:9from 2017 to 2019 compared to 1:3 during 2016. The prawn: discarded catch ranged from1:1.7 (2016) to 1:3.3 (2017). The trends in the target catch, retained by-catch, and discardedby-catch indicated a relative reduction in target catch (Figure 5). On average the total catchcomprised 16% target, 59% retained, and 25% discards. The proportion of the target prawnswas highest in 2016 but declined through the other years (Figure 5).
3.5. Composition of Retained and Discarded Catch
Overall, 475 species were recorded by observers during the study period with thehighest number of species (275) recorded in 2019. Among the top 10 retained and discardedspecies in terms of weight, Otolithes ruber and Pomadasys maculatus were captured in allyears, with O. ruber comprising 10 to 20% of the retained catch (Table 2). None of thetargeted prawn species were in the list of top-ten retained species. Three species Pellonaditchela, Galeichthys feliceps, and Secutor insidiator were captured in the top 10 of the discardedspecies in all years, with P. ditchela being the most discarded species (comprising 14% ofdiscards). Some species retained also appeared in the list of discards, e.g., P. ditchela,S. insidiator, G. feliceps, Trichiurus lepturus, and Leiognathus equulus.

Diversity 2022, 14, 199 9 of 18Diversity 2022, 14, x FOR PEER REVIEW 9 of 18
Figure 5. Trawl-fishery target retained and discarded catch (±SE) recorded by observers between 2016 and 2019 in Malindi–Ungwana Bay.
3.5. Composition of Retained and Discarded Catch Overall, 475 species were recorded by observers during the study period with the
highest number of species (275) recorded in 2019. Among the top 10 retained and dis-carded species in terms of weight, Otolithes ruber and Pomadasys maculatus were captured in all years, with O. ruber comprising 10 to 20% of the retained catch (Table 2). None of the targeted prawn species were in the list of top-ten retained species. Three species Pellona ditchela, Galeichthys feliceps, and Secutor insidiator were captured in the top 10 of the dis-carded species in all years, with P. ditchela being the most discarded species (comprising 14% of discards). Some species retained also appeared in the list of discards, e.g., P. ditch-ela, S. insidiator, G. feliceps, Trichiurus lepturus, and Leiognathus equulus.
Table 2. Top-ten species by weight of retained and discarded species recorded from 2016 to 2019. Weight in kg (percentage).
2016 2017 2018 2019 Retained
Otolithes ruber 8581.48 (20.37) 9183.81 (10.5) 6505.43 (13.35) 13,649.81 (11.12) Pomadasys maculatus 3063.06 (7.27) 3687.24 (4.22) 2711.51 (5.56) 5777.21 (4.71)
Galeichthys feliceps 2770.25 (6.58) 2760.77 (3.16) Johnius dussumieri 2579.50 (6.12)
Lobotes surinamensis 2167.08 (5.14) Upeneus sulphureus 1965.95 (4.67) 5326.79 (6.09)
Sphyraena jello 1695.13 (4.02) 2667.26 (3.05) 1835.36 (3.82) Leiognathus equulus 1531.83 (3.64 3360.49 (3.84) Trichiurus lepturus 1381.24 (3.28)
Pomadasys multimaculatus 1335.00 (3.17) Discards
Pellona ditchela 2393.18 (14.6) 7605.41 (14.33) 2695.23 (13.1) 4133.17 (12.35) Trichiurus lepturus 1729.85 (10.55) 4465.77 (8.41) 1119.30 (5.44) Galeichthys feliceps 1531.19 (9.34) 2634.68 (4.96) 1198.54 (5.83) 1570.19 (4.69) Secutor insidiator 1394.63 (8.51) 5668.83 (10.68) 2206.81 (10.73) 2226.35 (6.65)
Photopectoralis bindus 1177.52 (7.18) 1418.39 (2.67)
Figure 5. Trawl-fishery target retained and discarded catch (±SE) recorded by observers between2016 and 2019 in Malindi–Ungwana Bay.
Table 2. Top-ten species by weight of retained and discarded species recorded from 2016 to 2019.Weight in kg (percentage).
2016 2017 2018 2019
RetainedOtolithes ruber 8581.48 (20.37) 9183.81 (10.5) 6505.43 (13.35) 13,649.81 (11.12)
Pomadasys maculatus 3063.06 (7.27) 3687.24 (4.22) 2711.51 (5.56) 5777.21 (4.71)Galeichthys feliceps 2770.25 (6.58) 2760.77 (3.16)Johnius dussumieri 2579.50 (6.12)
Lobotes surinamensis 2167.08 (5.14)Upeneus sulphureus 1965.95 (4.67) 5326.79 (6.09)
Sphyraena jello 1695.13 (4.02) 2667.26 (3.05) 1835.36 (3.82)Leiognathus equulus 1531.83 (3.64 3360.49 (3.84)Trichiurus lepturus 1381.24 (3.28)
Pomadasys multimaculatus 1335.00 (3.17)
DiscardsPellona ditchela 2393.18 (14.6) 7605.41 (14.33) 2695.23 (13.1) 4133.17 (12.35)
Trichiurus lepturus 1729.85 (10.55) 4465.77 (8.41) 1119.30 (5.44)Galeichthys feliceps 1531.19 (9.34) 2634.68 (4.96) 1198.54 (5.83) 1570.19 (4.69)Secutor insidiator 1394.63 (8.51) 5668.83 (10.68) 2206.81 (10.73) 2226.35 (6.65)
Photopectoralis bindus 1177.52 (7.18) 1418.39 (2.67)Nematopalaemon tenuipes 1078.18 (6.58) 1347.20 (6.55)
Thryssa vitrirostris 982.82 (6) 1257.57 (6.11) 1136.33 (3.4)Thryssa malabarica 567.22 (3.46)
Leiognathus equulus 407.09 (2.48) 2543.74 (12.37) 1850.31 (5.53)Johnius amblycephalus 371.22 (2.27) 1527.96 (2.88)
Secutor ruconius 2554.29 (4.81)
The result of the nMDS ordination analysis of the catch data recorded by observersshowed a clear difference between the compositions of retained and discarded species, anindication that the selection is not random (Figure 6). ANOSIM revealed a strong dissim-ilarity between the composition of retained and discarded species (R = 0.709, p = 0.001).Three species were most responsible for 86.38 of the average dissimilarity between retainedand discarded species: P. ditchela, Nematopalaemon tenuipes, and S. insidiator (Table 3).

Diversity 2022, 14, 199 10 of 18
Diversity 2022, 14, x FOR PEER REVIEW 10 of 18
Nematopalaemon tenuipes 1078.18 (6.58) 1347.20 (6.55) Thryssa vitrirostris 982.82 (6) 1257.57 (6.11) 1136.33 (3.4) Thryssa malabarica 567.22 (3.46)
Leiognathus equulus 407.09 (2.48) 2543.74 (12.37) 1850.31 (5.53) Johnius amblycephalus 371.22 (2.27) 1527.96 (2.88)
Secutor ruconius 2554.29 (4.81)
The result of the nMDS ordination analysis of the catch data recorded by observers showed a clear difference between the compositions of retained and discarded species, an indication that the selection is not random (Figure 6). ANOSIM revealed a strong dissim-ilarity between the composition of retained and discarded species (R = 0.709, p = 0.001). Three species were most responsible for 86.38 of the average dissimilarity between re-tained and discarded species: P. ditchela, Nematopalaemon tenuipes, and S. insidiator (Table 3).
The nMDS ordination of the catches between years, grouped 2016 and 2017 as more similar in species composition (ANOSIM, R = 0.23) influenced by the composition of re-tained species (Figure 7), while all derived pairwise comparisons with 2018 and 2019 catches were strongly dissimilar (ANOSIM R values of 0.99). However, the observed dis-similarities between years were not statistically significant (p > 0.05). The species compo-sition of discarded species did not have a clear pattern as that of the retained catch. The discarded species in 2016 and July and October 2018 were dissimilar from those of 2017, some months of 2018, and 2019 (Figure 8). Discarded species in September 2017 and May 2019 were similar, while those in August 2017 and July 2019 were dissimilar to all the other observed months (Figure 8).
Figure 6. Non-metric multidimensional scaling ordination plots of retained vs. discarded species.
Table 3. Summary of SIMPER analysis showing the average dissimilarity in the species composition between retained and discarded catch and three species that contributed most to the overall dissim-ilarities.
Species Average Abundance (%) Dissimilarity Contrib% Cum.% Retained Discarded Av.Diss = 86.38
Pellona ditchela 1.11 3.5 2.83 3.28 3.28 Nematopalaemon tenuipes 0.01 2.3 2.58 2.99 6.27
Secutor insidiator 0.39 2.66 2.49 2.88 9.15
Figure 6. Non-metric multidimensional scaling ordination plots of retained vs. discarded species.
Table 3. Summary of SIMPER analysis showing the average dissimilarity in the species com-position between retained and discarded catch and three species that contributed most to theoverall dissimilarities.
Species Average Abundance (%) Dissimilarity Contrib% Cum.%
Retained Discarded Av.Diss = 86.38Pellona ditchela 1.11 3.5 2.83 3.28 3.28
Nematopalaemon tenuipes 0.01 2.3 2.58 2.99 6.27Secutor insidiator 0.39 2.66 2.49 2.88 9.15
The nMDS ordination of the catches between years, grouped 2016 and 2017 as moresimilar in species composition (ANOSIM, R = 0.23) influenced by the composition ofretained species (Figure 7), while all derived pairwise comparisons with 2018 and 2019catches were strongly dissimilar (ANOSIM R values of 0.99). However, the observeddissimilarities between years were not statistically significant (p > 0.05). The speciescomposition of discarded species did not have a clear pattern as that of the retained catch.The discarded species in 2016 and July and October 2018 were dissimilar from those of2017, some months of 2018, and 2019 (Figure 8). Discarded species in September 2017 andMay 2019 were similar, while those in August 2017 and July 2019 were dissimilar to all theother observed months (Figure 8).
Diversity 2022, 14, x FOR PEER REVIEW 11 of 18
Figure 7. Non-metric multidimensional scaling ordination plots for retained catches in the months of different years.
Result of SIMPER for the retained species identified O. ruber, Panulirus homarus, Pe-naeus indicus, and Penaeus japonicus as most responsible for the dissimilarity between 2016 and the other years (2017, 2018, and 2019), while P. homarus was most responsible for the dissimilarity between 2019 and the other years (2016, 2017, and 2018), contributing be-tween 4.4 and 4.8% (Table 4). For discarded species, N. tenuipes contributed most to the dissimilarity between 2016 and the other years, contributing between 4 to 11% (Table 5).
Table 4. Summary of SIMPER analysis showing the average dissimilarity in the composition of re-tained species across the years studied and three species that contributed most to the overall dis-similarities.
Species Average Abundance (%) Dissimilarity Contrib% Cum.% 2016 2017 Av.Diss = 50.63
Upeneus vittatus 0.6 1.68 1.51 2.98 2.98 Pellona ditchela 1.89 1.92 1.42 2.81 5.79
Plesionika martia 1.26 0.37 1.36 2.69 8.48 2016 2018 Av.Diss = 81.98
Otolithes ruber 3.62 0.06 3.49 4.25 4.25 Penaeus japonicus 0.68 3.9 3.2 3.91 8.16 Galeichthys feliceps 2.72 0.02 2.64 3.23 11.38
2016 2019 Av.Diss = 86.74 Panulirus homarus 0 3.89 3.78 4.36 4.36
Penaeus indicus 3.64 0 3.43 3.95 8.31 Otolithes ruber 3.62 0 3.41 3.93 12.24
2017 2018 Av.Diss = 79.88 Penaeus japonicus 0.87 3.9 2.95 3.69 3.69
Metapenaeus stebbingi 0.26 3 2.62 3.28 6.97 Penaeus indicus 3.64 1.14 2.54 3.18 10.15
2017 2019 Av.Diss = 83.23 Panulirus homarus 0 3.89 3.73 4.49 4.49
Penaeus indicus 3.64 0 3.42 4.11 8.6 Uroconger lepturus 0 2.51 2.44 2.93 11.53
2018 2019 Av.Diss = 82.48 Panulirus homarus 0 3.89 3.96 4.8 4.8 Penaeus japonicus 3.9 1 2.99 3.63 8.43
Figure 7. Non-metric multidimensional scaling ordination plots for retained catches in the months ofdifferent years.

Diversity 2022, 14, 199 11 of 18
Diversity 2022, 14, x FOR PEER REVIEW 12 of 18
Metapenaeus stebbingi 3 0.23 2.72 3.3 11.72
Figure 8. Non-metric multidimensional scaling ordination plots for discarded catches in the months of different years.
Table 5. Summary results of SIMPER showing the average dissimilarity in the discarded species composition across the years studied and three species that contributed most to the overall dissim-ilarities.
Species Average Abundance (%) Dissimilarity Contrib% Cum.% 2016 2017 Av.Diss = 68.29
Nematopalaemon tenuipes 6.81 0.73 7.48 10.95 10.95 Thryssa setirostris 0.67 2.7 2.55 3.73 14.69
Trichiurus lepturus 2.2 3.03 2.52 3.69 18.38 2016 2018 Av.Diss = 64.54 Contrib% Cum.%
Nematopalaemon tenuipes 6.81 2.25 6.87 10.65 10.65 Leiognathus equulus 0.82 1.98 2.35 3.65 14.3
Secutor insidiator 1.74 3.24 2.34 3.63 17.93 2016 2019 Av.Diss = 69.51 Contrib% Cum.%
Nematopalaemon tenuipes 6.81 0.17 8.09 11.63 11.63 Pellona ditchela 2.6 4.29 2.44 3.5 15.14
Thryssa setirostris 0.67 2.38 2.17 3.12 18.25 2017 2018 Av.Diss = 65.07 Contrib% Cum.%
Nematopalaemon tenuipes 0.73 2.25 3.07 4.72 4.72 Trichiurus lepturus 3.03 2.08 2.36 3.63 8.34 Antennarius pictus 2.05 0 2.34 3.59 11.93
2017 2019 Av.Diss = 66.28 Contrib% Cum.% Trichiurus lepturus 3.03 1.34 2.4 3.62 3.62
Pellona ditchela 2.94 4.29 2.34 3.53 7.15 Antennarius pictus 2.05 0 2.14 3.22 10.38
2018 2019 Av.Diss = 61.76 Contrib% Cum.% Nematopalaemon tenuipes 2.25 0.17 2.86 4.63 4.63
Gazza minuta 0.16 1.94 2.2 3.56 8.19 Leiognathus equulus 1.98 2.28 2.19 3.54 11.73
Figure 8. Non-metric multidimensional scaling ordination plots for discarded catches in the monthsof different years.
Result of SIMPER for the retained species identified O. ruber, Panulirus homarus,Penaeus indicus, and Penaeus japonicus as most responsible for the dissimilarity between2016 and the other years (2017, 2018, and 2019), while P. homarus was most responsiblefor the dissimilarity between 2019 and the other years (2016, 2017, and 2018), contributingbetween 4.4 and 4.8% (Table 4). For discarded species, N. tenuipes contributed most to thedissimilarity between 2016 and the other years, contributing between 4 to 11% (Table 5).
Table 4. Summary of SIMPER analysis showing the average dissimilarity in the compositionof retained species across the years studied and three species that contributed most to theoverall dissimilarities.
Species Average Abundance (%) Dissimilarity Contrib% Cum.%
2016 2017 Av.Diss = 50.63Upeneus vittatus 0.6 1.68 1.51 2.98 2.98Pellona ditchela 1.89 1.92 1.42 2.81 5.79
Plesionika martia 1.26 0.37 1.36 2.69 8.48
2016 2018 Av.Diss = 81.98Otolithes ruber 3.62 0.06 3.49 4.25 4.25
Penaeus japonicus 0.68 3.9 3.2 3.91 8.16Galeichthys feliceps 2.72 0.02 2.64 3.23 11.38
2016 2019 Av.Diss = 86.74Panulirus homarus 0 3.89 3.78 4.36 4.36
Penaeus indicus 3.64 0 3.43 3.95 8.31Otolithes ruber 3.62 0 3.41 3.93 12.24
2017 2018 Av.Diss = 79.88Penaeus japonicus 0.87 3.9 2.95 3.69 3.69
Metapenaeus stebbingi 0.26 3 2.62 3.28 6.97Penaeus indicus 3.64 1.14 2.54 3.18 10.15
2017 2019 Av.Diss = 83.23Panulirus homarus 0 3.89 3.73 4.49 4.49
Penaeus indicus 3.64 0 3.42 4.11 8.6Uroconger lepturus 0 2.51 2.44 2.93 11.53
2018 2019 Av.Diss = 82.48Panulirus homarus 0 3.89 3.96 4.8 4.8Penaeus japonicus 3.9 1 2.99 3.63 8.43
Metapenaeus stebbingi 3 0.23 2.72 3.3 11.72

Diversity 2022, 14, 199 12 of 18
Table 5. Summary results of SIMPER showing the average dissimilarity in the discarded species com-position across the years studied and three species that contributed most to the overall dissimilarities.
Species Average Abundance (%) Dissimilarity Contrib% Cum.%
2016 2017 Av.Diss = 68.29Nematopalaemon tenuipes 6.81 0.73 7.48 10.95 10.95
Thryssa setirostris 0.67 2.7 2.55 3.73 14.69Trichiurus lepturus 2.2 3.03 2.52 3.69 18.38
2016 2018 Av.Diss = 64.54 Contrib% Cum.%Nematopalaemon tenuipes 6.81 2.25 6.87 10.65 10.65
Leiognathus equulus 0.82 1.98 2.35 3.65 14.3Secutor insidiator 1.74 3.24 2.34 3.63 17.93
2016 2019 Av.Diss = 69.51 Contrib% Cum.%Nematopalaemon tenuipes 6.81 0.17 8.09 11.63 11.63
Pellona ditchela 2.6 4.29 2.44 3.5 15.14Thryssa setirostris 0.67 2.38 2.17 3.12 18.25
2017 2018 Av.Diss = 65.07 Contrib% Cum.%Nematopalaemon tenuipes 0.73 2.25 3.07 4.72 4.72
Trichiurus lepturus 3.03 2.08 2.36 3.63 8.34Antennarius pictus 2.05 0 2.34 3.59 11.93
2017 2019 Av.Diss = 66.28 Contrib% Cum.%Trichiurus lepturus 3.03 1.34 2.4 3.62 3.62
Pellona ditchela 2.94 4.29 2.34 3.53 7.15Antennarius pictus 2.05 0 2.14 3.22 10.38
2018 2019 Av.Diss = 61.76 Contrib% Cum.%Nematopalaemon tenuipes 2.25 0.17 2.86 4.63 4.63
Gazza minuta 0.16 1.94 2.2 3.56 8.19Leiognathus equulus 1.98 2.28 2.19 3.54 11.73
4. Discussion4.1. Catch and Effort
This study analyzed the catch trends using fisheries logbook data and observer datawith the aim of determining the impact of fishing on the ecosystem. The catch and effortincreased during the nine years of operation with the prawn and fish catch ranging from6 to 133 tons and 20 to 450, respectively, from 2011 to 2019. Previously reported averageannual landings in the bay were higher between 257 and 400, and 315 and 602 tons ofprawns and fish, respectively, between 2001 and 2006 [42]. The average prawn landings inthe Malindi–Ungwana Bay were 400 tons per year in the 1970s, 1980s, and 1990s [43]. Thus,the prawn catch is yet to reach these earlier reported catches. The lower total annual catchescould be attributed to the restricted fishing effort, with six months annual fishing seasonand only during the daytime from 6 a.m. to 6 p.m. required by the management planregulations. In addition, the regulations in the management plan zoned < 3 nm offshoreas no trawling to reduce the interaction of trawlers with small-scale fishing gears. Stocksurveys have shown that prawn stocks are higher close to the shore and the estuaries [42,44].The zoning in the management regulations moved the trawlers from the centers of prawnstocks concentration resulting in the lower catch.
4.2. Spatial and Seasonal Variation
Overall, in this study, no significant differences in the species composition betweenthe seasons and the two bays (Malindi and Ungwana) were found. However, distinctabundance and species composition patterns have been reported in the same bay forprawns driven by the bottom type and depth [45]. However, depth showed a significantdifference in the species composition at depths > 60 m. These findings indicate that therewere no changes in the species composition over the four years of observations, and the

Diversity 2022, 14, 199 13 of 18
dominant species in the catches have remained the same. However, the species compositionin the bay is influenced by the depth.
4.3. Diversity and Trophic Levels
Species diversity in the catch did not vary significantly and was dominated by a fewspecies and families, similar to other trawl fisheries in the tropics [46,47]. A previous studyreported G. feliceps, O. ruber, Johnius amblycephalus, Johnius dussumieri, Lobotes surinamensis,L. equulus, P. maculatus as the dominant species in the trawl catches of Malindi–UngwanaBay [48]. These species were also reported as dominant in this study.
Results of the nMDS analysis indicated that species composition from prawn trawlingdiffered over the four years. The species contributing to differences in the retained catchin the four years were P. indicus, O. ruber, and P. homarus with Otolithes ruber being mostabundant. In particular, P. homarus contribute to the dissimilarity of the catches in 2019indicating a shift in the distribution of fishing effort to deeper water. Based on numbers,N. tenuipes and P. ditchella were responsible for the difference in species composition of thediscarded catch. Nematopalaemon tenuipes is discarded because it is considered to be toosmall and of low economic value [49]. Pellona ditchela also appeared in the top 10 speciesin terms of weight. In a previous study, G. feliceps and P. ditchela were the most dominantspecies contributing to the highest spatial dissimilarity in the inshore areas of the bay [50].Overall, in this study, no significant differences in the species composition between theseasons and the two bays (Malindi and Ungwana) were found. However, depth showed asignificant difference in the species composition at depths > 60 m. These findings indicatethat there were no changes in the species composition over the four years of observations,and the dominant species in the catches have remained the same. However, the speciescomposition in the bay is influenced by the depth.
Mean trophic levels indicate the status of resource exploitation and is an indicatorof fishery-induced impacts at the food web level [51,52]. The trophic levels in this study(3.45–3.96) were comparable with the values between 3.2–4 recorded in an earlier study [48],an indication of no marked variation and a relatively stable ecosystem, meaning that theimpacts of fishing at the current level has not surpassed the self-regulatory capacity of thebay [51,53].
4.4. Retained and Discarded Catch
Globally, the trawl fishery is characterized by a high by-catch rate, with prawn trawlingreporting prawn to by-catch ratios of between 1:3 to 1:15 [54,55]. In this study, the prawnto by-catch ratio decreased through the four years and the prawn to discarded catch ratioof 1:1.7 to 1:3.3 is comparable to the prawn to discarded by-catch ratio of 1:1.5 obtained in2012 [42]. The by-catch in this study made about 84% of the catch of which 59% comprisedretained by-catch and 25% of discarded by-catch. Other studies estimated the total by-catch from prawn trawling in the Malindi–Ungwana Bay to be 70–80% by weight [43]. InMozambique, the by-catch comprised about 80% of the total catches [21]. These estimatesof by-catch are comparable with those found in this study and are an indication of highamounts of by-catch resulting from prawn trawling.
The reasons for discarding by-catch are attributed to lack of storage space and thelow value of small fish [56]. The discarded by-catch reported for the Malindi–UngwanaBay comprised different families, mainly the Leiognathidae, Clupeidae, Dasyatidae, andCarcharhinidae (This study, [43]). Non-commercial fishes contributed more than 43% of thediscards, whereas juveniles of some commercially important species, such as O. ruber andJohnius sp. (Sciaenidae), and Pomadasys sp. (Haemulidae), made up 25% of discards [43,57].In comparison to our study, the families that were discarded were mainly Pristigasteridae,Trichiuridae, and Ariidae while the species retained included O. ruber, P. maculatus, G.feliceps among others. Thus, the commercially important species that were previously beingdiscarded were now being retained. Species that were previously discarded may have
Diversity 2022, 14, 199 14 of 18
gained acceptance and value in the local market making retaining them cost-effective. Thefishing industry has been exploring ways of maximizing the use of by-catch.
4.5. Composition of Retained and Discarded Catch
Overall, the number of all species reported in this study increased with fishing effortover the years, with the highest 275 in 2019. The authors of [48] reported 223 species, whilein a bottom trawl survey in the bay in 2012, 66 fish species in 43 families were found withthe highest biomass in the shallow areas (<50 m) [58]. In an earlier survey, the number ofspecies collected was 160 species belonging to 61 families [44]. This shows that the numberof species reported varied from the different studies, with the highest reported in this studyattributed to the length of time over which the fishery observations were made.
Fish species contributed higher biomass compared to the target prawns, which wereranked below the 10 top species. This is the general observation in most prawn trawlfisheries of the world where large amounts of non-target species are caught [59,60]. InMalindi–Ungwana Bay, of the five target penaeid prawns, P. indicus is the most dom-inant [61]. Though seasonal variations influence prawn catches, P indicus along withP. monodon, P. monocerous, P. semisulcatus, and P. japonicus are common prawn species in thebay [25,49,50,62].
Concerns have been raised regarding the overfishing by trawlers of species importantin small-scale fisheries in the Western Indian Ocean (WIO) region, including O. ruber [63].The species is a common trawl fishery by-catch along the East African coast and is usu-ally retained for its high commercial value. Reduced abundance of O. ruber along withother common species associated with prawn trawling could result in ecological changes(e.g., altered predator–prey relationships) and impact the artisanal fishers’ catches [63].Predator–prey relationships between finfish and prawns may contribute to the resultinghigh abundance of finfish by-catch [64]. Most of the finfish abundant in the by-catch, suchas O. ruber, P. maculatus, P. ditchela, Thryssa vitrirostris, and L. equulus, Terapon jarbua, arepredators of penaeid prawns [64,65].
4.6. Reduction and Use of By-Catch
Discarded catch from prawn trawling has been a concern for a long time, with pressure toreduce the capture of non-commercial species increasing [5,60]. The by-catch in prawn trawlingcan be reduced but cannot be eliminated, and it is estimated that present selectivity technologyand management can reduce by-catch by 30 percent at most [21]. By-catch reducing devices areincreasingly being used in prawn trawling to reduce the amounts of by-catch, and in some areas,they have been successful and beneficial to prawn fisheries [60,66–68].
Besides the efforts to reduce the by-catch, the complete utilization of catch is alsoconsidered an important way of increasing the benefits from the fisheries [69]. In China, theby-catch was used for the aquaculture industry [70]. In Madagascar, by-catch is normallysold for human consumption [69]. In Kenya, the retained by-catch is offloaded in urbancenters, mainly Malindi and Mombasa, and sold to women in the fish retail business (locallyknown as “Mama karanga”) [71]. Increasing the amount of by-catch that reaches the marketwould support more livelihoods through trade and support food security, particularly inthe urban centers within the coast region. The utilization of by-catch as food reduces theethical argument against the un-selective fishing of trawl fisheries.
5. Conclusions
The Malindi–Ungwana Bay fishery is a good example of the competing interests offisheries resource use and ecosystem conservation needs between resource users; includingindustrial fishing, small-scale fishing, as well as recreational use of the ecosystem, in whichindustrial fishing has been criticized for environmental degradation and large wastagein form of discards. Consequently, several studies have been undertaken to assess theMalindi–Ungwana Bay fishery addressing the status of the fishery [49,61], ecologicalindicators affecting the fishery [72], and resource use and distribution [42,50]. This study

Diversity 2022, 14, 199 15 of 18
evaluated the state of the shallow-water prawn trawl fishery of the Malindi–UngwanaBay based on some catch and ecosystem-based indices, after the implementation of themanagement plan in 2010. The results showed an increase in fishing effort and catch overthe four years, 2016 to 2019. The levels of by-catch remained high, while the proportion ofretained by-catch increased over the years. The species composition of the trawl catchesin the two bays was similar and the dominating species in the Malindi–Ungwana Bayremained the same over the years. There was a distinct difference between the retainedand discarded species, and differences in species composition of retained catch over time.However, the evaluation showed no marked decline in the status of the stock in the baybased on the diversity and tropic indices. We recommend that more of the discarded speciesare retained to ensure that the fishery is less wasteful.
Author Contributions: Conceptualization, E.N.F. and E.N.K.; Data curation, E.N.F., J.O.O., N.W., P.T.and E.N.K.; Formal analysis, E.N.F., J.O.O., G.M.O. and E.N.K.; Methodology, E.N.F., J.O.O., G.M.O.,P.T. and G.W.M.; Validation, E.N.F., J.O.O., N.W., E.N.K., G.M.O. and G.W.M.; Writing—original draft,E.N.F.; Writing—review and editing, E.N.F., J.O.O., N.W., G.M.O., P.T., G.W.M. and E.N.K. All authorshave read and agreed to the published version of the manuscript.
Funding: This research received no external funding.
Institutional Review Board Statement: Not applicable.
Data Availability Statement: The data presented in this study are available on request from thecorresponding authors. The data are not publicly available due to confidential information includedin the data.
Acknowledgments: We are grateful to the Kenya Marine and Fisheries Research Institute (KMFRI),Kenya Fisheries Service (KeFS), and the fishing industry (East African Sea Foods Ltd. and ItticaLtd., Mombasa Kenya) that provided the logistical support of all the shallow-water prawn trawlingobserver program surveys. We appreciate the cooperation and support from the captains of the fishingvessels and the entire fishing crew who provided the scientific observers with the necessary supportto collect data and samples. The support, cooperation, and commitment of KMFRI fishery observers(Boaz Orembo, Masudi Juma Zamu, Rashid Anam, James Gonda, Jibril Olunga, Ben Ogola, SammyKadhengi, Benard Kimathi, Geoffrey Odhiambo Otieno, Justus Andati, Nimrod Ishmael, HafidhIshmael) during the field and laboratory work are appreciated. We are grateful to our respectiveinstitutions (KMFRI and The Nature Conservancy) for supporting authors’ time in this study. Wealso acknowledge the reviewers who gave constructive changes and recommendations to improvethe manuscript.
Conflicts of Interest: The authors declare no conflict of interest.
References1. Cashion, T.; Al-Abdulrazzak, D.; Belhabib, D.; Derrick, B.; Divovich, E.; Moutopoulos, D.K.; Noël, S.L.; Palomares, M.L.D.;
Teh, L.C.L.; Zeller, D.; et al. Reconstructing global marine fishing gear use: Catches and landed values by gear type and sector.Fish. Res. 2018, 206, 57–64. [CrossRef]
2. Pauly, D.; Zeller, D.; Palomares, M.L.D. (Eds.) Sea around Us Concepts, Design and Data; Oxford University Press: Oxford, UK, 2003;Available online: https://www.seaaroundus.org/ (accessed on 21 November 2020).
3. Roberts, C. Ocean of Life: How Our Seas Are Changing; Penguin: London, UK, 2012; p. 400.4. FAO. Report of the Technical Consultation on Reduction of Wastage in Fisheries. 28 October–1 November 1996 Tokyo, Japan; FAO Fisheries
Report No. 547; FAO: Rome, Italy, 1996; p. 27.5. Kelleher, K. Discards in the World’s Marine Fisheries. An Update; FAO Fisheries Technical Paper. No. 470; FAO: Rome, Italy, 2005;
p. 131.6. Jennings, S.; Kaiser, M.J. The effects of fishing on marine ecosystems. Adv. Mar. Biol. 1998, 34, 201–212.7. Zeller, D.; Cashion, T.; Palomares, M.; Pauly, D. Global marine fisheries discards: A synthesis of reconstructed data. Fish Fish.
2018, 19, 30–39. [CrossRef]8. Jennings, S.; Pinnegar, J.K.; Polunin, N.V.C.; Warr, K.J. Impacts of trawling disturbance on the trophic structure of benthic
invertebrate communities. Mar. Ecol. Prog. Ser. 2001, 213, 127–142. [CrossRef]9. Hiddink, J.G.; Jennings, S.; Sciberras, M.; Szostek, C.L.; Hughes, K.M.; Ellis, N.; Rijnsdorp, A.D.; McConnaughey, R.A.; Mazor, T.;
Hilborn, R.; et al. Effects of bottom trawling on seabed. Proc. Natl. Acad. Sci. USA 2017, 114, 8301–8306. [CrossRef]

Diversity 2022, 14, 199 16 of 18
10. Newsome, T.M.; Ballard, G.-A.; Fleming, P.J.S.; van de Ven, R.; Story, G.L.; Dickman, C.R. Human-resource subsidies alter thedietary preferences of a mammalian top predator. Oecologia 2014, 175, 139–150. [CrossRef]
11. Fondo, E.N.; Chaloupka, M.; Heymans, J.J.; Skilleter, G.A. Banning Fisheries Discards Abruptly Has a Negative Impact on thePopulation Dynamics of Charismatic Marine Megafauna. PLoS ONE 2015, 10, e0144543. [CrossRef]
12. Pusceddua, A.; Bianchelli, S.; Martín, J.; Puig, P.; Palanques, A.; Masquéd, P.; Danovaroa, R. Chronic and intensive bottomtrawling impairs deep-sea biodiversity and ecosystem functioning. Proc. Natl. Acad. Sci. USA 2014, 111, 8861–8866. [CrossRef]
13. Jacquet, J.; Pauly, D.; Ainley, D.; Holt, S.; Dayton, P.; Jackson, J. Seafood stewardship in crisis. Nature 2010, 467, 28–29. [CrossRef]14. Morton, B. At last, a trawling ban for Hong Kong’s inshore waters. Mar. Pollut. Bull. 2011, 62, 1153–1154. [CrossRef]15. Watling, L. Deep-sea trawling must be banned. Nature 2013, 501, 7. [CrossRef]16. Jiddawi, N.; Ohman, M.C. Marine Fisheries in Tanzania. Ambio 2002, 31, 518–527. [CrossRef] [PubMed]17. Abdallah, A.M. Management of the Commercial Prawn Fishery in Tanzania; Final Project Report; University of Iceland: Reykjavík,
Iceland, 2004; p. 42.18. Haule, W.V. Reducing the impact of tropical shrimp trawling fisheries on living marine resources through the adoption of
environmentally friendly techniques and practices in Tanzania. In Tropical Shrimp Fisheries and Their Impact on Living Resources;FAO Fisheries Technical Paper; FAO: Rome, Italy, 2001; Volume 974, pp. 216–233.
19. de Sousa, L.P.; Abdula, S.; Palha de Sousa, B.; Penn, J.W. Assessment of the shallow water shrimp fishery of Sofala Bank. Mozamb.Fish. Res. Inst. Rep. 2014, 33, 76.
20. WWF. A Sustainable Shrimp Fishery for Mozambique; WWF Fact Sheet: Morges, Switzerland, 2017; p. 4.21. Fennessy, S.T.; Mwatha, G.K.; Thiele, W. (Eds.) Report of the Regional Workshop on Approaches to Reducing Shrimp Trawl By-Catch in
the Western Indian Ocean. Mombasa, Kenya, 13–15 April 2003; FAO Fisheries Report. No. 734; FAO: Rome, Italy, 2004; p. 49.22. Ayers, M.J.; Scharler, U.M.; Fennessy, S.T. Modelling ecosystem effects of reduced prawn recruitment on the Thukela Bank
trawling grounds, South Africa, following nursery loss. Mar. Ecol. Prog. Ser. 2013, 479, 143–161. [CrossRef]23. Razafindrainibe, H. Baseline Study of the Shrimp Trawl Fishery in Madagascar and Strategies for Bycatch Management; TCP/MAG/3201–
REBYC2 Report; United Nations Food and Agriculture Organization: Rome, Italy, 2010; p. 111.24. Nzioka, R.M. Observations on the spawning seasons of East African reef fishes. J. Fish Biol. 1979, 14, 329–342. [CrossRef]25. Mutagyera, W.B. Distribution of some deepwater prawns and lobster species in Kenya waters. In Proceedings of the NORAD-
Kenya Seminar to Review the Marine Fish Stocks in Kenya, Mombasa, Kenya, 13–15 March 1984.26. Ruwa, R.K.; Muthiga, N.; Esposito, M.; Zanre, R.; Mueni, E.; Muchiri, M. Report of the scientific information and conservation
sub-committee-prawn fishery in Kenya. In Marine Waters. Prawn Trawling Task Force; Kenya Marine and Fisheries ResearchInstitute: Mombasa, Kenya, 2001; p. 8.
27. Government of Kenya. The Prawn Fishery Management Plan 2010; Kenya Gazette; Government of Kenya: Nairobi, Kenya, 2010.28. Mutagyera, W.B. On Thenus orientalus and Metanephrops andamanicus (Macrura, Scyllaridae and Nephropidae) off Kenya coast.
East Afr. Agric. For. J. 1979, 45, 142–144. [CrossRef]29. Ruwa, R.K. Coastal and Offshore Marine Fisheries of Kenya: Status and Opportunities; KMFRI Technical Report/2004/FP/1; Kenya
Marine and Fisheries Research Institute: Mombasa, Kenya, 2006; p. 44.30. Abuodha, P. Sediment composition and characteristics in the Malindi-Ungwana bay. In Current Status of Trawl Fishery of Malindi-
Ungwana Bay; KMFRI Technical Report; Kenya Marine and Fisheries Research Institute: Mombasa, Kenya, 2002; pp. 23–30.31. Mirera, D.; Kairo, J.; Kimani, E.; Waweru, F. A comparison between fish assemblages in mangrove forests and on intertidal flats at
Ungwana Bay, Kenya. Afr. J. Aquat. Sci. 2010, 35, 165–171. [CrossRef]32. Kitheka, J.U.; Obiero, M.; Nthenge, P. River discharge, sediment transport and exchange in the Tana estuary, Kenya. Est. Coast.
Shelf. Sci. 2005, 63, 455–468. [CrossRef]33. Schott, F.A.; McCreary, J.P., Jr. The monsoon circulation of the Indian Ocean. Prog. Oceangr. 2001, 51, 1–123. [CrossRef]34. Athayde, T. SWIOFP Observer Program Data Collection Guide; South West Indian Ocean Fisheries Project; Regional Management
Unit, Kenya Marine and Fisheries Research Institute: Mombasa, Kenya, 2012; p. 79.35. Smith, M.M.; Heemstra, P.C. (Eds.) Smith’s Sea Fishes, 6th ed.; Springer: Berlin, Germany, 1986; Volume 1038, p. 144.36. FAO FishFinder. Commercially Important Coastal Fishes of Kenya. A Pocket Guide; FAO: Rome, Italy, 2010; p. 39.37. Richmond, M.D.E. A Field Guide to the Seashores of Eastern Africa and the Western Indian Ocean Islands, 3rd ed.; Sida/WIOMSA;
Samaki Consultants Ltd.: Dar es Salaam, Tanzania, 2011; p. 464.38. Anam, R.; Mostarda, E. Field identification guide to the living marine resources of Kenya. In FAO Species Identification Guide for
Fishery Purposes; FAO: Rome, Italy, 2012; p. 25.39. Froese, R.; Pauly, D. (Eds.) FishBase. World Wide Web Electronic Publication. Available online: www.fishbase.org (accessed on
12 December 2019).40. Clarke, K.R.; Warwick, R.M. Change in Marine Communities: An Approach to statistical Analysis and Interpretation, 2nd ed.; PRIMER-E,
Ltd.: Plymouth, UK, 2001.41. Clarke, K.R.; Gorley, R.N. PRIMER v6: User Manual/Tutorial (Plymouth Routines in Multivariate Ecological Research); PRIMER-E, Ltd.:
Plymouth, UK, 2006.42. Munga, C.; Ndegwa, S.; Fulanda, B.; Manyala, J.; Kimani, E.; Ohtomi, J.; Vanreusel, A. Bottom shrimp trawling impacts on species
distribution and fishery dynamics; Ungwana bay fishery Kenya before and after the 2006 trawl ban. Fish. Sci. 2012, 78, 209–219.[CrossRef]

Diversity 2022, 14, 199 17 of 18
43. Mwatha, G.K. Stock Assessment and Population Dynamics of Penaeid Prawns in the Prawn Trawling Grounds of Malindi-UngwanaBay: The Challenges of Managing the Prawn Fishery in Kenya; WIOMSA/MARG-I/2005-06; Western Indian Ocean Marine ScienceAssociation: Zanzibar, Tanzania, 2005; p. 21.
44. Kimani, E.N.; Fulanda, B.; Wambiji, N.; Munga, C.; Okemwa, G.; Thoya, P.; Omukoto, J. Spatial Mapping of Trawl Fishery Resourcesof Malindi-Ungwana Bay, Kenya; SWIOFP Components 2 (Crustaceans); Special Technical Report; SWIOFP Survey Report forSWIOFP 2011C201a; Kenya Marine and Fisheries Research Institute: Mombasa, Kenya, 2012; p. 28.
45. Munga, C.N.; Mwangi, S.; Ong’anda, H.; Ruwa, R.; Manyala, J.; Groeneveld, J.C.; Kimani, E.; Vanreusel, A. Species composition,distribution patterns and population structure of penaeid shrimps in Malindi-Ungwana bay, Kenya, based on experimentalbottom trawl surveys. Fish. Res. 2013, 147, 93–102. [CrossRef]
46. Fennessy, S.T. Incidental capture of elasmobranchs by commercial prawn trawlers on the Tugela Bank, Natal, South Africa. S. Afr.J. Mar. Sci. 1994, 14, 287–296. [CrossRef]
47. Tonks, M.L.; Griffiths, S.P.; Heales, D.S.; Brewer, D.T.; Dell, Q. Species composition and temporal variation of prawn trawl bycatchin the Joseph Bonaparte Gulf, northwestern Australia. Fish. Res. 2008, 89, 276–293. [CrossRef]
48. Munga, C.N.; Mwangi, S.; Ong’anda, H.; Ruwa, R.; Manyala, J.; Groeneveld, J.; Kimani, E. Fish catch composition of artisanal andbottom trawl fisheries in Malindi-Ungwana bay, Kenya: A cause for conflict? WIO J. Mar. Sci. 2014, 13, 31–46.
49. KMFRI. Current Status of the Shallow Water Industrial Prawn Trawling Fishery in Kenya; Kenya Marine and Fisheries ResearchInstitute Research Report; OCS/FIS/2018–2019/ C1.1.i&C1.4.i; KMFRI: Mombasa, Kenya, 2019; p. 59.
50. Munga, C.N. Ecological and Socio-Economic Assessment of Kenyan Coastal Fisheries: The Case of Malindi-Ungwana BayArtisanal Fisheries versus Semi-Industrial Bottom Trawling. Ph.D. Thesis, Ghent University, Ghent, Belgium, 2013.
51. Pauly, D.; Palomares, M.L.; Froese, R.; Saa, P.; Vakily, M.; Preikshot, D.; Wallace, S. Fishing down Canadian aquatic food webs.Can. J. Fish. Aquat. Sci. 2001, 58, 51–62. [CrossRef]
52. Rochet, M.-J.; Trenkel, V.M. Which community indicators can measure the impact of fishing? A review and proposals. Can. J. Fish.Aquat. Sci. 2003, 60, 86–99. [CrossRef]
53. Yang, J. A tentative analysis of the trophic levels of North Sea fish. Mar. Ecol. Prog. Ser. 1982, 7, 47–52. [CrossRef]54. Hall, M.A.; Alverson, D.L.; Metuzals, K.I. By-Catch: Problems and Solutions. Mar. Pollut. Bull. 2000, 41, 204–219. [CrossRef]55. Sánchez, P.; Demestre, M.; Martin, P. Characterisation of the discards generated by bottom trawling in the northwestern
Mediterranean. Fish. Res. 2004, 67, 71–80. [CrossRef]56. Ramkumar, S.; Ranjith, L.; Jaiswar, A.K.; Vinod, K.; Deshmukhm, V. Does the mechanised trawl target the non-targets from the
commercial fishing grounds of northern Maharashtra, eastern Arabian Sea India. J. Entom. Zool. Stud. 2019, 7, 1133–1140.57. Ochiewo, J. Harvesting and Sustainability of Marine Fisheries in Malindi-Ungwana Bay, Northern Kenya Coast; Report NO:
WIOMSA/MARG-I/2006–03; Western Indian Ocean Marine Science Association: Zanzibar, Tanzania, 2006; p. 44.58. Kaunda-Arara, B.; Munga, C.; Manyala, J.; Kuguru, B.; Igulu, M.; Chande, M.; Kangwe, S.; Mwakiti, S.; Thoya, P.; Mbaru, E.; et al.
Spatial variation in benthopelagic fish assemblage structure along coastal East Africa from recent bottom trawl surveys. Reg. Stud.Mar. Sci. 2016, 8, 201–209. [CrossRef]
59. Kennelly, S.J.; Liggins, G.W.; Broadhurst, M.K. Retained and discarded by-catch from oceanic prawn trawling in New SouthWales, Australia. Fish. Res. 1998, 36, 217–236. [CrossRef]
60. Komoroske, L.; Lewison, R. Addressing fisheries bycatch in a changing world. Front. Mar. Sci. 2015, 2, 83. [CrossRef]61. Fulanda, B.; Ohtomi, J.; Mueni, E.; Kimani, E. Fishery trends, resource-use and management system in the Ungwana bay fishery
Kenya. Ocean Coast. Manag. 2011, 54, 401–414. [CrossRef]62. Mwatha, G.K. Assessment of the prawn fishery, by-catch, resource use conflicts and performance of the turtle excluder device. In
Current Status of Trawl Fishery of Malindi-Ungwana Bay; KMFR Technical Report; Kenya Marine and Fisheries Research Institute:Mombasa, Kenya, 2002; p. 97.
63. Olbers, J.M.; Fennessy, S.T. A retrospective assessment of the stock status of Otolithes ruber (Pisces: Sciaenidae) as bycatch onprawn trawlers from KwaZulu-Natal, South Africa. Afr. J. Mar. Sci. 2007, 29, 247–252. [CrossRef]
64. de Freitas, A.J. The Penaeoidea of South Africa IV- The Family Penaeidae: Genus Penaeus. Oceanogr. Res. Inst. Investig. Res. Rep.2011, 59, 125.
65. Macia, A. Juvenile penaeid shrimp density, spatial distribution and size composition in four adjacent habitats within a mangrove-fringed bay on Inhaca Island, Mozambique. WIO J. Mar. Sci. 2004, 3, 163–178. [CrossRef]
66. Rogers, D.R.; de Silva, J.A.; Wright, V.L.; Watson, J.W. Evaluation of shrimp trawls equipped with bycatch reduction devices ininshore waters of Louisiana. Fish. Res. 1997, 33, 55–72. [CrossRef]
67. Brewer, D.; Rawlinson, N.; Eayrs, S.; Burridge, C. An assessment of Bycatch Reduction Devices in a tropical Australian prawntrawl fishery. Fish. Res. 1998, 36, 195–215. [CrossRef]
68. Robins, J.B.; Campbell, M.J.; McGilvray, J.G. Reducing Prawn-trawl Bycatch in Australia: An Overview and an Example fromQueensland. Mar. Fish. Rev. 1999, 61, 46–55.
69. Bage, H. Desk Review of Bycatch in Shrimp Fisheries; Report; Food and Agriculture Organization of the United Nations: Ebene,Mauritius, 2013; p. 38.
70. Zhang, W.; Liu, M.; de Mitcheson, Y.S.; Cao, L.; Leadbitter, D.; Newton, R.; Little, D.C.; Li, S.; Yang, Y.; Chen, X.; et al. Fishing forfeed in China: Facts, impacts and implications. Fish Fish. 2020, 21, 47–62. [CrossRef]

Diversity 2022, 14, 199 18 of 18
71. Matsue, N.; Daw, T.; Garrett, L. Women Fish Traders on the Kenyan Coast: Livelihoods, Bargaining Power, and Participation inManagement. Coast. Manag. 2014, 42, 531–554. [CrossRef]
72. Swaleh, K.; Kaunda-Arara, B.; Ruwa, R.; Raburu, P. Ecosystem-based assessment of a prawn fishery in coastal Kenya usingecological indicators. Ecol. Indic. 2015, 50, 233–241. [CrossRef]