
A Case Study at Fast Food Restaurant in Jabodetabek
12
P-ISSN: 2087-1228 E-ISSN: 2476-9053 165 *Corresponding Author Binus Business Review, 12(2), July 2021, 165-176 DOI: 10.21512/bbr.v12i2.6672 Customer Satisfaction on Service Quality or Product Quality: A Case Study at Fast Food Restaurant in Jabodetabek Yudhy Kristiawan 1 *; Hartoyo 2 ; Budi Suharjo 3 1,2 School of Business, Institut Pertanian Bogor University Jln. Raya Pajajaran, Bogor, Jawa Barat 16151 Indonesia 3 Faculty of Math and Science, Institut Pertanian Bogor University Jln. Raya Dramaga, Jawa Barat 16680 Indonesia 1 [email protected]; 2 [email protected]; 3 [email protected] Received: 2 nd September 2020/ Revised: 20 th October 2020/ Accepted: 18 th January 2021 How to Cite: Kristiawan, Y., Hartoyo, & Suharjo, B. (2021). Customer Satisfaction on Service Quality or Product Quality: A Case Study at Fast Food Restaurant in Jabodetabek. Binus Business Review, 12(2), 165-176. https://doi.org/10.21512/bbr.v12i2.6672 ABSTRACT Along with the increasing number of fast food restaurant (FFR), the level of competition has also increased. Business owners and managers of FFR are required to provide quality services and products to maintain their existence. Product and service quality and customer satisfaction have a close relationship with company profits. Customer satisfaction is determined by customers’ perceptions regarding product or service performance to meet customer expectations. The research aimed to determine the factors that influenced customer satisfaction of the FFR. The research was conducted in FFR in Jabodetabek using a descriptive approach with survey methods and convenience sampling techniques. Using the Structural Equation Model (SEM), the researchers analyzed several factors that influenced customer satisfaction: service and product quality. The results illustrate that service quality affects customer satisfaction. Satisfied customers will revisit the FFR. However, product quality has no direct effect on customer satisfaction. To improve customer satisfaction, the management of FFR must pay attention to the attributes that contribute greatly but receive low ratings from customers. It consists of the coolness of the room when customers eat and greetings from officers when customers leave the restaurant. Owners and managers of FFR are required to provide service and product quality to maintain their existence. Keywords: customer satisfaction, service quality, product quality, fast food restaurant INTRODUCTION The fast food restaurant (FFR) industry is one of the growing food and beverage industries (USDA, 2017). The large market potential encourages many FFR to expand, including opening new outlets in strategic locations, launching new menus, and providing various promotions to attract customers’ interest. In Indonesia, the number of FFR has grown quite a lot. In 2016, the number reached 6.129 outlets, including 1.512 chicken outlets and 1.279 Asian FFR outlets. The number of FFR outlets contributed significantly to the total sales value, especially during 2013-2016, which continued to increase as described in Table 1 (USDA, 2017). The amount of sales value generated by FFR in Table 1 reflects the transactions by customers. Customers not only consume products or services but also carry out an evaluation process of goods or services. It is a part of the customers’ decision process, namely the post-consumption evaluation stage. The result is that customers are satisfied or dissatisfied with the goods or services. This satisfaction will encourage customers to re-buy these goods or services. Satisfaction occurs when customers’ expectations match the perceived performance of the goods or services and vice versa (Blackwell, Miniard, & Engel, 2012). Thus, customer satisfaction is one of the main
-
Upload
khangminh22 -
Category
Documents
-
view
0 -
download
0
Transcript of A Case Study at Fast Food Restaurant in Jabodetabek
P-ISSN: 2087-1228E-ISSN: 2476-9053
165*Corresponding Author
Binus Business Review, 12(2), July 2021, 165-176DOI: 10.21512/bbr.v12i2.6672
Customer Satisfaction on Service Quality or Product Quality: A Case Study at Fast Food Restaurant in
Jabodetabek
Yudhy Kristiawan1*; Hartoyo2; Budi Suharjo3
1,2School of Business, Institut Pertanian Bogor UniversityJln. Raya Pajajaran, Bogor, Jawa Barat 16151 Indonesia
3Faculty of Math and Science, Institut Pertanian Bogor UniversityJln. Raya Dramaga, Jawa Barat 16680 Indonesia
[email protected]; [email protected]; [email protected]
Received: 2nd September 2020/ Revised: 20th October 2020/ Accepted: 18th January 2021
How to Cite: Kristiawan, Y., Hartoyo, & Suharjo, B. (2021). Customer Satisfaction on Service Quality or Product Quality: A Case Study at Fast Food Restaurant in Jabodetabek. Binus Business Review, 12(2), 165-176.
https://doi.org/10.21512/bbr.v12i2.6672
ABSTRACT
Along with the increasing number of fast food restaurant (FFR), the level of competition has also increased. Business owners and managers of FFR are required to provide quality services and products to maintain their existence. Product and service quality and customer satisfaction have a close relationship with company profits. Customer satisfaction is determined by customers’ perceptions regarding product or service performance to meet customer expectations. The research aimed to determine the factors that influenced customer satisfaction of the FFR. The research was conducted in FFR in Jabodetabek using a descriptive approach with survey methods and convenience sampling techniques. Using the Structural Equation Model (SEM), the researchers analyzed several factors that influenced customer satisfaction: service and product quality. The results illustrate that service quality affects customer satisfaction. Satisfied customers will revisit the FFR. However, product quality has no direct effect on customer satisfaction. To improve customer satisfaction, the management of FFR must pay attention to the attributes that contribute greatly but receive low ratings from customers. It consists of the coolness of the room when customers eat and greetings from officers when customers leave the restaurant. Owners and managers of FFR are required to provide service and product quality to maintain their existence.
Keywords: customer satisfaction, service quality, product quality, fast food restaurant
INTRODUCTION
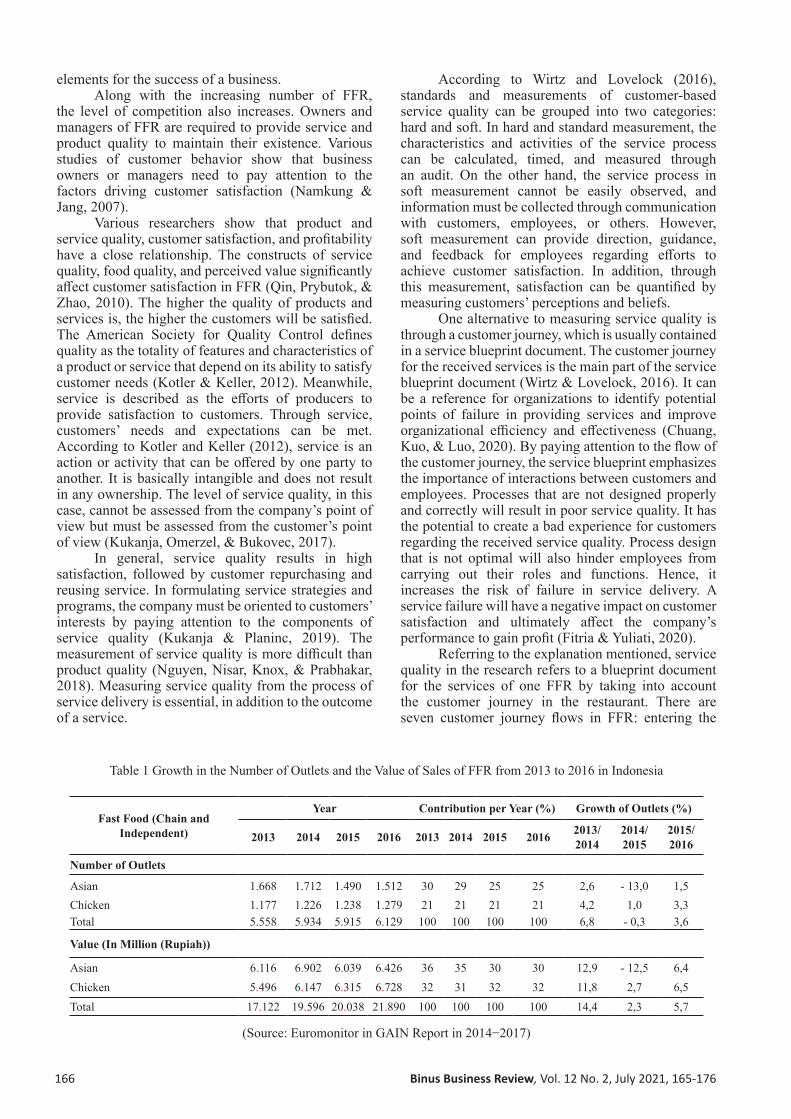
The fast food restaurant (FFR) industry is one of the growing food and beverage industries (USDA, 2017). The large market potential encourages many FFR to expand, including opening new outlets in strategic locations, launching new menus, and providing various promotions to attract customers’ interest. In Indonesia, the number of FFR has grown quite a lot. In 2016, the number reached 6.129 outlets, including 1.512 chicken outlets and 1.279 Asian FFR outlets. The number of FFR outlets contributed significantly to the total sales value, especially during 2013-2016, which continued to increase as described
in Table 1 (USDA, 2017).The amount of sales value generated by FFR
in Table 1 reflects the transactions by customers. Customers not only consume products or services but also carry out an evaluation process of goods or services. It is a part of the customers’ decision process, namely the post-consumption evaluation stage. The result is that customers are satisfied or dissatisfied with the goods or services. This satisfaction will encourage customers to re-buy these goods or services. Satisfaction occurs when customers’ expectations match the perceived performance of the goods or services and vice versa (Blackwell, Miniard, & Engel, 2012). Thus, customer satisfaction is one of the main
166 Binus Business Review, Vol. 12 No. 2, July 2021, 165-176
elements for the success of a business.Along with the increasing number of FFR,
the level of competition also increases. Owners and managers of FFR are required to provide service and product quality to maintain their existence. Various studies of customer behavior show that business owners or managers need to pay attention to the factors driving customer satisfaction (Namkung & Jang, 2007).
Various researchers show that product and service quality, customer satisfaction, and profitability have a close relationship. The constructs of service quality, food quality, and perceived value significantly affect customer satisfaction in FFR (Qin, Prybutok, & Zhao, 2010). The higher the quality of products and services is, the higher the customers will be satisfied. The American Society for Quality Control defines quality as the totality of features and characteristics of a product or service that depend on its ability to satisfy customer needs (Kotler & Keller, 2012). Meanwhile, service is described as the efforts of producers to provide satisfaction to customers. Through service, customers’ needs and expectations can be met. According to Kotler and Keller (2012), service is an action or activity that can be offered by one party to another. It is basically intangible and does not result in any ownership. The level of service quality, in this case, cannot be assessed from the company’s point of view but must be assessed from the customer’s point of view (Kukanja, Omerzel, & Bukovec, 2017).
In general, service quality results in high satisfaction, followed by customer repurchasing and reusing service. In formulating service strategies and programs, the company must be oriented to customers’ interests by paying attention to the components of service quality (Kukanja & Planinc, 2019). The measurement of service quality is more difficult than product quality (Nguyen, Nisar, Knox, & Prabhakar, 2018). Measuring service quality from the process of service delivery is essential, in addition to the outcome of a service.
According to Wirtz and Lovelock (2016), standards and measurements of customer-based service quality can be grouped into two categories: hard and soft. In hard and standard measurement, the characteristics and activities of the service process can be calculated, timed, and measured through an audit. On the other hand, the service process in soft measurement cannot be easily observed, and information must be collected through communication with customers, employees, or others. However, soft measurement can provide direction, guidance, and feedback for employees regarding efforts to achieve customer satisfaction. In addition, through this measurement, satisfaction can be quantified by measuring customers’ perceptions and beliefs.
One alternative to measuring service quality is through a customer journey, which is usually contained in a service blueprint document. The customer journey for the received services is the main part of the service blueprint document (Wirtz & Lovelock, 2016). It can be a reference for organizations to identify potential points of failure in providing services and improve organizational efficiency and effectiveness (Chuang, Kuo, & Luo, 2020). By paying attention to the flow of the customer journey, the service blueprint emphasizes the importance of interactions between customers and employees. Processes that are not designed properly and correctly will result in poor service quality. It has the potential to create a bad experience for customers regarding the received service quality. Process design that is not optimal will also hinder employees from carrying out their roles and functions. Hence, it increases the risk of failure in service delivery. A service failure will have a negative impact on customer satisfaction and ultimately affect the company’s performance to gain profit (Fitria & Yuliati, 2020).
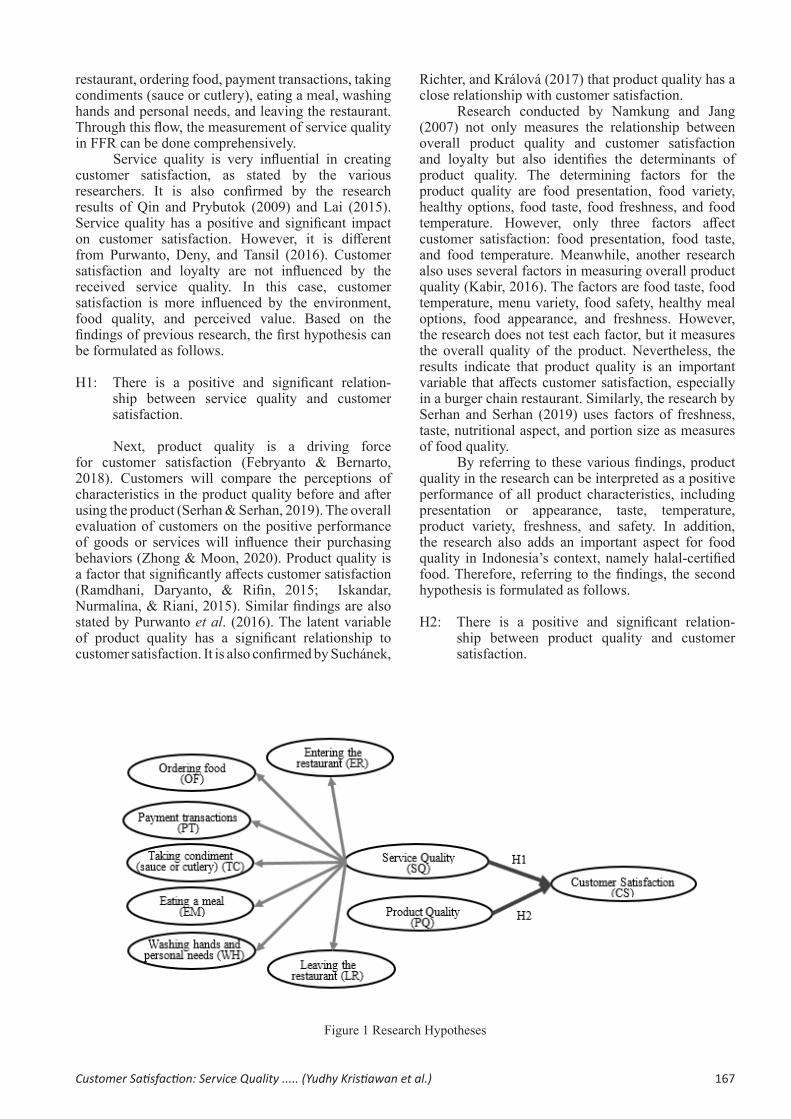
Referring to the explanation mentioned, service quality in the research refers to a blueprint document for the services of one FFR by taking into account the customer journey in the restaurant. There are seven customer journey flows in FFR: entering the
Table 1 Growth in the Number of Outlets and the Value of Sales of FFR from 2013 to 2016 in Indonesia
Fast Food (Chain and Independent)
Year Contribution per Year (%) Growth of Outlets (%)
2013 2014 2015 2016 2013 2014 2015 2016 2013/ 2014
2014/ 2015
2015/ 2016
Number of Outlets
Asian 1.668 1.712 1.490 1.512 30 29 25 25 2,6 - 13,0 1,5Chicken 1.177 1.226 1.238 1.279 21 21 21 21 4,2 1,0 3,3Total 5.558 5.934 5.915 6.129 100 100 100 100 6,8 - 0,3 3,6
Value (In Million (Rupiah))
Asian 6.116 6.902 6.039 6.426 36 35 30 30 12,9 - 12,5 6,4Chicken 5.496 6.147 6.315 6.728 32 31 32 32 11,8 2,7 6,5Total 17.122 19.596 20.038 21.890 100 100 100 100 14,4 2,3 5,7
(Source: Euromonitor in GAIN Report in 2014−2017)
167Customer Satisfaction: Service Quality ..... (Yudhy Kristiawan et al.)
restaurant, ordering food, payment transactions, taking condiments (sauce or cutlery), eating a meal, washing hands and personal needs, and leaving the restaurant. Through this flow, the measurement of service quality in FFR can be done comprehensively.
Service quality is very influential in creating customer satisfaction, as stated by the various researchers. It is also confirmed by the research results of Qin and Prybutok (2009) and Lai (2015). Service quality has a positive and significant impact on customer satisfaction. However, it is different from Purwanto, Deny, and Tansil (2016). Customer satisfaction and loyalty are not influenced by the received service quality. In this case, customer satisfaction is more influenced by the environment, food quality, and perceived value. Based on the findings of previous research, the first hypothesis can be formulated as follows.
H1: There is a positive and significant relation-ship between service quality and customer satisfaction.
Next, product quality is a driving force for customer satisfaction (Febryanto & Bernarto, 2018). Customers will compare the perceptions of characteristics in the product quality before and after using the product (Serhan & Serhan, 2019). The overall evaluation of customers on the positive performance of goods or services will influence their purchasing behaviors (Zhong & Moon, 2020). Product quality is a factor that significantly affects customer satisfaction (Ramdhani, Daryanto, & Rifin, 2015; Iskandar, Nurmalina, & Riani, 2015). Similar findings are also stated by Purwanto et al. (2016). The latent variable of product quality has a significant relationship to customer satisfaction. It is also confirmed by Suchánek,
Richter, and Králová (2017) that product quality has a close relationship with customer satisfaction.
Research conducted by Namkung and Jang (2007) not only measures the relationship between overall product quality and customer satisfaction and loyalty but also identifies the determinants of product quality. The determining factors for the product quality are food presentation, food variety, healthy options, food taste, food freshness, and food temperature. However, only three factors affect customer satisfaction: food presentation, food taste, and food temperature. Meanwhile, another research also uses several factors in measuring overall product quality (Kabir, 2016). The factors are food taste, food temperature, menu variety, food safety, healthy meal options, food appearance, and freshness. However, the research does not test each factor, but it measures the overall quality of the product. Nevertheless, the results indicate that product quality is an important variable that affects customer satisfaction, especially in a burger chain restaurant. Similarly, the research by Serhan and Serhan (2019) uses factors of freshness, taste, nutritional aspect, and portion size as measures of food quality.
By referring to these various findings, product quality in the research can be interpreted as a positive performance of all product characteristics, including presentation or appearance, taste, temperature, product variety, freshness, and safety. In addition, the research also adds an important aspect for food quality in Indonesia’s context, namely halal-certified food. Therefore, referring to the findings, the second hypothesis is formulated as follows.
H2: There is a positive and significant relation-ship between product quality and customer satisfaction.
Figure 1 Research Hypotheses
168 Binus Business Review, Vol. 12 No. 2, July 2021, 165-176
The purpose of the research is to examine the factors that influence customer satisfaction in the context of FFR in Jabodetabek. Figure 1 shows the used research hypotheses. The results can be used as input for the management of FFR in Jabodetabek to evaluate the factors that affect customer satisfaction. These efforts play an important role in the sustainability of the business in the future.
METHODS
The research is conducted at FFR in Jabodetabek (Jakarta–Bogor–Depok–Tangerang–Bekasi) with a descriptive approach. The descriptive approach is used to obtain information on the characteristics of the object of research factually, systematically, thoroughly, and accurately. Since there is no customer list which is the sample frame, the probability sampling technique is difficult to apply. Most FFRs do not have a customer list. For this reason, the research uses a non-probability convenience sampling technique. The sample is selected from customers who act as direct decision-makers and strongly influence their group to make purchases at FFR, especially in the last three months. The number of samples is 383 respondents. Primary data collection is obtained through direct interviews with customers at the research location using a questionnaire as a data collection instrument. Measurements are made using a Likert scale, with strongly disagree to strongly agree (score of 1 to 5). The Likert scale is suitable for a question with several answer choices related to the agreement (Taherdoost, 2016).
Descriptive analysis is designed to gather information, describe the ongoing situation, assess the causes of symptoms that are beyond the researchers’ control, and measure what has happened. (Sumarwan, 2011). Descriptive analysis of customers in the research is important as part of the process in introducing market segmentation of FFR, which needs to be developed in the future. In addition, this information can be used as input for service adjustments or product development according to customers’ characteristics for management.
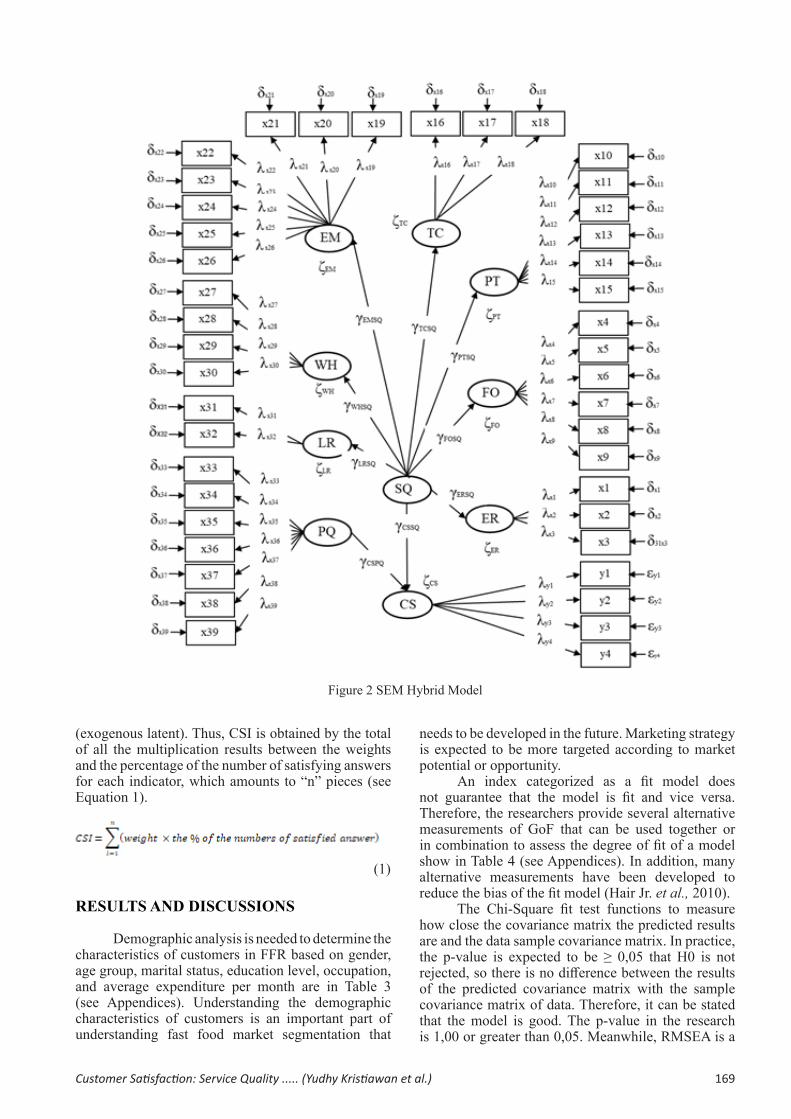
Next, the research uses Structural Equation Modeling (SEM), assisted by LISREL software. The LISREL module is used for SEM, including confirmatory factor analysis for continuous and ordinal variables, models for relationships between latent variables, multiple group analysis, and general covariance structures (Jöreskog, Olsson, & Wallentin, 2016). SEM is a multivariate analysis technique that allows researchers to examine the relationship between complex variables, both recursive and non-recursive, to obtain an overall picture of the overall model. In addition, researchers can measure error testing that is not separated from the SEM, including carrying out the factor analysis process simultaneously with hypothesis testing (Hair Jr., Black, Babin, & Anderson, 2010). SEM analysis in the research is built
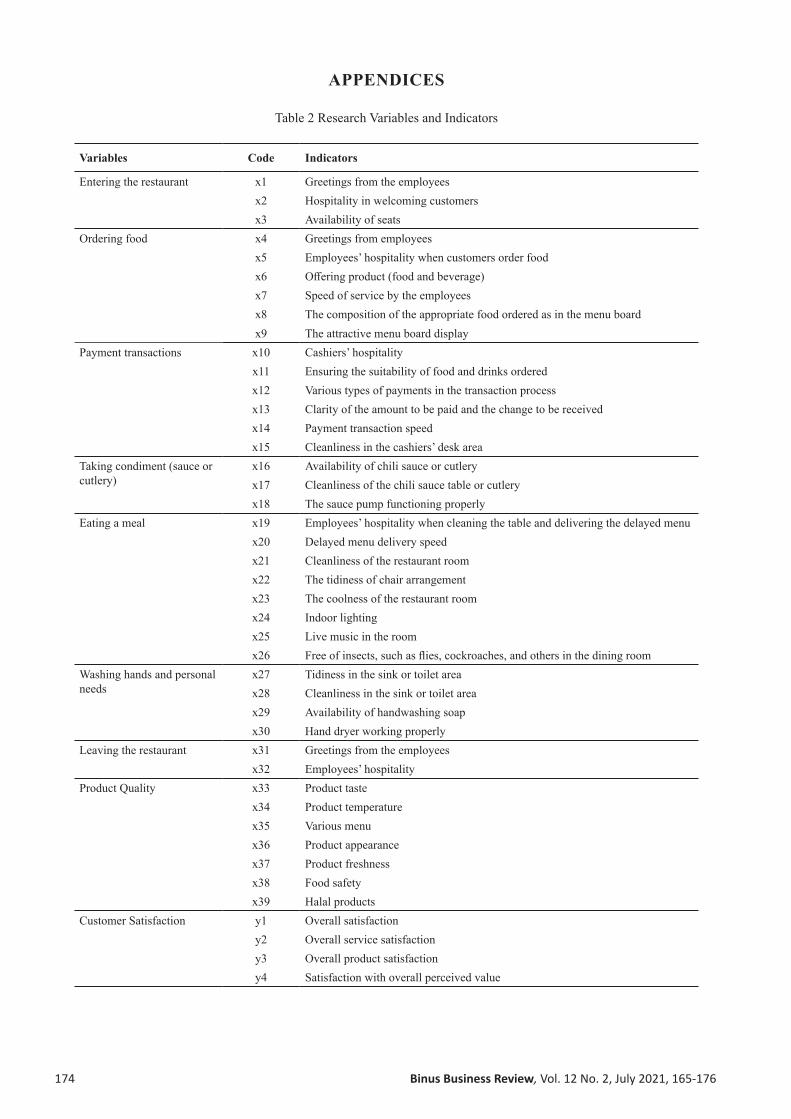
with latent variables (exogenous and endogenous) and indicators. First, there is the exogenous latent variable of product quality. Second, the exogenous latent variables of service quality are reflected in the seven customer journey flows. Third, it is an endogenous latent variable of customer satisfaction. The variables and indicators in the research can be seen in Table 2 (see Appendices). Then, Figure 2 shows the SEM hybrid model.
SEM is a method that can jointly test the relationship between independent and dependent contracts (structural model) and the relationship (loading value) between indicators and constructs (latent variables) (measurement models). Combining structural model testing and measurement models allows the measurement of error testing to be an integral part of SEM and factor analysis along with hypothesis testing. The evaluation of Goodness of Fit (GoF) is conducted in several steps: overall model fit, measurement model fit (validity and reliability test), and structural model fit (Hair Jr. et al., 2010).
In GoF testing, there is no single statistical test tool to measure or test hypotheses about the model in SEM analysis. Generally, there are various types of good fit indexes. For example, several GoF measurements include Chi-Square Statistic (χ2), minimum sample discrepancy function/degree of freedom (CMINDF), Goodness of Fit Index (GFI), Adjusted Goodness of Fit Index (AGFI), Tucker Lewis Index (TLI), Comparative Fit Index (CFI), and Root Mean Square Error of Approximation (RMSEA).
The validity and reliability tests of SEM analysis are carried out after the measurement of the fit model, and the overall data are good. Both tests are carried out by evaluating the relationship of each latent variable with the observed variable separately. If the t-value (loading factor) is ≥1,96, or the standard loading factor is ≥ 0,70, it can be said that the indicator variable is valid. Meanwhile, the indicator is declared reliable if it has Construct Reliability (CR) ≥ 0,70 and Variance Extracted (VE) ≥ 0,50 (Hair Jr. et al., 2010).
Structural model fit is a process of testing the hypothesis. It is carried out by means of a statistical test, namely the t-test. The proposed hypothesis that is accepted has a t-value ≥ 1,96 with the desired significance level of 0,05 (Hair Jr. et al., 2010).
Information about the Customer Satisfaction Index (CSI) is also presented in the research. CSI is categorized as a non-financial measurement for companies to determine the level of customer satisfaction (Rajendran & Suresh, 2017; Ajami, Navarro Elola, & Pastor, 2018). The CSI can be measured by weighted techniques (weighted CSI) on each indicator to compile satisfaction, as found in exogenous latency. After the weights have been obtained, it is possible to calculate the percentage of the number of satisfying answers by the customers for each indicator of exogenous latency.
The satisfying answer refers to the top two boxes in the form of agree (score 4) and strongly agree (score 5) answers on the constituent indicators of satisfaction
169Customer Satisfaction: Service Quality ..... (Yudhy Kristiawan et al.)
(exogenous latent). Thus, CSI is obtained by the total of all the multiplication results between the weights and the percentage of the number of satisfying answers for each indicator, which amounts to “n” pieces (see Equation 1).
(1)
RESULTS AND DISCUSSIONS
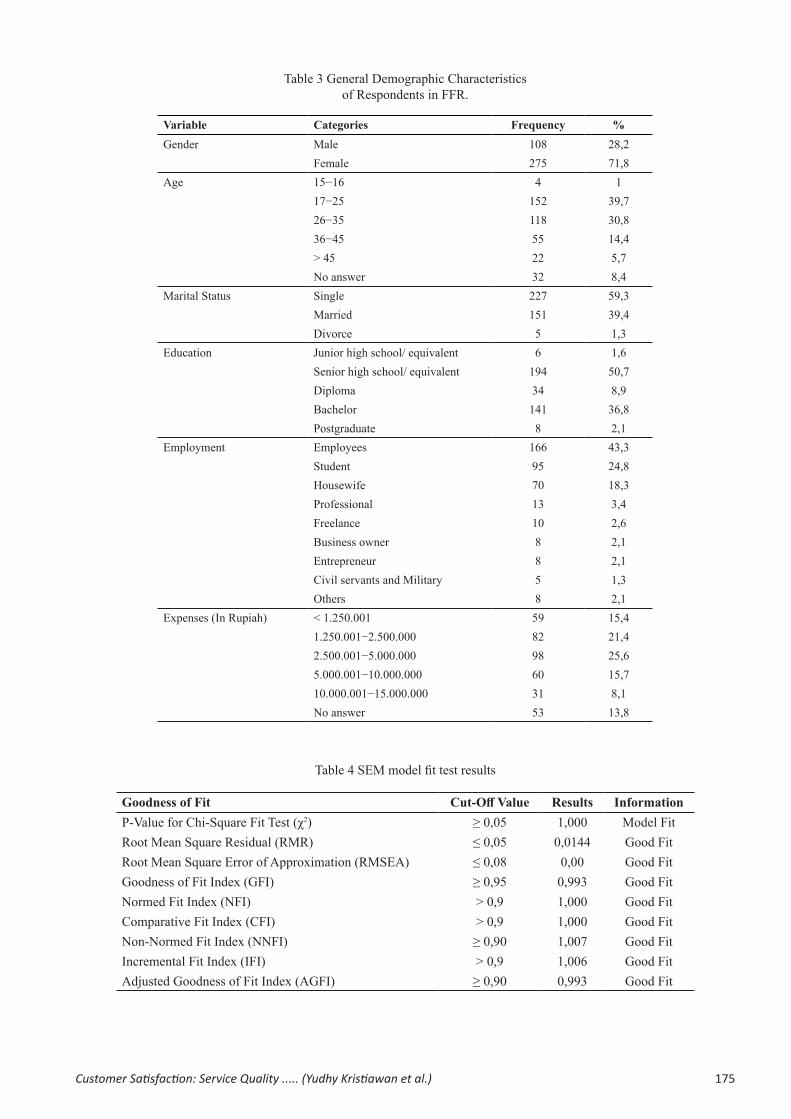
Demographic analysis is needed to determine the characteristics of customers in FFR based on gender, age group, marital status, education level, occupation, and average expenditure per month are in Table 3 (see Appendices). Understanding the demographic characteristics of customers is an important part of understanding fast food market segmentation that
needs to be developed in the future. Marketing strategy is expected to be more targeted according to market potential or opportunity.
An index categorized as a fit model does not guarantee that the model is fit and vice versa. Therefore, the researchers provide several alternative measurements of GoF that can be used together or in combination to assess the degree of fit of a model show in Table 4 (see Appendices). In addition, many alternative measurements have been developed to reduce the bias of the fit model (Hair Jr. et al., 2010).
The Chi-Square fit test functions to measure how close the covariance matrix the predicted results are and the data sample covariance matrix. In practice, the p-value is expected to be ≥ 0,05 that H0 is not rejected, so there is no difference between the results of the predicted covariance matrix with the sample covariance matrix of data. Therefore, it can be stated that the model is good. The p-value in the research is 1,00 or greater than 0,05. Meanwhile, RMSEA is a
Figure 2 SEM Hybrid Model
170 Binus Business Review, Vol. 12 No. 2, July 2021, 165-176
measure of the average expected difference per degree of freedom in the population. The RMSEA is an index to compensate for Chi-Square in a large sample. The RMSEA value can be said to be a good fit if it is lower than 0,08. In the research, the RMSEA value is 0,00.
Meanwhile, GFI is a measure of the accuracy of the model in producing the observed matrix covariance. This GFI value should range from 0 to 1. The closer the number to 1 is, the better the model can be said. Researchers often use a greater number than 0,90 to assess the fit of a model based on the GFI value. The GFI value in the model fit test is 0,993. In AGFI, there is an adjustment in the effect of the degree of freedom on the model. The accepted AGFI size is above 0,90. Meanwhile, the NFI value is the amount of mismatch between the target model and the base model. NFI values range from 0 to 1. The terms of the NFI value can be said to be a good fit if it is 0,95.
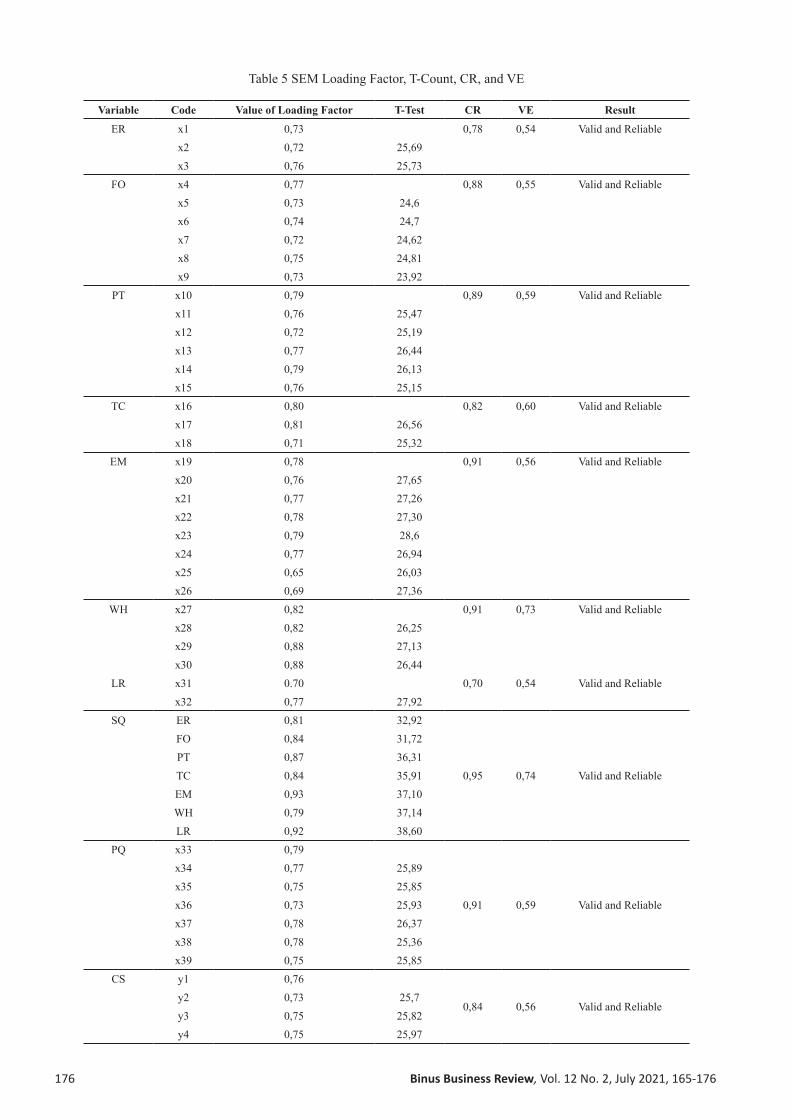
SEM analysis not only produces model fit but also informs about the measurement of model fit. The indicator variable of a latent variable is consistent or reliable if it has a value of CR ≥ 0,70 and a value of VE ≥ 0,50 (Hair Jr. et al., 2010). The CR and VE values of each latent variable in the research are presented in Table 5 (see Appendices). All indicator variables of each latent variable show a CR value of more than 0,70. It shows that all indicator variables can measure their latent variables. There is not a single VE value that is lower than 0,50. It indicates that all indicator variables can consistently measure the existing latent variables.
Table 6 Estimation Result of Path Coefficient and T-Test of SEM Model
The relationship between variables
Path coefficient T-test
Service quality and customer satisfaction 0,25 2,43*
Product quality and customer satisfaction 0,21 1,64
Notes: *The confidence level is 95%, if t-test is ≥ 1,96, it is
significant**The confidence level is 99%, if t-test is ≥ 2,56, it is significant
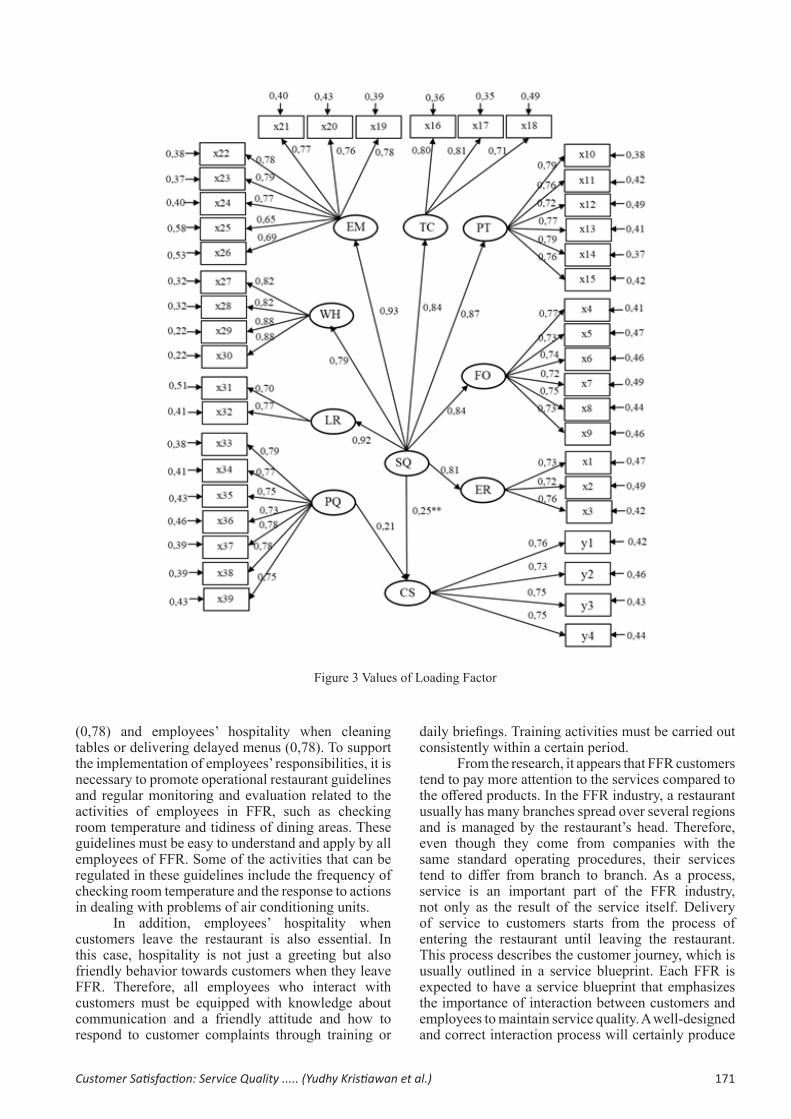
The calculation results in Table 6 show that there is one t-test result that is less than 1,96, which is 1,64. It confirms that there is no significant relationship between the exogenous latent variable of product quality and the endogenous latent variable of customer satisfaction. Meanwhile, there is a relationship between service quality and customer satisfaction. The path diagram of FFR for customer satisfaction can be seen in Figure 3 (loading factor value and significance test (t-test)). The relationship between variables can be determined by performing a significance test (t-test).
The confidence level used is 95% (significance level of 0,05) and a t-value of 1,96. The significance is determined by the t-value of each variable which is less than the t-table value (1,96). In the research, it is known that only one variable influences customer satisfaction, namely service quality.
The relationship between service quality and customer satisfaction has a t-test value of more than 1,96, which is 2,43. It means that service quality has a significant effect on customer satisfaction. This result is in line with Qin et al. (2010), Ramanathan, Di, and Ramanathan (2016), and Fitria and Yuliati (2020), who stated that service quality had a positive influence on customer satisfaction. Similarly, Kabir (2016) and Shahzadi, Malik, Ahmad, and Shabbir (2018) suggested that customer satisfaction was influenced by the quality of service provided. Then, Kaura, Durga Prasad, and Sharma (2015) stated that service quality directly affected customer satisfaction, although service quality dimensions are different from the research (ServQual). In short, the better the quality of service received by customers is, the more customer satisfaction will also increase. However, this result is different from the research by Purwanto et al. (2016). Satisfaction is not influenced by the quality of service perceived by customers.
Based on the analysis, the relationship between product quality and customer satisfaction has a less t-test than 1,96, which is 1,64. It means that product quality has no significant effect on customer satisfaction. This result is in line with Sabir, Irfan, Akhtar, Pervez, & Ur Rehman (2014). Product quality has a weak relationship with customer satisfaction. However, these results differ from Iskandar et al. (2015) and Purwanto et al. (2016). Product quality has a direct and significant effect on customer satisfaction. Similar findings are also stated that product quality has a significant relationship to customer satisfaction (Shariff et al., 2015; Kabir, 2016). Although product quality in the research does not significantly affect customer satisfaction, it does not mean that product quality is not essential in creating customer satisfaction.
Next, the overall CSI, which is expressed by feeling very satisfied when eating at FFR, is 88,72. The CSI is certainly related to the factors that affect customer satisfaction. The latent variable of product quality has a very small effect on the CSI calculation. In the SEM model results, the loading factor for the product quality is only 0,21. Meanwhile, the service quality has an influence of 0,25.
The research results related to service and product quality and customer satisfaction indicate that service quality positively and significantly affects customer satisfaction. Service quality is measured by paying attention to the customer journey at FFR. The customer journey while dining and leaving the restaurant has the greatest influence in creating good service quality. The values are 0,93 and 0,92, respectively. When customers eat a meal, the coolness of the restaurant room is a very important factor (0,79), followed by the neat arrangement of chairs
171Customer Satisfaction: Service Quality ..... (Yudhy Kristiawan et al.)
(0,78) and employees’ hospitality when cleaning tables or delivering delayed menus (0,78). To support the implementation of employees’ responsibilities, it is necessary to promote operational restaurant guidelines and regular monitoring and evaluation related to the activities of employees in FFR, such as checking room temperature and tidiness of dining areas. These guidelines must be easy to understand and apply by all employees of FFR. Some of the activities that can be regulated in these guidelines include the frequency of checking room temperature and the response to actions in dealing with problems of air conditioning units.
In addition, employees’ hospitality when customers leave the restaurant is also essential. In this case, hospitality is not just a greeting but also friendly behavior towards customers when they leave FFR. Therefore, all employees who interact with customers must be equipped with knowledge about communication and a friendly attitude and how to respond to customer complaints through training or
daily briefings. Training activities must be carried out consistently within a certain period.
From the research, it appears that FFR customers tend to pay more attention to the services compared to the offered products. In the FFR industry, a restaurant usually has many branches spread over several regions and is managed by the restaurant’s head. Therefore, even though they come from companies with the same standard operating procedures, their services tend to differ from branch to branch. As a process, service is an important part of the FFR industry, not only as the result of the service itself. Delivery of service to customers starts from the process of entering the restaurant until leaving the restaurant. This process describes the customer journey, which is usually outlined in a service blueprint. Each FFR is expected to have a service blueprint that emphasizes the importance of interaction between customers and employees to maintain service quality. A well-designed and correct interaction process will certainly produce
Figure 3 Values of Loading Factor
172 Binus Business Review, Vol. 12 No. 2, July 2021, 165-176
service quality. In the research, the service quality in FFR is reflected in creating a sense of comfort when customers dine in a restaurant and the friendliness of employees when customers leave the restaurant. For this reason, FFR owners and managers are expected to continue to create comfort for all customers and provide friendly service during the operation time of the restaurant.
Other findings from the research indicate that product quality has no significant effect on customer satisfaction. In general, an FFR will offer the same type of food for all its branches. All FFRs guarantee that the products are of the same quality in all of their branches. Although product quality does not have a significant effect on customer satisfaction, it does not mean that the variables are not necessary for the development of the FFR industry.
Efforts to create good quality and sustainable products must be the concern of FFR management. Management needs to formulate policies related to product innovation, especially taste, freshness, and food safety. This attribute has a major contribution to product quality. Raw material standards are needed to maintain product freshness and safety. In addition, FFR management through the research and development team must continue to innovate in variations of food or drinks with good taste. It is important to avoid customer saturation so far. The overall CSI shows quite high results. However, restaurant management still has to maintain these achievements, especially by paying attention to the factors that influence customer satisfaction, such as service quality. In addition, the management also needs to carry out a CSI study of FFR by involving restaurant customers in general. The results of that research can be used as a comparison in increasing the CSI.
CONCLUSIONS
In the research, it is found that service quality affects customer satisfaction. The better customers receive the quality of service, the higher the level of customer satisfaction will be. Satisfied customers will revisit the FFR. The service quality provided by FFR also has a significant influence on the creation of CSI compared to the product quality. However, it does not mean that product quality is insignificant in creating customer satisfaction. FFR management must pay attention to attributes that contribute greatly but receive low ratings from customers to increase customer satisfaction. For example, the coolness of the room has a big influence when customers eat, but their ratings are still low. Another important attribute that has a low rating is the greeting from the employees when customers leave the restaurant. Along with the increasing number of FFR, the level of competition also increases. Therefore, owners and managers of FFR should provide good service and product quality to maintain their existence in the industry.
The research has a limitation that the selected
respondents only come from one FFR through the convenience sampling technique. As a suggestion, future research needs to involve respondents from various FFRs to make comparisons. The selection of a more representative sample can also be applied. Furthermore, enriching the analysis can include other factors that also affect customer satisfaction to make it more comprehensive, such as customer loyalty, switching barriers, restaurant reputation, personality, and other variables. Finally, the research results can be taken into consideration by the FFR manager to evaluate the market segment and improve future performance and competitiveness.
ACKNOWLEDGEMENT
I acknowledge the effort of my supervisor, who provided insight and expertise that greatly assisted the research and the enumerator team for the sourcing of material and data for the research.
REFERENCES
Ajami, M. P., Navarro Elola, L., & Pastor, J. (2018). Validation and improvement of the European Customer Satisfaction Index for the Spanish wine sector. TQM Journal, 30(2), 133-152. https://doi.org/10.1108/TQM-07-2016-0056
Blackwell, R. D., Miniard, P. W., & Engel, J. F. (2012). Consumer behavior. Singapore: Cengage Learning.
Chuang, L. M., Kuo, T. S., & Luo, G. Y. (2020). The sustainable service innovation model in the chain restaurant industry: Circular economy perspective. Advances in Management and Applied Economics, 10(4), 1-22.
Febryanto, & Bernarto, I. (2018). The effects of service quality, competitive prices and product quality on customer satisfaction. Journal of Environmental Management & Tourism, 9(6(30)), 1165-1171.
Fitria, N. A., & Yuliati, E. (2020). The impact of behavior of restaurant employees on word of mouth intention: The mediating role of customer satisfaction. IPTEK The Journal for Technology and Science, 31(1), 91-100. https://doi.org/10.12962/j20882033.v31i1.6328
Hair Jr., J. F., Black, W. C., Babin, B. J., & Anderson, R. E. (2010). Multivariate data analysis. New York: Prentice Hall International.
Iskandar, D., Nurmalina, R., & Riani, E. (2015). The effect of service, product quality, and perceived value on customer purchase intention and satisfaction. Indonesian Journal of Business and Entrepreneurship (IJBE), 1(2), 51-51.
Jöreskog, K. G., Olsson, U. H., & Wallentin, F. Y. (2016). Multivariate analysis with LISREL. Basel, Switzerland: Springer.
Kabir, J. M. (2016). Factors influencing customer satisfaction at a fast food hamburger chain: the relationship between customer satisfaction and customer loyalty (Dissertation). Wilmington University.
Kaura, V., Durga Prasad, C. S., & Sharma, S. (2015).
173Customer Satisfaction: Service Quality ..... (Yudhy Kristiawan et al.)
Service quality, service convenience, price and fairness, customer loyalty, and the mediating role of customer satisfaction. International Journal of Bank Marketing, 33(4), 404-422. https://doi.org/10.1108/IJBM-04-2014-0048
Kotler, P., & Keller, K. L. (2012). Marketing management. New Jersey: Prentice Hall.
Kukanja, M., Omerzel, D. G., & Bukovec, B. (2017). A restaurant quality model based on marketing factors. E+M. Ekonomie a Management = Economics and Managemen, 20(1), 157-171. https://doi.org/10.15240/tul/001/2017-1-011
Kukanja, M., & Planinc, T. (2019). Cost-effective service excellence: Exploring the relationships among restaurants’ operational efficiency, size and service quality. The South East European Journal of Economics and Business, 14(2), 67-81. https://doi.org/10.2478/jeb-2019-0014
Lai, I. K. W. (2015). The roles of value, satisfaction, and commitment in the effect of service quality on customer loyalty in Hong Kong–style tea restaurants. Cornell Hospitality Quarterly, 56(1), 118-138. https://doi.org/10.1177/1938965514556149
Namkung, Y., & Jang, S. (2007). Does food quality really matter in restaurants? Its impact on customer satisfaction and behavioral intentions. Journal of Hospitality & Tourism Research, 31(3), 387-409. https://doi.org/10.1177/1096348007299924
Nguyen, Q., Nisar, T. M., Knox, D., & Prabhakar, G. P. (2018). Understanding customer satisfaction in the UK quick service restaurant industry: The influence of the tangible attributes of perceived service quality. British Food Journal, 120(6), 1207-1222. https://doi.org/10.1108/BFJ-08-2017-0449
Purwanto, E., Deny, D., & Tansil, R. C. (2016). Pengaruh atmosferik terhadap kepuasan dan niatan perilaku konsumen. Jurnal Ekonomi dan Bisnis, 19(3), 355-372.
Qin, H., & Prybutok, V. R. (2009). Service quality, customer satisfaction, and behavioral intentions in fast-food restaurants. International Journal of Quality and Service Sciences, 1(1), 78-95. https://doi.org/10.1108/17566690910945886
Qin, H., Prybutok, V. R., & Zhao, Q. (2010). Perceived service quality in fast-food restaurants: Empirical evidence from China. International Journal of Quality and Reliability Management, 27(4), 424-437. https://doi.org/10.1108/02656711011035129
Rajendran, R. P., & Suresh, J. (2017). Customer Satisfaction Index as a performance evaluation metric: A study on Indian e-banking industry. International Journal of Business, 22(3), 251-274.
Ramanathan, R., Di, Y., & Ramanathan, U. (2016). Moderating roles of customer characteristics on the link between service factors and satisfaction in
a buffet restaurant. Benchmarking, 23(2), 469-486. https://doi.org/10.1108/BIJ-01-2015-0012
Ramdhani, H. S., Daryanto, A., & Rifin, A. (2015). Kepuasan sebagai variabel antara kualitas produk, kualitas pelayanan, dan persepsi nilai terhadap loyalitas konsumen pada restoran baru. Jurnal Ilmu Keluarga & Konsumen, 8(2), 115-124. https://doi.org/10.24156/jikk.2015.8.2.115
Sabir, R. I., Irfan, M., Akhtar, N., Pervez, M. A., & Ur Rehman, A. (2014). Customer satisfaction in the restaurant industry; examining the model in local industry perspective. Journal of Asian Business Strategy, 4(1), 18-31.
Serhan, M., & Serhan, C. (2019). The impact of food service attributes on customer satisfaction in a rural university campus environment. International Journal of Food Science, 2019, 1-12. https://doi.org/10.1155/2019/2154548
Shahzadi, M., Malik, S. A., Ahmad, M., & Shabbir, A. (2018). Perceptions of fine dining restaurants in Pakistan: What influences customer satisfaction and behavioral intentions? International Journal of Quality & Reliability Management, 35(3), 635-655. https://doi.org/10.1108/IJQRM-07-2016-0113
Shariff, S. N. F. B. A., Omar, M. B., Sulong, S. N. B., Majid, H. A. B. M. A., Ibrahim, H. B. M., Jaafar, Z. B., & Ideris, M. S. K. B. (2015). The influence of service quality and food quality towards customer fulfillment and revisit intention. Canadian Social Science, 11(8), 110-116. https://doi.org/10.3968/7369
Suchánek, P., Richter, J., & Králová, M. (2017). Customer satisfaction with quality of products of food business. Prague Economic Papers, 26(1), 19-35. https://doi.org/10.18267/j.pep.595
Sumarwan, U. (2011). Perilaku konsumen: Teori dan penerapannya dalam pemasaran. Jakarta: Penerbit PT Ghalia Indonesia.
Taherdoost, H. (2016). Measurement and scaling techniques in research methodology; survey/questionnaire development. International Journal of Academic Research in Management (IJARM), 6(1), 1-5.
USDA. (2017). Global Agricultural Information Network Report (GAIN) Report no. 1732. Retrieved from https://apps.fas.usda.gov/newgainapi/api/report/downloadreportbyfilename?filename=Food%20Service%20-%20Hote l%20Res taurant%20Institutional_Jakarta_Indonesia_06-12-2017.pdf
Wirtz, J., & Lovelock, C. (2016). Services marketing: People, technology, strategy. World Scientific Publishing Company.
Zhong, Y., & Moon, H. C. (2020). What drives customer satisfaction, loyalty, and happiness in fast-food restaurants in China? Perceived price, service quality, food quality, physical environment quality, and the moderating role of gender. Foods, 9(4), 1-19. https://doi.org/10.3390/foods9040460
174 Binus Business Review, Vol. 12 No. 2, July 2021, 165-176
APPENDICES
Table 2 Research Variables and Indicators
Variables Code Indicators
Entering the restaurant x1 Greetings from the employeesx2 Hospitality in welcoming customersx3 Availability of seats
Ordering food x4 Greetings from employeesx5 Employees’ hospitality when customers order food x6 Offering product (food and beverage)x7 Speed of service by the employeesx8 The composition of the appropriate food ordered as in the menu boardx9 The attractive menu board display
Payment transactions x10 Cashiers’ hospitalityx11 Ensuring the suitability of food and drinks orderedx12 Various types of payments in the transaction process x13 Clarity of the amount to be paid and the change to be receivedx14 Payment transaction speedx15 Cleanliness in the cashiers’ desk area
Taking condiment (sauce or cutlery)
x16 Availability of chili sauce or cutleryx17 Cleanliness of the chili sauce table or cutleryx18 The sauce pump functioning properly
Eating a meal x19 Employees’ hospitality when cleaning the table and delivering the delayed menux20 Delayed menu delivery speedx21 Cleanliness of the restaurant roomx22 The tidiness of chair arrangementx23 The coolness of the restaurant roomx24 Indoor lightingx25 Live music in the roomx26 Free of insects, such as flies, cockroaches, and others in the dining room
Washing hands and personal needs
x27 Tidiness in the sink or toilet areax28 Cleanliness in the sink or toilet areax29 Availability of handwashing soapx30 Hand dryer working properly
Leaving the restaurant x31 Greetings from the employeesx32 Employees’ hospitality
Product Quality x33 Product tastex34 Product temperaturex35 Various menux36 Product appearancex37 Product freshnessx38 Food safetyx39 Halal products
Customer Satisfaction y1 Overall satisfactiony2 Overall service satisfactiony3 Overall product satisfactiony4 Satisfaction with overall perceived value
175Customer Satisfaction: Service Quality ..... (Yudhy Kristiawan et al.)
Table 3 General Demographic Characteristics of Respondents in FFR.
Variable Categories Frequency %Gender Male 108 28,2
Female 275 71,8Age 15−16 4 1
17−25 152 39,726−35 118 30,836−45 55 14,4> 45 22 5,7No answer 32 8,4
Marital Status Single 227 59,3Married 151 39,4Divorce 5 1,3
Education Junior high school/ equivalent 6 1,6Senior high school/ equivalent 194 50,7Diploma 34 8,9Bachelor 141 36,8Postgraduate 8 2,1
Employment Employees 166 43,3Student 95 24,8Housewife 70 18,3Professional 13 3,4Freelance 10 2,6Business owner 8 2,1Entrepreneur 8 2,1Civil servants and Military 5 1,3Others 8 2,1
Expenses (In Rupiah) < 1.250.001 59 15,41.250.001−2.500.000 82 21,42.500.001−5.000.000 98 25,65.000.001−10.000.000 60 15,710.000.001−15.000.000 31 8,1No answer 53 13,8
Table 4 SEM model fit test results
Goodness of Fit Cut-Off Value Results InformationP-Value for Chi-Square Fit Test (χ2) ≥ 0,05 1,000 Model FitRoot Mean Square Residual (RMR) ≤ 0,05 0,0144 Good FitRoot Mean Square Error of Approximation (RMSEA) ≤ 0,08 0,00 Good FitGoodness of Fit Index (GFI) ≥ 0,95 0,993 Good FitNormed Fit Index (NFI) > 0,9 1,000 Good FitComparative Fit Index (CFI) > 0,9 1,000 Good FitNon-Normed Fit Index (NNFI) ≥ 0,90 1,007 Good FitIncremental Fit Index (IFI) > 0,9 1,006 Good FitAdjusted Goodness of Fit Index (AGFI) ≥ 0,90 0,993 Good Fit
176 Binus Business Review, Vol. 12 No. 2, July 2021, 165-176
Table 5 SEM Loading Factor, T-Count, CR, and VE
Variable Code Value of Loading Factor T-Test CR VE Result
ER x1 0,73 0,78 0,54 Valid and Reliablex2 0,72 25,69x3 0,76 25,73
FO x4 0,77 0,88 0,55 Valid and Reliablex5 0,73 24,6x6 0,74 24,7x7 0,72 24,62x8 0,75 24,81x9 0,73 23,92
PT x10 0,79 0,89 0,59 Valid and Reliablex11 0,76 25,47x12 0,72 25,19x13 0,77 26,44x14 0,79 26,13x15 0,76 25,15
TC x16 0,80 0,82 0,60 Valid and Reliablex17 0,81 26,56x18 0,71 25,32
EM x19 0,78 0,91 0,56 Valid and Reliablex20 0,76 27,65x21 0,77 27,26x22 0,78 27,30x23 0,79 28,6x24 0,77 26,94x25 0,65 26,03x26 0,69 27,36
WH x27 0,82 0,91 0,73 Valid and Reliablex28 0,82 26,25x29 0,88 27,13x30 0,88 26,44
LR x31 0.70 0,70 0,54 Valid and Reliablex32 0,77 27,92
SQ ER 0,81 32,92
0,95 0,74 Valid and Reliable
FO 0,84 31,72PT 0,87 36,31TC 0,84 35,91EM 0,93 37,10WH 0,79 37,14LR 0,92 38,60
PQ x33 0,79
0,91 0,59 Valid and Reliable
x34 0,77 25,89x35 0,75 25,85x36 0,73 25,93x37 0,78 26,37x38 0,78 25,36x39 0,75 25,85
CS y1 0,76
0,84 0,56 Valid and Reliabley2 0,73 25,7y3 0,75 25,82y4 0,75 25,97