FAST STATS 2020 - British Columbia's Agriculture, Food and ...
52
FAST STATS 2020 British Columbia’s Agriculture, Food and Seafood Sector | JANUARY 2022
-
Upload
khangminh22 -
Category
Documents
-
view
0 -
download
0
Transcript of FAST STATS 2020 - British Columbia's Agriculture, Food and ...
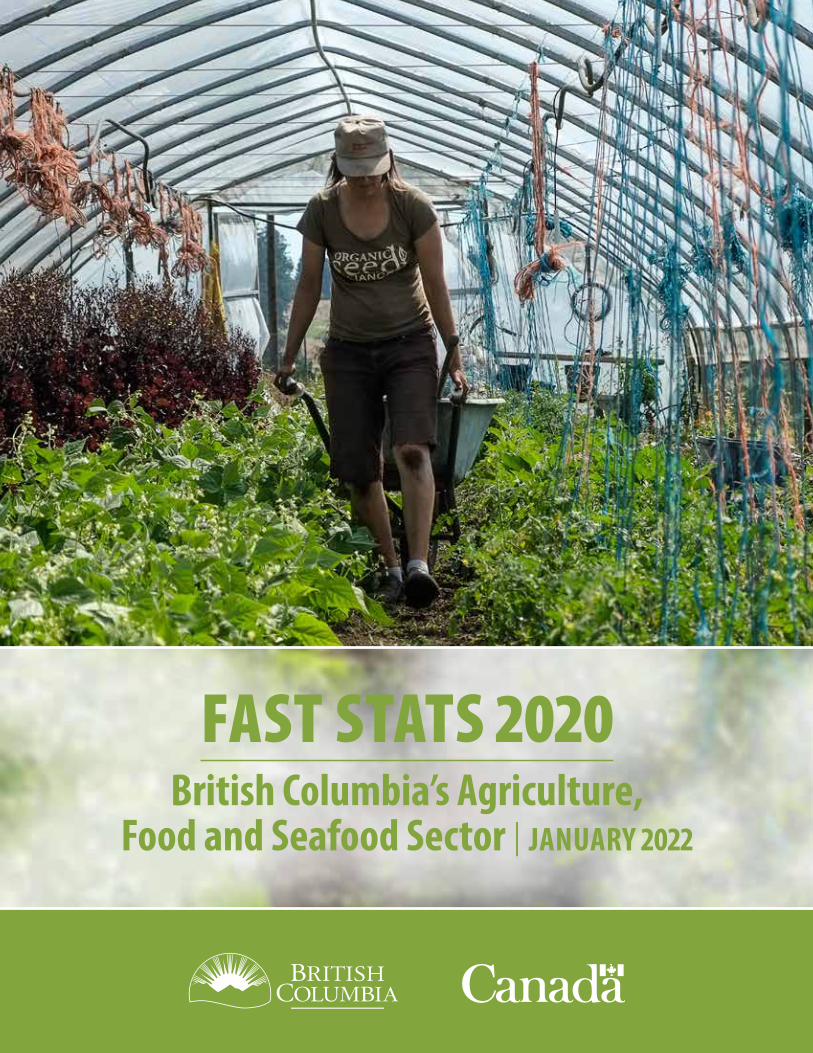
FAST STATS 2020British Columbia’s Agriculture,
Food and Seafood Sector | JANUARY 2022
[ 2 ] FAST STATS 2020 / British Columbia’s Agriculture, Food and Seafood Sector / JANUARY 2022
ContentsHighlights 3
Value of B.C.’s Agriculture, Food and Seafood Industry 3
Sector Revenues 3
Primary Agriculture 3
Primary Seafood 3
Food and Beverage Processing 3
B.C.’s Top Agrifood and Seafood Exports 4
B.C.’s Top 30 Agricultural and Seafood Commodities 5
Areas of Agricultural Activity by Census Agricultural Region – South 6
Areas of Agricultural Activity by Census Agricultural Region – North 7
Sector Profile 8
Resources in British Columbia Agriculture 8
Age of B.C. Farm Operators 9
B.C. Farmland Tenure 9
Number of Aquaculture Operations 9
Number of Organic Farms 9
Number of Agrifood and Seafood Establishments by Industry 10
Number of Other Agrifood and Seafood Related Establishments by Industry 11
B.C. Agricultural Land Management Practices 11
Farms Using Computers and Other Technologies 12
Number of Farms Selling Directly to Consumers 14
Agricultural Production and Prices 15
Grains, Oilseeds and Other Field Crop Production 15
Selected Grains and Oilseed Prices 16
Field Vegetables 16
Greenhouse Vegetables 23
Berries and Grapes 24
Tree Fruits 26
Floriculture Products 28
Production of Sod and Nursery Products 30
Animal Production and Prices 31
Livestock on B.C. Farms 31
Livestock Prices 32
Livestock Supply and Disposition 33
Milk Production and Utilization 34
Poultry Production and Disposition 35
Egg Production And Disposition 35
Honey Production 35
Aquaculture Production 36
Wild Commercial Fisheries Production 36
Aquaculture Prices 37
Wild Commercial Fisheries Prices 37
Value of Agrifood and Seafood 38
Farm Cash Receipts for B.C. Agriculture 38
Farm Cash Receipts, by Agricultural Commodity Group 39
Value of Pollination in B.C. 42
Farm Gate Value of Aquaculture Commodities 42
Landed Value of Wild Commercial Fisheries 43
Value of Food and Beverage Processing Sales 43
Farm Income and Expenses 44
Farm Operating Expenses and Depreciation Charges 44
Farm Income in B.C. 45
Total Agricultural Farm Debt Outstanding 45
Employment and Other Economic Indicators 46
Employment in the B.C. Agriculture, Food and Seafood Sector 46
Other Agriculture, Food and Seafood Sector Related Employment 47
Temporary Foreign Workers in B.C. Agricultural Occupations 47
Contribution to GDP by Sector 48
B.C. Farm Product Price Index 49
Price Indexes 49
Per Capita Consumption of Selected Foods in Canada 50
End Notes 51
[ 3 ] FAST STATS 2020 / British Columbia’s Agriculture, Food and Seafood Sector / JANUARY 2022
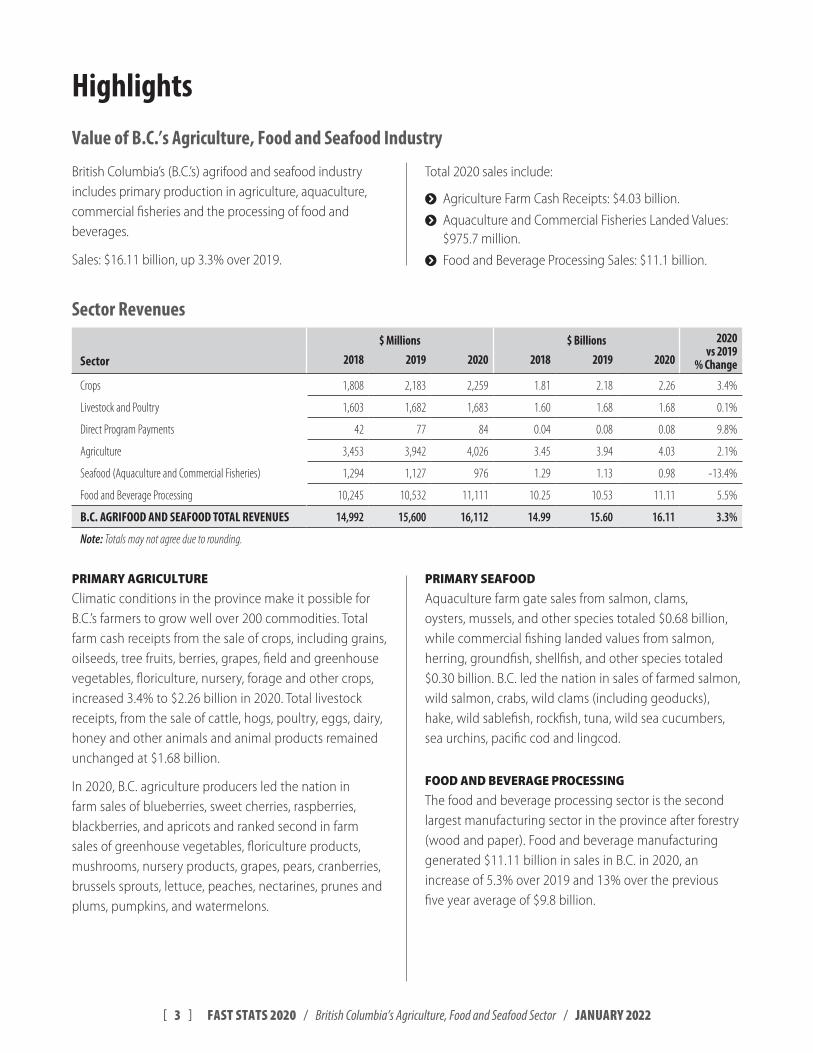
HighlightsValue of B.C.’s Agriculture, Food and Seafood Industry
British Columbia’s (B.C.’s) agrifood and seafood industry includes primary production in agriculture, aquaculture, commercial fisheries and the processing of food and beverages.
Sales: $16.11 billion, up 3.3% over 2019.
Total 2020 sales include:
į Agriculture Farm Cash Receipts: $4.03 billion.
į Aquaculture and Commercial Fisheries Landed Values: $975.7 million.
į Food and Beverage Processing Sales: $11.1 billion.
Sector Revenues$ Millions $ Billions 2020
vs 2019% Change Sector 2018 2019 2020 2018 2019 2020
Crops 1,808 2,183 2,259 1.81 2.18 2.26 3.4%
Livestock and Poultry 1,603 1,682 1,683 1.60 1.68 1.68 0.1%
Direct Program Payments 42 77 84 0.04 0.08 0.08 9.8%
Agriculture 3,453 3,942 4,026 3.45 3.94 4.03 2.1%
Seafood (Aquaculture and Commercial Fisheries) 1,294 1,127 976 1.29 1.13 0.98 -13.4%
Food and Beverage Processing 10,245 10,532 11,111 10.25 10.53 11.11 5.5%
B.C. AGRIFOOD AND SEAFOOD TOTAL REVENUES 14,992 15,600 16,112 14.99 15.60 16.11 3.3%
Note: Totals may not agree due to rounding
PRIMARY AGRICULTURE
Climatic conditions in the province make it possible for B.C.’s farmers to grow well over 200 commodities. Total farm cash receipts from the sale of crops, including grains, oilseeds, tree fruits, berries, grapes, field and greenhouse vegetables, floriculture, nursery, forage and other crops, increased 3.4% to $2.26 billion in 2020. Total livestock receipts, from the sale of cattle, hogs, poultry, eggs, dairy, honey and other animals and animal products remained unchanged at $1.68 billion.
In 2020, B.C. agriculture producers led the nation in farm sales of blueberries, sweet cherries, raspberries, blackberries, and apricots and ranked second in farm sales of greenhouse vegetables, floriculture products, mushrooms, nursery products, grapes, pears, cranberries, brussels sprouts, lettuce, peaches, nectarines, prunes and plums, pumpkins, and watermelons.
PRIMARY SEAFOOD
Aquaculture farm gate sales from salmon, clams, oysters, mussels, and other species totaled $0.68 billion, while commercial fishing landed values from salmon, herring, groundfish, shellfish, and other species totaled $0.30 billion. B.C. led the nation in sales of farmed salmon, wild salmon, crabs, wild clams (including geoducks), hake, wild sablefish, rockfish, tuna, wild sea cucumbers, sea urchins, pacific cod and lingcod.
FOOD AND BEVERAGE PROCESSING
The food and beverage processing sector is the second largest manufacturing sector in the province after forestry (wood and paper). Food and beverage manufacturing generated $11.11 billion in sales in B.C. in 2020, an increase of 5.3% over 2019 and 13% over the previous five year average of $9.8 billion.
[ 4 ] FAST STATS 2020 / British Columbia’s Agriculture, Food and Seafood Sector / JANUARY 2022
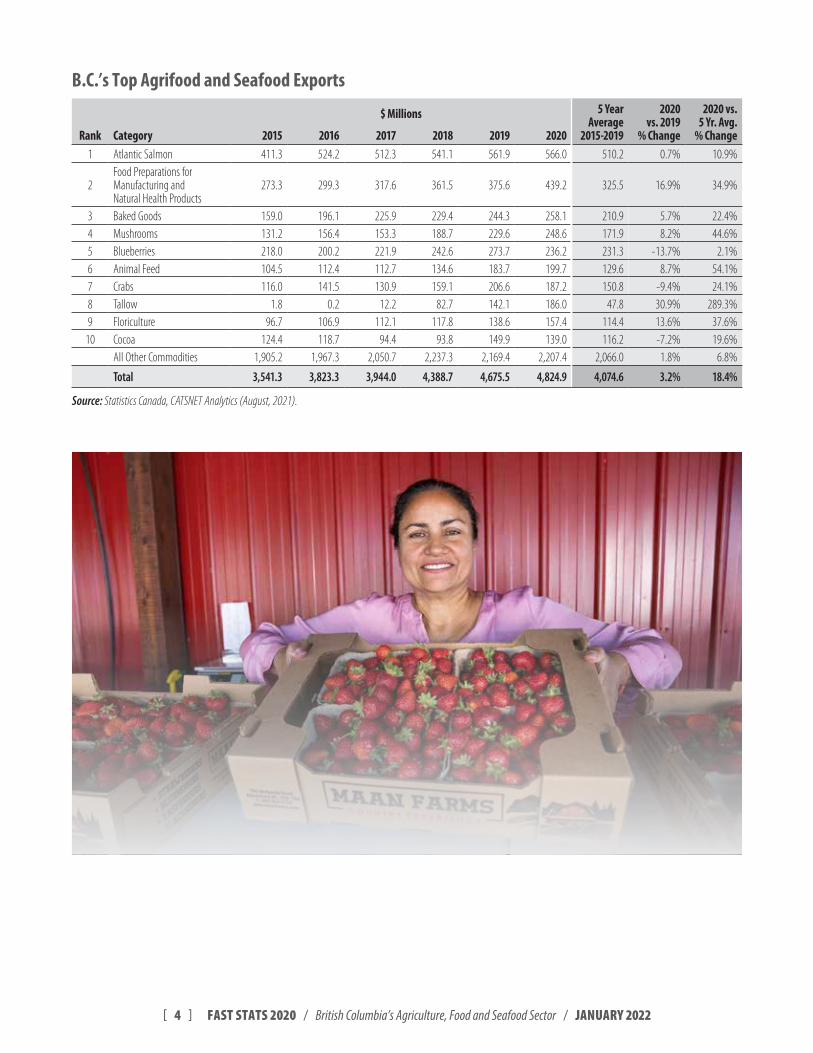
B.C.’s Top Agrifood and Seafood Exports
$ Millions 5 Year Average
2015-2019
2020 vs. 2019
% Change
2020 vs. 5 Yr. Avg.
% ChangeRank Category 2015 2016 2017 2018 2019 20201 Atlantic Salmon 411.3 524.2 512.3 541.1 561.9 566.0 510.2 0.7% 10.9%
2Food Preparations for Manufacturing and Natural Health Products
273.3 299.3 317.6 361.5 375.6 439.2 325.5 16.9% 34.9%
3 Baked Goods 159.0 196.1 225.9 229.4 244.3 258.1 210.9 5.7% 22.4%4 Mushrooms 131.2 156.4 153.3 188.7 229.6 248.6 171.9 8.2% 44.6%5 Blueberries 218.0 200.2 221.9 242.6 273.7 236.2 231.3 -13.7% 2.1%6 Animal Feed 104.5 112.4 112.7 134.6 183.7 199.7 129.6 8.7% 54.1%7 Crabs 116.0 141.5 130.9 159.1 206.6 187.2 150.8 -9.4% 24.1%8 Tallow 1.8 0.2 12.2 82.7 142.1 186.0 47.8 30.9% 289.3%9 Floriculture 96.7 106.9 112.1 117.8 138.6 157.4 114.4 13.6% 37.6%
10 Cocoa 124.4 118.7 94.4 93.8 149.9 139.0 116.2 -7.2% 19.6%All Other Commodities 1,905.2 1,967.3 2,050.7 2,237.3 2,169.4 2,207.4 2,066.0 1.8% 6.8%
Total 3,541.3 3,823.3 3,944.0 4,388.7 4,675.5 4,824.9 4,074.6 3.2% 18.4%
Source: Statistics Canada, CATSNET Analytics (August, 2021)
[ 5 ] FAST STATS 2020 / British Columbia’s Agriculture, Food and Seafood Sector / JANUARY 2022
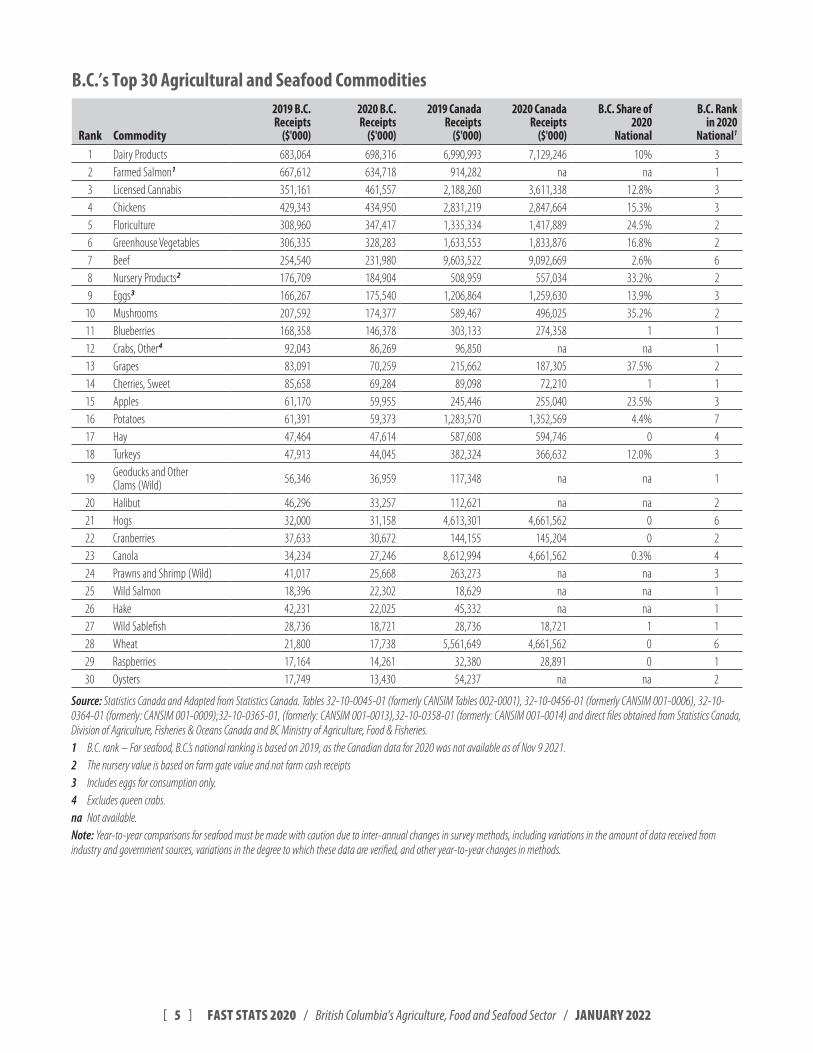
B.C.’s Top 30 Agricultural and Seafood Commodities
Rank Commodity
2019 B.C. Receipts
($'000)
2020 B.C. Receipts
($'000)
2019 Canada Receipts
($'000)
2020 Canada Receipts
($'000)
B.C. Share of 2020
National
B.C. Rank in 2020
National1
1 Dairy Products 683,064 698,316 6,990,993 7,129,246 10% 3 2 Farmed Salmon1 667,612 634,718 914,282 na na 1 3 Licensed Cannabis 351,161 461,557 2,188,260 3,611,338 12.8% 3 4 Chickens 429,343 434,950 2,831,219 2,847,664 15.3% 3 5 Floriculture 308,960 347,417 1,335,334 1,417,889 24.5% 2 6 Greenhouse Vegetables 306,335 328,283 1,633,553 1,833,876 16.8% 2 7 Beef 254,540 231,980 9,603,522 9,092,669 2.6% 6 8 Nursery Products2 176,709 184,904 508,959 557,034 33.2% 2 9 Eggs3 166,267 175,540 1,206,864 1,259,630 13.9% 3
10 Mushrooms 207,592 174,377 589,467 496,025 35.2% 2 11 Blueberries 168,358 146,378 303,133 274,358 1 1 12 Crabs, Other4 92,043 86,269 96,850 na na 1 13 Grapes 83,091 70,259 215,662 187,305 37.5% 2 14 Cherries, Sweet 85,658 69,284 89,098 72,210 1 1 15 Apples 61,170 59,955 245,446 255,040 23.5% 3 16 Potatoes 61,391 59,373 1,283,570 1,352,569 4.4% 7 17 Hay 47,464 47,614 587,608 594,746 0 4 18 Turkeys 47,913 44,045 382,324 366,632 12.0% 3
19 Geoducks and Other Clams (Wild) 56,346 36,959 117,348 na na 1
20 Halibut 46,296 33,257 112,621 na na 2 21 Hogs 32,000 31,158 4,613,301 4,661,562 0 6 22 Cranberries 37,633 30,672 144,155 145,204 0 2 23 Canola 34,234 27,246 8,612,994 4,661,562 0.3% 4 24 Prawns and Shrimp (Wild) 41,017 25,668 263,273 na na 3 25 Wild Salmon 18,396 22,302 18,629 na na 1 26 Hake 42,231 22,025 45,332 na na 1 27 Wild Sablefish 28,736 18,721 28,736 18,721 1 1 28 Wheat 21,800 17,738 5,561,649 4,661,562 0 6 29 Raspberries 17,164 14,261 32,380 28,891 0 1 30 Oysters 17,749 13,430 54,237 na na 2
Source: Statistics Canada and Adapted from Statistics Canada Tables 32-10-0045-01 (formerly CANSIM Tables 002-0001), 32-10-0456-01 (formerly CANSIM 001-0006), 32-10-0364-01 (formerly: CANSIM 001-0009);32-10-0365-01, (formerly: CANSIM 001-0013),32-10-0358-01 (formerly: CANSIM 001-0014) and direct files obtained from Statistics Canada, Division of Agriculture, Fisheries & Oceans Canada and BC Ministry of Agriculture, Food & Fisheries 1 B C rank – For seafood, B C ’s national ranking is based on 2019, as the Canadian data for 2020 was not available as of Nov 9 2021 2 The nursery value is based on farm gate value and not farm cash receipts 3 Includes eggs for consumption only 4 Excludes queen crabs na Not available Note: Year-to-year comparisons for seafood must be made with caution due to inter-annual changes in survey methods, including variations in the amount of data received from industry and government sources, variations in the degree to which these data are verified, and other year-to-year changes in methods
[ 6 ] FAST STATS 2020 / British Columbia’s Agriculture, Food and Seafood Sector / JANUARY 2022
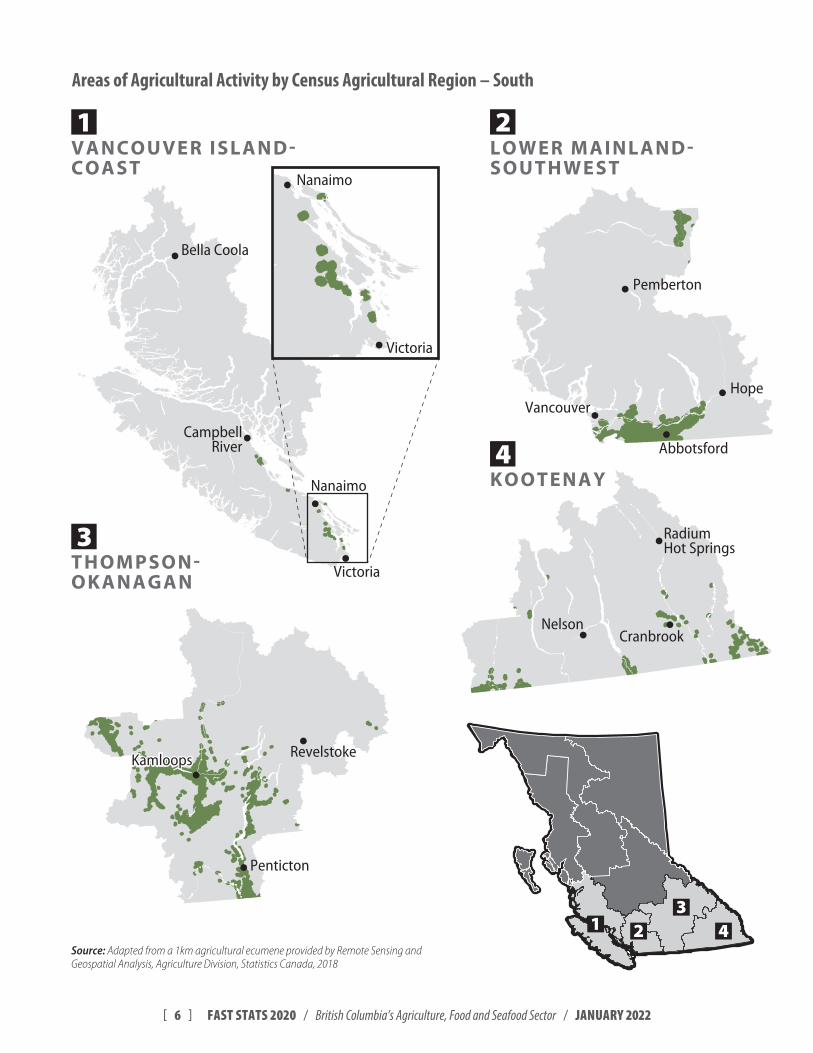
Areas of Agricultural Activity by Census Agricultural Region – South
KOOTENAY
VANCOUVER ISLAND-COAST
LOWER MAINLAND-SOUTHWEST
THOMPSON-OKANAGAN
1 2
3
13
2 4
4
Victoria
Victoria
Nanaimo
Nanaimo
Vancouver
Abbotsford
CranbrookNelson
RevelstokeKamloopsKamloops
Penticton
RadiumHot Springs
Hope
Pemberton
CampbellRiver
Bella Coola
Source: Adapted from a 1km agricultural ecumene provided by Remote Sensing and Geospatial Analysis, Agriculture Division, Statistics Canada, 2018
[ 7 ] FAST STATS 2020 / British Columbia’s Agriculture, Food and Seafood Sector / JANUARY 2022
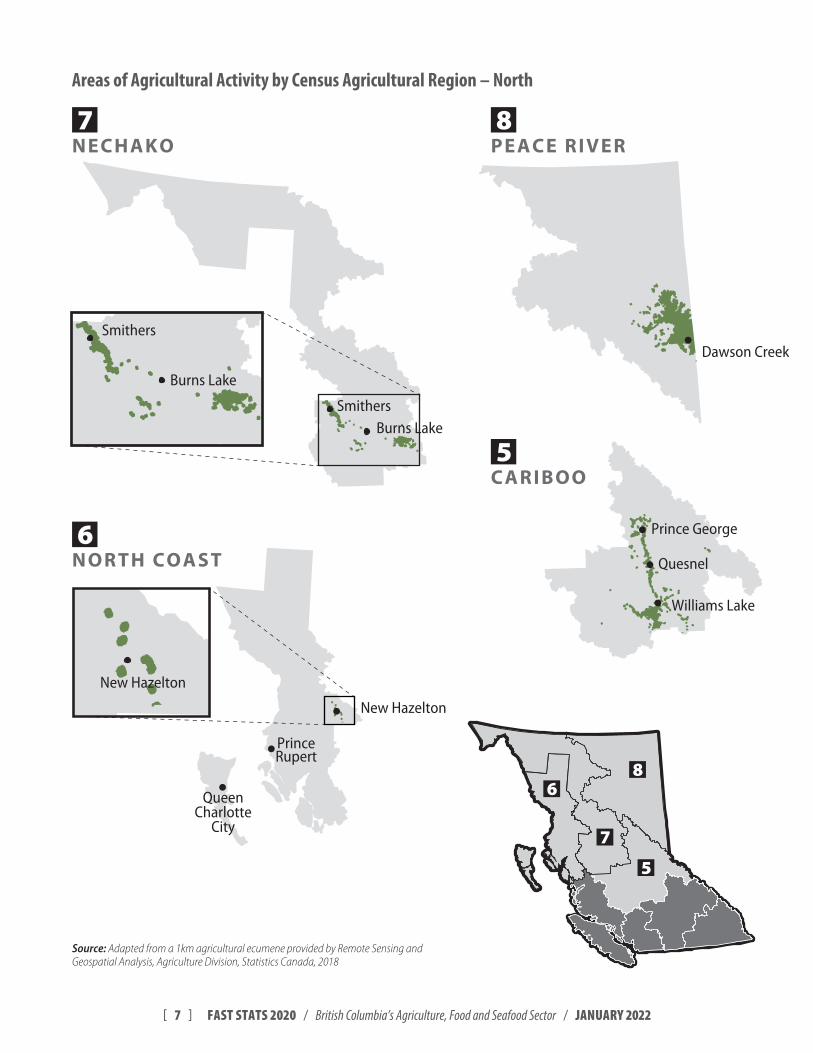
Source: Adapted from a 1km agricultural ecumene provided by Remote Sensing and Geospatial Analysis, Agriculture Division, Statistics Canada, 2018
CARIBOO
NECHAKO PEACE RIVER
NORTH COAST
7 8
6
6
7
8
5
5
Smithers
Smithers
Burns Lake
Burns Lake
Dawson Creek
New Hazelton
New Hazelton
PrinceRupert
QueenCharlotte
City
Quesnel
Prince George
Williams Lake
Areas of Agricultural Activity by Census Agricultural Region – North
[ 8 ] FAST STATS 2020 / British Columbia’s Agriculture, Food and Seafood Sector / JANUARY 2022
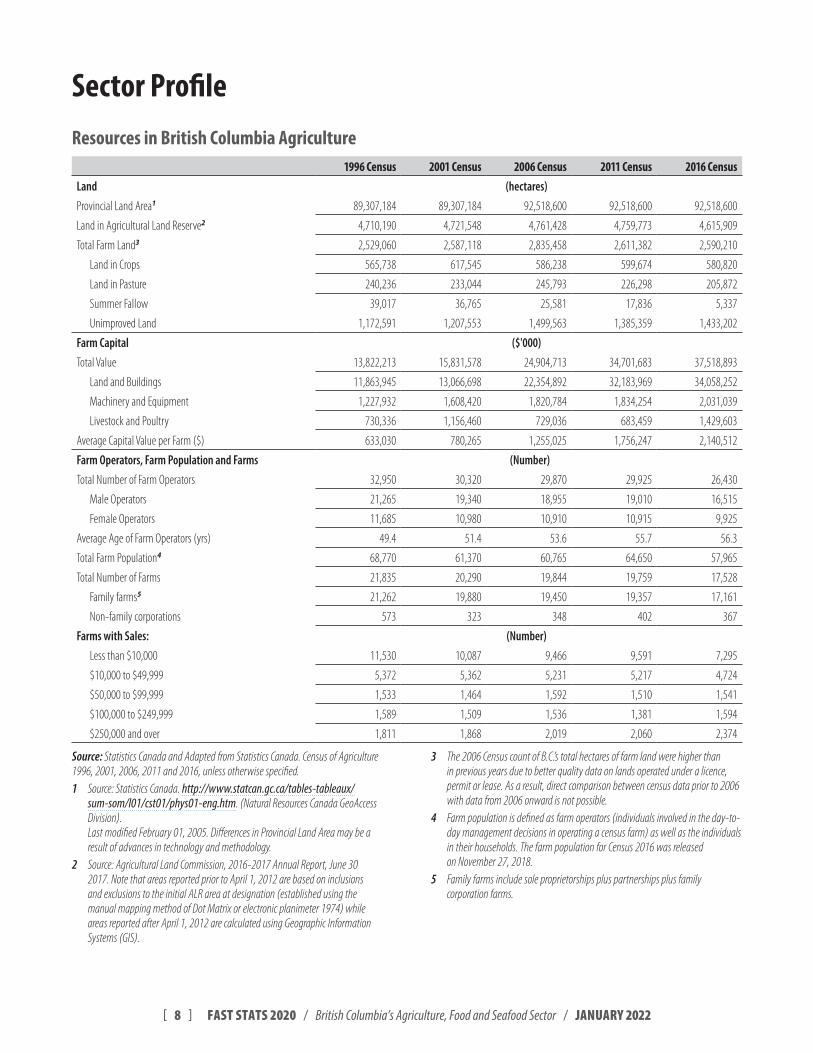
Sector ProfileResources in British Columbia Agriculture
1996 Census 2001 Census 2006 Census 2011 Census 2016 CensusLand (hectares)
Provincial Land Area1 89,307,184 89,307,184 92,518,600 92,518,600 92,518,600
Land in Agricultural Land Reserve2 4,710,190 4,721,548 4,761,428 4,759,773 4,615,909
Total Farm Land3 2,529,060 2,587,118 2,835,458 2,611,382 2,590,210
Land in Crops 565,738 617,545 586,238 599,674 580,820
Land in Pasture 240,236 233,044 245,793 226,298 205,872
Summer Fallow 39,017 36,765 25,581 17,836 5,337
Unimproved Land 1,172,591 1,207,553 1,499,563 1,385,359 1,433,202
Farm Capital ($'000)
Total Value 13,822,213 15,831,578 24,904,713 34,701,683 37,518,893
Land and Buildings 11,863,945 13,066,698 22,354,892 32,183,969 34,058,252
Machinery and Equipment 1,227,932 1,608,420 1,820,784 1,834,254 2,031,039
Livestock and Poultry 730,336 1,156,460 729,036 683,459 1,429,603
Average Capital Value per Farm ($) 633,030 780,265 1,255,025 1,756,247 2,140,512
Farm Operators, Farm Population and Farms (Number)
Total Number of Farm Operators 32,950 30,320 29,870 29,925 26,430
Male Operators 21,265 19,340 18,955 19,010 16,515
Female Operators 11,685 10,980 10,910 10,915 9,925
Average Age of Farm Operators (yrs) 49.4 51.4 53.6 55.7 56.3
Total Farm Population4 68,770 61,370 60,765 64,650 57,965
Total Number of Farms 21,835 20,290 19,844 19,759 17,528
Family farms5 21,262 19,880 19,450 19,357 17,161
Non-family corporations 573 323 348 402 367
Farms with Sales: (Number)
Less than $10,000 11,530 10,087 9,466 9,591 7,295
$10,000 to $49,999 5,372 5,362 5,231 5,217 4,724
$50,000 to $99,999 1,533 1,464 1,592 1,510 1,541
$100,000 to $249,999 1,589 1,509 1,536 1,381 1,594
$250,000 and over 1,811 1,868 2,019 2,060 2,374
Source: Statistics Canada and Adapted from Statistics Canada Census of Agriculture 1996, 2001, 2006, 2011 and 2016, unless otherwise specified 1 Source: Statistics Canada http://www.statcan.gc.ca/tables-tableaux/
sum-som/l01/cst01/phys01-eng.htm (Natural Resources Canada GeoAccess Division) Last modified February 01, 2005 Differences in Provincial Land Area may be a result of advances in technology and methodology
2 Source: Agricultural Land Commission, 2016-2017 Annual Report, June 30 2017 Note that areas reported prior to April 1, 2012 are based on inclusions and exclusions to the initial ALR area at designation (established using the manual mapping method of Dot Matrix or electronic planimeter 1974) while areas reported after April 1, 2012 are calculated using Geographic Information Systems (GIS)
3 The 2006 Census count of B C ’s total hectares of farm land were higher than in previous years due to better quality data on lands operated under a licence, permit or lease As a result, direct comparison between census data prior to 2006 with data from 2006 onward is not possible
4 Farm population is defined as farm operators (individuals involved in the day-to-day management decisions in operating a census farm) as well as the individuals in their households The farm population for Census 2016 was released on November 27, 2018
5 Family farms include sole proprietorships plus partnerships plus family corporation farms
[ 9 ] FAST STATS 2020 / British Columbia’s Agriculture, Food and Seafood Sector / JANUARY 2022
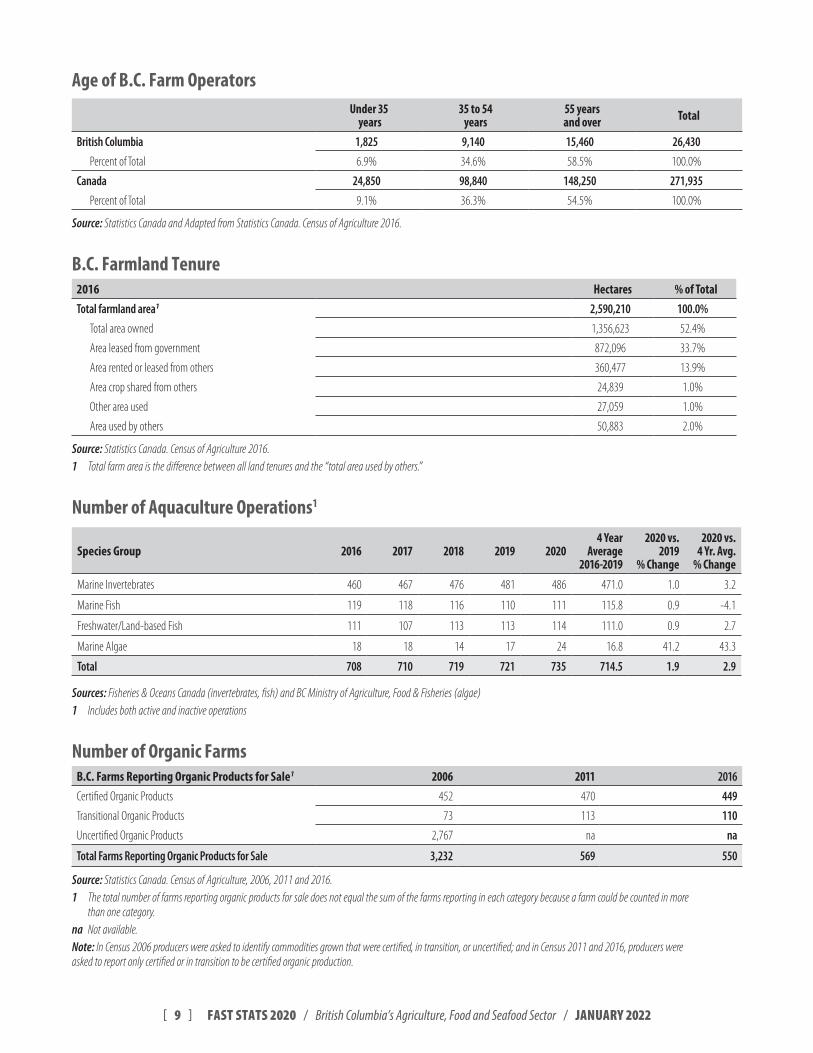
Age of B.C. Farm OperatorsUnder 35
years35 to 54
years55 years and over Total
British Columbia 1,825 9,140 15,460 26,430
Percent of Total 6.9% 34.6% 58.5% 100.0%
Canada 24,850 98,840 148,250 271,935
Percent of Total 9.1% 36.3% 54.5% 100.0%
Source: Statistics Canada and Adapted from Statistics Canada Census of Agriculture 2016
B.C. Farmland Tenure2016 Hectares % of TotalTotal farmland area1 2,590,210 100.0%
Total area owned 1,356,623 52.4%
Area leased from government 872,096 33.7%
Area rented or leased from others 360,477 13.9%
Area crop shared from others 24,839 1.0%
Other area used 27,059 1.0%
Area used by others 50,883 2.0%
Source: Statistics Canada Census of Agriculture 2016 1 Total farm area is the difference between all land tenures and the “total area used by others ”
Number of Aquaculture Operations1
Species Group 2016 2017 2018 2019 20204 Year
Average2016-2019
2020 vs. 2019
% Change
2020 vs. 4 Yr. Avg.
% Change
Marine Invertebrates 460 467 476 481 486 471.0 1.0 3.2
Marine Fish 119 118 116 110 111 115.8 0.9 -4.1
Freshwater/Land-based Fish 111 107 113 113 114 111.0 0.9 2.7
Marine Algae 18 18 14 17 24 16.8 41.2 43.3
Total 708 710 719 721 735 714.5 1.9 2.9
Sources: Fisheries & Oceans Canada (invertebrates, fish) and BC Ministry of Agriculture, Food & Fisheries (algae)1 Includes both active and inactive operations
Number of Organic FarmsB.C. Farms Reporting Organic Products for Sale1 2006 2011 2016
Certified Organic Products 452 470 449
Transitional Organic Products 73 113 110
Uncertified Organic Products 2,767 na na
Total Farms Reporting Organic Products for Sale 3,232 569 550
Source: Statistics Canada Census of Agriculture, 2006, 2011 and 2016 1 The total number of farms reporting organic products for sale does not equal the sum of the farms reporting in each category because a farm could be counted in more
than one category na Not available Note: In Census 2006 producers were asked to identify commodities grown that were certified, in transition, or uncertified; and in Census 2011 and 2016, producers were asked to report only certified or in transition to be certified organic production

[ 10 ] FAST STATS 2020 / British Columbia’s Agriculture, Food and Seafood Sector / JANUARY 2022
Number of Agrifood and Seafood Establishments by Industry Number of Establishments By Employee Count
SectorTotal 2020
Number of Employees 1 to 4 5 to 9 10 to 19 20 to 49 50 to 99 Over 100
Primary Production
Crop Production 11,712 9,611 1,160 436 251 86 66 102
Animal Production1 10,106 8,734 907 286 125 20 17 17
Support for Agriculture 2,334 2,000 194 52 31 12 22 23
Fishing 4,230 3,981 186 37 13 4 3 6
Subtotal 28,382 24,326 2,447 811 420 122 108 148
Manufacturing
Food Manufacturing 2,407 1355 318 242 190 85 78 139
Beverage Manufacturing 770 256 151 116 109 54 43 41
Tobacco Manufacturing 2 2 0 0 0 0 0 0
Subtotal 3,179 1,613 469 358 299 139 121 180
Total 31,561 25,939 2,916 1,169 719 261 229 328
Source: BC Stats and Adapted from BC Stats, Special data file, August 2021 The data in this table comes from a file produced by BC Stats that is based on Statistics Canada’s Business Register of all active B C business locations, from all revenue classes This does not constitute an endorsement by Statistics Canada of this product 1 Includes aquaculture
[ 11 ] FAST STATS 2020 / British Columbia’s Agriculture, Food and Seafood Sector / JANUARY 2022
Number of Other Agrifood and Seafood Related Establishments by Industry Number of Establishments By Employee Count
SectorTotal 2020
Number of Employees 1 to 4 5 to 9 10 to 19 20 to 49 50 to 99 Over 100
Other Agrifoods Product ManufacturingLeather and Hide Tanning and Finishing 34 31 3 0 0 0 0 0Pesticides, Fertilizers and Other Agricultural Chemicals 67 32 12 7 10 0 1 5
Subtotal 101 63 15 7 10 0 1 5Wholesalers, Distributors
Farm Product 483 331 76 32 16 15 6 7Food 2,064 1,036 445 193 168 59 70 93Beverage 389 233 64 43 25 9 5 10Tobacco 44 23 7 5 0 2 2 5Agricultural Supplies 221 123 35 26 15 9 5 8
Subtotal 3,201 1,746 627 299 224 94 88 123Retail
Food Stores 4,464 1,630 849 666 604 143 104 468Beer, Wine and Liquor Stores 771 131 56 224 190 92 59 19Florists 599 380 148 50 16 5 0 0Restaurants and Food Services 635 209 50 57 111 78 107 23Drinking Places 16,650 5,684 2,153 2,581 2,810 1,561 1,017 844
Subtotal 23,119 8,034 3,256 3,578 3,731 1,879 1,287 1,354Total 57,982 35,782 6,814 5,053 4,684 2,234 1,605 1,810
Source: BC Stats, Compilation of special file from Statistics Canada’s Canadian Business Counts, December 2020 Includes all active B C locations (including establishments of all revenue classes) This does not constitute an endorsement by Statistics Canada of this product (Accessed August 31, 2021 )
B.C. Agricultural Land Management PracticesLand Usage Type Farms Reporting HectaresTotal number of Farms 17,528 2,590,210
Weed Control on Summer Fallow Land, Chemical Only 34 614
Weed Control on Summerfallow Land, Tillage Only 387 3,147
Weed Control on Summerfallow Land, Tillage and Chemical Combination 77 1,576
Use of Herbicides 4,074 176,575
Use of Insecticides 2,164 42,930
Use of Fungicides 2,032 32,155
Use of Commercial Fertilizer 5,535 277,088
Use of Lime 1,220 13,185
Soil Conservation – Rotational Grazing 4,791 na
Soil Conservation – Winter Cover Crops 1,606 na
Soil Conservation – Plowing Down Green Crops 1,451 na
Total Land Prepared for Seeding 6,676 252,573
Tillage Incorporating Most Crop Residue into Soil 3,542 90,393
Tillage Retaining Most Crop Residue on the Surface 1,417 69,110
No-Till or Zero-Till Seeding 2,237 93,070
Total Use of Irrigation 7,523 114,064
Source: Statistics Canada Census of Agriculture 2016 na not available in Census 2016 data
[ 12 ] FAST STATS 2020 / British Columbia’s Agriculture, Food and Seafood Sector / JANUARY 2022
Farms Using Computers and Other TechnologiesCategory 1991 1996 2001 2006 2011 2016Total Number of Farms in B.C. 19,225 21,835 20,290 19,844 19,759 17,528
Number of Farms Using Geospatial Technology1
Use of GPS technology na na na na na 1,097
Use of GIS mapping (e.g., soil mapping) na na na na na 335
Total na na na na na 1,432
Number of Farms Using Automation Technology1 na na na na na
Use of robotic milking – Farms reporting na na na na na 72
Use of automated environmental controls for animal housing na na na na na 588
Use of automated animal feeding na na na na na 650
Use of automated steering (auto-steer) – Farms reporting na na na na na 474
Use of greenhouse automation na na na na na 318
Use of other technologies na na na na na 146
Total na na na na na 2,248
Number of Farms Reporting Computers Used for Farm Management1
Use of smartphones/tablets for farm management na na na na na 6,014
Use of computers/laptops for farm management 2,745 5,144 8,146 9,096 11,208 8,835
Number of Farms Using Computers, by Gross Receipts Class
Under $10,000 940 2,073 3,238 3,609 4,600 2,879
$10,000 to $49,999 589 1,165 2,121 2,333 3,021 2,278
$50,000 to $99,999 239 397 654 843 977 837
$100,000 to $499,999 715 999 1,380 1,443 1,531 1,591
$500,000 and over 262 510 753 868 1,079 1,250
Total 2,745 5,144 8,146 9,096 11,208 8,835
Number of Farms Using Computers by Farm Type2
Dairy Cattle and Milk Production 350 406 497 451 451 431
Beef Cattle Ranching and Farming, Including Feedlots 539 830 1,647 1,726 1,370 1,095
Hog and Pig Farming 67 84 85 60 53 50
Poultry and Egg Production na na na na 705 677
Poultry 98 214 312 281 na na
Eggs 65 157 220 262 na na
Sheep and Goat Farming na na na na 360 270
Oilseed and Grain Farming 72 110 109 107 152 156
Fruit and Tree Nut Farming na na na na 1,917 1,667
Tree Fruits 270 582 708 783 na na
Berry and Grape (Includes Nuts) Farming 121 233 458 699 na na
Field Vegetables, Melon Farming and Potato Farming 93 222 267 370 546 592
Greenhouse, Mushroom, Nursery and Floriculture Production na na na na 1,256 867
Greenhouse Vegetable & Mushroom Farms 46 80 188 145 na na
Floriculture & Nursery Farms 286 484 796 886 na na
Other Animal and Crop Farming 626 1,462 2,251 2,675 na 1,361
Forages 112 280 608 651 na na
Other Animal Production na na na na 2,468 1,669
Other Crop Farming na na na na 1,930 na
Total 10,980 5,144 8,146 9,096 11,208 8,835
[ 13 ] FAST STATS 2020 / British Columbia’s Agriculture, Food and Seafood Sector / JANUARY 2022
Category 1991 1996 2001 2006 2011 2016Number of Farms Using Computers, by Region
Cariboo 166 350 664 791 927 700
Kootenay 132 295 515 619 732 564
Lower Mainland/Southwest 1,046 1,751 2,513 2,629 3,223 2,700
Nechako 102 171 377 401 492 369
North Coast 15 28 44 60 66 52
Peace River 182 341 590 660 798 604
Thompson/Okanagan 727 1,411 2,242 2,534 3,173 2,440
Vancouver Island/Coast 375 797 1,201 1402 1,797 1,406
Total 2,745 5,144 8,146 9,096 11,208 8,835
Source: Statistics Canada and Adapted from Statistics Canada Census of Agriculture 1991, 1996, 2001, 2006, 2011 and 2016 and data obtained through special request from Statistics Canada 1 The 2016 Census of Agriculture asked farmers to report their use of various other technologies used on farms, in addition to computers 2 Farm type is based on the North American Industry Classification System (NAICS) farm typing categories NAICS is revised periodically The 2001 farm type data were derived using
NAICS 1997, the 2006 farm type data were derived using NAICS 2002, the 2011 farm type data were derived using NAICS 2007, and the 2016 farm type data were derived using NAICS 2012
na Not available
Farms Using Computers and Other Technologies – continued
[ 14 ] FAST STATS 2020 / British Columbia’s Agriculture, Food and Seafood Sector / JANUARY 2022
Number of Farms Selling Directly to ConsumersB.C. Farms Reporting Direct Selling1 2016Selling Method Used
Farm gate sales, stands, kiosks, U-pick 5,047
Farmers’ markets 1,244
Community Supported Agriculture (CSA) 249
Other methods 243
Agricultural Products Sold
Unprocessed2 5,532
Value-added3 592
Total Farms Selling Directly to Consumers 5,667
Source: Statistics Canada and Adapted from Statistics Canada, Census of Agriculture 2016 1 As a single farm can employ multiple selling methods and can sell both unprocessed and value-added products, the total number of farms selling directly to consumers
is greater than the sum of each selling method or agricultural product type category 2 Unprocessed agricultural products include fruits, vegetables, meat cuts, poultry, eggs, maple syrup, honey, etc 3 Value-added agricultural products include jellies, sausages, wine, cheese, etc
[ 15 ] FAST STATS 2020 / British Columbia’s Agriculture, Food and Seafood Sector / JANUARY 2022
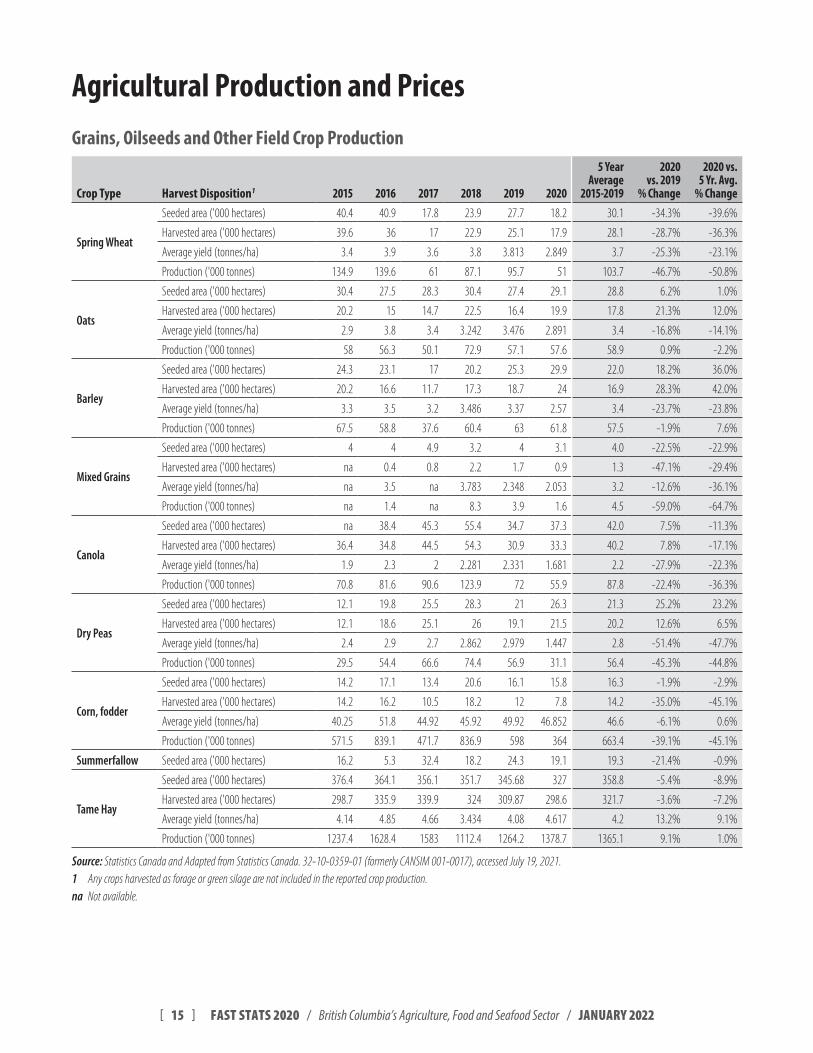
Agricultural Production and PricesGrains, Oilseeds and Other Field Crop Production
Crop Type Harvest Disposition1 2015 2016 2017 2018 2019 2020
5 Year Average
2015-2019
2020 vs. 2019
% Change
2020 vs. 5 Yr. Avg.
% Change
Spring Wheat
Seeded area ('000 hectares) 40.4 40.9 17.8 23.9 27.7 18.2 30.1 -34.3% -39.6%
Harvested area ('000 hectares) 39.6 36 17 22.9 25.1 17.9 28.1 -28.7% -36.3%
Average yield (tonnes/ha) 3.4 3.9 3.6 3.8 3.813 2.849 3.7 -25.3% -23.1%
Production ('000 tonnes) 134.9 139.6 61 87.1 95.7 51 103.7 -46.7% -50.8%
Oats
Seeded area ('000 hectares) 30.4 27.5 28.3 30.4 27.4 29.1 28.8 6.2% 1.0%
Harvested area ('000 hectares) 20.2 15 14.7 22.5 16.4 19.9 17.8 21.3% 12.0%
Average yield (tonnes/ha) 2.9 3.8 3.4 3.242 3.476 2.891 3.4 -16.8% -14.1%
Production ('000 tonnes) 58 56.3 50.1 72.9 57.1 57.6 58.9 0.9% -2.2%
Barley
Seeded area ('000 hectares) 24.3 23.1 17 20.2 25.3 29.9 22.0 18.2% 36.0%
Harvested area ('000 hectares) 20.2 16.6 11.7 17.3 18.7 24 16.9 28.3% 42.0%
Average yield (tonnes/ha) 3.3 3.5 3.2 3.486 3.37 2.57 3.4 -23.7% -23.8%
Production ('000 tonnes) 67.5 58.8 37.6 60.4 63 61.8 57.5 -1.9% 7.6%
Mixed Grains
Seeded area ('000 hectares) 4 4 4.9 3.2 4 3.1 4.0 -22.5% -22.9%
Harvested area ('000 hectares) na 0.4 0.8 2.2 1.7 0.9 1.3 -47.1% -29.4%
Average yield (tonnes/ha) na 3.5 na 3.783 2.348 2.053 3.2 -12.6% -36.1%
Production ('000 tonnes) na 1.4 na 8.3 3.9 1.6 4.5 -59.0% -64.7%
Canola
Seeded area ('000 hectares) na 38.4 45.3 55.4 34.7 37.3 42.0 7.5% -11.3%
Harvested area ('000 hectares) 36.4 34.8 44.5 54.3 30.9 33.3 40.2 7.8% -17.1%
Average yield (tonnes/ha) 1.9 2.3 2 2.281 2.331 1.681 2.2 -27.9% -22.3%
Production ('000 tonnes) 70.8 81.6 90.6 123.9 72 55.9 87.8 -22.4% -36.3%
Dry Peas
Seeded area ('000 hectares) 12.1 19.8 25.5 28.3 21 26.3 21.3 25.2% 23.2%
Harvested area ('000 hectares) 12.1 18.6 25.1 26 19.1 21.5 20.2 12.6% 6.5%
Average yield (tonnes/ha) 2.4 2.9 2.7 2.862 2.979 1.447 2.8 -51.4% -47.7%
Production ('000 tonnes) 29.5 54.4 66.6 74.4 56.9 31.1 56.4 -45.3% -44.8%
Corn, fodder
Seeded area ('000 hectares) 14.2 17.1 13.4 20.6 16.1 15.8 16.3 -1.9% -2.9%
Harvested area ('000 hectares) 14.2 16.2 10.5 18.2 12 7.8 14.2 -35.0% -45.1%
Average yield (tonnes/ha) 40.25 51.8 44.92 45.92 49.92 46.852 46.6 -6.1% 0.6%
Production ('000 tonnes) 571.5 839.1 471.7 836.9 598 364 663.4 -39.1% -45.1%
Summerfallow Seeded area ('000 hectares) 16.2 5.3 32.4 18.2 24.3 19.1 19.3 -21.4% -0.9%
Tame Hay
Seeded area ('000 hectares) 376.4 364.1 356.1 351.7 345.68 327 358.8 -5.4% -8.9%
Harvested area ('000 hectares) 298.7 335.9 339.9 324 309.87 298.6 321.7 -3.6% -7.2%
Average yield (tonnes/ha) 4.14 4.85 4.66 3.434 4.08 4.617 4.2 13.2% 9.1%
Production ('000 tonnes) 1237.4 1628.4 1583 1112.4 1264.2 1378.7 1365.1 9.1% 1.0%
Source: Statistics Canada and Adapted from Statistics Canada 32-10-0359-01 (formerly CANSIM 001-0017), accessed July 19, 2021 1 Any crops harvested as forage or green silage are not included in the reported crop production na Not available
[ 16 ] FAST STATS 2020 / British Columbia’s Agriculture, Food and Seafood Sector / JANUARY 2022
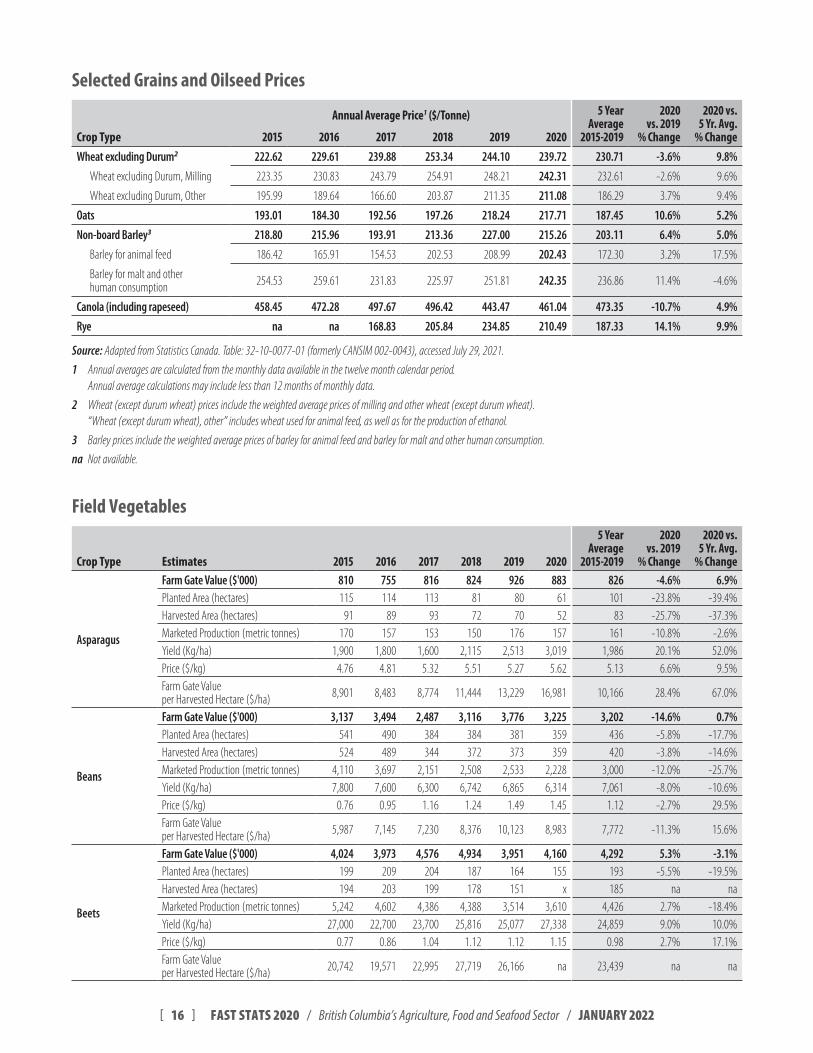
Selected Grains and Oilseed Prices
Annual Average Price1 ($/Tonne) 5 Year Average
2015-2019
2020 vs. 2019
% Change
2020 vs. 5 Yr. Avg.
% ChangeCrop Type 2015 2016 2017 2018 2019 2020Wheat excluding Durum2 222.62 229.61 239.88 253.34 244.10 239.72 230.71 -3.6% 9.8%
Wheat excluding Durum, Milling 223.35 230.83 243.79 254.91 248.21 242.31 232.61 -2.6% 9.6%
Wheat excluding Durum, Other 195.99 189.64 166.60 203.87 211.35 211.08 186.29 3.7% 9.4%
Oats 193.01 184.30 192.56 197.26 218.24 217.71 187.45 10.6% 5.2%
Non-board Barley3 218.80 215.96 193.91 213.36 227.00 215.26 203.11 6.4% 5.0%
Barley for animal feed 186.42 165.91 154.53 202.53 208.99 202.43 172.30 3.2% 17.5%
Barley for malt and other human consumption 254.53 259.61 231.83 225.97 251.81 242.35 236.86 11.4% -4.6%
Canola (including rapeseed) 458.45 472.28 497.67 496.42 443.47 461.04 473.35 -10.7% 4.9%
Rye na na 168.83 205.84 234.85 210.49 187.33 14.1% 9.9%
Source: Adapted from Statistics Canada Table: 32-10-0077-01 (formerly CANSIM 002-0043), accessed July 29, 2021
1 Annual averages are calculated from the monthly data available in the twelve month calendar period Annual average calculations may include less than 12 months of monthly data
2 Wheat (except durum wheat) prices include the weighted average prices of milling and other wheat (except durum wheat) “Wheat (except durum wheat), other” includes wheat used for animal feed, as well as for the production of ethanol
3 Barley prices include the weighted average prices of barley for animal feed and barley for malt and other human consumption
na Not available
Field Vegetables
Crop Type Estimates 2015 2016 2017 2018 2019 2020
5 Year Average
2015-2019
2020 vs. 2019
% Change
2020 vs. 5 Yr. Avg.
% Change
Asparagus
Farm Gate Value ($'000) 810 755 816 824 926 883 826 -4.6% 6.9%Planted Area (hectares) 115 114 113 81 80 61 101 -23.8% -39.4%Harvested Area (hectares) 91 89 93 72 70 52 83 -25.7% -37.3%Marketed Production (metric tonnes) 170 157 153 150 176 157 161 -10.8% -2.6%Yield (Kg/ha) 1,900 1,800 1,600 2,115 2,513 3,019 1,986 20.1% 52.0%Price ($/kg) 4.76 4.81 5.32 5.51 5.27 5.62 5.13 6.6% 9.5%Farm Gate Value per Harvested Hectare ($/ha) 8,901 8,483 8,774 11,444 13,229 16,981 10,166 28.4% 67.0%
Beans
Farm Gate Value ($'000) 3,137 3,494 2,487 3,116 3,776 3,225 3,202 -14.6% 0.7%Planted Area (hectares) 541 490 384 384 381 359 436 -5.8% -17.7%Harvested Area (hectares) 524 489 344 372 373 359 420 -3.8% -14.6%Marketed Production (metric tonnes) 4,110 3,697 2,151 2,508 2,533 2,228 3,000 -12.0% -25.7%Yield (Kg/ha) 7,800 7,600 6,300 6,742 6,865 6,314 7,061 -8.0% -10.6%Price ($/kg) 0.76 0.95 1.16 1.24 1.49 1.45 1.12 -2.7% 29.5%Farm Gate Value per Harvested Hectare ($/ha) 5,987 7,145 7,230 8,376 10,123 8,983 7,772 -11.3% 15.6%
Beets
Farm Gate Value ($'000) 4,024 3,973 4,576 4,934 3,951 4,160 4,292 5.3% -3.1%Planted Area (hectares) 199 209 204 187 164 155 193 -5.5% -19.5%Harvested Area (hectares) 194 203 199 178 151 x 185 na naMarketed Production (metric tonnes) 5,242 4,602 4,386 4,388 3,514 3,610 4,426 2.7% -18.4%Yield (Kg/ha) 27,000 22,700 23,700 25,816 25,077 27,338 24,859 9.0% 10.0%Price ($/kg) 0.77 0.86 1.04 1.12 1.12 1.15 0.98 2.7% 17.1%Farm Gate Value per Harvested Hectare ($/ha) 20,742 19,571 22,995 27,719 26,166 na 23,439 na na
[ 17 ] FAST STATS 2020 / British Columbia’s Agriculture, Food and Seafood Sector / JANUARY 2022
Crop Type Estimates 2015 2016 2017 2018 2019 2020
5 Year Average
2015-2019
2020 vs. 2019
% Change
2020 vs. 5 Yr. Avg.
% Change
Broccoli
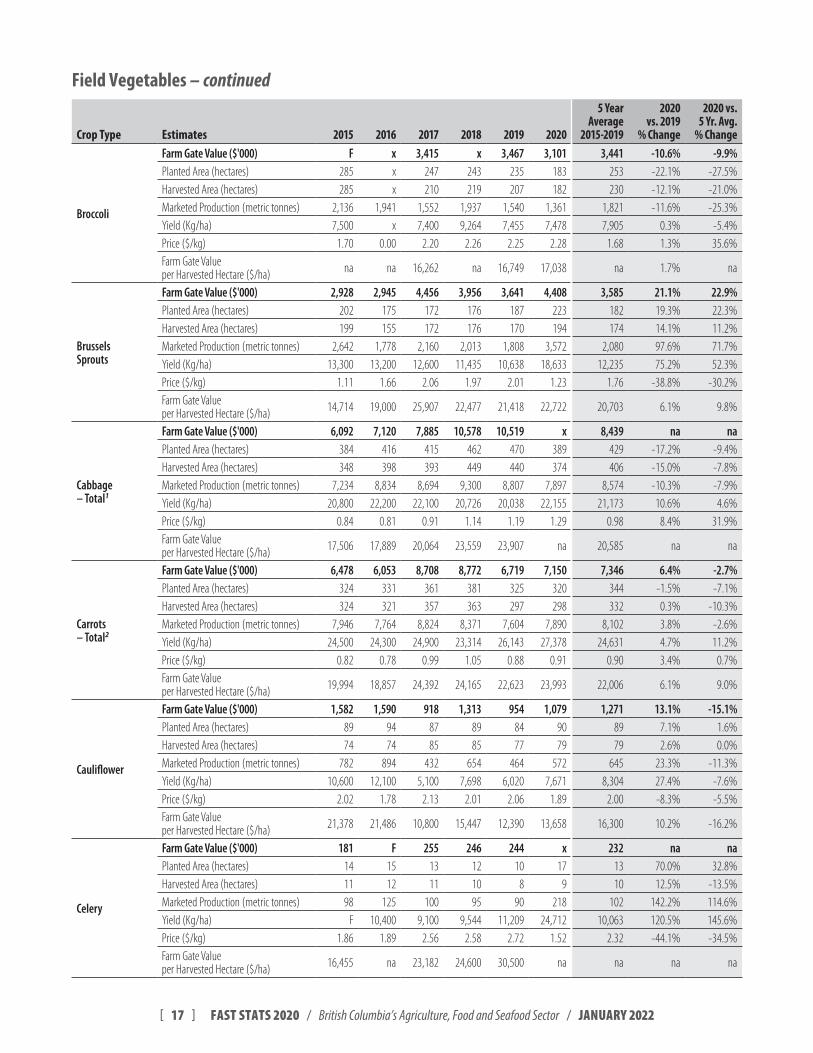
Farm Gate Value ($'000) F x 3,415 x 3,467 3,101 3,441 -10.6% -9.9%Planted Area (hectares) 285 x 247 243 235 183 253 -22.1% -27.5%Harvested Area (hectares) 285 x 210 219 207 182 230 -12.1% -21.0%Marketed Production (metric tonnes) 2,136 1,941 1,552 1,937 1,540 1,361 1,821 -11.6% -25.3%Yield (Kg/ha) 7,500 x 7,400 9,264 7,455 7,478 7,905 0.3% -5.4%Price ($/kg) 1.70 0.00 2.20 2.26 2.25 2.28 1.68 1.3% 35.6%Farm Gate Value per Harvested Hectare ($/ha) na na 16,262 na 16,749 17,038 na 1.7% na
Brussels Sprouts
Farm Gate Value ($'000) 2,928 2,945 4,456 3,956 3,641 4,408 3,585 21.1% 22.9%Planted Area (hectares) 202 175 172 176 187 223 182 19.3% 22.3%Harvested Area (hectares) 199 155 172 176 170 194 174 14.1% 11.2%Marketed Production (metric tonnes) 2,642 1,778 2,160 2,013 1,808 3,572 2,080 97.6% 71.7%Yield (Kg/ha) 13,300 13,200 12,600 11,435 10,638 18,633 12,235 75.2% 52.3%Price ($/kg) 1.11 1.66 2.06 1.97 2.01 1.23 1.76 -38.8% -30.2%Farm Gate Value per Harvested Hectare ($/ha) 14,714 19,000 25,907 22,477 21,418 22,722 20,703 6.1% 9.8%
Cabbage – Total1
Farm Gate Value ($'000) 6,092 7,120 7,885 10,578 10,519 x 8,439 na naPlanted Area (hectares) 384 416 415 462 470 389 429 -17.2% -9.4%Harvested Area (hectares) 348 398 393 449 440 374 406 -15.0% -7.8%Marketed Production (metric tonnes) 7,234 8,834 8,694 9,300 8,807 7,897 8,574 -10.3% -7.9%Yield (Kg/ha) 20,800 22,200 22,100 20,726 20,038 22,155 21,173 10.6% 4.6%Price ($/kg) 0.84 0.81 0.91 1.14 1.19 1.29 0.98 8.4% 31.9%Farm Gate Value per Harvested Hectare ($/ha) 17,506 17,889 20,064 23,559 23,907 na 20,585 na na
Carrots – Total2
Farm Gate Value ($'000) 6,478 6,053 8,708 8,772 6,719 7,150 7,346 6.4% -2.7%Planted Area (hectares) 324 331 361 381 325 320 344 -1.5% -7.1%Harvested Area (hectares) 324 321 357 363 297 298 332 0.3% -10.3%Marketed Production (metric tonnes) 7,946 7,764 8,824 8,371 7,604 7,890 8,102 3.8% -2.6%Yield (Kg/ha) 24,500 24,300 24,900 23,314 26,143 27,378 24,631 4.7% 11.2%Price ($/kg) 0.82 0.78 0.99 1.05 0.88 0.91 0.90 3.4% 0.7%Farm Gate Value per Harvested Hectare ($/ha) 19,994 18,857 24,392 24,165 22,623 23,993 22,006 6.1% 9.0%
Cauliflower
Farm Gate Value ($'000) 1,582 1,590 918 1,313 954 1,079 1,271 13.1% -15.1%Planted Area (hectares) 89 94 87 89 84 90 89 7.1% 1.6%Harvested Area (hectares) 74 74 85 85 77 79 79 2.6% 0.0%Marketed Production (metric tonnes) 782 894 432 654 464 572 645 23.3% -11.3%Yield (Kg/ha) 10,600 12,100 5,100 7,698 6,020 7,671 8,304 27.4% -7.6%Price ($/kg) 2.02 1.78 2.13 2.01 2.06 1.89 2.00 -8.3% -5.5%Farm Gate Value per Harvested Hectare ($/ha) 21,378 21,486 10,800 15,447 12,390 13,658 16,300 10.2% -16.2%
Celery
Farm Gate Value ($'000) 181 F 255 246 244 x 232 na naPlanted Area (hectares) 14 15 13 12 10 17 13 70.0% 32.8%Harvested Area (hectares) 11 12 11 10 8 9 10 12.5% -13.5%Marketed Production (metric tonnes) 98 125 100 95 90 218 102 142.2% 114.6%Yield (Kg/ha) F 10,400 9,100 9,544 11,209 24,712 10,063 120.5% 145.6%Price ($/kg) 1.86 1.89 2.56 2.58 2.72 1.52 2.32 -44.1% -34.5%Farm Gate Value per Harvested Hectare ($/ha) 16,455 na 23,182 24,600 30,500 na na na na
Field Vegetables – continued
[ 18 ] FAST STATS 2020 / British Columbia’s Agriculture, Food and Seafood Sector / JANUARY 2022
Crop Type Estimates 2015 2016 2017 2018 2019 2020
5 Year Average
2015-2019
2020 vs. 2019
% Change
2020 vs. 5 Yr. Avg.
% Change
Corn, Sweet
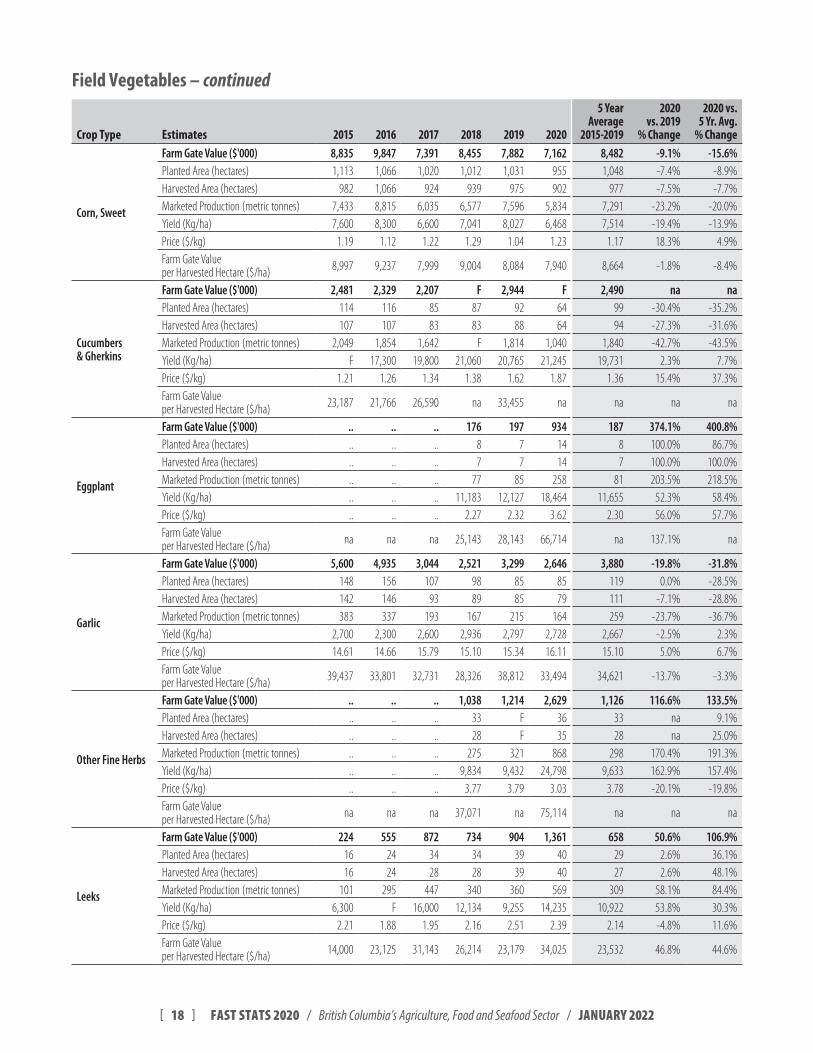
Farm Gate Value ($'000) 8,835 9,847 7,391 8,455 7,882 7,162 8,482 -9.1% -15.6%Planted Area (hectares) 1,113 1,066 1,020 1,012 1,031 955 1,048 -7.4% -8.9%Harvested Area (hectares) 982 1,066 924 939 975 902 977 -7.5% -7.7%Marketed Production (metric tonnes) 7,433 8,815 6,035 6,577 7,596 5,834 7,291 -23.2% -20.0%Yield (Kg/ha) 7,600 8,300 6,600 7,041 8,027 6,468 7,514 -19.4% -13.9%Price ($/kg) 1.19 1.12 1.22 1.29 1.04 1.23 1.17 18.3% 4.9%Farm Gate Value per Harvested Hectare ($/ha) 8,997 9,237 7,999 9,004 8,084 7,940 8,664 -1.8% -8.4%
Cucumbers & Gherkins
Farm Gate Value ($'000) 2,481 2,329 2,207 F 2,944 F 2,490 na naPlanted Area (hectares) 114 116 85 87 92 64 99 -30.4% -35.2%Harvested Area (hectares) 107 107 83 83 88 64 94 -27.3% -31.6%Marketed Production (metric tonnes) 2,049 1,854 1,642 F 1,814 1,040 1,840 -42.7% -43.5%Yield (Kg/ha) F 17,300 19,800 21,060 20,765 21,245 19,731 2.3% 7.7%Price ($/kg) 1.21 1.26 1.34 1.38 1.62 1.87 1.36 15.4% 37.3%Farm Gate Value per Harvested Hectare ($/ha) 23,187 21,766 26,590 na 33,455 na na na na
Eggplant
Farm Gate Value ($'000) .. .. .. 176 197 934 187 374.1% 400.8%Planted Area (hectares) .. .. .. 8 7 14 8 100.0% 86.7%Harvested Area (hectares) .. .. .. 7 7 14 7 100.0% 100.0%Marketed Production (metric tonnes) .. .. .. 77 85 258 81 203.5% 218.5%Yield (Kg/ha) .. .. .. 11,183 12,127 18,464 11,655 52.3% 58.4%Price ($/kg) .. .. .. 2.27 2.32 3.62 2.30 56.0% 57.7%Farm Gate Value per Harvested Hectare ($/ha) na na na 25,143 28,143 66,714 na 137.1% na
Garlic
Farm Gate Value ($'000) 5,600 4,935 3,044 2,521 3,299 2,646 3,880 -19.8% -31.8%Planted Area (hectares) 148 156 107 98 85 85 119 0.0% -28.5%Harvested Area (hectares) 142 146 93 89 85 79 111 -7.1% -28.8%Marketed Production (metric tonnes) 383 337 193 167 215 164 259 -23.7% -36.7%Yield (Kg/ha) 2,700 2,300 2,600 2,936 2,797 2,728 2,667 -2.5% 2.3%Price ($/kg) 14.61 14.66 15.79 15.10 15.34 16.11 15.10 5.0% 6.7%Farm Gate Value per Harvested Hectare ($/ha) 39,437 33,801 32,731 28,326 38,812 33,494 34,621 -13.7% -3.3%
Other Fine Herbs
Farm Gate Value ($'000) .. .. .. 1,038 1,214 2,629 1,126 116.6% 133.5%Planted Area (hectares) .. .. .. 33 F 36 33 na 9.1%Harvested Area (hectares) .. .. .. 28 F 35 28 na 25.0%Marketed Production (metric tonnes) .. .. .. 275 321 868 298 170.4% 191.3%Yield (Kg/ha) .. .. .. 9,834 9,432 24,798 9,633 162.9% 157.4%Price ($/kg) .. .. .. 3.77 3.79 3.03 3.78 -20.1% -19.8%Farm Gate Value per Harvested Hectare ($/ha) na na na 37,071 na 75,114 na na na
Leeks
Farm Gate Value ($'000) 224 555 872 734 904 1,361 658 50.6% 106.9%Planted Area (hectares) 16 24 34 34 39 40 29 2.6% 36.1%Harvested Area (hectares) 16 24 28 28 39 40 27 2.6% 48.1%Marketed Production (metric tonnes) 101 295 447 340 360 569 309 58.1% 84.4%Yield (Kg/ha) 6,300 F 16,000 12,134 9,255 14,235 10,922 53.8% 30.3%Price ($/kg) 2.21 1.88 1.95 2.16 2.51 2.39 2.14 -4.8% 11.6%Farm Gate Value per Harvested Hectare ($/ha) 14,000 23,125 31,143 26,214 23,179 34,025 23,532 46.8% 44.6%
Field Vegetables – continued
[ 19 ] FAST STATS 2020 / British Columbia’s Agriculture, Food and Seafood Sector / JANUARY 2022
Crop Type Estimates 2015 2016 2017 2018 2019 2020
5 Year Average
2015-2019
2020 vs. 2019
% Change
2020 vs. 5 Yr. Avg.
% Change
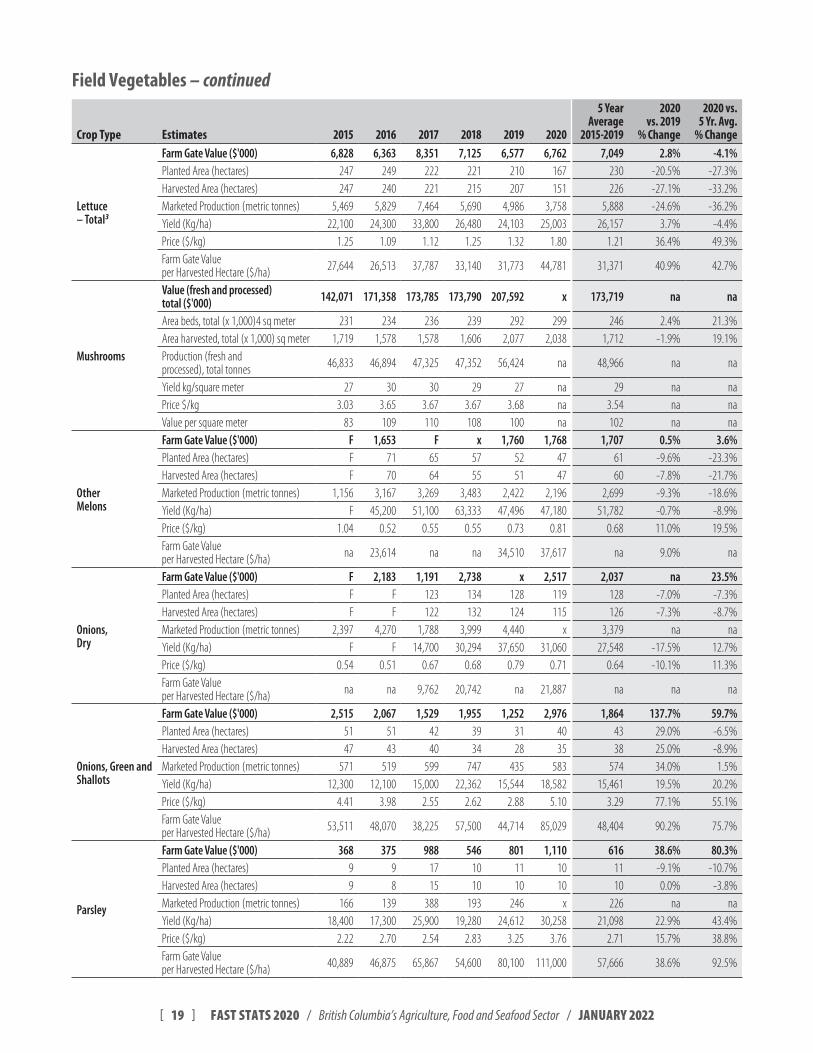
Lettuce – Total3
Farm Gate Value ($'000) 6,828 6,363 8,351 7,125 6,577 6,762 7,049 2.8% -4.1%Planted Area (hectares) 247 249 222 221 210 167 230 -20.5% -27.3%Harvested Area (hectares) 247 240 221 215 207 151 226 -27.1% -33.2%Marketed Production (metric tonnes) 5,469 5,829 7,464 5,690 4,986 3,758 5,888 -24.6% -36.2%Yield (Kg/ha) 22,100 24,300 33,800 26,480 24,103 25,003 26,157 3.7% -4.4%Price ($/kg) 1.25 1.09 1.12 1.25 1.32 1.80 1.21 36.4% 49.3%Farm Gate Value per Harvested Hectare ($/ha) 27,644 26,513 37,787 33,140 31,773 44,781 31,371 40.9% 42.7%
Mushrooms
Value (fresh and processed) total ($'000) 142,071 171,358 173,785 173,790 207,592 x 173,719 na na
Area beds, total (x 1,000)4 sq meter 231 234 236 239 292 299 246 2.4% 21.3%Area harvested, total (x 1,000) sq meter 1,719 1,578 1,578 1,606 2,077 2,038 1,712 -1.9% 19.1%Production (fresh and processed), total tonnes 46,833 46,894 47,325 47,352 56,424 na 48,966 na na
Yield kg/square meter 27 30 30 29 27 na 29 na naPrice $/kg 3.03 3.65 3.67 3.67 3.68 na 3.54 na naValue per square meter 83 109 110 108 100 na 102 na na
Other Melons
Farm Gate Value ($'000) F 1,653 F x 1,760 1,768 1,707 0.5% 3.6%Planted Area (hectares) F 71 65 57 52 47 61 -9.6% -23.3%Harvested Area (hectares) F 70 64 55 51 47 60 -7.8% -21.7%Marketed Production (metric tonnes) 1,156 3,167 3,269 3,483 2,422 2,196 2,699 -9.3% -18.6%Yield (Kg/ha) F 45,200 51,100 63,333 47,496 47,180 51,782 -0.7% -8.9%Price ($/kg) 1.04 0.52 0.55 0.55 0.73 0.81 0.68 11.0% 19.5%Farm Gate Value per Harvested Hectare ($/ha) na 23,614 na na 34,510 37,617 na 9.0% na
Onions, Dry
Farm Gate Value ($'000) F 2,183 1,191 2,738 x 2,517 2,037 na 23.5%Planted Area (hectares) F F 123 134 128 119 128 -7.0% -7.3%Harvested Area (hectares) F F 122 132 124 115 126 -7.3% -8.7%Marketed Production (metric tonnes) 2,397 4,270 1,788 3,999 4,440 x 3,379 na naYield (Kg/ha) F F 14,700 30,294 37,650 31,060 27,548 -17.5% 12.7%Price ($/kg) 0.54 0.51 0.67 0.68 0.79 0.71 0.64 -10.1% 11.3%Farm Gate Value per Harvested Hectare ($/ha) na na 9,762 20,742 na 21,887 na na na
Onions, Green and Shallots
Farm Gate Value ($'000) 2,515 2,067 1,529 1,955 1,252 2,976 1,864 137.7% 59.7%Planted Area (hectares) 51 51 42 39 31 40 43 29.0% -6.5%Harvested Area (hectares) 47 43 40 34 28 35 38 25.0% -8.9%Marketed Production (metric tonnes) 571 519 599 747 435 583 574 34.0% 1.5%Yield (Kg/ha) 12,300 12,100 15,000 22,362 15,544 18,582 15,461 19.5% 20.2%Price ($/kg) 4.41 3.98 2.55 2.62 2.88 5.10 3.29 77.1% 55.1%Farm Gate Value per Harvested Hectare ($/ha) 53,511 48,070 38,225 57,500 44,714 85,029 48,404 90.2% 75.7%
Parsley
Farm Gate Value ($'000) 368 375 988 546 801 1,110 616 38.6% 80.3%Planted Area (hectares) 9 9 17 10 11 10 11 -9.1% -10.7%Harvested Area (hectares) 9 8 15 10 10 10 10 0.0% -3.8%Marketed Production (metric tonnes) 166 139 388 193 246 x 226 na naYield (Kg/ha) 18,400 17,300 25,900 19,280 24,612 30,258 21,098 22.9% 43.4%Price ($/kg) 2.22 2.70 2.54 2.83 3.25 3.76 2.71 15.7% 38.8%Farm Gate Value per Harvested Hectare ($/ha) 40,889 46,875 65,867 54,600 80,100 111,000 57,666 38.6% 92.5%
Field Vegetables – continued
[ 20 ] FAST STATS 2020 / British Columbia’s Agriculture, Food and Seafood Sector / JANUARY 2022
Crop Type Estimates 2015 2016 2017 2018 2019 2020
5 Year Average
2015-2019
2020 vs. 2019
% Change
2020 vs. 5 Yr. Avg.
% Change
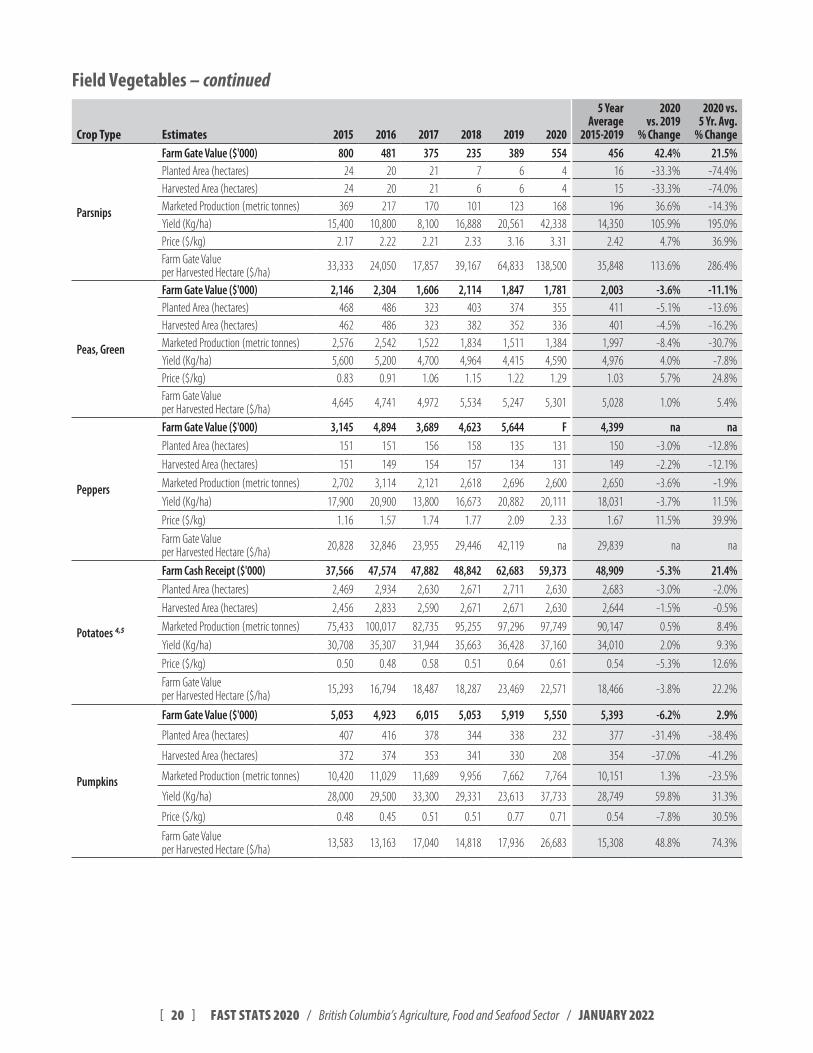
Parsnips
Farm Gate Value ($'000) 800 481 375 235 389 554 456 42.4% 21.5%Planted Area (hectares) 24 20 21 7 6 4 16 -33.3% -74.4%Harvested Area (hectares) 24 20 21 6 6 4 15 -33.3% -74.0%Marketed Production (metric tonnes) 369 217 170 101 123 168 196 36.6% -14.3%Yield (Kg/ha) 15,400 10,800 8,100 16,888 20,561 42,338 14,350 105.9% 195.0%Price ($/kg) 2.17 2.22 2.21 2.33 3.16 3.31 2.42 4.7% 36.9%Farm Gate Value per Harvested Hectare ($/ha) 33,333 24,050 17,857 39,167 64,833 138,500 35,848 113.6% 286.4%
Peas, Green
Farm Gate Value ($'000) 2,146 2,304 1,606 2,114 1,847 1,781 2,003 -3.6% -11.1%Planted Area (hectares) 468 486 323 403 374 355 411 -5.1% -13.6%Harvested Area (hectares) 462 486 323 382 352 336 401 -4.5% -16.2%Marketed Production (metric tonnes) 2,576 2,542 1,522 1,834 1,511 1,384 1,997 -8.4% -30.7%Yield (Kg/ha) 5,600 5,200 4,700 4,964 4,415 4,590 4,976 4.0% -7.8%Price ($/kg) 0.83 0.91 1.06 1.15 1.22 1.29 1.03 5.7% 24.8%Farm Gate Value per Harvested Hectare ($/ha) 4,645 4,741 4,972 5,534 5,247 5,301 5,028 1.0% 5.4%
Peppers
Farm Gate Value ($'000) 3,145 4,894 3,689 4,623 5,644 F 4,399 na naPlanted Area (hectares) 151 151 156 158 135 131 150 -3.0% -12.8%
Harvested Area (hectares) 151 149 154 157 134 131 149 -2.2% -12.1%
Marketed Production (metric tonnes) 2,702 3,114 2,121 2,618 2,696 2,600 2,650 -3.6% -1.9%
Yield (Kg/ha) 17,900 20,900 13,800 16,673 20,882 20,111 18,031 -3.7% 11.5%
Price ($/kg) 1.16 1.57 1.74 1.77 2.09 2.33 1.67 11.5% 39.9%
Farm Gate Value per Harvested Hectare ($/ha) 20,828 32,846 23,955 29,446 42,119 na 29,839 na na
Potatoes 4,5
Farm Cash Receipt ($'000) 37,566 47,574 47,882 48,842 62,683 59,373 48,909 -5.3% 21.4%Planted Area (hectares) 2,469 2,934 2,630 2,671 2,711 2,630 2,683 -3.0% -2.0%
Harvested Area (hectares) 2,456 2,833 2,590 2,671 2,671 2,630 2,644 -1.5% -0.5%
Marketed Production (metric tonnes) 75,433 100,017 82,735 95,255 97,296 97,749 90,147 0.5% 8.4%
Yield (Kg/ha) 30,708 35,307 31,944 35,663 36,428 37,160 34,010 2.0% 9.3%
Price ($/kg) 0.50 0.48 0.58 0.51 0.64 0.61 0.54 -5.3% 12.6%
Farm Gate Value per Harvested Hectare ($/ha) 15,293 16,794 18,487 18,287 23,469 22,571 18,466 -3.8% 22.2%
Pumpkins
Farm Gate Value ($'000) 5,053 4,923 6,015 5,053 5,919 5,550 5,393 -6.2% 2.9%
Planted Area (hectares) 407 416 378 344 338 232 377 -31.4% -38.4%
Harvested Area (hectares) 372 374 353 341 330 208 354 -37.0% -41.2%
Marketed Production (metric tonnes) 10,420 11,029 11,689 9,956 7,662 7,764 10,151 1.3% -23.5%
Yield (Kg/ha) 28,000 29,500 33,300 29,331 23,613 37,733 28,749 59.8% 31.3%
Price ($/kg) 0.48 0.45 0.51 0.51 0.77 0.71 0.54 -7.8% 30.5%
Farm Gate Value per Harvested Hectare ($/ha) 13,583 13,163 17,040 14,818 17,936 26,683 15,308 48.8% 74.3%
Field Vegetables – continued
[ 21 ] FAST STATS 2020 / British Columbia’s Agriculture, Food and Seafood Sector / JANUARY 2022
Crop Type Estimates 2015 2016 2017 2018 2019 2020
5 Year Average
2015-2019
2020 vs. 2019
% Change
2020 vs. 5 Yr. Avg.
% Change
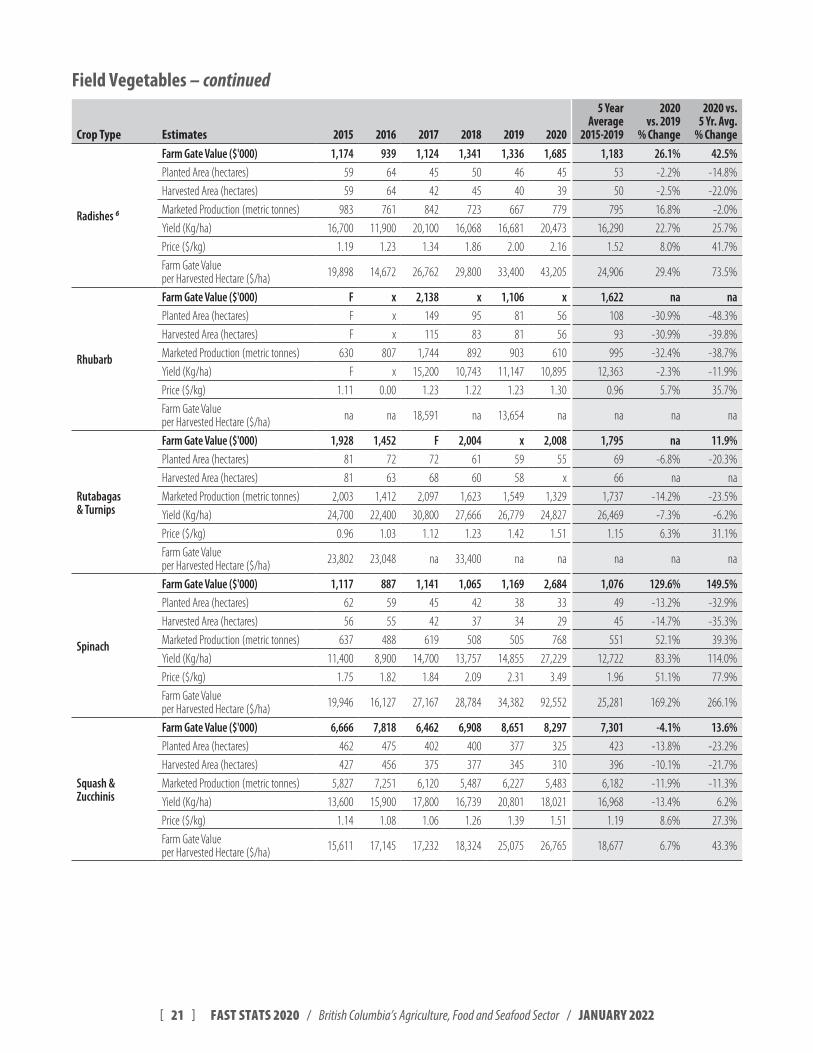
Radishes 6
Farm Gate Value ($'000) 1,174 939 1,124 1,341 1,336 1,685 1,183 26.1% 42.5%Planted Area (hectares) 59 64 45 50 46 45 53 -2.2% -14.8%
Harvested Area (hectares) 59 64 42 45 40 39 50 -2.5% -22.0%
Marketed Production (metric tonnes) 983 761 842 723 667 779 795 16.8% -2.0%
Yield (Kg/ha) 16,700 11,900 20,100 16,068 16,681 20,473 16,290 22.7% 25.7%
Price ($/kg) 1.19 1.23 1.34 1.86 2.00 2.16 1.52 8.0% 41.7%
Farm Gate Value per Harvested Hectare ($/ha) 19,898 14,672 26,762 29,800 33,400 43,205 24,906 29.4% 73.5%
Rhubarb
Farm Gate Value ($'000) F x 2,138 x 1,106 x 1,622 na naPlanted Area (hectares) F x 149 95 81 56 108 -30.9% -48.3%
Harvested Area (hectares) F x 115 83 81 56 93 -30.9% -39.8%
Marketed Production (metric tonnes) 630 807 1,744 892 903 610 995 -32.4% -38.7%
Yield (Kg/ha) F x 15,200 10,743 11,147 10,895 12,363 -2.3% -11.9%
Price ($/kg) 1.11 0.00 1.23 1.22 1.23 1.30 0.96 5.7% 35.7%
Farm Gate Value per Harvested Hectare ($/ha) na na 18,591 na 13,654 na na na na
Rutabagas & Turnips
Farm Gate Value ($'000) 1,928 1,452 F 2,004 x 2,008 1,795 na 11.9%Planted Area (hectares) 81 72 72 61 59 55 69 -6.8% -20.3%
Harvested Area (hectares) 81 63 68 60 58 x 66 na na
Marketed Production (metric tonnes) 2,003 1,412 2,097 1,623 1,549 1,329 1,737 -14.2% -23.5%
Yield (Kg/ha) 24,700 22,400 30,800 27,666 26,779 24,827 26,469 -7.3% -6.2%
Price ($/kg) 0.96 1.03 1.12 1.23 1.42 1.51 1.15 6.3% 31.1%
Farm Gate Value per Harvested Hectare ($/ha) 23,802 23,048 na 33,400 na na na na na
Spinach
Farm Gate Value ($'000) 1,117 887 1,141 1,065 1,169 2,684 1,076 129.6% 149.5%Planted Area (hectares) 62 59 45 42 38 33 49 -13.2% -32.9%
Harvested Area (hectares) 56 55 42 37 34 29 45 -14.7% -35.3%
Marketed Production (metric tonnes) 637 488 619 508 505 768 551 52.1% 39.3%
Yield (Kg/ha) 11,400 8,900 14,700 13,757 14,855 27,229 12,722 83.3% 114.0%
Price ($/kg) 1.75 1.82 1.84 2.09 2.31 3.49 1.96 51.1% 77.9%
Farm Gate Value per Harvested Hectare ($/ha) 19,946 16,127 27,167 28,784 34,382 92,552 25,281 169.2% 266.1%
Squash & Zucchinis
Farm Gate Value ($'000) 6,666 7,818 6,462 6,908 8,651 8,297 7,301 -4.1% 13.6%Planted Area (hectares) 462 475 402 400 377 325 423 -13.8% -23.2%
Harvested Area (hectares) 427 456 375 377 345 310 396 -10.1% -21.7%
Marketed Production (metric tonnes) 5,827 7,251 6,120 5,487 6,227 5,483 6,182 -11.9% -11.3%
Yield (Kg/ha) 13,600 15,900 17,800 16,739 20,801 18,021 16,968 -13.4% 6.2%
Price ($/kg) 1.14 1.08 1.06 1.26 1.39 1.51 1.19 8.6% 27.3%
Farm Gate Value per Harvested Hectare ($/ha) 15,611 17,145 17,232 18,324 25,075 26,765 18,677 6.7% 43.3%
Field Vegetables – continued
[ 22 ] FAST STATS 2020 / British Columbia’s Agriculture, Food and Seafood Sector / JANUARY 2022
Crop Type Estimates 2015 2016 2017 2018 2019 2020
5 Year Average
2015-2019
2020 vs. 2019
% Change
2020 vs. 5 Yr. Avg.
% Change
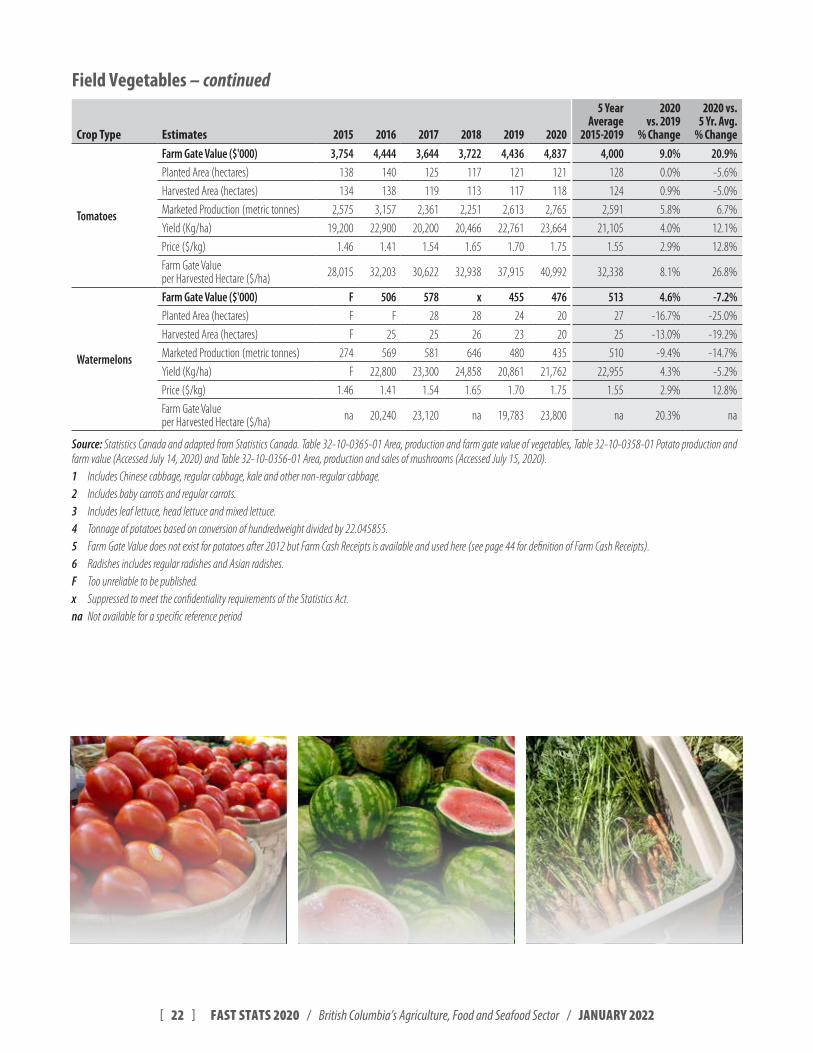
Tomatoes
Farm Gate Value ($'000) 3,754 4,444 3,644 3,722 4,436 4,837 4,000 9.0% 20.9%Planted Area (hectares) 138 140 125 117 121 121 128 0.0% -5.6%
Harvested Area (hectares) 134 138 119 113 117 118 124 0.9% -5.0%
Marketed Production (metric tonnes) 2,575 3,157 2,361 2,251 2,613 2,765 2,591 5.8% 6.7%
Yield (Kg/ha) 19,200 22,900 20,200 20,466 22,761 23,664 21,105 4.0% 12.1%
Price ($/kg) 1.46 1.41 1.54 1.65 1.70 1.75 1.55 2.9% 12.8%
Farm Gate Value per Harvested Hectare ($/ha) 28,015 32,203 30,622 32,938 37,915 40,992 32,338 8.1% 26.8%
Watermelons
Farm Gate Value ($'000) F 506 578 x 455 476 513 4.6% -7.2%Planted Area (hectares) F F 28 28 24 20 27 -16.7% -25.0%
Harvested Area (hectares) F 25 25 26 23 20 25 -13.0% -19.2%
Marketed Production (metric tonnes) 274 569 581 646 480 435 510 -9.4% -14.7%
Yield (Kg/ha) F 22,800 23,300 24,858 20,861 21,762 22,955 4.3% -5.2%
Price ($/kg) 1.46 1.41 1.54 1.65 1.70 1.75 1.55 2.9% 12.8%
Farm Gate Value per Harvested Hectare ($/ha) na 20,240 23,120 na 19,783 23,800 na 20.3% na
Source: Statistics Canada and adapted from Statistics Canada Table 32-10-0365-01 Area, production and farm gate value of vegetables, Table 32-10-0358-01 Potato production and farm value (Accessed July 14, 2020) and Table 32-10-0356-01 Area, production and sales of mushrooms (Accessed July 15, 2020) 1 Includes Chinese cabbage, regular cabbage, kale and other non-regular cabbage 2 Includes baby carrots and regular carrots 3 Includes leaf lettuce, head lettuce and mixed lettuce 4 Tonnage of potatoes based on conversion of hundredweight divided by 22 045855 5 Farm Gate Value does not exist for potatoes after 2012 but Farm Cash Receipts is available and used here (see page 44 for definition of Farm Cash Receipts) 6 Radishes includes regular radishes and Asian radishes F Too unreliable to be published x Suppressed to meet the confidentiality requirements of the Statistics Act na Not available for a specific reference period
Field Vegetables – continued
[ 23 ] FAST STATS 2020 / British Columbia’s Agriculture, Food and Seafood Sector / JANUARY 2022
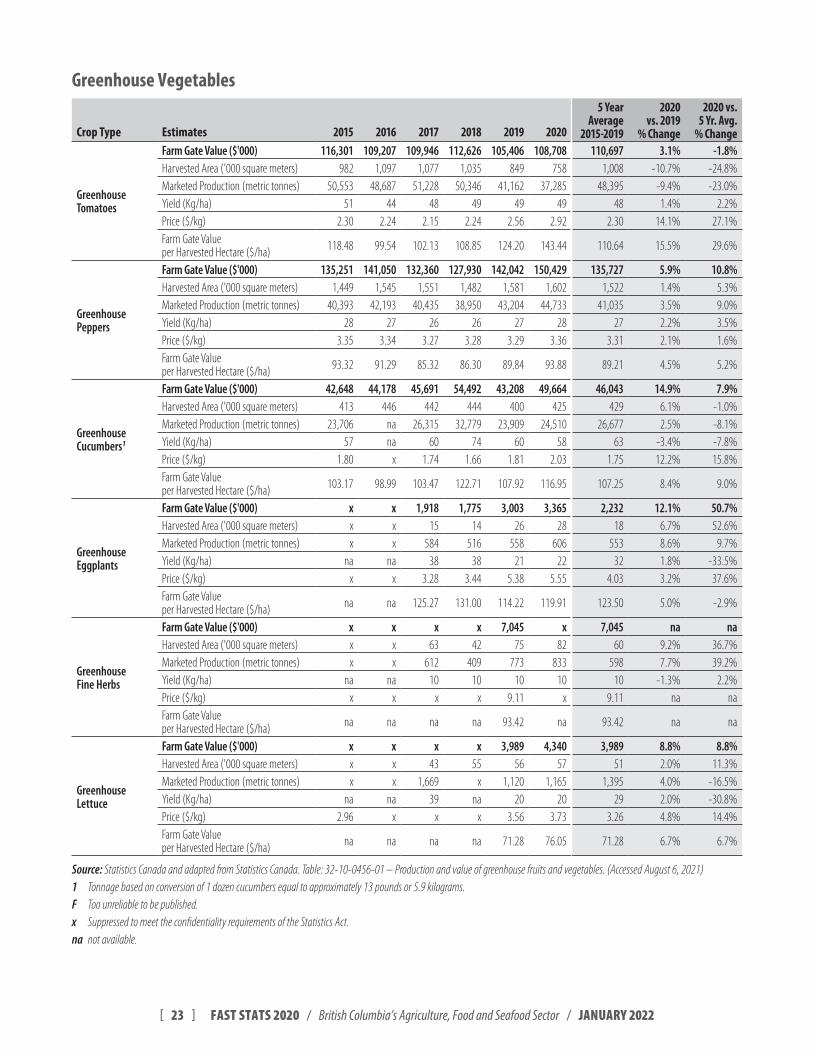
Greenhouse Vegetables
Crop Type Estimates 2015 2016 2017 2018 2019 2020
5 Year Average
2015-2019
2020 vs. 2019
% Change
2020 vs. 5 Yr. Avg.
% Change
Greenhouse Tomatoes
Farm Gate Value ($'000) 116,301 109,207 109,946 112,626 105,406 108,708 110,697 3.1% -1.8%Harvested Area ('000 square meters) 982 1,097 1,077 1,035 849 758 1,008 -10.7% -24.8%Marketed Production (metric tonnes) 50,553 48,687 51,228 50,346 41,162 37,285 48,395 -9.4% -23.0%Yield (Kg/ha) 51 44 48 49 49 49 48 1.4% 2.2%Price ($/kg) 2.30 2.24 2.15 2.24 2.56 2.92 2.30 14.1% 27.1%Farm Gate Value per Harvested Hectare ($/ha) 118.48 99.54 102.13 108.85 124.20 143.44 110.64 15.5% 29.6%
Greenhouse Peppers
Farm Gate Value ($'000) 135,251 141,050 132,360 127,930 142,042 150,429 135,727 5.9% 10.8%Harvested Area ('000 square meters) 1,449 1,545 1,551 1,482 1,581 1,602 1,522 1.4% 5.3%Marketed Production (metric tonnes) 40,393 42,193 40,435 38,950 43,204 44,733 41,035 3.5% 9.0%Yield (Kg/ha) 28 27 26 26 27 28 27 2.2% 3.5%Price ($/kg) 3.35 3.34 3.27 3.28 3.29 3.36 3.31 2.1% 1.6%Farm Gate Value per Harvested Hectare ($/ha) 93.32 91.29 85.32 86.30 89.84 93.88 89.21 4.5% 5.2%
Greenhouse Cucumbers1
Farm Gate Value ($'000) 42,648 44,178 45,691 54,492 43,208 49,664 46,043 14.9% 7.9%Harvested Area ('000 square meters) 413 446 442 444 400 425 429 6.1% -1.0%Marketed Production (metric tonnes) 23,706 na 26,315 32,779 23,909 24,510 26,677 2.5% -8.1%Yield (Kg/ha) 57 na 60 74 60 58 63 -3.4% -7.8%Price ($/kg) 1.80 x 1.74 1.66 1.81 2.03 1.75 12.2% 15.8%Farm Gate Value per Harvested Hectare ($/ha) 103.17 98.99 103.47 122.71 107.92 116.95 107.25 8.4% 9.0%
Greenhouse Eggplants
Farm Gate Value ($'000) x x 1,918 1,775 3,003 3,365 2,232 12.1% 50.7%Harvested Area ('000 square meters) x x 15 14 26 28 18 6.7% 52.6%Marketed Production (metric tonnes) x x 584 516 558 606 553 8.6% 9.7%Yield (Kg/ha) na na 38 38 21 22 32 1.8% -33.5%Price ($/kg) x x 3.28 3.44 5.38 5.55 4.03 3.2% 37.6%Farm Gate Value per Harvested Hectare ($/ha) na na 125.27 131.00 114.22 119.91 123.50 5.0% -2.9%
Greenhouse Fine Herbs
Farm Gate Value ($'000) x x x x 7,045 x 7,045 na naHarvested Area ('000 square meters) x x 63 42 75 82 60 9.2% 36.7%Marketed Production (metric tonnes) x x 612 409 773 833 598 7.7% 39.2%Yield (Kg/ha) na na 10 10 10 10 10 -1.3% 2.2%Price ($/kg) x x x x 9.11 x 9.11 na naFarm Gate Value per Harvested Hectare ($/ha) na na na na 93.42 na 93.42 na na
Greenhouse Lettuce
Farm Gate Value ($'000) x x x x 3,989 4,340 3,989 8.8% 8.8%Harvested Area ('000 square meters) x x 43 55 56 57 51 2.0% 11.3%Marketed Production (metric tonnes) x x 1,669 x 1,120 1,165 1,395 4.0% -16.5%Yield (Kg/ha) na na 39 na 20 20 29 2.0% -30.8%Price ($/kg) 2.96 x x x 3.56 3.73 3.26 4.8% 14.4%Farm Gate Value per Harvested Hectare ($/ha) na na na na 71.28 76.05 71.28 6.7% 6.7%
Source: Statistics Canada and adapted from Statistics Canada Table: 32-10-0456-01 – Production and value of greenhouse fruits and vegetables (Accessed August 6, 2021) 1 Tonnage based on conversion of 1 dozen cucumbers equal to approximately 13 pounds or 5 9 kilograms F Too unreliable to be published x Suppressed to meet the confidentiality requirements of the Statistics Act na not available
[ 24 ] FAST STATS 2020 / British Columbia’s Agriculture, Food and Seafood Sector / JANUARY 2022
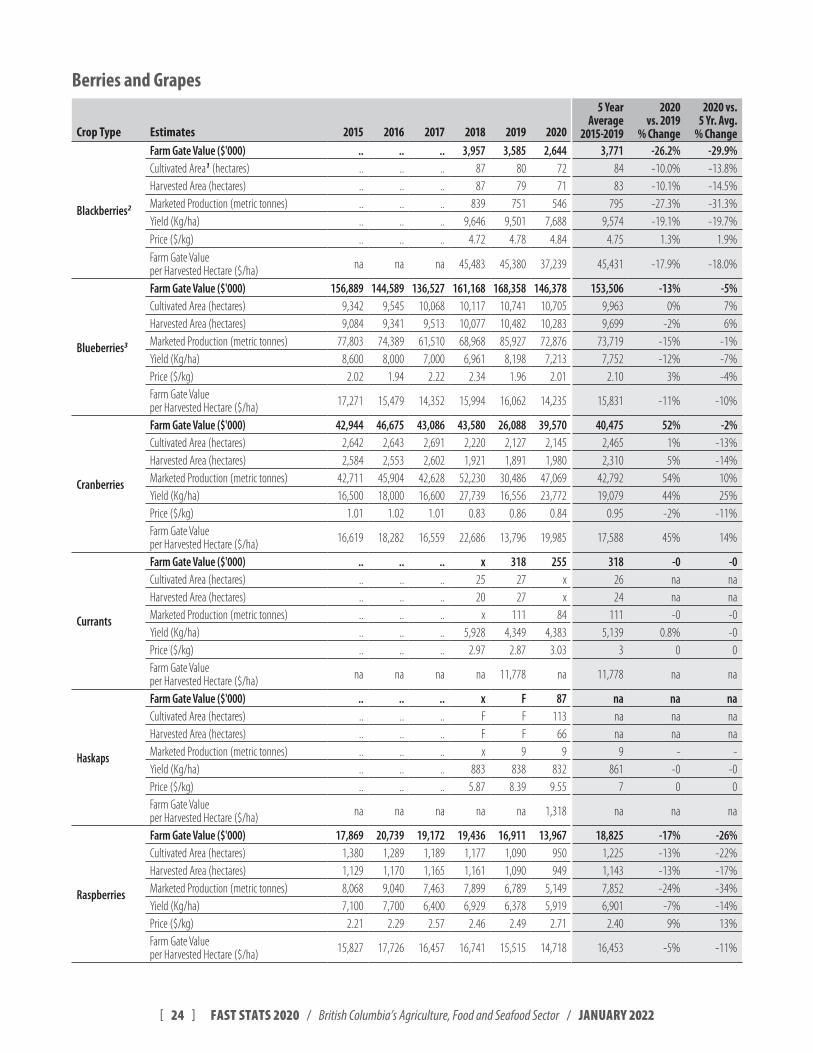
Berries and Grapes
Crop Type Estimates 2015 2016 2017 2018 2019 2020
5 Year Average
2015-2019
2020 vs. 2019
% Change
2020 vs. 5 Yr. Avg.
% Change
Blackberries2
Farm Gate Value ($'000) .. .. .. 3,957 3,585 2,644 3,771 -26.2% -29.9%Cultivated Area1 (hectares) .. .. .. 87 80 72 84 -10.0% -13.8%Harvested Area (hectares) .. .. .. 87 79 71 83 -10.1% -14.5%Marketed Production (metric tonnes) .. .. .. 839 751 546 795 -27.3% -31.3%Yield (Kg/ha) .. .. .. 9,646 9,501 7,688 9,574 -19.1% -19.7%Price ($/kg) .. .. .. 4.72 4.78 4.84 4.75 1.3% 1.9%Farm Gate Value per Harvested Hectare ($/ha) na na na 45,483 45,380 37,239 45,431 -17.9% -18.0%
Blueberries3
Farm Gate Value ($'000) 156,889 144,589 136,527 161,168 168,358 146,378 153,506 -13% -5%Cultivated Area (hectares) 9,342 9,545 10,068 10,117 10,741 10,705 9,963 0% 7%Harvested Area (hectares) 9,084 9,341 9,513 10,077 10,482 10,283 9,699 -2% 6%Marketed Production (metric tonnes) 77,803 74,389 61,510 68,968 85,927 72,876 73,719 -15% -1%Yield (Kg/ha) 8,600 8,000 7,000 6,961 8,198 7,213 7,752 -12% -7%Price ($/kg) 2.02 1.94 2.22 2.34 1.96 2.01 2.10 3% -4%Farm Gate Value per Harvested Hectare ($/ha) 17,271 15,479 14,352 15,994 16,062 14,235 15,831 -11% -10%
Cranberries
Farm Gate Value ($'000) 42,944 46,675 43,086 43,580 26,088 39,570 40,475 52% -2%Cultivated Area (hectares) 2,642 2,643 2,691 2,220 2,127 2,145 2,465 1% -13%Harvested Area (hectares) 2,584 2,553 2,602 1,921 1,891 1,980 2,310 5% -14%Marketed Production (metric tonnes) 42,711 45,904 42,628 52,230 30,486 47,069 42,792 54% 10%Yield (Kg/ha) 16,500 18,000 16,600 27,739 16,556 23,772 19,079 44% 25%Price ($/kg) 1.01 1.02 1.01 0.83 0.86 0.84 0.95 -2% -11%Farm Gate Value per Harvested Hectare ($/ha) 16,619 18,282 16,559 22,686 13,796 19,985 17,588 45% 14%
Currants
Farm Gate Value ($'000) .. .. .. x 318 255 318 -0 -0 Cultivated Area (hectares) .. .. .. 25 27 x 26 na naHarvested Area (hectares) .. .. .. 20 27 x 24 na naMarketed Production (metric tonnes) .. .. .. x 111 84 111 -0 -0 Yield (Kg/ha) .. .. .. 5,928 4,349 4,383 5,139 0.8% -0 Price ($/kg) .. .. .. 2.97 2.87 3.03 3 0 0 Farm Gate Value per Harvested Hectare ($/ha) na na na na 11,778 na 11,778 na na
Haskaps
Farm Gate Value ($'000) .. .. .. x F 87 na na na Cultivated Area (hectares) .. .. .. F F 113 na na na Harvested Area (hectares) .. .. .. F F 66 na na na Marketed Production (metric tonnes) .. .. .. x 9 9 9 - - Yield (Kg/ha) .. .. .. 883 838 832 861 -0 -0 Price ($/kg) .. .. .. 5.87 8.39 9.55 7 0 0 Farm Gate Value per Harvested Hectare ($/ha) na na na na na 1,318 na na na
Raspberries
Farm Gate Value ($'000) 17,869 20,739 19,172 19,436 16,911 13,967 18,825 -17% -26%Cultivated Area (hectares) 1,380 1,289 1,189 1,177 1,090 950 1,225 -13% -22%Harvested Area (hectares) 1,129 1,170 1,165 1,161 1,090 949 1,143 -13% -17%Marketed Production (metric tonnes) 8,068 9,040 7,463 7,899 6,789 5,149 7,852 -24% -34%Yield (Kg/ha) 7,100 7,700 6,400 6,929 6,378 5,919 6,901 -7% -14%Price ($/kg) 2.21 2.29 2.57 2.46 2.49 2.71 2.40 9% 13%Farm Gate Value per Harvested Hectare ($/ha) 15,827 17,726 16,457 16,741 15,515 14,718 16,453 -5% -11%
[ 25 ] FAST STATS 2020 / British Columbia’s Agriculture, Food and Seafood Sector / JANUARY 2022
Crop Type Estimates 2015 2016 2017 2018 2019 2020
5 Year Average
2015-2019
2020 vs. 2019
% Change
2020 vs. 5 Yr. Avg.
% Change
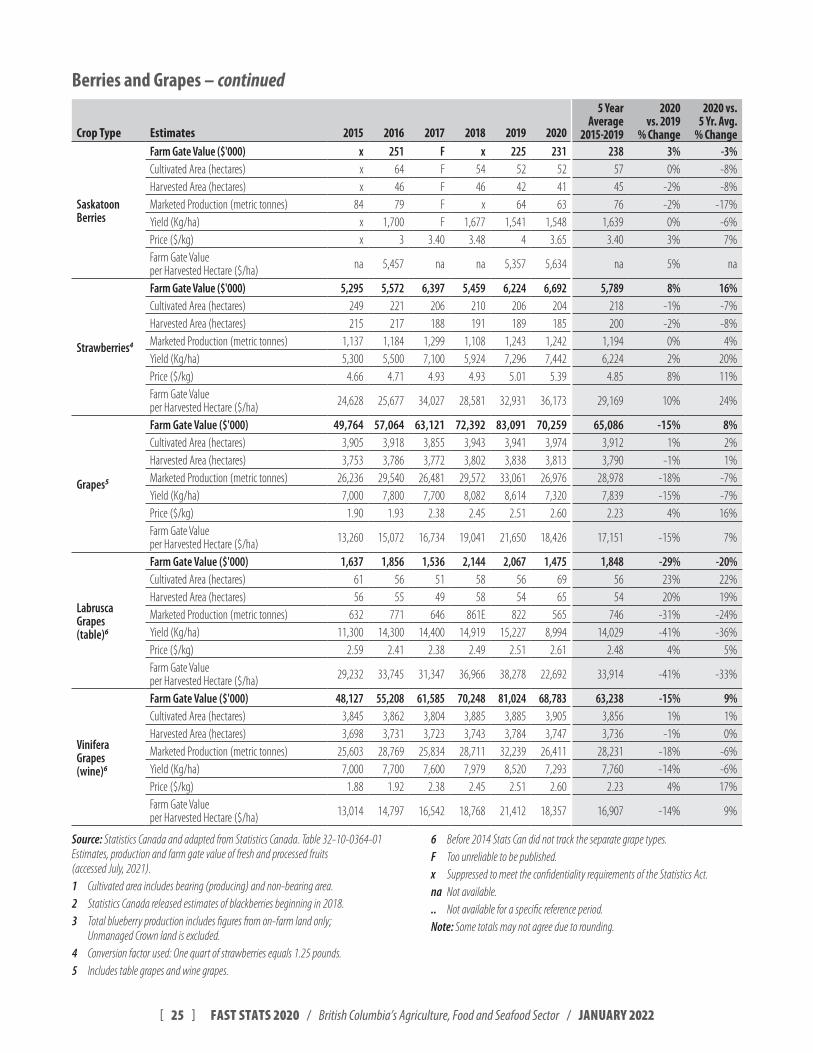
Saskatoon Berries
Farm Gate Value ($'000) x 251 F x 225 231 238 3% -3%Cultivated Area (hectares) x 64 F 54 52 52 57 0% -8%Harvested Area (hectares) x 46 F 46 42 41 45 -2% -8%Marketed Production (metric tonnes) 84 79 F x 64 63 76 -2% -17%Yield (Kg/ha) x 1,700 F 1,677 1,541 1,548 1,639 0% -6%Price ($/kg) x 3 3.40 3.48 4 3.65 3.40 3% 7%Farm Gate Value per Harvested Hectare ($/ha) na 5,457 na na 5,357 5,634 na 5% na
Strawberries4
Farm Gate Value ($'000) 5,295 5,572 6,397 5,459 6,224 6,692 5,789 8% 16%Cultivated Area (hectares) 249 221 206 210 206 204 218 -1% -7%Harvested Area (hectares) 215 217 188 191 189 185 200 -2% -8%Marketed Production (metric tonnes) 1,137 1,184 1,299 1,108 1,243 1,242 1,194 0% 4%Yield (Kg/ha) 5,300 5,500 7,100 5,924 7,296 7,442 6,224 2% 20%Price ($/kg) 4.66 4.71 4.93 4.93 5.01 5.39 4.85 8% 11%Farm Gate Value per Harvested Hectare ($/ha) 24,628 25,677 34,027 28,581 32,931 36,173 29,169 10% 24%
Grapes5
Farm Gate Value ($'000) 49,764 57,064 63,121 72,392 83,091 70,259 65,086 -15% 8%Cultivated Area (hectares) 3,905 3,918 3,855 3,943 3,941 3,974 3,912 1% 2%Harvested Area (hectares) 3,753 3,786 3,772 3,802 3,838 3,813 3,790 -1% 1%Marketed Production (metric tonnes) 26,236 29,540 26,481 29,572 33,061 26,976 28,978 -18% -7%Yield (Kg/ha) 7,000 7,800 7,700 8,082 8,614 7,320 7,839 -15% -7%Price ($/kg) 1.90 1.93 2.38 2.45 2.51 2.60 2.23 4% 16%Farm Gate Value per Harvested Hectare ($/ha) 13,260 15,072 16,734 19,041 21,650 18,426 17,151 -15% 7%
Labrusca Grapes (table)6
Farm Gate Value ($'000) 1,637 1,856 1,536 2,144 2,067 1,475 1,848 -29% -20%Cultivated Area (hectares) 61 56 51 58 56 69 56 23% 22%Harvested Area (hectares) 56 55 49 58 54 65 54 20% 19%Marketed Production (metric tonnes) 632 771 646 861E 822 565 746 -31% -24%Yield (Kg/ha) 11,300 14,300 14,400 14,919 15,227 8,994 14,029 -41% -36%Price ($/kg) 2.59 2.41 2.38 2.49 2.51 2.61 2.48 4% 5%Farm Gate Value per Harvested Hectare ($/ha) 29,232 33,745 31,347 36,966 38,278 22,692 33,914 -41% -33%
Vinifera Grapes (wine)6
Farm Gate Value ($'000) 48,127 55,208 61,585 70,248 81,024 68,783 63,238 -15% 9%Cultivated Area (hectares) 3,845 3,862 3,804 3,885 3,885 3,905 3,856 1% 1%Harvested Area (hectares) 3,698 3,731 3,723 3,743 3,784 3,747 3,736 -1% 0%Marketed Production (metric tonnes) 25,603 28,769 25,834 28,711 32,239 26,411 28,231 -18% -6%Yield (Kg/ha) 7,000 7,700 7,600 7,979 8,520 7,293 7,760 -14% -6%Price ($/kg) 1.88 1.92 2.38 2.45 2.51 2.60 2.23 4% 17%Farm Gate Value per Harvested Hectare ($/ha) 13,014 14,797 16,542 18,768 21,412 18,357 16,907 -14% 9%
Source: Statistics Canada and adapted from Statistics Canada Table 32-10-0364-01 Estimates, production and farm gate value of fresh and processed fruits (accessed July, 2021) 1 Cultivated area includes bearing (producing) and non-bearing area 2 Statistics Canada released estimates of blackberries beginning in 2018 3 Total blueberry production includes figures from on-farm land only;
Unmanaged Crown land is excluded 4 Conversion factor used: One quart of strawberries equals 1 25 pounds 5 Includes table grapes and wine grapes
6 Before 2014 Stats Can did not track the separate grape types F Too unreliable to be published x Suppressed to meet the confidentiality requirements of the Statistics Act na Not available .. Not available for a specific reference period Note: Some totals may not agree due to rounding
Berries and Grapes – continued
[ 26 ] FAST STATS 2020 / British Columbia’s Agriculture, Food and Seafood Sector / JANUARY 2022
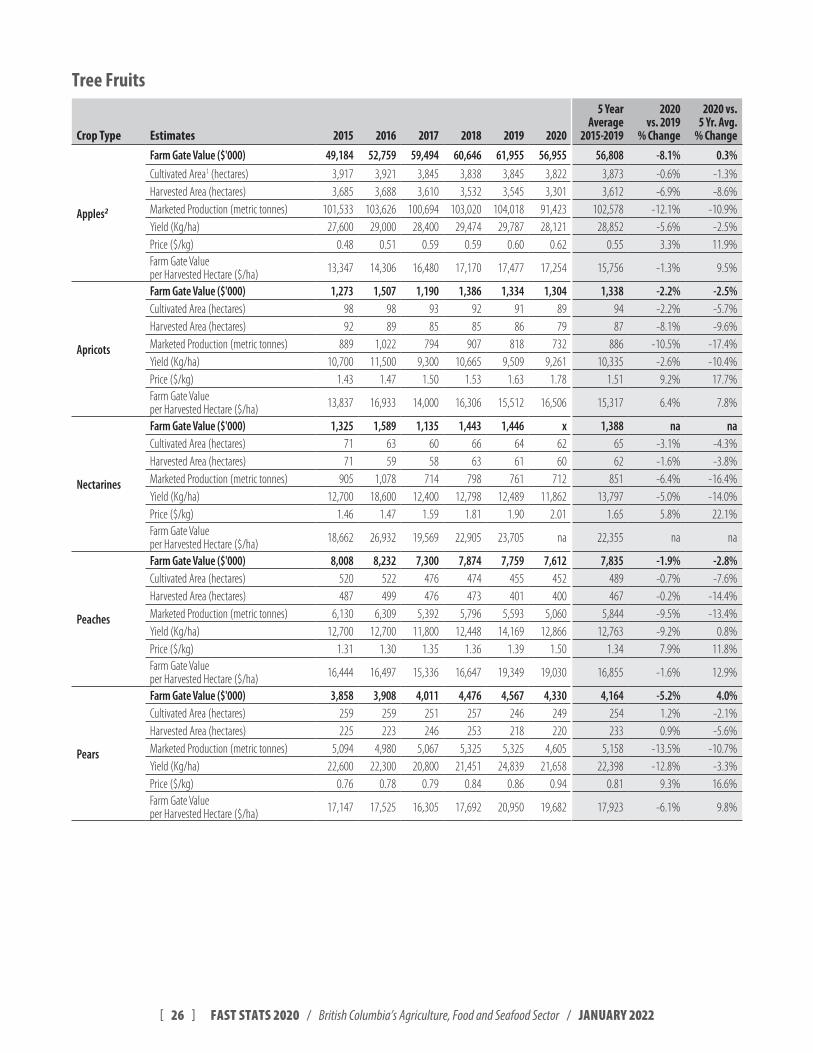
Tree Fruits
Crop Type Estimates 2015 2016 2017 2018 2019 2020
5 Year Average
2015-2019
2020 vs. 2019
% Change
2020 vs. 5 Yr. Avg.
% Change
Apples2
Farm Gate Value ($'000) 49,184 52,759 59,494 60,646 61,955 56,955 56,808 -8.1% 0.3%Cultivated Area1 (hectares) 3,917 3,921 3,845 3,838 3,845 3,822 3,873 -0.6% -1.3%Harvested Area (hectares) 3,685 3,688 3,610 3,532 3,545 3,301 3,612 -6.9% -8.6%Marketed Production (metric tonnes) 101,533 103,626 100,694 103,020 104,018 91,423 102,578 -12.1% -10.9%Yield (Kg/ha) 27,600 29,000 28,400 29,474 29,787 28,121 28,852 -5.6% -2.5%Price ($/kg) 0.48 0.51 0.59 0.59 0.60 0.62 0.55 3.3% 11.9%Farm Gate Value per Harvested Hectare ($/ha) 13,347 14,306 16,480 17,170 17,477 17,254 15,756 -1.3% 9.5%
Apricots
Farm Gate Value ($'000) 1,273 1,507 1,190 1,386 1,334 1,304 1,338 -2.2% -2.5%Cultivated Area (hectares) 98 98 93 92 91 89 94 -2.2% -5.7%Harvested Area (hectares) 92 89 85 85 86 79 87 -8.1% -9.6%Marketed Production (metric tonnes) 889 1,022 794 907 818 732 886 -10.5% -17.4%Yield (Kg/ha) 10,700 11,500 9,300 10,665 9,509 9,261 10,335 -2.6% -10.4%Price ($/kg) 1.43 1.47 1.50 1.53 1.63 1.78 1.51 9.2% 17.7%Farm Gate Value per Harvested Hectare ($/ha) 13,837 16,933 14,000 16,306 15,512 16,506 15,317 6.4% 7.8%
Nectarines
Farm Gate Value ($'000) 1,325 1,589 1,135 1,443 1,446 x 1,388 na naCultivated Area (hectares) 71 63 60 66 64 62 65 -3.1% -4.3%Harvested Area (hectares) 71 59 58 63 61 60 62 -1.6% -3.8%Marketed Production (metric tonnes) 905 1,078 714 798 761 712 851 -6.4% -16.4%Yield (Kg/ha) 12,700 18,600 12,400 12,798 12,489 11,862 13,797 -5.0% -14.0%Price ($/kg) 1.46 1.47 1.59 1.81 1.90 2.01 1.65 5.8% 22.1%Farm Gate Value per Harvested Hectare ($/ha) 18,662 26,932 19,569 22,905 23,705 na 22,355 na na
Peaches
Farm Gate Value ($'000) 8,008 8,232 7,300 7,874 7,759 7,612 7,835 -1.9% -2.8%Cultivated Area (hectares) 520 522 476 474 455 452 489 -0.7% -7.6%Harvested Area (hectares) 487 499 476 473 401 400 467 -0.2% -14.4%Marketed Production (metric tonnes) 6,130 6,309 5,392 5,796 5,593 5,060 5,844 -9.5% -13.4%Yield (Kg/ha) 12,700 12,700 11,800 12,448 14,169 12,866 12,763 -9.2% 0.8%Price ($/kg) 1.31 1.30 1.35 1.36 1.39 1.50 1.34 7.9% 11.8%Farm Gate Value per Harvested Hectare ($/ha) 16,444 16,497 15,336 16,647 19,349 19,030 16,855 -1.6% 12.9%
Pears
Farm Gate Value ($'000) 3,858 3,908 4,011 4,476 4,567 4,330 4,164 -5.2% 4.0%Cultivated Area (hectares) 259 259 251 257 246 249 254 1.2% -2.1%Harvested Area (hectares) 225 223 246 253 218 220 233 0.9% -5.6%Marketed Production (metric tonnes) 5,094 4,980 5,067 5,325 5,325 4,605 5,158 -13.5% -10.7%Yield (Kg/ha) 22,600 22,300 20,800 21,451 24,839 21,658 22,398 -12.8% -3.3%Price ($/kg) 0.76 0.78 0.79 0.84 0.86 0.94 0.81 9.3% 16.6%Farm Gate Value per Harvested Hectare ($/ha) 17,147 17,525 16,305 17,692 20,950 19,682 17,923 -6.1% 9.8%
[ 27 ] FAST STATS 2020 / British Columbia’s Agriculture, Food and Seafood Sector / JANUARY 2022
Tree Fruits – continued
Crop Type Estimates 2015 2016 2017 2018 2019 2020
5 Year Average
2015-2019
2020 vs. 2019
% Change
2020 vs. 5 Yr. Avg.
% Change
Plums and Prune Plums
Farm Gate Value ($'000) 1,752 1,658 1,856 x 1,972 2,008 1,810 1.8% 11.0%Cultivated Area (hectares) 191 191 182 178 170 162 182 -4.7% -11.2%Harvested Area (hectares) 155 146 146 146 126 118 144 -6.3% -17.9%Marketed Production (metric tonnes) 1,649 1,581 1,473 x 1,387 1,234 1,523 -11.0% -18.9%Yield (Kg/ha) 11,000 10,800 10,200 10,608 11,005 10,460 10,723 -5.0% -2.4%Price ($/kg) 1.06 1.05 1.26 1.27 1.42 1.63 1.21 14.8% 34.5%Farm Gate Value per Harvested Hectare ($/ha) 11,303 11,356 12,712 na 15,651 17,017 12,756 8.7% 33.4%
Sour Cherries
Farm Gate Value ($'000) x 199 F x 240 F 199 na naCultivated Area (hectares) x 55 F 38 37 F 47 na naHarvested Area (hectares) x 45 F 35 35 F 38 na naMarketed Production (metric tonnes) 240 186 F 117 113 F 164 na naYield (Kg/ha) x 4,100 F 3,341 3,279 3,262 3,573 -0.5% -8.7%Price ($/kg) x 1.07 1.26 1.87 2.12 2.21 1.58 4.2% 39.9%Farm Gate Value per Harvested Hectare ($/ha) na 4,422 na na na na 4,422 na na
Sweet Cherries
Farm Gate Value ($'000) 61,083 56,608 84,744 97,545 85,658 69,284 77,128 -19.1% -10.2%Cultivated Area (hectares) 1,928 1,987 1,942 1,944 1,968 1,939 1,954 -1.5% -0.8%Harvested Area (hectares) 1,841 1,858 1,739 1,878 1,968 1,865 1,857 -5.2% 0.4%Marketed Production (metric tonnes) 16,990 15,871 23,484 24,452 21,235 16,810 20,406 -20.8% -17.6%Yield (Kg/ha) 9,500 9,400 14,200 13,489 10,790 9,268 11,476 -14.1% -19.2%Price ($/kg) 3.60 3.57 3.61 3.99 4.03 4.12 3.76 2.2% 9.6%Farm Gate Value per Harvested Hectare ($/ha) 33,179 30,467 48,731 51,941 43,525 37,150 41,569 -14.6% -10.6%
Source: Statistics Canada and adapted from Statistics Canada Table 32-10-0364-01 Estimates, production and farm gate value of fresh and processed fruits (accessed July, 2021) 1 Cultivated area includes bearing (producing) and non-bearing area 2 Conversion factor used: one bushel of apples equals 42 0 poundsF Too unreliable to be published x Suppressed to meet the confidentiality requirements of the Statistics Act na Not available Note: Some totals may not agree due to rounding
[ 28 ] FAST STATS 2020 / British Columbia’s Agriculture, Food and Seafood Sector / JANUARY 2022
Floriculture Products
Flower/Plant 2015 2016 2017 2018 2019 2020
5 Year Average
2015-2019
2020 vs. 2019
% Change
2020 vs. 5 Yr. Avg.
% ChangeNumber of Greenhouse Flowers and Plants Total Cut Flowers1 89,871,743 82,244,761 x 82,001,189 74,296,005 68,663,226 82,103,425 -7.6% -16.4%
Alstroemeria 3,652,095 3,889,317 x x 2,056,966 x 3,199,459 na naChrysanthemums 16,467,959 x x 12,028,862 12,354,929 12,044,319 13,617,250 -2.5% -11.6%Daffodils x x x x x 199 na na naFreesia F x 3,120,965 3,353,931 x 2,718,395 3,237,448 na -16.0%Gerberas x x x x 26,221,475 x 26,221,475 na naIris 40,000 40,500 x x 170,634 x 83,711 na naLilies 1,820,987 2,659,640 x 3,998,240 5,266,760 7,515,982 3,436,407 42.7% 118.7%Roses 1,995,473 x x x x 2,238,301 1,995,473 na 12.2%Snapdragons 1,414,993 x x 719,216 777,148 x 970,452 na naTulips 19,635,933 20,789,055 x x 15,724,579 15,628,907 18,716,522 -0.6% -16.5%Other 16,874,098 12,190,811 x 4,119,835 5,282,084 9,816,734 9,616,707 85.8% 2.1%
Total Cuttings 20,845,771 17,921,389 13,699,199 x 6,649,582 5,967,908 14,778,985 -10.3% -59.6%Geraniums 2,626,210 3,712,716 x x x 889,741 3,169,463 na -71.9%Impatiens 316,280 x x x x x 316,280 na naPoinsettias x x x x x 1,191,130 na na na
Other cuttings 15,966,400 12,551,494 10,067,251 x 4,843,709 3,836,920 10,857,214 -20.8% -64.7%
Total Potted Plants1 55,675,029 54,012,377 51,090,568 49,089,450 51,223,159 55,638,369 52,218,117 8.6% 6.5%Indoor Potted Plants
African violets x x 436,175 749,666 829,682 866,711 671,841 4.5% 29.0%Azaleas 115,245 x x 176,906 173,720 156,330 155,290 -10.0% 0.7%Chrysanthemums 829,875 607,554 461,998 493,422 365,516 346,051 551,673 -5.3% -37.3%Cyclamen 412,561 418,071 143,837 405,325 368,846 363,498 349,728 -1.4% 3.9%Gerberas 718,243 693,197 433,122 514,489 471,395 461,959 566,089 -2.0% -18.4%Hanging pots 484,580 469,789 171,428 231,653 239,125 256,044 319,315 7.1% -19.8%Kalanchoe 1,086,551 x 1,527,443 x 1,305,672 1,376,750 1,306,555 5.4% 5.4%Lilies 2,780,312 1,354,874 458,187 768,929 735,670 817,249 1,219,594 11.1% -33.0%Orchids 851,020 x 626,029 598,262 622,022 551,381 674,333 -11.4% -18.2%Poinsettias 1,948,746 1,847,362 1,449,901 1,233,845 1,081,794 1,250,462 1,512,330 15.6% -17.3%Primula 1,627,975 2,352,849 1,957,472 1,611,156 1,447,144 1,054,382 1,799,319 -27.1% -41.4%Miniature roses x x x 784,816 761,254 754,585 773,035 -0.9% -2.4%Tropical foliage, green plants 3,639,464 3,706,537 5,409,858 5,178,260 5,381,673 6,117,904 4,663,158 13.7% 31.2%Tulips F 62,983 x x 21,184 20,851 42,084 -1.6% -50.5%
Other 1,446,247 1,527,993 1,434,486 1,325,066 2,835,646 3,012,175 1,713,888 6.2% 75.8%
[ 29 ] FAST STATS 2020 / British Columbia’s Agriculture, Food and Seafood Sector / JANUARY 2022
Flower/Plant 2015 2016 2017 2018 2019 2020
5 Year Average
2015-2019
2020 vs. 2019
% Change
2020 vs. 5 Yr. Avg.
% ChangeOutdoor Potted Plants
Argyranthemum 125,526 61,507 57,661 44,352 43,176 38,472 66,444 -10.9% -42.1%Begonias 1,925,866 1,534,686 831,241 854,083 891,190 813,190 1,207,413 -8.8% -32.7%Chrysanthemums 343,362 390,308 476,160 241,414 277,330 309,706 345,715 11.7% -10.4%Geraniums 5,766,090 5,389,525 3,639,041 3,316,501 3,003,080 2,908,567 4,222,847 -3.1% -31.1%Herbaceous perennials 2,895,304 1,198,848 1,502,505 1,205,348 1,282,046 1,362,512 1,616,810 6.3% -15.7%Hawker's balsams (Impatiens Hawkeri) 1,380,560 739,772 618,676 549,199 466,981 370,959 751,038 -20.6% -50.6%
Petunias 3,363,757 1,901,683 1,628,886 1,317,681 1,155,628 935,626 1,873,527 -19.0% -50.1%Calibrachoas .. 522,890 398,893 368,599 337,970 320,362 407,088 -5.2% -21.3%Dahlias .. 289,866 281,591 213,671 215,020 176,811 250,037 -17.8% -29.3%Pansies .. 508,508 559,921 498,444 464,314 364,521 507,797 -21.5% -28.2%Rudbeckias .. 21,624 x 44,700 48,781 43,545 38,368 -10.7% 13.5%Heliopsis .. x 1,060 7,842 6,567 2,242 5,156 -65.9% -56.5%Verbenas .. 184,914 185,093 216,606 224,887 160,920 202,875 -28.4% -20.7%Zinnias .. 132,721 55,184 69,375 57,518 47,307 78,700 -17.8% -39.9%Fine herb plants .. 2,547,861 1,404,568 1,813,868 1,443,863 1,212,511 1,802,540 -16.0% -32.7%Vegetable plants .. 2,408,775 2,411,195 2,843,870 3,123,303 2,639,624 2,696,786 -15.5% -2.1%Hanging pots 1,967,955 1,757,140 2,179,041 2,014,941 1,966,707 2,159,150 1,977,157 9.8% 9.2%Other 20,469,048 18,265,891 19,256,695 18,060,093 19,574,455 24,366,012 19,125,236 24.5% 27.4%
Bedding plants, ornamental – Production 49,418,460 59,239,958 64,907,790 77,610,409 61,148,068 65,573,869 62,464,937 7.2% 5.0%
Bedding plants, vegetables – Production 129,285,917 140,799,257 141,242,864 110,740,235 77,471,800 68,531,193 119,908,015 -11.5% -42.8%
Estimates of field-grown cut flowers area, production and sales2 2015 2016 2017 2018 2019 2020
5 Year Average
2015-2019
2020 vs. 2019
% Change
2020 vs. 5 Yr. Avg.
% ChangeField-grown flowers operations - number .. 71 89 92 92 101 86 9.8% 17.4%
Field-grown flowers area - hectare .. 166 164 168 192 338 173 76.0% 95.9%
Cut flowers - number .. x 36,353,488 37,448,987E 26,393,441 65,968,941 31,373,465 149.9% 110.3%
Gross sales - dollars .. 10,009,925 10,825,750 10,003,328 8,557,432 14,437,934 9,849,109 68.7% 46.6%
Source: Statistics Canada Table 32-10-0246-01 Production and sale of greenhouse flowers and plants and Table 32-10-0021-01 Production of potted plants, cut flowers, cuttings, by variety and tree seedlings (accessed August 4, 2021) 1 Includes flowers grown, or given some cultural treatment and sold 2 Statistics Canada started in 2016 estimates of field-grown cut flowers area, production and sales na Not available .. Not available for a specific reference period x Suppressed to meet the confidentiality requirements of the Statistics Act Note: Averages calculated using the available data for the period 2015 to 2019
Floriculture Products – continued
[ 30 ] FAST STATS 2020 / British Columbia’s Agriculture, Food and Seafood Sector / JANUARY 2022
Production of Sod and Nursery Products
Type of Crop 2015 2016 2017 2018 2019 2020
5 Year Average
2015-2019
2020 vs. 2019
% Change
2020 vs. 5 Yr. Avg.
% ChangeNumber of Field Grown Nursery Products
Coniferous Trees 923,860 834,848 717,821 593,069 738,174 595,336 767,400 -19.4% -22.4%
Coniferous Evergreen Shrubs 557,757 428,441 256,269 114,454 135,536 146,431 339,230 8.0% -56.8%
Deciduous Shrubs (including roses) F x 32,963 288,111 62,894 40,647 160,537 -35.4% -74.7%
Evergreen Broadleaf Shrubs 75,536 x 394,004 18,238 49,726 21,645 162,593 -56.5% -86.7%
Fruit Trees 238,473 309,311 455,574 405,595 416,486 400,067 352,238 -3.9% 13.6%
Nursery Tree Seedlings1 1,296 3,126 83.0 23213.0 19897.0 16539.0 6,930 -16.9% 138.7%
Perennials and Annuals 6,604,470 4,806,866 2,575,766 2,759,043 2,321,505 3,056,402 4,186,536 31.7% -27.0%
Shade or Ornamental Trees 715,702 614,889 549,971 260,271 390,948 543,691 535,208 39.1% 1.6%
Small Fruit Bushes F x x 218,439 213,020 237,843 218,439 11.7% 8.9%
Vines F x 499 995 1,263 1,316 747 4.2% 76.2%
Other Trees and Plants F 21,281 x 101,180 244,835 306,095 61,231 25.0% 399.9%
Containers of Grown Nursery Products
Coniferous Trees 707,957 968,141 2,172,464 420,949 830,354 868,574 1,067,378 4.6% -18.6%
Coniferous Evergreen Shrubs 1,064,850 2,334,215 2,759,441 4,502,894 3,877,549 4,465,243 2,665,350 15.2% 67.5%
Deciduous Shrubs (including roses) 3,645,987 3,895,135 5,147,909 4,295,821 4,372,180 4,638,896 4,246,213 6.1% 9.2%
Evergreen Broadleaf Shrubs 1,340,507 1,668,504 2,014,497 1,822,925 1,899,365 2,071,191 1,711,608 9.0% 21.0%
Fruit Trees 56,060.0 x 83,184.0 60,093.0 210,800.0 74,133.0 66,445.7 -64.8% 11.6%
Nursery Tree Seedlings1 220,513,783 2,153,766 1,020,537 38,850 440,507 277,864 55,931,734 -36.9% -99.5%
Perennials and Annuals 7,773,979 5,707,038 6,675,794 6,348,804 5,904,642 7,687,331 6,626,404 30.2% 16.0%
Shade or Ornamental Trees 900,551 369,545 502,965 505,201 460,196 407,063 569,566 -11.5% -28.5%
Small Fruit Bushes 535,431 393,944 417,573 233,953 249,490 196,592 395,225 -21.2% -50.3%
Vines 371,527 302,008 227,370 129,820 154,550 158,485 257,681 2.5% -38.5%
Other Trees and Plants 894,385 x 1,478,263 218,908 1,085,500 1,575,390 863,852 45.1% 82.4%
Tree Seedlings – Greenhouse Production F x x 1,870,360 2,887,552 4,022,710 1,870,360 39.3% 115.1%
Sod Area Grown for Sale (Hectares) 542 550 599 571 550 516 566 -6.2% -8.8%
Source: Statistics Canada Table 32-10-0031-01 Nursery tree and plant production, and Table 32-10-0034-01 Estimates of sod area, sales and resales (accessed August 4, 2021) 1 Operations which exclusively produce tree seedlings for reforestation are outside the scope of the 2016 survey Prior surveys have included their production, affecting also nursery
area, production, sales, labour and expenses variables x Suppressed to meet the confidentiality requirements of the Statistics Act F Too unreliable to be published na Not available
[ 31 ] FAST STATS 2020 / British Columbia’s Agriculture, Food and Seafood Sector / JANUARY 2022
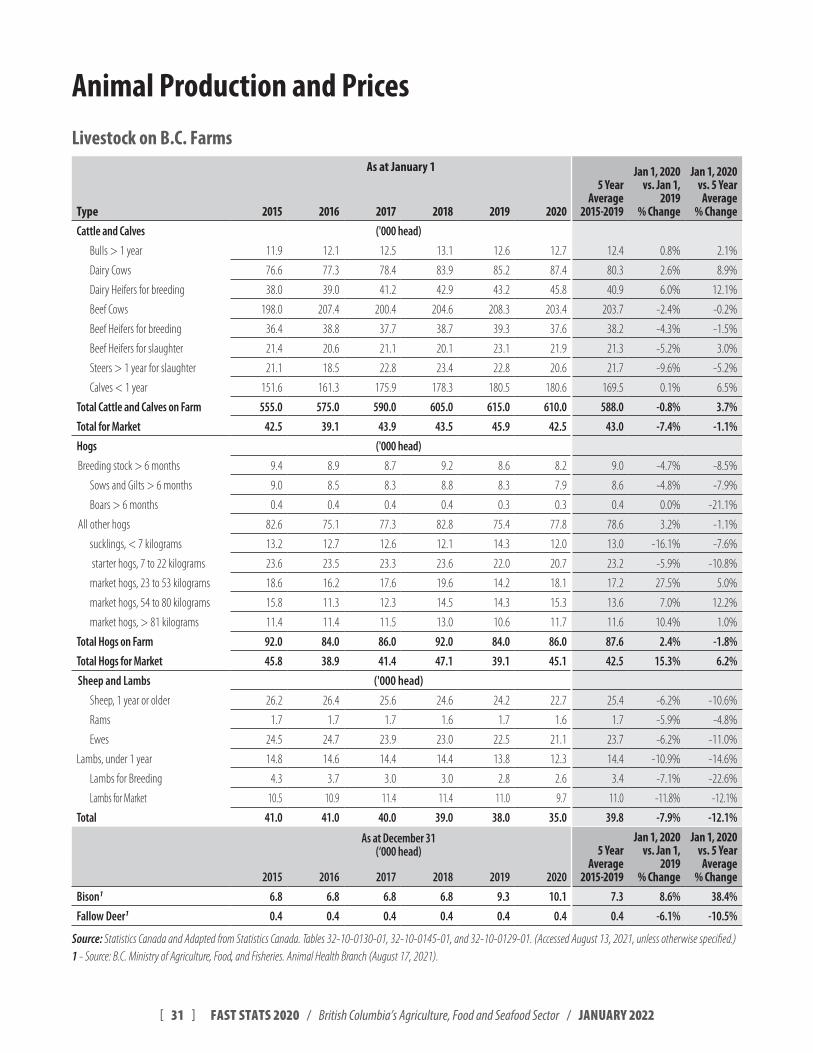
Animal Production and PricesLivestock on B.C. Farms
As at January 15 Year
Average 2015-2019
Jan 1, 2020 vs. Jan 1,
2019 % Change
Jan 1, 2020 vs. 5 Year Average
% ChangeType 2015 2016 2017 2018 2019 2020Cattle and Calves ('000 head)
Bulls > 1 year 11.9 12.1 12.5 13.1 12.6 12.7 12.4 0.8% 2.1%
Dairy Cows 76.6 77.3 78.4 83.9 85.2 87.4 80.3 2.6% 8.9%
Dairy Heifers for breeding 38.0 39.0 41.2 42.9 43.2 45.8 40.9 6.0% 12.1%
Beef Cows 198.0 207.4 200.4 204.6 208.3 203.4 203.7 -2.4% -0.2%
Beef Heifers for breeding 36.4 38.8 37.7 38.7 39.3 37.6 38.2 -4.3% -1.5%
Beef Heifers for slaughter 21.4 20.6 21.1 20.1 23.1 21.9 21.3 -5.2% 3.0%
Steers > 1 year for slaughter 21.1 18.5 22.8 23.4 22.8 20.6 21.7 -9.6% -5.2%
Calves < 1 year 151.6 161.3 175.9 178.3 180.5 180.6 169.5 0.1% 6.5%
Total Cattle and Calves on Farm 555.0 575.0 590.0 605.0 615.0 610.0 588.0 -0.8% 3.7%
Total for Market 42.5 39.1 43.9 43.5 45.9 42.5 43.0 -7.4% -1.1%
Hogs ('000 head)
Breeding stock > 6 months 9.4 8.9 8.7 9.2 8.6 8.2 9.0 -4.7% -8.5%
Sows and Gilts > 6 months 9.0 8.5 8.3 8.8 8.3 7.9 8.6 -4.8% -7.9%
Boars > 6 months 0.4 0.4 0.4 0.4 0.3 0.3 0.4 0.0% -21.1%
All other hogs 82.6 75.1 77.3 82.8 75.4 77.8 78.6 3.2% -1.1%
sucklings, < 7 kilograms 13.2 12.7 12.6 12.1 14.3 12.0 13.0 -16.1% -7.6%
starter hogs, 7 to 22 kilograms 23.6 23.5 23.3 23.6 22.0 20.7 23.2 -5.9% -10.8%
market hogs, 23 to 53 kilograms 18.6 16.2 17.6 19.6 14.2 18.1 17.2 27.5% 5.0%
market hogs, 54 to 80 kilograms 15.8 11.3 12.3 14.5 14.3 15.3 13.6 7.0% 12.2%
market hogs, > 81 kilograms 11.4 11.4 11.5 13.0 10.6 11.7 11.6 10.4% 1.0%
Total Hogs on Farm 92.0 84.0 86.0 92.0 84.0 86.0 87.6 2.4% -1.8%
Total Hogs for Market 45.8 38.9 41.4 47.1 39.1 45.1 42.5 15.3% 6.2%
Sheep and Lambs ('000 head)
Sheep, 1 year or older 26.2 26.4 25.6 24.6 24.2 22.7 25.4 -6.2% -10.6%
Rams 1.7 1.7 1.7 1.6 1.7 1.6 1.7 -5.9% -4.8%
Ewes 24.5 24.7 23.9 23.0 22.5 21.1 23.7 -6.2% -11.0%
Lambs, under 1 year 14.8 14.6 14.4 14.4 13.8 12.3 14.4 -10.9% -14.6%
Lambs for Breeding 4.3 3.7 3.0 3.0 2.8 2.6 3.4 -7.1% -22.6%
Lambs for Market 10.5 10.9 11.4 11.4 11.0 9.7 11.0 -11.8% -12.1%
Total 41.0 41.0 40.0 39.0 38.0 35.0 39.8 -7.9% -12.1%
As at December 31 (‘000 head) 5 Year
Average 2015-2019
Jan 1, 2020 vs. Jan 1,
2019 % Change
Jan 1, 2020 vs. 5 Year Average
% Change2015 2016 2017 2018 2019 2020
Bison1 6.8 6.8 6.8 6.8 9.3 10.1 7.3 8.6% 38.4%
Fallow Deer1 0.4 0.4 0.4 0.4 0.4 0.4 0.4 -6.1% -10.5%
Source: Statistics Canada and Adapted from Statistics Canada Tables 32-10-0130-01, 32-10-0145-01, and 32-10-0129-01 (Accessed August 13, 2021, unless otherwise specified )1 - Source: B C Ministry of Agriculture, Food, and Fisheries Animal Health Branch (August 17, 2021)
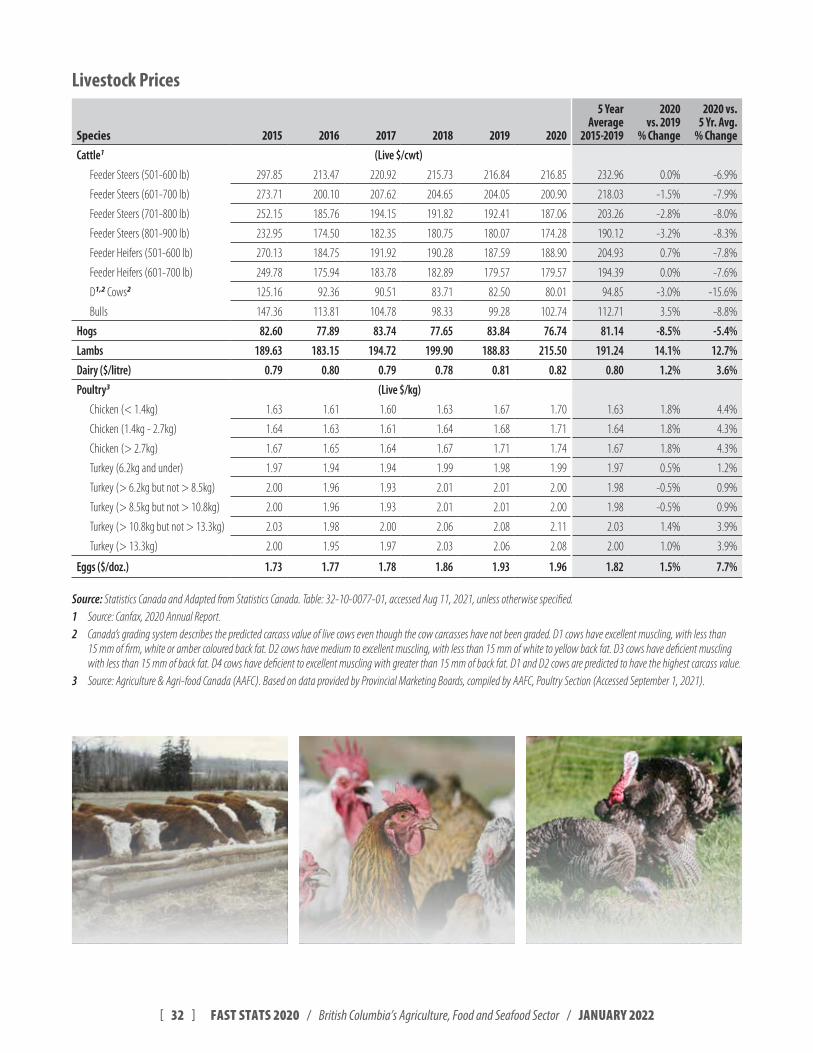
[ 32 ] FAST STATS 2020 / British Columbia’s Agriculture, Food and Seafood Sector / JANUARY 2022
Livestock Prices
Species 2015 2016 2017 2018 2019 2020
5 Year Average
2015-2019
2020 vs. 2019
% Change
2020 vs. 5 Yr. Avg.
% ChangeCattle1 (Live $/cwt)
Feeder Steers (501-600 lb) 297.85 213.47 220.92 215.73 216.84 216.85 232.96 0.0% -6.9%
Feeder Steers (601-700 lb) 273.71 200.10 207.62 204.65 204.05 200.90 218.03 -1.5% -7.9%
Feeder Steers (701-800 lb) 252.15 185.76 194.15 191.82 192.41 187.06 203.26 -2.8% -8.0%
Feeder Steers (801-900 lb) 232.95 174.50 182.35 180.75 180.07 174.28 190.12 -3.2% -8.3%
Feeder Heifers (501-600 lb) 270.13 184.75 191.92 190.28 187.59 188.90 204.93 0.7% -7.8%
Feeder Heifers (601-700 lb) 249.78 175.94 183.78 182.89 179.57 179.57 194.39 0.0% -7.6%
D1,2 Cows2 125.16 92.36 90.51 83.71 82.50 80.01 94.85 -3.0% -15.6%
Bulls 147.36 113.81 104.78 98.33 99.28 102.74 112.71 3.5% -8.8%
Hogs 82.60 77.89 83.74 77.65 83.84 76.74 81.14 -8.5% -5.4%
Lambs 189.63 183.15 194.72 199.90 188.83 215.50 191.24 14.1% 12.7%
Dairy ($/litre) 0.79 0.80 0.79 0.78 0.81 0.82 0.80 1.2% 3.6%
Poultry3 (Live $/kg)
Chicken (< 1.4kg) 1.63 1.61 1.60 1.63 1.67 1.70 1.63 1.8% 4.4%
Chicken (1.4kg - 2.7kg) 1.64 1.63 1.61 1.64 1.68 1.71 1.64 1.8% 4.3%
Chicken (> 2.7kg) 1.67 1.65 1.64 1.67 1.71 1.74 1.67 1.8% 4.3%
Turkey (6.2kg and under) 1.97 1.94 1.94 1.99 1.98 1.99 1.97 0.5% 1.2%
Turkey (> 6.2kg but not > 8.5kg) 2.00 1.96 1.93 2.01 2.01 2.00 1.98 -0.5% 0.9%
Turkey (> 8.5kg but not > 10.8kg) 2.00 1.96 1.93 2.01 2.01 2.00 1.98 -0.5% 0.9%
Turkey (> 10.8kg but not > 13.3kg) 2.03 1.98 2.00 2.06 2.08 2.11 2.03 1.4% 3.9%
Turkey (> 13.3kg) 2.00 1.95 1.97 2.03 2.06 2.08 2.00 1.0% 3.9%
Eggs ($/doz.) 1.73 1.77 1.78 1.86 1.93 1.96 1.82 1.5% 7.7%
Source: Statistics Canada and Adapted from Statistics Canada Table: 32-10-0077-01, accessed Aug 11, 2021, unless otherwise specified 1 Source: Canfax, 2020 Annual Report 2 Canada’s grading system describes the predicted carcass value of live cows even though the cow carcasses have not been graded D1 cows have excellent muscling, with less than
15 mm of firm, white or amber coloured back fat D2 cows have medium to excellent muscling, with less than 15 mm of white to yellow back fat D3 cows have deficient muscling with less than 15 mm of back fat D4 cows have deficient to excellent muscling with greater than 15 mm of back fat D1 and D2 cows are predicted to have the highest carcass value
3 Source: Agriculture & Agri-food Canada (AAFC) Based on data provided by Provincial Marketing Boards, compiled by AAFC, Poultry Section (Accessed September 1, 2021)
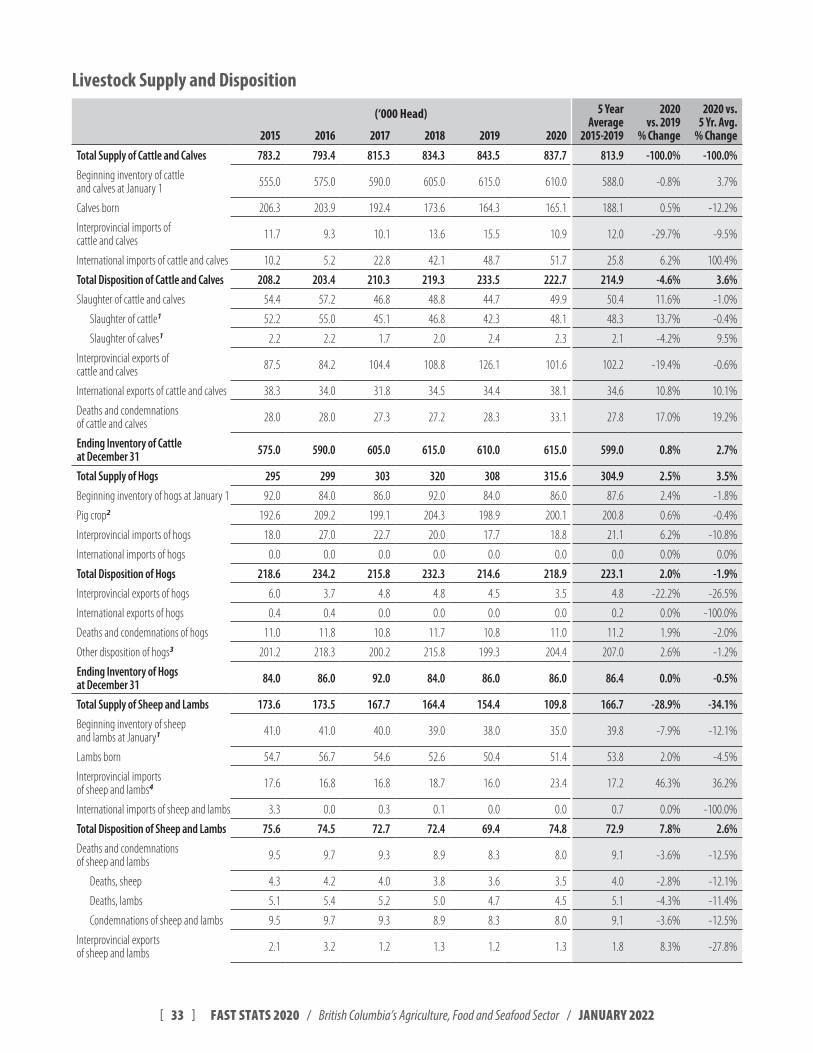
[ 33 ] FAST STATS 2020 / British Columbia’s Agriculture, Food and Seafood Sector / JANUARY 2022
Livestock Supply and Disposition
(‘000 Head) 5 Year Average
2015-2019
2020 vs. 2019
% Change
2020 vs. 5 Yr. Avg.
% Change2015 2016 2017 2018 2019 2020Total Supply of Cattle and Calves 783.2 793.4 815.3 834.3 843.5 837.7 813.9 -100.0% -100.0%
Beginning inventory of cattle and calves at January 1 555.0 575.0 590.0 605.0 615.0 610.0 588.0 -0.8% 3.7%
Calves born 206.3 203.9 192.4 173.6 164.3 165.1 188.1 0.5% -12.2%
Interprovincial imports of cattle and calves 11.7 9.3 10.1 13.6 15.5 10.9 12.0 -29.7% -9.5%
International imports of cattle and calves 10.2 5.2 22.8 42.1 48.7 51.7 25.8 6.2% 100.4%
Total Disposition of Cattle and Calves 208.2 203.4 210.3 219.3 233.5 222.7 214.9 -4.6% 3.6%
Slaughter of cattle and calves 54.4 57.2 46.8 48.8 44.7 49.9 50.4 11.6% -1.0%
Slaughter of cattle1 52.2 55.0 45.1 46.8 42.3 48.1 48.3 13.7% -0.4%
Slaughter of calves1 2.2 2.2 1.7 2.0 2.4 2.3 2.1 -4.2% 9.5%
Interprovincial exports of cattle and calves 87.5 84.2 104.4 108.8 126.1 101.6 102.2 -19.4% -0.6%
International exports of cattle and calves 38.3 34.0 31.8 34.5 34.4 38.1 34.6 10.8% 10.1%
Deaths and condemnations of cattle and calves 28.0 28.0 27.3 27.2 28.3 33.1 27.8 17.0% 19.2%
Ending Inventory of Cattle at December 31 575.0 590.0 605.0 615.0 610.0 615.0 599.0 0.8% 2.7%
Total Supply of Hogs 295 299 303 320 308 315.6 304.9 2.5% 3.5%
Beginning inventory of hogs at January 1 92.0 84.0 86.0 92.0 84.0 86.0 87.6 2.4% -1.8%
Pig crop2 192.6 209.2 199.1 204.3 198.9 200.1 200.8 0.6% -0.4%
Interprovincial imports of hogs 18.0 27.0 22.7 20.0 17.7 18.8 21.1 6.2% -10.8%
International imports of hogs 0.0 0.0 0.0 0.0 0.0 0.0 0.0 0.0% 0.0%
Total Disposition of Hogs 218.6 234.2 215.8 232.3 214.6 218.9 223.1 2.0% -1.9%
Interprovincial exports of hogs 6.0 3.7 4.8 4.8 4.5 3.5 4.8 -22.2% -26.5%
International exports of hogs 0.4 0.4 0.0 0.0 0.0 0.0 0.2 0.0% -100.0%
Deaths and condemnations of hogs 11.0 11.8 10.8 11.7 10.8 11.0 11.2 1.9% -2.0%
Other disposition of hogs3 201.2 218.3 200.2 215.8 199.3 204.4 207.0 2.6% -1.2%
Ending Inventory of Hogs at December 31 84.0 86.0 92.0 84.0 86.0 86.0 86.4 0.0% -0.5%
Total Supply of Sheep and Lambs 173.6 173.5 167.7 164.4 154.4 109.8 166.7 -28.9% -34.1%
Beginning inventory of sheep and lambs at January1 41.0 41.0 40.0 39.0 38.0 35.0 39.8 -7.9% -12.1%
Lambs born 54.7 56.7 54.6 52.6 50.4 51.4 53.8 2.0% -4.5%
Interprovincial imports of sheep and lambs4 17.6 16.8 16.8 18.7 16.0 23.4 17.2 46.3% 36.2%
International imports of sheep and lambs 3.3 0.0 0.3 0.1 0.0 0.0 0.7 0.0% -100.0%
Total Disposition of Sheep and Lambs 75.6 74.5 72.7 72.4 69.4 74.8 72.9 7.8% 2.6%
Deaths and condemnations of sheep and lambs 9.5 9.7 9.3 8.9 8.3 8.0 9.1 -3.6% -12.5%
Deaths, sheep 4.3 4.2 4.0 3.8 3.6 3.5 4.0 -2.8% -12.1%
Deaths, lambs 5.1 5.4 5.2 5.0 4.7 4.5 5.1 -4.3% -11.4%
Condemnations of sheep and lambs 9.5 9.7 9.3 8.9 8.3 8.0 9.1 -3.6% -12.5%
Interprovincial exports of sheep and lambs 2.1 3.2 1.2 1.3 1.2 1.3 1.8 8.3% -27.8%
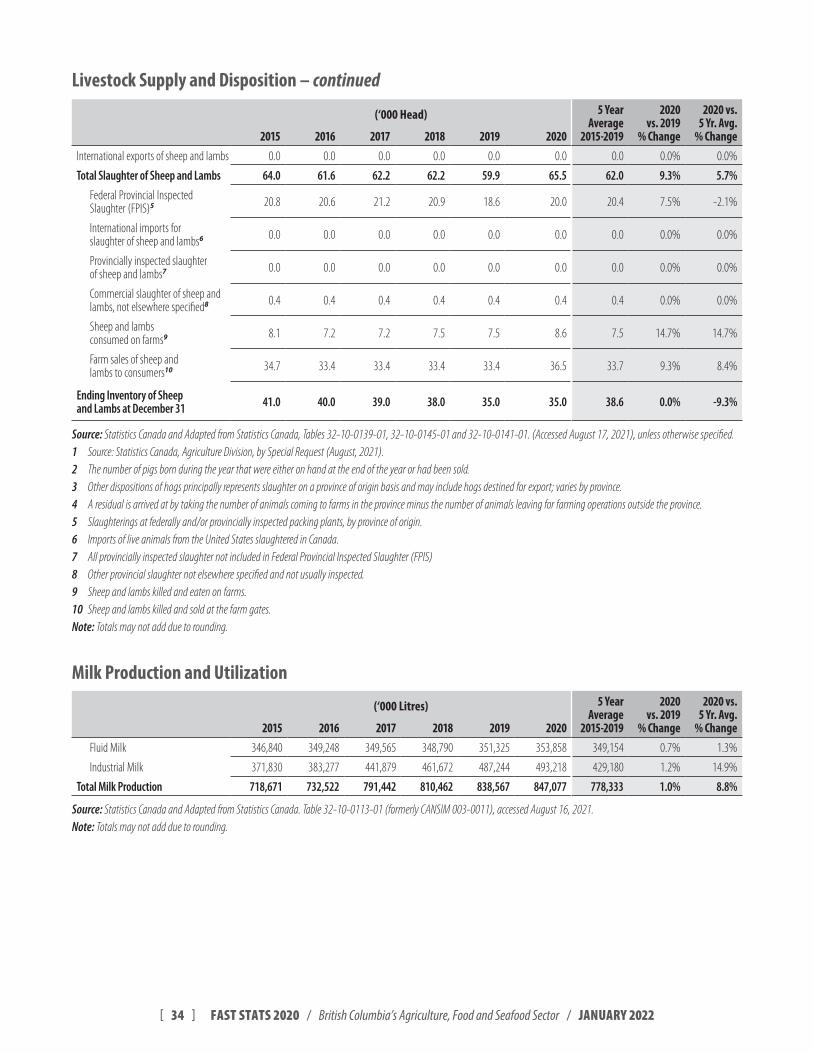
[ 34 ] FAST STATS 2020 / British Columbia’s Agriculture, Food and Seafood Sector / JANUARY 2022
(‘000 Head) 5 Year Average
2015-2019
2020 vs. 2019
% Change
2020 vs. 5 Yr. Avg.
% Change2015 2016 2017 2018 2019 2020International exports of sheep and lambs 0.0 0.0 0.0 0.0 0.0 0.0 0.0 0.0% 0.0%
Total Slaughter of Sheep and Lambs 64.0 61.6 62.2 62.2 59.9 65.5 62.0 9.3% 5.7%
Federal Provincial Inspected Slaughter (FPIS)5 20.8 20.6 21.2 20.9 18.6 20.0 20.4 7.5% -2.1%
International imports for slaughter of sheep and lambs6 0.0 0.0 0.0 0.0 0.0 0.0 0.0 0.0% 0.0%
Provincially inspected slaughter of sheep and lambs7 0.0 0.0 0.0 0.0 0.0 0.0 0.0 0.0% 0.0%
Commercial slaughter of sheep and lambs, not elsewhere specified8 0.4 0.4 0.4 0.4 0.4 0.4 0.4 0.0% 0.0%
Sheep and lambs consumed on farms9 8.1 7.2 7.2 7.5 7.5 8.6 7.5 14.7% 14.7%
Farm sales of sheep and lambs to consumers10 34.7 33.4 33.4 33.4 33.4 36.5 33.7 9.3% 8.4%
Ending Inventory of Sheep and Lambs at December 31 41.0 40.0 39.0 38.0 35.0 35.0 38.6 0.0% -9.3%
Source: Statistics Canada and Adapted from Statistics Canada, Tables 32-10-0139-01, 32-10-0145-01 and 32-10-0141-01 (Accessed August 17, 2021), unless otherwise specified 1 Source: Statistics Canada, Agriculture Division, by Special Request (August, 2021) 2 The number of pigs born during the year that were either on hand at the end of the year or had been sold 3 Other dispositions of hogs principally represents slaughter on a province of origin basis and may include hogs destined for export; varies by province 4 A residual is arrived at by taking the number of animals coming to farms in the province minus the number of animals leaving for farming operations outside the province 5 Slaughterings at federally and/or provincially inspected packing plants, by province of origin 6 Imports of live animals from the United States slaughtered in Canada 7 All provincially inspected slaughter not included in Federal Provincial Inspected Slaughter (FPIS)8 Other provincial slaughter not elsewhere specified and not usually inspected 9 Sheep and lambs killed and eaten on farms 10 Sheep and lambs killed and sold at the farm gates Note: Totals may not add due to rounding
Milk Production and Utilization
(‘000 Litres) 5 Year Average
2015-2019
2020 vs. 2019
% Change
2020 vs. 5 Yr. Avg.
% Change2015 2016 2017 2018 2019 2020Fluid Milk 346,840 349,248 349,565 348,790 351,325 353,858 349,154 0.7% 1.3%
Industrial Milk 371,830 383,277 441,879 461,672 487,244 493,218 429,180 1.2% 14.9%
Total Milk Production 718,671 732,522 791,442 810,462 838,567 847,077 778,333 1.0% 8.8%
Source: Statistics Canada and Adapted from Statistics Canada Table 32-10-0113-01 (formerly CANSIM 003-0011), accessed August 16, 2021 Note: Totals may not add due to rounding
Livestock Supply and Disposition – continued
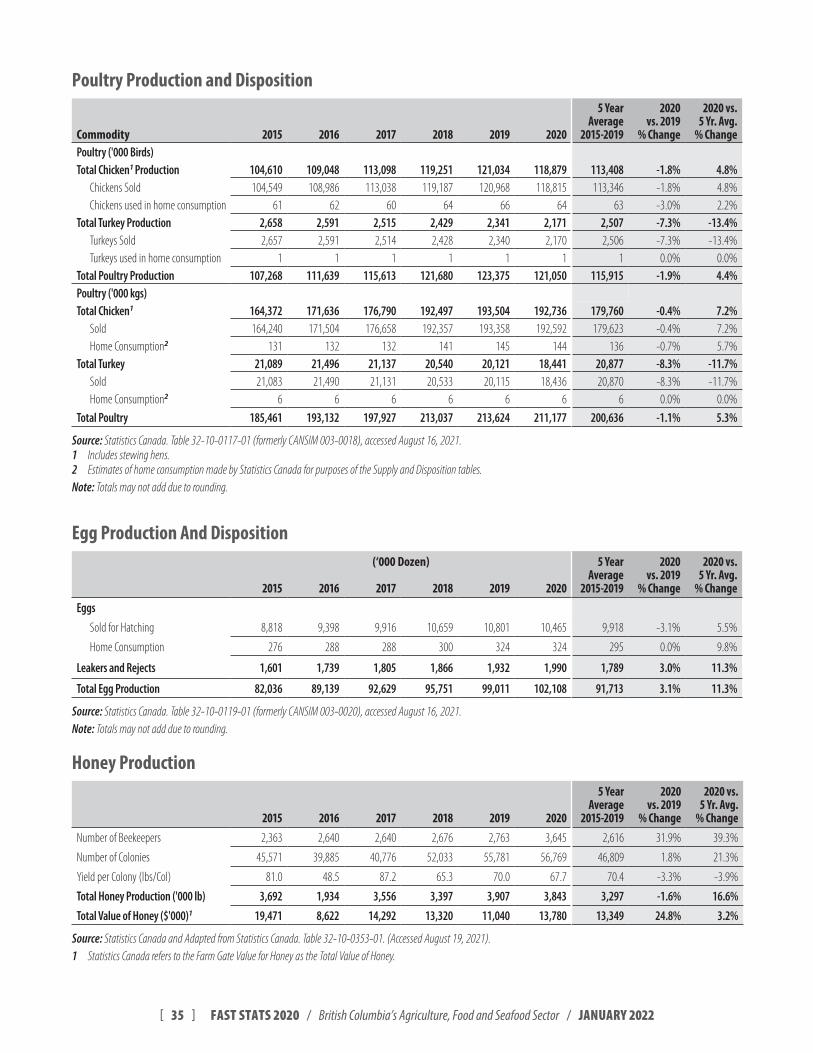
[ 35 ] FAST STATS 2020 / British Columbia’s Agriculture, Food and Seafood Sector / JANUARY 2022
Poultry Production and Disposition
Commodity 2015 2016 2017 2018 2019 2020
5 Year Average
2015-2019
2020 vs. 2019
% Change
2020 vs. 5 Yr. Avg.
% ChangePoultry ('000 Birds)Total Chicken1 Production 104,610 109,048 113,098 119,251 121,034 118,879 113,408 -1.8% 4.8%
Chickens Sold 104,549 108,986 113,038 119,187 120,968 118,815 113,346 -1.8% 4.8%Chickens used in home consumption 61 62 60 64 66 64 63 -3.0% 2.2%
Total Turkey Production 2,658 2,591 2,515 2,429 2,341 2,171 2,507 -7.3% -13.4%Turkeys Sold 2,657 2,591 2,514 2,428 2,340 2,170 2,506 -7.3% -13.4%Turkeys used in home consumption 1 1 1 1 1 1 1 0.0% 0.0%
Total Poultry Production 107,268 111,639 115,613 121,680 123,375 121,050 115,915 -1.9% 4.4%Poultry ('000 kgs)Total Chicken1 164,372 171,636 176,790 192,497 193,504 192,736 179,760 -0.4% 7.2%
Sold 164,240 171,504 176,658 192,357 193,358 192,592 179,623 -0.4% 7.2%Home Consumption2 131 132 132 141 145 144 136 -0.7% 5.7%
Total Turkey 21,089 21,496 21,137 20,540 20,121 18,441 20,877 -8.3% -11.7%Sold 21,083 21,490 21,131 20,533 20,115 18,436 20,870 -8.3% -11.7%Home Consumption2 6 6 6 6 6 6 6 0.0% 0.0%
Total Poultry 185,461 193,132 197,927 213,037 213,624 211,177 200,636 -1.1% 5.3%
Source: Statistics Canada Table 32-10-0117-01 (formerly CANSIM 003-0018), accessed August 16, 2021 1 Includes stewing hens 2 Estimates of home consumption made by Statistics Canada for purposes of the Supply and Disposition tables Note: Totals may not add due to rounding
Egg Production And Disposition(‘000 Dozen) 5 Year
Average2015-2019
2020 vs. 2019
% Change
2020 vs. 5 Yr. Avg.
% Change2015 2016 2017 2018 2019 2020Eggs
Sold for Hatching 8,818 9,398 9,916 10,659 10,801 10,465 9,918 -3.1% 5.5%
Home Consumption 276 288 288 300 324 324 295 0.0% 9.8%
Leakers and Rejects 1,601 1,739 1,805 1,866 1,932 1,990 1,789 3.0% 11.3%
Total Egg Production 82,036 89,139 92,629 95,751 99,011 102,108 91,713 3.1% 11.3%
Source: Statistics Canada Table 32-10-0119-01 (formerly CANSIM 003-0020), accessed August 16, 2021 Note: Totals may not add due to rounding
Honey Production
2015 2016 2017 2018 2019 2020
5 Year Average
2015-2019
2020 vs. 2019
% Change
2020 vs. 5 Yr. Avg.
% ChangeNumber of Beekeepers 2,363 2,640 2,640 2,676 2,763 3,645 2,616 31.9% 39.3%
Number of Colonies 45,571 39,885 40,776 52,033 55,781 56,769 46,809 1.8% 21.3%
Yield per Colony (lbs/Col) 81.0 48.5 87.2 65.3 70.0 67.7 70.4 -3.3% -3.9%
Total Honey Production ('000 lb) 3,692 1,934 3,556 3,397 3,907 3,843 3,297 -1.6% 16.6%
Total Value of Honey ($'000)1 19,471 8,622 14,292 13,320 11,040 13,780 13,349 24.8% 3.2%
Source: Statistics Canada and Adapted from Statistics Canada Table 32-10-0353-01 (Accessed August 19, 2021) 1 Statistics Canada refers to the Farm Gate Value for Honey as the Total Value of Honey
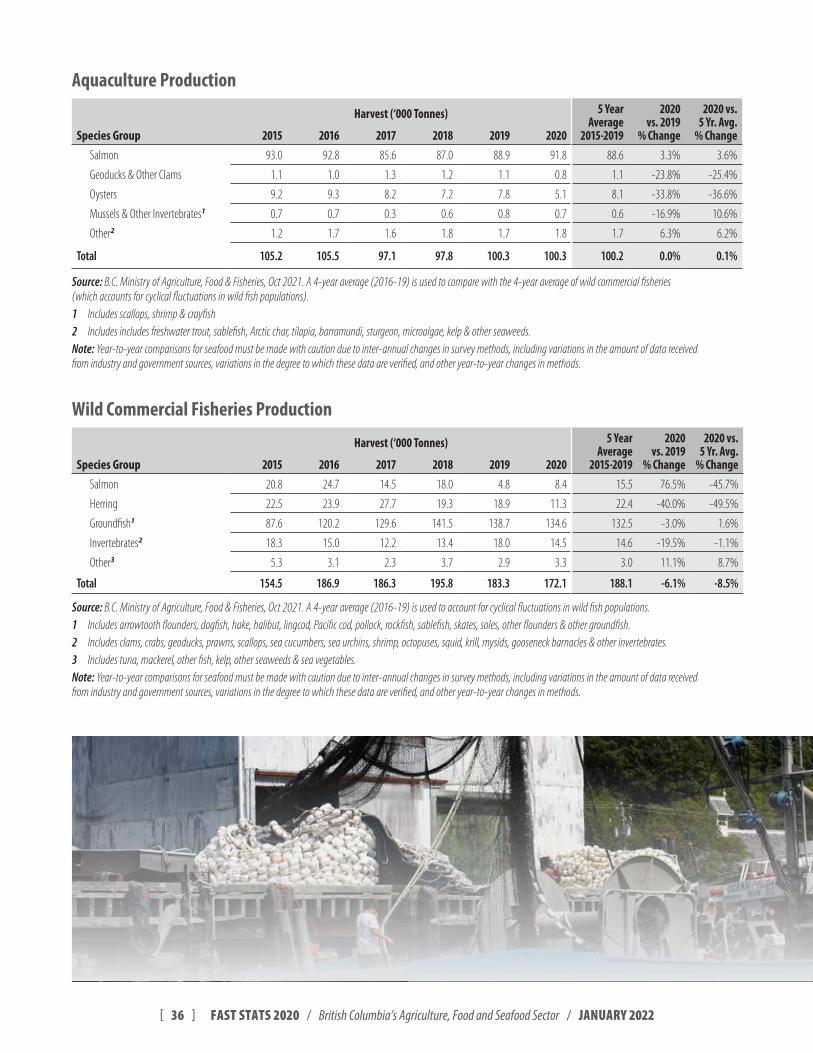
[ 36 ] FAST STATS 2020 / British Columbia’s Agriculture, Food and Seafood Sector / JANUARY 2022
Aquaculture Production
Harvest (‘000 Tonnes) 5 Year Average
2015-2019
2020 vs. 2019
% Change
2020 vs. 5 Yr. Avg.
% ChangeSpecies Group 2015 2016 2017 2018 2019 2020Salmon 93.0 92.8 85.6 87.0 88.9 91.8 88.6 3.3% 3.6%
Geoducks & Other Clams 1.1 1.0 1.3 1.2 1.1 0.8 1.1 -23.8% -25.4%
Oysters 9.2 9.3 8.2 7.2 7.8 5.1 8.1 -33.8% -36.6%
Mussels & Other Invertebrates1 0.7 0.7 0.3 0.6 0.8 0.7 0.6 -16.9% 10.6%
Other2 1.2 1.7 1.6 1.8 1.7 1.8 1.7 6.3% 6.2%
Total 105.2 105.5 97.1 97.8 100.3 100.3 100.2 0.0% 0.1%
Source: B C Ministry of Agriculture, Food & Fisheries, Oct 2021 A 4-year average (2016-19) is used to compare with the 4-year average of wild commercial fisheries (which accounts for cyclical fluctuations in wild fish populations) 1 Includes scallops, shrimp & crayfish2 Includes includes freshwater trout, sablefish, Arctic char, tilapia, barramundi, sturgeon, microalgae, kelp & other seaweeds Note: Year-to-year comparisons for seafood must be made with caution due to inter-annual changes in survey methods, including variations in the amount of data received from industry and government sources, variations in the degree to which these data are verified, and other year-to-year changes in methods
Wild Commercial Fisheries Production
Harvest (‘000 Tonnes) 5 Year Average
2015-2019
2020 vs. 2019
% Change
2020 vs. 5 Yr. Avg.
% ChangeSpecies Group 2015 2016 2017 2018 2019 2020Salmon 20.8 24.7 14.5 18.0 4.8 8.4 15.5 76.5% -45.7%
Herring 22.5 23.9 27.7 19.3 18.9 11.3 22.4 -40.0% -49.5%
Groundfish1 87.6 120.2 129.6 141.5 138.7 134.6 132.5 -3.0% 1.6%
Invertebrates2 18.3 15.0 12.2 13.4 18.0 14.5 14.6 -19.5% -1.1%
Other3 5.3 3.1 2.3 3.7 2.9 3.3 3.0 11.1% 8.7%
Total 154.5 186.9 186.3 195.8 183.3 172.1 188.1 -6.1% -8.5%
Source: B C Ministry of Agriculture, Food & Fisheries, Oct 2021 A 4-year average (2016-19) is used to account for cyclical fluctuations in wild fish populations 1 Includes arrowtooth flounders, dogfish, hake, halibut, lingcod, Pacific cod, pollock, rockfish, sablefish, skates, soles, other flounders & other groundfish 2 Includes clams, crabs, geoducks, prawns, scallops, sea cucumbers, sea urchins, shrimp, octopuses, squid, krill, mysids, gooseneck barnacles & other invertebrates 3 Includes tuna, mackerel, other fish, kelp, other seaweeds & sea vegetables Note: Year-to-year comparisons for seafood must be made with caution due to inter-annual changes in survey methods, including variations in the amount of data received from industry and government sources, variations in the degree to which these data are verified, and other year-to-year changes in methods
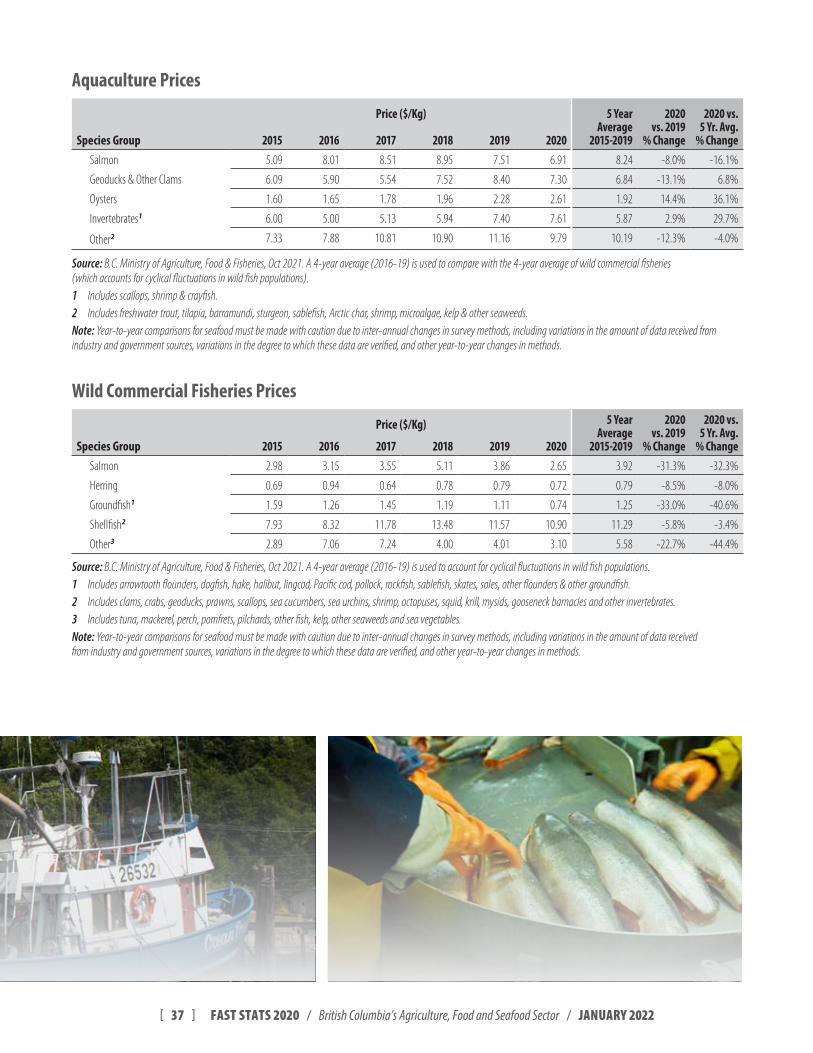
[ 37 ] FAST STATS 2020 / British Columbia’s Agriculture, Food and Seafood Sector / JANUARY 2022
Aquaculture Prices
Price ($/Kg) 5 Year Average
2015-2019
2020 vs. 2019
% Change
2020 vs. 5 Yr. Avg.
% ChangeSpecies Group 2015 2016 2017 2018 2019 2020Salmon 5.09 8.01 8.51 8.95 7.51 6.91 8.24 -8.0% -16.1%
Geoducks & Other Clams 6.09 5.90 5.54 7.52 8.40 7.30 6.84 -13.1% 6.8%
Oysters 1.60 1.65 1.78 1.96 2.28 2.61 1.92 14.4% 36.1%
Invertebrates1 6.00 5.00 5.13 5.94 7.40 7.61 5.87 2.9% 29.7%
Other2 7.33 7.88 10.81 10.90 11.16 9.79 10.19 -12.3% -4.0%
Source: B C Ministry of Agriculture, Food & Fisheries, Oct 2021 A 4-year average (2016-19) is used to compare with the 4-year average of wild commercial fisheries (which accounts for cyclical fluctuations in wild fish populations) 1 Includes scallops, shrimp & crayfish 2 Includes freshwater trout, tilapia, barramundi, sturgeon, sablefish, Arctic char, shrimp, microalgae, kelp & other seaweeds Note: Year-to-year comparisons for seafood must be made with caution due to inter-annual changes in survey methods, including variations in the amount of data received from industry and government sources, variations in the degree to which these data are verified, and other year-to-year changes in methods
Wild Commercial Fisheries Prices
Price ($/Kg) 5 Year Average
2015-2019
2020 vs. 2019
% Change
2020 vs. 5 Yr. Avg.
% ChangeSpecies Group 2015 2016 2017 2018 2019 2020Salmon 2.98 3.15 3.55 5.11 3.86 2.65 3.92 -31.3% -32.3%
Herring 0.69 0.94 0.64 0.78 0.79 0.72 0.79 -8.5% -8.0%
Groundfish1 1.59 1.26 1.45 1.19 1.11 0.74 1.25 -33.0% -40.6%
Shellfish2 7.93 8.32 11.78 13.48 11.57 10.90 11.29 -5.8% -3.4%
Other3 2.89 7.06 7.24 4.00 4.01 3.10 5.58 -22.7% -44.4%
Source: B C Ministry of Agriculture, Food & Fisheries, Oct 2021 A 4-year average (2016-19) is used to account for cyclical fluctuations in wild fish populations 1 Includes arrowtooth flounders, dogfish, hake, halibut, lingcod, Pacific cod, pollock, rockfish, sablefish, skates, soles, other flounders & other groundfish 2 Includes clams, crabs, geoducks, prawns, scallops, sea cucumbers, sea urchins, shrimp, octopuses, squid, krill, mysids, gooseneck barnacles and other invertebrates 3 Includes tuna, mackerel, perch, pomfrets, pilchards, other fish, kelp, other seaweeds and sea vegetables Note: Year-to-year comparisons for seafood must be made with caution due to inter-annual changes in survey methods, including variations in the amount of data received from industry and government sources, variations in the degree to which these data are verified, and other year-to-year changes in methods
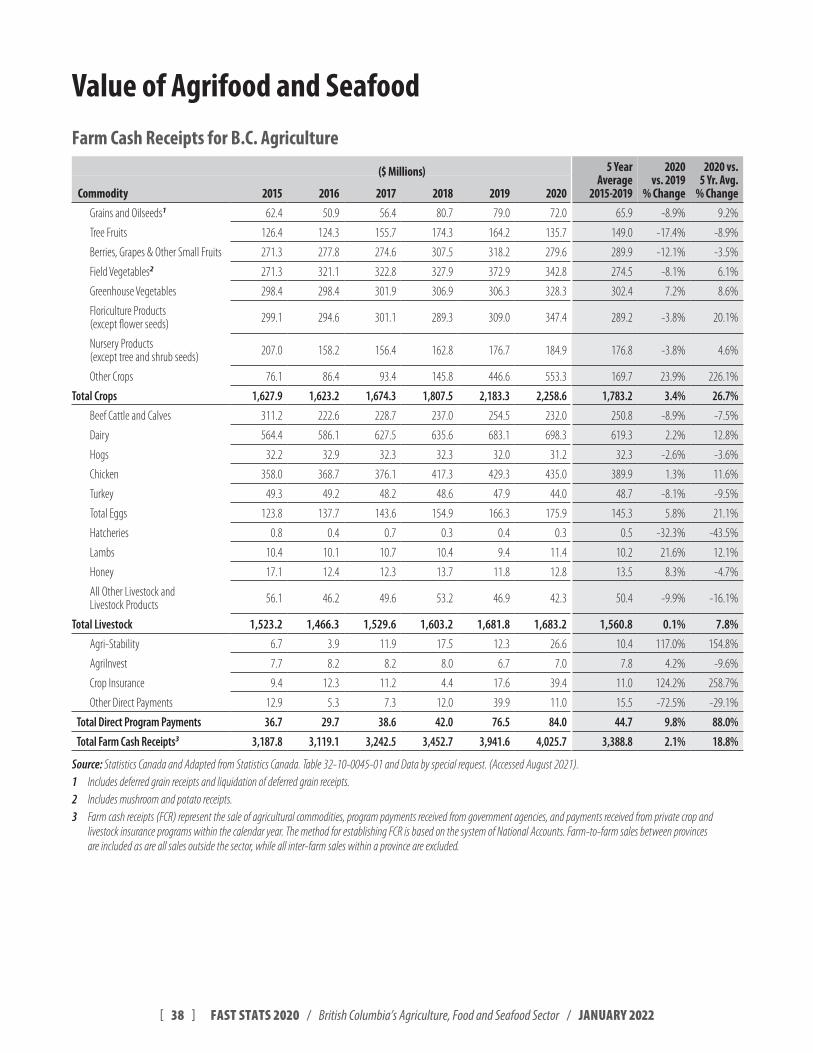
[ 38 ] FAST STATS 2020 / British Columbia’s Agriculture, Food and Seafood Sector / JANUARY 2022
Value of Agrifood and SeafoodFarm Cash Receipts for B.C. Agriculture
($ Millions) 5 Year Average
2015-2019
2020 vs. 2019
% Change
2020 vs. 5 Yr. Avg.
% ChangeCommodity 2015 2016 2017 2018 2019 2020Grains and Oilseeds1 62.4 50.9 56.4 80.7 79.0 72.0 65.9 -8.9% 9.2%
Tree Fruits 126.4 124.3 155.7 174.3 164.2 135.7 149.0 -17.4% -8.9%
Berries, Grapes & Other Small Fruits 271.3 277.8 274.6 307.5 318.2 279.6 289.9 -12.1% -3.5%
Field Vegetables2 271.3 321.1 322.8 327.9 372.9 342.8 274.5 -8.1% 6.1%
Greenhouse Vegetables 298.4 298.4 301.9 306.9 306.3 328.3 302.4 7.2% 8.6%
Floriculture Products (except flower seeds) 299.1 294.6 301.1 289.3 309.0 347.4 289.2 -3.8% 20.1%
Nursery Products (except tree and shrub seeds) 207.0 158.2 156.4 162.8 176.7 184.9 176.8 -3.8% 4.6%
Other Crops 76.1 86.4 93.4 145.8 446.6 553.3 169.7 23.9% 226.1%
Total Crops 1,627.9 1,623.2 1,674.3 1,807.5 2,183.3 2,258.6 1,783.2 3.4% 26.7%
Beef Cattle and Calves 311.2 222.6 228.7 237.0 254.5 232.0 250.8 -8.9% -7.5%
Dairy 564.4 586.1 627.5 635.6 683.1 698.3 619.3 2.2% 12.8%
Hogs 32.2 32.9 32.3 32.3 32.0 31.2 32.3 -2.6% -3.6%
Chicken 358.0 368.7 376.1 417.3 429.3 435.0 389.9 1.3% 11.6%
Turkey 49.3 49.2 48.2 48.6 47.9 44.0 48.7 -8.1% -9.5%
Total Eggs 123.8 137.7 143.6 154.9 166.3 175.9 145.3 5.8% 21.1%
Hatcheries 0.8 0.4 0.7 0.3 0.4 0.3 0.5 -32.3% -43.5%
Lambs 10.4 10.1 10.7 10.4 9.4 11.4 10.2 21.6% 12.1%
Honey 17.1 12.4 12.3 13.7 11.8 12.8 13.5 8.3% -4.7%
All Other Livestock and Livestock Products 56.1 46.2 49.6 53.2 46.9 42.3 50.4 -9.9% -16.1%
Total Livestock 1,523.2 1,466.3 1,529.6 1,603.2 1,681.8 1,683.2 1,560.8 0.1% 7.8%
Agri-Stability 6.7 3.9 11.9 17.5 12.3 26.6 10.4 117.0% 154.8%
AgriInvest 7.7 8.2 8.2 8.0 6.7 7.0 7.8 4.2% -9.6%
Crop Insurance 9.4 12.3 11.2 4.4 17.6 39.4 11.0 124.2% 258.7%
Other Direct Payments 12.9 5.3 7.3 12.0 39.9 11.0 15.5 -72.5% -29.1%
Total Direct Program Payments 36.7 29.7 38.6 42.0 76.5 84.0 44.7 9.8% 88.0%
Total Farm Cash Receipts3 3,187.8 3,119.1 3,242.5 3,452.7 3,941.6 4,025.7 3,388.8 2.1% 18.8%
Source: Statistics Canada and Adapted from Statistics Canada Table 32-10-0045-01 and Data by special request (Accessed August 2021) 1 Includes deferred grain receipts and liquidation of deferred grain receipts 2 Includes mushroom and potato receipts 3 Farm cash receipts (FCR) represent the sale of agricultural commodities, program payments received from government agencies, and payments received from private crop and
livestock insurance programs within the calendar year The method for establishing FCR is based on the system of National Accounts Farm-to-farm sales between provinces are included as are all sales outside the sector, while all inter-farm sales within a province are excluded
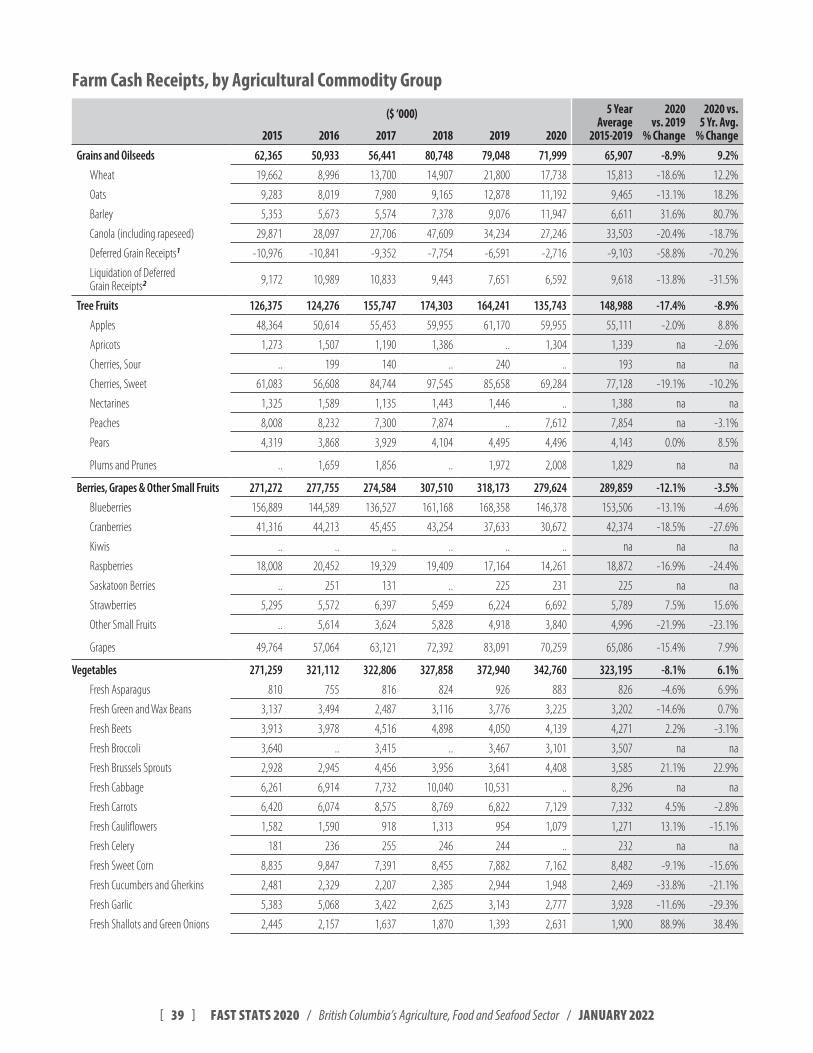
[ 39 ] FAST STATS 2020 / British Columbia’s Agriculture, Food and Seafood Sector / JANUARY 2022
Farm Cash Receipts, by Agricultural Commodity Group
($ ‘000) 5 Year Average
2015-2019
2020 vs. 2019
% Change
2020 vs. 5 Yr. Avg.
% Change2015 2016 2017 2018 2019 2020Grains and Oilseeds 62,365 50,933 56,441 80,748 79,048 71,999 65,907 -8.9% 9.2%
Wheat 19,662 8,996 13,700 14,907 21,800 17,738 15,813 -18.6% 12.2%
Oats 9,283 8,019 7,980 9,165 12,878 11,192 9,465 -13.1% 18.2%
Barley 5,353 5,673 5,574 7,378 9,076 11,947 6,611 31.6% 80.7%
Canola (including rapeseed) 29,871 28,097 27,706 47,609 34,234 27,246 33,503 -20.4% -18.7%
Deferred Grain Receipts1 -10,976 -10,841 -9,352 -7,754 -6,591 -2,716 -9,103 -58.8% -70.2%
Liquidation of Deferred Grain Receipts2 9,172 10,989 10,833 9,443 7,651 6,592 9,618 -13.8% -31.5%
Tree Fruits 126,375 124,276 155,747 174,303 164,241 135,743 148,988 -17.4% -8.9%
Apples 48,364 50,614 55,453 59,955 61,170 59,955 55,111 -2.0% 8.8%
Apricots 1,273 1,507 1,190 1,386 .. 1,304 1,339 na -2.6%
Cherries, Sour .. 199 140 .. 240 .. 193 na na
Cherries, Sweet 61,083 56,608 84,744 97,545 85,658 69,284 77,128 -19.1% -10.2%
Nectarines 1,325 1,589 1,135 1,443 1,446 .. 1,388 na na
Peaches 8,008 8,232 7,300 7,874 .. 7,612 7,854 na -3.1%
Pears 4,319 3,868 3,929 4,104 4,495 4,496 4,143 0.0% 8.5%
Plums and Prunes .. 1,659 1,856 .. 1,972 2,008 1,829 na na
Berries, Grapes & Other Small Fruits 271,272 277,755 274,584 307,510 318,173 279,624 289,859 -12.1% -3.5%
Blueberries 156,889 144,589 136,527 161,168 168,358 146,378 153,506 -13.1% -4.6%
Cranberries 41,316 44,213 45,455 43,254 37,633 30,672 42,374 -18.5% -27.6%
Kiwis .. .. .. .. .. .. na na na
Raspberries 18,008 20,452 19,329 19,409 17,164 14,261 18,872 -16.9% -24.4%
Saskatoon Berries .. 251 131 .. 225 231 225 na na
Strawberries 5,295 5,572 6,397 5,459 6,224 6,692 5,789 7.5% 15.6%
Other Small Fruits .. 5,614 3,624 5,828 4,918 3,840 4,996 -21.9% -23.1%
Grapes 49,764 57,064 63,121 72,392 83,091 70,259 65,086 -15.4% 7.9%
Vegetables 271,259 321,112 322,806 327,858 372,940 342,760 323,195 -8.1% 6.1%
Fresh Asparagus 810 755 816 824 926 883 826 -4.6% 6.9%
Fresh Green and Wax Beans 3,137 3,494 2,487 3,116 3,776 3,225 3,202 -14.6% 0.7%
Fresh Beets 3,913 3,978 4,516 4,898 4,050 4,139 4,271 2.2% -3.1%
Fresh Broccoli 3,640 .. 3,415 .. 3,467 3,101 3,507 na na
Fresh Brussels Sprouts 2,928 2,945 4,456 3,956 3,641 4,408 3,585 21.1% 22.9%
Fresh Cabbage 6,261 6,914 7,732 10,040 10,531 .. 8,296 na na
Fresh Carrots 6,420 6,074 8,575 8,769 6,822 7,129 7,332 4.5% -2.8%
Fresh Cauliflowers 1,582 1,590 918 1,313 954 1,079 1,271 13.1% -15.1%
Fresh Celery 181 236 255 246 244 .. 232 na na
Fresh Sweet Corn 8,835 9,847 7,391 8,455 7,882 7,162 8,482 -9.1% -15.6%
Fresh Cucumbers and Gherkins 2,481 2,329 2,207 2,385 2,944 1,948 2,469 -33.8% -21.1%
Fresh Garlic 5,383 5,068 3,422 2,625 3,143 2,777 3,928 -11.6% -29.3%
Fresh Shallots and Green Onions 2,445 2,157 1,637 1,870 1,393 2,631 1,900 88.9% 38.4%
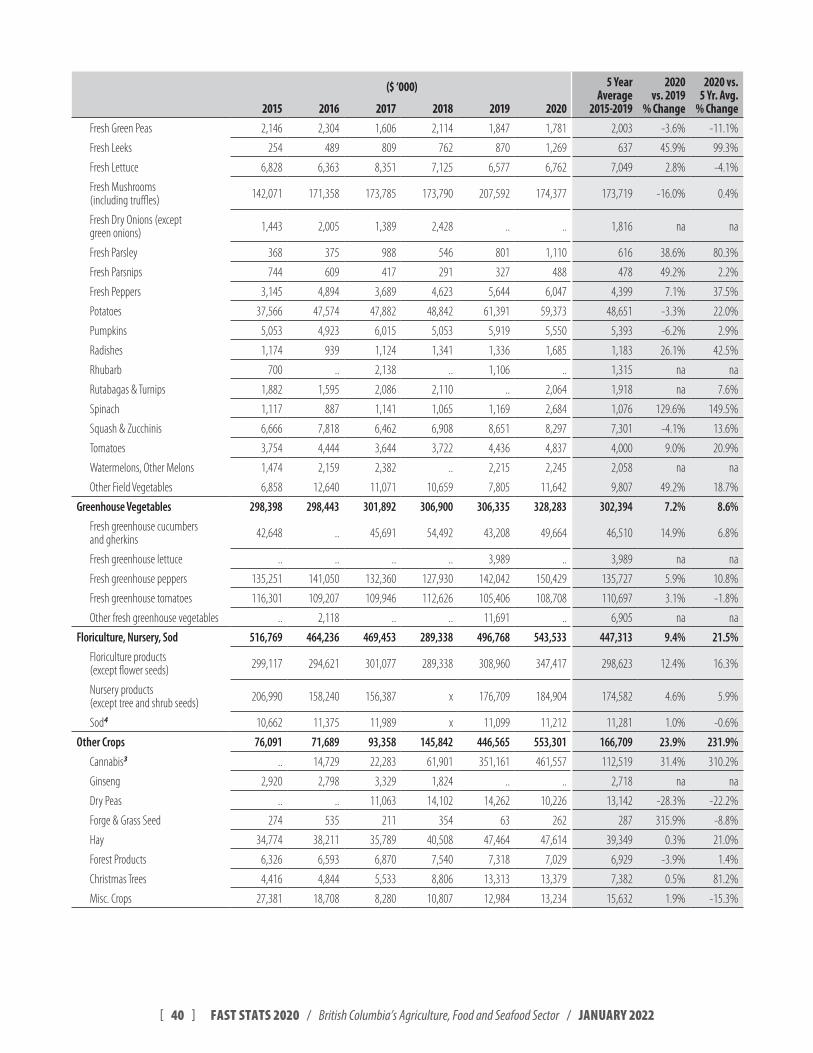
[ 40 ] FAST STATS 2020 / British Columbia’s Agriculture, Food and Seafood Sector / JANUARY 2022
($ ‘000) 5 Year Average
2015-2019
2020 vs. 2019
% Change
2020 vs. 5 Yr. Avg.
% Change2015 2016 2017 2018 2019 2020Fresh Green Peas 2,146 2,304 1,606 2,114 1,847 1,781 2,003 -3.6% -11.1%
Fresh Leeks 254 489 809 762 870 1,269 637 45.9% 99.3%
Fresh Lettuce 6,828 6,363 8,351 7,125 6,577 6,762 7,049 2.8% -4.1%
Fresh Mushrooms (including truffles) 142,071 171,358 173,785 173,790 207,592 174,377 173,719 -16.0% 0.4%
Fresh Dry Onions (except green onions) 1,443 2,005 1,389 2,428 .. .. 1,816 na na
Fresh Parsley 368 375 988 546 801 1,110 616 38.6% 80.3%
Fresh Parsnips 744 609 417 291 327 488 478 49.2% 2.2%
Fresh Peppers 3,145 4,894 3,689 4,623 5,644 6,047 4,399 7.1% 37.5%
Potatoes 37,566 47,574 47,882 48,842 61,391 59,373 48,651 -3.3% 22.0%
Pumpkins 5,053 4,923 6,015 5,053 5,919 5,550 5,393 -6.2% 2.9%
Radishes 1,174 939 1,124 1,341 1,336 1,685 1,183 26.1% 42.5%
Rhubarb 700 .. 2,138 .. 1,106 .. 1,315 na na
Rutabagas & Turnips 1,882 1,595 2,086 2,110 .. 2,064 1,918 na 7.6%
Spinach 1,117 887 1,141 1,065 1,169 2,684 1,076 129.6% 149.5%
Squash & Zucchinis 6,666 7,818 6,462 6,908 8,651 8,297 7,301 -4.1% 13.6%
Tomatoes 3,754 4,444 3,644 3,722 4,436 4,837 4,000 9.0% 20.9%
Watermelons, Other Melons 1,474 2,159 2,382 .. 2,215 2,245 2,058 na na
Other Field Vegetables 6,858 12,640 11,071 10,659 7,805 11,642 9,807 49.2% 18.7%
Greenhouse Vegetables 298,398 298,443 301,892 306,900 306,335 328,283 302,394 7.2% 8.6%
Fresh greenhouse cucumbers and gherkins 42,648 .. 45,691 54,492 43,208 49,664 46,510 14.9% 6.8%
Fresh greenhouse lettuce .. .. .. .. 3,989 .. 3,989 na na
Fresh greenhouse peppers 135,251 141,050 132,360 127,930 142,042 150,429 135,727 5.9% 10.8%
Fresh greenhouse tomatoes 116,301 109,207 109,946 112,626 105,406 108,708 110,697 3.1% -1.8%
Other fresh greenhouse vegetables .. 2,118 .. .. 11,691 .. 6,905 na na
Floriculture, Nursery, Sod 516,769 464,236 469,453 289,338 496,768 543,533 447,313 9.4% 21.5%
Floriculture products (except flower seeds) 299,117 294,621 301,077 289,338 308,960 347,417 298,623 12.4% 16.3%
Nursery products (except tree and shrub seeds) 206,990 158,240 156,387 x 176,709 184,904 174,582 4.6% 5.9%
Sod4 10,662 11,375 11,989 x 11,099 11,212 11,281 1.0% -0.6%
Other Crops 76,091 71,689 93,358 145,842 446,565 553,301 166,709 23.9% 231.9%
Cannabis3 .. 14,729 22,283 61,901 351,161 461,557 112,519 31.4% 310.2%
Ginseng 2,920 2,798 3,329 1,824 .. .. 2,718 na na
Dry Peas .. .. 11,063 14,102 14,262 10,226 13,142 -28.3% -22.2%
Forge & Grass Seed 274 535 211 354 63 262 287 315.9% -8.8%
Hay 34,774 38,211 35,789 40,508 47,464 47,614 39,349 0.3% 21.0%
Forest Products 6,326 6,593 6,870 7,540 7,318 7,029 6,929 -3.9% 1.4%
Christmas Trees 4,416 4,844 5,533 8,806 13,313 13,379 7,382 0.5% 81.2%
Misc. Crops 27,381 18,708 8,280 10,807 12,984 13,234 15,632 1.9% -15.3%
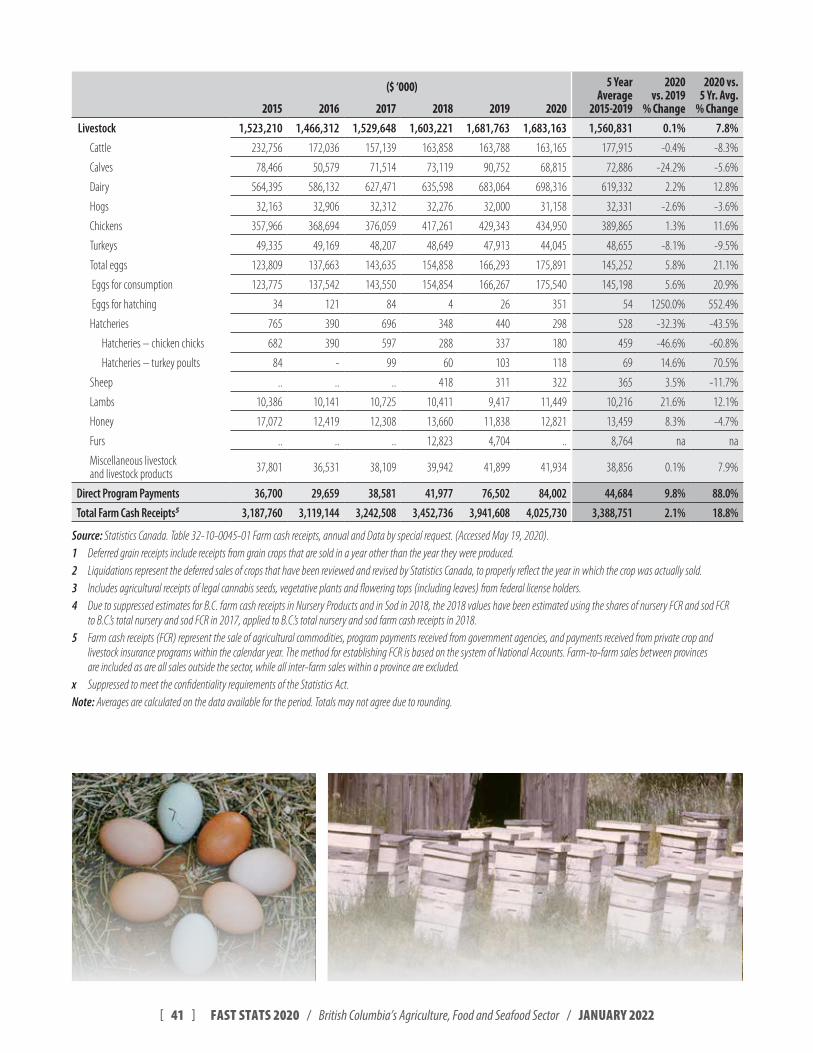
[ 41 ] FAST STATS 2020 / British Columbia’s Agriculture, Food and Seafood Sector / JANUARY 2022
($ ‘000) 5 Year Average
2015-2019
2020 vs. 2019
% Change
2020 vs. 5 Yr. Avg.
% Change2015 2016 2017 2018 2019 2020Livestock 1,523,210 1,466,312 1,529,648 1,603,221 1,681,763 1,683,163 1,560,831 0.1% 7.8%
Cattle 232,756 172,036 157,139 163,858 163,788 163,165 177,915 -0.4% -8.3%
Calves 78,466 50,579 71,514 73,119 90,752 68,815 72,886 -24.2% -5.6%
Dairy 564,395 586,132 627,471 635,598 683,064 698,316 619,332 2.2% 12.8%
Hogs 32,163 32,906 32,312 32,276 32,000 31,158 32,331 -2.6% -3.6%
Chickens 357,966 368,694 376,059 417,261 429,343 434,950 389,865 1.3% 11.6%
Turkeys 49,335 49,169 48,207 48,649 47,913 44,045 48,655 -8.1% -9.5%
Total eggs 123,809 137,663 143,635 154,858 166,293 175,891 145,252 5.8% 21.1%
Eggs for consumption 123,775 137,542 143,550 154,854 166,267 175,540 145,198 5.6% 20.9%
Eggs for hatching 34 121 84 4 26 351 54 1250.0% 552.4%
Hatcheries 765 390 696 348 440 298 528 -32.3% -43.5%
Hatcheries – chicken chicks 682 390 597 288 337 180 459 -46.6% -60.8%
Hatcheries – turkey poults 84 - 99 60 103 118 69 14.6% 70.5%
Sheep .. .. .. 418 311 322 365 3.5% -11.7%
Lambs 10,386 10,141 10,725 10,411 9,417 11,449 10,216 21.6% 12.1%
Honey 17,072 12,419 12,308 13,660 11,838 12,821 13,459 8.3% -4.7%
Furs .. .. .. 12,823 4,704 .. 8,764 na na
Miscellaneous livestock and livestock products 37,801 36,531 38,109 39,942 41,899 41,934 38,856 0.1% 7.9%
Direct Program Payments 36,700 29,659 38,581 41,977 76,502 84,002 44,684 9.8% 88.0%
Total Farm Cash Receipts5 3,187,760 3,119,144 3,242,508 3,452,736 3,941,608 4,025,730 3,388,751 2.1% 18.8%
Source: Statistics Canada Table 32-10-0045-01 Farm cash receipts, annual and Data by special request (Accessed May 19, 2020) 1 Deferred grain receipts include receipts from grain crops that are sold in a year other than the year they were produced 2 Liquidations represent the deferred sales of crops that have been reviewed and revised by Statistics Canada, to properly reflect the year in which the crop was actually sold 3 Includes agricultural receipts of legal cannabis seeds, vegetative plants and flowering tops (including leaves) from federal license holders 4 Due to suppressed estimates for B C farm cash receipts in Nursery Products and in Sod in 2018, the 2018 values have been estimated using the shares of nursery FCR and sod FCR
to B C ’s total nursery and sod FCR in 2017, applied to B C ’s total nursery and sod farm cash receipts in 2018 5 Farm cash receipts (FCR) represent the sale of agricultural commodities, program payments received from government agencies, and payments received from private crop and
livestock insurance programs within the calendar year The method for establishing FCR is based on the system of National Accounts Farm-to-farm sales between provinces are included as are all sales outside the sector, while all inter-farm sales within a province are excluded
x Suppressed to meet the confidentiality requirements of the Statistics Act Note: Averages are calculated on the data available for the period Totals may not agree due to rounding
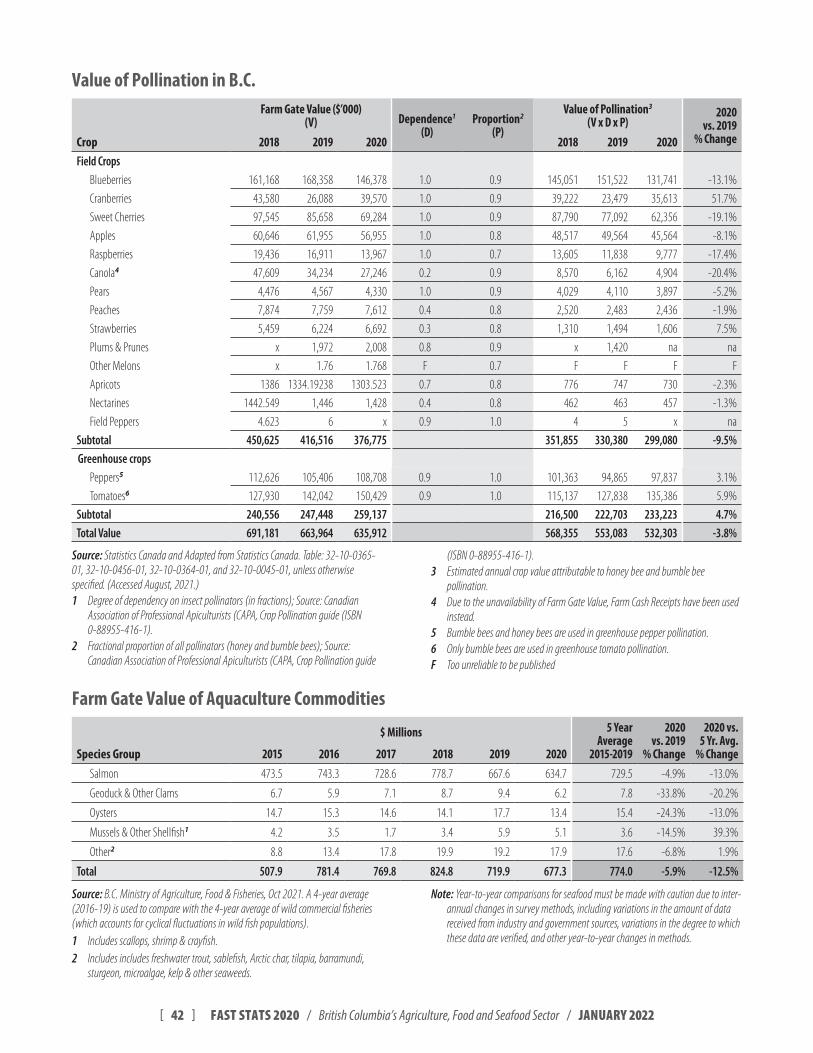
[ 42 ] FAST STATS 2020 / British Columbia’s Agriculture, Food and Seafood Sector / JANUARY 2022
Value of Pollination in B.C.Farm Gate Value ($’000)
(V) Dependence1
(D)Proportion2
(P)
Value of Pollination3
(V x D x P)2020
vs. 2019 % ChangeCrop 2018 2019 2020 2018 2019 2020
Field CropsBlueberries 161,168 168,358 146,378 1.0 0.9 145,051 151,522 131,741 -13.1%
Cranberries 43,580 26,088 39,570 1.0 0.9 39,222 23,479 35,613 51.7%
Sweet Cherries 97,545 85,658 69,284 1.0 0.9 87,790 77,092 62,356 -19.1%
Apples 60,646 61,955 56,955 1.0 0.8 48,517 49,564 45,564 -8.1%
Raspberries 19,436 16,911 13,967 1.0 0.7 13,605 11,838 9,777 -17.4%
Canola4 47,609 34,234 27,246 0.2 0.9 8,570 6,162 4,904 -20.4%
Pears 4,476 4,567 4,330 1.0 0.9 4,029 4,110 3,897 -5.2%
Peaches 7,874 7,759 7,612 0.4 0.8 2,520 2,483 2,436 -1.9%
Strawberries 5,459 6,224 6,692 0.3 0.8 1,310 1,494 1,606 7.5%
Plums & Prunes x 1,972 2,008 0.8 0.9 x 1,420 na na
Other Melons x 1.76 1.768 F 0.7 F F F F
Apricots 1386 1334.19238 1303.523 0.7 0.8 776 747 730 -2.3%
Nectarines 1442.549 1,446 1,428 0.4 0.8 462 463 457 -1.3%
Field Peppers 4.623 6 x 0.9 1.0 4 5 x na
Subtotal 450,625 416,516 376,775 351,855 330,380 299,080 -9.5%Greenhouse crops
Peppers5 112,626 105,406 108,708 0.9 1.0 101,363 94,865 97,837 3.1%
Tomatoes6 127,930 142,042 150,429 0.9 1.0 115,137 127,838 135,386 5.9%
Subtotal 240,556 247,448 259,137 216,500 222,703 233,223 4.7%Total Value 691,181 663,964 635,912 568,355 553,083 532,303 -3.8%
Source: Statistics Canada and Adapted from Statistics Canada Table: 32-10-0365-01, 32-10-0456-01, 32-10-0364-01, and 32-10-0045-01, unless otherwise specified (Accessed August, 2021 )1 Degree of dependency on insect pollinators (in fractions); Source: Canadian
Association of Professional Apiculturists (CAPA, Crop Pollination guide (ISBN 0-88955-416-1)
2 Fractional proportion of all pollinators (honey and bumble bees); Source: Canadian Association of Professional Apiculturists (CAPA, Crop Pollination guide
(ISBN 0-88955-416-1) 3 Estimated annual crop value attributable to honey bee and bumble bee
pollination 4 Due to the unavailability of Farm Gate Value, Farm Cash Receipts have been used
instead 5 Bumble bees and honey bees are used in greenhouse pepper pollination 6 Only bumble bees are used in greenhouse tomato pollination F Too unreliable to be published
Farm Gate Value of Aquaculture Commodities
$ Millions 5 Year Average
2015-2019
2020 vs. 2019
% Change
2020 vs. 5 Yr. Avg.
% ChangeSpecies Group 2015 2016 2017 2018 2019 2020Salmon 473.5 743.3 728.6 778.7 667.6 634.7 729.5 -4.9% -13.0%
Geoduck & Other Clams 6.7 5.9 7.1 8.7 9.4 6.2 7.8 -33.8% -20.2%
Oysters 14.7 15.3 14.6 14.1 17.7 13.4 15.4 -24.3% -13.0%
Mussels & Other Shellfish1 4.2 3.5 1.7 3.4 5.9 5.1 3.6 -14.5% 39.3%
Other2 8.8 13.4 17.8 19.9 19.2 17.9 17.6 -6.8% 1.9%
Total 507.9 781.4 769.8 824.8 719.9 677.3 774.0 -5.9% -12.5%
Source: B C Ministry of Agriculture, Food & Fisheries, Oct 2021 A 4-year average (2016-19) is used to compare with the 4-year average of wild commercial fisheries (which accounts for cyclical fluctuations in wild fish populations) 1 Includes scallops, shrimp & crayfish 2 Includes includes freshwater trout, sablefish, Arctic char, tilapia, barramundi,
sturgeon, microalgae, kelp & other seaweeds
Note: Year-to-year comparisons for seafood must be made with caution due to inter-annual changes in survey methods, including variations in the amount of data received from industry and government sources, variations in the degree to which these data are verified, and other year-to-year changes in methods
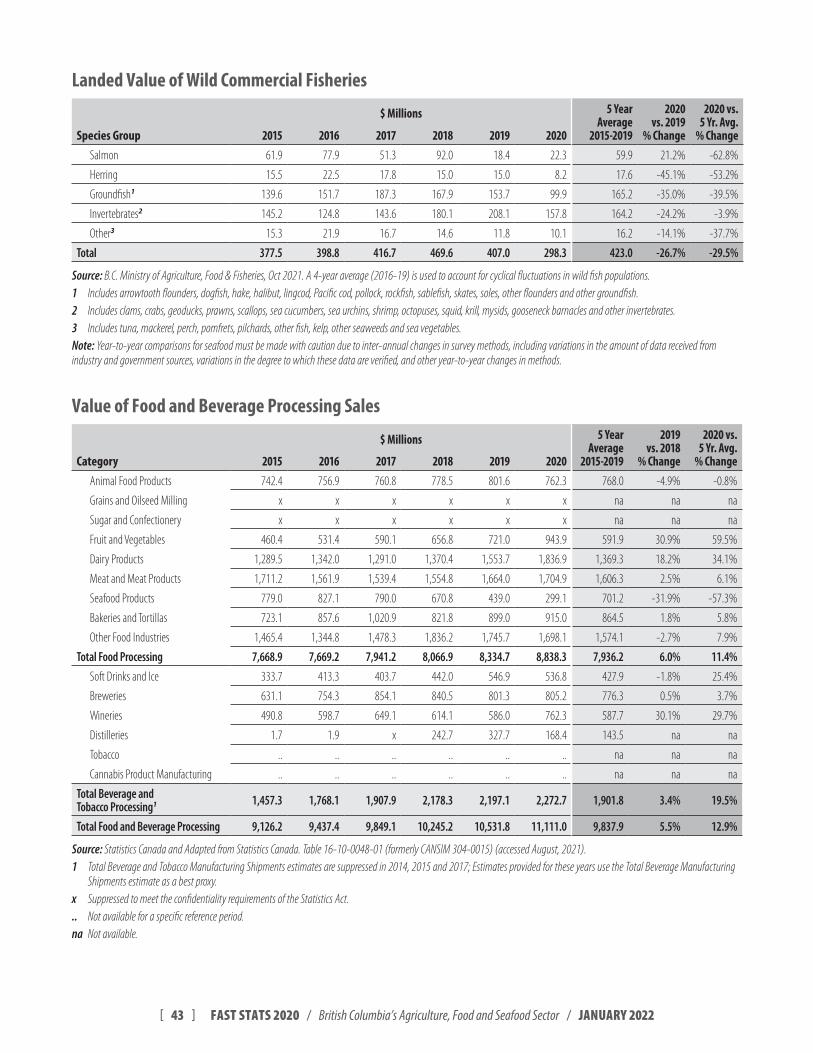
[ 43 ] FAST STATS 2020 / British Columbia’s Agriculture, Food and Seafood Sector / JANUARY 2022
Landed Value of Wild Commercial Fisheries
$ Millions 5 Year Average
2015-2019
2020 vs. 2019
% Change
2020 vs. 5 Yr. Avg.
% ChangeSpecies Group 2015 2016 2017 2018 2019 2020Salmon 61.9 77.9 51.3 92.0 18.4 22.3 59.9 21.2% -62.8%
Herring 15.5 22.5 17.8 15.0 15.0 8.2 17.6 -45.1% -53.2%
Groundfish1 139.6 151.7 187.3 167.9 153.7 99.9 165.2 -35.0% -39.5%
Invertebrates2 145.2 124.8 143.6 180.1 208.1 157.8 164.2 -24.2% -3.9%
Other3 15.3 21.9 16.7 14.6 11.8 10.1 16.2 -14.1% -37.7%
Total 377.5 398.8 416.7 469.6 407.0 298.3 423.0 -26.7% -29.5%
Source: B C Ministry of Agriculture, Food & Fisheries, Oct 2021 A 4-year average (2016-19) is used to account for cyclical fluctuations in wild fish populations 1 Includes arrowtooth flounders, dogfish, hake, halibut, lingcod, Pacific cod, pollock, rockfish, sablefish, skates, soles, other flounders and other groundfish 2 Includes clams, crabs, geoducks, prawns, scallops, sea cucumbers, sea urchins, shrimp, octopuses, squid, krill, mysids, gooseneck barnacles and other invertebrates 3 Includes tuna, mackerel, perch, pomfrets, pilchards, other fish, kelp, other seaweeds and sea vegetables Note: Year-to-year comparisons for seafood must be made with caution due to inter-annual changes in survey methods, including variations in the amount of data received from industry and government sources, variations in the degree to which these data are verified, and other year-to-year changes in methods
Value of Food and Beverage Processing Sales
$ Millions 5 Year Average
2015-2019
2019 vs. 2018
% Change
2020 vs. 5 Yr. Avg.
% ChangeCategory 2015 2016 2017 2018 2019 2020Animal Food Products 742.4 756.9 760.8 778.5 801.6 762.3 768.0 -4.9% -0.8%
Grains and Oilseed Milling x x x x x x na na na
Sugar and Confectionery x x x x x x na na na
Fruit and Vegetables 460.4 531.4 590.1 656.8 721.0 943.9 591.9 30.9% 59.5%
Dairy Products 1,289.5 1,342.0 1,291.0 1,370.4 1,553.7 1,836.9 1,369.3 18.2% 34.1%
Meat and Meat Products 1,711.2 1,561.9 1,539.4 1,554.8 1,664.0 1,704.9 1,606.3 2.5% 6.1%
Seafood Products 779.0 827.1 790.0 670.8 439.0 299.1 701.2 -31.9% -57.3%
Bakeries and Tortillas 723.1 857.6 1,020.9 821.8 899.0 915.0 864.5 1.8% 5.8%
Other Food Industries 1,465.4 1,344.8 1,478.3 1,836.2 1,745.7 1,698.1 1,574.1 -2.7% 7.9%
Total Food Processing 7,668.9 7,669.2 7,941.2 8,066.9 8,334.7 8,838.3 7,936.2 6.0% 11.4%
Soft Drinks and Ice 333.7 413.3 403.7 442.0 546.9 536.8 427.9 -1.8% 25.4%
Breweries 631.1 754.3 854.1 840.5 801.3 805.2 776.3 0.5% 3.7%
Wineries 490.8 598.7 649.1 614.1 586.0 762.3 587.7 30.1% 29.7%
Distilleries 1.7 1.9 x 242.7 327.7 168.4 143.5 na na
Tobacco .. .. .. .. .. .. na na na
Cannabis Product Manufacturing .. .. .. .. .. .. na na na
Total Beverage and Tobacco Processing1 1,457.3 1,768.1 1,907.9 2,178.3 2,197.1 2,272.7 1,901.8 3.4% 19.5%
Total Food and Beverage Processing 9,126.2 9,437.4 9,849.1 10,245.2 10,531.8 11,111.0 9,837.9 5.5% 12.9%
Source: Statistics Canada and Adapted from Statistics Canada Table 16-10-0048-01 (formerly CANSIM 304-0015) (accessed August, 2021) 1 Total Beverage and Tobacco Manufacturing Shipments estimates are suppressed in 2014, 2015 and 2017; Estimates provided for these years use the Total Beverage Manufacturing
Shipments estimate as a best proxy x Suppressed to meet the confidentiality requirements of the Statistics Act .. Not available for a specific reference period na Not available

[ 44 ] FAST STATS 2020 / British Columbia’s Agriculture, Food and Seafood Sector / JANUARY 2022
Farm Income and ExpensesFarm Operating Expenses and Depreciation Charges
$ Millions 5 Year Average
2015-2019
2019 vs. 2018
% Change
2020 vs. 5 Yr. Avg.
% ChangeType 2015 2016 2017 2018 2019 2020Cash Wages, Room and Board 648.6 669.6 686.7 723.0 820.4 853.8 709.6 4.1% 20.3%
Family Wages 162.1 167.4 171.7 179.3 196.1 203.2 175.3 3.6% 15.9%
Non-Family Wages 486.4 502.2 515.0 543.7 624.3 650.6 534.3 4.2% 21.8%
Commercial Feed 511.1 531.5 536.3 591.6 609.3 636.7 556.0 4.5% 14.5%
Interest 176.8 177.2 183.1 214.2 240.5 232.8 198.4 -3.2% 17.3%
Machinery Repairs 133.1 136.0 141.3 145.6 156.4 162.7 142.5 4.0% 14.2%
Custom Work 126.2 116.9 129.2 143.7 169.3 178.7 137.0 5.6% 30.4%
Fertilizer and Lime 131.9 130.7 129.3 139.9 165.3 157.0 139.4 -5.0% 12.6%
Commercial Seed 100.5 101.7 108.2 111.4 131.9 143.6 110.7 8.9% 29.7%
Machinery Fuel 104.6 94.3 103.7 120.7 121.9 102.5 109.0 -16.0% -6.0%
Twine, Wire and Containers 96.8 99.3 100.8 114.7 130.7 137.0 108.5 4.8% 26.3%
Legal and Accounting Fees 90.2 97.3 98.0 107.0 138.1 148.0 106.1 7.1% 39.4%
Other Expenses 83.0 87.9 87.5 91.0 115.1 122.7 92.9 6.6% 32.1%
Electricity 69.6 73.6 79.3 79.9 90.6 91.4 78.6 0.9% 16.3%
Livestock and Poultry Purchases 52.4 49.4 70.3 57.6 60.7 54.2 58.1 -10.7% -6.6%
Cash Rent 63.7 67.4 66.9 71.8 81.2 85.2 70.2 4.9% 21.4%
Repairs to Buildings and Fences 67.4 69.6 72.7 77.3 81.9 85.0 73.8 3.7% 15.1%
Business Insurance 48.7 51.1 52.4 54.3 62.2 67.8 53.7 9.0% 26.2%
Pesticides 43.5 45.3 43.3 46.0 55.7 57.9 46.8 3.9% 23.7%
Heating Fuel 47.7 42.4 46.6 48.0 66.8 68.3 50.3 2.4% 35.9%
Veterinary Fees 45.4 47.2 48.6 50.3 51.8 53.6 48.6 3.5% 10.2%
Property Taxes 22.8 23.9 23.3 24.3 28.3 31.5 24.5 11.3% 28.3%
Telephone 22.2 22.5 22.3 23.2 26.8 26.3 23.4 -1.6% 12.6%
Crop and Hail Insurance 6.7 7.0 7.0 7.4 6.7 6.2 7.0 -7.8% -11.4%
Share Rent 3.3 4.0 3.7 3.9 4.4 4.6 3.9 4.1% 19.0%
Irrigation 3.3 3.3 3.3 3.4 3.4 3.4 3.3 0.5% 1.6%
Stabilization Premiums 0.3 0.4 1.0 0.4 0.3 0.5 0.5 70.9% 11.8%
Total Operating Expenses before Rebates 3,106.9 3,165.9 3,280.2 3,510.2 3,889.9 4,002.2 3,390.6 2.9% 18.0%
Total Rebates 6.6 6.6 7.3 7.2 7.5 7.6 7.0 1.1% 7.7%
Total Operating Expenses after Rebates 2,693.3 2,743.0 2,837.3 3,043.3 3,412.3 3,503.7 2,945.8 2.7% 18.9%
Building Depreciation 203.7 212.1 227.5 247.3 248.7 249.8 227.9 0.4% 9.6%
Machinery Depreciation 203.3 204.2 208.1 212.4 221.4 241.0 209.9 8.9% 14.8%
Total Depreciation 407.1 416.3 435.6 459.6 470.1 490.8 437.7 4.4% 12.1%
Total Expenses and Depreciation 3,100.4 3,159.3 3,272.9 3,502.9 3,882.4 3,994.6 3,383.6 2.9% 18.1%
Source: Statistics Canada Table 002-0005, CANSIM database (accessed July 31, 2021) na Not available Note: Totals may not agree due to rounding
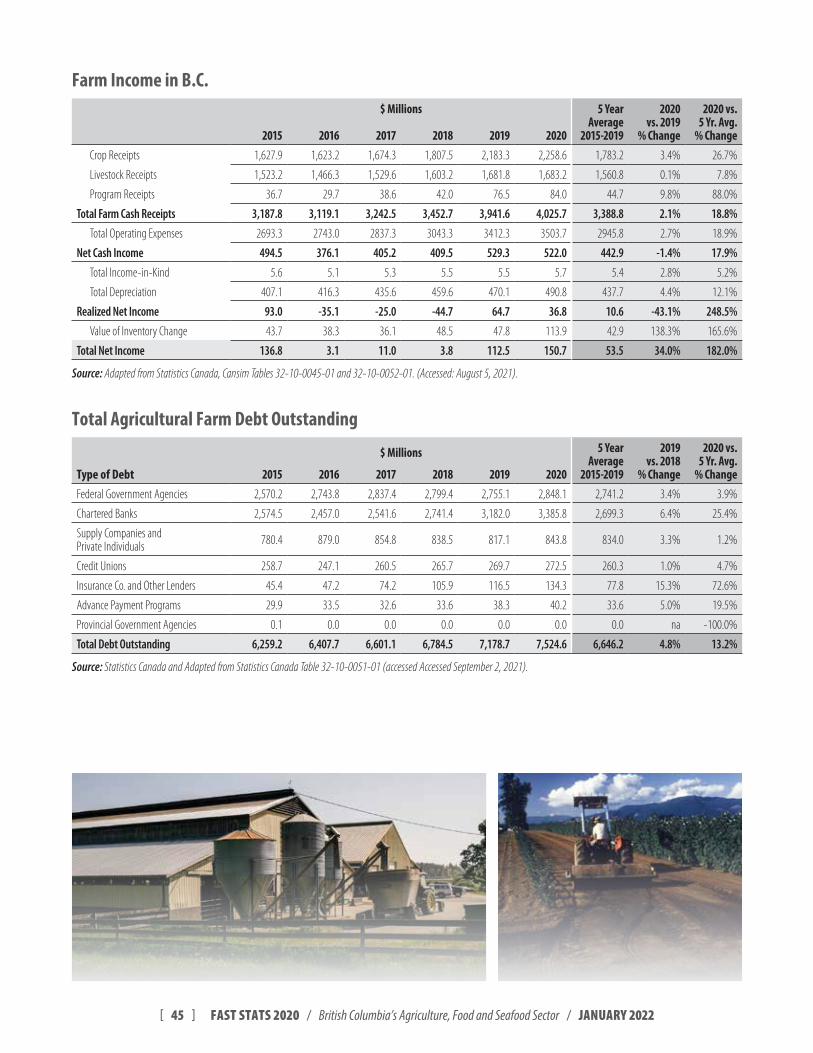
[ 45 ] FAST STATS 2020 / British Columbia’s Agriculture, Food and Seafood Sector / JANUARY 2022
Farm Income in B.C.$ Millions 5 Year
Average2015-2019
2020 vs. 2019
% Change
2020 vs. 5 Yr. Avg.
% Change2015 2016 2017 2018 2019 2020Crop Receipts 1,627.9 1,623.2 1,674.3 1,807.5 2,183.3 2,258.6 1,783.2 3.4% 26.7%
Livestock Receipts 1,523.2 1,466.3 1,529.6 1,603.2 1,681.8 1,683.2 1,560.8 0.1% 7.8%
Program Receipts 36.7 29.7 38.6 42.0 76.5 84.0 44.7 9.8% 88.0%
Total Farm Cash Receipts 3,187.8 3,119.1 3,242.5 3,452.7 3,941.6 4,025.7 3,388.8 2.1% 18.8%
Total Operating Expenses 2693.3 2743.0 2837.3 3043.3 3412.3 3503.7 2945.8 2.7% 18.9%
Net Cash Income 494.5 376.1 405.2 409.5 529.3 522.0 442.9 -1.4% 17.9%
Total Income-in-Kind 5.6 5.1 5.3 5.5 5.5 5.7 5.4 2.8% 5.2%
Total Depreciation 407.1 416.3 435.6 459.6 470.1 490.8 437.7 4.4% 12.1%
Realized Net Income 93.0 -35.1 -25.0 -44.7 64.7 36.8 10.6 -43.1% 248.5%
Value of Inventory Change 43.7 38.3 36.1 48.5 47.8 113.9 42.9 138.3% 165.6%
Total Net Income 136.8 3.1 11.0 3.8 112.5 150.7 53.5 34.0% 182.0%
Source: Adapted from Statistics Canada, Cansim Tables 32-10-0045-01 and 32-10-0052-01 (Accessed: August 5, 2021)
Total Agricultural Farm Debt Outstanding
$ Millions 5 Year Average
2015-2019
2019 vs. 2018
% Change
2020 vs. 5 Yr. Avg.
% ChangeType of Debt 2015 2016 2017 2018 2019 2020Federal Government Agencies 2,570.2 2,743.8 2,837.4 2,799.4 2,755.1 2,848.1 2,741.2 3.4% 3.9%
Chartered Banks 2,574.5 2,457.0 2,541.6 2,741.4 3,182.0 3,385.8 2,699.3 6.4% 25.4%
Supply Companies and Private Individuals 780.4 879.0 854.8 838.5 817.1 843.8 834.0 3.3% 1.2%
Credit Unions 258.7 247.1 260.5 265.7 269.7 272.5 260.3 1.0% 4.7%
Insurance Co. and Other Lenders 45.4 47.2 74.2 105.9 116.5 134.3 77.8 15.3% 72.6%
Advance Payment Programs 29.9 33.5 32.6 33.6 38.3 40.2 33.6 5.0% 19.5%
Provincial Government Agencies 0.1 0.0 0.0 0.0 0.0 0.0 0.0 na -100.0%
Total Debt Outstanding 6,259.2 6,407.7 6,601.1 6,784.5 7,178.7 7,524.6 6,646.2 4.8% 13.2%
Source: Statistics Canada and Adapted from Statistics Canada Table 32-10-0051-01 (accessed Accessed September 2, 2021)
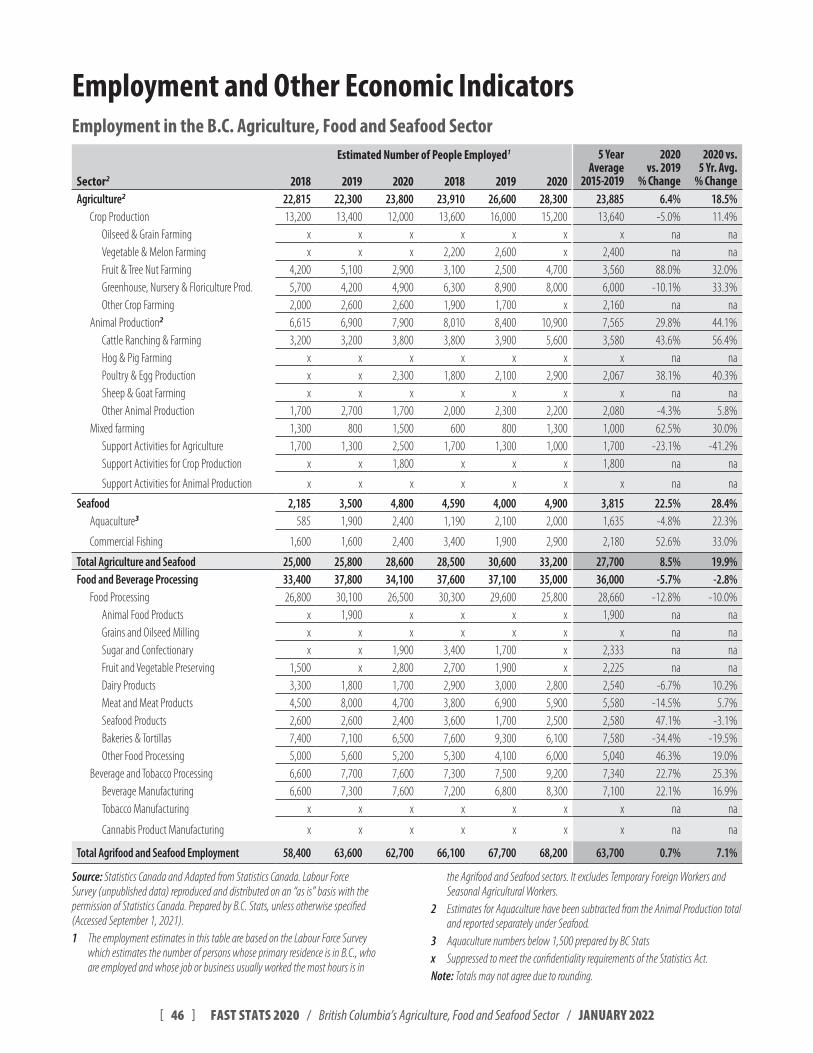
[ 46 ] FAST STATS 2020 / British Columbia’s Agriculture, Food and Seafood Sector / JANUARY 2022
Employment and Other Economic IndicatorsEmployment in the B.C. Agriculture, Food and Seafood Sector
Estimated Number of People Employed1 5 Year Average
2015-2019
2020 vs. 2019
% Change
2020 vs. 5 Yr. Avg.
% ChangeSector2 2018 2019 2020 2018 2019 2020Agriculture2 22,815 22,300 23,800 23,910 26,600 28,300 23,885 6.4% 18.5%
Crop Production 13,200 13,400 12,000 13,600 16,000 15,200 13,640 -5.0% 11.4%Oilseed & Grain Farming x x x x x x x na naVegetable & Melon Farming x x x 2,200 2,600 x 2,400 na naFruit & Tree Nut Farming 4,200 5,100 2,900 3,100 2,500 4,700 3,560 88.0% 32.0%Greenhouse, Nursery & Floriculture Prod. 5,700 4,200 4,900 6,300 8,900 8,000 6,000 -10.1% 33.3%Other Crop Farming 2,000 2,600 2,600 1,900 1,700 x 2,160 na na
Animal Production2 6,615 6,900 7,900 8,010 8,400 10,900 7,565 29.8% 44.1%Cattle Ranching & Farming 3,200 3,200 3,800 3,800 3,900 5,600 3,580 43.6% 56.4%Hog & Pig Farming x x x x x x x na naPoultry & Egg Production x x 2,300 1,800 2,100 2,900 2,067 38.1% 40.3%Sheep & Goat Farming x x x x x x x na naOther Animal Production 1,700 2,700 1,700 2,000 2,300 2,200 2,080 -4.3% 5.8%
Mixed farming 1,300 800 1,500 600 800 1,300 1,000 62.5% 30.0%Support Activities for Agriculture 1,700 1,300 2,500 1,700 1,300 1,000 1,700 -23.1% -41.2%Support Activities for Crop Production x x 1,800 x x x 1,800 na na
Support Activities for Animal Production x x x x x x x na na
Seafood 2,185 3,500 4,800 4,590 4,000 4,900 3,815 22.5% 28.4%Aquaculture3 585 1,900 2,400 1,190 2,100 2,000 1,635 -4.8% 22.3%
Commercial Fishing 1,600 1,600 2,400 3,400 1,900 2,900 2,180 52.6% 33.0%
Total Agriculture and Seafood 25,000 25,800 28,600 28,500 30,600 33,200 27,700 8.5% 19.9%Food and Beverage Processing 33,400 37,800 34,100 37,600 37,100 35,000 36,000 -5.7% -2.8%
Food Processing 26,800 30,100 26,500 30,300 29,600 25,800 28,660 -12.8% -10.0%Animal Food Products x 1,900 x x x x 1,900 na naGrains and Oilseed Milling x x x x x x x na naSugar and Confectionary x x 1,900 3,400 1,700 x 2,333 na naFruit and Vegetable Preserving 1,500 x 2,800 2,700 1,900 x 2,225 na naDairy Products 3,300 1,800 1,700 2,900 3,000 2,800 2,540 -6.7% 10.2%Meat and Meat Products 4,500 8,000 4,700 3,800 6,900 5,900 5,580 -14.5% 5.7%Seafood Products 2,600 2,600 2,400 3,600 1,700 2,500 2,580 47.1% -3.1%Bakeries & Tortillas 7,400 7,100 6,500 7,600 9,300 6,100 7,580 -34.4% -19.5%Other Food Processing 5,000 5,600 5,200 5,300 4,100 6,000 5,040 46.3% 19.0%
Beverage and Tobacco Processing 6,600 7,700 7,600 7,300 7,500 9,200 7,340 22.7% 25.3%Beverage Manufacturing 6,600 7,300 7,600 7,200 6,800 8,300 7,100 22.1% 16.9%Tobacco Manufacturing x x x x x x x na na
Cannabis Product Manufacturing x x x x x x x na na
Total Agrifood and Seafood Employment 58,400 63,600 62,700 66,100 67,700 68,200 63,700 0.7% 7.1%
Source: Statistics Canada and Adapted from Statistics Canada Labour Force Survey (unpublished data) reproduced and distributed on an “as is” basis with the permission of Statistics Canada Prepared by B C Stats, unless otherwise specified (Accessed September 1, 2021) 1 The employment estimates in this table are based on the Labour Force Survey
which estimates the number of persons whose primary residence is in B C , who are employed and whose job or business usually worked the most hours is in
the Agrifood and Seafood sectors It excludes Temporary Foreign Workers and Seasonal Agricultural Workers
2 Estimates for Aquaculture have been subtracted from the Animal Production total and reported separately under Seafood
3 Aquaculture numbers below 1,500 prepared by BC Statsx Suppressed to meet the confidentiality requirements of the Statistics Act Note: Totals may not agree due to rounding
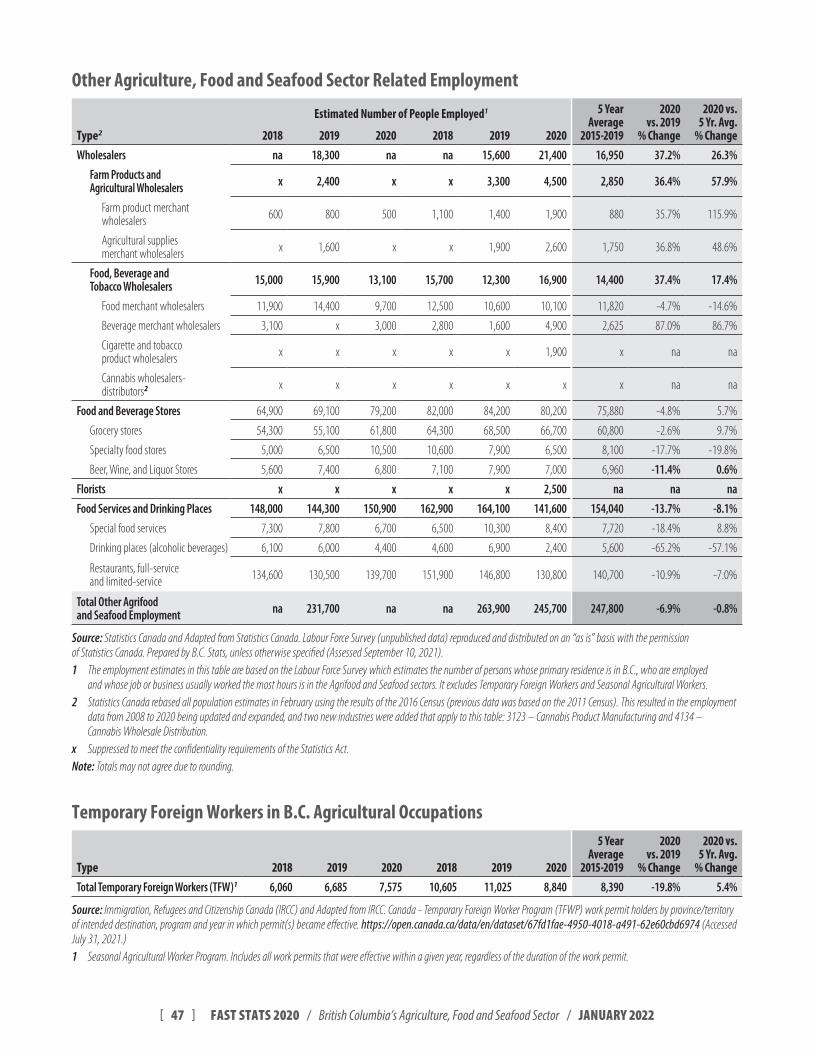
[ 47 ] FAST STATS 2020 / British Columbia’s Agriculture, Food and Seafood Sector / JANUARY 2022
Other Agriculture, Food and Seafood Sector Related Employment
Estimated Number of People Employed1 5 Year Average
2015-2019
2020 vs. 2019
% Change
2020 vs. 5 Yr. Avg.
% ChangeType2 2018 2019 2020 2018 2019 2020Wholesalers na 18,300 na na 15,600 21,400 16,950 37.2% 26.3%
Farm Products and Agricultural Wholesalers x 2,400 x x 3,300 4,500 2,850 36.4% 57.9%
Farm product merchant wholesalers 600 800 500 1,100 1,400 1,900 880 35.7% 115.9%
Agricultural supplies merchant wholesalers x 1,600 x x 1,900 2,600 1,750 36.8% 48.6%
Food, Beverage and Tobacco Wholesalers 15,000 15,900 13,100 15,700 12,300 16,900 14,400 37.4% 17.4%
Food merchant wholesalers 11,900 14,400 9,700 12,500 10,600 10,100 11,820 -4.7% -14.6%
Beverage merchant wholesalers 3,100 x 3,000 2,800 1,600 4,900 2,625 87.0% 86.7%
Cigarette and tobacco product wholesalers x x x x x 1,900 x na na
Cannabis wholesalers-distributors2 x x x x x x x na na
Food and Beverage Stores 64,900 69,100 79,200 82,000 84,200 80,200 75,880 -4.8% 5.7%
Grocery stores 54,300 55,100 61,800 64,300 68,500 66,700 60,800 -2.6% 9.7%
Specialty food stores 5,000 6,500 10,500 10,600 7,900 6,500 8,100 -17.7% -19.8%
Beer, Wine, and Liquor Stores 5,600 7,400 6,800 7,100 7,900 7,000 6,960 -11.4% 0.6%
Florists x x x x x 2,500 na na na
Food Services and Drinking Places 148,000 144,300 150,900 162,900 164,100 141,600 154,040 -13.7% -8.1%
Special food services 7,300 7,800 6,700 6,500 10,300 8,400 7,720 -18.4% 8.8%
Drinking places (alcoholic beverages) 6,100 6,000 4,400 4,600 6,900 2,400 5,600 -65.2% -57.1%
Restaurants, full-service and limited-service 134,600 130,500 139,700 151,900 146,800 130,800 140,700 -10.9% -7.0%
Total Other Agrifood and Seafood Employment na 231,700 na na 263,900 245,700 247,800 -6.9% -0.8%
Source: Statistics Canada and Adapted from Statistics Canada Labour Force Survey (unpublished data) reproduced and distributed on an “as is” basis with the permission of Statistics Canada Prepared by B C Stats, unless otherwise specified (Assessed September 10, 2021) 1 The employment estimates in this table are based on the Labour Force Survey which estimates the number of persons whose primary residence is in B C , who are employed
and whose job or business usually worked the most hours is in the Agrifood and Seafood sectors It excludes Temporary Foreign Workers and Seasonal Agricultural Workers 2 Statistics Canada rebased all population estimates in February using the results of the 2016 Census (previous data was based on the 2011 Census) This resulted in the employment
data from 2008 to 2020 being updated and expanded, and two new industries were added that apply to this table: 3123 – Cannabis Product Manufacturing and 4134 – Cannabis Wholesale Distribution
x Suppressed to meet the confidentiality requirements of the Statistics Act Note: Totals may not agree due to rounding
Temporary Foreign Workers in B.C. Agricultural Occupations
Type 2018 2019 2020 2018 2019 2020
5 Year Average
2015-2019
2020 vs. 2019
% Change
2020 vs. 5 Yr. Avg.
% ChangeTotal Temporary Foreign Workers (TFW)1 6,060 6,685 7,575 10,605 11,025 8,840 8,390 -19.8% 5.4%
Source: Immigration, Refugees and Citizenship Canada (IRCC) and Adapted from IRCC Canada - Temporary Foreign Worker Program (TFWP) work permit holders by province/territory of intended destination, program and year in which permit(s) became effective https://open.canada.ca/data/en/dataset/67fd1fae-4950-4018-a491-62e60cbd6974 (Accessed July 31, 2021 )1 Seasonal Agricultural Worker Program Includes all work permits that were effective within a given year, regardless of the duration of the work permit
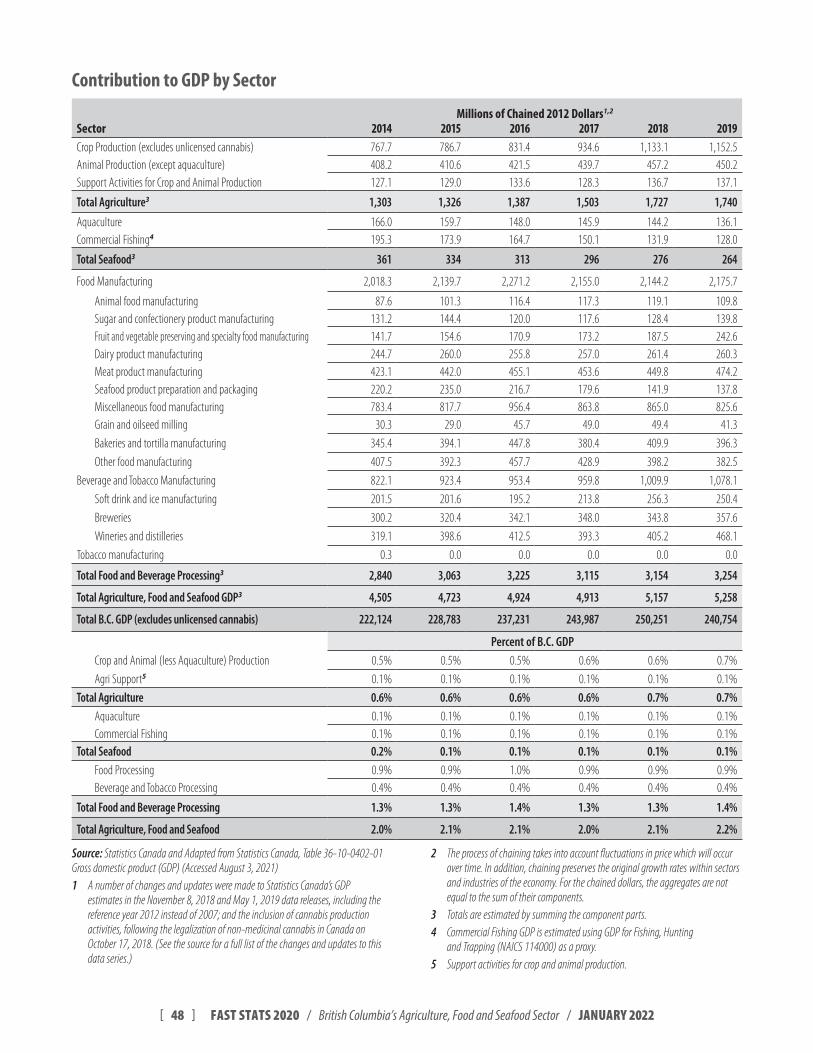
[ 48 ] FAST STATS 2020 / British Columbia’s Agriculture, Food and Seafood Sector / JANUARY 2022
Contribution to GDP by Sector
Millions of Chained 2012 Dollars1,2
Sector 2014 2015 2016 2017 2018 2019Crop Production (excludes unlicensed cannabis) 767.7 786.7 831.4 934.6 1,133.1 1,152.5Animal Production (except aquaculture) 408.2 410.6 421.5 439.7 457.2 450.2Support Activities for Crop and Animal Production 127.1 129.0 133.6 128.3 136.7 137.1
Total Agriculture3 1,303 1,326 1,387 1,503 1,727 1,740
Aquaculture 166.0 159.7 148.0 145.9 144.2 136.1Commercial Fishing4 195.3 173.9 164.7 150.1 131.9 128.0
Total Seafood3 361 334 313 296 276 264
Food Manufacturing 2,018.3 2,139.7 2,271.2 2,155.0 2,144.2 2,175.7
Animal food manufacturing 87.6 101.3 116.4 117.3 119.1 109.8Sugar and confectionery product manufacturing 131.2 144.4 120.0 117.6 128.4 139.8Fruit and vegetable preserving and specialty food manufacturing 141.7 154.6 170.9 173.2 187.5 242.6Dairy product manufacturing 244.7 260.0 255.8 257.0 261.4 260.3Meat product manufacturing 423.1 442.0 455.1 453.6 449.8 474.2Seafood product preparation and packaging 220.2 235.0 216.7 179.6 141.9 137.8Miscellaneous food manufacturing 783.4 817.7 956.4 863.8 865.0 825.6Grain and oilseed milling 30.3 29.0 45.7 49.0 49.4 41.3
Bakeries and tortilla manufacturing 345.4 394.1 447.8 380.4 409.9 396.3
Other food manufacturing 407.5 392.3 457.7 428.9 398.2 382.5
Beverage and Tobacco Manufacturing 822.1 923.4 953.4 959.8 1,009.9 1,078.1
Soft drink and ice manufacturing 201.5 201.6 195.2 213.8 256.3 250.4
Breweries 300.2 320.4 342.1 348.0 343.8 357.6
Wineries and distilleries 319.1 398.6 412.5 393.3 405.2 468.1
Tobacco manufacturing 0.3 0.0 0.0 0.0 0.0 0.0
Total Food and Beverage Processing3 2,840 3,063 3,225 3,115 3,154 3,254
Total Agriculture, Food and Seafood GDP3 4,505 4,723 4,924 4,913 5,157 5,258
Total B.C. GDP (excludes unlicensed cannabis) 222,124 228,783 237,231 243,987 250,251 240,754
Percent of B.C. GDPCrop and Animal (less Aquaculture) Production 0.5% 0.5% 0.5% 0.6% 0.6% 0.7%
Agri Support5 0.1% 0.1% 0.1% 0.1% 0.1% 0.1%
Total Agriculture 0.6% 0.6% 0.6% 0.6% 0.7% 0.7%Aquaculture 0.1% 0.1% 0.1% 0.1% 0.1% 0.1%Commercial Fishing 0.1% 0.1% 0.1% 0.1% 0.1% 0.1%
Total Seafood 0.2% 0.1% 0.1% 0.1% 0.1% 0.1%Food Processing 0.9% 0.9% 1.0% 0.9% 0.9% 0.9%Beverage and Tobacco Processing 0.4% 0.4% 0.4% 0.4% 0.4% 0.4%
Total Food and Beverage Processing 1.3% 1.3% 1.4% 1.3% 1.3% 1.4%
Total Agriculture, Food and Seafood 2.0% 2.1% 2.1% 2.0% 2.1% 2.2%
Source: Statistics Canada and Adapted from Statistics Canada, Table 36-10-0402-01 Gross domestic product (GDP) (Accessed August 3, 2021)1 A number of changes and updates were made to Statistics Canada’s GDP
estimates in the November 8, 2018 and May 1, 2019 data releases, including the reference year 2012 instead of 2007; and the inclusion of cannabis production activities, following the legalization of non-medicinal cannabis in Canada on October 17, 2018 (See the source for a full list of the changes and updates to this data series )
2 The process of chaining takes into account fluctuations in price which will occur over time In addition, chaining preserves the original growth rates within sectors and industries of the economy For the chained dollars, the aggregates are not equal to the sum of their components
3 Totals are estimated by summing the component parts 4 Commercial Fishing GDP is estimated using GDP for Fishing, Hunting
and Trapping (NAICS 114000) as a proxy 5 Support activities for crop and animal production
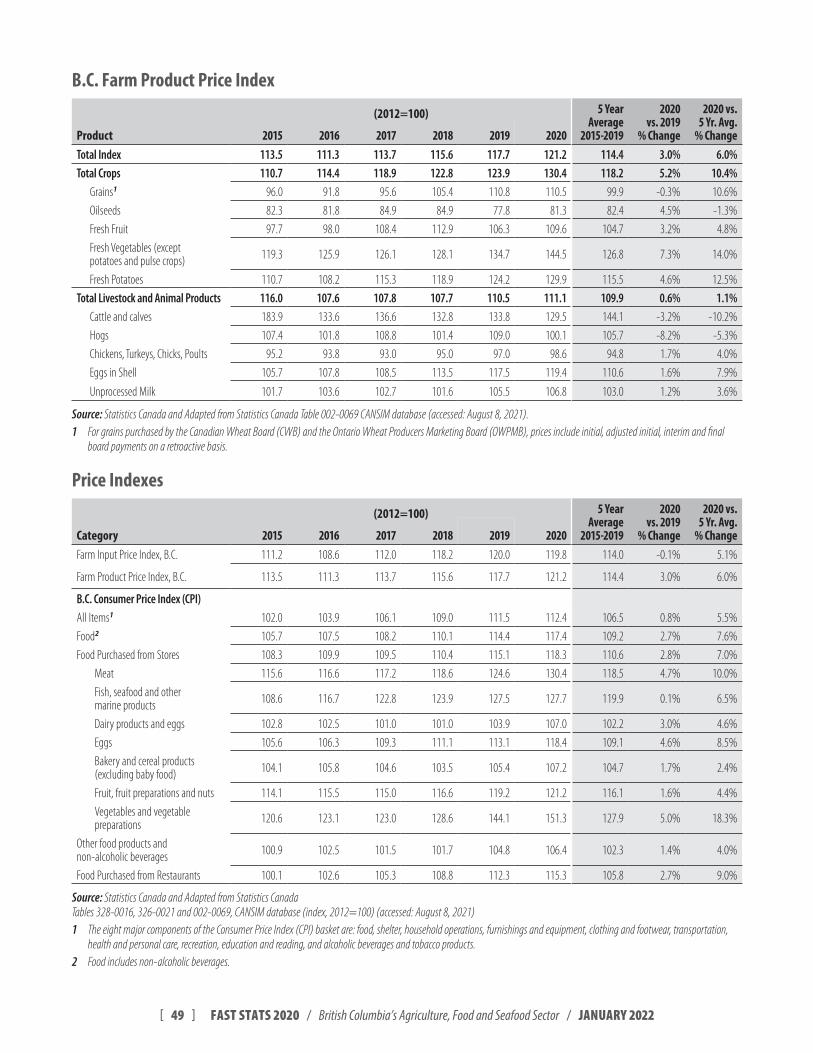
[ 49 ] FAST STATS 2020 / British Columbia’s Agriculture, Food and Seafood Sector / JANUARY 2022
B.C. Farm Product Price Index
(2012=100) 5 Year Average
2015-2019
2020 vs. 2019
% Change
2020 vs. 5 Yr. Avg.
% ChangeProduct 2015 2016 2017 2018 2019 2020Total Index 113.5 111.3 113.7 115.6 117.7 121.2 114.4 3.0% 6.0%Total Crops 110.7 114.4 118.9 122.8 123.9 130.4 118.2 5.2% 10.4%
Grains1 96.0 91.8 95.6 105.4 110.8 110.5 99.9 -0.3% 10.6%
Oilseeds 82.3 81.8 84.9 84.9 77.8 81.3 82.4 4.5% -1.3%
Fresh Fruit 97.7 98.0 108.4 112.9 106.3 109.6 104.7 3.2% 4.8%
Fresh Vegetables (except potatoes and pulse crops) 119.3 125.9 126.1 128.1 134.7 144.5 126.8 7.3% 14.0%
Fresh Potatoes 110.7 108.2 115.3 118.9 124.2 129.9 115.5 4.6% 12.5%
Total Livestock and Animal Products 116.0 107.6 107.8 107.7 110.5 111.1 109.9 0.6% 1.1%Cattle and calves 183.9 133.6 136.6 132.8 133.8 129.5 144.1 -3.2% -10.2%
Hogs 107.4 101.8 108.8 101.4 109.0 100.1 105.7 -8.2% -5.3%
Chickens, Turkeys, Chicks, Poults 95.2 93.8 93.0 95.0 97.0 98.6 94.8 1.7% 4.0%
Eggs in Shell 105.7 107.8 108.5 113.5 117.5 119.4 110.6 1.6% 7.9%
Unprocessed Milk 101.7 103.6 102.7 101.6 105.5 106.8 103.0 1.2% 3.6%
Source: Statistics Canada and Adapted from Statistics Canada Table 002-0069 CANSIM database (accessed: August 8, 2021) 1 For grains purchased by the Canadian Wheat Board (CWB) and the Ontario Wheat Producers Marketing Board (OWPMB), prices include initial, adjusted initial, interim and final
board payments on a retroactive basis
Price Indexes
(2012=100) 5 Year Average
2015-2019
2020 vs. 2019
% Change
2020 vs. 5 Yr. Avg.
% ChangeCategory 2015 2016 2017 2018 2019 2020Farm Input Price Index, B.C. 111.2 108.6 112.0 118.2 120.0 119.8 114.0 -0.1% 5.1%
Farm Product Price Index, B.C. 113.5 111.3 113.7 115.6 117.7 121.2 114.4 3.0% 6.0%
B.C. Consumer Price Index (CPI)All Items1 102.0 103.9 106.1 109.0 111.5 112.4 106.5 0.8% 5.5%
Food2 105.7 107.5 108.2 110.1 114.4 117.4 109.2 2.7% 7.6%
Food Purchased from Stores 108.3 109.9 109.5 110.4 115.1 118.3 110.6 2.8% 7.0%
Meat 115.6 116.6 117.2 118.6 124.6 130.4 118.5 4.7% 10.0%
Fish, seafood and other marine products 108.6 116.7 122.8 123.9 127.5 127.7 119.9 0.1% 6.5%
Dairy products and eggs 102.8 102.5 101.0 101.0 103.9 107.0 102.2 3.0% 4.6%
Eggs 105.6 106.3 109.3 111.1 113.1 118.4 109.1 4.6% 8.5%
Bakery and cereal products (excluding baby food) 104.1 105.8 104.6 103.5 105.4 107.2 104.7 1.7% 2.4%
Fruit, fruit preparations and nuts 114.1 115.5 115.0 116.6 119.2 121.2 116.1 1.6% 4.4%
Vegetables and vegetable preparations 120.6 123.1 123.0 128.6 144.1 151.3 127.9 5.0% 18.3%
Other food products and non-alcoholic beverages 100.9 102.5 101.5 101.7 104.8 106.4 102.3 1.4% 4.0%
Food Purchased from Restaurants 100.1 102.6 105.3 108.8 112.3 115.3 105.8 2.7% 9.0%
Source: Statistics Canada and Adapted from Statistics Canada Tables 328-0016, 326-0021 and 002-0069, CANSIM database (index, 2012=100) (accessed: August 8, 2021) 1 The eight major components of the Consumer Price Index (CPI) basket are: food, shelter, household operations, furnishings and equipment, clothing and footwear, transportation,
health and personal care, recreation, education and reading, and alcoholic beverages and tobacco products 2 Food includes non-alcoholic beverages
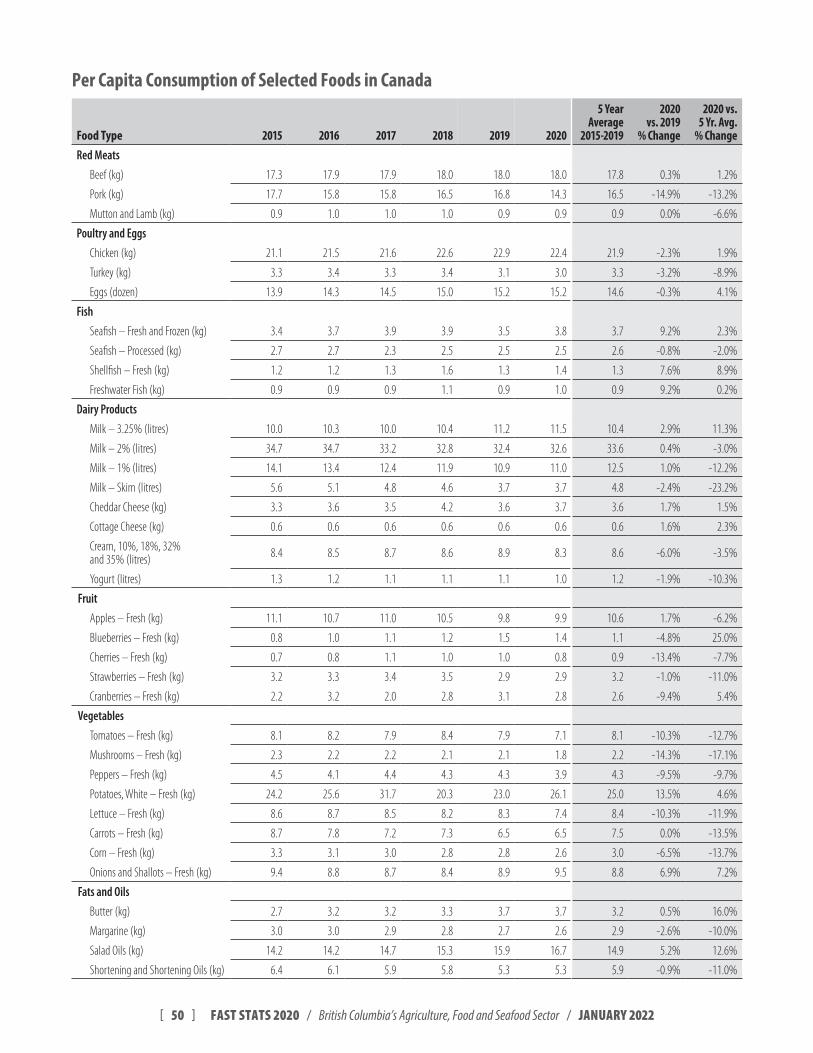
[ 50 ] FAST STATS 2020 / British Columbia’s Agriculture, Food and Seafood Sector / JANUARY 2022
Per Capita Consumption of Selected Foods in Canada
Food Type 2015 2016 2017 2018 2019 2020
5 Year Average
2015-2019
2020 vs. 2019
% Change
2020 vs. 5 Yr. Avg.
% ChangeRed Meats
Beef (kg) 17.3 17.9 17.9 18.0 18.0 18.0 17.8 0.3% 1.2%
Pork (kg) 17.7 15.8 15.8 16.5 16.8 14.3 16.5 -14.9% -13.2%
Mutton and Lamb (kg) 0.9 1.0 1.0 1.0 0.9 0.9 0.9 0.0% -6.6%
Poultry and Eggs
Chicken (kg) 21.1 21.5 21.6 22.6 22.9 22.4 21.9 -2.3% 1.9%
Turkey (kg) 3.3 3.4 3.3 3.4 3.1 3.0 3.3 -3.2% -8.9%
Eggs (dozen) 13.9 14.3 14.5 15.0 15.2 15.2 14.6 -0.3% 4.1%
Fish
Seafish – Fresh and Frozen (kg) 3.4 3.7 3.9 3.9 3.5 3.8 3.7 9.2% 2.3%
Seafish – Processed (kg) 2.7 2.7 2.3 2.5 2.5 2.5 2.6 -0.8% -2.0%
Shellfish – Fresh (kg) 1.2 1.2 1.3 1.6 1.3 1.4 1.3 7.6% 8.9%
Freshwater Fish (kg) 0.9 0.9 0.9 1.1 0.9 1.0 0.9 9.2% 0.2%
Dairy Products
Milk – 3.25% (litres) 10.0 10.3 10.0 10.4 11.2 11.5 10.4 2.9% 11.3%
Milk – 2% (litres) 34.7 34.7 33.2 32.8 32.4 32.6 33.6 0.4% -3.0%
Milk – 1% (litres) 14.1 13.4 12.4 11.9 10.9 11.0 12.5 1.0% -12.2%
Milk – Skim (litres) 5.6 5.1 4.8 4.6 3.7 3.7 4.8 -2.4% -23.2%
Cheddar Cheese (kg) 3.3 3.6 3.5 4.2 3.6 3.7 3.6 1.7% 1.5%
Cottage Cheese (kg) 0.6 0.6 0.6 0.6 0.6 0.6 0.6 1.6% 2.3%
Cream, 10%, 18%, 32% and 35% (litres) 8.4 8.5 8.7 8.6 8.9 8.3 8.6 -6.0% -3.5%
Yogurt (litres) 1.3 1.2 1.1 1.1 1.1 1.0 1.2 -1.9% -10.3%
Fruit
Apples – Fresh (kg) 11.1 10.7 11.0 10.5 9.8 9.9 10.6 1.7% -6.2%
Blueberries – Fresh (kg) 0.8 1.0 1.1 1.2 1.5 1.4 1.1 -4.8% 25.0%
Cherries – Fresh (kg) 0.7 0.8 1.1 1.0 1.0 0.8 0.9 -13.4% -7.7%
Strawberries – Fresh (kg) 3.2 3.3 3.4 3.5 2.9 2.9 3.2 -1.0% -11.0%
Cranberries – Fresh (kg) 2.2 3.2 2.0 2.8 3.1 2.8 2.6 -9.4% 5.4%
Vegetables
Tomatoes – Fresh (kg) 8.1 8.2 7.9 8.4 7.9 7.1 8.1 -10.3% -12.7%
Mushrooms – Fresh (kg) 2.3 2.2 2.2 2.1 2.1 1.8 2.2 -14.3% -17.1%
Peppers – Fresh (kg) 4.5 4.1 4.4 4.3 4.3 3.9 4.3 -9.5% -9.7%
Potatoes, White – Fresh (kg) 24.2 25.6 31.7 20.3 23.0 26.1 25.0 13.5% 4.6%
Lettuce – Fresh (kg) 8.6 8.7 8.5 8.2 8.3 7.4 8.4 -10.3% -11.9%
Carrots – Fresh (kg) 8.7 7.8 7.2 7.3 6.5 6.5 7.5 0.0% -13.5%
Corn – Fresh (kg) 3.3 3.1 3.0 2.8 2.8 2.6 3.0 -6.5% -13.7%
Onions and Shallots – Fresh (kg) 9.4 8.8 8.7 8.4 8.9 9.5 8.8 6.9% 7.2%
Fats and Oils
Butter (kg) 2.7 3.2 3.2 3.3 3.7 3.7 3.2 0.5% 16.0%
Margarine (kg) 3.0 3.0 2.9 2.8 2.7 2.6 2.9 -2.6% -10.0%
Salad Oils (kg) 14.2 14.2 14.7 15.3 15.9 16.7 14.9 5.2% 12.6%
Shortening and Shortening Oils (kg) 6.4 6.1 5.9 5.8 5.3 5.3 5.9 -0.9% -11.0%
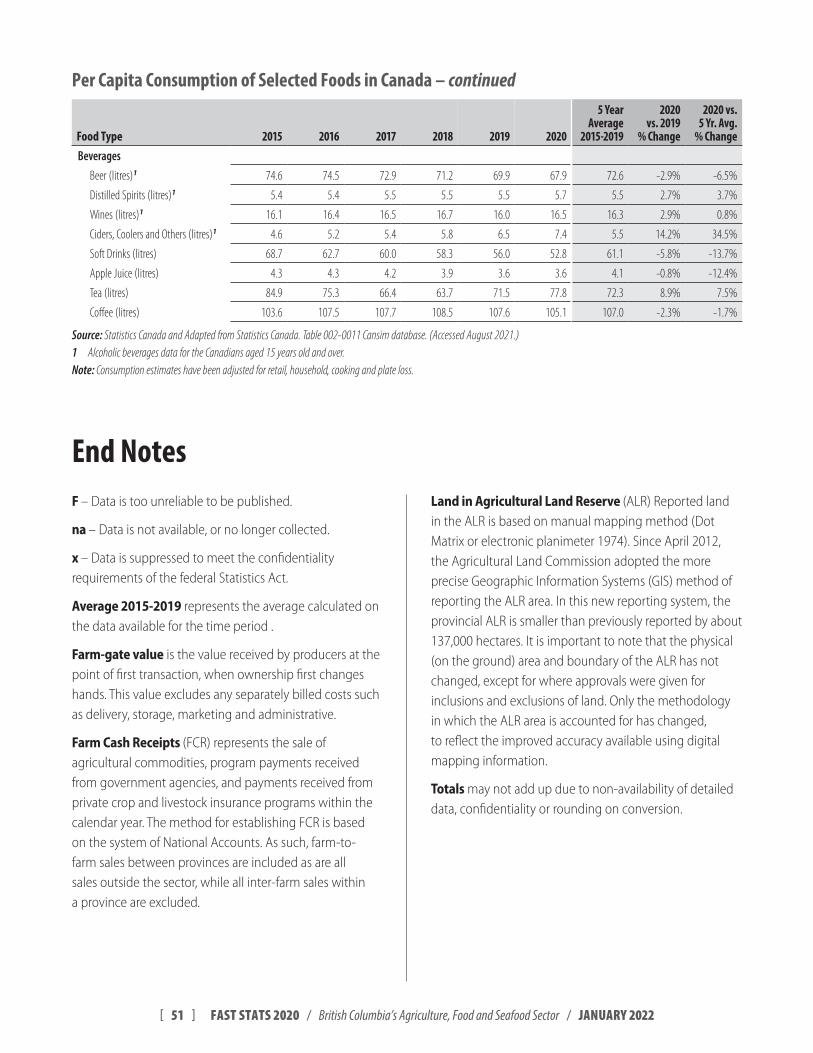
[ 51 ] FAST STATS 2020 / British Columbia’s Agriculture, Food and Seafood Sector / JANUARY 2022
Food Type 2015 2016 2017 2018 2019 2020
5 Year Average
2015-2019
2020 vs. 2019
% Change
2020 vs. 5 Yr. Avg.
% ChangeBeverages
Beer (litres)1 74.6 74.5 72.9 71.2 69.9 67.9 72.6 -2.9% -6.5%
Distilled Spirits (litres)1 5.4 5.4 5.5 5.5 5.5 5.7 5.5 2.7% 3.7%
Wines (litres)1 16.1 16.4 16.5 16.7 16.0 16.5 16.3 2.9% 0.8%
Ciders, Coolers and Others (litres)1 4.6 5.2 5.4 5.8 6.5 7.4 5.5 14.2% 34.5%
Soft Drinks (litres) 68.7 62.7 60.0 58.3 56.0 52.8 61.1 -5.8% -13.7%
Apple Juice (litres) 4.3 4.3 4.2 3.9 3.6 3.6 4.1 -0.8% -12.4%
Tea (litres) 84.9 75.3 66.4 63.7 71.5 77.8 72.3 8.9% 7.5%
Coffee (litres) 103.6 107.5 107.7 108.5 107.6 105.1 107.0 -2.3% -1.7%
Source: Statistics Canada and Adapted from Statistics Canada Table 002-0011 Cansim database (Accessed August 2021 )1 Alcoholic beverages data for the Canadians aged 15 years old and over Note: Consumption estimates have been adjusted for retail, household, cooking and plate loss
End NotesF – Data is too unreliable to be published.
na – Data is not available, or no longer collected.
x – Data is suppressed to meet the confidentiality requirements of the federal Statistics Act.
Average 2015-2019 represents the average calculated on the data available for the time period .
Farm-gate value is the value received by producers at the point of first transaction, when ownership first changes hands. This value excludes any separately billed costs such as delivery, storage, marketing and administrative.
Farm Cash Receipts (FCR) represents the sale of agricultural commodities, program payments received from government agencies, and payments received from private crop and livestock insurance programs within the calendar year. The method for establishing FCR is based on the system of National Accounts. As such, farm-to-farm sales between provinces are included as are all sales outside the sector, while all inter-farm sales within a province are excluded.
Land in Agricultural Land Reserve (ALR) Reported land in the ALR is based on manual mapping method (Dot Matrix or electronic planimeter 1974). Since April 2012, the Agricultural Land Commission adopted the more precise Geographic Information Systems (GIS) method of reporting the ALR area. In this new reporting system, the provincial ALR is smaller than previously reported by about 137,000 hectares. It is important to note that the physical (on the ground) area and boundary of the ALR has not changed, except for where approvals were given for inclusions and exclusions of land. Only the methodology in which the ALR area is accounted for has changed, to reflect the improved accuracy available using digital mapping information.
Totals may not add up due to non-availability of detailed data, confidentiality or rounding on conversion.
Per Capita Consumption of Selected Foods in Canada – continued
Data SourcesProduction, farm cash receipts, manufacturing shipment values, and employment data sourced from Statistics Canada.
Specific industry data obtained from industry associations, where necessary.
Contact InformationThis report is available online at gov.bc.ca/gov/content/industry/agriculture-seafood/statistics/agriculture-and-seafood-statistics-publications
For more information on B.C. agrifood and seafood please contact:
AGRISERVICE BCTelephone: 1-888-221-7141 Email: [email protected]
For more information on the Province of British Columbia, please visit gov.bc.ca/gov/content/home
JANUARY 2022