Factors Affecting Consumer Behavior of Fast Food in Pathum ...
Upload
khangminh22Category
view
5download
0
International Journal of Advance Research In Science And Engineering http://www.ijarse.com
IJARSE, Vol. No.3, Issue No.9, September 2014 ISSN-2319-8354(E)
356 | P a g e
www.ijarse.com
DATA MINING ANALYSIS OF IMPACT OF FAST FOOD
AMONG CHILDREN: A DISTRICT WIDE CASE STUDY
D.Latha1, B. Jasmine
2, G. Kamala Kamatchi
3
1,3 PG students,
2Asst. Professor, Dept. of Computer Science,
Jayaraj Annapackiam College for Women (Autonomous),
Periyakulam – 625 601,Theni Dt, Tamil Nadu, India.
ABSTRACT
Health is determined by human biology, health care systems, environment and lifestyle of human being in which
lifestyle and environmental determinants have major on socioeconomic circumstances. Today, Fast food has become
a prominent feature of the diet of childrenthroughout the world. Frequent consumption of fast food has adverse
effects on nutrition because of excessive content of energy, fat and low nutritional value. Moreover, frequent
consumption of fast food is associated with poor nutritional habits. Of note, the “empty calorie” content (low
nutritional value) of children’s dietary intake from retail food stores and schools is similar to that of fast food
restaurants. The source of added sugar and fat from retail food stores and schools, including sugar-sweetened
beverages, grain desserts, pizza and high-fat milk was similar to that from fast food restaurants including high-fat
milk beverages, dairy desserts, French fries and pizza. However, many studies have examined the effects of fast-food
consumption on any nutrition or health-related outcome in our Indian scenario. More importantly, children under
the age of 10 from middle and low socio-economic class backgrounds were more likely to report infrequent fruit and
vegetable intake also result in low nutritious food habit. The aim of this study was to test the hypothesis that fast-
food consumption adversely affects dietary factors linked to children health risk. We have collected the information
from many children of Theni district, Tamil Nadu in India who is fond of eating junk foods. This process is done by
using the classification algorithm in data mining and we select with the XL Miner tool.
Keywords: Children; Classification Algorithm; Data Mining Analysis; Fast Food; Theni District;
I INTRODUCTION
This case study is entitled as ―Data Mining Analysis of Impact of fast food among Children: A Districtwide Case
Study” using classification algorithm in Data Mining. The main objective of the case study is to find out the change
in eating patterns and food choices and the impact of fast food among children under the age of 10 in Theni district.
The data was collected from many schools of Theni district and analyzed using XL-Miner tool of the Data mining.
Among the growing concerns about childhood obesity and the associated health risks, we have identified that many
children were affected by junk foods and even their parents also encouraging the children in eating these kinds of
International Journal of Advance Research In Science And Engineering http://www.ijarse.com
IJARSE, Vol. No.3, Issue No.9, September 2014 ISSN-2319-8354(E)
357 | P a g e
www.ijarse.com
food itemsincluding sugar-sweetened beverages, grain desserts and pizza [1]. Our research indicates that nutrition
education is urgently needed in the elementary and middle school students less than 10 years. In addition, we need to
work on improving children social and physical environments to encourage and facilitate their choice of healthy
foods.And there is an alarm that family, school and community-wide efforts are needed to promote healthful eating
patterns and food choices among children under the age of 10.
II PROBLEM DEFINITION AND DESCRIPTION
Theni, one of the southern districts of Tamilnadu state, is bounded on the north by Dindigul district, on the east by
Madurai district, on the south by portions of Virudhunagar district and Idukki district of Kerala State and on the
west by Idukki (Kerala). The total geographical area of the district is 3076.30 Sq. Km. According to the 2011
census, it has a population of 1,243,684. The district has a population density of 433 inhabitants per square
kilometre (1,120 /sq. mi There has also been a significant increase of female literacy level from 31.68 % in 1981 to
69.72 % in 2011 [2].
TABLE 1. Total Population, Population in the Age-Group 0-6, Literacy Rate by Sensex-2011.
Population Population in age group 0-6 Literacy Rate (%)
Tamil Nadu Theni Dt. Tamil Nadu Theni Dt. Tamil Nadu Theni Dt.
Total 72138958 1243684 6894821 110919 80.33 77.62
Male 36158871 624922 3542351 57258 86.81 85.48
Female 35980087 618762 3352470 53661 73.86 69.72
Source: Census of India 2011
This district has 68 Pre-Primary Schools, 569 Primary Schools, 203 Middle Schools, 65 High Schools, 80
Higher Secondary Schools, 44 Matriculation Schools and 30 Matric. Higher Secondary Schools in which a total of
392550 are doing their schooling.The school details and students strength is given in Table 2.
TABLE 2: School Category and Students’ Strength
Category
No. of
Institutions
Students
Boys Girls Total
Pre-Primary Schools 68 3823 3259 7082
Primary Schools 569 75648 70650 146298
Middle Schools 203 43806 38015 81821
High Schools 65 8848 9899 18746
Higher Secondary Schools 80 51679 47302 98981
Matriculation Schools 44 10075 7277 17352

International Journal of Advance Research In Science And Engineering http://www.ijarse.com
IJARSE, Vol. No.3, Issue No.9, September 2014 ISSN-2319-8354(E)
358 | P a g e
www.ijarse.com
Matric. Higher Secondary Schools 30 12596 9673 22270
Total 1059 206476 186074 392550
Source: Chief Educational Officer, Theni
We predicted that the school children will have the possibilities of affected by various sicknesses such as Illness,
Anemia, Cholesterol, Heart attack, low memory power, Obesity and laziness. In this case study , we have taken
some attributes such as Like fast food, Affect health, Illness, Anemia, Delicious, Cholesterol, Avoid it, Heart attack,
memory power, Obesity, laziness, Allowed it, Take every day, Take with family and analyzed it using the
classification algorithm of data mining in tree structure.
II METHODOLOGY
Methods play a major role in research. This study has adopted the survey method and descriptive research design.
The population of the study consists of the entire set of student population in the Theni district. According to the
statistical data from Theni chief educational office, a total of 392550 students are studying in 1059 schools of Theni
district of which 206476 are male and 186074 are female students. A total of 13857 respondents of the survey region
have been covered as the sample. Data were gathered using a self-administered questionnaire prepared specially for
these purpose. The following interview questions brought a wealth of information to the researchers.
• Do you like fast food?
• Do you know that fast food will affect your health?
• Do you feel that you are addicted to fast food?
• Do you always eat fast food with your family?
• Do you know the fast food containing lot of chemicals?
• Do you know that the fast food will be a cause for heart attack?
• Do you know fast food affect our memory power?
• Can you avoid fast food?
• Do you know your body cholesterol will be increased by taking fast food?
• Do you know child life obesity is caused by having fast food?
• Do your parents allow you to take a fast food items?
• Do you know anaemia is caused by having fast food?
III DATA MINING PROCESS
Data mining is defined as a process of discovering hidden valuable knowledge by analyzing large amounts of data,
which is stored in databases or data warehouse, using various data mining techniques such as machine learning,
artificial intelligence (AI) and statistical. Therefore the needs for a standard data mining process increased
dramatically.
International Journal of Advance Research In Science And Engineering http://www.ijarse.com
IJARSE, Vol. No.3, Issue No.9, September 2014 ISSN-2319-8354(E)
359 | P a g e
www.ijarse.com
Any data that was collected by any means must be pre-processed to bring it to a form suitable for pattern
recognition. Starting with the raw data in the form of images or meshes, we successively process these data into
more refined forms, enabling further processing of the data and the extraction of relevant information. Detailed
transaction information in the OLTP (On Line Transaction Processing) and legacy system is usually not suitable for
data mining. For data mining to be effective, much careful work is needed in defining the aims of network of data
mining then in selection, cleaning, transformation and separate storage of data that is suitable for data mining. A
typical data mining process includes requirement analysis, data selection and collection, cleaning mining exploration
and validation, implementing, evaluating and validation, monitoring and result visualization [3]. We implement
classification algorithm to evaluate the predicted data of our case study. We generated the reports for result
visualization and exploration.
3.1 Requirement Analysis: There are some goals that the data mining process is expected to achieve. The samples
of the case study must be clearly defined. In requirement analysis, the problem is clearly defined as the objective of
the case study. Objective of this case study is to test the hypothesis that fast-food consumption adversely affects
dietary factors linked to the health risk of school children under the age of 10 of Theni district.
3.2 Data Selection and Collection: This step includes finding the best source of databases for the analysis. If the
data has implemented a data warehouse, then most of the data could be available there. If the data is not available in
the warehouse, the source OLTP (On Line Transaction Processing) systems need to be identified and the required
information extracted and stored in some temporary system. In some cases, only a sample of the data available may
be required [4]. In our case study, data were collected using questionnaire from the study area. Questionnaires were
used to survey the impact of fast food on school children under the age of 10 of Theni district.
3.3 Cleaning and Preparing Data: This may not be an onerous task if a data warehouse contains the required data,
since most of this must have already been done when data was loaded into the warehouse. Otherwise this task can be
very resource intensive and sometimes more than 50% of effort in a data mining project is spent on this step.
Essentially, a data store that integrates data from a number of databases may need to be created. When integrating
data, one often encounters problems like identifying data, dealing with missing data, data conflicts and ambiguity.
An ETL (Extraction, Transformation and loading) tool may be used to overcome these problems.
3.4 Data Mining Exploration and Validation: Once appropriate data has been collected and cleaned, it is possible
to start data mining exploration. Assuming that, the user has access to one or more data mining tools, a data mining
model may be constructed based on the sample details. It may be possible to take a sample of data and apply a
number of relevant techniques. For each technique, the results should be evaluated and their significance is
interpreted. This is likely to be an iterative process which should lead the selection of one or more techniques that
are suitable for further exploration, testing and validation.
3.5 Implementing, Evaluating and Monitoring: Once a model selected and validated, the model can be
implemented by the decision makers. This may involves software development for generating reports or for results
visualization and exploration which is used by the managers. It may be more than one technique that is available for
International Journal of Advance Research In Science And Engineering http://www.ijarse.com
IJARSE, Vol. No.3, Issue No.9, September 2014 ISSN-2319-8354(E)
360 | P a g e
www.ijarse.com
the given data mining task. It is important to evaluate the results and choose the best technique. Furthermore, there is
a need for regular monitoring the performance of the techniques that have been implemented [5]. In our case study,
we have implemented Classification Algorithm to evaluate the predicted data. We generated the reports for result
visualization and exploration. It may be more than one technique is available for given data mining task.
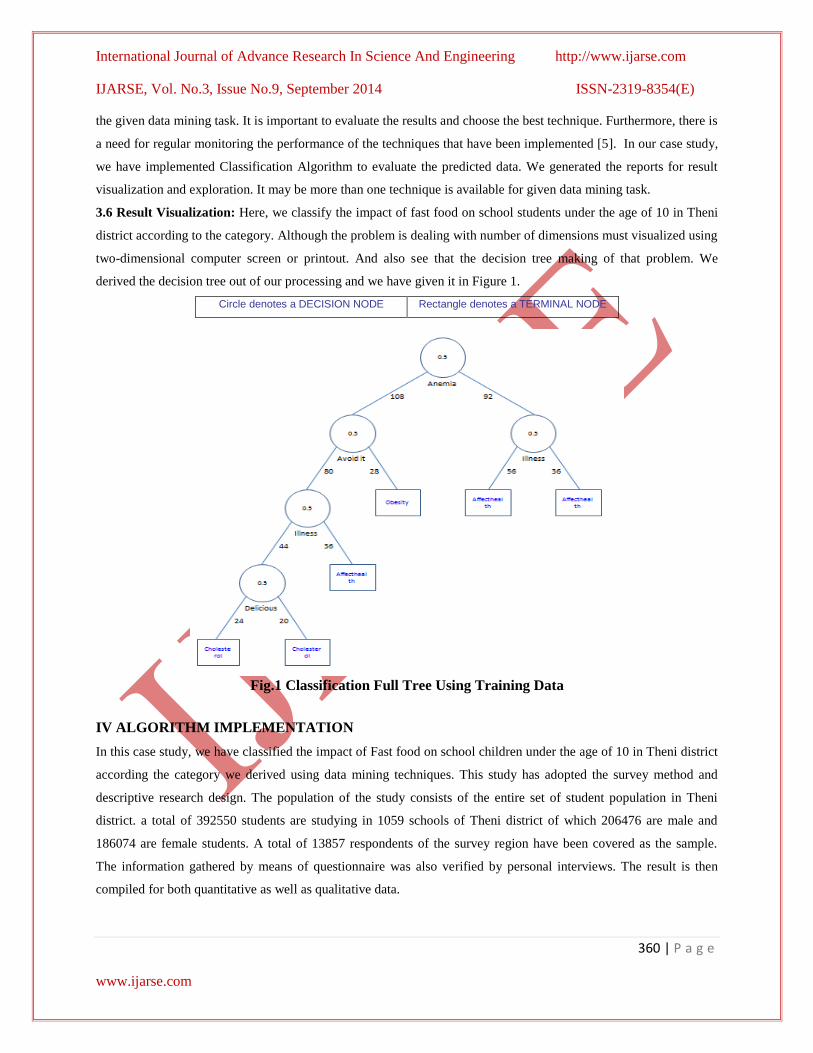
3.6 Result Visualization: Here, we classify the impact of fast food on school students under the age of 10 in Theni
district according to the category. Although the problem is dealing with number of dimensions must visualized using
two-dimensional computer screen or printout. And also see that the decision tree making of that problem. We
derived the decision tree out of our processing and we have given it in Figure 1.
Circle denotes a DECISION NODE Rectangle denotes a TERMINAL NODE
Fig.1 Classification Full Tree Using Training Data
IV ALGORITHM IMPLEMENTATION
In this case study, we have classified the impact of Fast food on school children under the age of 10 in Theni district
according the category we derived using data mining techniques. This study has adopted the survey method and
descriptive research design. The population of the study consists of the entire set of student population in Theni
district. a total of 392550 students are studying in 1059 schools of Theni district of which 206476 are male and
186074 are female students. A total of 13857 respondents of the survey region have been covered as the sample.
The information gathered by means of questionnaire was also verified by personal interviews. The result is then
compiled for both quantitative as well as qualitative data.
International Journal of Advance Research In Science And Engineering http://www.ijarse.com
IJARSE, Vol. No.3, Issue No.9, September 2014 ISSN-2319-8354(E)
361 | P a g e
www.ijarse.com
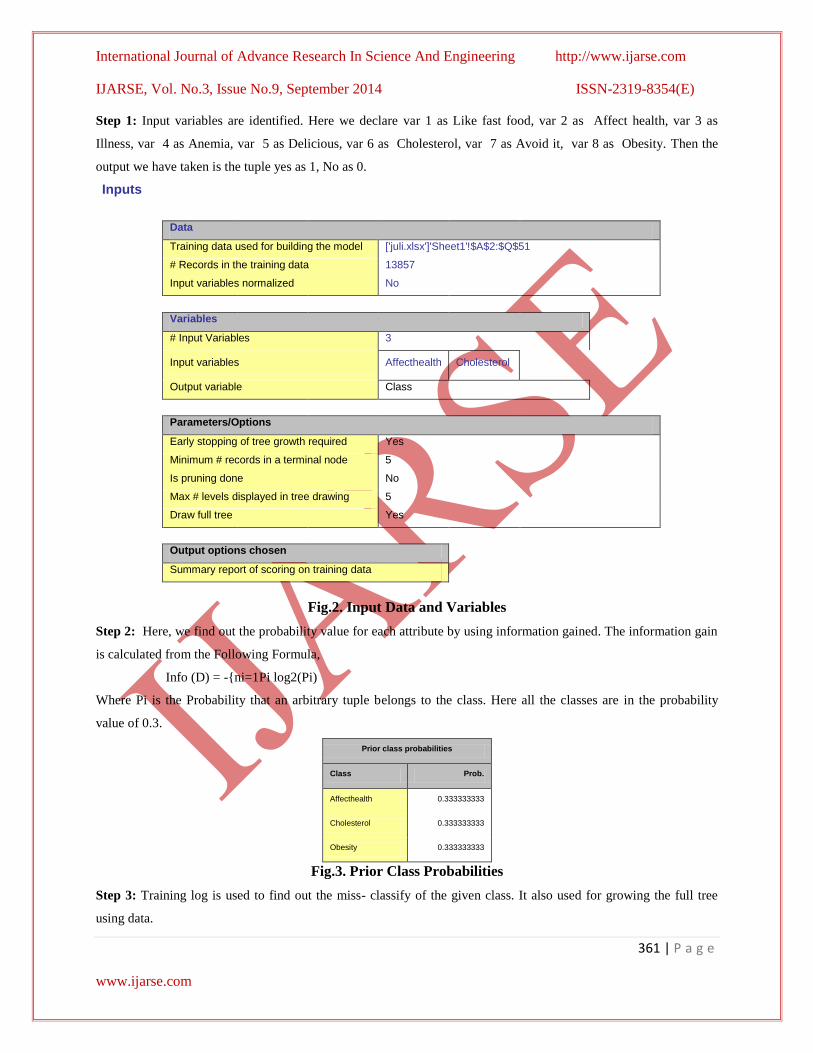
Step 1: Input variables are identified. Here we declare var 1 as Like fast food, var 2 as Affect health, var 3 as
Illness, var 4 as Anemia, var 5 as Delicious, var 6 as Cholesterol, var 7 as Avoid it, var 8 as Obesity. Then the
output we have taken is the tuple yes as 1, No as 0.
Inputs
Data
Training data used for building the model ['juli.xlsx']'Sheet1'!$A$2:$Q$51
# Records in the training data 13857
Input variables normalized No
Variables
# Input Variables 3
Input variables Affecthealth Cholesterol
Output variable Class
Parameters/Options
Early stopping of tree growth required Yes
Minimum # records in a terminal node 5
Is pruning done No
Max # levels displayed in tree drawing 5
Draw full tree Yes
Output options chosen
Summary report of scoring on training data
Fig.2. Input Data and Variables
Step 2: Here, we find out the probability value for each attribute by using information gained. The information gain
is calculated from the Following Formula,
Info (D) = -{ni=1Pi log2(Pi)
Where Pi is the Probability that an arbitrary tuple belongs to the class. Here all the classes are in the probability
value of 0.3.
Prior class probabilities
Class Prob.
Affecthealth 0.333333333
Cholesterol 0.333333333
Obesity 0.333333333
Fig.3. Prior Class Probabilities
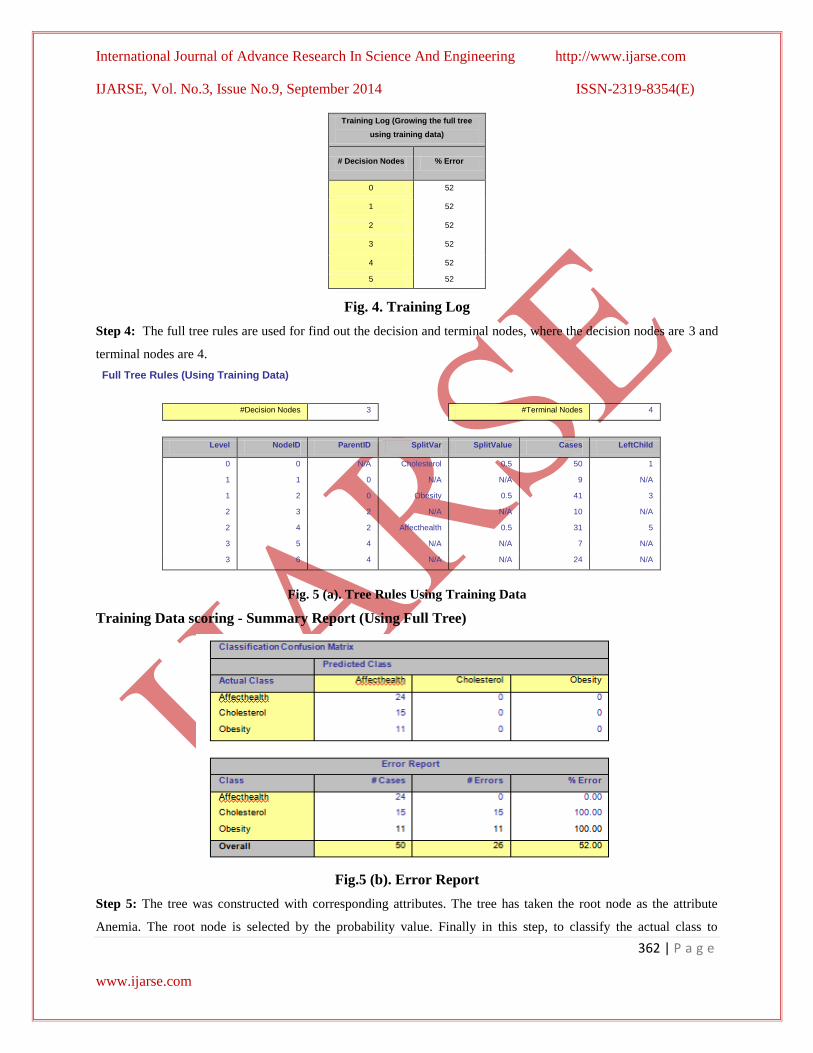
Step 3: Training log is used to find out the miss- classify of the given class. It also used for growing the full tree
using data.
International Journal of Advance Research In Science And Engineering http://www.ijarse.com
IJARSE, Vol. No.3, Issue No.9, September 2014 ISSN-2319-8354(E)
362 | P a g e
www.ijarse.com
Training Log (Growing the full tree
using training data)
# Decision Nodes % Error
0 52
1 52
2 52
3 52
4 52
5 52
Fig. 4. Training Log
Step 4: The full tree rules are used for find out the decision and terminal nodes, where the decision nodes are 3 and
terminal nodes are 4.
Full Tree Rules (Using Training Data)
#Decision Nodes 3
#Terminal Nodes 4
Level NodeID ParentID SplitVar SplitValue Cases LeftChild
0 0 N/A Cholesterol 0.5 50 1
1 1 0 N/A N/A 9 N/A
1 2 0 Obesity 0.5 41 3
2 3 2 N/A N/A 10 N/A
2 4 2 Affecthealth 0.5 31 5
3 5 4 N/A N/A 7 N/A
3 6 4 N/A N/A 24 N/A
Fig. 5 (a). Tree Rules Using Training Data
Training Data scoring - Summary Report (Using Full Tree)
Fig.5 (b). Error Report
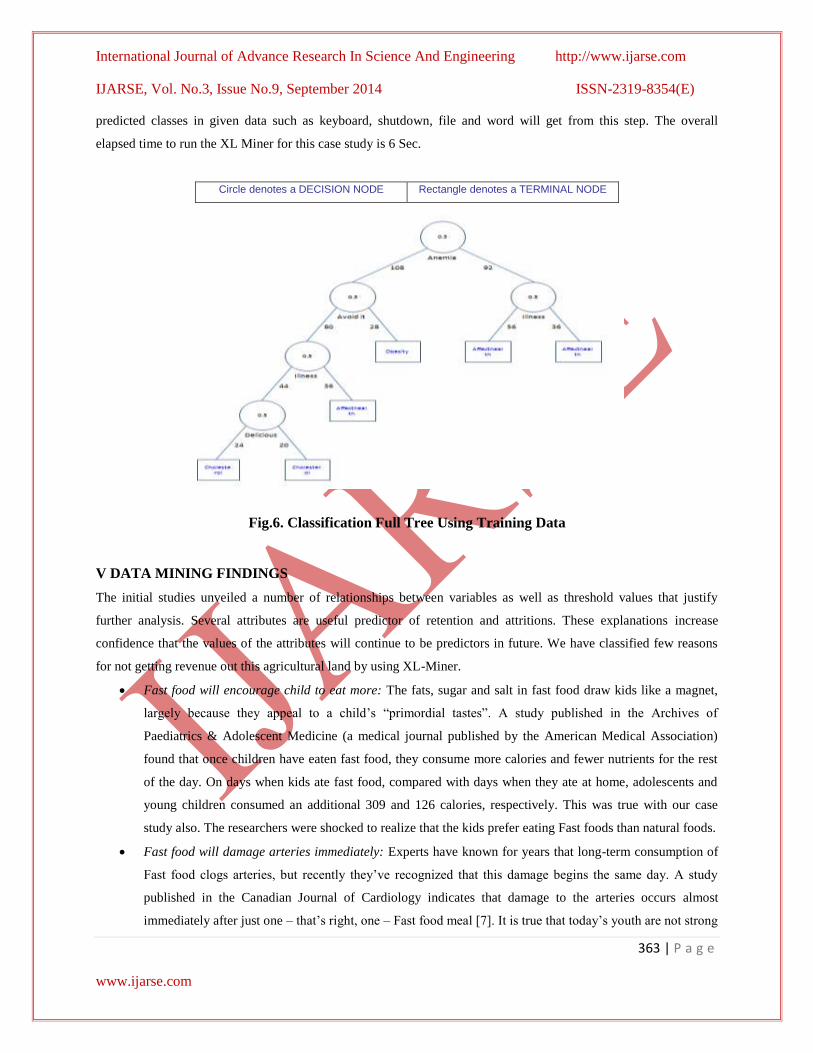
Step 5: The tree was constructed with corresponding attributes. The tree has taken the root node as the attribute
Anemia. The root node is selected by the probability value. Finally in this step, to classify the actual class to
International Journal of Advance Research In Science And Engineering http://www.ijarse.com
IJARSE, Vol. No.3, Issue No.9, September 2014 ISSN-2319-8354(E)
363 | P a g e
www.ijarse.com
predicted classes in given data such as keyboard, shutdown, file and word will get from this step. The overall
elapsed time to run the XL Miner for this case study is 6 Sec.
Circle denotes a DECISION NODE Rectangle denotes a TERMINAL NODE
Fig.6. Classification Full Tree Using Training Data
V DATA MINING FINDINGS
The initial studies unveiled a number of relationships between variables as well as threshold values that justify
further analysis. Several attributes are useful predictor of retention and attritions. These explanations increase
confidence that the values of the attributes will continue to be predictors in future. We have classified few reasons
for not getting revenue out this agricultural land by using XL-Miner.
Fast food will encourage child to eat more: The fats, sugar and salt in fast food draw kids like a magnet,
largely because they appeal to a child’s ―primordial tastes‖. A study published in the Archives of
Paediatrics & Adolescent Medicine (a medical journal published by the American Medical Association)
found that once children have eaten fast food, they consume more calories and fewer nutrients for the rest
of the day. On days when kids ate fast food, compared with days when they ate at home, adolescents and
young children consumed an additional 309 and 126 calories, respectively. This was true with our case
study also. The researchers were shocked to realize that the kids prefer eating Fast foods than natural foods.
Fast food will damage arteries immediately: Experts have known for years that long-term consumption of
Fast food clogs arteries, but recently they’ve recognized that this damage begins the same day. A study
published in the Canadian Journal of Cardiology indicates that damage to the arteries occurs almost
immediately after just one – that’s right, one – Fast food meal [7]. It is true that today’s youth are not strong
International Journal of Advance Research In Science And Engineering http://www.ijarse.com
IJARSE, Vol. No.3, Issue No.9, September 2014 ISSN-2319-8354(E)
364 | P a g e
www.ijarse.com
as of before 20 years. So it is evident that by having more Fast food, today we are creating a generation of
weaker health condition.
Fast food will cause school work to suffer: Diet has a significant effect on children’s study habits. Fast food
and foods with high-sugar content deplete energy levels and the ability to concentrate for extended periods
of time. ―If a kid is having sweets, chocolate croissants or sweetened beverages during the first break time
at school instead of his fruit portion or his sandwich, he would definitely feel hungry within an hour and
that would disrupt his concentration in class, and could affect his overall performance in school,‖ explains
Chirine Watfa, a dietician at Health Factory, Dubai. In a study published in Child: Care, Health and
Development (a European public health journal), researchers analysed the fast-food consumption and test
scores in Maths and reading of 12,000 fifth-graders. They found that children who ate fast food four to six
times within a given week tested significantly lower in Maths and reading compared with children who did
not.
Fast food will make kids depressed: Eating foods rich in antioxidants, such as fruits and vegetables, and
healthy fats, such as cold-water fish and nuts, leads to positive energy and moods – both of which derive
from positive brain function. A diet high in fast food lacks these nutritional benefits, increasing the risk of
depression. We found many of samples were are short temper and find it hard to adjust with fellow friends
and relatives. Some families encourage these characteristics of the children whereas other few found it will
be creating a generation with less positive brain function. And also these kinds of Fast foods will make
them irritable [8]. The high content of sugar in Fast food causes fluctuations in children’s blood glucose
levels. This makes them edgy, sleepy and irritable throughout the day and leaves them with no motivation
to be active.
Fast food will put your child off healthy food: The artificial taste of junk food is thought to be addictive and
children used to spicy junk food may have trouble adjusting their palates to relatively blander healthy
foods.
Fast food will cause constipation: Fast food typically lacks fibre. The less fibre children consume, the more
likely they are to develop constipation, which can cause abdominal pain and discomfort.
Fast food will ruin bedtime: Having sugary drinks or fruit juice with dinner even twice a week can affect
children’s sleep and wake-up cycle. The caffeine from sodas acts as a stimulant, keeping them awake
longer and negatively affects their metabolism. Studies have shown that moderate to high caffeine
consumers [100 to 300mg of caffeine] have more disturbed and more interrupted sleep than low- or no-
caffeine consumers.
Excessive Weight Gain: In a study published in "Paediatrics" in January 2009, researchers analyzed the
dietary quality and fast food intake of 6,212 children and adolescents. Data compiled over a two-year
period showed that children who ate fast food most often consumed more total calories, fat and sugar-rich
beverages, less fiber and fewer fruits and vegetables compared to children who ate fast food less often [9].
International Journal of Advance Research In Science And Engineering http://www.ijarse.com
IJARSE, Vol. No.3, Issue No.9, September 2014 ISSN-2319-8354(E)
365 | P a g e
www.ijarse.com
This high-calorie, high-fat, low-nutrient eating pattern is associated with undesirable weight gain, obesity
and obesity-related health risks, such as asthma, high blood pressure and type 2 diabetes. According to a
report published in "Obesity" in July 2011, childhood overweight and obesity contributes significantly to
obesity-related problems, including early mortality, that stretch into adulthood.
VI CONCLUSION
The goal of data mining classification is to build a set of models that can correctly predict the class of the different
objects. The input to this method is set of objects (training data); the classes in which these objects belong to
(dependent variables), and a set of variables describing different characteristics of the objects (independent
variables). Before the case study was done, there is less awareness on Fast food among school students under the age
of 10 in Theni district. After completing this case study, it is very useful to classify the impact of fast food on one’s
body and mental health. The researcher felt that they have done some nation building efforts by analyzing this case
study and classify the impact of Fast food among school students under the age of 10 in Theni district. Few children
were expressed their willingness in avoiding fast foods and turn towards natural foods which are seasonable.
REFERENCES
[1] TirthaDhar, Kathy Baylis, Fast-Food Consumption and the Ban on advertising Targeting Children: The Quebec
Experience. Journal of Marketing Research: October 2011, Vol. 48, No. 5, pp. 799-813.
[2] District Census 2011, Census2011.co.in. 2011, www.census2011.co.in/district.php.
[3] Gupta G. K.,2011, Introduction to Data Mining with Case Studies, 2nd
Edition, PHI Learning publication, Page 7.
[4] Agarwal R,Imielinski T,Mannila H,Toivonen H Verkamo A I,Data mining classification Rules, VLDB, Sept 12-
1-1999.
[5] Isabelle Guyon, An Introduction to Variable and Feature Selection, Journal of Machine Learning Research 3,
2003.
[6] Yael Ben-Haim and Elad Tom-Tov, A Streaming Parallel Decision Tree Algorithm, Journal of Machine
Learning Research 11 (2010) 849-872 .
[7] Kristin Kirkpatrick,Fast Food's Immediate Damage To Your Health,
http://www.huffingtonpost.com/2012/11/27/fast-food-health-arteries-beauty_n_2198725.html. Posted:
12/03/2012 8:42 am EST Updated: 12/03/2012 8:42 am EST, Accessed on 31/08/201414:31pm EST
[8] Rachel Lewis, The immediate effect fast food has on children, http://www.thenational.ae/lifestyle/family/the-
immediate-effect-fast-food-has-on-children, Posted on May 13, 2013, Accessed on August 30,2014.
[9] George Lister, Theresa C. Murdock-Vlautin, and Aaron L. Friedman, Report of Colloquium I: The Future of
Pediatric Health Care Delivery and Education—Pondering Imponderables to Create an Ideal Residency in a
World of Critical Uncertainties, Pediatrics January 2009; 123:S12-S16
Copyright © 2022 FDOKUMEN