Factors Affecting Consumer Behavior of Fast Food in Pathum ...
14
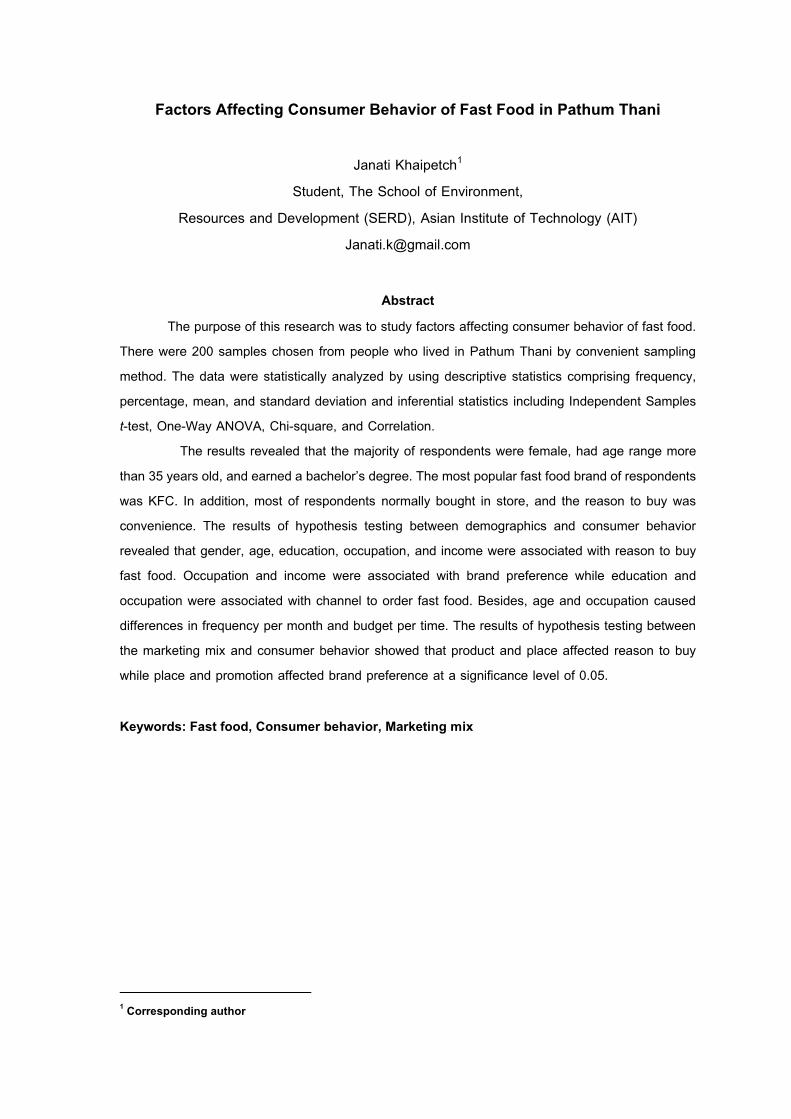
Factors Affecting Consumer Behavior of Fast Food in Pathum Thani Janati Khaipetch 1 Student, The School of Environment, Resources and Development (SERD), Asian Institute of Technology (AIT) [email protected] Abstract The purpose of this research was to study factors affecting consumer behavior of fast food. There were 200 samples chosen from people who lived in Pathum Thani by convenient sampling method. The data were statistically analyzed by using descriptive statistics comprising frequency, percentage, mean, and standard deviation and inferential statistics including Independent Samples t-test, One-Way ANOVA, Chi-square, and Correlation. The results revealed that the majority of respondents were female, had age range more than 35 years old, and earned a bachelor’s degree. The most popular fast food brand of respondents was KFC. In addition, most of respondents normally bought in store, and the reason to buy was convenience. The results of hypothesis testing between demographics and consumer behavior revealed that gender, age, education, occupation, and income were associated with reason to buy fast food. Occupation and income were associated with brand preference while education and occupation were associated with channel to order fast food. Besides, age and occupation caused differences in frequency per month and budget per time. The results of hypothesis testing between the marketing mix and consumer behavior showed that product and place affected reason to buy while place and promotion affected brand preference at a significance level of 0.05. Keywords: Fast food, Consumer behavior, Marketing mix 1 Corresponding author
-
Upload
khangminh22 -
Category
Documents
-
view
0 -
download
0
Transcript of Factors Affecting Consumer Behavior of Fast Food in Pathum ...
Factors Affecting Consumer Behavior of Fast Food in Pathum Thani
Janati Khaipetch1 Student, The School of Environment,
Resources and Development (SERD), Asian Institute of Technology (AIT) [email protected]
Abstract
The purpose of this research was to study factors affecting consumer behavior of fast food. There were 200 samples chosen from people who lived in Pathum Thani by convenient sampling method. The data were statistically analyzed by using descriptive statistics comprising frequency, percentage, mean, and standard deviation and inferential statistics including Independent Samples t-test, One-Way ANOVA, Chi-square, and Correlation.
The results revealed that the majority of respondents were female, had age range more than 35 years old, and earned a bachelor’s degree. The most popular fast food brand of respondents was KFC. In addition, most of respondents normally bought in store, and the reason to buy was convenience. The results of hypothesis testing between demographics and consumer behavior revealed that gender, age, education, occupation, and income were associated with reason to buy fast food. Occupation and income were associated with brand preference while education and occupation were associated with channel to order fast food. Besides, age and occupation caused differences in frequency per month and budget per time. The results of hypothesis testing between the marketing mix and consumer behavior showed that product and place affected reason to buy while place and promotion affected brand preference at a significance level of 0.05. Keywords: Fast food, Consumer behavior, Marketing mix
1 Corresponding author

Rajamangala University of Technology Thanyaburi
RMUTT Global Business Accounting and Finance Review (GBAFR) Volume 1 Issue 2: May – August 2017
50
1. Introduction Food is essential for everyone because it provides necessary nutrition for the survival of
human being. According to differences in cultures, climates, geographic locations, natural resources, and lifestyles, food tends to be different and unique throughout the world (Islam and Ullah, 2010). In the food industry of Thailand, trend of food and restaurants has been rapidly changed today. Regarding Thailand’s Gross Domestic Product (GDP) in 2015, President of the National Food Institute (NFI), Ministry of Industry, Thailand stated that Thai food industry generated 23% of the overall country’s revenue, and it is predicted that restaurant sector has a bright future due to increased spending (Thailand Board of Investment, 2016).
According to Office of the National Economic and Social Development Board - NESDB (2016), Thailand’s hotel and restaurant sectors expanded by 15.9% in the third quarter of 2016, accounted for 12.7% higher comparing to the second quarter. As of March 2016, there were 11,020 restaurants registered to operate legally in Thailand (USDA Foreign Agricultural Service, 2016). USDA Foreign Agricultural Service (2016) stated that future opportunities for restaurant industry in Thailand remained positive due to lifestyle changing of urbanization increasing, higher income, and convenient eating out behavior. Furthermore, new pattern of lifestyles, which seeks for convenience and comfort, influences teenagers and urbanites to prefer indoor restaurants rather than traditional restaurants or street food restaurants. In addition, rapid expansion of retail mall and modern retail food establishments provides Thai people to access indoor restaurants more easily (USDA Foreign Agricultural Service, 2016). Thus, the changes in lifestyles and consumer behavior toward restaurant business in Thailand recently would make restaurant business to differentiate their strategies from the past. The examples are rapid expansion of fast food restaurants in a retail mall as well as expansion of online channel and website, increasing of technology adoption in the restaurants to increase sales, and creating in new brands for more consumers’ choices (USDA Foreign Agricultural Service, 2016).
Moreover, Market Share of Western Casual Dining in Thailand from 2013 to 2015 showed that among café, restaurants, fast food, and ice cream and bakery, restaurants’ revenue was in the first ranking which were accounted for 42%, 41%, and 39%, respectively (USDA Foreign Agricultural Service, 2016). Fast food remained the second ranking with the revenue of 37%, 37%, and 38% from the total dining in Thailand for three years continuously (Ministry of Commerce, Thailand, 2015). Even though restaurant remains the first ranking in dining food industry, but the facts about restaurant businesses in Thailand reveal that Thailand’s restaurants could be divided into three categories as Quick Service Restaurants (QSR), International/High-end Restaurants, and Small Restaurants (SMEs-Small Medium Enterprises) (USDA Foreign Agricultural Service, 2016). Surprisingly, the QSR market is mainly dominated by franchise businesses, which mostly are fast

Rajamangala University of Technology Thanyaburi
RMUTT Global Business Accounting and Finance Review (GBAFR) Volume 1 Issue 2: May – August 2017
51
food restaurants. Examples of QSRs currently operating in Thailand are KFC, McDonalds, the Pizza Company, etc. Therefore, some QSR restaurants in Thailand combining with other fast food businesses make fast food become increasingly popular in Thailand. This type of restaurant is predicted to grow with 8-10 percent per year, and it is estimated to generate nearly US$4.6 billion by 2020 (USDA Foreign Agricultural Service, 2016).
2. Literature Review
2.1 The Concepts of Demographic Characteristics Kotler, Armstrong, Saunders, and Wong (1999) stated that a study of human populations
can be defined as demography which includes age, gender, race, career, and other statistics accordingly. They also proposed that marketers should pay attention to the demographic environment because it involves people, and a group people can be the target market for any products and services. Kotler and Keller (2012) also stated that marketers mostly concentrate on population, including the size of cities, size of population, and its growth rate, regions, nations, age and ethnic groups, educational levels, household purchasing patterns, and regional characteristics. Kardes, Cronley, and Cline (2008) proposed that market segmentation is often based on customers’ population statistics, called demographic characteristics. Popular demographic characteristics include age, gender, income, education, career, social class, social ranking, marital status, family life cycle, and culture or ethnicity.
Demographics involve every person, and it is important to pay attention because the more understanding in customers’ characteristics, the more success a company can accomplish. The most popular segmentation most companies recently used is demographics-based since demographic characteristics are visible and easy to measure with low costs (Kardes, Cronley, and Cline, 2008). Not only different demographic characteristics can be used to target customers exclusively, but also main factors causing preferences, buying habits, and behaviors vary dramatically. 2.2 The Concepts of Marketing Mix (4Ps)
Kotler, Armstrong, Saunders, and Wong (1999) stated that after planning its overall competitive marketing strategy, a company shall begin planning the details of the marketing mix. The marketing mix is one of the dominant ideas in modern marketing, and it can be defined as the set of controllable tactical marketing tools which the company blends to produce the response it wants in the target market. Furthermore, the marketing mix consists of four groups of variables known as the “four Ps” consisting of product, price, place, and promotion. Product means the overall of goods and services that a company offers to target market. Price is what customers pay to get

Rajamangala University of Technology Thanyaburi
RMUTT Global Business Accounting and Finance Review (GBAFR) Volume 1 Issue 2: May – August 2017
52
the product. Place refers to a company’s activities that make the product available and reach target market and consumers. Promotion refers to activities to communicate to target customers about products and services and persuade them to buy.
Stone and Desmond (2007) explained each component from the marketing mix theory as follows:
1. Product is the focus of marketing activities. Product can be classified into four categories as the core product, the tangible product, the augmented product, and the potential product. The core product represents the key benefits expected by customers. The tangible product is related to other components that mainly support the core product. The augmented product includes those add-on extras which may be used to enhance the product benefits. Finally, the potential product constitutes what the product could be in the future by ensuring continuous improvement (Stone and Desmond, 2007).
2. Pricing is one of the most important elements of the marketing mix since it affects profit, market share, consumer perceptions, brand positioning, marketing channel choice, and marketing communication plans. The concept of pricing is complex and essential to the successful implementation of a marketing strategy. Pricing decision is the most difficult process due to its complexity involved with consumers, trade, and competitors (Stone and Desmond, 2007).
3. Promotion or marketing communications include advertising, sales promotions, personal selling, internet marketing, and public relations. Marketing communications are designed to create awareness of new brands or to reinforce the value of existing brands for all companies (Stone and Desmond, 2007). Besides, sale promotion is used to attract consumers’ attention and motivate decision to purchase, and it is a powerful tool to compete with competitors in low-cost product industry.
4. Place or channel of distribution is the process of moving goods and services through intermediaries, such as wholesalers, retailers, convenience stores, etc., to reach the end user. Specifically, the main purpose is to move the goods or services efficiently, with the lowest number of intermediaries between the producer and the end user. However, as the physical distance between the two parties and the volume of goods to be exchanged increases, it becomes necessary for producers to use value chain to associate with the transaction. (Stone and Desmond, 2007). 2.3 The Concepts of Consumer Behavior The first concept related to consumer behavior has been introduced by Howard and Sheth (1969) as “The Theory of Buyer Behavior.” This model proposed that outputs of consumer purchase behavior, intention, attitudes, comprehension, and attention came from various variables associated with consumers. The first exogenous variables were importance of purchase, personality, social

Rajamangala University of Technology Thanyaburi
RMUTT Global Business Accounting and Finance Review (GBAFR) Volume 1 Issue 2: May – August 2017
53
class, culture, organization, time pressure, and financial status. The input variables which were important can be determined as brands, significance, symbolic, and social environment. In addition, search for information, sensitivity to information, perceptual bias, and satisfaction may cause consumer purchase behavior, intention, attitudes, comprehension, and attention to appear differently.
The consumer decision model has been developed from the research of Blackwell, Miniard, and Engel (2001) to explain consumer processes. The main structure of the model was decision process comprising seven stages as need recognition, search, pre-purchase evaluation of alternatives, purchase, consumption, post-consumption evaluation, and divestment. These stages in decision process were influenced by two determinants as stimuli and external variables, such as environmental influences and individual differences (Blackwell et al., 2001). Environmental influences are composed of culture, social class, personal influence, family, and situation. Moreover, individual differences include consumer resources, motivation and involvement, knowledge, attitudes, personality, values, and lifestyle (Blackwell et al., 2001).
Consumer behavior is the approach to study what the determinants which consumers use as their measurement are and how they affect selecting or disposing of products, services, experiences, or ideas to meet the customers’ needs as well as revealing the consequences that these procedures have on the consumer and society (Kuester, 2012). Consumer behavior is contributed by various sectors such as psychology, sociology, geography, culture, marketing, and economics with aims at understanding the decision-making process and how emotions and attitudes affect consumers’ purchasing behavior.
2.4 Research Objectives
1. To study a relationship between demographics (gender, age, education, occupation, and income) and consumer behavior (reason to buy, brand, and channel to order)
2. To identify differences in consumer behavior (frequency per month and budget per time) according to demographics (gender, age, education, occupation, and income)
3. To study a relationship between the marketing mix (product, price, place, and promotion) and consumer behavior (reason to buy, brand, channel to order, frequency per month, and budget per time) 2.5 Research Hypotheses
Hypothesis 1: There is a significant relationship between demographics (gender, age, education, occupation, and income) and consumer behavior (reason to buy, brand, and channel to order).

Rajamangala University of Technology Thanyaburi
RMUTT Global Business Accounting and Finance Review (GBAFR) Volume 1 Issue 2: May – August 2017
54
Hypothesis 2: There are significant differences in consumer behavior (frequency per month and budget per time) according to demographics (gender, age, education, occupation, and income).
Hypothesis 3: There is a significant relationship between the marketing mix (product, price, place, and promotion) and consumer behavior (reason to buy, brand, channel to order, frequency per month, and budget per time).
2.6 Conceptual Framework
Independent Variables Dependent Variables
2.7 Prior Research
There are previous studies which revealed that demographic characteristics have relationships with consumer behavior. Nondzor and Tawiah (2015) focused on “consumer perception and preference of fast food: a study of tertiary students in Ghana,” and the findings showed that some respondents perceived fast food to be unhealthy, expensive, and too foreign whereas other respondents perceived fast food to be convenient, time saving, delicious, good for fun, and change and expose them to likable environments.
Deivanai (2016) revealed that factors influencing preference of fast food restaurants included quality of product, service quality, environment internal and external, staff cooperation, price, taste of the product, convenience, and place. Those factors generated satisfaction toward fast food restaurants. Moreover, a variety of products, environment (both internal and external), quality product, service quality, price, convenience were related to customer.
Demographics • Gender • Age • Education • Occupation • Income
Consumer Behavior of Fast Food
• Frequency per month • Budget per time • Reason to buy • Brand • Channel to order
The Marketing Mix (4Ps) • Product • Price • Place • Promotion

Rajamangala University of Technology Thanyaburi
RMUTT Global Business Accounting and Finance Review (GBAFR) Volume 1 Issue 2: May – August 2017
55
Aruppillai and Godwin Phillip (2015) focused on identifying the impact of demographics and economic attributes of the consumers which influenced fast food consumption and consumers’ buying behavior in Moratuwa municipal council area located in Sri Lanka. The results revealed that education level, employment and civil status, and distance to the nearest fast food were statistically significant to consumption of fast food.
Dave et al. (2009) examined the association between attitudes toward fast food and the frequency of fast-food intake in adults. The results revealed that frequency of fast-food intake was found to be significantly associated with age, gender, and marital status. In addition, frequency of fast-food intake was also found to be significantly associated with perceived convenience of fast food and dislike toward cooking. In contrast, perceived unhealthfulness of fast food did not influence fast food consumption.
Shaharudin et al. (2011) examined the attributes which influenced customers’ decisions to purchase fast food products in Malaysia. The results indicated that Malaysian consumers considered food freshness and taste of the food at high importance level. However, innovative food was less important and could have minimal effect on customers’ behavioral intention toward fast food products.
Nguyen et al. (2015) investigated the impact of the marketing mix elements on food buying behavior of supermarket consumers in Vietnam. The results indicated a significant positive relationship between the marketing mix variables and food purchasing behavior. The results also revealed that product factor placed the greatest influence on consumer buying decision, followed by shopping convenience, store atmosphere, price, promotion, and personnel, respectively.
3. Research Methodology
The selection of population and samples was drawn by focusing on 200 people who have eaten fast food in Pathum Thani area. The researcher selected non-probability sampling as a sampling method by using convenience sampling technique. The survey questionnaire was used as a tool for data collection. The questionnaire was divided into three main sections. The first section consisted of 5 items measuring the consumer behavior to buy fast food. The second section contained 14 items measuring the levels of agreement on given statements toward the marketing mix attributes. The respondents were asked to rate their agreements on a 5-point Likert scale comprising 1 = strongly disagree, 2 = disagree, 3 = neutral, 4 = agree, and 5 = strongly agree. The last section consisted of 5 items regarding demographics measuring gender, age, education, occupation, and income. In the last section, the respondents were asked to give five items regarding demographic information. Descriptive statistics comprising frequency, percentage, mean, and

Rajamangala University of Technology Thanyaburi
RMUTT Global Business Accounting and Finance Review (GBAFR) Volume 1 Issue 2: May – August 2017
56
standard deviation and inferential statistics including Independent Samples t-test, One-Way ANOVA, Chi-square, and Correlation were used to analyze the data.
4. Research Findings The results revealed that the majority of respondents were female (58.0%), had age range
more than 35 year old (39.0%), and earned a bachelor’s degree (45.0%). Most of these respondents were students (34.0%) and had average income per month less than or equal to 15,000 Baht (50.0%).
Moreover, the majority of respondents decided to eat fast food because of convenience (38.5%). The most famous fast food restaurant among respondents was KFC (48.0%), and they normally ordered fast food in-store (79.5%). The average frequency per month to eat fast food was 3.37 times per month, and the money spent to buy fast food was approximately 380 Baht per time.
In terms of the marketing mix, the findings can be divided into four categories as product, price, place, and promotion as follows:
The results revealed that most of the respondents had agreement with overall fast food in terms of product at the neutral level with the average mean of 3.55. They had highest agreement toward “Fast food meal looks appetizing” at the agree level with the average mean of 3.95.
Regarding price, the results revealed that most of the respondents had agreement with overall fast food at the neutral level with the average mean of 3.21. They had highest agreement toward “Fast food has a fair price based on the quality” at the neutral level with the average mean of 3.28.
Moreover, the results revealed that most of the respondents had agreement with overall fast food in terms of place or channel of distribution at the neutral level with the average mean of 3.98. They had highest agreement toward “Channels of order are various, it provides the easier way to buy fast food” at the agree level with the average mean of 4.17.
Finally, due to promotion, the results revealed that most of the respondents had agreement with overall fast food at the neutral level with the average mean of 3.54. They had highest agreement toward “Fast food industry always do advertisements” at the agree level with the average mean of 3.86.

Rajamangala University of Technology Thanyaburi
RMUTT Global Business Accounting and Finance Review (GBAFR) Volume 1 Issue 2: May – August 2017
57
Table 1: The Results of Hypothesis 1 Testing Reason to buy Brand Channel to order Gender 0.006** 0.132 0.394 Age 0.025* 0.087 0.902 Education 0.006** 0.601 0.007** Occupation 0.006** 0.011* 0.004** Income 0.005** 0.020* 0.416
Note: ** p < 0.01, 2-tailed. * p < 0.05, 2-tailed.
The results of hypothesis 1 testing shown in able 1 indicated that there was a significant relationship (p < 0.05) between gender and reason to buy, age and reason to buy, education and reason to buy, education and channel to order, occupation and all factors including reason to buy, brand, and channel to order, and income and reason to buy. This clearly indicated that null hypothesis (H0) was rejected, so alternative hypothesis (H1) was supported. Therefore, there is a significant relationship between demographics and consumer behavior toward gender and reason to buy, age and reason to buy, education and reason to buy, education and channel to order, occupation and all factors including reason to buy, brand, and channel to order, and income and reason to buy.
Table 2: The Results of Hypothesis 2 Testing
Frequency per month Budget per time Gender 0.988 0.628 Age 0.010* 0.012* Education 0.236 0.485 Occupation 0.010* 0.000** Income 0.156 0.151
Note: ** p < 0.01, 2-tailed. * p < 0.05, 2-tailed.
The results of hypothesis 2 testing shown in table 2 indicated that there were significant differences in consumer behavior in terms of frequency per month and budget per time toward age and occupation (p < 0.05), clearly indicating that null hypothesis (H0) was rejected, and alternative hypothesis (H1) was supported. Therefore, there are significant differences in consumer behavior in terms of frequency per month and budget per time according to age and occupation.

Rajamangala University of Technology Thanyaburi
RMUTT Global Business Accounting and Finance Review (GBAFR) Volume 1 Issue 2: May – August 2017
58
Table 3: The Results of Hypothesis 3 Testing
Reason Brand Channel to order Frequency per month
Budget per time
Product 0.020* 0.143 0.353 0.325 0.094 Price 0.080 0.294 0.800 0.172 0.787 Place 0.033* 0.004** 0.585 0.310 0.244 Promotion 0.200 0.045* 0.898 0.263 0.744
Note: ** p < 0.01, 2-tailed. * p < 0.05, 2-tailed.
The results of hypothesis 3 testing shown in table 3 indicated that there was a significant relationship ( p < 0. 05) between product and reason to buy, place and reason to buy, place and brand, promotion and brand, which clearly indicated that null hypothesis (H0) was rejected, so alternative hypothesis (H1) was supported. Therefore, there is a significant relationship between the marketing mix and consumer behavior toward product and reason to buy, place and reason to buy, place and brand, and promotion and brand.
5. Conclusion and Discussion Based on the major findings as shown above, they can be noted and summarized in terms
of interesting aspects as enumerated below. 1. The research showed that there were significant relationships between all demographics,
including gender, age, education, occupation, and income, and consumer behavior toward reason to buy fast food. It showed that when people decided to buy things, demographics play an important role in decision process. Male decided to buy fast food based on convenience and availability of restaurant while female decided to buy fast food based on convenience and deliciousness. Different age ranges affected reason to buy as respondents with age range 25 and below decided to buy fast food due to deliciousness and convenience while 26 years old and older decided to buy because of its convenience and availability of restaurant. According to educational level, all respondents decided to buy fast food based on its convenience as the first reason. Students thought that fast food was convenient and delicious with the same equal ratio, while most of other occupations thought fast food was convenient only. With every range of income, people decided to buy fast food due to its convenience, but people with income of 30,000 Baht per month and below tended to think that fast food was delicious more than people with income of above 30,000 Baht per month. These can be concluded that the most reason that people decide to buy and consume fast food is mainly based on its convenience. The results of this research were the same as the researches of Nondzor and Tawiah (2015) which stated that fast food in some of respondents’ perceptions can be viewed

Rajamangala University of Technology Thanyaburi
RMUTT Global Business Accounting and Finance Review (GBAFR) Volume 1 Issue 2: May – August 2017
59
as convenient, time saving, delicious, good for fun, and change, and expose them to likable environments and Deivanai (2016) who revealed that qualities in fast food, service, and staff, environment, price, convenience, variety, and taste were positively related to customer satisfaction on purchase decision.
2. According to hypothesis testing between age and frequency to buy, it revealed that there were significant differences in frequency to buy per month according to different age ranges. The result showed that customers with age range more than 35 years old had lower frequency to buy per month than customers with age range below or equal to 15 years old and between 16 to 25 years old (2.56 times comparing to 4.58 and 3.93 times). The result of this hypothesis supported the results from Aruppillai and Godwin Phillip (2015) which revealed that age of the respondent was statistically significant, and this was one of the key determinants in the consumption of fast food. They stated that young consumers who have age less than 15 years old have more visits and are more likely to consume (60%) fast food than middle aged consumers who have age between 31 and 45 years old. This can be explained as children with under or equal to 15 years old obviously have the highest rate of the frequency. As revealed by the Ministry of Public Health, it was stated that Thai students mainly consume soft drinks, candy, and fast food a lot (McNeil, 2014: online). In contrast, people with more age have fewer frequency because people with middle age tend to pay more attention to their health concern. Even though many studies revealed negative results of fast food that fast food can be perceived as unhealthy (Nondzor and Tawiah, 2015), young people who mostly enjoyed eating out stated their attitudes toward fast food as convenience, fun, and social, and they dislike cooking (Dave et al., 2009).
3. In contrast to age and frequency, the difference in age ranges toward budget to spend per time revealed different results. The findings revealed that people with age of 26 years old and older spent more money with the average of 470 Baht per time than people with younger ages (25 years old and below) with the average of 260 Baht per time. The result could simply be explained that purchasing power is based on ability to work and earn money from jobs. As such, considering people with the age between 26 to 35 years as workers, they can be able to afford the meal by themselves. Meanwhile, people with age range less than 25 years old tend to be students and just started working, and the income they earn can be associated with age. Therefore, with younger ages, people tend to spend less money when purchasing things.
4. The relationship between product of fast food and reason to buy showed a significant result. The respondents were asked about fast food product in terms of its deliciousness, visually looks appetizing, nutrients provided, fresh and clean, and offering new and various types of products. The result of the research showed that most of respondents had highest agreement toward “Fast food meal looks appetizing,” so this result supported the findings of Shaharudin et al.

Rajamangala University of Technology Thanyaburi
RMUTT Global Business Accounting and Finance Review (GBAFR) Volume 1 Issue 2: May – August 2017
60
(2011) which indicated that generally Malaysian consumers place relatively high level of importance on food freshness, followed by presentation and taste of the food, respectively. The relationship between product and reason to buy showed that most of people concerning overall fast food product with the high to highest levels stated that fast food was delicious and convenient. However, people who rated overall fast food product with low to medium levels stated that fast food was convenient and easy to find rather than it was delicious. This was congruent with the results from Nguyen et al. (2015) which revealed that there was a significant positive relationship between product and consumer behavior. More specifically, Nguyen et al. (2015) stated that product is the most important factor affecting consumer purchase decision towards the frozen food purchase.
5. The results of hypothesis indicated that there was a significant relationship between promotion and brand that consumers prefer to eat fast food. The promotion is one of the marketing mix strategy that is essential in every business including fast food. According to the role of promotion in the marketing mix, the role of promotion is essential for reaching the right consumers and meeting company’s objectives and goal. Asamoah and Chovancová (2011) stated that marketing variables such as integrated marketing communications and other sale promotions are adopted to influence consumer behavior. Allahar (2015) stated that advertising is one of the main strategic tools employed by the food chains because it can be communicated to various segments of the markets, especially the young people. Hence, the promotion will significantly have an influence on how consumers get attracted to the brand. Moreover, the promotion can be one of the strategies that define success in a business.
6. Recommendation for Further Research This research only focused on studying within Pathum Thani province. Thus, it is advisable to expand the study area to central region or other remaining areas of Thailand for future research. This allowed future researchers to obtain greater responses as well as wider perspectives. A cross-cultural behavior among consumers from different countries could be considered. Regarding the concentration of the research on the relationships among demographics and the marketing mix, the future research could extend to study the effects by using other variables such as psychographics, cultures, geographic factors, and so on. Besides, the research about the internal and external factors of the company could also be considered.

Rajamangala University of Technology Thanyaburi
RMUTT Global Business Accounting and Finance Review (GBAFR) Volume 1 Issue 2: May – August 2017
61
7. References Allahar, H. (2015). Consumer behavior and the growth of the fast food industry in a small emerging
country. International Journal of Advances in Management and Economics, 4, 180-189. Aruppillai, T. and Godwin Phillip, P. M. (2015). An analysis of consumers’ buying behavoiur and its
determinants of fast food in Sri Lanka. International Journal of Economics and Finance, 7(9), 112-119.
Asamoah, E. S. and Chovancová, M. (2011). The theory of consumer behaviour in fast food marketing: Strategies for competitive advantage. Recent Researches in Economics, 51-56.
Blackwell, R. D., Miniard, P. W., and Engel, J. F. (2001). Consumer behavior (9th ed.). Fort Worth, TX: Harcourt College Publishers.
Dave, J. M., An, L. C., Jeffery, R. W., and Ahluwalia, J. S. (2009). Relationship of attitudes toward fast food and frequency of fast-food intake in adults. Obesity, 17, 1164–1170.
Deivanai, P. (2016). Factors influencing to preference of fast food restaurants. IOSR Journal of Business and Management (IOSR-JBM), 18(8), 20-25.
Howard, J. A. and Sheth, J. (1969). The theory of buyer behavior. New York: John Wiley and Sons. Islam, N. and Ullah, G. M. (2010). Factors affecting consumers’ preferences on fast food items in
Bangladesh. The Journal of Applied Business Research, 26(4), 131. Kardes, F. R., Cronley, M. L., and Cline, T. W. (2008). Consumer behavior. Cincinnati, OH: South-
Western College. Kotler, P. and Keller, K. L. (2012). Marketing management. Upper Saddle River, NJ: Pearson
Prentice Hall. Kotler, P., Armstrong, G., Wong, V., and Saunders, J. (1999). Principles of marketing. Harlow:
Pearson. Kuester, S. (2012). MKT 301: Strategic Marketing & Marketing in Specific Industry Contexts.
University of Mannheim. McNeil, R. (2014, May 30). Research result. Thai children eat for relaxation. National News
Bereau of Thailand. Retrieved from http://thainews.prd.go.th/centerweb/newsen/NewsDetail?NT01_NewsID=WNSOC5705300010010
Ministry of Commerce, Thailand. (2015). Retrieved from www.moc.go.th/index.php/moc-english.html Nguyen, The Ninh & Phan, Hoai & Anh Vu, Phuong. (2015). The impact of marketing mix elements
on food buying behavior: A study of supermarket consumers in Vietnam. International Journal of Business and Management, 10(10), 206-215.

Rajamangala University of Technology Thanyaburi
RMUTT Global Business Accounting and Finance Review (GBAFR) Volume 1 Issue 2: May – August 2017
62
Nondzor, H. E. and Tawiah, Y. S. (2015). Consumer perception and preference of fast food: A Study of tertiary students in Ghana. Science Journal of Business and Management, 3(1), 43-49.
Office of the National Economic and Social Development Board. (2016). NESDB ECONOMIC REPORT Thai Economic Performance in Q2 and Outlook for 2016. Retrieved from http://www.nesdb.go.th/nesdb_en/article_attach/article_file_20160815110939.pdf
Shaharudin, M. R., Mansor, S. W., and Elias, S. J. Food quality attributes among Malaysia’s fast food customer. International Business and Management, 2(1), 198-208.
Stone, M. and Desmond, J. (2007). Fundamentals of marketing (1st ed.). Oxford: Routledge. Thailand Board of Investment. (2016). Thailand Investment Review: Thailand Gears Up to become
the World’s Food Innovation Hub, July 2016 vol. 26 no.7. Retrieved from http://www.boi.go.th/upload/content/TIR_JULY_82855.pdf USDA Foreign Agricultural Service. (2016). Global Agriculture Information Network:
Thailand Food Service - Hotel Restaurant Institutional 2016. Retrieved from https://gain.fas.usda.gov/Recent%20GAIN%20Publications/Food%20Service%20-%20Hotel%20Restaurant%20Institutional_Bangkok_Thailand_12-29-2016.pdf.